Embed Size (px)
Citation preview

High Speed Rail in India
Selection of corridors andImpacts on energy and emissions*
Sarbojit PalFellow, TERI
iCED, Jaipur
May 2, 2016
*Emissions throughout this presentation refer to CO2 emissions from operations only

• Very fast growth in passenger transport activity
Ever increasing demand for mobility GROWTH IN PASSENGER TRANSPORT
• Growth drivers: population, economy, urbanization, motorization
2.5 Mil. Cars 24 Mil. Cars *
(1990) (2012)
The absolute growth in mobility has been very rapid specifically in the last decade
286 Rail BPKM 1,147 Rail BPKM
(1990) (2015) **
* Total number of registered cars and jeeps in India; source: Basic Road Statistics, MoRTH; ** Data from the IR

Reducing energy intensity of transport (recap)
• Inter-city/long distance passenger transport – Shift from roads/air to railways
• Intra-city/short distance transport – Shift from private modes to public modes
• Improvements in vehicle fleets – vehicle efficiency and emission reduction
• Phasing out old vehicular fleet
• Establishing strict inspection and maintenance regime for in-use vehicles
• Promoting use of alternative/clean fuels and technologies
• Measures for urban areas like TDM, ITS, etc.

Impact of energy efficient options
• 40% reduction in energy consumption can be achieved by implementing energy efficient options
• Reductions mainly a result of-
- Inter-modal shift from roads to rail
- Shift from private modes to public modes within road sector
Inter-modal share of Railways in the alternate growth scenario envisaged at 50%
Source- TERI (2009)

Nagpur
Map based on Census 2011 data
India’s large urban agglomerations
Mumbai
Kolkata
Delhi
> 10 million
Hyderabad
ChennaiBangalore
Pune
Ahmedabad
> 5 million
Patna
Lucknow
Surat
Coimbatore
Jaipur
Ghaziabad
Vadodara
Thane
Kochi
Kanpur
Indore
Thrissur
Bhopal
Kochi
> 1 million
• Already 8 urban centers have populations greater than 5 million people
• By 2030– At least 6 ten million plus
cities– 6 to 11 five million plus cities
Large passenger mobility can be seen between such large
cities across the country

Kochi
Map based on PRS data for period: 01-SEP-09 TO 31-AUG-10
• Top 40 passenger originating cities generate 51% of the total non-suburban traffic
• Delhi, Mumbai and Kolkata alone generate 20% of the total traffic
Originating passengers for the Railways
1 to 2 million
Number of originating passengers
> 2 million

Kochi
Map based on data from DGCA for year 2011-12 – Data does not include information for Indian
> 1 million
Originating passengers for the Airlines
• Top 10 passenger originating cities generate 78% of the total traffic
• Delhi, Mumbai and Bangalore generate about 50% of the total traffic
Number of originating passengers

Kochi
Air data does not include data from Indian
> 1 million air
Identifying urban passenger corridors
• Distinct heavy passenger use corridors emerge
• Capacity constraint of rail would mean traffic will move to air and road
Number of originating passengers
> 2 million rail
1 to 2 million rail
HSR Corridors identified by
Ministry of Railways

Increasing Railways’ share -Need increased rail capacity at fast pace
Two key solutions
• Improve the existing rail network in terms of commercial speeds and quality of services- create more capacity for passenger services
• Introduce new high-speed passenger rail network

Identification of potential HSR corridors in India
• TERI-ITPS study tried to determine the potential corridors for HSR in India
• There were several overlapping corridors with the Govt. links
• Detailed study on two corridors:– Western Corridor
• Ahmedabad – Mumbai – Pune
– Southern Corridor• Chennai – Bangalore - Coimbatore
Economic & social parameters Corridor specific
Per capita GDP Corridor length/time
Population densities Number of cities on corridor
Population growth rates Intercity OD traffic volume
Historic connectedness Capacity along the corridor
Map sourced from TERI-ITPS study titled “A Study on the Mid/Long-Term Railway Networks in India Phase II”.

The western corridor
- a quick snapshotThe Western Corridor
Ahmedabad – Vadodara – Surat – Mumbai – Pune
Road
– 95 km Ahmedabad-Vadodara Expressway (1.5
hours)
– 93 km Mumbai-Pune Expressway (2 hrs)
– Ahmedabad - Pune corridor coming up
connecting Vadodara, Surat and Mumbai
Rail
– Ahmedabad, Vadodara, Surat, Bharuch,
Valsad, Borivali, Dadar, Mumbai Central &
Pune
– 30 trains runs along the Ahm to Mum, 15 -
superfast, 11 - Express, 4 Rajdhani, Shatabdi
& Duronto
Air
– All the cities along the corridor are connected
by air with center at Mumbai
Section 1: Ahmedabad to Mumbai
Section 2: Mumbai to Pune

The southern corridor
- a quick snapshot
Road
– High density passenger network on roads –
SRTUs and private operators
– NHAI is expanding the road from 4 to 6 lanes
between Chennai and Bangalore – DPR is
ready
– Expressway being planned independently
between Chennai – Bangalore and Chennai –
Coimbatore
Air
– There are about 9 flights daily between
Chennai-Bangalore and 3 between Bangalore
and Coimbatore
– Since Bangalore airport is 40 km away from
the city center it takes approximately the same
time between the cities on air as it takes on the
road
The Southern Corridor
Chennai – Bangalore - Coimbatore
Rail
– 17 trains between Chennai and Bangalore and
13 trains between Bangalore – Coimbatore (no
Shatabdi)
Section 3: Chennai-Bangalore Section 4: Bangalore-Coimbatore
Section 5: Coimbatore-Chennai
Chennai – Bangalore 327.6 km
Bangalore – Coimbatore 372.0 km
Chennai – Coimbatore 530.0 km

THE AHMEDABAD-MUMBAI CORRIDOR
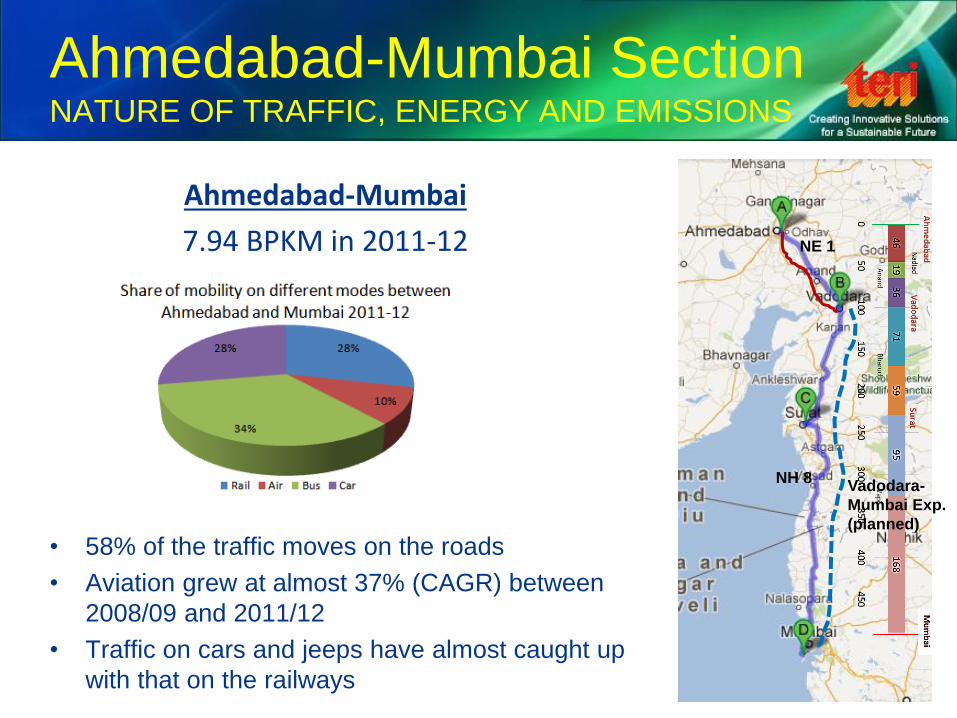
Ahmedabad-Mumbai SectionNATURE OF TRAFFIC, ENERGY AND EMISSIONS
Ahmedabad-Mumbai
7.94 BPKM in 2011-12
• 58% of the traffic moves on the roads
• Aviation grew at almost 37% (CAGR) between
2008/09 and 2011/12
• Traffic on cars and jeeps have almost caught up
with that on the railways
NH 8
NE 1
Vadodara-
Mumbai Exp.
(planned)

The Ahmedabad-Mumbai corridorRAIL TRAFFIC
• 6.2 million passengers travelled on
reserved rail categories in 2011-12
• Growth of passenger kilometers on
various classes (CAGR: 2008/9-2010/11)
– Higher - 7.62%
– Middle - 6.79%
– Lower - 3.85%
• Higher journey classes have higher leads
(404km-373km-348km)
Class types combined:
Higher: 1A, 2A, EC; Middle: 3A, 3E, CC; Lower: SL, 2S
Fastest end to end travel time on
railways: 6h 25min

The Ahmedabad-Mumbai corridorRAIL – GLIMPSE AT PASSENGER PROFILES
• Conducted a primary face to face passenger survey on-board trains
• 73% of the respondents were in the ages between 21 and 40 years
• Largely in private services (44%) or self employed (25%)
• Highest share of total respondents in the income band of Rs. 25-50,000
Primary surveys were conducted on day passenger superfast trains that started and terminated between Ahmedabad and Mumbai Central. Sample size: 1461

The Ahmedabad-Mumbai corridorRAIL – GLIMPSE AT PASSENGER PROFILES
• 45% of the respondents were traveling for business or official purposes
• A large number of people were also traveling for social reasons
• Most of the respondents were traveling on a monthly basis (42%) and a large share occasionally (34%)
Large share of rail passengers surveyed were making this journey on a monthly basis and most of them were traveling on work
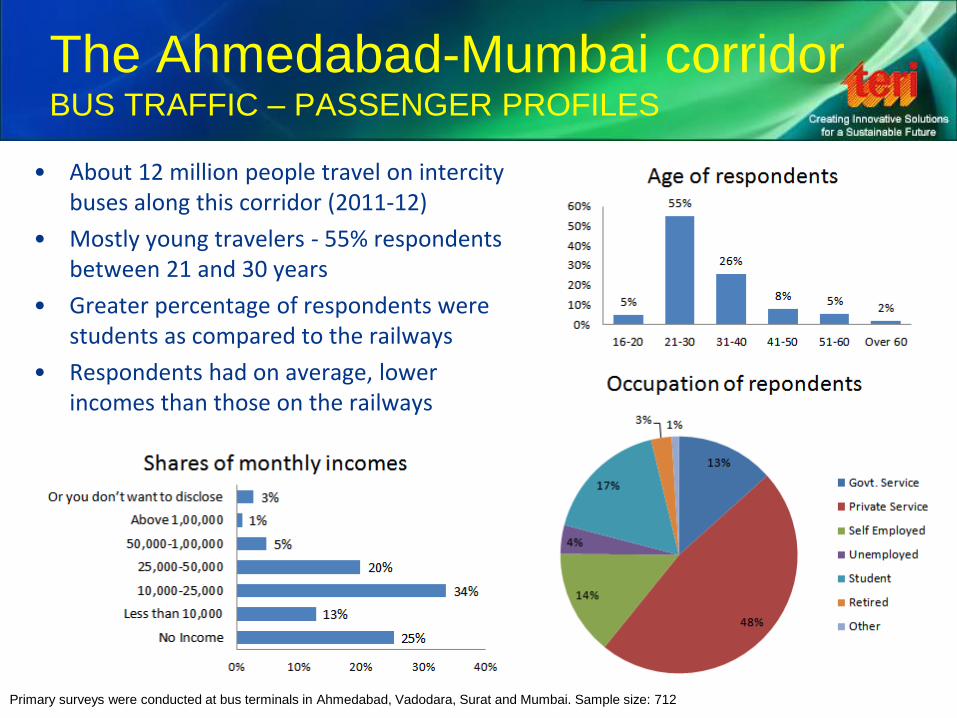
The Ahmedabad-Mumbai corridorBUS TRAFFIC – PASSENGER PROFILES
• About 12 million people travel on intercity buses along this corridor (2011-12)
• Mostly young travelers - 55% respondents between 21 and 30 years
• Greater percentage of respondents were students as compared to the railways
• Respondents had on average, lower incomes than those on the railways
Primary surveys were conducted at bus terminals in Ahmedabad, Vadodara, Surat and Mumbai. Sample size: 712

The Ahmedabad-Mumbai corridorBUS TRAFFIC – PASSENGER PROFILES
• 63% of the respondents were traveling for business or official purposes
• Most of these respondents made trips along this corridor once a week
• 92% of them booked their tickets at the time of the journeyHigh share of bus passengers surveyed along this corridor were young and booked their tickets at the time of journey

• 1.76 mn passengers travelled by air
in 2011-12
• Mumbai-Ahmedabad accounts for
80% of the traffic
• Rapid growth of aviation passengers
• New airports in the anvil
The Ahmedabad-Mumbai corridorAIR TRAFFIC
• Mobility on air at par with the
mobility on medium classes of
the railways
This growth of passenger traffic driven by growth in air and road traffic is
unsustainable in the long run

Rail• Conducted primary surveys on board trains and on platforms to
understand willingness of current passengers to shift to HSR if introduced• About 98% passengers said that they would be willing to shift to HSR• But smaller percentage were willing to pay for HSR services
Ahmedabad-Mumbai corridorMODAL SHIFT TO HSR
Primary surveys were conducted on day passenger superfast trains that started and terminated between Ahmedabad and Mumbai Central. Sample size: 1461
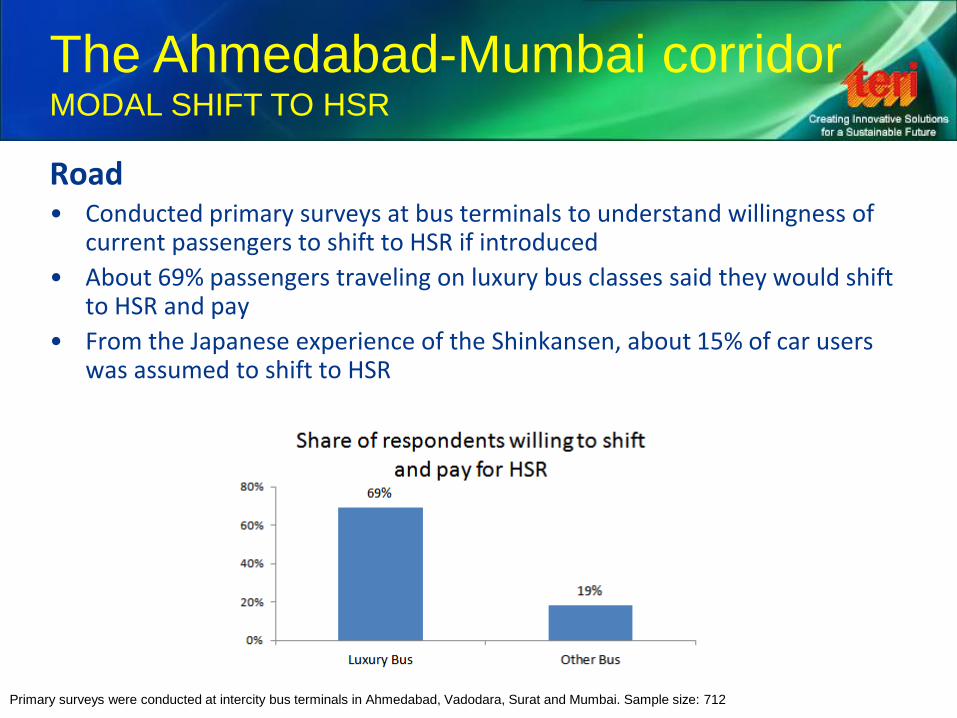
Road• Conducted primary surveys at bus terminals to understand willingness of
current passengers to shift to HSR if introduced
• About 69% passengers traveling on luxury bus classes said they would shift to HSR and pay
• From the Japanese experience of the Shinkansen, about 15% of car users was assumed to shift to HSR
The Ahmedabad-Mumbai corridorMODAL SHIFT TO HSR
Primary surveys were conducted at intercity bus terminals in Ahmedabad, Vadodara, Surat and Mumbai. Sample size: 712

The Ahmedabad-Mumbai corridorMODAL SHIFT TO HSR
Air• International experience show HSR passengers prefer to travel by HSR for
journeys with travel time less than 3 hours
• About 80% of the passengers between Ahmedabad and Mumbai can be expected to shift to HSR
Source: UIC-High Speed Presentation by Jean-Pierre LOUBINOUX 2009
Based on these assumptions an alternate scenario was built to evaluate the impact of HSR along this corridor

The Ahmedabad-Mumbai corridorTRAFFIC TRENDS WITH INTRODUCTION OF HSR
• After 15 year of operations likely shares of traffic on this corridor would be
• 46% on HSR
• 40% on roads (car: 24%, bus: 16%)
• 4% on air and 10% on conventional rail

The Ahmedabad-Mumbai corridorENERGY TRENDS WITH INTRODUCTION OF HSR
• This scenario results in an annual average savings of about 3.5 PJ over a 15 year period
• By 2035-36, HSR services would carry about 46% of the total traffic by consuming only 16% of the energy
• Road transport would still continue to consume the largest share of energy

The Ahmedabad-Mumbai corridorEMISSIONS TRENDS WITH INTRODUCTION OF HSR
• A 10% reduction of emissions per annum over BAU
• Annual average emissions reduction of about 81,040 tCO2 over a 15 year period
• Impact on emissions due to HSR is dampened due to heavy coal based energy generation – need to move towards non-fossil fuel energy sources
HOW DO THESE IMPACTS VARY
ACROSS OTHER SECTIONS?
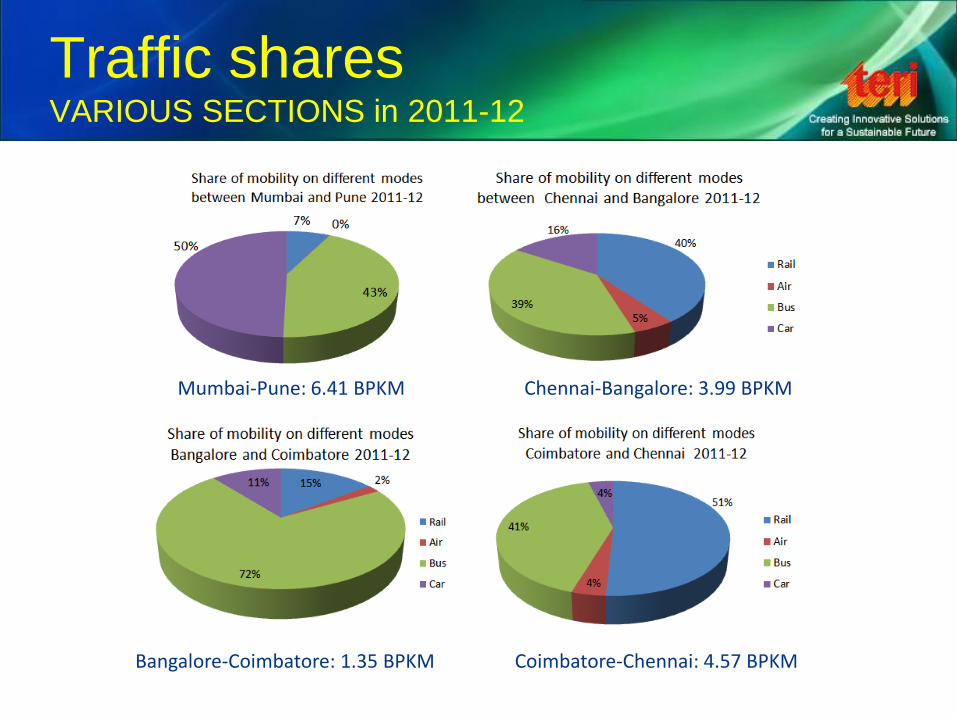
Traffic sharesVARIOUS SECTIONS in 2011-12
Mumbai-Pune: 6.41 BPKM Chennai-Bangalore: 3.99 BPKM
Coimbatore-Chennai: 4.57 BPKMBangalore-Coimbatore: 1.35 BPKM
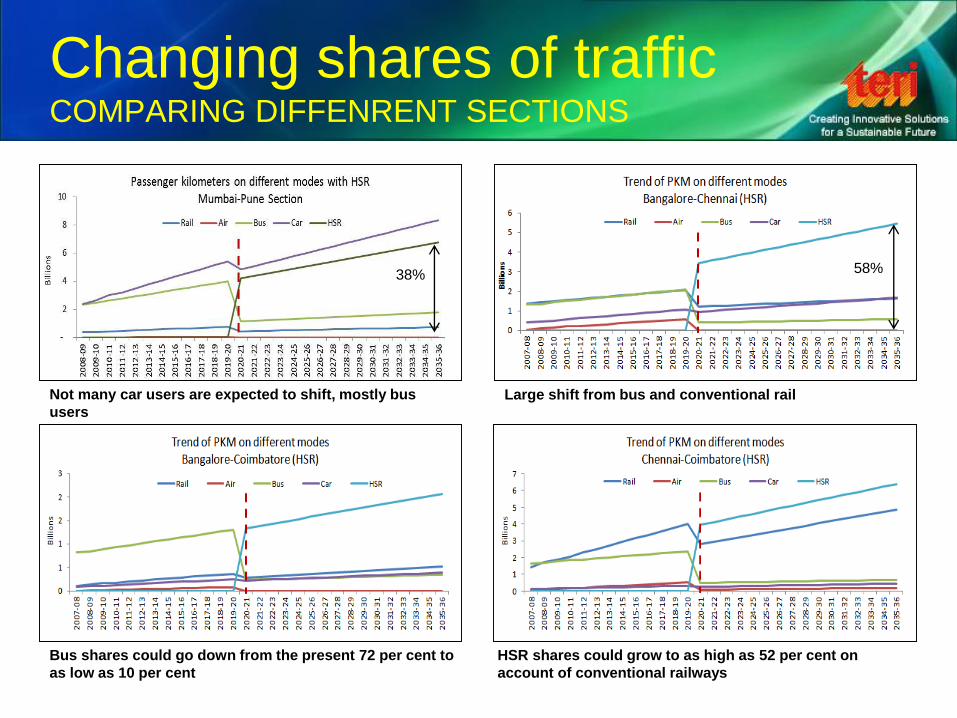
Changing shares of trafficCOMPARING DIFFENRENT SECTIONS
38% 58%
Bus shares could go down from the present 72 per cent to
as low as 10 per cent
Large shift from bus and conventional rail
HSR shares could grow to as high as 52 per cent on
account of conventional railways
Not many car users are expected to shift, mostly bus
users

Energy use patternsCOMPARING DIFFENRENT SECTIONS

Emissions patternsCOMPARING DIFFENRENT SECTIONS
Where large shifts are expected from conventional rail and buses, there is a decline in the emissions benefits of HSR

Key takeaways
1. High Speed Rail is one of the solutions to meet the rapidly
increasing demands for mobility along these corridors
2. It will also help in achieving energy savings - however the
level of savings would depend on the nature of modal shifts
3. Introduction of HSR may not result in decreased emissions
in all cases
4. Electricity generation from dirty fuels like coal could reduce
the overall benefits of HSR - need to move to renewables
5. The selection of HSR corridors should be done on a case
by case basis after thoroughly understanding the traffic
patterns along each section

#iCED_Jaipur
Transport and its link with energy and
emissions
Sarbojit Pal
Fellow
The Energy and Resources Institute (TERI)
#iCED_Jaipur
Energy Management and the Transport Sector
May 2, 2016

#iCED_Jaipur2
˃ Energy consumption in
all end use sectors
projected to reach a
level of about 740
quadrillion Btu by 2035,
a 1.5 times increase as
compared to 2007 level
˃ Transport will continue
being the second
largest energy
consuming sector after
industry
T R A N S P O R T Globally the second largest energy consuming sector
0.0
100.0
200.0
300.0
400.0
500.0
600.0
2007 2015 2020 2025 2030 2035
98109
115123
133142
(Qu
adri
llio
n B
tu)
Residential Commercial Industrial Transportation
Source – Energy Information Administration –EIA (2010)
1 Quadrillion BTU = 23.57 × 10⁶mtoe
#iCED_Jaipur3
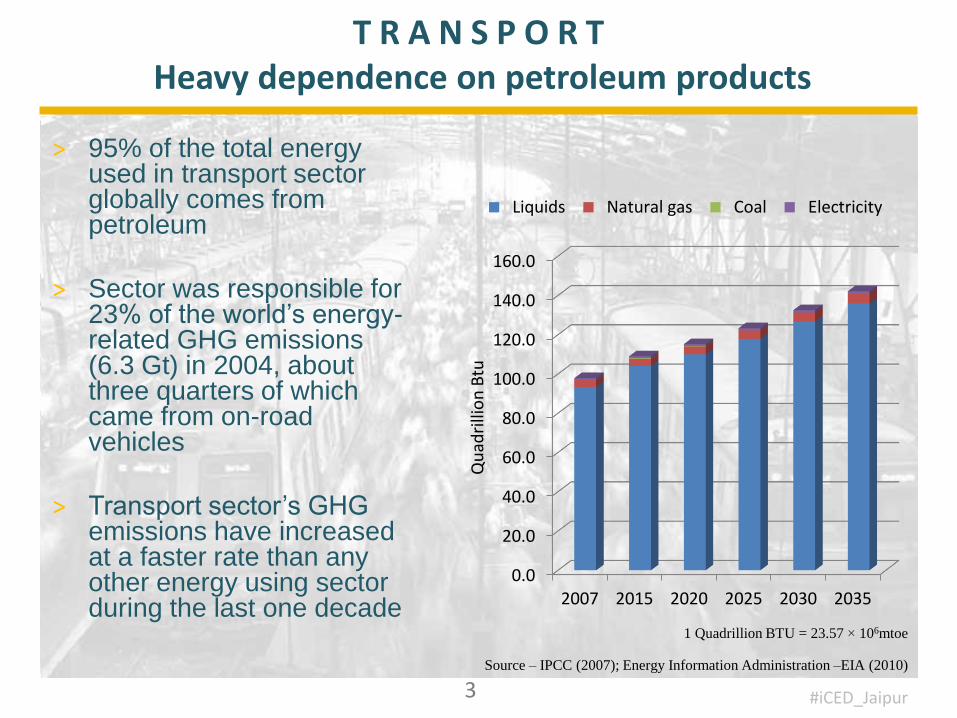
˃ 95% of the total energy used in transport sector globally comes from petroleum
˃ Sector was responsible for 23% of the world’s energy-related GHG emissions (6.3 Gt) in 2004, about three quarters of which came from on-road vehicles
˃ Transport sector’s GHG emissions have increased at a faster rate than any other energy using sector during the last one decade
T R A N S P O R T Heavy dependence on petroleum products
Source – IPCC (2007); Energy Information Administration –EIA (2010)
0.0
20.0
40.0
60.0
80.0
100.0
120.0
140.0
160.0
2007 2015 2020 2025 2030 2035
Qu
adri
llio
n B
tu
Liquids Natural gas Coal Electricity
1 Quadrillion BTU = 23.57 × 10⁶mtoe

#iCED_Jaipur4
˃ Transport sector will be
responsible for 60% of the
world’s liquid fuel consumption in
2035
T R A N S P O R T Main consumer of world’s liquid energy
Source – EIA (2010); Photo credit – Lohia (2009)
0.00
20.00
40.00
60.00
80.00
100.00
120.00
140.00
2007 2015 2020 2025 2030 2035
Qu
adri
llio
n B
tu
Transportation Others

#iCED_Jaipur5
˃ Road transport sector responsible for 3/4th of transport sector’s
energy consumption and emissions
R O A D T R A N S P O R T Main consumer of energy within transport sector
Source – IPCC (2007)

#iCED_Jaipur6
˃ Global energy-related CO2 emissions expected to increase to about 40Gt by 2030
˃ Emissions from transport sector would be around 9Gt (23%) despite significant mitigation policies built into the reference scenario
˃ Share of non-OECD countries in the total global CO2 emissions from transport sector in 2004 was 36%. This is expected to increase to 46% by 2030 if the current trends of transport growth in these countries continue
G R O W I N G C A U S E F O R E M I S S I O N SCO2 emissions expected to increase in the BAU scenario
Source – IPCC (2007); Photo credit – IRF (2009)

#iCED_Jaipur7
Future growth of motor vehicles:
˃ Globally, an average annual increase of about 3% expected
˃ Europe to experience slowest rate of car growth (less than 1 % per year)
˃ Rate of growth in United States expected around 1-2% per year
˃ China and India to experience much faster annual growth rates of more than 7 or 8 % per year
P E R S O N A L M O T O R V E H I C L E SFueling the current trends in emission and energy use
Source – Sperling and Gordon (2008)
Number of motor vehicles expected to more than double in the next two decades

#iCED_Jaipur8
R I S E O F P E R S O N A L V E H I C L E SLinked to economic growth
Source – Ghate et al (2010)
˃ Personal vehicles per thousand population in developing
countries increases with economic growth

#iCED_Jaipur9
S E C T O R ’ s E N E R G Y U S EFrom LDVs and Developed Nations
Source – IPCC (2007)
˃ Largest growth in energy demand in transport sector would be
in developing countries

#iCED_Jaipur10
T R A N S P O R T A N D E N V I R O N M E N TOther Impacts
Photo credits – Lohia (2009); www.hindu.com
˃ Largest impacts of these effects
are felt in developing countries
˃ Emissions
˃ Congestion
˃ Air pollution
˃ Health
˃ Accidents
˃ Parking
#iCED_Jaipur
I N D I A N S C E N A R I O

#iCED_Jaipur12
˃ About 182 million registered
vehicles (3rd highest in the world)
˃ Second highest road network
(5.23 mil. kilometers in 2012/13)
˃ Highest railway passenger traffic
(23 million passengers per day!)
T R A N S P O R T S E C T O R I N I N D I AChallenges magnified due to its scale and needs
Picture source: http://www.flickr.com/photos/lingaraj/2415084235/sizes/l/;http://upload.wikimedia.org/wikipedia/commons/thumb/b/b2/Bombay4.jpg
˃ Fourth largest freight carrying railway system in the world
˃ Almost 8000 cities with over 55 million plus
˃ Public bus and rail based services available in only 68 cities

#iCED_Jaipur13
˃ Largest volume of both passenger and
freight traffic moves on road
˃ Over 2 million road vehicles are sold
every year
˃ In 2012-13 motorized freight transport
moved on#:
˃ Roads (50%)
˃ Railways (36%)
˃ Pipelines (7.5%)
˃ Coastal shipping (6.4%)
˃ Passenger traffic mostly moved on*
˃ Road (84%)
˃ Rail (15%)
˃ Air (1%)
˃ Energy efficient railways consistently
losing its share in both passenger and
freight traffic
T R A N S P O R T S E C T O R I N I N D I AHeavily reliant on road transport
*TERI Estimates; #RITES Total Transport System Study on Traffic Flows & Modal
Costs (Highways, Railways, Airways & Coastal Shipping)
Share of Freight traffic on different modes (2007-08)
Source: RITES Total Transport Study, Chapter 3
Source: Road Transport Yearbook, 2012-13
19 18 17 16 15 14 13 13 14 14 14 14 14 15
0%
20%
40%
60%
80%
100%
Share of modes in passenger transport
Roadways (%) Railways (%)

#iCED_Jaipur14
˃ Exact volumes of road transport traffic is difficult to determine in the absence of accurate road data
˃ Most studies however point to a declining share of Railways in both freight and passenger traffic
R A I L W A Y S Declining shares
0%
10%
20%
30%
40%
50%
60%
70%
80%
90%
100%
Freight transport
Road Railways
0%
10%
20%
30%
40%
50%
60%
70%
80%
90%
Passenger transport
Road Railways Airlines
Source: Planning Commission and TERI Estimates

#iCED_Jaipur15
69.2
42.74
86.98
17.33
0
10
20
30
40
50
60
70
80
90
100
2009-10 2010-11 2011-12 2012-13(R) 2013-14(P)
Percentage of total availability (production plus imports) of select
major commodities carried on IR
Coal
Iron Ore
Cement
Foodgrains
Fertilisers
POL
F R E I G H T S H A R E S O N R A I LRail losing share even in core commodities
˃ Rail loosing its share to road across a large number of commodities
˃ Coal, Iron Ore, Food-grain shares are flat or are increasing
˃ Cement and POL are major commodities where shares are declining

#iCED_Jaipur16
Source: Life Cycle Analysis Report, 2012, TERI
Operational CO2 emission (g/PKM)
˃ The most environmentally benign mode of land transport
˃ Need to retain, and increase the share of railways
R A I L W A Y SEfficient passenger transport mode

#iCED_Jaipur17
˃ Demand growth has outpaced infrastructure growth
˃ Investments in railways have remained low
˃ Current suggestion is injection of Rs. 8.5L Cr. over next 5 years
˃ Non-competitive freight rates cross subsidizing
passenger
˃ Passenger business getting stiff competition from
airlines
RAILWAYS LOSING SHARESome key factors for share decline
Sector Year Infrastructure supply (km)
Avg. annual growth rate of infrastructure supply
Demand in BAU (BPKM)
Avg. annual growth rate of
demand
Rail
2010-11Route kms - 64, 015
28% double/multiple lines 3.9%
868
13.5%2,360
2020-21Route kms - 89,015
33% double/multiple lines
Source: IR Vision 2020 for infrastructure supply and TERI Estimates for demand

#iCED_Jaipur18
˃ Transport consumes 22% of the India’s commercial energy
˃ Most of the energy is consumed in the form of petroleum fuels
Source: TEDDY 2015
18
L A R G E C O N S U M E R O F E N E R G YSecond only to industry sector

#iCED_Jaipur19
˃ Road transport meets ~50% of the freight and ~84% of the
passenger mobility but consumes over 90% of the energy
19
W I T H I N T H E T R A N S P O R T S E C T O RDisproportionate use of energy by roads
Road-Passenger60%
Rail-Passenger2%
Air-Passenger2%
Road-Freight34%
Rail-Freight2%
Air-Freight0%
Share of energy use by different transport modes (2014-15)
Source: TERI Transport Model Estimates

#iCED_Jaipur20
˃ Single largest petroleum
consuming sector in India
˃ Consumption in 2012-13*
˃ ~100% of gasoline/petrol
(15.7MT)
˃ ~70% of the diesel (48.42MT)
˃ Traces of LPG and CNG
*source: PETSTAT 2012-13 and PPAC; #MOEF (INCCA 2010 Study – India: GHG Emissions 2007)
˃ Inadequate energy supply to this
sector can destabilize economic
growth
˃ And increasing petroleum
consumption by this sector can
jeopardize national energy security
Source: All India Study on Sectoral Demand of Diesel & Petrol, PPAC 2013
Share of diesel consumption by different sectors
Share of petrol consumption by different vehicles
20
R O A D T R A N S P O R THeavily reliant on petroleum products
#iCED_Jaipur21
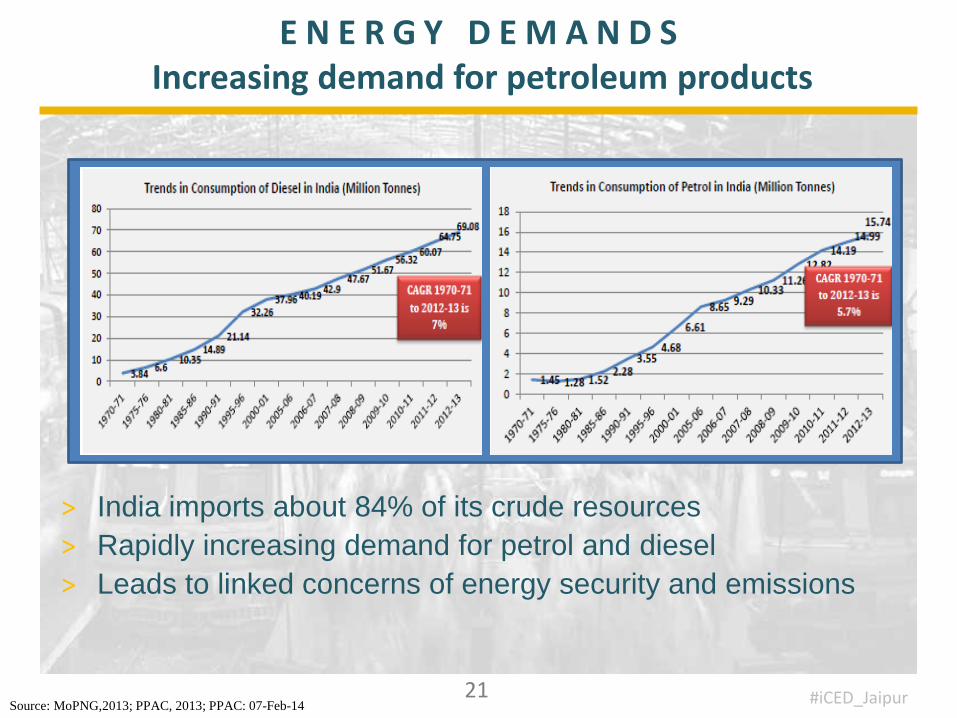
˃ India imports about 84% of its crude resources
˃ Rapidly increasing demand for petrol and diesel
˃ Leads to linked concerns of energy security and emissions
Source: MoPNG,2013; PPAC, 2013; PPAC: 07-Feb-14
21
E N E R G Y D E M A N D SIncreasing demand for petroleum products

#iCED_Jaipur22
0
20
40
60
80
100
120
140
160
180
200
1981 1986 1991 1996 2000 2001 2002 2003 2004 2005 2006 2007 2008 2009 2010 2011 2012 2013
Mill
ion
s
Growth in registered vehicles in India (1980-2013)
Two-wheelers Cars, jeeps, taxis Buses Goods vehicles Others
~182M registered vehicles in 2013!
~54M registered vehicles in 2001
˃ Passenger vehicles have been growing at exponential rates
˃ Almost 30 per cent of registered vehicles are concentrated in 35 million plus cities
22
R O A D T R A N S P O R TRapid growth in road vehicles in India

#iCED_Jaipur23
Source: Ghate and Sundar (2013)
˃ With continued economic growth and urbanization similar situation will arise in other cities and rural centers
23
T R E N D S O F C A R O W N E R S H I PCar ownership levels will continue to rise

#iCED_Jaipur24
-
100
200
300
400
500
600
700
800
Millio
ns
(tC
O2
)
Emissions trends from the Transport Sector
Passenger (tCO2) Freight (tCO2)
Source: TERI Transport Model
˃ If current trends were to continue:
˃ 5 times growth in energy consumption
˃ 7 times growth in emissions generated
L O N G T E R M I M P L I C A T I O N SA scenario of high energy and emissions
-
50
100
150
200
250
300
2005 2010 2015 2020 2025 2030
Energy consumption by transport modes (MTOE)
Air-Freight
Rail-Freight
Road-Freight
Air-Passenger
Rail-Passenger
Road-Passenger

#iCED_Jaipur
I N D I A ’ s S T E P S S O F A R F O RR E D U C I N G E N E R G Y D E M A N D A N D
E M I S S I O N S F R O M T H E S E C T O R

#iCED_Jaipur26
˃ For a developing and low income country like India, growth of transport sector is critical for meeting its development objectives
˃ Access and availability is still limited in many parts of the country – need to develop all modes
˃ Government’s current strategy include development of rail, road, air and water transport driven by the objective of providing choice for both passenger and freight mobility
˃ The sector has large scope to reduce energy intensities and GHG emissions and an energy efficient, low carbon transport path has large number of co-benefits
˃ Focus gradually shifting to make the sector more energy efficient and sustainable
T R A N S P O R T A sector with large energy and GHG mitigation potential

#iCED_Jaipur27
˃ National Urban Transport Policy
˃ National Action Plan on Climate Change
˃ 12th Five Year Plan
˃ National Electric Mobility Mission
˃ Inland Water Transport policy
˃ Smart cities and new National Urban Renewal Mission
˃ INDCs
TRANSPORT POLICIES recognize the need for low carbon transport
Need for having a holistic and integrated view of the sector to reap the largest benefits

#iCED_Jaipur28
˃ Improvement in vehicle
efficiencies
˃ Aggressive implementation
of emission norms
˃ Increasing public transport
services
˃ Moving to energy efficient
Hybrid and Electric Vehicles
˃ Removal of fuel subsidies
˃ Improvement in road quality
Picture sourced from: Wikimedia Commons28
Measures being pursued in India to reduce energy demand from road transport
#iCED_Jaipur29
˃ The fuel efficiency of new cars in India is 20‐30% more than the global average, owing to its high share of small cars (UNEP, 2014)
˃ India has announced its first‐ever automobile fuel efficiency norms for LMVs (below 3500 kg) in 2014 ‐ corporate average fuel economy (CAFE) standards
˃ CAFE standards for cars are based on the corporate average kerb weight (CAKW) of the vehicles sold by the manufacturers applicable from 2017
˃ Fuel efficiency improvements in HDVs can result in substantial savings of the fuel (in the order of 65 MT annually by the year 2030)
˃ Fuel Economy Standards for HDVs are in the process of being formulated
Efforts to reduce energy intensities of the road transport sector
#iCED_Jaipur30
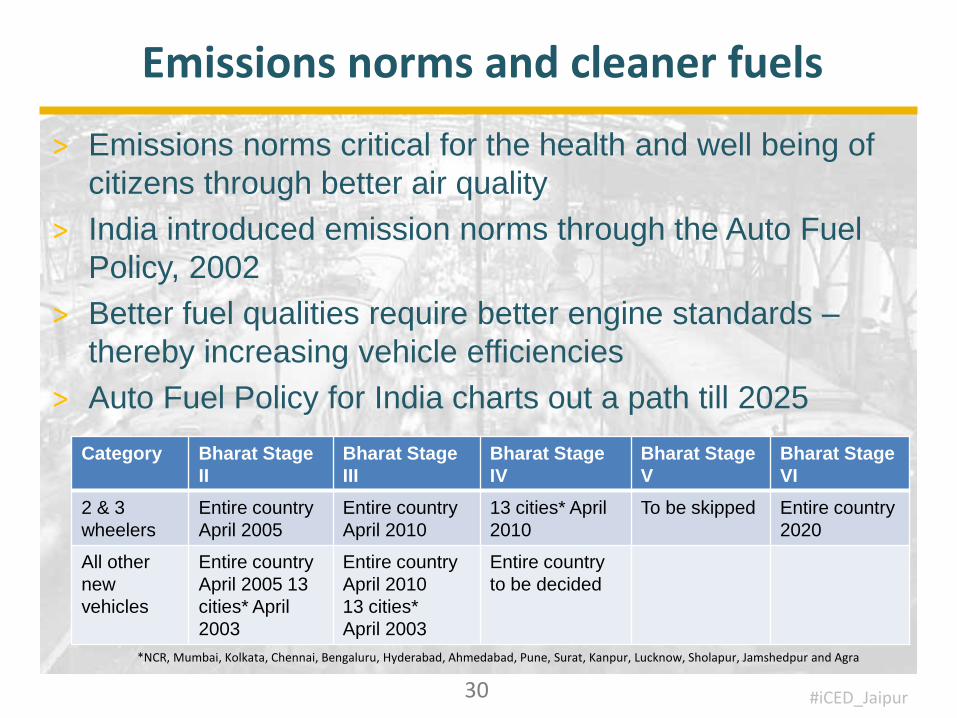
˃ Emissions norms critical for the health and well being of
citizens through better air quality
˃ India introduced emission norms through the Auto Fuel
Policy, 2002
˃ Better fuel qualities require better engine standards –
thereby increasing vehicle efficiencies
˃ Auto Fuel Policy for India charts out a path till 2025
Emissions norms and cleaner fuels
Category Bharat Stage
II
Bharat Stage
III
Bharat Stage
IV
Bharat Stage
V
Bharat Stage
VI
2 & 3
wheelers
Entire country
April 2005
Entire country
April 2010
13 cities* April
2010
To be skipped Entire country
2020
All other
new
vehicles
Entire country
April 2005 13
cities* April
2003
Entire country
April 2010
13 cities*
April 2003
Entire country
to be decided
*NCR, Mumbai, Kolkata, Chennai, Bengaluru, Hyderabad, Ahmedabad, Pune, Surat, Kanpur, Lucknow, Sholapur, Jamshedpur and Agra

#iCED_Jaipur31
Hybrid and electric vehicles
˃ Pure electric vehicles are almost 6-7 times more energy efficient than ICT vehicles
˃ National Electric Mobility Mission Plan 2020 (NEMMP 2020)
˃ Ambitious vision for 5-7 million xEVs in India
˃ Including electric, hybrid and plug-in hybrid
˃ FAME India, an incentive scheme to extend subsidy for xEVs have also been launched
˃ Could completely revolutionize the nature of road transport in India
˃ This has to be complemented by also moving passenger traffic to rail based transport and freight traffic to rail, water and pipelines
xEV potential demand by 2020
Source: NEMMP 2020
#iCED_Jaipur32
˃ Share of bus and non-motorized passenger traffic had been on the decline
˃ Aggressive push to introduction/ increasing penetration of public transport in cities
˃ Three key focus areas‐ Introduce/increase penetration of city buses
Implement high capacity public transport systems i.e. BRTS and MRTS
Capacity building of stakeholders working in the area of public transport
Need to develop innovative financial models to finance public transport
Shift and Retain Public transport

#iCED_Jaipur33
Increasing the share of public transport
˃ National Urban Transport Plan 2006
˃ Increase and improvement of public and
non-motorized transport infrastructure
˃ National Urban Renewable Mission
(2005-12)
˃ Number of buses have almost doubled
˃ 21 BRTS projects in 10 cities
˃ Intelligent Transport System
infrastructure, Traffic infrastructure,
Transit Management Centers, etc.
˃ Increase in the number of urban metro
and suburban services
˃ 8 cities have suburban rail services
˃ 5 cities already have metro rail services
˃ 22 more metro services are being
planned
892
1 604
200
400
600
800
1 000
1 200
1 400
1 600
Number of registered buses in India*
Th
ou
san
ds
*Source: TEDDY 2011-12; Picture sourced from: Wikimedia Commons33

#iCED_Jaipur34
Key policies & schemes promote
the concept of sustainable and
low carbon mobility
NUTP
JNNURMNMSH
SLBs
SUTP
AMRUT
SMART CITIES
Policy shifted
focus in urban
transport from
transport to
“mobility”
Made it compulsory for
cities to develop CMPs
consistent with NUTP to
secure funding
Need for integrated land
use planning for Urban
Development
Delivery
standards for
public
infrastructure
projects
Capacity building
programs &
sustainable
transport demo
projects
Upgrade of urban transport
infrastructure and technology
Integrate TOD in
development of
such cities
URBAN TRANSPORTLarge gamut of policies

#iCED_Jaipur35
˃ Railways are about 18-20 times more energy efficient in operations than personal road transport
˃ In 2013-14 Indian Railways carried˃ 8.397 billion passengers
˃ 1.051 billion tonnes
˃ By consuming˃ 2.78 billion litres of diesel (2.76 MTOE)
˃ ~ 4.0% of total for HSD for transport sector
˃ 14.41 billion KWH electricity (1.45 MTOE)
˃ ~2 % of National Consumption
˃ Several measures being taken to make the railways more efficient and improve its services to retain traffic
Source: TERI-NTDPC Life Cycle Analysis of Transport Modes, 2012; IR Annual Statistical Statements 2011-12;
0
200
400
600
800
1,000
1,200
0
2000
4000
6000
8000
10000
BPKMMillion
No of originating passengers (in millions) BPKM
0
100
200
300
400
500
600
700
800
0
200
400
600
800
1000
1200
BNTKMMillion
Total originating freight traffic in millions BNTKM
35
R A I L W A Y SConstant efforts to increase efficiencies

#iCED_Jaipur36
˃ Need to taken an integrated view of transport and fit rail
˃ Freight tariff rates need to be moderated for commodities
where IR has lost the market share to Roadways.
˃ Commodity specific wagons and wagons with higher tare
to weight ratio & increased axle load are strategies for
improved operational efficiency
˃ Quick transit for both freight and passenger services
could be a game changer for the Railways
˃ Increase average freight speed to 60 kmph and
passenger to 100 kmph
˃ Increase bandwidth and capacity of both freight and
passenger services
I N C R E A S I N G T H E S H A R E O F R A I L W A Y SMeasures being taken and suggested
#iCED_Jaipur37
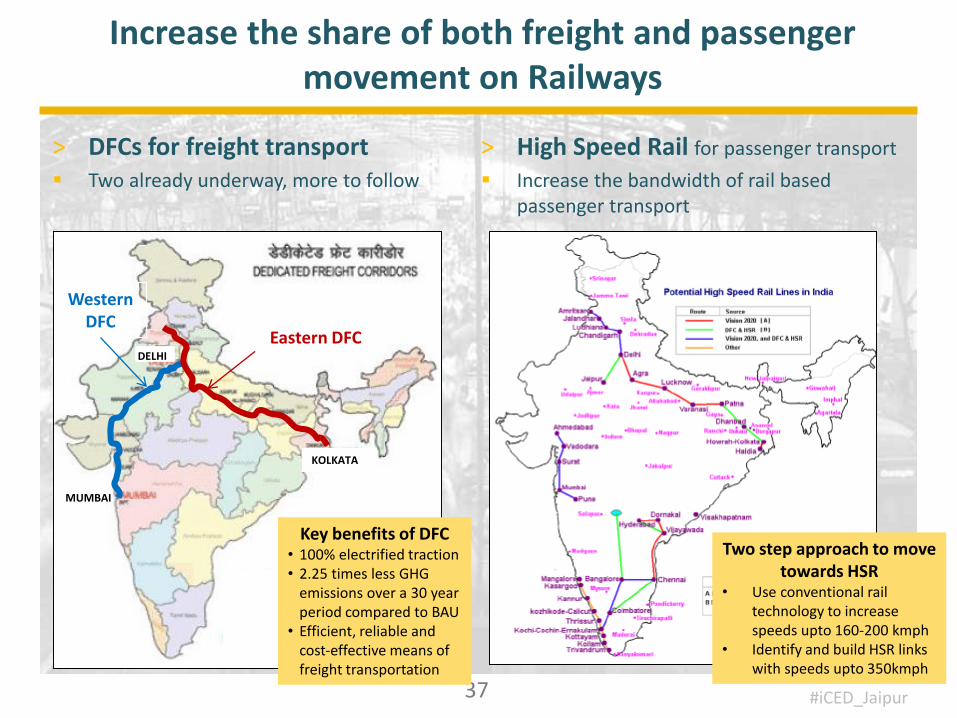
˃ DFCs for freight transport Two already underway, more to follow
Increase the share of both freight and passenger movement on Railways
˃ High Speed Rail for passenger transport
Increase the bandwidth of rail based passenger transport
Two step approach to move towards HSR
• Use conventional rail technology to increase speeds upto 160-200 kmph
• Identify and build HSR links with speeds upto 350kmph
Key benefits of DFC• 100% electrified traction• 2.25 times less GHG
emissions over a 30 year period compared to BAU
• Efficient, reliable and cost‐effective means of freight transportation
Western DFC
Eastern DFC
KOLKATA
MUMBAI
DELHI

#iCED_Jaipur38
˃ Targeted efficiency improvements in
both diesel and electric locomotives
˃ Initiatives of Bio-diesel and
CNG/LNG in Rail traction can be
supported by National Clean
Energy fund
˃ Targeting environmental funds of
Government of India to support the
energy efficient Railways
˃ Supplementing market borrowings
through Environmental funds for
financing railway projects
M A K I N G R A I L W A Y S M O R E E F F I C I E N TMeasures being taken and suggested

#iCED_Jaipur39
˃ Electrification of the railway network is a priority for the
Railways
˃ Energy saving measures being adopted in both traction
and non-traction activities
˃ Introduction of high HP, high efficiency electric
locomotives
˃ Couple the drive towards efficient electric traction with the
use of renewable power sources
˃ Railway efforts are already underway in this regard
Electrification and promoting alternate/clean fuels in Railways

#iCED_Jaipur40
tCO2/million
GTKM
% reduction Annual
savings in
million tCO2
2005 12.40 Base year Base year
2014 10.82 12.7 3
2020 9.44 23 9
2030 8.35 31 23
Target for Emission Intensity reduction for Railways in India

#iCED_Jaipur41
˃ Increase of Rail mode share in land freight transport from 36% to 45 %
˃ Dedicated Freight Corridors
˃ Improvement in technical energy efficiency factors
˃ Increase Mass Rapid Transit Systems
˃ Solar power in Railways – Land & Roof top
RAILWAYS AND INDIA’s INDCSustainable green transportation system

#iCED_Jaipur
M O V I N G T O W A R D S A L O W C A R B O N T R A N S P O R T T R A J E C T O R Y
- S T R A T E G I E S -
42

#iCED_Jaipur43
1. Developing an integrated view of transport Large number of ministries presently dealing with transport
Need to establish an unified agency with a holistic view for transport coordination and planning
2. Encourage an optimal mix of rail, water and road transport for inter-city movement Develop strategies that specifically target improvement in
shares of rail and water modes in inter-regional movement
Strategies can focus on investments on rail and water transport infrastructure and incentives to encourage shift to these modes
Moving India towards a low carbon transport path

#iCED_Jaipur44
3. Diversify the fuel basket of transport sector Encourage use of fuels other than petrol and diesel Large number
of ministries presently dealing with transport
Establish the necessary infrastructure to promote the use of alternative fuels
Promote electricity as a transport fuel of future, keeping in view move towards renewables
4. Arrest the fast pace of motorization (ownership and utilization of vehicles) Policies should target altering the current patterns of motorization
in terms of vehicle ownership and utilization
Possible policy options - vehicle quota system, high parking fees, high vehicle registration charges, fuel taxes, congestion pricing, etc.
Moving India towards a low carbon transport path

#iCED_Jaipur45
5. Increase the share of public transport and non motorized modes in urban areas Need to arrest the growing dependence on private modes in
cities - encourage a shift from personal to mass modes of transport
Introduce comprehensive policies and programs to outline a roadmap for the improvement/development of public transport in all cities – Improve public transport systems, in terms of their capacity, coverage
and quality
Promote inter-modal integration
Develop comprehensive strategies to develop infrastructure for non motorized transport users
Moving India towards a low carbon transport path

#iCED_Jaipur46
6. Promote integrated land use and transport planning in urban areas˃ Transit oriented development in cities, high density along transit corridors, inter-
modal integration, promote cycling and walking, reduce need for motorized travel, etc.
7. Encourage energy efficient road-based movement ˃ Mandate fuel efficiency standards
˃ Tighten emission norms
˃ Improve vehicle technologies and fuel quality
˃ Establish modern inspection and maintenance regimes
8. Increased use of Information Technology˃ Encourage virtual commuting
˃ Improved freight delivery and logistics
9. Capacity building at all levels˃ Institutional capacity building for practicing sustainable transport policies
˃ Creating awareness among policy makers and transport users on issues of sustainable mobility
Moving India towards a low carbon transport path


![Download [7.94 MB]](https://img.pdfslide.us/doc/110x75/5866e7431a28abf23f8b8ead/download-794-mb.jpg)


![BPKM 2012_2013[1]](https://img.pdfslide.us/doc/110x75/55cf987e550346d03397f731/bpkm-201220131.jpg)