Embed Size (px)
Citation preview

High Rock Lake Turbidity Criteria (link to rules)
15A NCAC 02B .0211 FRESH SURFACE WATER QUALITY STANDARDS FOR CLASS C WATERS
General. The water quality standards for all fresh surface waters shall be the basic standards applicable to
Class C waters. Water quality standards for temperature and numerical water quality standards for the
protection of human health applicable to all fresh surface waters are in Rule .0208 of this Section. Additional
and more stringent standards applicable to other specific freshwater classifications are specified in Rules
.0212, .0214, .0215, .0216, .0218, .0219, .0223, .0224 and .0225 of this Section. Action Levels for purposes of
National Pollutant Discharge Elimination System (NPDES) permitting are specified in Item (22) of this Rule.
(1) Best Usage of Waters: aquatic life propagation and maintenance of biological integrity (including
fishing and fish), wildlife, secondary recreation, agriculture, and any other usage except for primary
recreation or as a source of water supply for drinking, culinary, or food processing purposes;
(2) Conditions Related to Best Usage: the waters shall be suitable for aquatic life propagation and
maintenance of biological integrity, wildlife, secondary recreation, and agriculture. Sources of water
pollution that preclude any of these uses on either a short-term or long-term basis shall be
considered to be violating a water quality standard; …
(21) Turbidity: the turbidity in the receiving water shall not exceed 50 Nephelometric Turbidity Units
(NTU) in streams not designated as trout waters and 10 NTU in streams, lakes, or reservoirs
designated as trout waters; for lakes and reservoirs not designated as trout waters, the turbidity
shall not exceed 25 NTU; if turbidity exceeds these levels due to natural background conditions, the
existing turbidity level shall not be increased. Compliance with this turbidity standard can be met
when land management activities employ Best Management Practices (BMPs) [as defined by Rule
.0202 of this Section] recommended by the Designated Nonpoint Source Agency [as defined by Rule
.0202 of this Section]. BMPs shall be in full compliance with all specifications governing the proper
design, installation, operation, and maintenance of such BMPs;
2016 303(d) Listing Methodology (EMC approved May 2015) (link to full document)
1. ASSESSING NUMERIC CRITERIA
The following sets of evaluations will be used for the 2016 assessment for these parameters: chlorophyll-a,
dissolved oxygen, MBAS, mercury, nitrate/nitrite, pH, temperature, toxic substances, and turbidity. For each
parameter there is a brief discussion of the standard used for assessment of the parameter including any
parameter-specific good causes for not assessing in Category 5.
The true frequency of criteria exceedances cannot be measured. It must be estimated from a set of samples,
which introduces statistical uncertainty. The degree of uncertainty depends on the sample size. NC will use a
nonparametric hypothesis testing approach based on the binomial distribution. The binomial method allows
a quantifiable level of statistical confidence (90%) for listing decisions, which provides a 10% probability of
listing an assessment unit when it should not be listed. The null hypothesis is that the overall exceedance
probability is less than or equal to the 10% exceedance allowance.
• Exceeding Criteria-Category 5
o Greater than 10% exceedance with greater than or equal to 90% confidence

o Sample size is greater than nine.
The standards (criteria) and additional considerations are included for each parameter as applicable….
TURBIDITY (AQUATIC LIFE) CRITERIA The turbidity criteria are 50 nephalometric turbidity units (NTU) for
freshwaters, 25 NTU for reservoirs and estuarine waters, and 10 NTU for supplemental classified Trout
waters.

NC Nutrient Criteria Development Plan – Scientific Advisory Council (meeting #10)
10/19/2016
Page 1 of 19
Attendees
SAC members in attendance:
Lauren Petter
Bill Hall
Linda Ehrlich
Clifton Bell
Deanna Osmond
Michael O’Driscoll
Nathan Hall (alternate for Hans Paerl)
James Bowen
Astrid Schnetzer
SAC members online:
Marcelo Ardon (AM)
Martin Lebo (PM)
SAC meeting facilitator:
Andy Sachs
NCDEQ NCDP Team members in attendance:
Tammy Hill
Mike Templeton
Connie Brower
Pam Behm
Jing Lin
Christopher Ventaloro
Jeff Manning
Jucilene Hoffman
Jim Hawhee
Cyndi Karoly
Bonghi Hong
Nora Deamer
Brian Wrenn (AM)
Guest presenter:
Whit Wheeler – City of Raleigh Public Utilities Department
Kenny Waldroup – City of Raleigh, Assistant Director
Cam McNutt - DWR
CIC members in attendance:
In person:
Andy McDaniel
Anne Coan
Meeting notes
***All questions, comments and answers are paraphrased***
1. Convene (Andy Sachs)
a. SAC members, DWR staff and audience attendees provide names and affiliations.
b. Facilitator asks for approval on meeting notes from June 15th, 2016 SAC meeting (meeting
#9)
NC Nutrient Criteria Development Plan – Scientific Advisory Council (meeting #10)
10/19/2016
Page 2 of 19
i. Comments:
1. Bill: From reading the notes it appears that this discussion on whether HRL
is impaired keeps coming up. We need to make a decision on this.
2. DWR Staff Updates (Jim Hawhee)
a. Steve Kroeger has retired.
b. Jim Hawhee will lead the NCDP efforts for now.
c. SAC member alternates:
i. SAC members, remember that you may have alternates.
ii. Contact Jim Hawhee to notify us of your choice for an alternate.
d. Schedule going forward:
i. Next SAC meeting is scheduled for December 14th, 2016.
1. Conflicts:
Jim H. will be having a baby that day!
Connie will be in Washington D.C. to participate in an EPA
cyanotoxin criteria workgroup.
Deanna has a meeting that she must attend.
2. Proposed option to postpone this meeting. Jim H. will follow-up on this
before December.
ii. Have been holding SAC meetings bimonthly on Wednesdays. Is this still preferable?
1. Wednesdays conflict with some SAC member teaching schedules.
2. SAC members request DWR staff send out another Doodle poll for the
selection of dates for 2017 SAC meetings
iii. December SAC meeting will be pushed to January or February depending on
Doodle poll results.
e. Mid-term Plan:
i. High Rock Lake:
1. So far we have discussed indicators, nutrient criteria, uses, and approaches
2. Summer study has wrapped up and data is forthcoming
3. Should start to get results of the toxins analysis beginning mid-November
4. We’ll talk about assessment methods today
5. Up next we will be narrowing down the criteria ranges and entering the
early stages of discussing potential criteria suggestion.
6. Does the SAC feel we are moving closer to criteria discussions?
Clifton: Still concerned about where to go with clarity. Tying
recreational uses to water clarity is very subjective. Are the surveys
we’ve discussed so far (mostly from non-piedmont lakes) sufficient
for us to make a decision on this? Is there something else we can
look at?
Jim H.: We can discuss this further this afternoon.
NC Nutrient Criteria Development Plan – Scientific Advisory Council (meeting #10)
10/19/2016
Page 3 of 19
Mike: Concerned about separating turbidity due to chlorophyll
from that due to sediment. Can we separate the nutrient influence
from the sediment influence?
i. Astrid: Part of the lake Assessment looked at turbidity.
Maybe we can look at that?
ii. Clifton: A light partitioning approach may help to
differentiate this.
7. Thoughts on moving forward:
Can we pick off some of the chemical parameters (pH, DO) and
start to move forward on those while we consider some of these
other issues?
Cape Fear stuff is also coming up.
8. Update on Florida algal blooms (Lauren Petter)
Algal blooms have been occurring in Lake Okeechobee, FL.
FL has TN, TP & chlorophyll-a standards for the lake.
There is a high internal load of nutrients in the lake.
The flow in the lake is very regulated by the Army Core of
Engineers due to the presence of a dam.
Excess water is released to the estuaries.
FL has been testing for microcystin since May of 2016.
i. 170 samples
1. 25% had detects
2. 60% of detects were <10 ug/L
3. 30% of detects were >100 ug/L
Questions/comments:
i. Astrid: Did FL do a whole water analysis (particulate +
dissolved)?
1. Lauren: Not sure.
ii. Deanna: Does FL (the state) do their own toxin analysis?
1. Lauren: Not sure if they do it or contract it.
2. Astrid: They do it irregularly.
iii. Astrid: Did the testing result in any lake closings?
1. Lauren: They do advisory postings not closures.
iv. Bill: Were the toxin detects confined to the lake?
1. Lauren: It varied. There is a report that I can send
out to everyone.
9. Update on upcoming cyanotoxin guidance for recreational waters. (Lauren
Petter)
In 2015, EPA released drinking water advisories for mycrocystin
and cylindrospermopsin. These were not intended to reflect

NC Nutrient Criteria Development Plan – Scientific Advisory Council (meeting #10)
10/19/2016
Page 4 of 19
recreation uses in surface waters.
See Fact Sheet here:
https://www.epa.gov/sites/production/files/2015-
06/documents/cyanotoxins-fact_sheet-2015.pdf
EPA has since been working on recreation guidelines for
cyanotoxins for surface waters.
A draft document may be available by the end of 2016 for public
comment.
Questions/comments:
i. Astrid: Are the drinking water advisories for chronic
exposures?
ii. Nathan & Clifton: They are calculated for 10-day exposure
durations with separate advisory levels for adults, infants
and children. Water consumption for adults is based on 2 L
drinking water per day.
3. Albemarle Sound Criteria Development: Updates and Status (Jim Hawhee)
a. Albemarle Sound was chosen for an estuarine pilot program
b. An Albemarle-Pamlico National Estuary Partnership (APNEP) workgroup was established to
review the nutrient criteria that protect the Albemarle-Pamlico estuarine system under the
Clean Water Act.
c. APNEP workgroup completed Phase 1 in September of 2016 which will result in a research
agenda for DWR staff and the SAC to consider.
d. Overview:
i. Albemarle projects:
1. Remote sensing study
2. Tetra Tech report
3. Law & Policy review
4. Literature compilation
5. USGS initiatives (one report pending)
6. DWR data analysis
ii. Meeting progression
iii. Planning timeline
1. Group did not come up with criteria recommendations
2. Jim Hawhee is working on a Phase 1 report and hopes to have a draft
completed by the end of 2016.
3. Due to APNEP staff & priority changes, Phase 2 will be picked up by the SAC
and will involve working towards developing criteria with a target date of
2018.
e. Questions/comments:
i. Connie: Is the target date the completion date?
1. Jim H. Hard to say.

NC Nutrient Criteria Development Plan – Scientific Advisory Council (meeting #10)
10/19/2016
Page 5 of 19
ii. Bill: Is there a model for this system?
1. Jim H.: The workgroup determined that the complexity of the system
would make developing a model very difficult. They decided that a model
would not be the most appropriate approach to take in determining
nutrient criteria for this system.
iii. Mike O.: Were other estuary systems examined to see if there were similar
systems?
1. Jim H.: No other systems compared to the Albemarle-Pamlico system
directly.
2. Clifton: There was information from other systems regarding using
chlorophyll-a criteria for the protection of submerged aquatic vegetation
(SAV) that was looked at.
iv. Astrid: Was there anything more on the remote sensing?
1. Jim H.: The study resulted in very little correlation between satellite
imagery and presence of algal blooms. The report stated that the sound
was optically challenging geographically.
4. Overview of Nutrient Criteria Development Approaches (Connie Brower)
a. See presentation slides here.
b. Recap of the NCDP goal:
i. “To Develop Scientifically Sound, Defensible, and Economically Feasible Nutrient
Criteria that Protect the Designated Uses of North Carolina’s Surface Waters”
1. The “…that Protect the Designated Uses…” part was added for this
presentation to reinforce the purpose of criteria development.
2. Remember that for us, standards are the criteria, the implementation,
antidegradation and the designated uses. It is more holistic than just a
single numeric value.
c. Recap of where the SAC is in this process for HRL
i. SAC has discussed designated uses and impairments for HRL.
ii. SAC has defined causal and response variables associated with designated uses.
iii. SAC has developed a conceptual model to illustrate those relationships.
iv. SAC is currently in the process of identifying potential indicators to form the basis
of criteria recommendations.
v. Once these indicators are selected SAC will need to apply Nutrient Criteria
Development Approaches to develop criteria recommendations.
d. Overview of the approaches:
i. Reference Approach
ii. Stressor-Response Analysis approach
iii. Mechanistic Model approach
iv. Combined/Integrated approach
v. Weight of Evidence approach
vi. Best Professional Judgement

NC Nutrient Criteria Development Plan – Scientific Advisory Council (meeting #10)
10/19/2016
Page 6 of 19
vii. Others?
1. We recognize that the SAC may come up with other methods.
e. Examples of approaches used by other states in developing nutrient criteria.
f. Further information
i. Previous SAC presentations
1. Tiffany Crawford
“Overview of Approaches for Numeric Nutrient Criteria
Development”
2. Lauren Petter
“NNC Methodologies and Criteria in R4 States”
“Possible TN & TP Ranges for High Rock Lake”
3. Bill Hall
“A Critical Examination of Nutrient Criteria Development using
Weight of Evidence/Stressor-Response Methods”
4. Clifton Bell
“Case Studies on Water-Body Specific Numeric Nutrient Criteria”
ii. EPA Criteria Development Guidance
1. https://www.epa.gov/nutrient-policy-data/criteria-development-guidance
iii. EPA Toolkit of Resources
1. https://www.epa.gov/nutrient-policy-data/toolkit-resources-assist-states-
adopting-and-implementing-numeric-nutrient
g. Questions/comments:
i. Jim H.: (comment) There’s a big world of approaches out there that we may take to
develop any of these criteria. I thought now was a good time to recap these ideas
as we will soon need to consider how we narrow down our options.
ii. Bill: (comment) You started out by saying that we need to be able to scientifically
defend any criteria we develop and that we can use these approached to get there.
The reference condition approach does not produce scientifically defensible
criteria. This is evident in some of the work Florida has done.
1. Connie: I’m not sure how useful [this approach] is, but it is an option.
iii. Mike: Does Florida have the longest history of lake nutrient criteria? Have they
changed the criteria over time (adaptive management) and, if so, for what
reasons? Can we learn from their experiences?
1. Lauren: Georgia and Alabama were pretty early on. For Alabama, there is
one lake for which they actually reduced the chlorophyll criteria from what
they originally adopted. Most states have kept their initial criteria for the
most part. Florida has a process by which they can reevaluate criteria
based on new information.
2. Connie: Some states jumped on this directive from EPA without realizing
what they might be getting into. Alabama established a number that was
NC Nutrient Criteria Development Plan – Scientific Advisory Council (meeting #10)
10/19/2016
Page 7 of 19
written to be the standard at the dam so it doesn’t really apply to the
whole lake. That may have been okay at the time it was written, but EPA
would probably want protections for the whole lake now. Also, North
Carolina lakes are quite different from the lakes in these other states so it’s
challenging to make comparisons.
3. Linda: Example of this might be Lake Okeechobee (in Florida). They have
loading limits created in 2001, but they’ve never been met.
4. Connie: I think we’re in a good position in that we actually have some data.
As far as who was first in developing nutrient criteria, NC was the first state
(to the best of our knowledge) to establish a standard for chlorophyll-a (for
good or bad).
5. Alternatives to Pass/Fail Concentration-Based N & P Criteria (Clifton Bell)
a. See presentation slides here.
b. This will focus on whether we should adopt nutrient concentrations (causal) as criteria and,
if so, should they be adopted as a pass/fail number. I’m advocating that they should not be
adopted as pass/fail criteria.
c. Why should we consider alternatives to pass/fail criteria?
i. Two broad alternatives
1. Numeric translators
2. Bioconfirmation
ii. Exceedance of criteria can trigger a cascade of regulatory actions (303(d), TMDLs,
economic impacts, etc…)
d. Would pass/fail criteria help or hurt our ability to make the correct management decisions
to control excess nutrients or would it be preferable to develop criteria that address
response variables?
i. Advantages of pass/fail:
1. Environmentally conservative
2. Early sign of impairments
3. Simplifies permitting in some cases (streams)
ii. Disadvantages of pass/fail:
1. N & P are poor predictors of impairment in some systems
2. Often better managed by loads
3. Increases likelihood of assessment errors (more uncertainty. See slide # 10)
4. Reduces flexibility in implementation (see slide #13)
5. Can show many cases from around the country of high variability and lack
of predictive ability of N & P pass/fail concentrations
6. Concentrations may show effects over the short-term, but for systems that
integrate nutrients over a period of time, loads work better
e. Numeric translators
i. Provide ability to calculate management objectives to get to a certain response.
1. Ex: Set loading limits to attain a desired chlorophyll-a level

NC Nutrient Criteria Development Plan – Scientific Advisory Council (meeting #10)
10/19/2016
Page 8 of 19
2. States can do this according to EPA and these can vary in complexity as is
appropriate for a water body.
3. This has been used for a long time for various parameters. (DO & BOD
models. Slide # 17)
4. NC has been using this approach for a long time in its nutrient
management strategies.
5. EPA has also done this in the Chesapeake Bay. They did not use numeric
nutrient criteria.
6. California has done this with Numeric Nutrient Endpoints (NNE)
7. Florida has stated that TMDLs can be used as numeric nutrient criteria.
ii. Uncertainty in models
1. Models do have uncertainty
2. If we adopt numeric nutrient criteria for HRL, we would still need to the
model to relate sources to response/causal concentrations
3. We also do not use the model for assessment
f. Bioconfirmation
i. From EPA’s Guiding Principles on an Optional Approach for Developing and
Implementing a Numeric Nutrient Criterion that Integrates Causal and Response
Parameters (EPA-820-F-13-039, September 2013)
ii. Integrate causal and response variables into one water quality standard
iii. Gives precedence to response variables for assessment purposes
iv. The guidance document addresses the following elements:
1. Protectiveness
2. Sound scientific rationale
3. Expression of the criterion (I will focus on this)
v. There can be different combinations for how you meet uses (See slides #29 & 30)
vi. Various states have tried this:
1. Virginia (reservoirs) – slide #30
2. Virginia streams – slide #31
3. Ohio trophic index criterion – close to EPA’s guiding principles (See slide
#32)
4. Minnesota Multi-metric Criterion (see slide #33)
vii. If using the bioconfirmation approach, it is important to allow for site-specific
adjustments to default nutrient concentration targets. Otherwise, the benefits this
approach provides for assessment purposes will be lost for permitting and TMDLs.
1. Most states have this ability to make site-specific adjustments in some
form, but don’t have specific procedures for nutrient criteria
Florida has specific guidance for this (see slides #36-37)
g. Final thoughts
i. Translators have been used for a long time in watershed management
ii. Many states going the bioconfirmation route
NC Nutrient Criteria Development Plan – Scientific Advisory Council (meeting #10)
10/19/2016
Page 9 of 19
1. Should have detailed implementation procedures to address assessment
methods, allow for site-specific criteria, and to protect existing water
quality
h. Questions/comments:
i. Linda: Question about load. Since flux is a big part of load and there is evidence
that suggests load is increasing in the mid-west and east coast due to increased
rainfall frequency and intensity, how do you take into account weather pattern
changes that are occurring?
1. Clifton: Some folks are looking at this explicitly. Chesapeake Bay has been
doing model runs to determine future loads (2050). Rainfall is going up as
is temperature and they are suggesting it will cancel out somehow.
Group: More flushing, less residence time.
Linda: I keep thinking about this. We have practice standards (best
management practices?) that don’t address these issues. Do we
have the tool to reduce these loads?
Clifton: It’s a good point. It happens with low flow as well. When
you see climactic shifts like this models have to be reviewed.
ii. Pam: In NC we have a statewide chlorophyll-a standard. N & P seem to be more
site-specific in how particular waters respond to loading. Do you see more
flexibility in assigning a response variable across locations or should that be more
site-specific as well?
1. Clifton: I would think there would be more stabilities in response across
locations. Recreational targets should be similar more or less. Warm water
fish feed the same way. However, something like the algal toxin,
chlorophyll-a relationship might vary. We know systems can be very
different.
6. Assessment Methods and Criteria Implications (Cam McNutt)
a. See presentation slides here.
b. Will discuss assessments for current standards based on data through 2016. We have not
started assessment for any of the new standards, such as the dissolved and hardness-
dependent metals, introduced in the last triennial review. These will begin next year.
c. Will discuss:
i. Water Quality Assessment Methods Review
ii. Summary of water quality assessments by method
iii. Summary of Category 5 assessments – 303(d) list
iv. Public review process and information
d. Water Quality Assessment Methods Review
i. There are ~13,000 water bodies in the state.
ii. We collect data for parameters associated with the water quality standards for
about 30% of them.

NC Nutrient Criteria Development Plan – Scientific Advisory Council (meeting #10)
10/19/2016
Page 10 of 19
iii. This combination of water body and parameter is then assigned one of the
following categories:
Category Assessment Criteria Results
1 Meets assessment criteria
2 Meets assessment criteria
3 No info/inconclusive
4 Exceeds assessment criteria
5 Exceeds assessment criteria – 303(d) list
iv. We don’t use the term “impairment” as we are not doing use assessment. We are
doing water quality standard assessment.
v. Five assessment methods are used:
1. Numeric
2. Biologic
3. Pathogen
4. Shellfish Harvesting
5. Fish Consumption
vi. Standards and associated uses
1. There can be different standards for the same parameter based on the
classification of the water body
Chlorophyll-a is 40 ug/L for Class C and 15 ug/L for Trout waters
2. Some standards apply only to specific classifications
NO2+NO3 = 10 mg/L, but only applies to water supply waters
vii. Numeric assessment methods
1. The following need to be met for a water body to go on the 303(d) list:
N >9
Greater than 10% exceedance of numeric standard
Greater than 90% confidence that numeric standard is exceeded in
at least 10% of samples
2. Example on slide #7
3. Assessments applied independently. Water body can be listed for one
parameter or for multiple parameters.
viii. Standards and assessments methods
1. Standards approved by EPA
2. Assessment methods approved by the NC Environmental Management
Commission for 303(d) purposes
3. EPA ultimately approves the 3030(d) list, but they don’t approve of NC’s
assessment methodology
ix. What’s on 3030(d) list
1. For numeric:
199 numeric standards currently exceeding criteria
NC Nutrient Criteria Development Plan – Scientific Advisory Council (meeting #10)
10/19/2016
Page 11 of 19
Most common parameters include chlorophyll-a, copper, pH, DO,
turbidity
2. For fish & benthic organisms:
Fair, poor or severe biological rating results in category 5 or 303(d)
list assessment
3. For pathogens:
Water quality standard aligns with assessment method
i. N>5 samples within 30-day period
ii. Geometric mean >200 for fecal or >35 for Enterococcus
iii. Greater than 20% samples >400 for fecal only
4. For shellfish:
We have a standard for fecal coliform, but don’t use it. We use
Division of Marine Resources shellfish area classifications instead.
If a water body is not approved for shellfish harvesting it is
category 5 or 303(d) listed.
Question:
i. Bill: Who determines if a water body is approved for
shellfish harvesting?
1. Cam: The Marine Fisheries Shellfish Sanitation
group. Often based on sanitation surveys and fecal
coliform data.
ii. Astrid: When is sampling conducted for the numeric
parameters?
1. Cam: This is mostly data from the Ambient
Monitoring System which samples monthly. For
lakes this isn’t necessarily the case. Small lakes are
done every five years. Larger lakes have more
year-round data.
2. Astrid: Is this stepped up during growing seasons?
3. Cam: I think it depends on the individual lake. Falls
Lake is monthly.
4. Pam: Sampling is not targeted. We may special
studies. It is an ambient schedule.
5. For fish consumption
Based on DHHS fish consumption advisories
Criteria:
i. DHHS consumption advisory
ii. Availability of fish tissue data
Not looking at actual fish tissue data
x. Changes from 2014 assessment

NC Nutrient Criteria Development Plan – Scientific Advisory Council (meeting #10)
10/19/2016
Page 12 of 19
1. See slide #18 and 19
2. Question:
Bill (regarding top bullet of slide #18 “Exceeding Criteria to
Meeting Criteria”): For the “Natural conditions assessment” bullet,
are you saying that if you are exceeding criteria due to natural
conditions it is taken off the list?
Cam: We only do this right now for low pH and low DO conditions
in swamp waters. We look to see if there are any anthropogenic
sources and, if not, we have to demonstrate to EPA that it is a
natural condition. The standard has a narrative statement to
account for swamp waters.
Bill: It’s not that they are meeting the criteria, they are just
exceeding due to a natural condition. That may be an important
consideration for HRL in terms of the turbidity coming into an
artificial lake.
Cam: It would be hard to determine the natural condition there.
Bill: The point is the high flow will scour the solids and increase
turbidity. What part of that is unnatural?
Cam: Right now we’re only considering natural conditions for low
pH and low DO because we feel that we can make the distinction
between natural and anthropogenic in swamp waters. We haven’t
expanded this to other standards yet because we’re not sure to
what extent we can differentiate those causes.
Nathan: Who gets to delineate the assessment units and when
they change is there oversight?
Cam: It’s basically me. There is usually some discussion during
public review periods. The more data we have the more
assessment units we tend to have. Assessment units with a letter
after them have been split. This happens a lot in the shellfish areas
and also in lakes where there are usually more sampling stations.
We don’t spatially average the data.
Bill: I’m intrigued by this. HRL is actually 17 different assessment
pieces? When I looked at the chlorophyll-a data, that’s not the way
that I looked at it. I assumed that you have the main body and the
arms.
Cam: As long as the stations are saying the same things they will
stay in the same assessment unit. Certain areas in the lake will be
different. It gets tricky with spatial averaging because you need to
determine how many station it is appropriate to average together.
Linda: For DO criterion, how do you address summer stratification?

NC Nutrient Criteria Development Plan – Scientific Advisory Council (meeting #10)
10/19/2016
Page 13 of 19
Cam: It’s surface DO and the standard indicates that you don’t
have to evaluate bottom waters so it’s just that top meter.
Michael: If the streams are listed for biological impairment for
benthos diversity is it biased as you can’t look at bigger systems? Is
there a metric for lakes or is it just for the smaller, lower order,
systems?
Cam: It’s wadeable streams. It is biased towards wadeable streams.
Michael: Is there any way to do biological community assessment
for lakes?
Cam: We don’t have one that we use. We do have something that
we use for thermal variances for the power companies, but it is not
an index.
Pam: I have been looking to see how other states are assessing
biological communities in reservoirs. I’m not getting very far with
this, but I think it is something that this group is really going to
have to consider.
7. Water Treatment Impacts from Source Water Organics (Whit Wheeler)
a. See presentation here
b. Overview
i. Currently serve 535,00 people in a service area that includes Raleigh, Garner,
Wakefield and Rolesville. That’s about 53 million gallons per day.
ii. Two water sources: Falls Lake to the north and Lake Wheeler/Lake Benson to the
south.
iii. Falls Lake has the E.M. Johnson Water Treatment Plant with a treatment capacity
of 86 million gallons per day.
iv. Lake Benson/Lake Wheeler (Swift Creek system) has a new plant (2010) that has
capacity of 60 million gallons per day.
v. Water quality is consistent and typical of the Piedmont region.
1. Falls Lake: Turbidity, alkalinity, TOC, Iron, and Manganese are all fairly
stable. (See slide #4)
2. Lake Benson/Lake Wheeler: More a run of the river system. Alkalinity very
low. TOC, Iron, manganese, and color higher than at Falls Lake. (See slide
#5)
c. Impacts source water organics on treatment process
i. Dissolved organic carbon reacts with disinfection products to produce
trihalomethanes and haloacetic acids.
ii. Taste & odor issues. Geosmin & 2-methylisoborneol (MIB) from cyanobacteria
blooms.
iii. Cyanotoxins. New issue. Astrid has been helping us with this. EPA analyzing 9 toxins
as part of the UMCR 4.

NC Nutrient Criteria Development Plan – Scientific Advisory Council (meeting #10)
10/19/2016
Page 14 of 19
iv. Diatoms. Can make it through the treatment process and bind up filters. Requires
more frequent backwashing.
d. Treatment Goals
i. Turbidity < 0.1 NTU
ii. Iron < 0.3 ug/L
iii. Manganese < 0.5 ug/L
iv. TOC removal of 45% based on safe drinking water act. We try to get it < 2.3 mg/L to
optimize treatment system
v. Disinfection byproduct formation = strive to minimize formation of byproducts
vi. Taste & odor = strive to minimize
e. Water Treatment Strategies
i. Anticoagulation
1. Use ferric sulfate to flocculate at a lower pH (5.3-5.5 S.U.)
2. Produces more sludge and must feed caustics to maintain pH
ii. Powdered or Granulated Activated Carbon
1. Commonly used
iii. Ozone
1. Helps with taste & odor
2. Helps to enhance biological filtration process
iv. Biological filtration
1. Helps with removal of organics
2. Using at our newer plant
v. Chloramination/UV
1. Chloramines are used to minimize disinfection byproducts
vi. Distribution water age management
1. System tanks taken out of service routinely to minimize water age
2. This helps to minimize disinfection byproducts
3. System is also routinely flushed
4. Critical part of strategy for dealing with source water organics
vii. Ion exchange
1. Johnson County has this
2. Helps with removal of disinfection byproducts
viii. Aeration
1. New tool to help minimize disinfection byproducts
2. Volatilizes trihalomethanes
3. Wilmington has recently installed this technology
f. Treatment Process
i. E.M. Johnson (See slide #9)
ii. Lake Benson (See slide #10)
1. Newer plant. Different process
2. Only plant in NC that gets disinfection credit for using UV disinfection

NC Nutrient Criteria Development Plan – Scientific Advisory Council (meeting #10)
10/19/2016
Page 15 of 19
3. This has helped to reduce formation of disinfection byproducts
iii. Trihalomethane formation potential (See slide #11)
1. Table shows trihalomethane formation potential throughout the treatment
process
2. Chloroform is our main issue
3. Most reduction occurs during settling process
4. Trihalomethane potential jumps back up post filter mainly due to the
increase in pH
iv. Jar Test Example (See slide #12)
1. Used to determine how much chemical we need to feed
v. TOC Reduction (See slides 13-18)
1. Powdered Activated Carbon
2. Performance at Dempsey E. Benton Plant (Slide #14)
3. Biological filtration by Granulated Activated Carbon (Slide #15)
This is when the filters were new.
vi. Treatment Results
1. TOC removal = 63% at E.M. Johnson, 75% at Dempsey E. Benton
2. Turbidity <0.1 NTU 95% of time
3. Iron = 0.01 mg/L
4. Manganese = 0.01 mg/L
g. Algae
i. Lake Benson level and algae
1. Weather impacts water quality
2. We monitor phycocyanin and chlorophyll-a daily in source waters
3. Increased flow due to rainfall tends to decrease chlorophyll-a
ii. Ferric Sulfate Chemical Cost (See slide #22)
iii. Algal Count Trend at Falls lake
1. Some correlation between low discharge and increased chlorophyll-a
h. Questions/comments:
i. Bill: (Regarding slide #15) The granulized activated carbon was the biofilter?
1. Whit: Yes. We see a large amount of biological growth on the media. The
absorptive capacity decreases over time, but the biological capacity
remains.
2. Bill: Why do you call it a biofilter?
3. Whit: We do not feed chlorine before this process so the GAC has bacterial
growth. We see a lot of biological activity. We see about 50% removal of
Iron & Manganese here. This wasn’t intentionally designed to remove
metals, but it has been a big help when we see spikes.
ii. Bill: Was there a particular cause for that spike in the raw water organic carbon?

NC Nutrient Criteria Development Plan – Scientific Advisory Council (meeting #10)
10/19/2016
Page 16 of 19
1. Whit: This was during the summer months so there is more biological
activity in the lake. Hard to trend that throughout the season, but it’s not
unusual. Can also be due to weather.
iii. Jucilene: Does the Dempsey E. Benton Water Treatment Plant cost more to run?
1. Whit: It costs about 20% more to run and there was a substantial
investment in the construction of this facility.
iv. (?): What is the algae situation in Lake Benson?
1. Whit: Regularly measure chlorophyll-a and phycocyanin. Weather has a big
impact. Chlorophyll-a and phycocyanin decrease as the flow increases.
v. Jucilene: Do you have an idea of what the increase is to deal with algal blooms?
1. Whit: We have not seen major impacts as of yet in Raleigh. The Town of
Cary, however, has spent about a half-million dollars per month recently
due to blooms.
vi. Clifton: What would be considered to be beyond normal treatment in relation to a
bloom? Is the Cary situation an example of what would be beyond normal
treatment?
1. Whit: Yes, it is atypical. They are also expanding their capacity.
2. Clifton: What do we know about the differences in their raw water supply
in terms of chlorophyll-a, etc.?
Whit: I don’t have that information with me, but they tend to see
MIB and Geosmin levels that are orders of magnitude higher than
what we see in our source waters.
vii. Nathan: Have you looked at the relationship between total organic carbon (TOC)
and chlorophyll-a?
1. Whit: It’s very dynamic though it will be related to weather as mentioned
above. Certainly some part of the TOC is from the algae. Looking at total
algal counts is more important than looking at just the chlorophyll-a as
there are many species involved.
2. Kenny: The relationship you are asking about is one of the outcome goals
for the Upper Neuse River Basin Monitoring and Modelling Program. The
only relationship we have found is the increase of TOC due to the
urbanization of watersheds.
3. Linda: In the Mebane reservoir, algal mass has been responsible for high
TOC, but it was a lot of biomass.
viii. Bill: Do you test for cyanotoxins and can existing processes treat for it if it does
occur?
1. Whit: We do spot test for toxins and we have tools to deal with it if it does
occur. Ozone and chlorine are effective treatments. We would also try to
settle out cells to reduce toxin release via cell lysing and then focus on any
remaining toxins in the system.

NC Nutrient Criteria Development Plan – Scientific Advisory Council (meeting #10)
10/19/2016
Page 17 of 19
ix. Connie: In developing criteria we need to look at cost vs. benefit so we might need
some help understanding this at a later time. The Criteria Implementation
Committee (CIC) will look at this.
x. Jucilene: Have you noticed any cost reductions since the initiation of the Falls Lake
Management Plan?
1. Kenny: I think that we can draw a general conclusion that we have seen a
stabilization of TOC and other parameters at the intake on average.
xi. Jim H.: How does the City of Raleigh’s capacity to deal with these issues compare to
smaller facilities throughout the state?
1. Whit: The main differences would be that our primary tool would be the
use of ozone treatment. We also use UV disinfection, chloramines, and
ferric sulfate and also maintain a higher pH.
xii. Jim H.: Would the treatment for algae increase the release of disinfection by-
products downstream?
1. Whit: That’s a hard question. It probably comes back to disinfection.
Chloramines are a milder form a disinfection so that could be an issue.
xiii. Bill: So to summarize the treatment schemes:
1. Ferric Sulfate
Particulate removal. Easier to have lower floculation pH which
helps with TOC removal.
2. Activated carbon
Treats TOC, organics removal, and taste & odor.
3. Ozone
Disinfection, algal toxin removal, taste & odor
4. UV disinfection
Disinfection, less free chlorine by-products
5. Ion exchange
Removes TOC
6. Aeration
Takes care of trihalomethanes
7. Chloramine
Disinfection
8. Sodium Silicate
pH control and manages corrosion of infrastructure
8. SAC Decision-making Procedures (Andy Sachs)
a. Andy: Since we are coming closer to a point in time where you will be asked to make
decisions on final criteria recommendations we need to establish the ground rules for the
SAC’s decision making process. How would you all like to do this? For reference, there are
11 current SAC members. A simple majority would require 6 members to agree.
i. Discussion:

NC Nutrient Criteria Development Plan – Scientific Advisory Council (meeting #10)
10/19/2016
Page 18 of 19
1. Deanna: I have concerns about using a simple majority. If only 6 members
agree it may not be a very strong recommendation. Would a super
majority be better?
2. James B.: How would the voting work. Would it just be those people
present in the room? Would it require every SAC member to vote
regardless of whether they are present?
3. Andy: We can go with the quorum rule everyone votes even if they are
not in the room.
4. James B.: I would be concerned that those people that are not in
attendance may miss the discussion surrounding the vote. They may not
have key pieces of information which might inform their ultimate decision.
5. Deanna: Would you feel better about it if we had a process to brief them
prior to their vote?
6. James B.: Yes.
7. Bill: It might be better to wait to get a full vote from everyone.
8. James B.: That would be my preference.
9. Lauren: Would it be okay to just document results rather than having an
actual vote?
10. Clifton: I’m looking at a document from another group that has some
useful guidelines:
Try to reach a consensus as a general principle
80% super majority ok
Any reasons for disagreement are to be documented.
11. Andy: Do you have thoughts on what you want a majority to be for this
group?
12. Deanna: If we don’t have a super majority we may not be making strong
recommendations. Maybe an 8-person majority or a 70% majority?
13. Bill: So we will make recommendations for criteria, the CIC will look at it,
and then the state will get it. Does the state have to follow the
recommendations?
14. Connie: The goal is the protection of the designated uses. If the CIC
indicates that a recommendation would be difficult to implement it goes
back to the SAC for further discussion. Ultimately the Environmental
Management Commission makes the final decision, but it would be best to
be able to say that the SAC has a strong recommendation.
15. Andy: So do we agree that a 70% majority is good?
ii. Final Decision-making Procedure:
1. Take a preliminary vote to identify areas of disagreement and other
concerns.
2. Strive for unanimity.
3. Strive to resolve any differences.

NC Nutrient Criteria Development Plan – Scientific Advisory Council (meeting #10)
10/19/2016
Page 19 of 19
4. Recommendation requires 70% affirmative supermajority from all
designated SAC members.
5. Absentee SAC members be contacted following a meeting at which a vote
was taken to brief them on the discussion and solicit a position on the
question.
6. Minority recommendations will be recorded along with pros and cons of
any alternatives. Alternatives may be reconsidered should it be determined
that the primary recommendation is not implementable.
iii. DWR staff notes:
1. Marcelo and Hans have both indicated their approval of the SAC decision
rules via email communication with Jim Hawhee.
9. Preliminary Criteria Evaluation Discussion: DO, pH, and Clarity (Andy Sachs)
a. See presentation here
b. Discussion of the indicator ranges that SAC members voted on earlier in this process with a
focus on pH, DO, and clarity.
10. Attachments
Overview of Nutrient Criteria Development Approaches
NCDP_Approaches_
Overview_SAC_10_19_16_draft3.pdf
Alternatives to Pass/Fail Concentration-Based N & P Criteria
SAC Slides - Alts to
Pass-Fail N P Criteria 19 Oct 2016.pdf
Assessment Methods and Criteria Implication
2016_NC_303d_NCD
P.pdf
Water Treatment Impacts from Source Water Organics
TOCtreatment.pdf
Preliminary Criteria Evaluation Discussion: DO, pH, and Clarity
Ranges-DO-pH-clar
ity_SAC20161019.pdf

Selected Indicator Ranges
Scientific Advisory Council January 25, 2017

Drinking Water Treatment Considerations
2
Information from Tom Boyd with the Public Water Supply Section:
"The Town of Denton feeds powdered activated carbon especially during the warm water months for taste and odor control due to algae in the lake. The other problem that the town faces is high turbidity after hard rain events.
The upper Yadkin from Roaring River to Rockford is highly nitrified…Once the Yadkin re-aerates through the shoals at Rockford it seems to be better. All of the plants pulling raw water from the Yadkin during the warm water months have to be alert for algal blooms due to the nutrient levels."
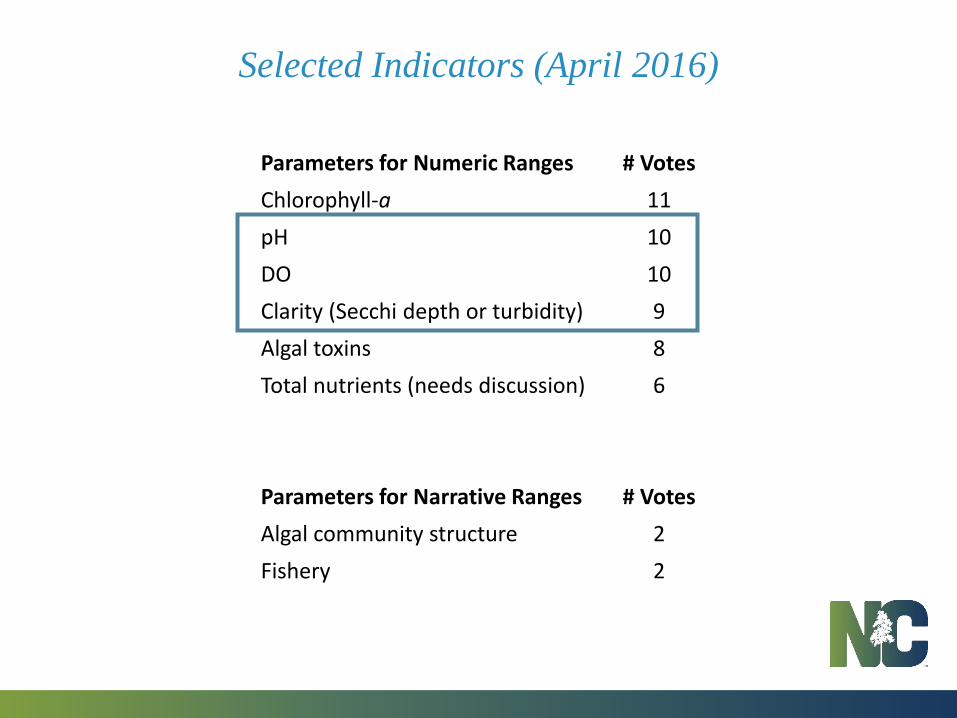
Selected Indicators (April 2016)
Parameters for Numeric Ranges # Votes
Chlorophyll-a 11
pH 10
DO 10
Clarity (Secchi depth or turbidity) 9
Algal toxins 8
Total nutrients (needs discussion) 6
Parameters for Narrative Ranges # Votes
Algal community structure 2
Fishery 2
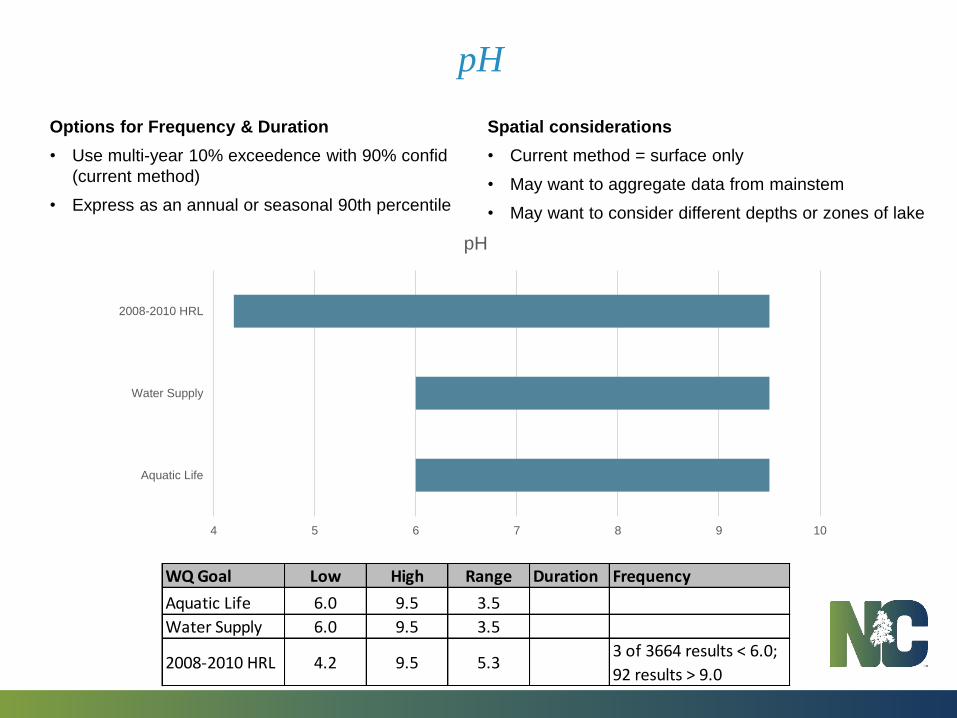
Options for Frequency & Duration
• Use multi-year 10% exceedence with 90% confid
(current method)
• Express as an annual or seasonal 90th percentile
Spatial considerations
• Current method = surface only
• May want to aggregate data from mainstem
• May want to consider different depths or zones of lake
pH
4 5 6 7 8 9 10
Aquatic Life
Water Supply
2008-2010 HRL
pH
WQ Goal Low High Range Duration Frequency
Aquatic Life 6.0 9.5 3.5
Water Supply 6.0 9.5 3.5
2008-2010 HRL 4.2 9.5 5.33 of 3664 results < 6.0;
92 results > 9.0

pH Background
WQ Goal: Aquatic Life Low High Range Duration Frequency Special Considerations
Healthy fish population 6.0 9.5 3.5
Annual or seasonal 90th percentile
1 in 3 years
Assumes salmonids absent.Assumes low levels of pH-dependent toxics (e.g., ammonia).Option: Use all epilimnetic observations, not just surface.Option: Lump all samples from lake mainstem. [C. Bell]
WQ Goal: Water Supply Low High Range Duration Frequency Special Considerations
Suitable drinking water source
6.0 9.5 3.5
Annual or seasonal 90th percentile
1 in 3 years
Based on optimizing treatability and aesthetic issues, not human health.Could be based on spatially-integrated conditions or conditions near intake(s), not just surface samples at individual points. [C. Bell]
No untreatable taste and odor issues
pH is readily adjusted during treatment. [C. Bell]

Dissolved Oxygen
WQ Goal: Aquatic Life Inst Min Average Range Notes
Healthy fish - open waters 1.7 5.5 3.8 upper photic zone: instantaneous; 30-day mean
Healthy fish - deep waters 1 2.3 1.3 below photic zone/thermocline: instant. min to protect benthic forage base; daily avg to protect fish
Healthy fish - current WQS 4 5 1 minimum 4 mg/L; daily average 5 mg/L
2008-2010 HRL - surface waters 0.8 9.1 8.3 Sample depths <0.2 m (n=448); 2 results <5 mg/L
2008-2010 HRL - deep waters 0.04 4.9 4.86 Sample depths >5 m (n=1235); 306 results <1 mg/L
0 1 2 3 4 5 6 7 8 9 10
Healthy fish - open waters
Healthy fish - deep waters
Healthy fish - current WQS
2008-2010 HRL - surface waters
2008-2010 HRL - deep waters
Dissolved Oxygen (mg/L) Minimum Values
• Likely want to consider different depths/zones of lake
• Proposed values from Chesapeake Bay criteria, EPA Gold Book & NCDEQ WQS
• Measured values from NC DWQ & Alcoa sampling, 2008-2010

Dissolved Oxygen Background
WQ Goal: Aquatic LifeInstantan
eous Average Range Duration Special Considerations LiteratureHealthy fish - open waters
1.7 5.5 3.8 (1) Open Waters (2) [M. Lebo] See Lebo spreadsheet 4/2016
Healthy fish - deep waters
1 2.3 1.3 (3) Deep Waters (4) [M. Lebo] See Lebo spreadsheet 4/2016
Healthy fish - current WQS
4 5 1 (5) Current WQS [M. Lebo] NCDEQ WQS code viewed online
Notes: (1) low is instantaneous; high is for 30-day mean; (2) open waters is the upper photic zone; (3) low is instantaneous to protect benthic forage base; high is daily average of deep waters for protection of juvenile and adult fish; (4) deep waters
below photic zone/thermocline; (5) minimum 4 mg/L and daily average of 5 mg/L. [M.Lebo]

Criteria considerations:
• Determine duration & frequency protective of uses
• Piedmont lakes reference condition Secchi depth = 1.66 m
• Current turbidity WQS = 25 NTU ≈ 0.5 m Secchi depth
Water Clarity
Clarity Low High Range
Aquatic Life 0.8 1.3 0.5
Recreation 0.5 2 1.5
0 0.5 1 1.5 2 2.5
Aquatic Life
Recreation
Secchi Depth (m)

Water Clarity Background
Indicator: Clarity (Secchi Depth in m)WQ Goal: Aquatic Life Low High Range Special Considerations Literature
Healthy fish population 0.8 1.3 0.5excellent to good; good to acceptable range
Burden et al. 1985, Younos 2007
Indicator: Clarity (Secchi Depth in m)
Water Quality Goal: Recreation Low High Range Special Considerations Literature
Full-body contact 0.8 2 1.2Smith et al. 1995, Younos2007
Incidental/infrequent contact 0.5 2 1.50.5 hypereutrophic, no recreation
Lee et al. 1995, Younos2007
Aesthetics 1 2 1 >1 clear, no bloomsBarica 1975, Younos2007: Burkart et al. 2008