Embed Size (px)
Citation preview

HIGH PRECISION TARGET CENTER DETERMINATION FROM A POINTCLOUD
Klemen Kregar, Dejan Grigillo and Dusan Kogoj
University of Ljubljana,Faculty of Civil and Geodetic Engineering,
Chair of Geodesy,Jamova cesta 2, 1000 Ljubljana, Slovenia
KEY WORDS: terrestrial laser scanner, planar target, target detection, point cloud, calibration, registration
ABSTRACT:
Many applications of terrestrial laser scanners (TLS) require the determination of a specific point from a point cloud.In this paper procedure of high precision planar target center acquisition from point cloud is presented. The processis based on an image matching algorithm but before we can deal with raster image to fit a target on it, we need toproperly determine the best fitting plane and project points on it. The main emphasis of this paper is in the precisionestimation and propagation through the whole procedure which allows us to obtain precision assessment of final results(target center coordinates). Theoretic precision estimations – obtained through the procedure were rather high so wecompared them with the empiric precision estimations obtained as standard deviations of results of 60 independentlyscanned targets. An χ2-test confirmed that theoretic precisions are overestimated. The problem most probably lies inthe overestimated precisions of the plane parameters due to vast redundancy of points. However, empirical precisionsalso confirmed that the proposed procedure can ensure a submillimeter precision level. The algorithm can automaticallydetect grossly erroneous results to some extent. It can operate when the incidence angles of a laser beam are as highas 80◦, which is desirable property if one is going to use planar targets as tie points in scan registration. The proposedalgorithm will also contribute to improve TLS calibration procedures.
1 INTRODUCTION
Terrestrial laser scanning (TLS) technology generally doesnot allow the measuring of a specific point. However manyTLS tasks require the determination of a specific pointfrom the point cloud. For example, point-based registra-tion (Lichti and Skaloud, 2010a), geo-referencing of pointcloud, and also different methods of scanner calibration(Lichti, 2010), (Reshetyuk, 2010), (Schulz, 2007). Theproblem can be solved by scanning geometric objects orcontrast shapes that can be recognized from point cloud.For different tasks different precisions are desired, in thispaper we focus on the highest achievable precisions – belowthe millimeter.
Most of TLS software have built-in solutions for target cen-ter determination. Each scanner manufacturer prefers itsown type of targets. Most instruments automatically de-tect the target center, but in most cases it does not returnthe precision of coordinates. Often only a flat rate preci-sion estimation is given in the scanner’s technical data.
In the literature some authors report about target centerdetermination. (Chow et al., 2010) apply least square cir-cle fitting in the adjusted plane and in (Chow et al., 2011)intersection of lines that distinct different colors of targetis applied. (Vezocnik, 2011) in doctoral thesis determinestarget center for Leica circular planar target. He is fitting3D surface into intensity image of scanned points projectedonto adjusted plane. The main disadvantage of this ap-proach is instability of targets used. The author reportsthat target centers are moving within the frame of 1 mmwhen target is rotated. (Lichti et al., 2000) used targetsfrom low-cost acrylic reflector with diameter of 10cm. Atdistances up to 600 m they obtained multiple laser returns
from the same target with different intensities of responses.The target center was determined as a mean of responsesweighted by the intensities.
For our research we designed a planar target that shouldallow center determination with TLS as well as total sta-tion (TPS) with submillimeter precision. We propose algo-rithm that is different from others’, explain its advantagesand carry out some test to evaluate its performance.
In the second section we explain how the algorithm works.The plane is fitted by minimizing the distances in the di-rection of the incidence laser beam and not orthogonaldistances as is usual. Points are projected on to the planeusing an oblique projection and then rasterized into in-tensity image. Image matching is applied afterwards andtarget center is transformed back from the plane into 3Dspace. Target center precision is also determined through-out the procedure.
In the third section the two methods for results evaluationare given. The fourth section leads us through the stepsof the algorithm with key intermediate results. Then thefindings of the result evaluation methods are presented.
In the conclusion we try to emphasize the advantages ofthe proposed method along with the main points wherethe procedure has to be investigated more thoroughly andimproved.
2 TARGET CENTER DETERMINATIONALGORITHM
Since the proposed procedure of target center determina-tion is based on image matching, it is essential to pro-vide a reference plane to project the scanned points on it.
ISPRS Annals of the Photogrammetry, Remote Sensing and Spatial Information Sciences, Volume II-5/W2, 2013ISPRS Workshop Laser Scanning 2013, 11 – 13 November 2013, Antalya, Turkey
This contribution has been peer-reviewed. The double-blind peer-review was conducted on the basis of the full paper.doi:10.5194/isprsannals-II-5-W2-139-2013 139

The reference plane is the plane best fitted to the scannedpoints of target. There are often certain amounts of pointsin a point cloud that do not belong to the target plane.It is wise to remove such outliers for they may cause se-vere difficulties in the next step of plane adjustment. TheRANSAC procedure is used for the detection of points be-longing to the plane (Fischler and Bolles, 1981).
2.1 Reference Plane
Normally we would use least square method to find theplane that minimizes the perpendicular distances from thepoints to the plane. In our case we wish to minimize thedistances in the direction of the incidence laser beam. It isknown that single point precision is lower in the directionof measured distance ρ than in perpendicular directionsdependant on measured angles; standard error ellipsoidof single point is elongated in the direction of laser beam(Schulz and Ingensand, 2004). Let the normal vector of theplane be ~n =
[a b c
]and direction of the incidence laser
beam ~v =[t u v
]. Both vectors have to be unit length
||~n|| = 1 and ||~v|| = 1. For each point ~p =[X Y Z
]we need to find the length of the projection of the point tothe line defined by ~v. The length of the projection of ~p tothe ~n must be divided by cos ϕ, where ϕ is angle between~n and ~v. Since they are both unit vectors, cos ϕ = ~n · ~v.The mathematical model for the best fitting plane is
aX + bY + cZ
at + bu + cv− d = 0 (1)
Equation (1) is linearized to the form Ax + B∆ = f .
x is vector of observations (i.e. cloud points coordinates(Xi, Yi, Zi), i = 1, ..., n) and matrix A contains the deriva-tives of eqn. (1) with respect to observations x. The sizeof A equals n × 3n: 1 row and 3 columns for each point.
∆ is vector of unknowns (i.e. plane parameters a, b, c andd) and matrix B contains the derivatives of eqn. (1) withrespect to unknowns ∆. The size of B equals n × 4: 1 rowfor each point and 4 columns for 4 unknowns.
The solution is obtained through the Gauss-Markov model
∆ =(
BT(AAT)−1 B
)−1 (BT(AAT)−1 f)
(2)
Stochastic properties or precisions of plane parameters areobtained through:
Σ∆∆ = σ20
(BT(AAT)−1 B
)−1(3)
More detailed descriptions of adjustment can be found in(Grigillo and Stopar, 2003) or (Kuang, 1996). The resultsof this step are four parameters of the best fitting planealong with their covariance matrix.
2.2 Projection of points on to the plane
For our purpose we wish to carry out an oblique projectionof points to the plane in the direction of the incidence laserbeam. The reason is again significantly lower precision ofmeasured distances ρ relatively to angles θ and α. Eachpoint has to be translated to the plane in the direction ofthe incidence laser beam. The length of the translationis equal to the shortest distance between point and plane
~p · ~n divided by cos ϕ = ~p · ~v. The vector of translation foreach point is
~t = ~v~p · ~n
~n · ~v(4)
Point ~p projected to the plane becomes ~p′ = ~p + ~t. Theresult of this step are points lying in the plane, but theystill have all three coordinates.
2.3 Rasterization of planar points
To obtain a raster image which will serve for image match-ing, the points have to be transformed into a 2D coordinatesystem. We need to define the two basis vectors spanningour plane. They should both be perpendicular to planenormal vector ~n and one unit long. We can obtain themusing the Gramm-Schmidt algorithm. Randomly chosenvector ~r is decomposed in a way that one component isperpendicular to ~n and then normalized. The procedureis for practical purposes carried out as
~e1 = ~n × ~r
|~n × ~r|~e2 = ~n × ~e1
|~n × ~e1|(5)
Since the covariance matrix of components of ~n is knownand ~r is randomly chosen, we are able to obtain covariancematrices Σe1 and Σe2 of vectors ~e1 and ~e2 componentsthrough the error propagation law. Points from a planein 3D are transformed into a plane spanned by vectors ~e1and ~e2 through the equation[
x y]
=[X Y Z
] [e1
T e2T]
(6)
Points in the plane are than rasterized into grid of pointintensities. Many modern computational tools such asMatlab R© or Mathematica R© have such functions built-in.It is important to set the grid resolution according to thescanning resolution. Pixel values are interpolated frompoint’s intensities. It is not very important which methodis used for interpolation. In Matlab R© we can choose be-tween linear, cubic, natural and the nearest neighbour so-lutions, but in our research the selected method did notaffect final results.
2.4 Image matching
Image matching is well established procedure in the fieldof image processing and digital photogrammetry. In ourprocedure we are matching two images, the raster imageof the target and the template image. Template was gen-erated manually in order to describe actual targets. Pixelvalues in the template are zeros and ones describing blackand white intensities respectively. The procedure consistsof two steps. In the first step the correlation coefficientsbetween template and target image are calculated for eachpossible position of the template in the target image. Theapproximate (pixel) position of the target center (ξ, η) isdetermined by the greatest value of the correlation coeffi-cient. Procedure is in details described in (Kraus, 2000).In the second step we obtain subpixel position of targetcenter through least squares adjustment (Hohle, 1997).
The final results of image matching are plane coordinatesof target center (xc, yc) along with their covariance matrixΣxy.
ISPRS Annals of the Photogrammetry, Remote Sensing and Spatial Information Sciences, Volume II-5/W2, 2013ISPRS Workshop Laser Scanning 2013, 11 – 13 November 2013, Antalya, Turkey
This contribution has been peer-reviewed. The double-blind peer-review was conducted on the basis of the full paper.doi:10.5194/isprsannals-II-5-W2-139-2013 140

2.5 Transformation of the target center from theplane back to space
The obtained coordinates of the target center in the pro-jection plane has to be transformed back to 3D space ofthe original point cloud. The transformation is the reverseof that in equation (6)[
X Y Z]
=[x y] [
e1 e2]T (7)
The covariances of the obtained point depend on the co-variance matrices of the input parameters.Through the er-ror propagation law precisions of the target center are de-rived as
ΣXY Z = J
[Σxy 0 00 Σe1 00 0 Σe2
]JT (8)
where J is Jacobian of the equations (7)
J =[e1
T e2T xI3×3 yI3×3
](9)
Projection from the plane back to the point cloud spacecan be enhanced by adding z = 0 coordinate to the planecoordinates (x, y) and expanding the projection matrix[e1 e2
]T with the plane normal vector n. The covari-ance matrix of the plane from section 2.1 are added to thecovariance matrix of the input parameters from equation(8). The variances of the plane parameters a, b and c referto the normal n and the variance of the parameter d refersto the “plane” coordinate z = 0.
3 EVALUATION OF RESULTS
When the target cannot be scanned entirely due to ob-stacles or data artefacts (Lichti and Skaloud, 2010b) itis impossible to fit the proper plane into a point cloud,causing the results of target determination algorithm tobe erroneous. The results of the multiple target centerdetermination will be visually classified as correct or in-correct. Furthermore, the correctness of the result will bepresented with respect to the incidence angle and maxi-mal correlation from image matching. We would like tocheck if correctness can be predicted regarding these twoparameters.
Precisions obtained through the proposed procedures turnedout to be rather high. Precisions obtained from imagematching are always better than the size of a pixel (inour case a millimeter). Imprecisions of the vector base(e1, e2, n, ) does not reduce them much. Simple test wasset up to validate/justify the achieved precisions.
Five targets were scanned 60 times independently from thesame scanner station at a distance of 5 m and another twotargets at a distance of 45 m. The targets were facingdifferent directions so that each target had a different in-cidence angle of the laser beam: 2◦, 15◦, 35◦, 50◦ and 85◦
(see Figure 1) for 5 m distance and 10◦ and 65◦ for 45 mdistance.
All scans were processed and each target center was de-termined 60 times, along with its precision, yielding sets(Xij , Yij , Zij , σXij
, σYij, σZij
); where i indicates one of thetargets i = 1, ..., 7 and j indicates the iteration j = 1, ..., m =
Figure 1: Targets setup
60. For each of the five targets the mean precision was ob-tained as
σXi=
√∑m
j=1 σ2Xij
m − 1 (10)
On the other hand, the standard deviation of the centercoordinates was obtained as
σXi=
√∑m
j=1
(Xij − Xi
)2m − 1 (11)
Precisions of coordinates Y and Z are also calculated thro-ugh equations (10) and (11).
Statistical testing is carried out to check if theoretical pre-cisions obtained through the process are adequate to em-pirical precisions i.e. deviations of target centers. An χ2-test is used to check the consistence of variances σ and σ.Under the assumption of a normal distribution of errors,the test statistic
H = νσ2
σ2
is distributed through χ2 distribution with ν = m − 1degrees of freedom. The hypotheses are
H0 : σ = σ
H1 : σ 6= σ
The null hypothesis cannot be rejected when the value oftest statistic H lies in the interval [χ2
α/2,ν , χ21−α/2,ν ], where
1 − α is confidence level.
In the next section we are first going to represent the re-sults of proposed algorithm and then the findings of eval-uation methods results.
4 RESULTS AND DISCUSSION
4.1 Results of proposed algorithm
The entire procedure of target center acquisition is repre-sented on the example of particular target “T203”. Theresult of the first step – oblique plane adjustment is pre-sented in Figure 2.
The precisions of the vectors in Figure 2 are in Table 1.All values are in millimeters
ISPRS Annals of the Photogrammetry, Remote Sensing and Spatial Information Sciences, Volume II-5/W2, 2013ISPRS Workshop Laser Scanning 2013, 11 – 13 November 2013, Antalya, Turkey
This contribution has been peer-reviewed. The double-blind peer-review was conducted on the basis of the full paper.doi:10.5194/isprsannals-II-5-W2-139-2013 141
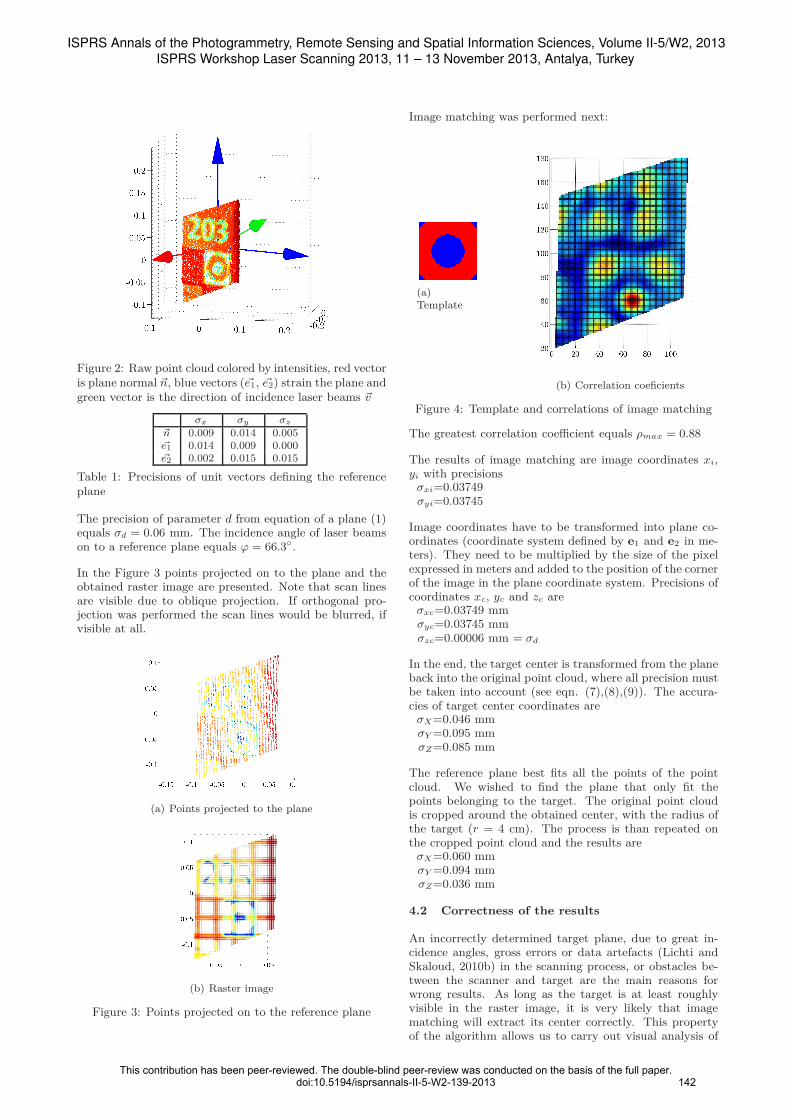
Figure 2: Raw point cloud colored by intensities, red vectoris plane normal ~n, blue vectors (~e1, ~e2) strain the plane andgreen vector is the direction of incidence laser beams ~v
σx σy σz
~n 0.009 0.014 0.005~e1 0.014 0.009 0.000~e2 0.002 0.015 0.015
Table 1: Precisions of unit vectors defining the referenceplane
The precision of parameter d from equation of a plane (1)equals σd = 0.06 mm. The incidence angle of laser beamson to a reference plane equals ϕ = 66.3◦.
In the Figure 3 points projected on to the plane and theobtained raster image are presented. Note that scan linesare visible due to oblique projection. If orthogonal pro-jection was performed the scan lines would be blurred, ifvisible at all.
(a) Points projected to the plane
(b) Raster image
Figure 3: Points projected on to the reference plane
Image matching was performed next:
(a)Template
(b) Correlation coeficients
Figure 4: Template and correlations of image matching
The greatest correlation coefficient equals ρmax = 0.88
The results of image matching are image coordinates xi,yi with precisions
σxi=0.03749σyi=0.03745
Image coordinates have to be transformed into plane co-ordinates (coordinate system defined by e1 and e2 in me-ters). They need to be multiplied by the size of the pixelexpressed in meters and added to the position of the cornerof the image in the plane coordinate system. Precisions ofcoordinates xc, yc and zc are
σxc=0.03749 mmσyc=0.03745 mmσzc=0.00006 mm = σd
In the end, the target center is transformed from the planeback into the original point cloud, where all precision mustbe taken into account (see eqn. (7),(8),(9)). The accura-cies of target center coordinates are
σX=0.046 mmσY =0.095 mmσZ=0.085 mm
The reference plane best fits all the points of the pointcloud. We wished to find the plane that only fit thepoints belonging to the target. The original point cloudis cropped around the obtained center, with the radius ofthe target (r = 4 cm). The process is than repeated onthe cropped point cloud and the results are
σX=0.060 mmσY =0.094 mmσZ=0.036 mm
4.2 Correctness of the results
An incorrectly determined target plane, due to great in-cidence angles, gross errors or data artefacts (Lichti andSkaloud, 2010b) in the scanning process, or obstacles be-tween the scanner and target are the main reasons forwrong results. As long as the target is at least roughlyvisible in the raster image, it is very likely that imagematching will extract its center correctly. This propertyof the algorithm allows us to carry out visual analysis of
ISPRS Annals of the Photogrammetry, Remote Sensing and Spatial Information Sciences, Volume II-5/W2, 2013ISPRS Workshop Laser Scanning 2013, 11 – 13 November 2013, Antalya, Turkey
This contribution has been peer-reviewed. The double-blind peer-review was conducted on the basis of the full paper.doi:10.5194/isprsannals-II-5-W2-139-2013 142

correctness of our method. It would be best if the algo-rithm was able to automatically detect erroneous results.The decision may be based on the values of incidence angleand maximal correlation between the raster image and thetemplate.
The 65 targets distributed over the walls and ceiling of aroom were scanned from four scanner stations with RieglVZ-400 and Leica C10 TLS. Some technical characteristicof scanners are given in Table 2.
Riegl – VZ400 Leica C10Single Point Precision
σposition = 6 mmσdistance = 5 mm σdistance = 4 mm
angle resolution 1.8′′ σangle = 12′′
Laser Beam Divergence3.5 mm/10 m ∼ 72′′ 7 mm (at 1 – 50 m)
Angular Step8.5′′ <1 mm/full range ∼ 4′′
Table 2: Technical specification of used scanners
The results of the correctness analysis are shown in theFigure 5. Brown and blue dots represent correctly andincorrectly determined target center, respectively. Greendots represent special cases where higher reflectances weremeasured on the black surface. In such cases an inversetemplate (switched zeros and ones) achieves correct result.
When scanning with Riegl we decided not to scan targetsat incidence angles greater than 80◦, while with Leica wescanned all targets. The general conclusion based on Fig-ure 5 can be: when the incidence angle is lower than 80◦
and the maximal correlation in image matching is greaterthan 0.6 the target should be determined correctly. How-ever, even some targets with lower correlation may be de-termined corretly but not for incidence angles lower than10◦ or greater than 80◦. We suggest that targets with cor-relation between 0.4 and 0.6 are verified manually. Whenthe correlation is lower than 0.6 and the incidence anglelower than 5◦, one should repeat image matching with aninverse template (switched ones and zeros).
4.3 Results of statistical testing
The comparison of variances (standard deviations) describedin Section 3 returned the results shown in Table 3. All val-ues of standard deviations are in millimeters.
ϕ[◦] d[m] σx σy σz σx σy σz
T1 2 4.2 0.20 0.32 0.07 0.04 0.03 0.04T2 15 4.2 0.22 0.39 0.13 0.03 0.04 0.03T3 35 4.2 0.37 0.52 0.33 0.11 0.14 0.17T4 50 4.3 0.25 0.39 0.16 0.04 0.05 0.04T5 80 4.3 0.54 2.52 1.66 1.08 0.18 0.27T6 10 45.8 0.10 0.18 0.10 0.02 0.02 0.02T7 65 45.9 0.41 0.37 0.22 0.06 0.04 0.03
Table 3: Empirical and theoretical standard deviations
For ν = 59 degrees of freedom and confidence level of 99%, the confidence interval is [34.77, 90.71]. The obtainedtest statistic for all coordinate components of all targetsare in Table 4.
Red values mean that theoretical precision (estimated thro-ugh the procedure) is statistically significantly overesti-mated (values are to low). Blue values mean that it is
(a) Riegl - VZ400
(b) Leica C10
Figure 5: Correctness of results
statistically significantly underestimated. The third op-tion would mean (if it appeared) that it is not possible toclaim that theoretical precision is different from empirical.All three statements are stated with the confidence levelof 99 %.
The results of statistical testing suggest that the processof precision estimation produces too optimistic results. Ifwe check the orientation of coordinate system axes we findthat the main reason is a too optimistically determinedvalue of parameter d of the projection plane, which corre-sponds to the dispersion of points around the plane. Thevast number of points forces the precision of their mean tobe unreasonably high.
However, despite of the negative results of statistical test-ing we must not overlook the actual empirical precisionsof the results. The majority of estimated precisions stay
target Hx Hy Hz
T1 2.30 0.51 20.19T2 0.92 0.50 2.78T3 5.64 4.12 16.58T4 1.75 0.95 3.02T5 234.16 0.31 1.56T6 1.33 0.59 2.43T7 1.10 0.76 1.05
Table 4: values of H test statistic
ISPRS Annals of the Photogrammetry, Remote Sensing and Spatial Information Sciences, Volume II-5/W2, 2013ISPRS Workshop Laser Scanning 2013, 11 – 13 November 2013, Antalya, Turkey
This contribution has been peer-reviewed. The double-blind peer-review was conducted on the basis of the full paper.doi:10.5194/isprsannals-II-5-W2-139-2013 143

significantly below half millimeter which seems to be anencouraging result. The target “T5” must be excludedfrom the former state, confirming the findings of previousexperiment that the results are incorrect at incidence an-gles greater than 80◦. Detailed investigation reveals thatin most cases the dispersion of measured ranges ρ was toohigh to allow proper plane adjustment.
5 CONCLUSIONS AND FUTURE WORK
The majority of today’s TLS software has integrated algo-rithms for planar target center determination. The draw-back of such programs is an unknown algorithm and onlya flat rate estimation of center precision.
The proposed algorithm allows us to determine the centerof a planar target with precisions significantly higher thanthe scanning resolution.
Different types and sizes of targets can be processed, andonly the template image has to be changed. An importantadvantage is that targets can be homemade, printed onnormal paper.
The fact that target centers can be determined properlyeven when scanned under an incidence angle of up to 80◦,allows us to use planar targets for tasks where sphericaltargets are usually used.
In this paper we present the details of a proposed algo-rithm with emphasis on the precision estimation of everystep. In the practical example the results of every step arepresented numerically and graphically. At the end of theprocess we obtain target center coordinates along with itsprecisions. At first glance precisions seem to be severelyoverestimated. Further investigation with statistical test-ing confirmed that theoretical precisions are indeed to highbut empirical precisions were still about half millimeter.
Another test revealed that it is possible to automatize theprocedure for the detection of probably incorrect results.
With further investigations we would like to improve theerror propagation procedure in a way that theoretical pre-cision will get in accordance with empirical ones. Moretests with different sizes of targets, different scanning res-olutions, and at different ranges have to be carried out toconfirm the applicability of the algorithm.
When scanning highly contrasting shapes it is common toobtain different ranges on dark and light surface. It mayalso be the property of material the target is made of. Thetarget has to be scanned at a known distance from thescanner to find which color of the surface ensures accuratedistance measurements. When it is known, the plane canbe adjusted only through the points belonging to the rightcolor.
In this paper we focused mainly on precisions while accu-racies were set aside. Targets can be designed in a wayto allow the centers to be measured with theodolite. Thisway we can assure correct target center positions and com-pare it to centers acquired by TLS. A test requires a lotof caution not to attach scanners’ systematic errors to thetarget acquisition algorithm.
In conclusion we would like to point out the most impor-tant emphasis of this paper. Oblique plane adjustment and
oblique projection of points on to the plane are importantto ensure accurate results. The proposed algorithm eval-uates the precision of result which is empirically provenwithin the range of half millimeter. Target centers can beproperly determined even if scanned at an incidence angleof up to 80◦.
ACKNOWLEDGEMENTS
The authors would like to thank the DFG consulting d.o.o.and Piniped d.o.o. for rental of laser scanners.
REFERENCES
Chow, J. C. K., Teskey, W. F. and Lovse, J. W. B., 2011. In-situ Self-calibration of Terrestrial Laser Scanners and Deforma-tion Analysis Using Both Signalized Targets and Intersection ofPlanes for Indoor Applications. In: 14th FIG Symposium onDeformation Measurements and Analysis, 5th IAG Symposiumon Geodesy for Geotechnical and Structural Engineering, and2nd International Workshop on Spatial Information Technolo-gies for Monitoring the Deformation of Large-Scale Man-MadeLinear Features, Hong Kong, China, p. 15.Chow, J., Ebeling, A. and Bill, T., 2010. Low cost Artificial Pla-nar Target Measurement Techniques for TLS. In: FIG Congress2010 Facing the Challenges - Building the Capacity, Sydney,Australia, p. 13.Fischler, M. A. and Bolles, R. C., 1981. Paradigm for Modelmodel fitting with applications to image analysis and automatedcartography. Graphics and Image Processing 24(6), pp. 381–395.Grigillo, D. and Stopar, B., 2003. Methods of gross error detec-tion in geodetic observations. Geodetski Vestnik 47(4), pp. 387–403. (in Slovene).Hohle, J., 1997. The Automatic Measurement of Targets. Pho-togrammetrie Fernerkundung Geoinformation (1), pp. 13–21.Kraus, K., 2000. Photogrammetry. 2nd englis edn, Walter DeGruyter.Kuang, S., 1996. Geodetic Network Analysis and Optimal de-sign. Ann Arbor Press, Inc., Chelsea, Michigan.Lichti, D. D., 2010. A review of geometric models and self-calibration methods for terrestrial laser scanners. Boletim DeCiencias Geodesicas 16, pp. 3–19.Lichti, D. D. and Skaloud, J., 2010a. Airborne and terrestriallaser scanning. Whittles Publishing; CRC Press, chapter 3.3.1.1Target-based regstration, pp. XVII, 318.Lichti, D. D. and Skaloud, J., 2010b. Airborne and terrestriallaser scanning. Whittles Publishing; CRC Press, chapter 3.2.1.4Data artefacts, pp. XVII, 318.Lichti, D. D., Stewart, M. P., Tsakiri, M. and Snow, A. J.,2000. Calibration and testing of a terrestrial laser scanner. In-ternational Archives of Photogrammetry and Remote SensingXXXIII(Part B5), pp. 485–492.Reshetyuk, Y., 2010. A unified approach to self-calibration ofterrestrial laser scanners. ISPRS Journal of Photogrammetryand Remote Sensing 65(5), pp. 445–456.Schulz, T., 2007. Calibration of a Terrestrial Laser Scanner forEngineering Geodesy. PhD thesis, ETH Zurich, Zurich.Schulz, T. and Ingensand, H., 2004. Influencing variables, preci-sion and accuracy of terrestrial laser scanners. In: INGEO 2004and FIG Regional Central and Eastern European Conference onEngineering Surveying, Bratislava, Slovakia, p. 9.Vezocnik, R., 2011. Analysis of terrestrial laser scanning tech-nology for structural deformation monitoring. PhD thesis, Uni-versity of Ljubljana.
ISPRS Annals of the Photogrammetry, Remote Sensing and Spatial Information Sciences, Volume II-5/W2, 2013ISPRS Workshop Laser Scanning 2013, 11 – 13 November 2013, Antalya, Turkey
This contribution has been peer-reviewed. The double-blind peer-review was conducted on the basis of the full paper.doi:10.5194/isprsannals-II-5-W2-139-2013 144