Embed Size (px)
Citation preview
HIGH PERFORMANCE CONCRETE IN WASHINGTON STATE
SR18/SR516 OVERCROSSING:
FINAL REPORT ON GIRDER MONITORING
Paul Barr Marc Eberhard John Stanton
Bijan Khaleghi J.C. Hsieh
Washington State Transportation Center (TRAC)
University of Washington, JD-10 The University District Building 1107 N.E. 45th Street, Suite 535 Seattle, Washington 98105-4631
Washington State Department of Transportation
Technical Monitors Tom Roper and Myint Lwin
Bridges and Structures Engineer
Prepared for
Washington State Transportation Commission Department of Transportation
and in cooperation with U.S. Department of Transportation
Federal Highway Administration
December 2000

Table of Contents SUMMARY.........................................................................................................................1
CHAPTER 1: INTRODUCTION ........................................................................................5
1.1: CONTEXT..............................................................................................................5
1.2: CHALLENGES TO THE IMPLEMENTATION OF HPC....................................6
1.3: SR516 OVERCROSSING......................................................................................7
1.4: RESEARCH OBJECTIVES ...................................................................................8
1.5: SCOPE AND ORGANIZATION OF REPORT.....................................................8
CHAPTER 2: METHODS FOR ESTIMATING PRESTRESS LOSSES.........................10
2.1: INTRODUCTION ................................................................................................10
2.2: AASHTO LUMP SUM METHOD ......................................................................11
2.3: AASHTO REFINED METHOD ..........................................................................13
2.4: AASHTO TIME STEP METHOD .......................................................................17
2.5: MODIFIED RATE OF CREEP METHOD..........................................................17
2.6: PCI GENERAL METHOD ..................................................................................20
2.7: DECK CASTING .................................................................................................27
2.8: DIFFERENTIAL SHRINKAGE ..........................................................................30
2.8.1: STATICALLY-DETERMINATE GIRDERS.............................................31
2.8.2: SECONDARY STRESSES .........................................................................34
2.8.3: CHANGES IN PRESTRESS.......................................................................35
2.9: REDUCED RELAXATION COEFFICIENT ......................................................35
CHAPTER 3: DESIGN AND CONSTRUCTION OF HPC GIRDERS FOR THE
SR18/SR516 BRIDGE.................................................................................................37
ii
3.1: TEST GIRDER.....................................................................................................37
3.2: BRIDGE GIRDERS .............................................................................................41
CHAPTER 4: INSTRUMENTATION PROGRAM .........................................................47
4.1: TEST GIRDER.....................................................................................................47
4.1.1: CONCRETE STRAINS AND TEMPERATURES.....................................48
4.1.2: STRAND SLIPBACK .................................................................................50
4.1.3: GIRDER CAMBER.....................................................................................51
4.1.4: CONCRETE STRESS .................................................................................52
4.1.5: STRESS STRESS........................................................................................53
4.2: BRIDGE GIRDERS .............................................................................................53
4.2.1: CONCRETE STRAINS AND TEMPERATURES.....................................53
4.2.2: STRAND SLIPBACK .................................................................................56
4.2.3: GIRDER CAMBER.....................................................................................57
4.2.4: STRAND STRESS ......................................................................................59
4.3: GAGE PREPARATION.......................................................................................59
4.4: MONITORING PROGRAM................................................................................60
4.4.1: CONCRETE STRAINS AND TEMPERATURES.....................................60
4.4.2: STRAND SLIPBACK .................................................................................61
4.4.3: GIRDER CAMBER.....................................................................................62
4.4.4: STRAND STRESS ......................................................................................62
CHAPTER 5: OBSERVED BEHAVIOR..........................................................................63
5.1: CASTING THROUGH DESTRESSING.............................................................63
5.1.1: TEMPERATURE ........................................................................................64
5.1.2: CONCRETE MATURITY ..........................................................................67
iii
5.1.3: STRAINS.....................................................................................................68
5.1.4: CAMBER.....................................................................................................73
5.1.5: TRANSFER LENGTH ................................................................................74
5.2: SERVICE CONDITIONS ....................................................................................78
5.2.1: TEMPERATURE ........................................................................................78
5.2.2: STRAINS.....................................................................................................80
5.2.3: CAMBER.....................................................................................................85
CHAPTER 6: OBSERVED PRESTRESS LOSSES .........................................................91
6.1: ELASTIC SHORTENING AND EARLY CREEP ..............................................91
6.2: GRIDER CREEP AND SHRINKAGE ................................................................94
6.3: CASTING OF BRIDGE DECK ...........................................................................98
6.4: RELAXATION...................................................................................................100
6.5: SUMMARY OF OBSERVED PRESTRESS LOSSES......................................102
CHAPTER 7: COMPARISON WITH OBSERVED PRESTRESS LOSSES.................105
7.1: ELASTIC SHORTENING .................................................................................105
7.2: SHRINKAGE .....................................................................................................111
7.3: CREEP................................................................................................................113
7.4: CREEP AND SHRINKAGE ..............................................................................115
7.4.1: TOTAL CREEP AND SHRINKAGE LOSSES........................................115
7.4.2: DIFFERENTIAL SHRINKAGE ...............................................................117
7.5: RELAXATION...................................................................................................119
7.6: DECK CASTING ...............................................................................................122
7.7: TOTAL PRESTRESS LOSSES .........................................................................124
7.8: ESTIMATED EFFECT OF USING HPC ON PRESTRESS LOSSES..............129
iv
7.8.1: ESTIMATED ELASTIC SHORTENING LOSSES FOR HPC................129
7.8.1: ESIMATED CREEP LOSSES FOR HPC.................................................129
CHAPTER 8: COMPARISON OF CALCULATED AND OBSERVED CAMBERS...134
8.1: PCI METHOD (1992) ........................................................................................134
8.2: CALCULATED AND MEASURED CAMBERS .............................................135
8.3: CAMBER DUE TO DIFFERENTIAL SHRINKAGE.......................................138
CHAPTER 9: CONCLUSIONS ......................................................................................142
9.1: FABRICATION..................................................................................................142
9.2: OBSERVED PRESTRESS LOSSES .................................................................143
9.3: COMPARISON WITH CALCULATED PRESTRESS LOSSES .....................145
9.4: CAMBER............................................................................................................147
9.5: RESEARCH RECOMMENDATIONS..............................................................148
REFERENCES ................................................................................................................149
v
List of figures
Number Page
Figure 2.1: Ultimate Prestress Change Due to Shrinkage ................................................23
Figure 2.2: Two-Degree-of-Freedom Model of Brdige....................................................29
Figure 2.3: Differential Shrinkage Stress .........................................................................31
Figure 3.1: W74MG Girder Dimensions ..........................................................................37
Figure 3.2: Elevation of Test Girder .................................................................................38
Figure 3.3: Test Girder Mild Reinforcing Steel................................................................39
Figure 3.4: Bridge Layout.................................................................................................41
Figure 3.5: Bridge Cross-Section at Pier 2 (looking north)..............................................42
Figure 3.6: Elevation of Bridge Girders ...........................................................................43
Figure 4.1: Strand Pattern in W74MG Test Girder ..........................................................47
Figure 4.2: Vibrating Wire Strain Gage Nominal Locations............................................49
Figure 4.3: Welded Grid Rebar Cage ...............................................................................50
Figure 4.4: Potentiometer and Wooden Block..................................................................51
Figure 4.5: Test Girder Stretched Wire System................................................................52
Figure 4.6: Locations of Vibrating Wire Stress Gages.....................................................53
Figure 4.7: Instrumentation Sites in HPC Bridges ...........................................................54
Figure 4.8: Cross Section of Typical Instrumentation Site...............................................55
Figure 4.9: Strand Pattern for Spans 1 and 3 ....................................................................57
Figure 4.10: Guides for Bridge Stretched-Wire System...................................................58
Figure 4.10: Guides for Bridge Stretched-Wire System...................................................58
Figure 5.1: Casting Temperatures at Midspan of Girder 2B ............................................65
Figure 5.3: Midspan Temperatures in Instrumented Girders: Gage BL...........................66
Figure 5.4: Casting Strains at Midspan of Girder 2B .......................................................68
Figure 5.5: Midspan Strains in Most Highly Stressed Girders: Gage BL ........................70
Figure 5.6: BL Gages Strain Comparison of Span 1 Girders ...........................................71
Figure 5.7: Cross-Sectional Strains in Girder 2B after Destressing .................................72
vi
Figure 5.8: Camber During Destressing in Girder 2B ......................................................74
Figure 5.9: End Slip Measurements of Girder 2B ............................................................75
Figure 5.10: Calculated Transfer Lengths During Destressing of Girder 2B...................76
Figure 5.11: Summary of Calculated Transfer Lengths....................................................77
Figure 5.12: Service Temperatures at Midspan of Girder 2B...........................................78
Figure 5.13: Typical Temperature Variation at Midspan in Girder 2B............................80
Figure 5.14: Service Strains at Midspan of Girder 2B .....................................................81
Figure 5.15: Cross-Sectional Strains at Midspan of Girder 2B ........................................83
Figure 5.16: Deck Strains for Girder 2B...........................................................................84
Figure 5.17: Camber Histories for Span 2 Girders (Surveyor's Level) ............................85
Figure 5.18: Camber Histories for Span 1 Instrumented Girders (Surveyor's Level) ......87
Figure 5.19: Camber versus Time on June 5 (Suveyor's Level) .......................................88
Figure 5.20: Daily Camber Readings for Span 2 (Stretched-Wire System) .....................89
Figure 5.21: Daily Camber Readings for Span 1 (Stretched-Wire System) .....................90
Figure 6.1: Strain History for Prestressing Centroid During Destressing at Midspan
of Girder 2B .....................................................................................................92
Figure 6.2: Change in Strain at Tendon Centroid Due to Creep and Shrinkage...............95
Figure 6.3: Prestress Losses Due to Creep and Shrinkage ...............................................97
Figure 6.4: Girder 2B Deck Casting Strains .....................................................................99
Figure 6.5: Stress Loss Due to Relaxation.....................................................................102
Figure 6.6: Summary of Observed Prestress Losses.......................................................103
Figure 7.1: Observed and Computed Elastic Shortening Losses for Span 2 Girders .....107
Figure 7.2: Observed and Predicted Elastic Shortening Losses for Span 1 Girders.......108
Figure 7.3: AASHTO and PCI Shrinkage Loss Predictions ...........................................112
Figure 7.4: Computed Prestress Losses Due to Creep in Span 2 Girders.......................113
Figure 7.5: Computed Prestress Losses Due to Creep in Span 1 Girders.......................114
Figure 7.6: Observed and Predicted Creep and Shrinkage Losses for Span 2................115
Figure 7.7: Observed and Predicted Creep and Shrinkage Losses for Span 1................116
Figure 7.8: Change in Strand Stress After Deck Casting ...............................................118
vii
Figure 7.9: Observed and Predicted Relaxation Losses in Span 1 .................................120
Figure 7.10: Observed and predicted Relaxation Losses in Span 2................................120
Figure 7.11: Comparison of Average Changes in Stress During Deck Casting .............123
Figure 7.12: Total Prestress Losses for Span 2 Girders..................................................125
Figure 7.13: Total Prestress Losses for Span 1 Girders..................................................126
Figure 7.14: Best Fit Power Curve for Creep Coefficient vs. Compressive Strength ....131
Figure 7.15: Normalized Creep Loss versus Concrete Strength.....................................132
Figure 8.1: Comparison of Calculated and Measured Cambers for Span 2 ...................136
Figure 8.2: Comparison of Calculated and Measured Cambers for Span 1 ...................136
Figure 8.3: Curvature Diagram for Three-Span Brdige..................................................139
viii

List of TABLES Number Page
Table 2.1: Size and Shape Factor for Shrinkage (SSF) ....................................................23
Table 2.2: Shrinkage Coefficients (AUS).........................................................................24
Table 2.3: Size and Shape Factor for Creep ....................................................................25
Table 2.4: Variation of Creep (AUC) with Time .............................................................26
Table 3.1: W74MG Cross-Section Properties .................................................................38
Table 3.2: HPC Test Girder Design Details ....................................................................38
Table 3.3: Cross-Section Properties .................................................................................43
Table 3.4: HPC Brdige Girder Design Details ................................................................44
Table 3.5: Predicted Time-Dependent Prestress Losses (MPa) .......................................44
Table 3.6: Summary of Predicted and Calculated Stresses at Service .............................45
Table 3.7: Predicted Girder Deflection ............................................................................45
Table 3.8: Fabrication Schedule for Bridge Girders ........................................................46
Table 4.1: Instrumented Slipback Strands .......................................................................56
Table 4.2: Frequency of Strain and Temperature Readings ............................................61
Table 4.3: Strand Monitored for Slip-Back and Number of Destressing Stages .............61
Table 4.4: Schedule of Level Readings ............................................................................62
Table 5.1: Match-Cured Cylinder Data ............................................................................64
Table 5.2: Girder Concrete Maturity at cgc at Destressing ..............................................67
Table 5.3: Camber Measured after Destressing................................................................73
Table 6.1: Early Creep Losses During Destressing ..........................................................93
Table 6.2: Elastic Shortening Losses in Instrumented Girder ..........................................93
Table 6.3: Losses Due to Creep and Shrinkage (Three Years).........................................96
Table 6.4: Losses Due to Creep and Shrinkage After Deck Casting................................98
Table 6.5: Increase in Strand Stress at Midspan Due to Deck Casting ..........................100
Table 6.6: Total Observed Prestress Losses at Three Years...........................................104
Table 7.1: Elastic Shortening Loss as a Percentage of Jacking Stress ...........................110
ix

Table 7.2: Three Year Creep and Shrinkage Losses as Percentage of the Jacking
Stress ..............................................................................................................117
Table 7.3: Strand Loss Due to Differentail Shrinkage....................................................119
Table 7.4: Predicted Relaxation Loss as a Percentage of Jacking Stress at 3 Years ......121
Table 7.5: Stress Losses During Deck Casting...............................................................123
Table 7.6: Total Prestress Losses at 3 Years as Percentage of Jacking Stress ...............126
Table 7.7: Observed and Calculated Prestress Losses at Three Years (MPa) ................128
Table 7.8: Typical Creep Parameters (Nilson 1991) ......................................................130
Table 8.1: Comparison of PCI Predicted and Measured Cambers (mm) .......................137
Table 8.2: Comparison of Camber Due to Differential Shrinkage at Three Years ........140
Table 9.1: Comparison of Prestress Losses after Three Years .......................................144
x

Acknowledgments
The authors wish to thank the Washington Department of Transportation and the
Federal Highway Administration for providing funding for this project. Central Pre-mix
Co. provided valuable logistical assistance and provided access to their fabrication plant.
The authors also wish to thank Barry Brecto (FHWA), Myint Lwin (WSDOT), Tom
Roper (WSDOT), Ray Shaefer (WSDOT), Keith Anderson (WSDOT), Chuck Ruth
(WSDOT) and Chuck Prussack (Central Pre-Mix Co.) for all the support during the
project.
xi

SUMMARY
The Federal Highway Administration has developed a program to encourage the
use of High-Performance Concrete (HPC) in bridges. As part of that program, the
University of Washington and the Washington State Department of Transportation
investigated the long-term behavior of a High-Performance Concrete (HPC) pretensioned
concrete girder bridge. This report provides results from the program of girder design,
and three years of monitoring and evaluation. A companion report provides results of
the materials testing program (Barr et al. 2000a).
The Washington State Department of Transportation (WSDOT) builds many
precast, pretensioned concrete girders, largely because this form of construction is very
economical, thanks to the excellent aggregates that are available locally, and the
competitive nature of the precast industry. Pretensioned girders can be made stronger by
using more prestressing steel, but this in turn necessitates that the concrete be stronger.
The stronger girders offer several potential benefits, such as shallower girders for a given
span, longer spans with a given girder size, or fewer girder lines in a bridge of given size.
In the latter case, the cost per girder may increase slightly, but the total initial cost of the
bridge is expected to decrease compared with bridges made of conventional concrete.
The prestressing force in a girder under service conditions is significantly lower
than the initial jacking force, because losses occur due to elastic shortening, creep,
shrinkage and relaxation. Accurate prediction of these losses, and thus the final
prestressing force, is an important step in the design of any prestressed concrete girder;
this prediction assumes even greater importance in a highly stressed HPC girder.
The bridge used for this study is located near Kent, WA, and carries the
eastbound lanes of SR 18 over SR 516. The bridge has three spans, of 24, 42 and 24 m
(80, 137 and 80 ft), five lines of girders and a skew of 40°. The girders are WSDOT
W74MG pretensioned I-girders, and the deck is 190-mm (7.5-inch) thick, cast-in-place
composite. The prestressing force was supplied by forty 15-mm (0.6-in.) diameter
strands in the longer girders (Span 2) and by fourteen strands in the shorter ones (Spans 1
1
and 3). The girders were designed as simply supported, but significant continuity steel
was supplied at the interior pier supports. The girders were designed for zero bottom
tension under full service load. WSDOT engineers believed that the small incremental
cost of this conservative design easily warranted its adoption.
Using seven girders, WSDOT could have satisfied all of the design requirements
with conventional concrete. To meet the design requirements for the long span using
only five girders, it was necessary for WSDOT to specify a nominal concrete
compressive strength of 51 MPa (7400 psi) at release of prestress and 69 MPa (10,000
psi) at 56 days. A suitable mix was developed by the precast fabricator, Central Premix
Prestress Co. of Spokane, Washington.
A 6-m (20-ft) long test girder was cast in December 1996 in order to provide the
fabricator with experience in handling the HPC. The test girder casting also provided the
researchers with an opportunity to evaluate various specimen preparation procedures and
to install instrumentation under field conditions. The test girder was designed so that the
stress conditions at midspan would be the same as those at midspan of a long bridge
girder. The bridge girders were cast during March and April of 1997. They were
transported and erected in May 1997, and the deck was cast in September 1997. The
time between the girder erection and deck casting was longer than had been scheduled,
but it provided an opportunity to take relatively long-term strain and deflection readings
on the bare girders.
The primary instrumentation was designed to record temperatures, strains and
cambers in the girders. During casting, additional instrumentation was used to measure
strand slip-back, from which the transfer length of the strands could be estimated. Two
stress gages were installed in the test girder on an experimental basis, but their
subsequent use was rejected, because they were too sensitive to temperature variations.
Embedded Vibrating-Wire Strain Gages (VWSGs) were used to measure concrete
strains. They were chosen on the basis of their long-term stability and durability, and the
fact that they contain an integral thermistor for measuring temperature as well as strains.
They were installed in a standard pattern at ten locations on the bridge; the midspan and
2
at 1.5 m (5 ft) from one end of each of the instrumented girders. The standard pattern
consisted of six gages over the height of the girder and two more in the slab above the
girder. Several gages were also installed at other selected locations.
Midspan cambers were recorded using two methods. An automatic recording
system, based on a wire stretched between the girder ends and a midspan displacement
sensor (an LVDT), was developed and installed on three long girders and three short
ones. Supplementary readings were taken with a surveyor's level in the fabricator’s yard
and, when possible, at the bridge site. The automatic system was plagued by damage in
the fabricator's yard and by vandalism on site. Thus the records from that system are far
from complete. However, a modified, more robust system worked well on site. The
surveyor's level readings provided an independent measure of camber, but these
measurements were inevitably intermittent. Both methods provide approximately
± 1 mm. (0.04") accuracy on site and somewhat worse in the yard.
Results suggest that the general performance of the HPC Bridge is similar to that
expected of comparable bridges made from conventional concrete. The bridge is
performing well under service loads.
The slip-back of the strands showed considerable scatter but implied a transfer
length between 50 and 100 strand diameters, compared with the 60 predicted by the
AASHTO equations (1994). Nineteen of the twenty-four measurements exceeded the
transfer length estimated with the AASHTO equation. The slip-back readings could only
be taken over a period of about one hour during destressing, so they do not include the
effects of "creep slipback," which has been reported by others. Thus, the true transfer
length probably exceeds that reported here.
The thermistors in the VWSGs showed that the concrete temperature during
curing varied by approximately 25 °C (45°F) over the girder height. The concrete was
coldest, and therefore presumably weakest, at the bottom. The reason for this variation is
believed to be that the girders were cast out of doors during the winter when the freezing
ground acted as a heat sink. The fabricator installed at mid-height of the girder a
thermocouple that was connected to a "sure-cure" cylinder curing system. This
3

observation is significant, because the prestressing release time was based on the strength
of concrete at mid-height, rather than at the bottom flange of the girder, where the stress
was highest and the concrete was weakest.
In general, strains recorded in the field are frequently susceptible to errors and to
large scatter. However, those recorded here are believed to be reliable, because they
satisfy several consistency criteria. They are similar in similar girders, and they vary
consistently over the height of the girders. Moreover, the relative magnitudes of the
strains among the girders are consistent with the relative magnitudes among the measured
cambers.
Several methods for estimating prestress losses have been proposed in the
literature. The total losses computed from the measured strains are, in general, similar to
those implied by the AASHTO and PCI equations for prestress losses. However, this
agreement is not a result of the methods accurately predicting each individual
component. Instead, the total changes compared well, because some predictions were too
low (e.g., elastic shortening) and others were too high (e.g., creep and shrinkage,
relaxation and deck casting).
The prestress losses due to some sources that are not usually accounted for, such
as deck casting and differential shrinkage, were also considered in the predictions made
here. In particular, the effect of shrinkage of the deck concrete on available prestressing
force is more complex than usually assumed. For example, girder-to-girder continuity
can reverse the direction of the prestress force change due to deck shrinkage.
4

CHAPTER 1
INTRODUCTION
1.1 CONTEXT
The American Concrete Institute defines High-Performance Concrete (HPC) as
“concrete that meets special performance and uniformity requirements that cannot always
be obtained using conventional ingredients, normal mixing procedures, and typical curing
practices” (Goodspeed et al., 1996). These requirements may include the following
enhancements: (1) easier placement and consolidation, (2) high early strength, (3) better
long-term mechanical properties, (4) increased resistance to abrasion, (5) better volume
stability and (6) longer life in severe environments.
The use of High-Performance Concrete can be a step towards further improving
the durability of our nation’s bridges. Of the 596,047 bridges listed in the National
Bridge Inventory (NBI) in 1997, 18% were identified as structurally deficient (NBI
1997). It was estimated that more than 400 billion dollars would be needed just to
replace the existing deteriorated bridges in the United States highway system (NBI
1997). Some bridges built with conventional concrete and located in severe
environments have not proven to be durable. The use of HPC for the deck and
substructure of future bridges would increase durability, resulting in longer life and
decreased-long term maintenance costs.
In the case of precast, prestressed girder bridges, the availability of high-strength
concrete would enable engineers to design longer span lengths, increased girder spacings
and therefore, fewer girders and shallower sections. The longer spans would permit the
use of fewer supports, which could improve traffic safety, especially where the bridge is
built at locations that are already congested. Increased girder spacings would decrease
fabrication, transportation and erection costs. If girders were shallower, it would be
possible to increase underpass clearances or lower embankment heights.
5
1.2 CHALLENGES TO THE IMPLEMENTATION OF HPC
Despite the apparent benefits of using High Performance Concrete, there are
reasons why it has not yet been widely used in prestressed members.
Current methods for calculating prestress losses, such as those advocated by the
American Association of State Highway and Transportation Officials (AASHTO 1994)
and the Precast Prestressed Concrete Institute (PCI 1975), were based on the observed
behavior of conventional concrete, with strengths usually below 41.4 MPa (6000 psi). In
particular, several equations for calculating prestress losses are empirically related to
concrete strength. Because incorrect calculations of prestress losses can lead to
unacceptable service performance, these losses need to be predicted accurately.
The appropriateness of applying current design methods to High-Performance
Concrete needs to be evaluated. For example, elastic shortening and creep are two major
components of the total prestress loss. Because an HPC girder will almost certainly be
more highly stressed than one made with conventional concrete, those components will
probably be higher. It is unknown whether this difference in prestress loss is adequately
predicted by present methods of analysis.
The use of larger-diameter strand with HPC has also been an area of concern for
designers. Compared with lower strength concrete, the use of HPC permits additional
prestressing force to be used. To obtain this force in a standard girder shape with
standard strand spacing without inducing excess congestion, larger-diameter strands must
often be used. However, in 1988 the Federal Highway Administration (FHWA) placed a
moratorium on the use of 15 mm (0.6 inch) diameter strand for pretensioned applications
because of uncertainties in its bond properties. In May 1996, based on preliminary
studies at the University of Texas (Russel and Burns 1997) on the transfer and
development length of the 15 mm (0.6 inch) strand, the FHWA permitted the use of 15
mm (0.6 inch) diameter strands at 51 mm (2 inch) spacings. The current design equations
for transfer and development length were based on smaller, 13 mm (0.5 inch) diameter
6
strands. Whether they are universally applicable for the 15 mm (0.6 inch) diameter
strands remains an open question.
Precast fabricators also have concerns about the economics of HPC. They prefer
to produce girders on a 24-hour cycle in order to make the most efficient use of their
casting beds and to provide an orderly schedule for their work force. The higher the
prestressing force in the girder, the larger must be the concrete compressive strength at
release of the prestressing strands. To achieve this higher strength, the precast plants
must use a combination of various materials, longer curing times and increased curing
rates. Each of these options is likely to increase costs, and some may negatively affect
the long-term concrete strength. Many plants already steam-cure conventional concrete
to increase the curing rate and remain on a 24-hour cycle. A better understanding of the
effects of this heating on HPC is needed.
This report and its companion report (Barr et al. 2000) document a study
undertaken to evaluate the benefits and concerns of using HPC.
1.3 SR18/SR516 OVERCROSSING
The FHWA has been encouraging the states to use HPC in bridge applications.
Since the Washington State Department of Transportation (WSDOT) was also interested
in expanding the use of HPC to structural applications, WSDOT (with sponsorship from
the FHWA) designed a new bridge to carry the eastbound lanes of State Route 18 (SR
18) over State Route 516 (SR 516). This HPC bridge has three spans with lengths of 24.4
m, 41.7 m and 24.4 m (80 ft, 137 ft and 80 ft) respectively. The girders were designed to
have a release strength of 51 MPa (7,400 psi) and a 56-day compressive strength of 68.9
MPa (10,000 psi). As a result of specifying HPC, WSDOT was able to reduce the
number of lines of girders from seven to five.
The roadway deck has a width of 11.6 m (38 ft). The design strength of the deck
concrete is only 27.6 MPa (4000 psi), but it has enhanced durability properties due to the
use of fly ash and the requirement of a 14-day water cure. The HPC bridge is described
7

further in Chapter 3. The design and construction of the bridge provided the opportunity
to assess the benefits and drawbacks of using HPC.
1.4 RESEARCH OBJECTIVES
In general, the use of HPC in bridge applications is considered an innovative
concept. Therefore, the bridges built under the FHWA HPC programs are being
monitored and evaluated for satisfactory performance. The research phase of the study
focuses on evaluating the effectiveness of using HPC in prestressed precast concrete
girders. Specific objectives include:
• Documenting the prestress losses of five bridge girders made with HPC.
• Documenting the camber growth for five bridge girders made with HPC.
• Comparing measured field behavior with that expected according to current
design methods.
• Estimating the transfer length for 15 mm (0.6 in.) diameter strands based on
slipback displacements measured during fabrication.
• Evaluating the material properties of the HPC.
The first four bulleted items are addressed in this report, while the last item is
addressed in a separate report (Barr et al. 2000).
1.5 SCOPE AND ORGANIZATION OF REPORT
The report is organized as follows:
• Chapter 2 describes several methods for calculating prestress losses: the
AASHTO, PCI and Modified Rate of Creep methods. In addition to these
methods, procedures for calculating changes in prestress due to deck casting,
differential shrinkage and intrinsic relaxation are also presented.
• In Chapter 3, the design and fabrication of a 6.1 m (20 foot) long test girder
and five HPC bridge girders are described.
8

• Chapter 4 describes the instrumentation program used to monitor the test
girder and bridge girders. The monitoring program for the instrumentation is
also presented in this chapter.
• Chapter 5 presents the measured data for the bridge girders. The
measurements include strain, camber and temperature time histories. Also
presented are the estimates of transfer length, and a chronology of important
events during fabrication of the test girder and bridge.
• Chapter 6 focuses on documenting the prestress losses, which were estimated
using the measured change in concrete strain of the girders. Creep, shrinkage
and elastic shortening losses were calculated from measured strain data at the
prestressing centroid. Intrinsic relaxation values were taken from the
manufacturer’s test data and then converted to prestress loss by a procedure
described by Ghali (1994).
• Chapter 7 evaluates the accuracy of a variety of prestress loss equations in
predicting the observed prestress losses. Specific methods discussed include
the AASHTO and PCI recommended methods.
• Chapter 8 documents the measured camber growth in the bridge girders, and
compares this behavior with calculated estimates.
• Chapter 9 summarizes the report and its conclusions.
9
CHAPTER 2
METHODS FOR ESTIMATING PRESTRESS LOSSES
2.1 INTRODUCTION
The prestressing force in a girder during service is lower than at initial stressing,
because losses occur. These stress losses must be estimated when the girder is designed
so that, once they are subtracted from the initial prestress force, the remaining strand
force will be sufficient to provide the allowable concrete stress during service. The
primary sources of these losses are relaxation of the steel, elastic shortening of the
concrete when the prestress is applied, and creep and shrinkage of the concrete during the
life of the girder. Stress is regained with the addition of load, caused for example, by
casting of the deck.
Several methods of estimating prestress losses have been proposed, but many of
them were developed in the 1970s. The methods described in this chapter are the PCI
General method (PCI 1975), the three AASHTO LRFD methods (AASHTO 1994) and
the Modified Rate of Creep Method (Lwin and Khaleghi 1996). These methods are
subsequently used in Chapter 3 (girder design), and in Chapter 6 (comparison of
observed and measured prestress losses).
Methods for predicting prestress losses can be classified into four groups
according to their complexity (Fekete 1997). True lump-sum methods are the crudest
and require no knowledge of material properties. Single equation methods use a single
equation to predict the ultimate loss, but the coefficients in the equation vary with the
material properties and girder geometry. Component methods predict the ultimate loss by
calculating explicitly the components of loss due to various causes, such as elastic
shortening or creep, based on knowledge of the material properties. Time-step methods
use a similar methodology to component methods, but compute the loss at user-selected
time intervals. Such methods require as input the time-dependence of the material
properties, for which approximations are provided in the absence of material-specific
data.
10

According to this classification system, the AASHTO Lump-Sum Method is a
single equation method. AASHTO’s description of it as a lump sum method is
unfortunate and confusing, since previous editions of the AASHTO Specifications
contained a method that is a true lump sum method. The AASHTO Refined Method
contains a more detailed estimate of the time-dependent components of loss but does so
only for the ultimate condition, and it is therefore a component method. The equations
in the AASHTO Refined Method can be made time-dependent by multiplying the
ultimate loss by the ratio of loss at any time to total loss at service. This time-dependent
approach is not explicitly contained in the AASHTO Specifications, but it was used in
this report to investigate the rate of loss throughout time and is identical to the official
AASHTO Refined Method at service. It is referred to here as the AASHTO Refined
Method. The Modified Rate of Creep Method and the PCI General Method are also
related to the AASHTO methods, and are also time-step methods.
None of these methods was developed specifically for HPC. One of the goals of
this research was to evaluate the actual prestress losses and to determine the accuracy of
current prediction methods. The methods are described in this chapter, but specific
values of losses are computed in chapters 3 and 6.
Also discussed in this chapter are procedures for calculating changes in strand
stress due to deck casting (Section 2.7) and differential shrinkage (Section 2.8). A
procedure to convert relaxation test data at constant strain to relaxation loss in prestressed
concrete girders is also presented (Section 2.9). Each of the procedures will be used in
subsequent chapters to help compare measured and predicted prestress losses.
2.2 AASHTO LUMP-SUM METHOD
According to the AASHTO LRFD Specification (AASHTO 1994), the total stress loss, ∆fpTOT, is given by ∆fpTOT = ∆fpES + ∆fpTD (2.1) where ∆fpES = prestress loss due to elastic shortening
∆fpTD = total time-dependent prestress loss.
11
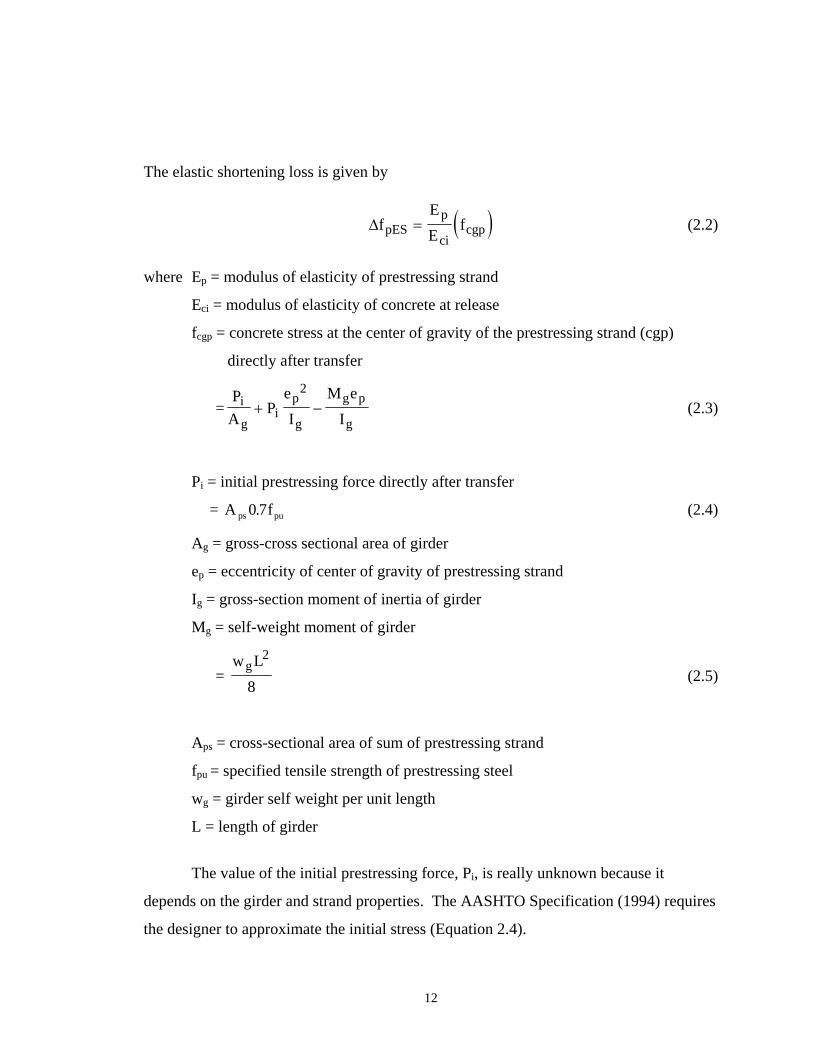
The elastic shortening loss is given by
(∆fEE
fpESp
cicgp= ) (2.2)
where Ep = modulus of elasticity of prestressing strand
Eci = modulus of elasticity of concrete at release
fcgp = concrete stress at the center of gravity of the prestressing strand (cgp)
directly after transfer
=P
AP
eI
M eI
i
gi
p
g
g p
g+ −
2 (2.3)
Pi = initial prestressing force directly after transfer
= A (2.4) fps pu0 7.
Ag = gross-cross sectional area of girder
ep = eccentricity of center of gravity of prestressing strand
Ig = gross-section moment of inertia of girder
Mg = self-weight moment of girder
= w Lg
2
8 (2.5)
Aps = cross-sectional area of sum of prestressing strand
fpu = specified tensile strength of prestressing steel
wg = girder self weight per unit length
L = length of girder
The value of the initial prestressing force, Pi, is really unknown because it
depends on the girder and strand properties. The AASHTO Specification (1994) requires
the designer to approximate the initial stress (Equation 2.4).
12
For I-shaped girders that are prestressed with 1860 MPa (270 ksi) grade
low-relaxation strands, that contain no mild reinforcement and that have a concrete
strength above 41 MPa (6 ksi), the time-dependent losses in Equation 2.1 (creep,
shrinkage and relaxation) are approximated by Equation 2.6. This equation predicts a
slight reduction in time-dependent losses as concrete strength increases.
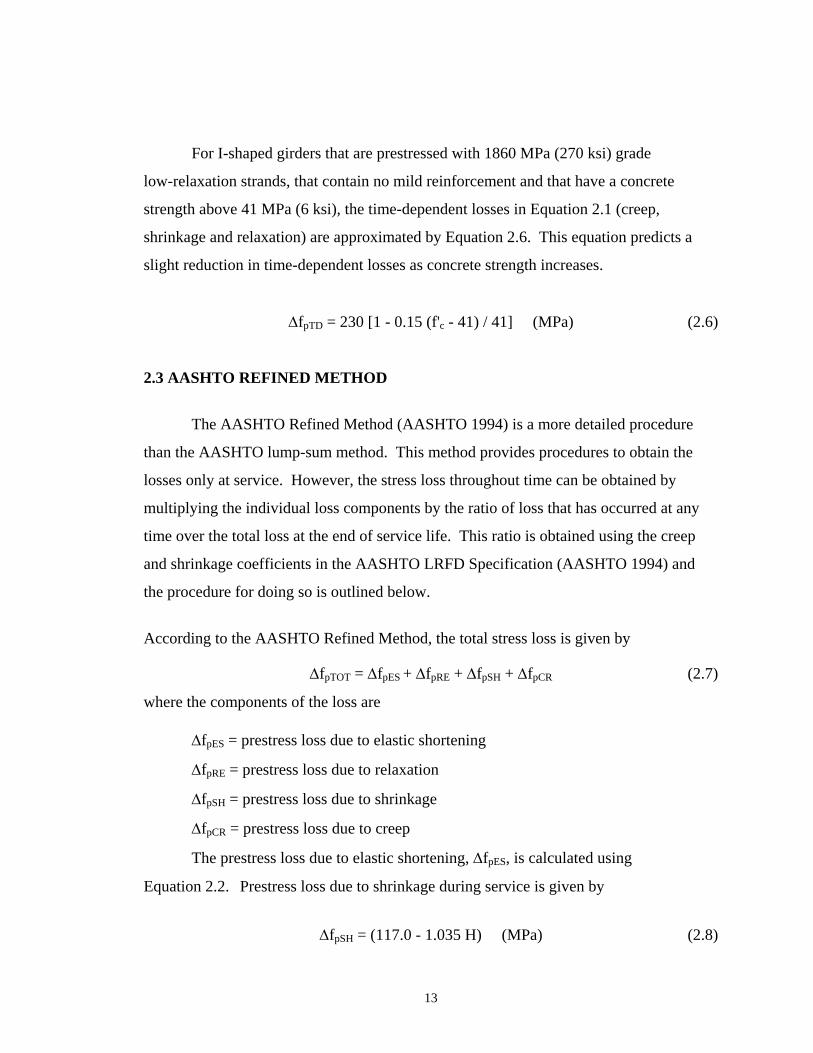
∆fpTD = 230 [1 - 0.15 (f'c - 41) / 41] (MPa) (2.6) 2.3 AASHTO REFINED METHOD
The AASHTO Refined Method (AASHTO 1994) is a more detailed procedure
than the AASHTO lump-sum method. This method provides procedures to obtain the
losses only at service. However, the stress loss throughout time can be obtained by
multiplying the individual loss components by the ratio of loss that has occurred at any
time over the total loss at the end of service life. This ratio is obtained using the creep
and shrinkage coefficients in the AASHTO LRFD Specification (AASHTO 1994) and
the procedure for doing so is outlined below.
According to the AASHTO Refined Method, the total stress loss is given by ∆fpTOT = ∆fpES + ∆fpRE + ∆fpSH + ∆fpCR (2.7)
where the components of the loss are ∆fpES = prestress loss due to elastic shortening
∆fpRE = prestress loss due to relaxation
∆fpSH = prestress loss due to shrinkage
∆fpCR = prestress loss due to creep
The prestress loss due to elastic shortening, ∆fpES, is calculated using
Equation 2.2. Prestress loss due to shrinkage during service is given by
∆fpSH = (117.0 - 1.035 H) (MPa) (2.8)
13
where H = relative humidity (%) ∆fpSH = shrinkage loss in MPa
According to Equation 2.8, the stress loss due to shrinkage can range from 117
MPa (17.0 ksi) at 0% humidity to 13.8 MPa (2 ksi) at 100% humidity. Western
Washington, where the SR18/SR516 Bridge is located, has an average humidity value of
80% which corresponds to a predicted ultimate stress loss due to shrinkage of 34.5 MPa
(5 ksi).
The ultimate shrinkage loss in Equation 2.8 can be made time-dependent by using the
relationship in Equation 2.9.
( )( )( )∆ ∆f t fpSH pSH
sh t ti
sh t=
⎛⎝⎜
⎞⎠⎟
=
=∞
εε
(2.9)
where εsh= strain due to shrinkage of concrete
= − ∗ ∗+
⎛⎝⎜
⎞⎠⎟∗ −k k
tt
xs h550
056 10 3
..
ks = volume-to-surface ratio factor
=( )
te t
tt
v sv s26
45
1064 94923
0 36∗ +
+
⎡
⎣
⎢⎢⎢⎢
⎤
⎦
⎥⎥⎥⎥
− ∗⎡
⎣⎢
⎤
⎦⎥
∗. ( / ) /
= ( ) ( )[ ]4526
1153 01020 36
+
+
⎡
⎣⎢
⎤
⎦⎥ +
te t
v sv s*
. ..
t = time in days
v/s = volume-to-surface ratio of girder (76.5 mm for W74MG)
kh = humidity factor (0.80 for Western Washington)
14
The time-dependent shrinkage strain is taken from Section 5.4.2.3.3 of the
AASHTO LRFD Specifications (AASHTO 1994). The prestress loss due to creep is
given by
∆fpCR = 12.0 fcgp – 7.0 ∆fcdp > 0.0 (2.10)
where fcgp = sum of the concrete stresses due to prestressing and the self weight of the
girder at the center of gravity of the prestressing strands at mid-span. This
stress is considered constant over time.
∆fcdp = change in the concrete stress at the level of the prestressing strands due
to the weight of the concrete deck slab, diaphragms and barriers. The
term 7.0 ∆fcdp in Equation 2.10 is an approximate estimate of prestress
gain due to dead load of slab, diaphragm and barriers.
The ultimate creep loss in Equation 2.10 can be made time dependent by using the
relationship in Equation 2.11, which is taken from Section 5.4.2.3.2 of the AASHTO
LRFD Specifications (AASHTO 1994).
∆ ∆Ψ
Ψf fpCR t pCR
t
t( )
( )
( )= ∗
⎛⎝⎜
⎞⎠⎟= ∞
(2.11)
where ∆fpCR(t) = prestress loss due to creep at time t
Ψ(t) = creep coefficient
=( )
( )( )35 158120 10 0
0 1180 6
0 6. ..
..
.∗ ∗ ∗ −⎛⎝⎜
⎞⎠⎟
−
+ −
⎛
⎝⎜⎜
⎞
⎠⎟⎟
−k kH
tt t
t tc f i
i
i
kc = factor for volume to surface ratio
15
= ( ) ( )
t
e tt
t
ev s v s26
45
180 1772 587
0 36 0 54∗ +
+
⎡
⎣
⎢⎢⎢⎢
⎤
⎦
⎥⎥⎥⎥
+ ∗⎡
⎣⎢⎢
⎤
⎦⎥⎥
−. / . /. ..
= ( )( )[ ]45
260 696 06840 36
0 54+⎡⎣⎢
⎤⎦⎥
+ ∗+−t
eev s t
v s
*.. /
. /
kf = factor for the effect of concrete strength
=1
0 6762
.'
+⎛⎝⎜
⎞⎠⎟
f c
f’c = concrete strength at 28 days (MPa)
H = relative humidity in % (80 for Western Washington)
ti = age of concrete when load is initially applied (days)
t = age of concrete of time interval (days)
v/s = volume-to-surface ratio
The relaxation loss, ∆fpRE, is divided into two components. The one that occurs before transfer is given by
∆fpRE = log(24*t)/40.0 [fPj/fPy-0.55]fPj (2.12)
where t = time in days from stressing to transfer
fPj = stress in steel directly before transfer
fpy = yield strength of the prestressing steel
After transfer, the relaxation is given by
∆fpRE = 0.30 [ 138 -0.4 ∆fpES - 0.2(∆fpSH + ∆fpCR)] (MPa) (2.13)
16
Equation 2.13 is intended to account for the fact that the strand is under
continuously decreasing strain, due to creep and shrinkage in the concrete, rather than the
constant strain that exists prior to transfer and is considered in Equation 2.12.
2.4 AASHTO TIME-STEP METHOD
The AASHTO Time-Step Method (AASHTO 1994) is similar to the AASHTO
Refined Method except that the time-step method is iterative. Although this method is
not an official AASHTO Method, it has been proposed as an alternative method (Lwin
and Khaleghi 1996). The calculation for the first iteration is exactly the same as the
refined method, in which prestress loss values are obtained throughout time. These
prestress losses are then used to calculate the prestress force throughout time for the next
iteration. The prestressing force is then used to calculate concrete stresses due to
prestressing and the self weight of the girder at the center of gravity of the prestressing
strands at mid-span (fcgp), except that now, this stress will change over time (Equation
2.3). The prestressing force is calculated at the end of the previous iteration and used in
the beginning of the next iteration. Losses generally converge after a few cycles (Lwin
and Khaleghi 1996).
2.5 MODIFIED
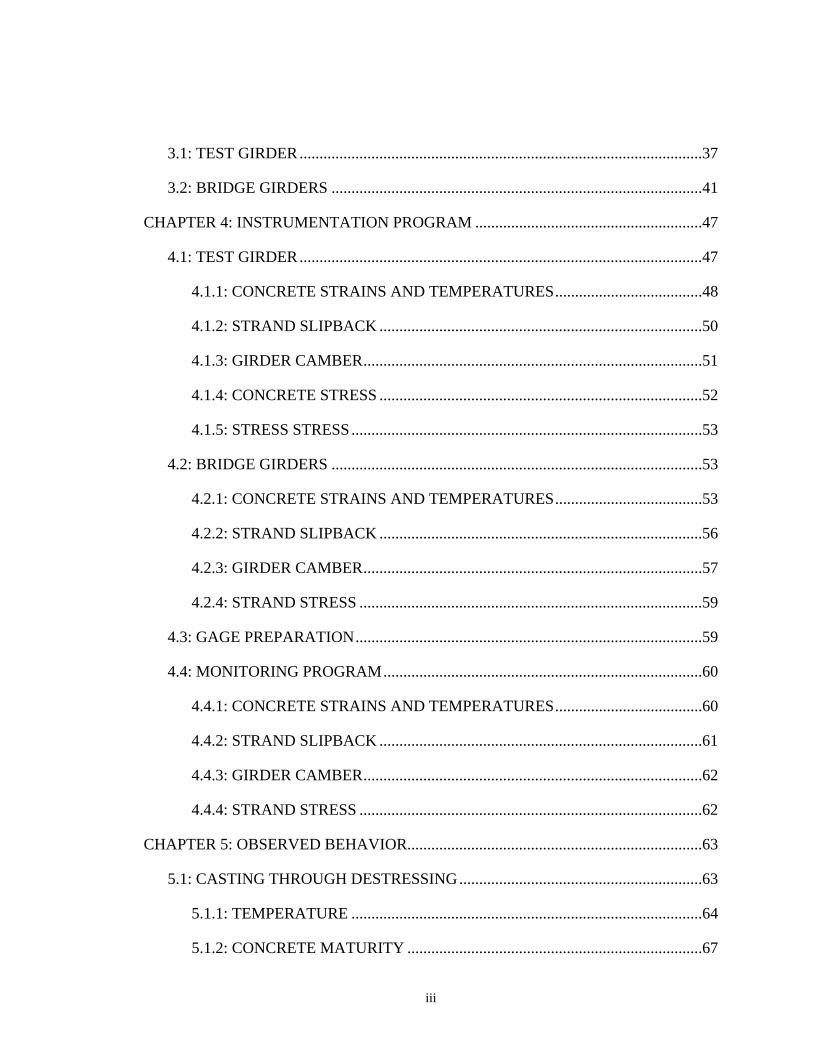
List of figures..................................................................................................................... vi
2.6 PCI GENERAL METHOD.............................................................................22
Figure 2.2. Two-Degree-of-Freedom Model of Bridge ........................................30
Figure 2.3. Differential Shrinkage Stresses ......................................................................32
Table 5.1. Match-Cured Cylinder Data ............................................................................65
Girder .....................................................................................................................65
1A 65
Table 5.2. Girder Concrete Maturity at cgc at Destressing ..............................................68
1A 68
Table 6.4. Losses Due to Creep and Shrinkage After Deck Casting ....................99
17
Span 1 ...................................................................................................................111
0 200 400 600 800 1000 1200Time (days)
0
10
20
30
40
50
60
70
80
90
100St
ress
Los
s (M
Pa)
0.0
1.5
2.9
4.3
5.8
7.3
8.7
10.1
11.6
13.0
14.5
Stre
ss L
oss
(ksi
)
PCI (AASHTO)AASHTO (AASHT0)PCI (ACI 363)AASHTO (ACI 363)
........................................................................................................................115
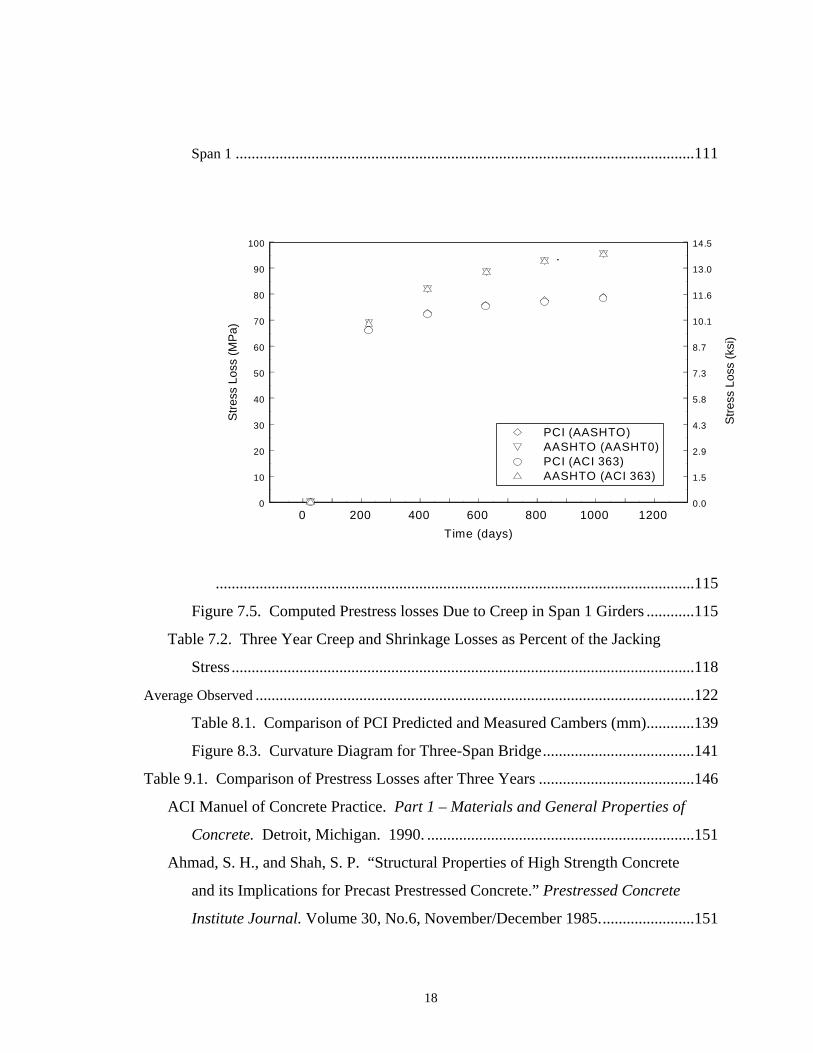
Figure 7.5. Computed Prestress losses Due to Creep in Span 1 Girders ............115
Table 7.2. Three Year Creep and Shrinkage Losses as Percent of the Jacking
Stress ....................................................................................................................118
Average Observed ..............................................................................................................122
Table 8.1. Comparison of PCI Predicted and Measured Cambers (mm)............139
Figure 8.3. Curvature Diagram for Three-Span Bridge......................................141
Table 9.1. Comparison of Prestress Losses after Three Years .......................................146
ACI Manuel of Concrete Practice. Part 1 – Materials and General Properties of
Concrete. Detroit, Michigan. 1990. ...................................................................151
Ahmad, S. H., and Shah, S. P. “Structural Properties of High Strength Concrete
and its Implications for Precast Prestressed Concrete.” Prestressed Concrete
Institute Journal. Volume 30, No.6, November/December 1985........................151
18
RATE OF CREEP METHOD
The Modified Rate of Creep Method (Lwin and Khaleghi 1996) is another
time-step method that takes into account the instantaneous and time-dependent effect of
slab casting, and the transition from non-composite to composite cross-section properties.
It also includes provision for the effects of differential shrinkage between the slab and
girders, and allows for different creep rates before and after slab casting. The rate after
slab casting is a weighted average of the slab and girder concrete properties. As with the
AASHTO Methods the elastic shortening loss is computed using Equation 2.2.
Time-dependent prestress losses using the Modified Rate of Creep Method are given by
∆fpTD = ∆fpSH + ∆fpCR1 + ∆fpCR2 + ∆fpRE - ∆fpEG - ∆fpCRG - ∆fpDSH (2.14)
where ∆fpTD = total prestress loss
∆fpSH = prestress loss due to shrinkage
∆fpCR1 = prestress loss due to creep of concrete before slab casting
∆fpCR2 = prestress loss due to creep of concrete at any time after slab casting
∆fpRE = prestress loss due to relaxation
∆fpEG = prestress gain due to dead load of slab
∆fpCRG = prestress gain due to creep effect of slab casting
∆fpDSH = prestress gain due to differential shrinkage between slab and concrete
girder
For non-composite girders, Equation 2.14 may be simplified, and the
time-dependent prestress losses may be taken as
∆fpTD = ∆fpSH + ∆fpCR1 + ∆fpRE (2.15)
19
The prestress loss due to girder shrinkage is computed using Equation 2.9. The
prestress loss due to creep is calculated in two stages. Stage 1 is the creep loss between
time of transfer and slab casting is given by
∆fpCR1 = n fcgp Ψt,tisc (1-∆FSC/2Fo) (2.16) Stage 2 is the creep loss for any time after slab casting, which is expressed as ∆fpCR2 = n fcgp (Ψt,ti-Ψt,tisc) (1-(∆FSC+∆Ft)/2Fo) Ig/Ic (2.17) where Ψt,ti = creep coefficient of girder at any time
Ψt,tisc = creep coefficient of girder at the time of slab casting
∆FSC = total loss of force at the time of slab casting minus initial elastic
shortening loss
Fo = prestressing force at transfer after elastic losses
∆Ft = total prestressing loss at any time minus initial elastic shortening loss
Ig/Ic = ratio of moment of inertia of prestressed girder to composite girder
n = modular ratio ( E EP C )
Ep = modulus of elasticity of prestressing strand
Ec = modulus of elasticity of concrete at 28 days
In the above equations, the terms Ψt,tisc(1-∆FSC/2Fo) and (Ψt,ti-Ψt,tisc)(1-
∆FSC+∆Ft)/2Fo) take into account the effects of variable stress history from the time of
transfer to the time of slab casting, and from slab casting to final conditions, respectively.
The term Ig/Ic represents the effect of composite section properties after slab casting.
The AASHTO LRFD Specifications recognize the prestress gain due to the deck
weight by the term 7.0 ∆fcdp in Equation 2.10. In the Modified Rate of Creep Method,
the creep response to slab and diaphragm dead load is treated as a prestress gain. Part of
the initial compressive strain induced in the concrete immediately after transfer is
reduced by the tensile strain resulting from permanent loads. The prestress gain due to
slab dead load consists of two parts. The first part is due to instantaneous elastic
20
prestress gain. The second part is a time-dependent creep effect. Prestress gain due to
elastic and creep effect of slab casting is given as
∆fpEG = nSC fS+D (2.18) ∆fpCRG = nSC fS+D (Ψt,ti - Ψt,tisc) Ig/Ic (2.19) where ∆fpEG = gain in prestress from elastic response to superimposed dead load.
∆fpCRG = gain in prestress from to creep response to superimposed dead load.
nSC = modular ratio at the time of slab casting;
fS+D = stress in concrete at the level of prestressing strands due to dead load of
slab and diaphragms.
In composite prestressed girders bridges, the concrete in the girder is steam-cured
while the concrete in the slab is usually cast-in-place and moist-cured. Slab concrete is
also cast at a later time, when the girders are already in place. Due to differences in the
concrete properties, curing processes and times of casting, the Modified Rate of Creep
Method predicts a prestress gain due to differential shrinkage. This gain in prestressing
force is given by
∆fpDS = nSC fCD (2.20) where fCD = concrete stress at the level of prestressing strands
=[∆εS-G AcSLAB EcSLAB / (1 + Ψt,ti)] (yCS ec / Ic)
∆εS-G = differential shrinkage strain;
AcSLAB = area of concrete deck slab;
EcSLAB = modulus of elasticity of slab;
yCS = distance between the c.g. of composite section to the c.g. of slab;
ec = eccentricity of prestressing strands in composite section;
Ic = moment of inertia of composite section.
The denominator (1 + Ψt,ti) is meant to approximate the long-term creep effect.
21

2.6 PCI GENERAL METHOD
The Precast Concrete Institute (PCI) Committee on Prestress Losses (PCI 1975)
recommends two methods for calculating the change in prestress. The General Method is
a time-stepping method that computes the total loss in stress in the prestressing strand as
the sum of the separate components, over discrete time steps.
∆ ∆ ∆ δ δ δf f f ( f f fpTOT pANC pES pSH pCR pRE
t
= + + + + )∑ (2.21)
where = change in prestress due to anchorage slip ∆fpANC∆fpES = change in prestress due to elastic shortening δfpCR = incremental change due to creep of concrete δfpSH = incremental change due to shrinkage of concrete δfpRE = incremental change due to relaxation of prestressing steel
∆fpANC and are one-time changes, whereas∆fpES δfpCR , and δ are
time-dependent and are calculated for each time step. In pretensioned construction, is not applicable and Equation 2.21 is reduced to Equation 2.22.
δfpSH fpRE
∆fpANC ∆ ∆ δ + δ δf f ( f f fpTOT pES pSH pCR pRE
t)= + +∑ (2.22)
Instantaneous elastic shortening loss is calculated by ∆fpES = (Ep/Eci)*fcgp (2.23) where fcgp = concrete stress at the center of gravity of the prestressing strand (cgp)
directly after transfer. EP = modulus of elasticity of prestressing strand Eci = initial modulus of elasticity of concrete
This equation is identical to that contained in the AASHTO LRFD Specification
(AASHTO 1994), but PCI does not approximate the prestressing force after transfer
(Equation 2.4). The PCI General Method (PCI 1975) uses an iterative calculation to
22
compute fcgp and ∆fpES. However a direct calculation is also possible which can be used
in place of the iterative procedure (Equation 2.24).
ff A
Ae
r
M eIcgp
pj ps
t
pt
t
sw pt
t= + +
⎡
⎣⎢⎢
⎤
⎦⎥⎥
−12
2 (2.24)
where fpj = stress in prestressing strand immediately before transfer
Aps = area of prestressing strand
At = transformed cross-sectional area of girder
ept = eccentricity of center of gravity of prestressing strand (c.g.p.) using
transformed section properties
rt = radius of gyration of girder using transformed cross section
=IA
t
t
It = gross-section moment of inertia of girder using transformed section
Msw = self-weight moment of girder
= w Lg
2
8
The incremental change of prestress due to shrinkage over any time interval is described by
δpSH (USH)(SSF)(PSH)= (2.25)
where USH = ultimate change in stress due to shrinkage
SSF = size and shape factor
PSH = portion of ultimate shrinkage during a given time interval
The ultimate change in stress due to shrinkage is
23
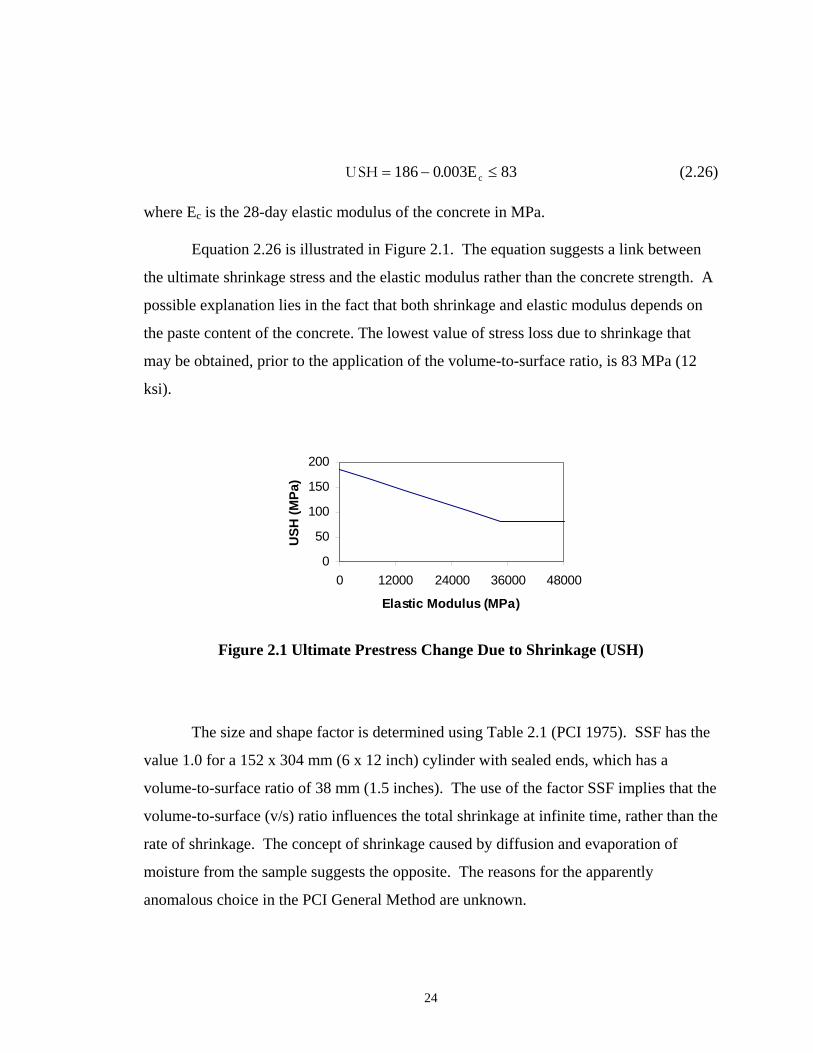
USH = − ≤186 0 003 83. Ec (2.26)
where Ec is the 28-day elastic modulus of the concrete in MPa. Equation 2.26 is illustrated in Figure 2.1. The equation suggests a link between
the ultimate shrinkage stress and the elastic modulus rather than the concrete strength. A
possible explanation lies in the fact that both shrinkage and elastic modulus depends on
the paste content of the concrete. The lowest value of stress loss due to shrinkage that
may be obtained, prior to the application of the volume-to-surface ratio, is 83 MPa (12
ksi).
0
50
100
150
200
0 12000 24000 36000 48000
Elastic Modulus (MPa)
USH
(MPa
)
Figure 2.1 Ultimate Prestress Change Due to Shrinkage (USH)
The size and shape factor is determined using Table 2.1 (PCI 1975). SSF has the
value 1.0 for a 152 x 304 mm (6 x 12 inch) cylinder with sealed ends, which has a
volume-to-surface ratio of 38 mm (1.5 inches). The use of the factor SSF implies that the
volume-to-surface (v/s) ratio influences the total shrinkage at infinite time, rather than the
rate of shrinkage. The concept of shrinkage caused by diffusion and evaporation of
moisture from the sample suggests the opposite. The reasons for the apparently
anomalous choice in the PCI General Method are unknown.
24
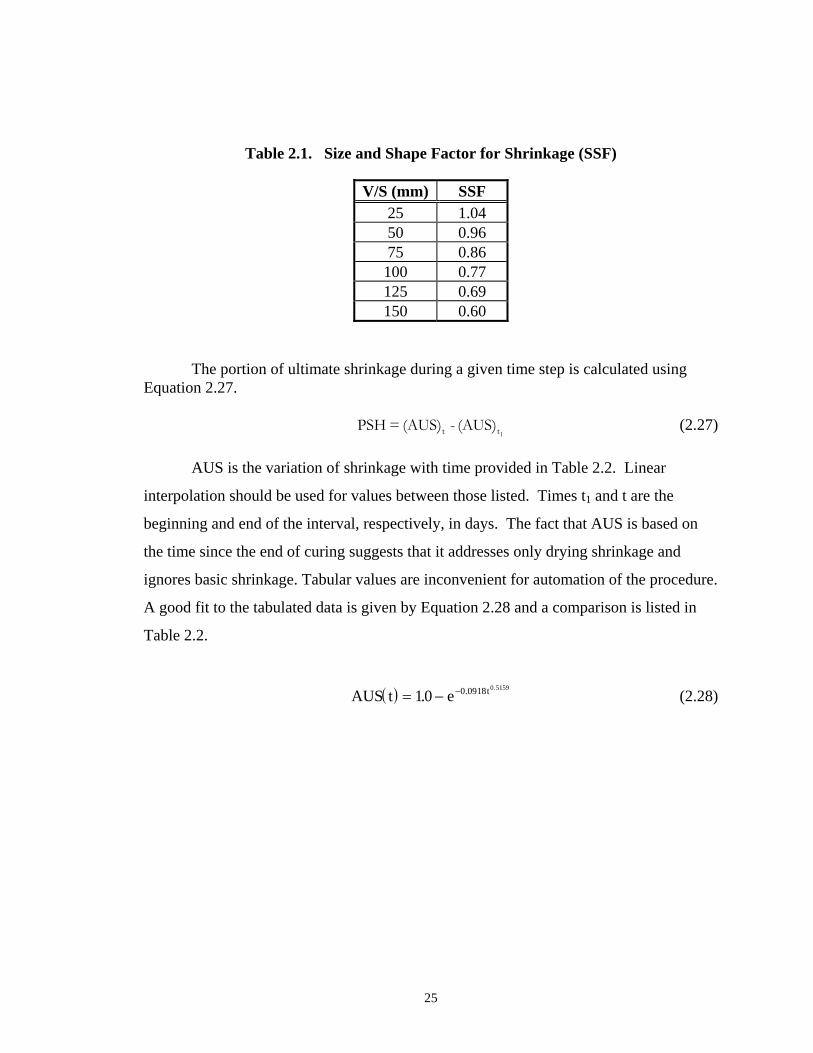
Table 2.1. Size and Shape Factor for Shrinkage (SSF)
V/S (mm) SSF 25 1.04 50 0.96 75 0.86 100 0.77 125 0.69 150 0.60
The portion of ultimate shrinkage during a given time step is calculated using Equation 2.27.
(2.27) PSH = (AUS) - (AUS)t 1t
AUS is the variation of shrinkage with time provided in Table 2.2. Linear
interpolation should be used for values between those listed. Times t1 and t are the
beginning and end of the interval, respectively, in days. The fact that AUS is based on
the time since the end of curing suggests that it addresses only drying shrinkage and
ignores basic shrinkage. Tabular values are inconvenient for automation of the procedure.
A good fit to the tabulated data is given by Equation 2.28 and a comparison is listed in
Table 2.2.
(2.28) ( )AUS t e t= − −10 0 0918 0 5159
. . .
25
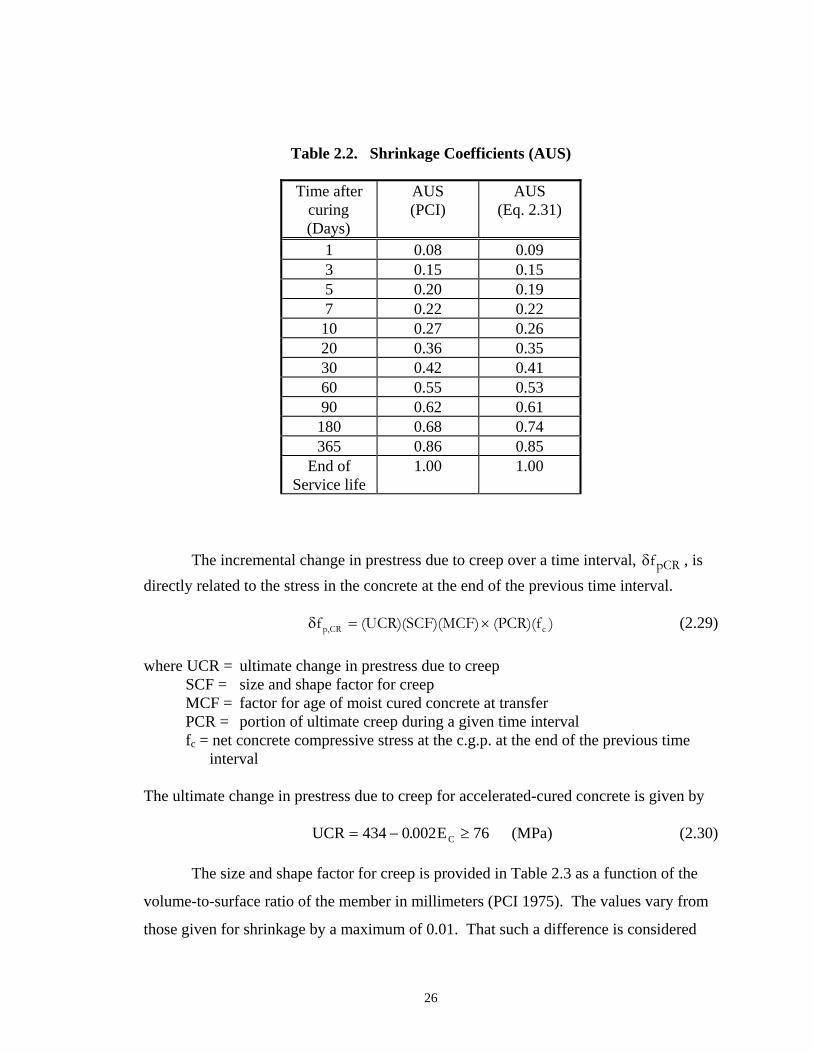
Table 2.2. Shrinkage Coefficients (AUS)
Time after curing (Days)
AUS (PCI)
AUS (Eq. 2.31)
1 0.08 0.09 3 0.15 0.15 5 0.20 0.19 7 0.22 0.22 10 0.27 0.26 20 0.36 0.35 30 0.42 0.41 60 0.55 0.53 90 0.62 0.61 180 0.68 0.74 365 0.86 0.85
End of Service life
1.00 1.00
The incremental change in prestress due to creep over a time interval, δ , is directly related to the stress in the concrete at the end of the previous time interval.
fpCR
δf (UCR)(SCF)(MCF) (PCR)(f )p,CR c= × (2.29) where UCR = ultimate change in prestress due to creep
SCF = size and shape factor for creep MCF = factor for age of moist cured concrete at transfer PCR = portion of ultimate creep during a given time interval fc = net concrete compressive stress at the c.g.p. at the end of the previous time
interval
The ultimate change in prestress due to creep for accelerated-cured concrete is given by UCR EC= − ≥434 0 002 76. (MPa) (2.30)
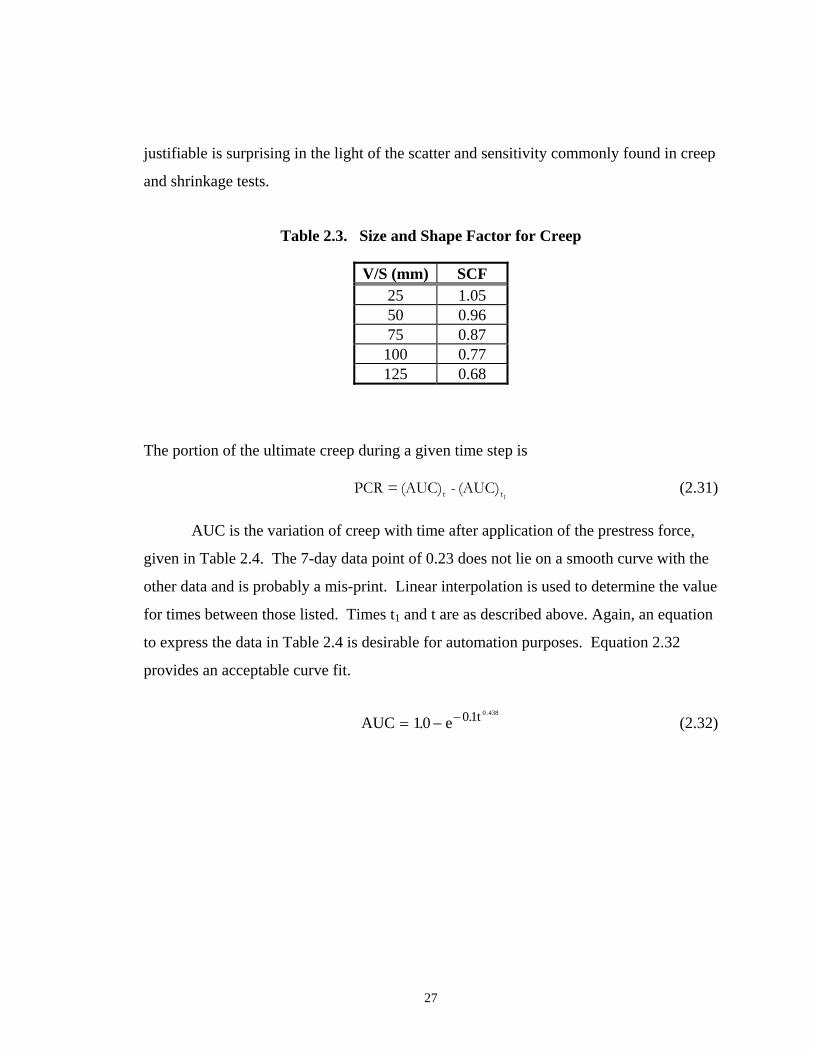
The size and shape factor for creep is provided in Table 2.3 as a function of the
volume-to-surface ratio of the member in millimeters (PCI 1975). The values vary from
those given for shrinkage by a maximum of 0.01. That such a difference is considered
26
justifiable is surprising in the light of the scatter and sensitivity commonly found in creep
and shrinkage tests.
Table 2.3. Size and Shape Factor for Creep
V/S (mm) SCF 25 1.05 50 0.96 75 0.87 100 0.77 125 0.68
The portion of the ultimate creep during a given time step is (2.31) PCR = (AUC) - (AUC)t 1t
AUC is the variation of creep with time after application of the prestress force,
given in Table 2.4. The 7-day data point of 0.23 does not lie on a smooth curve with the
other data and is probably a mis-print. Linear interpolation is used to determine the value
for times between those listed. Times t1 and t are as described above. Again, an equation
to express the data in Table 2.4 is desirable for automation purposes. Equation 2.32
provides an acceptable curve fit.
AUC e t= − −10 01 0 438
. . .
(2.32)
27
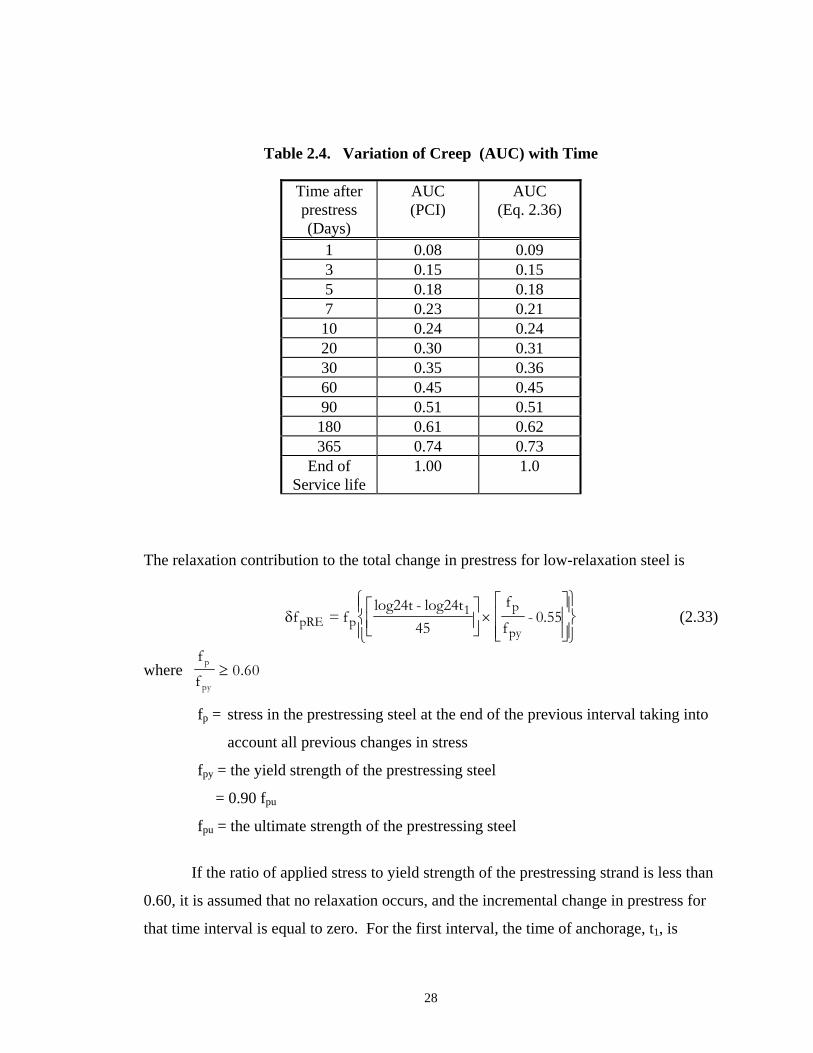
Table 2.4. Variation of Creep (AUC) with Time
Time after prestress (Days)
AUC (PCI)
AUC (Eq. 2.36)
1 0.08 0.09 3 0.15 0.15 5 0.18 0.18 7 0.23 0.21 10 0.24 0.24 20 0.30 0.31 30 0.35 0.36 60 0.45 0.45 90 0.51 0.51 180 0.61 0.62 365 0.74 0.73
End of Service life
1.00 1.0
The relaxation contribution to the total change in prestress for low-relaxation steel is
δf = flog24t - log24t
45
f
f- 0.55pRE p
1 p
py
⎡⎣⎢
⎤⎦⎥
×⎡
⎣⎢⎢
⎤
⎦⎥⎥
⎧⎨⎪
⎩⎪
⎫⎬⎪
⎭⎪ (2.33)
where ff
0.60p
py≥
fp = stress in the prestressing steel at the end of the previous interval taking into
account all previous changes in stress
fpy = the yield strength of the prestressing steel
= 0.90 fpu
fpu = the ultimate strength of the prestressing steel
If the ratio of applied stress to yield strength of the prestressing strand is less than
0.60, it is assumed that no relaxation occurs, and the incremental change in prestress for
that time interval is equal to zero. For the first interval, the time of anchorage, t1, is
28

assumed to be 1/24 day (1 hour). It should also be noted that Equation 2.33 leads to
different ultimate values of change in stress due to relaxation if time steps, rather than a
single calculation over the lifetime of the girder, are used. However, the total change due
to relaxation is typically so small in low-relaxation strand that the difference has little
practical importance.
2.7 DECK CASTING
The preceding sections have described methods for calculating prestress losses
that have been formalized in codes or in the technical literature. These methods fail to
address issues associated with the deck, such as the moment due to self weight of the
deck and differential shrinkage. These issues are discussed in sections 2.7 and 2.8. For a
simply supported girder, the expected change in strand stress due to deck casting can be
calculated as
∆ ∆f fEEpDECK cDECK
p
c=
⎛⎝⎜
⎞⎠⎟ (2.34)
where = change in strand stress due to deck casting ∆fpDECK
∆fcDECK = change in concrete stress due to deck casting
=M e
IDC pt
t
MDC = moment due to self weight of deck
=w LDC
2
8
ept = distance from neutral axis to centroid of the prestressing strand using
transformed properties
wDC = self weight of deck
L = length of girder
It = moment of inertia of girder of transformed section (girder and reinforcement)
Ep = modulus of elasticity of the prestressing strand
Ec = modulus of elasticity of concrete
29
Here the subscript ‘t’ refers to properties of the transformed concrete section,
calculated taking into account the transformed area of the prestressing strands but without
the deck. For simplicity, the gross section properties are usually used in place of the
transformed-section properties.
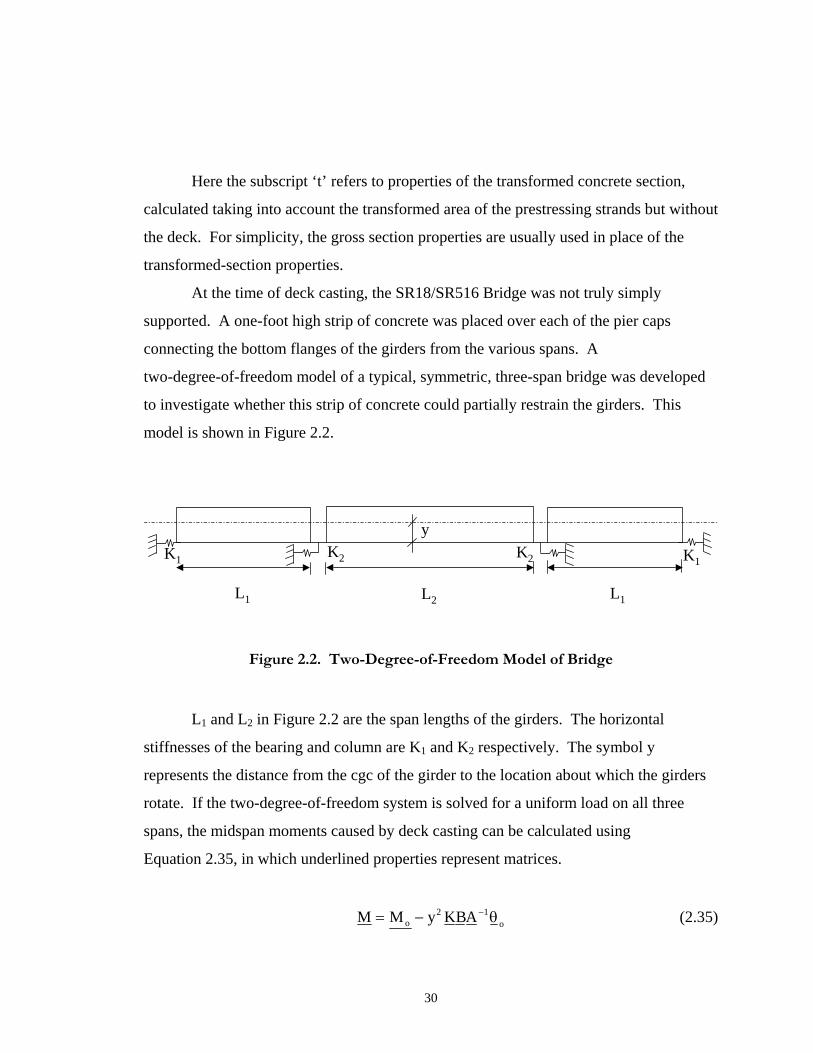
At the time of deck casting, the SR18/SR516 Bridge was not truly simply
supported. A one-foot high strip of concrete was placed over each of the pier caps
connecting the bottom flanges of the girders from the various spans. A
two-degree-of-freedom model of a typical, symmetric, three-span bridge was developed
to investigate whether this strip of concrete could partially restrain the girders. This
model is shown in Figure 2.2.
L1 L2 L1
K1 K2 K1K2
y
Figure 2.2. Two-Degree-of-Freedom Model of Bridge
L1 and L2 in Figure 2.2 are the span lengths of the girders. The horizontal
stiffnesses of the bearing and column are K1 and K2 respectively. The symbol y
represents the distance from the cgc of the girder to the location about which the girders
rotate. If the two-degree-of-freedom system is solved for a uniform load on all three
spans, the midspan moments caused by deck casting can be calculated using
Equation 2.35, in which underlined properties represent matrices.
M M y KBAo o= − −2 1θ (2.35)
30
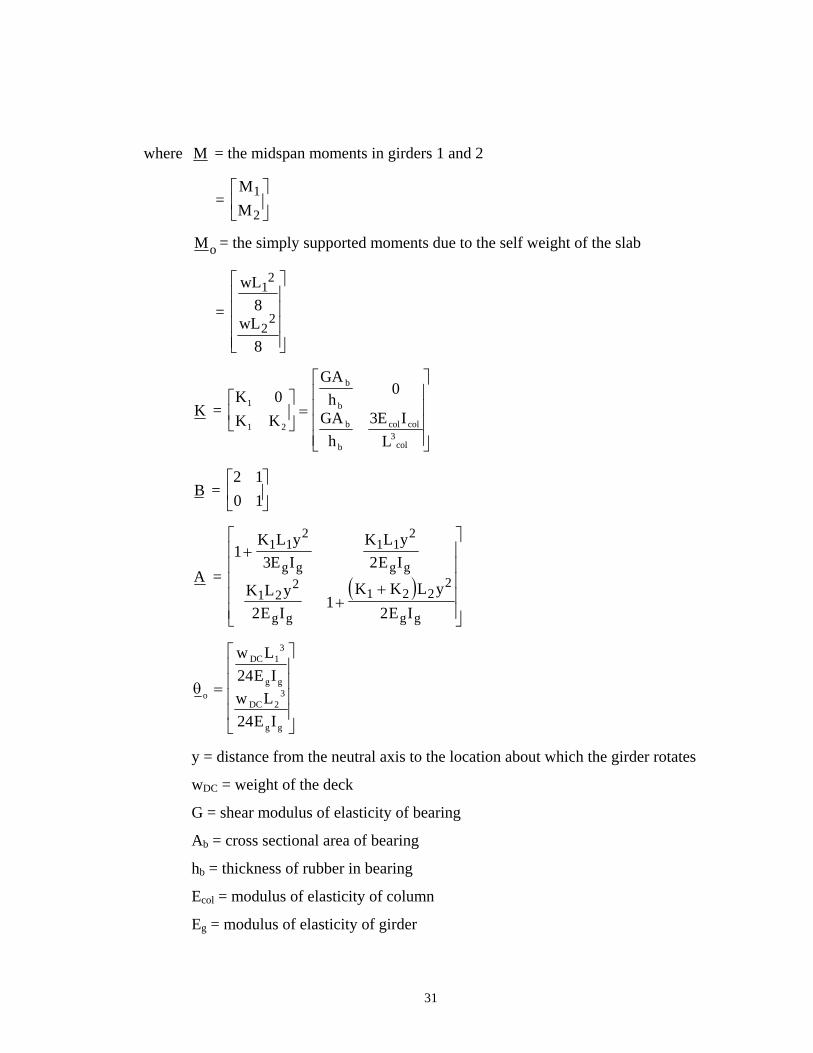
where M = the midspan moments in girders 1 and 2
= MM
1
2
⎡
⎣⎢
⎤
⎦⎥
Mo = the simply supported moments due to the self weight of the slab
=
wL
wL
12
22
8
8
⎡
⎣
⎢⎢⎢⎢
⎤
⎦
⎥⎥⎥⎥
K = KK K
GAh
GAh
E IL
b
b
b
b
col col
col
1
1 23
0 0
3⎡
⎣⎢
⎤
⎦⎥ =
⎡
⎣
⎢⎢⎢⎢
⎤
⎦
⎥⎥⎥⎥
B = 2 10 1
⎡
⎣⎢
⎤
⎦⎥
A = ( )1
3 2
21
2
1 12
1 12
1 22
1 2 22
+
++
⎡
⎣
⎢⎢⎢⎢⎢
⎤
⎦
⎥⎥⎥⎥⎥
K L yE I
K L yE I
K L yE I
K K L yE I
g g g g
g g g g
θo
DC
g g
DC
g g
w LE I
w LE I
=
⎡
⎣
⎢⎢⎢⎢
⎤
⎦
⎥⎥⎥⎥
13
23
24
24
y = distance from the neutral axis to the location about which the girder rotates
wDC = weight of the deck
G = shear modulus of elasticity of bearing
Ab = cross sectional area of bearing
hb = thickness of rubber in bearing
Ecol = modulus of elasticity of column
Eg = modulus of elasticity of girder
31
Icol = moment of inertia of column
Ig = moment of inertia of girder
Lcol = length of column
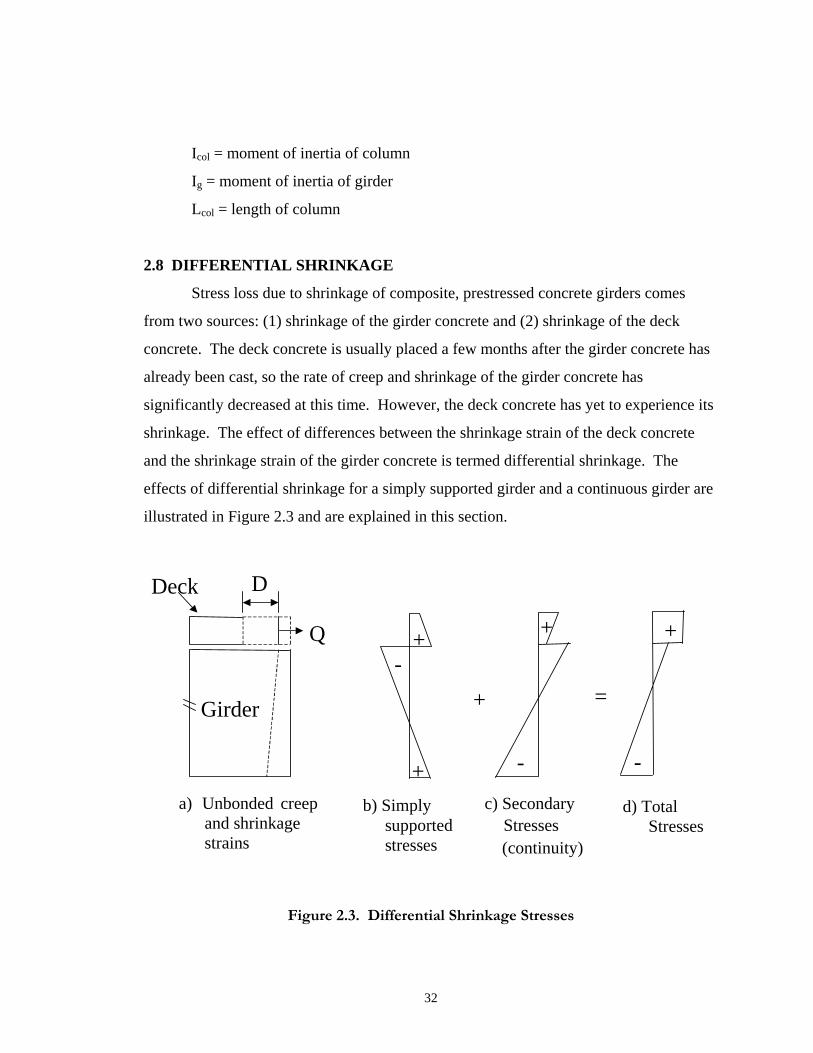
2.8 DIFFERENTIAL SHRINKAGE
Stress loss due to shrinkage of composite, prestressed concrete girders comes
from two sources: (1) shrinkage of the girder concrete and (2) shrinkage of the deck
concrete. The deck concrete is usually placed a few months after the girder concrete has
already been cast, so the rate of creep and shrinkage of the girder concrete has
significantly decreased at this time. However, the deck concrete has yet to experience its
shrinkage. The effect of differences between the shrinkage strain of the deck concrete
and the shrinkage strain of the girder concrete is termed differential shrinkage. The
effects of differential shrinkage for a simply supported girder and a continuous girder are
illustrated in Figure 2.3 and are explained in this section.
Girder
Q
DDeck
+-
+ -
+ +
-
+ =
a) Unbonded creep and shrinkage strains
b) Simply supported stresses
c) Secondary Stresses
d) Total Stresses
(continuity)
Figure 2.3. Differential Shrinkage Stresses
32
The effect of differential shrinkage on concrete stress is first calculated for the
basic case of elastic assumptions and a statically determinate girder (Section 2.8.1). The
calculations are then extended to account for creep and for continuity (Section 2.8.2).
The procedure followed to calculate the change in prestress due to differential shrinkage
is described in Section 2.8.3.
2.8.1 Statically-Determinate Girders
The effect of differential shrinkage can be estimated by superimposing two load
cases. In the first case, fictitious restraint forces are applied to the deck (at its centroid)
to inhibit shrinkage-induced displacements. This fictitious force is calculated as
Q A Ed d d sh= − ε (2.36)
where Qd = restraint force
Ad = cross-sectional area of deck
Ed = modulus of elasticity of deck concrete
εsh = free shrinkage strain
In this case, the strain is zero in the deck and girder, but the stress in the deck is
equal to . The deck and girder are assumed to be attached in shear, without slip,
prior to any deck shrinkage. The total shrinkage of the girder may be ignored for these
purposes, because it causes only a shortening of the composite system and, in the case of
a girder that is not restrained by its supports from translating, no forces are introduced.
Thus only the difference in shrinkage strains between the deck and girder concrete needs
to be applied to the deck.
− εsh dE
This restraint force (Qd) cannot exist in practice so in the second load case, an
equal and opposite force is applied to the composite deck and girder system at the level
of the centroid of the deck. This force causes an axial strain at the composite centroid
and a curvature given by
33
( )εad
comp
QEA
=−
(2.37)
( )φ =− Q eEI
d d
comp (2.38)
where εa = axial strain at centroid of composite system caused by differential shrinkage
(EA)comp = axial stiffness of composite system
φ = curvature of composite system caused by differential shrinkage
ed = distance from centroid of composite system to centroid of deck
(EI)comp = flexural stiffness of composite system
By superimposing the two load cases, the stress in the deck at a vertical location y is
( ) ( )f y E yc d sh a= − + +ε ε φ (2.39)
and the stress in the girder is
( ) ( )f y E yc g a= +ε φ (2.40)
where Eg = Young’s modulus of girder concrete
fc(y) = stress at vertical location y due to deck shrinkage
y = vertical coordinate
The sign convention used in Equations 2.36 to 2.40 is that all distances are
measured positive downwards from the centroid of the composite system, and that
tension stress and strain are positive. Thus, for example, ed and εsh are both negative
quantities. The stress distribution for the simply supported girder is shown in Figure
2.3b.
34
In the previous calculations, girder shrinkage was neglected, because in general, it
will be small. Most of this shrinkage has already occurred by the time the deck was cast.
One could include girder shrinkage by replacing εsh with εsh - εshgirder, where εshgirder is the
girder shrinkage.
In practice, some creep will occur over time and will reduce the stresses induced
by the differential shrinkage. The stresses are induced in the girder when the concrete in
it is relatively old, so the girder creep is likely to be significantly less than the deck creep.
If the girder creep is ignored, the calculations in Equations 2.36 to 2.39 can be modified
to account for deck creep by using an age-adjusted modulus, Eadj, in place of Ed, where
Eadj = Ed/(1+Cc), and Cc = creep coefficient.
2.8.2 Secondary Stresses
If the girder is continuous, additional stresses are induced as a result of the
secondary moments that are generated in the girder. The secondary moment in a
three-span girder (with equal end spans) can be calculated as follows
M Q eDS d d' = λ (2.41)
where M’DS = secondary moment
λ = L L
L L
1 2
1 223
+
+⎛⎝⎜
⎞⎠⎟
= 1.14 for the SR18/SR516
L1 = length of spans 1 and 3
L2 = length of Span 2
The secondary stresses (fcsec) in the deck, shown in Figure 2.3c, at a vertical location y
are
35

( )f yM y
IEEc
DS
c
adj
gsec
'=
⎛
⎝⎜⎜
⎞
⎠⎟⎟ (2.42)
and the secondary stress in the girder is
( )f yM y
IcDS
csec
'= (2.43)
where fcsec = stress due to secondary moment
Ic = moment of inertia of composite section
The total change in concrete stress resulting from differential shrinkage that is
induced in a composite girder is the sum of the simply supported stresses (Equations 2.39
and 2.40) and the secondary moment stresses (Equations 2.42 and 2.43) respectively.
2.8.3 Change in Prestress
The change in prestress due to differential shrinkage is calculated as
∆ ∆f fEEpDS cgpDF
p
g= (2.44)
where ∆fpDS = change in prestress due to differential shrinkage
∆fcgpDS = change in concrete stress at cgp due to differential shrinkage
= ( )E eM e
Ig a pDS p
cε φ+ +
'
ep = distance from neutral axis to center of gravity of prestressing strand
Ep = modulus of elasticity of prestressing strand
φ = curvature (Equation 2.38)
36

2.9 REDUCED RELAXATION COEFFICIENT
In a prestressed girder, the strain in the prestressing strand reduces due to creep
and shrinkage in the girder concrete. This reduction in strain leads to a reduction in
strand stress. Therefore the relaxation in a prestressed girder should therefore be smaller
than the intrinsic relaxation of the strand. This reduced relaxation value can be estimated
using Equation 2.45 (Ghali 1994).
∆ ∆f p RE r p RE, ,= χ f (2.45)
where ∆f p RE, = reduced relaxation value
χ r = reduction coefficient
= ( ) ( )1
1 0 40 4
2
0
1−
− −−
⎛
⎝⎜⎜
⎞
⎠⎟⎟∫ Ωξ
Ωξλλ
ξ.
.d
( )Ω
∆ ∆=
−f t ff
p CRSH p RE
pe
, ,
∆fpCRSH = change in strand stress due to creep and shrinkage
fpe = effective prestressing force
λ =ff
pe
pu
fpu = characteristic tensile strength of prestressing strand
The concept for this reduction coefficient was developed in 1978 (Ghali et al.
1978) when low-relaxation strand was not readily available and relaxation represented a
significant proportion of the total loss. The low-relaxation strand that is widely used
today leads to lower relaxation losses, in which case, the reduction coefficient is less
important.
37
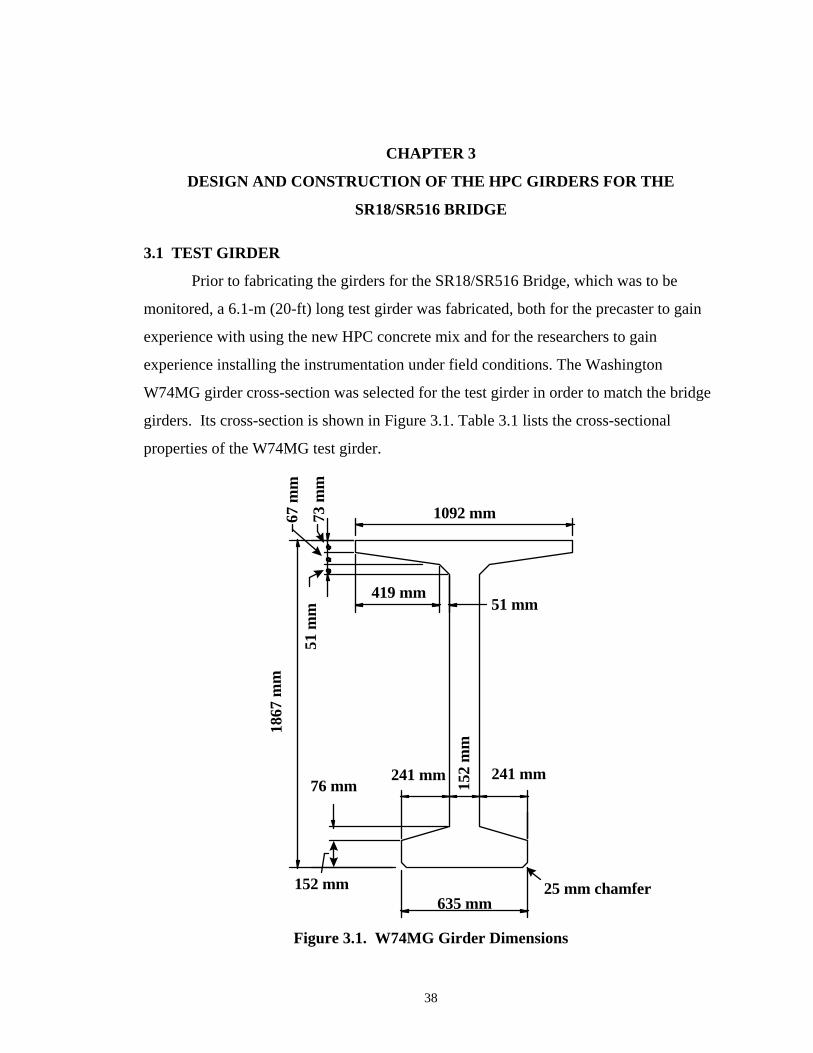
CHAPTER 3
DESIGN AND CONSTRUCTION OF THE HPC GIRDERS FOR THE
SR18/SR516 BRIDGE 3.1 TEST GIRDER
Prior to fabricating the girders for the SR18/SR516 Bridge, which was to be
monitored, a 6.1-m (20-ft) long test girder was fabricated, both for the precaster to gain
experience with using the new HPC concrete mix and for the researchers to gain
experience installing the instrumentation under field conditions. The Washington
W74MG girder cross-section was selected for the test girder in order to match the bridge
girders. Its cross-section is shown in Figure 3.1. Table 3.1 lists the cross-sectional
properties of the W74MG test girder.
25 mm chamfer635 mm
241 mm 152
mm
241 mm
1867
mm
1092 mm
152 mm
76 mm
419 mm51 mm
73 m
m
67 m
m51
mm
Figure 3.1. W74MG Girder Dimensions
38
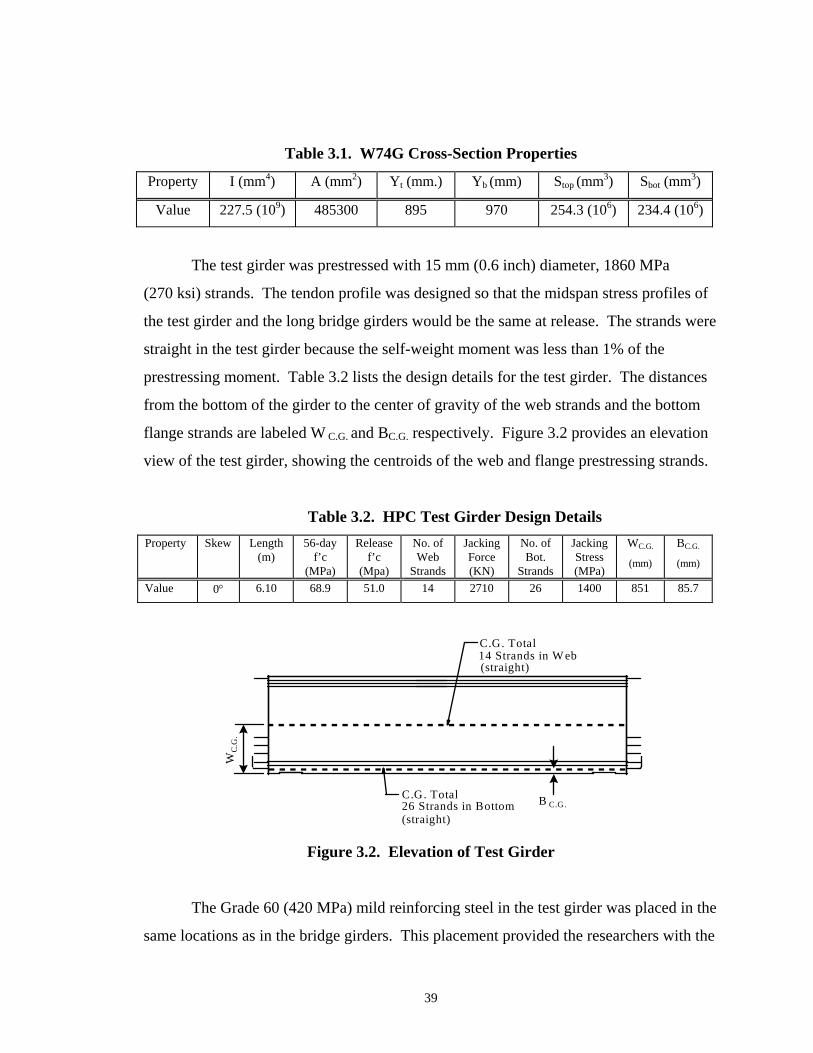
Table 3.1. W74G Cross-Section Properties
Property I (mm4) A (mm2) Yt (mm.) Yb (mm) Stop (mm3) Sbot (mm3)
Value 227.5 (109) 485300 895 970 254.3 (106) 234.4 (106)
The test girder was prestressed with 15 mm (0.6 inch) diameter, 1860 MPa
(270 ksi) strands. The tendon profile was designed so that the midspan stress profiles of
the test girder and the long bridge girders would be the same at release. The strands were
straight in the test girder because the self-weight moment was less than 1% of the
prestressing moment. Table 3.2 lists the design details for the test girder. The distances
from the bottom of the girder to the center of gravity of the web strands and the bottom
flange strands are labeled W C.G. and BC.G. respectively. Figure 3.2 provides an elevation
view of the test girder, showing the centroids of the web and flange prestressing strands.
Table 3.2. HPC Test Girder Design Details Property Skew Length
(m) 56-day
f’c (MPa)
Release f’c
(Mpa)
No. of Web
Strands
Jacking Force (KN)
No. of Bot.
Strands
Jacking Stress (MPa)
WC.G.
(mm)
BC.G.
(mm)
Value 0° 6.10 68.9 51.0 14 2710 26 1400 851 85.7
C.G. Total14 Strands in W eb(straight)
C.G. Total26 Strands in Bottom(straight)
WC
.G.
B C.G.
Figure 3.2. Elevation of Test Girder
The Grade 60 (420 MPa) mild reinforcing steel in the test girder was placed in the
same locations as in the bridge girders. This placement provided the researchers with the
39
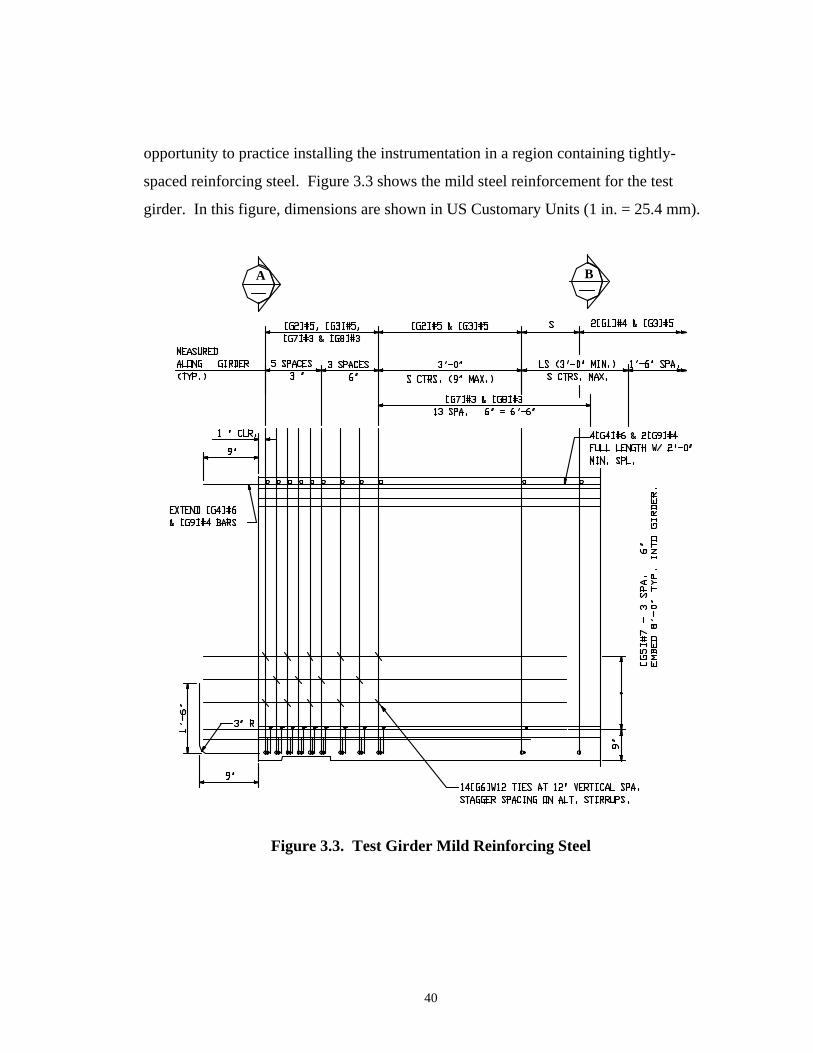
opportunity to practice installing the instrumentation in a region containing tightly-
spaced reinforcing steel. Figure 3.3 shows the mild steel reinforcement for the test
girder. In this figure, dimensions are shown in US Customary Units (1 in. = 25.4 mm).
A B
Figure 3.3. Test Girder Mild Reinforcing Steel
40
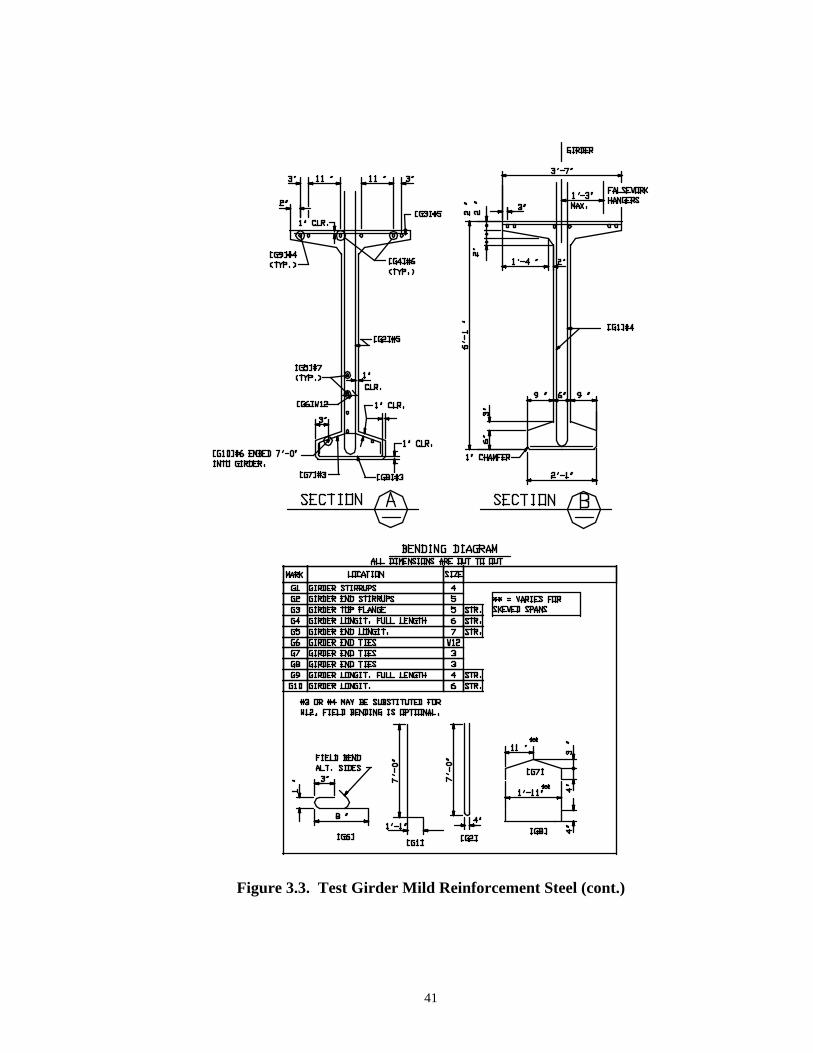
Figure 3.3. Test Girder Mild Reinforcement Steel (cont.)
41
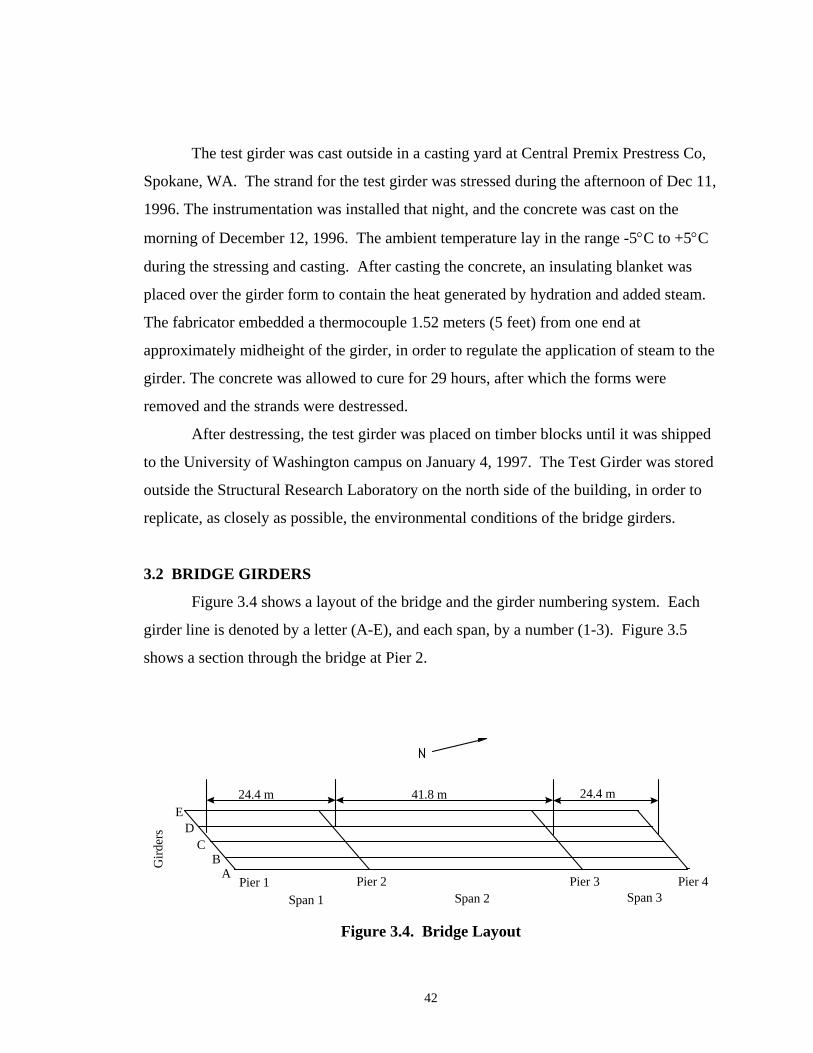
The test girder was cast outside in a casting yard at Central Premix Prestress Co,
Spokane, WA. The strand for the test girder was stressed during the afternoon of Dec 11,
1996. The instrumentation was installed that night, and the concrete was cast on the
morning of December 12, 1996. The ambient temperature lay in the range -5°C to +5°C
during the stressing and casting. After casting the concrete, an insulating blanket was
placed over the girder form to contain the heat generated by hydration and added steam.
The fabricator embedded a thermocouple 1.52 meters (5 feet) from one end at
approximately midheight of the girder, in order to regulate the application of steam to the
girder. The concrete was allowed to cure for 29 hours, after which the forms were
removed and the strands were destressed.
After destressing, the test girder was placed on timber blocks until it was shipped
to the University of Washington campus on January 4, 1997. The Test Girder was stored
outside the Structural Research Laboratory on the north side of the building, in order to
replicate, as closely as possible, the environmental conditions of the bridge girders.
3.2 BRIDGE GIRDERS
Figure 3.4 shows a layout of the bridge and the girder numbering system. Each
girder line is denoted by a letter (A-E), and each span, by a number (1-3). Figure 3.5
shows a section through the bridge at Pier 2.
Span 1 Span 2 Span 3
24.4 m 41.8 m 24.4 m
Pier 1 Pier 2 Pier 3 Pier 4AB
CD
E
Gird
ers
Figure 3.4. Bridge Layout
42
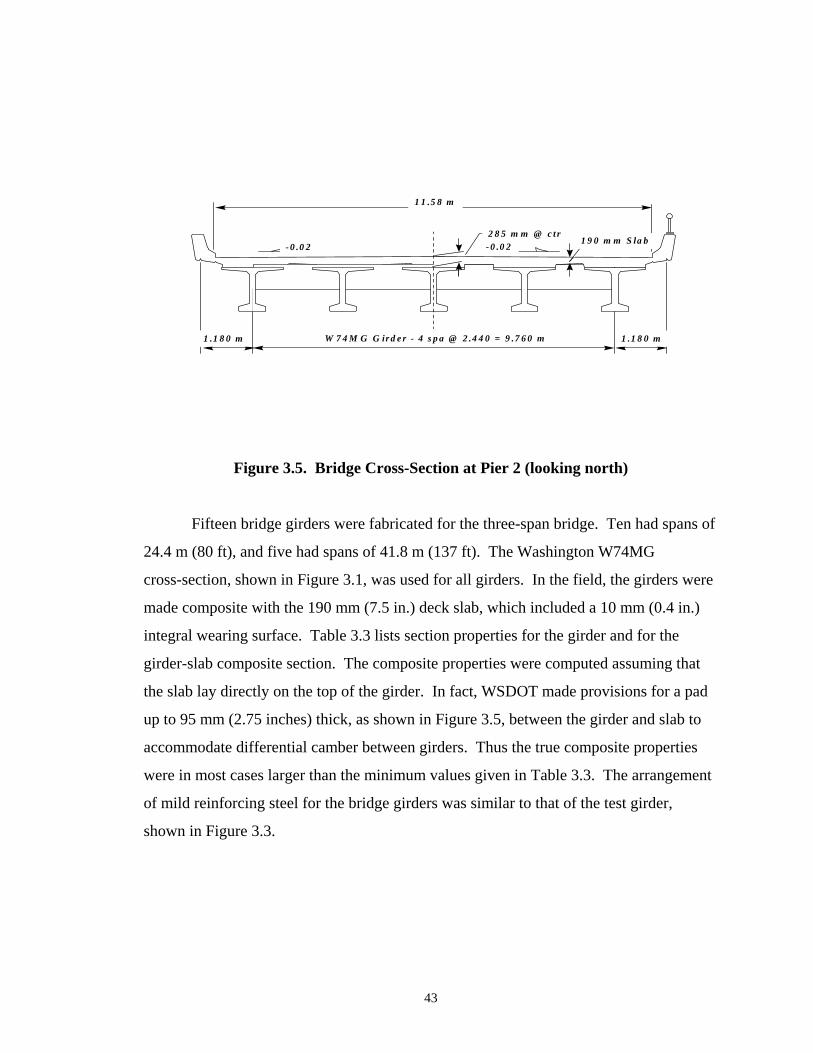
1 .1 8 0 m W 7 4 M G G ir d e r - 4 s p a @ 2 .4 4 0 = 9 .7 6 0 m
1 1 .5 8 m
- 0 .0 2 - 0 .0 21 9 0 m m S la b
2 8 5 m m @ c t r
1 .1 8 0 m
Figure 3.5. Bridge Cross-Section at Pier 2 (looking north)
Fifteen bridge girders were fabricated for the three-span bridge. Ten had spans of
24.4 m (80 ft), and five had spans of 41.8 m (137 ft). The Washington W74MG
cross-section, shown in Figure 3.1, was used for all girders. In the field, the girders were
made composite with the 190 mm (7.5 in.) deck slab, which included a 10 mm (0.4 in.)
integral wearing surface. Table 3.3 lists section properties for the girder and for the
girder-slab composite section. The composite properties were computed assuming that
the slab lay directly on the top of the girder. In fact, WSDOT made provisions for a pad
up to 95 mm (2.75 inches) thick, as shown in Figure 3.5, between the girder and slab to
accommodate differential camber between girders. Thus the true composite properties
were in most cases larger than the minimum values given in Table 3.3. The arrangement
of mild reinforcing steel for the bridge girders was similar to that of the test girder,
shown in Figure 3.3.
43
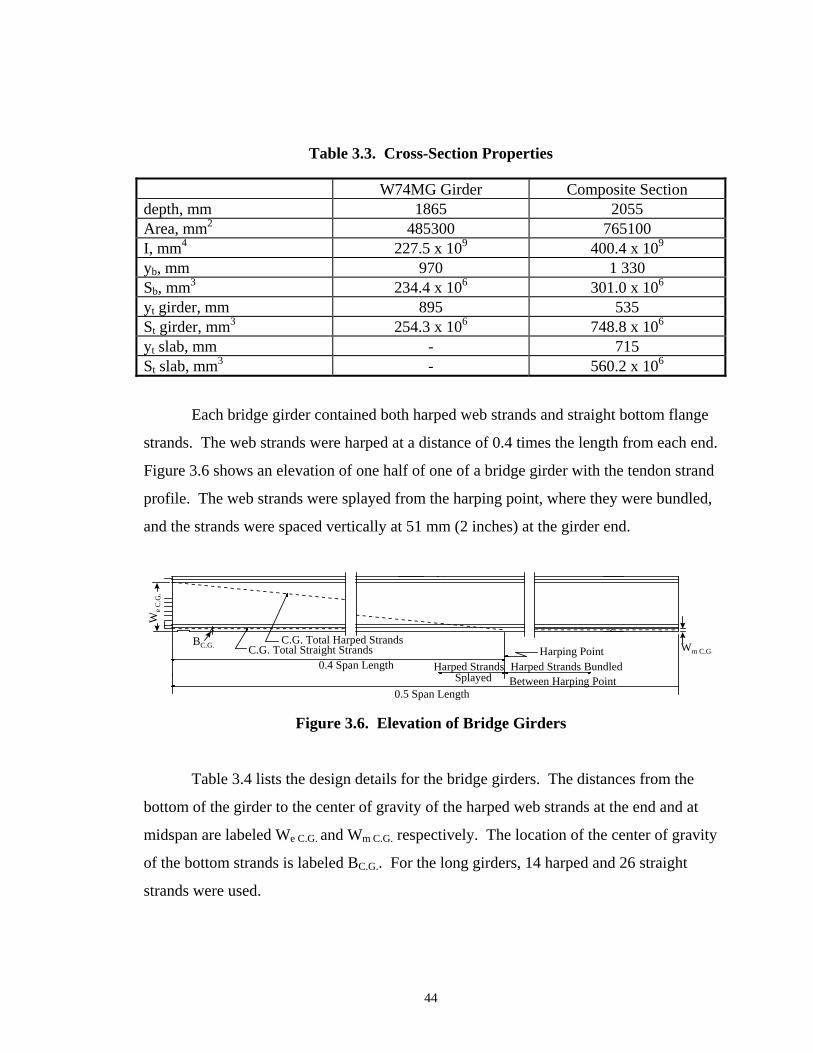
Table 3.3. Cross-Section Properties W74MG Girder Composite Section depth, mm 1865 2055 Area, mm2 485300 765100 I, mm4 227.5 x 10⁹ 400.4 x 10⁹
yb, mm 970 1 330 Sb, mm3 234.4 x 10⁶ 301.0 x 10⁶
yt girder, mm 895 535 St girder, mm3 254.3 x 10⁶ 748.8 x 10⁶
yt slab, mm - 715 St slab, mm3 - 560.2 x 10⁶
Each bridge girder contained both harped web strands and straight bottom flange
strands. The web strands were harped at a distance of 0.4 times the length from each end.
Figure 3.6 shows an elevation of one half of one of a bridge girder with the tendon strand
profile. The web strands were splayed from the harping point, where they were bundled,
and the strands were spaced vertically at 51 mm (2 inches) at the girder end.
Harping PointHarped Strands
SplayedHarped Strands BundledBetween Harping Point
C.G. Total Harped StrandsC.G. Total Straight Strands
0.5 Span Length
0.4 Span Length
We
C.G
.
BC.G. Wm C.G.
Figure 3.6. Elevation of Bridge Girders
Table 3.4 lists the design details for the bridge girders. The distances from the
bottom of the girder to the center of gravity of the harped web strands at the end and at
midspan are labeled We C.G. and Wm C.G. respectively. The location of the center of gravity
of the bottom strands is labeled BC.G.. For the long girders, 14 harped and 26 straight
strands were used.
44
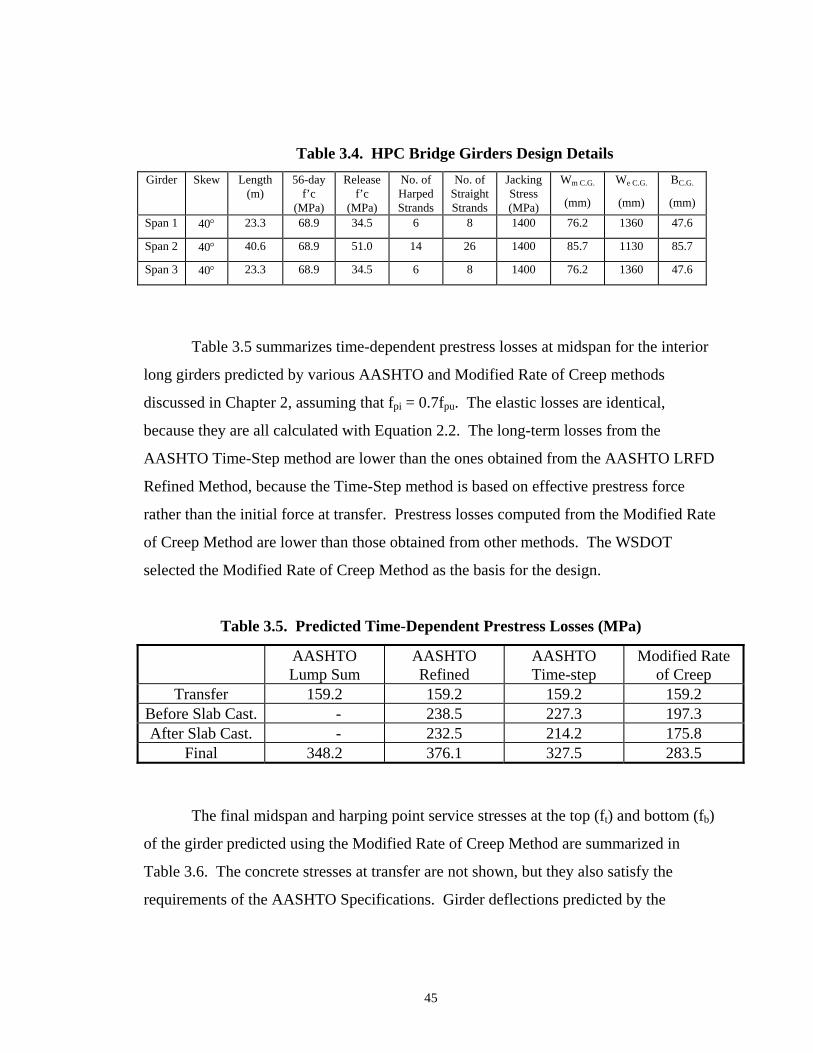
Table 3.4. HPC Bridge Girders Design Details Girder Skew Length
(m) 56-day
f’c (MPa)
Release f’c
(MPa)
No. of Harped Strands
No. of Straight Strands
Jacking Stress (MPa)
Wm C.G.
(mm)
We C.G.
(mm)
BC.G.
(mm)
Span 1 40° 23.3 68.9 34.5 6 8 1400 76.2 1360 47.6
Span 2 40° 40.6 68.9 51.0 14 26 1400 85.7 1130 85.7
Span 3 40° 23.3 68.9 34.5 6 8 1400 76.2 1360 47.6
Table 3.5 summarizes time-dependent prestress losses at midspan for the interior
long girders predicted by various AASHTO and Modified Rate of Creep methods
discussed in Chapter 2, assuming that fpi = 0.7fpu. The elastic losses are identical,
because they are all calculated with Equation 2.2. The long-term losses from the
AASHTO Time-Step method are lower than the ones obtained from the AASHTO LRFD
Refined Method, because the Time-Step method is based on effective prestress force
rather than the initial force at transfer. Prestress losses computed from the Modified Rate
of Creep Method are lower than those obtained from other methods. The WSDOT
selected the Modified Rate of Creep Method as the basis for the design.
Table 3.5. Predicted Time-Dependent Prestress Losses (MPa)
AASHTO Lump Sum
AASHTO Refined
AASHTO Time-step
Modified Rate of Creep
Transfer 159.2 159.2 159.2 159.2 Before Slab Cast. - 238.5 227.3 197.3 After Slab Cast. - 232.5 214.2 175.8
Final 348.2 376.1 327.5 283.5
The final midspan and harping point service stresses at the top (ft) and bottom (fb)
of the girder predicted using the Modified Rate of Creep Method are summarized in
Table 3.6. The concrete stresses at transfer are not shown, but they also satisfy the
requirements of the AASHTO Specifications. Girder deflections predicted by the
45

Modified Rate of Creep Method are presented in Table 3.7. WSDOT does not allow any
tension in its girders under service conditions.
Table 3.6. Summary of Predicted Concrete Stresses at Service
At Midspan At Harping Point Stress Type (MPa) fb ft(girder) ft(slab) fb ft(girder) ft(slab) Girder 10.15 -9.35 - 9.74 -8.98 - Slab + haunch 12.26 -11.30 - 11.77 -10.85 - Diaphragm 1.41 -1.30 - 1.27 -1.17 - Traffic barrier 1.85 -0.74 -0.99 1.77 -0.71 -0.95 ΣDL 25.67 -22.69 -0.99 24.55 -21.71 -0.95 LL - Service I - -4.73 -6.33 - -4.58 -6.12 LL - Service III 9.42 - - 9.11 - - Prestressing -35.98 8.66 - -35.98 8.66 - Total Stress under permanent load
-
-14.03
-0.99
-
-13.04
-0.95
Allowable - -31.05 -12.60 - -31.05 -12.60 Total Stress under all loads
-0.89
-18.76
-7.32
-2.32
-17.62
-7.07
Allowable 0.00 -41.40 -16.80 0.00 -41.40 -16.80 Note: Tension (+)
Table 3.7. Predicted Girder Deflection
Total Deflection (mm) At Transfer -80 Before Slab Casting -107 After Slab Casting -56 Final -44
The long girders were cast individually on a 61.0 m (200 ft) long casting bed.
After they were cast, the bed was reconfigured and the short girders were cast in it,
end-to-end, in pairs. The steam curing arrangements were the same as in the Test Girder
except that, in Girder 2B, the thermocouple was located approximately 508 mm
46
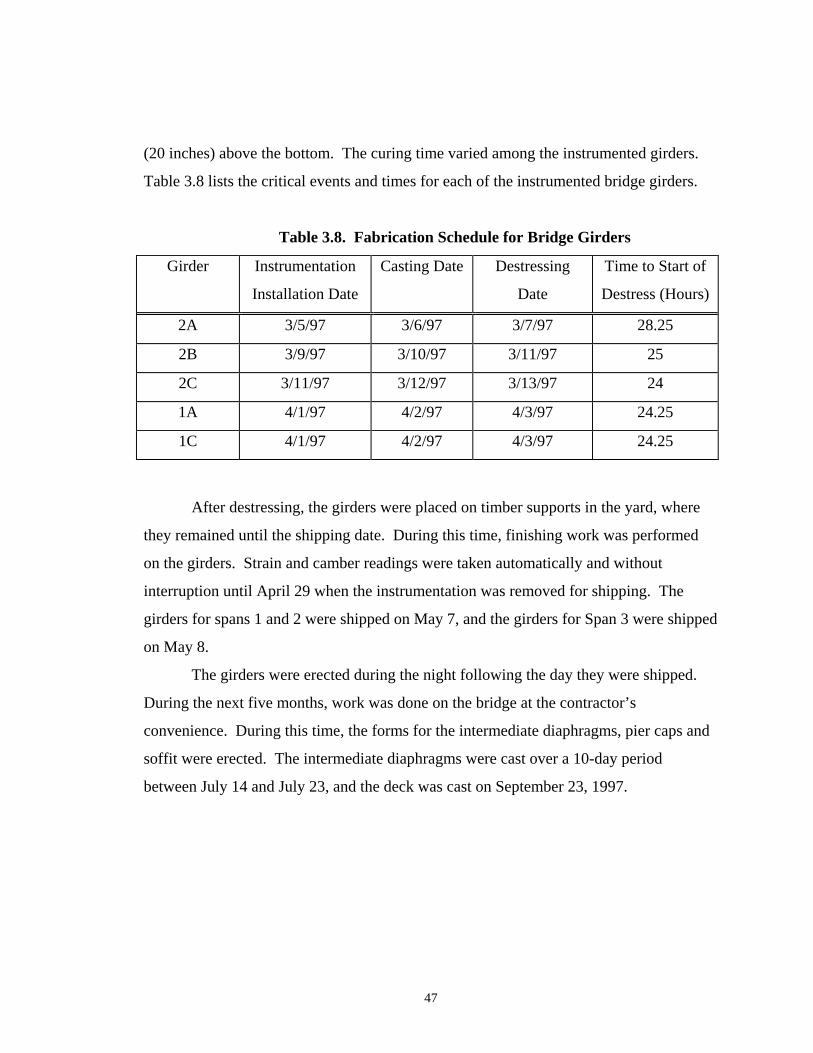
(20 inches) above the bottom. The curing time varied among the instrumented girders.
Table 3.8 lists the critical events and times for each of the instrumented bridge girders.
Table 3.8. Fabrication Schedule for Bridge Girders
Girder Instrumentation
Installation Date
Casting Date Destressing
Date
Time to Start of
Destress (Hours)
2A 3/5/97 3/6/97 3/7/97 28.25
2B 3/9/97 3/10/97 3/11/97 25
2C 3/11/97 3/12/97 3/13/97 24
1A 4/1/97 4/2/97 4/3/97 24.25
1C 4/1/97 4/2/97 4/3/97 24.25
After destressing, the girders were placed on timber supports in the yard, where
they remained until the shipping date. During this time, finishing work was performed
on the girders. Strain and camber readings were taken automatically and without
interruption until April 29 when the instrumentation was removed for shipping. The
girders for spans 1 and 2 were shipped on May 7, and the girders for Span 3 were shipped
on May 8.
The girders were erected during the night following the day they were shipped.
During the next five months, work was done on the bridge at the contractor’s
convenience. During this time, the forms for the intermediate diaphragms, pier caps and
soffit were erected. The intermediate diaphragms were cast over a 10-day period
between July 14 and July 23, and the deck was cast on September 23, 1997.
47
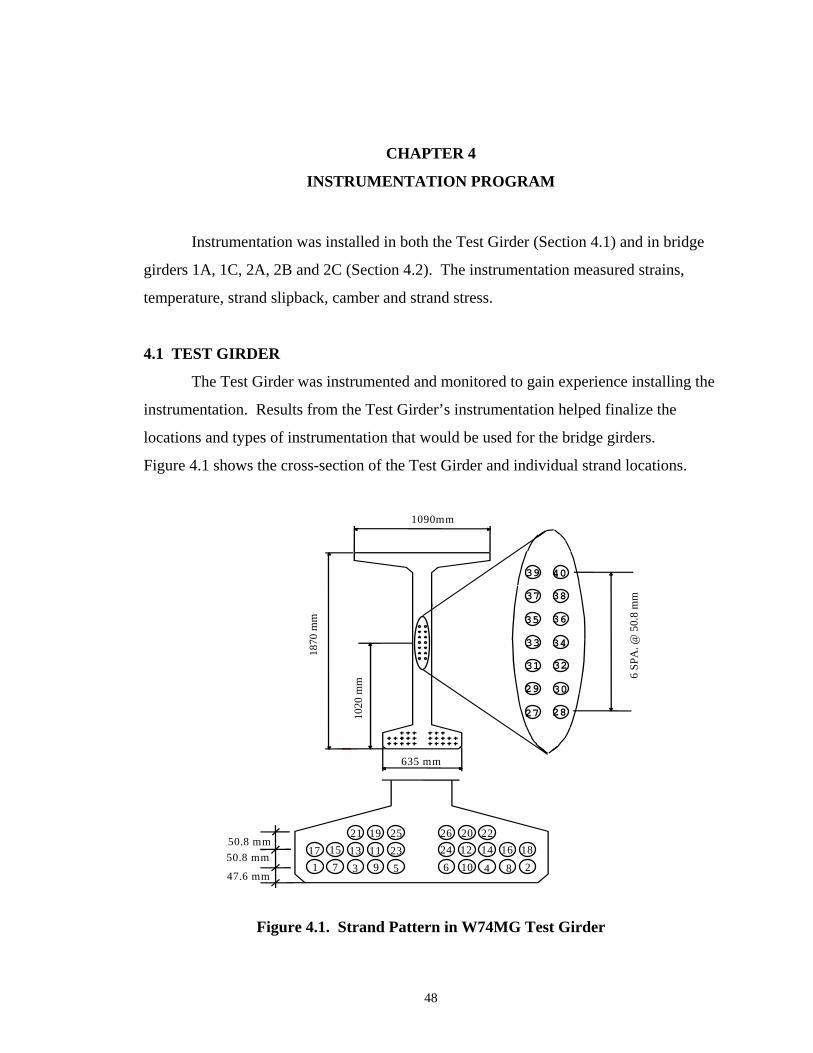
CHAPTER 4
INSTRUMENTATION PROGRAM
Instrumentation was installed in both the Test Girder (Section 4.1) and in bridge
girders 1A, 1C, 2A, 2B and 2C (Section 4.2). The instrumentation measured strains,
temperature, strand slipback, camber and strand stress.
4.1 TEST GIRDER
The Test Girder was instrumented and monitored to gain experience installing the
instrumentation. Results from the Test Girder’s instrumentation helped finalize the
locations and types of instrumentation that would be used for the bridge girders.
Figure 4.1 shows the cross-section of the Test Girder and individual strand locations.
27 28
29 30
31 32
33 34
35 36
37 38
39 40
1090mm
21 19 2517 15 13 11 231 7 3 9 5
635 mm
26 20 2224 12 14 16 186 10 4 8 2
1870
mm
1020
mm
6 SP
A. @
50.
8 m
m
47.6 mm
50.8 mm50.8 mm
Figure 4.1. Strand Pattern in W74MG Test Girder
48
4.1.1 Concrete Strains and Temperatures
Vibrating-wire strain gages were embedded in the Test Girder to monitor both
temperatures and longitudinal strains. They were selected because of their history of
long-term reliability. These gages (Geokon model VCE-4200, 152 mm (6 inch) gage
length) were embedded at midspan and 1.52 meters (5 feet) from one end. The layout of
the midspan gages is shown in Figure 4.2. The instrumentation layout at the 1.52 meter
(5 foot) location was identical to the one at midspan except that the LW and UW gages
were omitted. In addition, a vibrating-wire strain gage was embedded in each of two 152
x 305 mm (6 x 12 inch) cylinders to monitor curing temperatures and for gage
calibration.
Two vibrating-wire strain gages (BL and BR) were embedded in the bottom
flange of the girder. To secure the gages in place, they were attached with nylon cable
ties to a 9.53 mm (3/8 inch) diameter U-shaped section of reinforcement. Before casting,
the U-shaped reinforcement was tied to the existing prestressed strands within the girder.
At midspan, three gages (LW, MW and UW) were placed at the quarter points
over the height of the girder. The gages at midheight of the girder (MW), both at
midspan and near the end, were attached to a U-shaped piece of reinforcement and then
tied to the prestressing strand in the web of the girder. The remaining two gages (LW
and UW) were attached to a welded grid of four pieces of #3 reinforcing bar. Figure 4.3
shows the dimensions of the welded rebar grid. The grids were tied to the vertical
stirrups in the girder. The grids made it possible for researchers to attach the gages
accurately and fast.
49
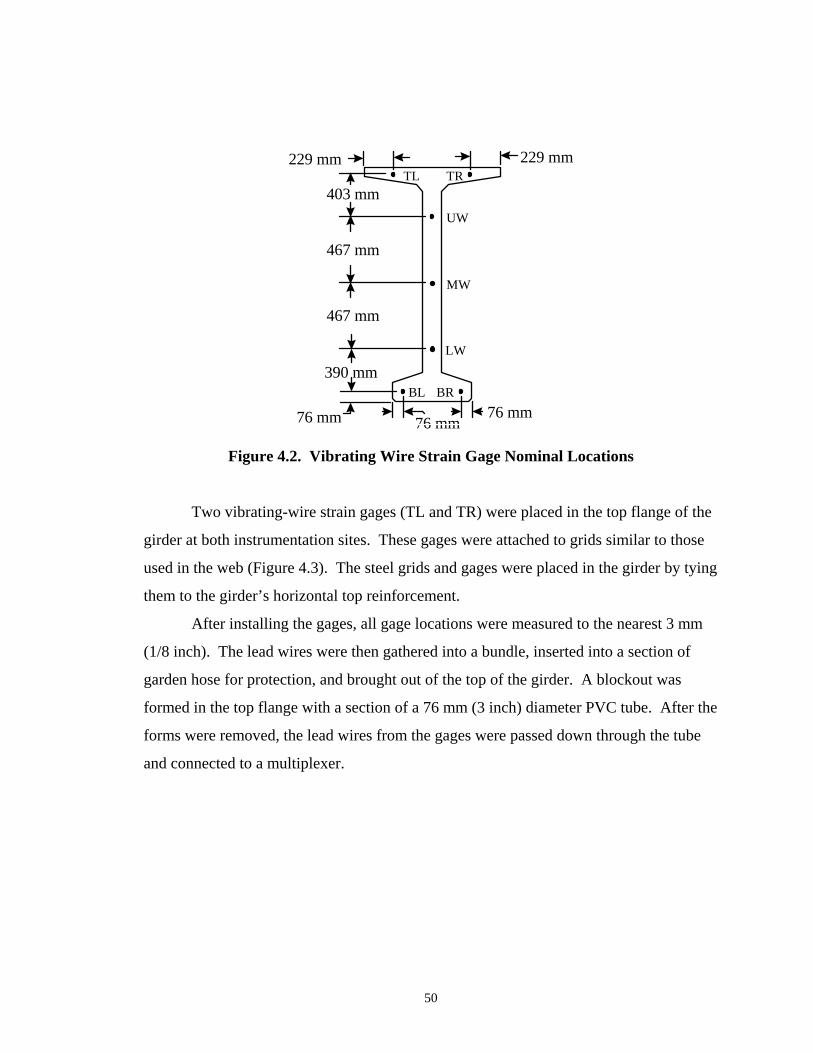
76 mm76 mm76 mm
229 mm
390 mm
467 mm
467 mm
403 mm
229 mm
BL BR
LW
MW
UW
TL TR
Figure 4.2. Vibrating Wire Strain Gage Nominal Locations
Two vibrating-wire strain gages (TL and TR) were placed in the top flange of the
girder at both instrumentation sites. These gages were attached to grids similar to those
used in the web (Figure 4.3). The steel grids and gages were placed in the girder by tying
them to the girder’s horizontal top reinforcement.
After installing the gages, all gage locations were measured to the nearest 3 mm
(1/8 inch). The lead wires were then gathered into a bundle, inserted into a section of
garden hose for protection, and brought out of the top of the girder. A blockout was
formed in the top flange with a section of a 76 mm (3 inch) diameter PVC tube. After the
forms were removed, the lead wires from the gages were passed down through the tube
and connected to a multiplexer.
50
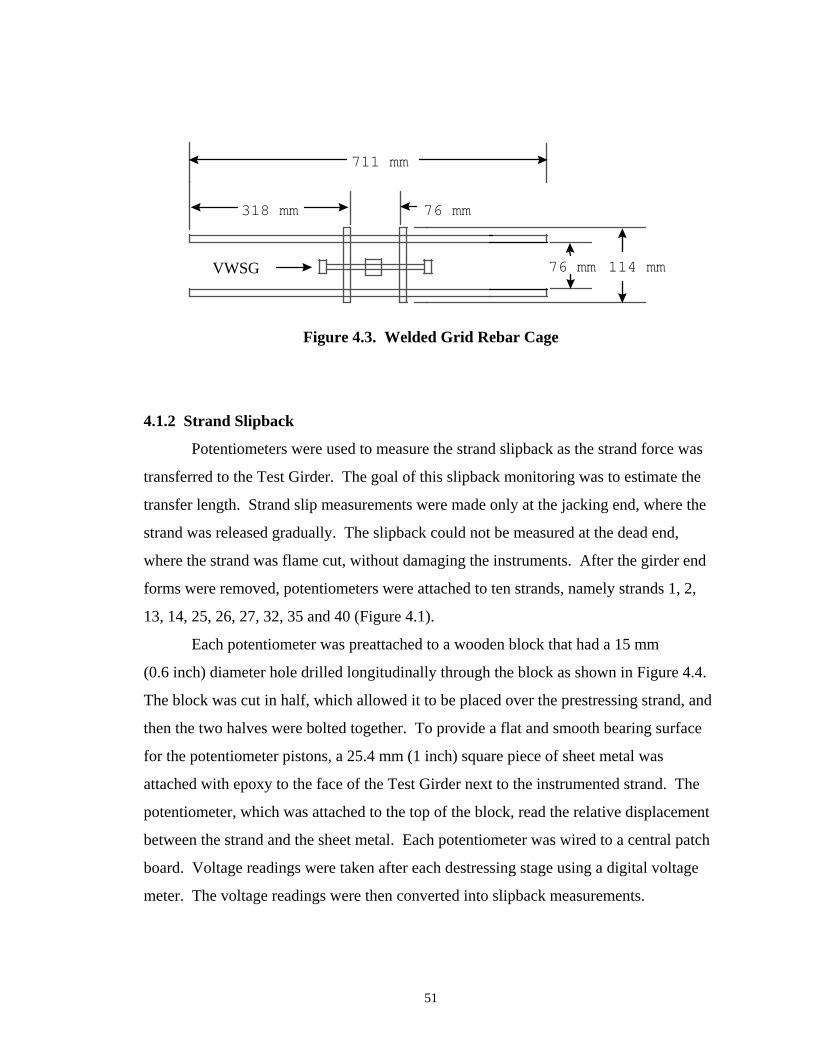
711 mm
318 mm 76 mm
76 mm 114 mmVWSG
Figure 4.3. Welded Grid Rebar Cage
4.1.2 Strand Slipback
Potentiometers were used to measure the strand slipback as the strand force was
transferred to the Test Girder. The goal of this slipback monitoring was to estimate the
transfer length. Strand slip measurements were made only at the jacking end, where the
strand was released gradually. The slipback could not be measured at the dead end,
where the strand was flame cut, without damaging the instruments. After the girder end
forms were removed, potentiometers were attached to ten strands, namely strands 1, 2,
13, 14, 25, 26, 27, 32, 35 and 40 (Figure 4.1).
Each potentiometer was preattached to a wooden block that had a 15 mm
(0.6 inch) diameter hole drilled longitudinally through the block as shown in Figure 4.4.
The block was cut in half, which allowed it to be placed over the prestressing strand, and
then the two halves were bolted together. To provide a flat and smooth bearing surface
for the potentiometer pistons, a 25.4 mm (1 inch) square piece of sheet metal was
attached with epoxy to the face of the Test Girder next to the instrumented strand. The
potentiometer, which was attached to the top of the block, read the relative displacement
between the strand and the sheet metal. Each potentiometer was wired to a central patch
board. Voltage readings were taken after each destressing stage using a digital voltage
meter. The voltage readings were then converted into slipback measurements.
51
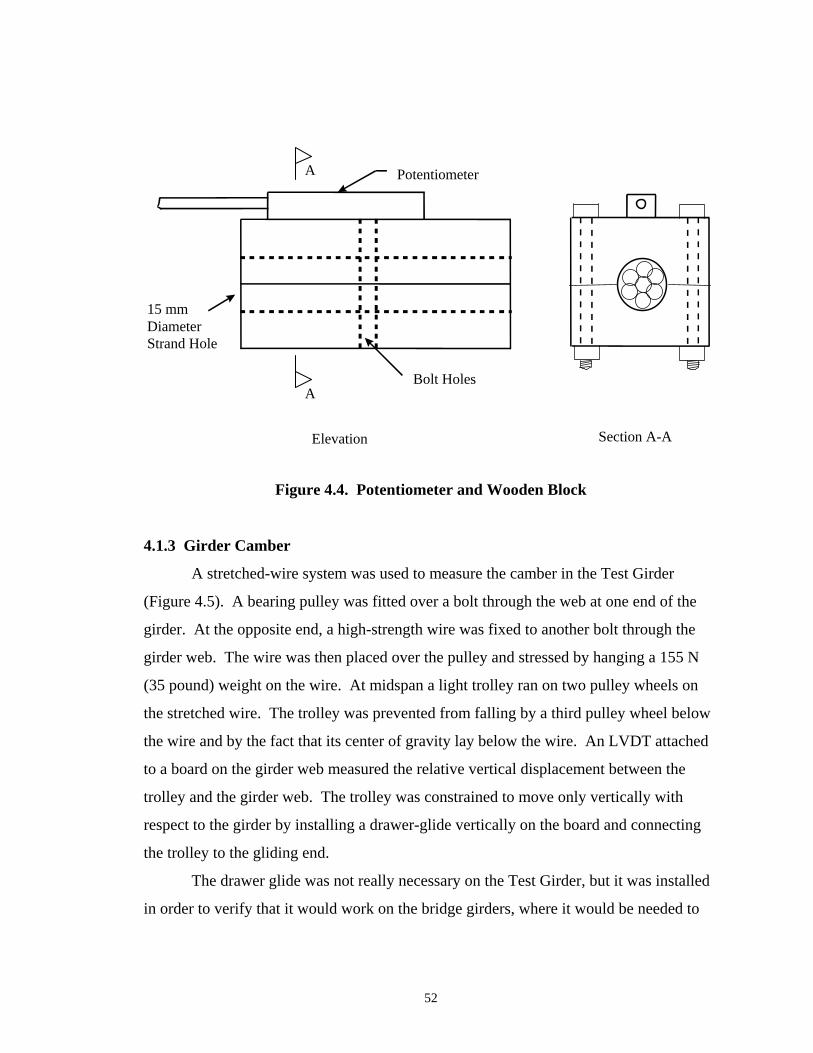
Potentiometer
Bolt Holes
15 mm DiameterStrand Hole
Elevation Section A-A
A
A
Figure 4.4. Potentiometer and Wooden Block
4.1.3 Girder Camber
A stretched-wire system was used to measure the camber in the Test Girder
(Figure 4.5). A bearing pulley was fitted over a bolt through the web at one end of the
girder. At the opposite end, a high-strength wire was fixed to another bolt through the
girder web. The wire was then placed over the pulley and stressed by hanging a 155 N
(35 pound) weight on the wire. At midspan a light trolley ran on two pulley wheels on
the stretched wire. The trolley was prevented from falling by a third pulley wheel below
the wire and by the fact that its center of gravity lay below the wire. An LVDT attached
to a board on the girder web measured the relative vertical displacement between the
trolley and the girder web. The trolley was constrained to move only vertically with
respect to the girder by installing a drawer-glide vertically on the board and connecting
the trolley to the gliding end.
The drawer glide was not really necessary on the Test Girder, but it was installed
in order to verify that it would work on the bridge girders, where it would be needed to
52
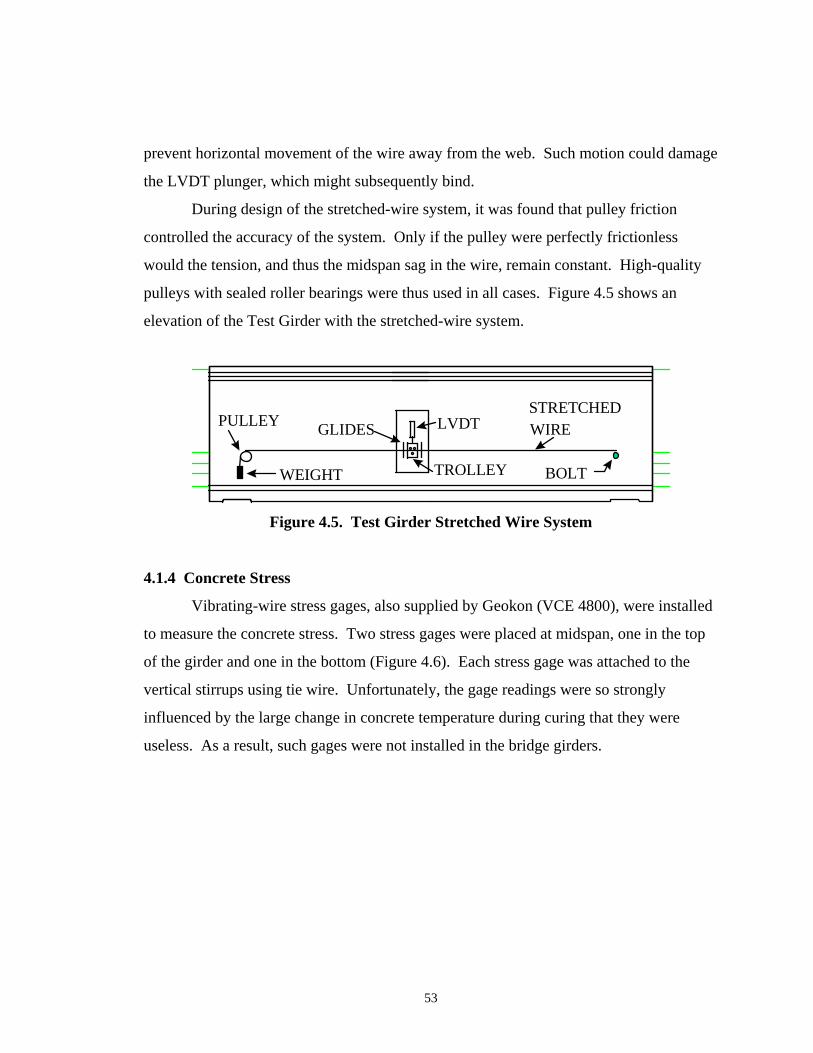
prevent horizontal movement of the wire away from the web. Such motion could damage
the LVDT plunger, which might subsequently bind.
During design of the stretched-wire system, it was found that pulley friction
controlled the accuracy of the system. Only if the pulley were perfectly frictionless
would the tension, and thus the midspan sag in the wire, remain constant. High-quality
pulleys with sealed roller bearings were thus used in all cases. Figure 4.5 shows an
elevation of the Test Girder with the stretched-wire system.
STRETCHED WIRE
WEIGHT
PULLEY
BOLTTROLLEY
LVDTGLIDES
Figure 4.5. Test Girder Stretched Wire System
4.1.4 Concrete Stress
Vibrating-wire stress gages, also supplied by Geokon (VCE 4800), were installed
to measure the concrete stress. Two stress gages were placed at midspan, one in the top
of the girder and one in the bottom (Figure 4.6). Each stress gage was attached to the
vertical stirrups using tie wire. Unfortunately, the gage readings were so strongly
influenced by the large change in concrete temperature during curing that they were
useless. As a result, such gages were not installed in the bridge girders.
53
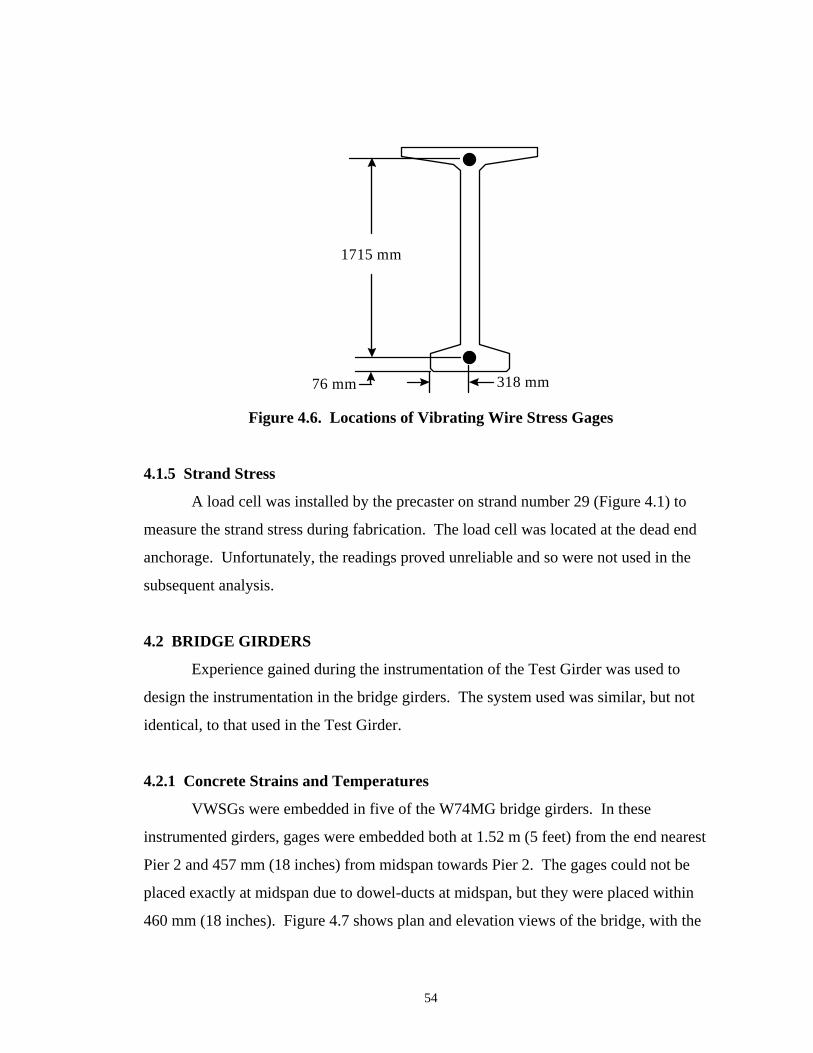
318 mm
1715 mm
76 mm Figure 4.6. Locations of Vibrating Wire Stress Gages
4.1.5 Strand Stress
A load cell was installed by the precaster on strand number 29 (Figure 4.1) to
measure the strand stress during fabrication. The load cell was located at the dead end
anchorage. Unfortunately, the readings proved unreliable and so were not used in the
subsequent analysis.
4.2 BRIDGE GIRDERS
Experience gained during the instrumentation of the Test Girder was used to
design the instrumentation in the bridge girders. The system used was similar, but not
identical, to that used in the Test Girder.
4.2.1 Concrete Strains and Temperatures
VWSGs were embedded in five of the W74MG bridge girders. In these
instrumented girders, gages were embedded both at 1.52 m (5 feet) from the end nearest
Pier 2 and 457 mm (18 inches) from midspan towards Pier 2. The gages could not be
placed exactly at midspan due to dowel-ducts at midspan, but they were placed within
460 mm (18 inches). Figure 4.7 shows plan and elevation views of the bridge, with the
54
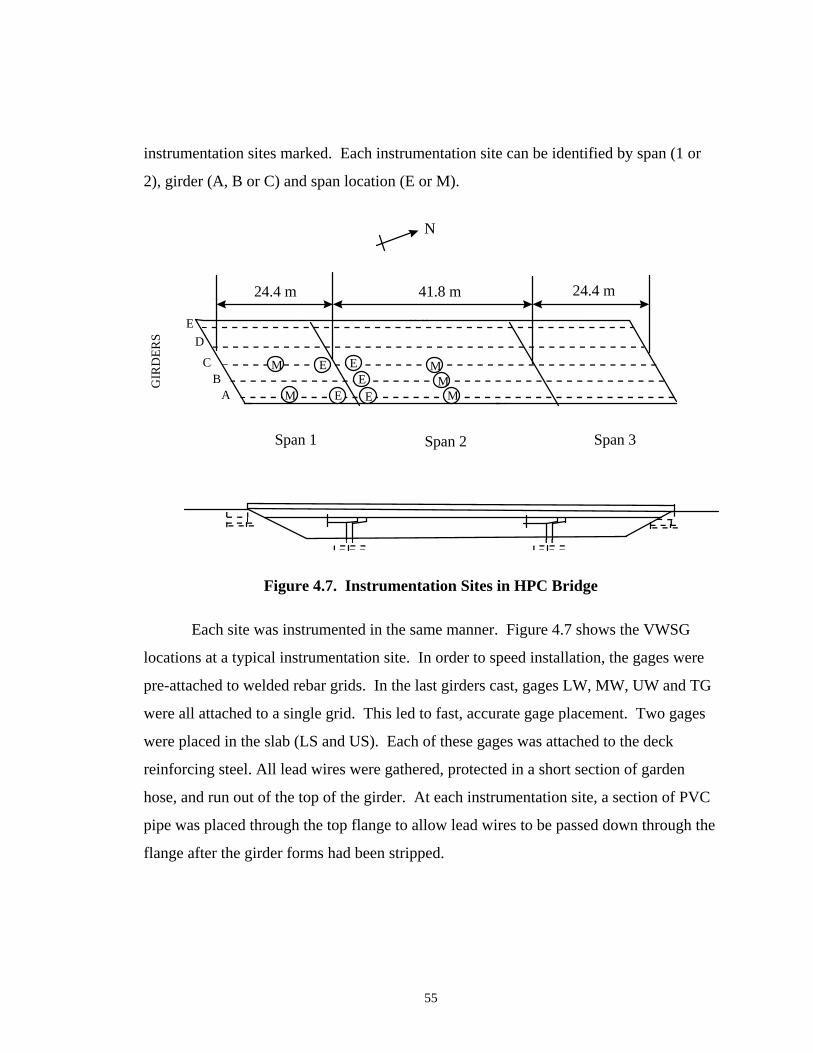
instrumentation sites marked. Each instrumentation site can be identified by span (1 or
2), girder (A, B or C) and span location (E or M).
N
AB
C
DE
GIR
DER
S
Span 1 Span 2 Span 3
M
M
E
E EE
E
MM
M
24.4 m 41.8 m 24.4 m
Figure 4.7. Instrumentation Sites in HPC Bridge
Each site was instrumented in the same manner. Figure 4.7 shows the VWSG
locations at a typical instrumentation site. In order to speed installation, the gages were
pre-attached to welded rebar grids. In the last girders cast, gages LW, MW, UW and TG
were all attached to a single grid. This led to fast, accurate gage placement. Two gages
were placed in the slab (LS and US). Each of these gages was attached to the deck
reinforcing steel. All lead wires were gathered, protected in a short section of garden
hose, and run out of the top of the girder. At each instrumentation site, a section of PVC
pipe was placed through the top flange to allow lead wires to be passed down through the
flange after the girder forms had been stripped.
55
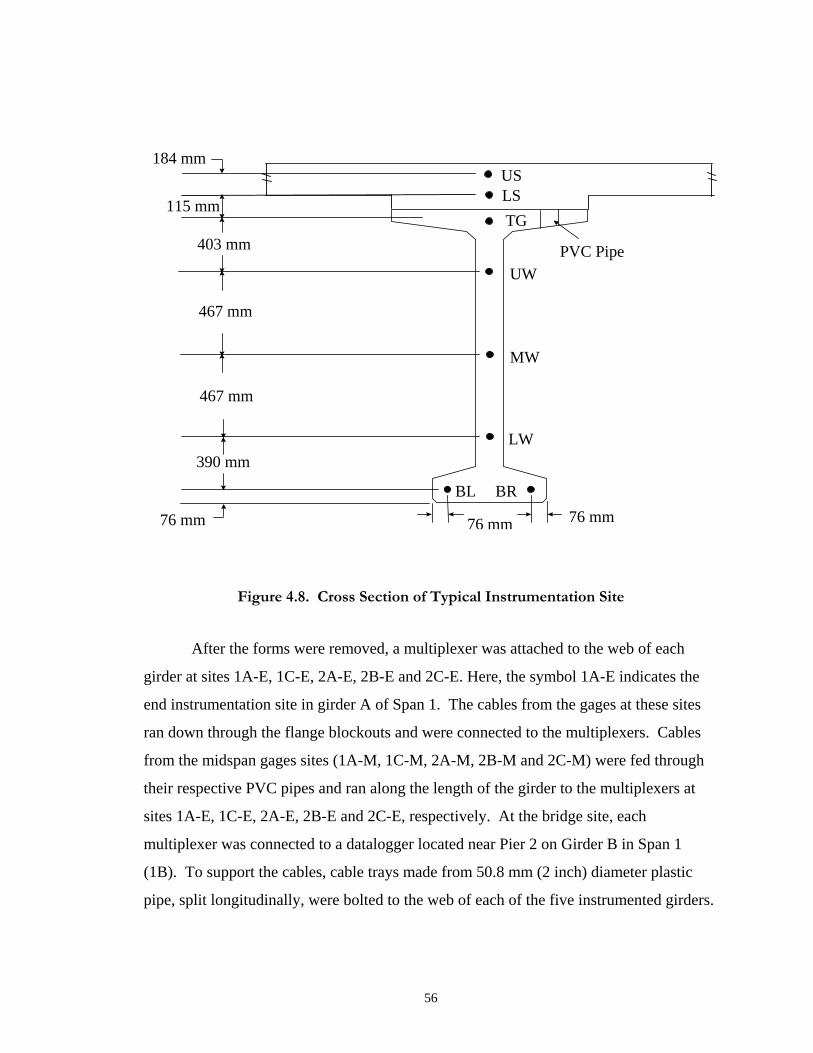
76 mm76 mm76 mm
467 mm
467 mm
403 mm
BL BR
LW
MW
UW
TG
PVC Pipe
390 mm
LSUS
115 mm
184 mm
Figure 4.8. Cross Section of Typical Instrumentation Site
After the forms were removed, a multiplexer was attached to the web of each
girder at sites 1A-E, 1C-E, 2A-E, 2B-E and 2C-E. Here, the symbol 1A-E indicates the
end instrumentation site in girder A of Span 1. The cables from the gages at these sites
ran down through the flange blockouts and were connected to the multiplexers. Cables
from the midspan gages sites (1A-M, 1C-M, 2A-M, 2B-M and 2C-M) were fed through
their respective PVC pipes and ran along the length of the girder to the multiplexers at
sites 1A-E, 1C-E, 2A-E, 2B-E and 2C-E, respectively. At the bridge site, each
multiplexer was connected to a datalogger located near Pier 2 on Girder B in Span 1
(1B). To support the cables, cable trays made from 50.8 mm (2 inch) diameter plastic
pipe, split longitudinally, were bolted to the web of each of the five instrumented girders.
56
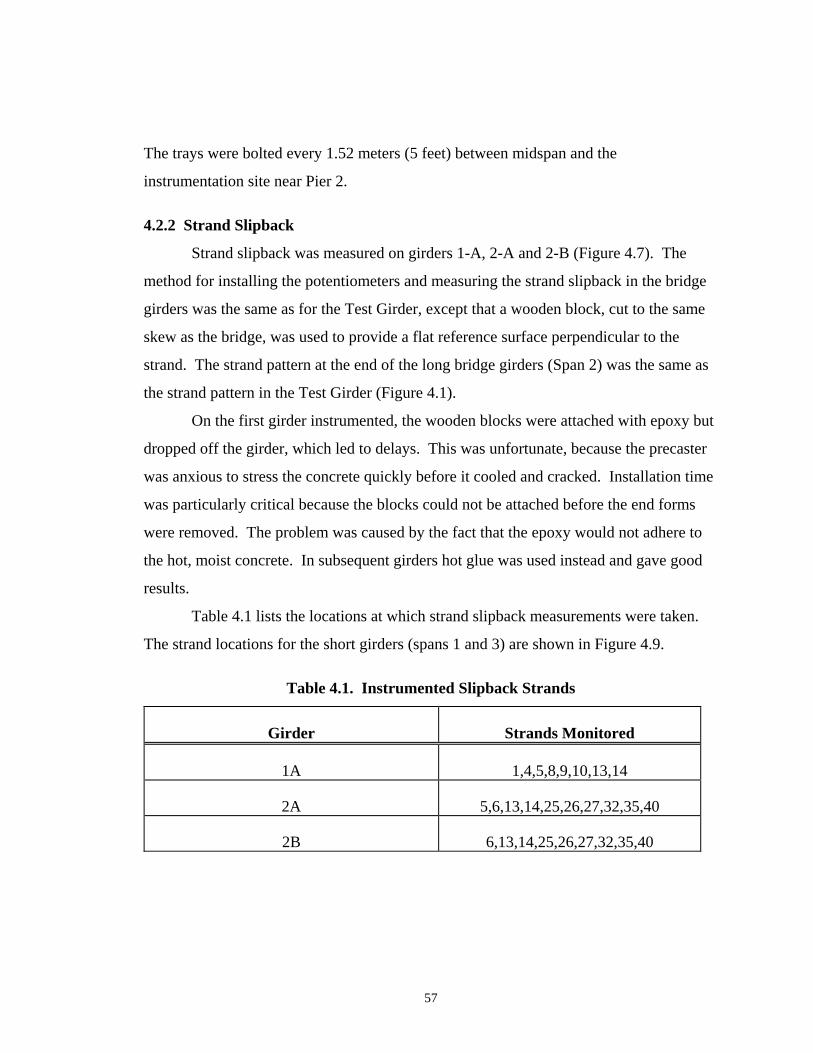
The trays were bolted every 1.52 meters (5 feet) between midspan and the
instrumentation site near Pier 2.
4.2.2 Strand Slipback
Strand slipback was measured on girders 1-A, 2-A and 2-B (Figure 4.7). The
method for installing the potentiometers and measuring the strand slipback in the bridge
girders was the same as for the Test Girder, except that a wooden block, cut to the same
skew as the bridge, was used to provide a flat reference surface perpendicular to the
strand. The strand pattern at the end of the long bridge girders (Span 2) was the same as
the strand pattern in the Test Girder (Figure 4.1).
On the first girder instrumented, the wooden blocks were attached with epoxy but
dropped off the girder, which led to delays. This was unfortunate, because the precaster
was anxious to stress the concrete quickly before it cooled and cracked. Installation time
was particularly critical because the blocks could not be attached before the end forms
were removed. The problem was caused by the fact that the epoxy would not adhere to
the hot, moist concrete. In subsequent girders hot glue was used instead and gave good
results.
Table 4.1 lists the locations at which strand slipback measurements were taken.
The strand locations for the short girders (spans 1 and 3) are shown in Figure 4.9.
Table 4.1. Instrumented Slipback Strands
Girder Strands Monitored
1A 1,4,5,8,9,10,13,14
2A 5,6,13,14,25,26,27,32,35,40
2B 6,13,14,25,26,27,32,35,40
57
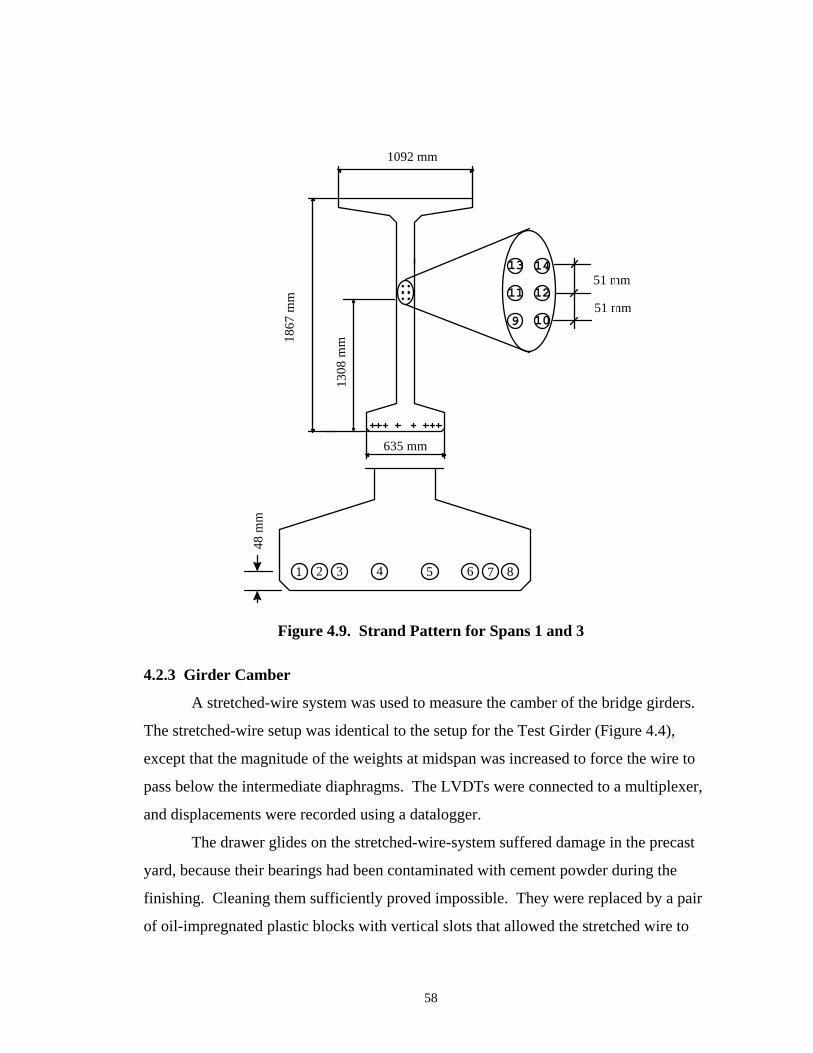
9 10
11 12
13 14
635 mm
1092 mm
1867
mm
1 2 3 4 5 6 7 8
48 m
m
51 mm
51 mm
1308
mm
Figure 4.9. Strand Pattern for Spans 1 and 3
4.2.3 Girder Camber
A stretched-wire system was used to measure the camber of the bridge girders.
The stretched-wire setup was identical to the setup for the Test Girder (Figure 4.4),
except that the magnitude of the weights at midspan was increased to force the wire to
pass below the intermediate diaphragms. The LVDTs were connected to a multiplexer,
and displacements were recorded using a datalogger.
The drawer glides on the stretched-wire-system suffered damage in the precast
yard, because their bearings had been contaminated with cement powder during the
finishing. Cleaning them sufficiently proved impossible. They were replaced by a pair
of oil-impregnated plastic blocks with vertical slots that allowed the stretched wire to
58
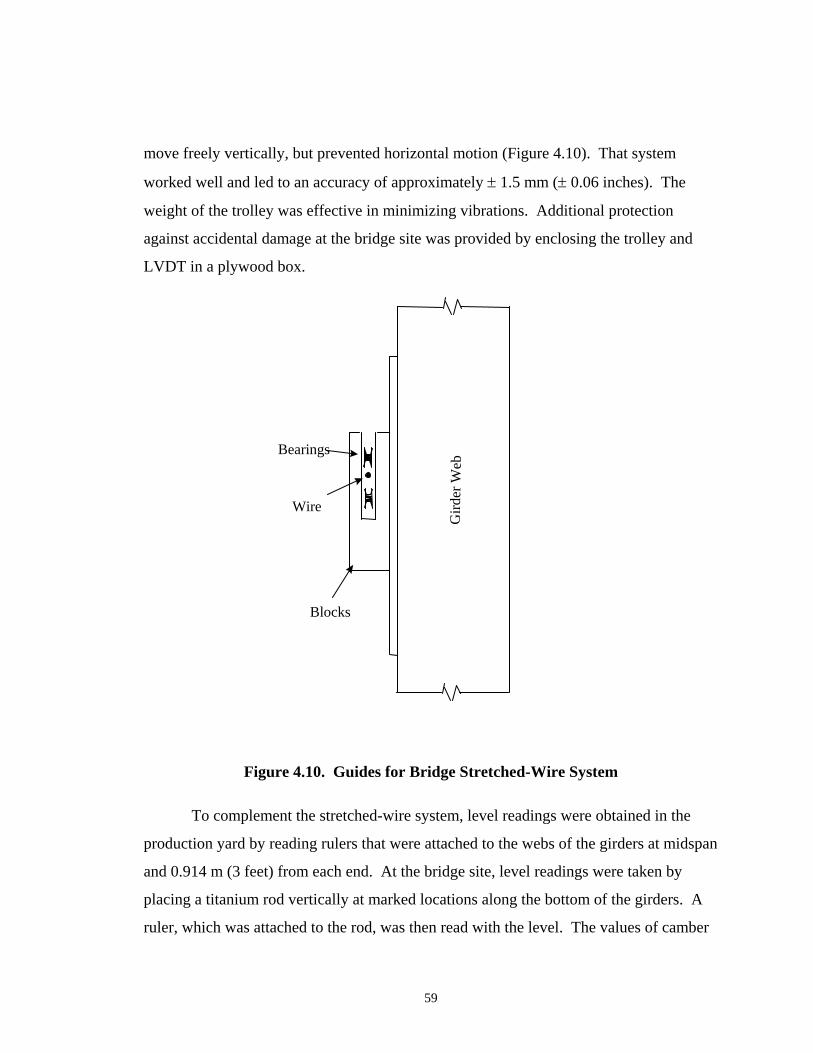
move freely vertically, but prevented horizontal motion (Figure 4.10). That system
worked well and led to an accuracy of approximately ± 1.5 mm (± 0.06 inches). The
weight of the trolley was effective in minimizing vibrations. Additional protection
against accidental damage at the bridge site was provided by enclosing the trolley and
LVDT in a plywood box.
Gird
er W
e b
Blocks
Wire
Bearings
Figure 4.10. Guides for Bridge Stretched-Wire System
To complement the stretched-wire system, level readings were obtained in the
production yard by reading rulers that were attached to the webs of the girders at midspan
and 0.914 m (3 feet) from each end. At the bridge site, level readings were taken by
placing a titanium rod vertically at marked locations along the bottom of the girders. A
ruler, which was attached to the rod, was then read with the level. The values of camber
59
calculated from these readings were adjusted using the girder’s deflection curve to
compensate for the fact that the readings were not taken exactly at the end of the girders.
Readings at the bridge site were always taken between 6 A.M. and 8 A.M. in order to
minimize the effects of temperature.
At the bridge site, the level produced readings that were repeatable to ± 1 mm
(± 0.04 inches). In the casting yard, access to the girders was more difficult and,
particularly for the readings taken at destressing, the accuracy was almost certainly not as
good.
4.2.4 Strand Stress
A load cell was used by the fabricator to measure the strand stress during
fabrication. One load cell was attached to strand number 29 (Figure 4.1) in each of the
long-span girders (Span 2) and to strand number 9 (Figure 4.8) in the two short girders
(Span 1). In each case the load cell was placed directly behind the strand chuck at the
dead end anchor. Unfortunately, the readings proved too unreliable to be used.
4.3 GAGE PREPARATION
Prior to casting, calibration tests were performed on the VWSGs, stress gages,
potentiometers and LVDTs. All calibration tests were performed in air only, except for
the VWSGs, which were calibrated in both air and concrete. The air calibration numbers
for each gage closely matched the calibration number given by the manufacturers. The
calibration test for the VWSG embedded in a 152 x 304 mm (6 x 12 inch) cylinder
proved inaccurate due to the end effects on the cylinder.
Each gage was tagged with an individual label and color to help facilitate field
instrumentation and monitoring. Field manuals were made for each type of
instrumentation location. These manuals had matching tags, which were marked next to
a figure identifying gage locations within the girders. The instrumentation team
practiced using these manuals and gages on a 1.83 meter (6 foot) mock-up of the girder
reinforcing cage. Steel was placed in every location that would be encountered in the
60

field in an effort to discover any problems prior to field installation. Photographs were
taken of the installed gages in the mock-up and then placed in the manuals to help
provide a visual picture of how the gages would be installed in the girder. This was
necessary because the same installation team members were not available for all girders.
4.4 MONITORING PROGRAM
During fabrication, the jacking stress, release stress, and strand slipback were
measured for the Test Girder and five bridge girders. Temperature, strain distributions at
midspan and 1.52 meter (5 foot) locations, and midspan camber were monitored during
fabrication. Monitoring continued at the bridge site for three years from the time of
girder fabrication.
4.4.1 Concrete Strains and Temperatures
Concrete strain and temperature were monitored using vibrating-wire strain
gages. Table 4.2 shows the frequency of strain and temperature readings in the Test
Girder and production girders.
Table 4.2. Frequency of Strain and Temperature Readings
Girder Time Reading Interval
Until Destress 15 minutes
Test During Destress 1 minute
Girder Until Approximately 6 Months After Casting 1 hour
As Long As Possible 6 hours
Until Destress 15 minutes
Production During Destress 1 minute
Girders Until 6 Months After Casting of Deck 1 hour
At 6 Months After Casting of Deck intense 36 hour
monitoring
Until End Of Project 6 hours
61
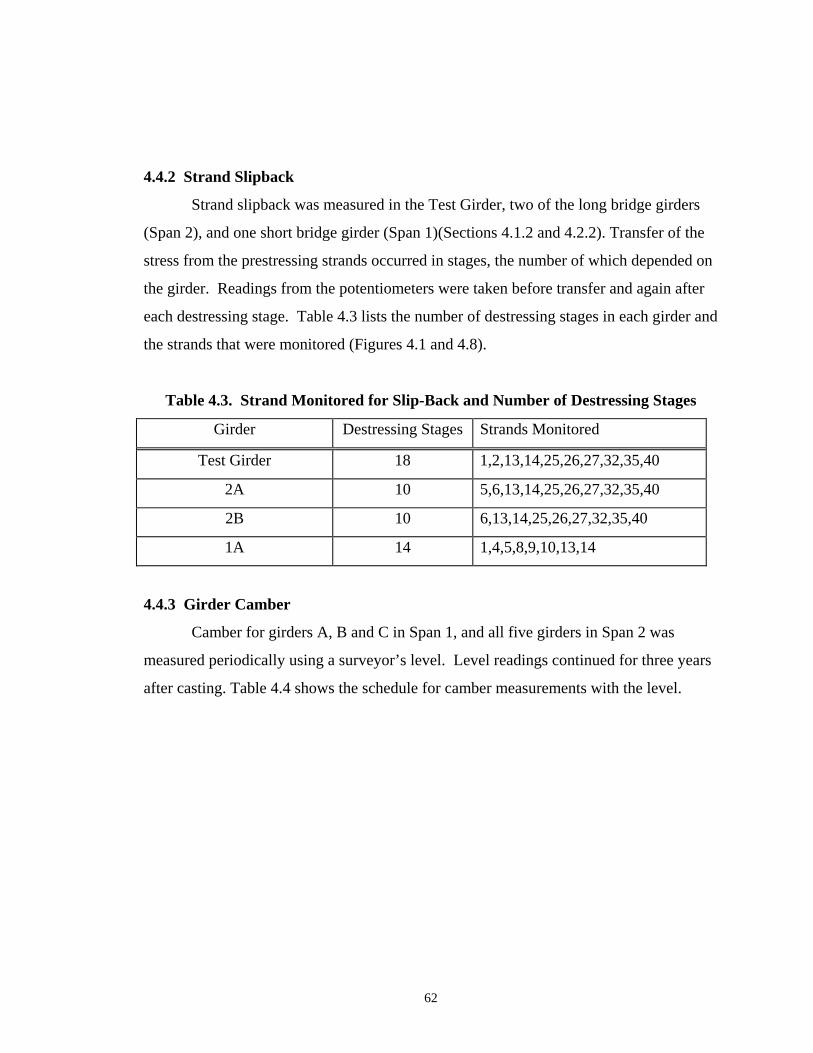
4.4.2 Strand Slipback
Strand slipback was measured in the Test Girder, two of the long bridge girders
(Span 2), and one short bridge girder (Span 1)(Sections 4.1.2 and 4.2.2). Transfer of the
stress from the prestressing strands occurred in stages, the number of which depended on
the girder. Readings from the potentiometers were taken before transfer and again after
each destressing stage. Table 4.3 lists the number of destressing stages in each girder and
the strands that were monitored (Figures 4.1 and 4.8).
Table 4.3. Strand Monitored for Slip-Back and Number of Destressing Stages
Girder Destressing Stages Strands Monitored
Test Girder 18 1,2,13,14,25,26,27,32,35,40
2A 10 5,6,13,14,25,26,27,32,35,40
2B 10 6,13,14,25,26,27,32,35,40
1A 14 1,4,5,8,9,10,13,14
4.4.3 Girder Camber
Camber for girders A, B and C in Span 1, and all five girders in Span 2 was
measured periodically using a surveyor’s level. Level readings continued for three years
after casting. Table 4.4 shows the schedule for camber measurements with the level.
62
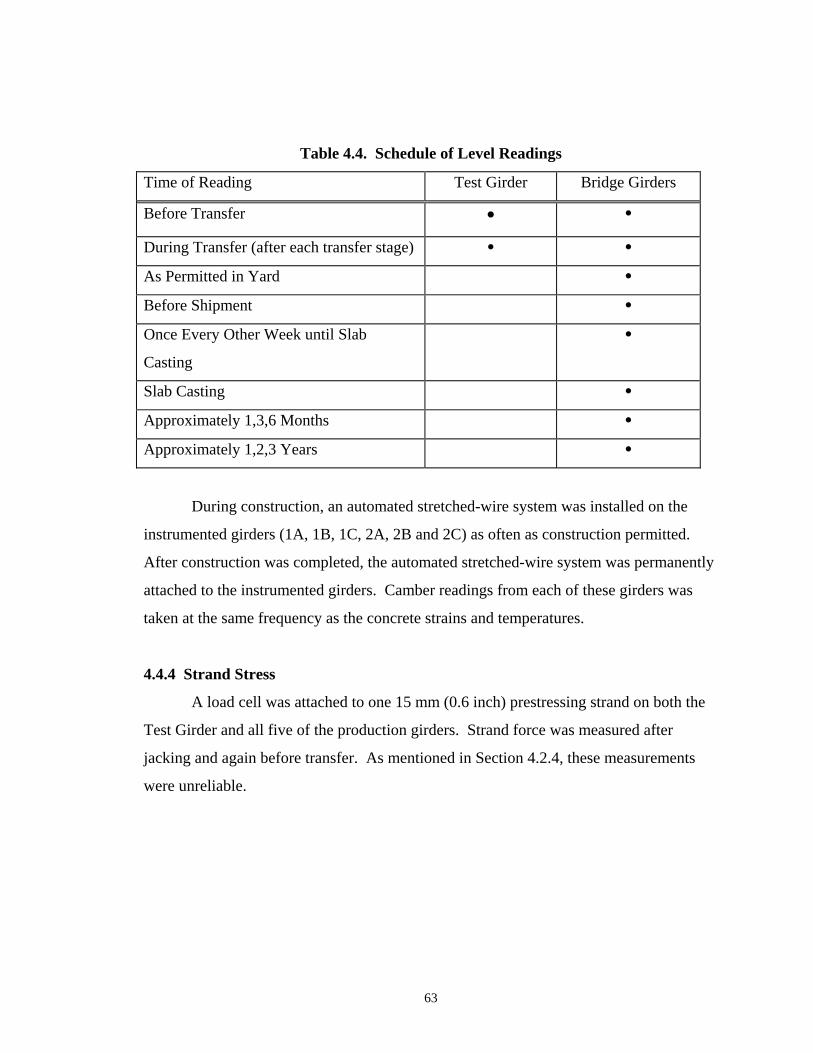
Table 4.4. Schedule of Level Readings
Time of Reading Test Girder Bridge Girders
Before Transfer • •
During Transfer (after each transfer stage) • •
As Permitted in Yard •
Before Shipment •
Once Every Other Week until Slab
Casting
•
Slab Casting •
Approximately 1,3,6 Months •
Approximately 1,2,3 Years •
During construction, an automated stretched-wire system was installed on the
instrumented girders (1A, 1B, 1C, 2A, 2B and 2C) as often as construction permitted.
After construction was completed, the automated stretched-wire system was permanently
attached to the instrumented girders. Camber readings from each of these girders was
taken at the same frequency as the concrete strains and temperatures.
4.4.4 Strand Stress
A load cell was attached to one 15 mm (0.6 inch) prestressing strand on both the
Test Girder and all five of the production girders. Strand force was measured after
jacking and again before transfer. As mentioned in Section 4.2.4, these measurements
were unreliable.
63
CHAPTER 5 OBSERVED BEHAVIOR
This chapter presents the observed behavior of the SR18/SR516 bridge girders.
The discussion is organized into two sections. Section 5.1 discusses the behavior of the
girders from the time of casting until the time of destressing. Section 5.2 discusses the
service behavior of the girders after destressing.
5.1 CASTING THROUGH DESTRESSING
Before destressing the instrumented girders, strength measurements were made on
100 x 152 mm (4 x 8 inch) diameter cylinders that had been subjected to the same
temperature history as the embedded thermocouple. For these cylinders, Table 5.1 lists
the casting dates, average slump, hours of curing, maturity and the average compressive
strengths measured by Central Premix Prestress Co. For a given mix design, maturity
values (Lew and Reichard 1978) can be calculated as
( )( )Maturity T t dti= +∫ 12 2. (5.1)
where Ti(t) = temperature (°C) at time t
t = time
For all six sets of cylinders, the measured compressive strength exceeded the
specified strength of 51 MPa (7400 psi), but it took approximately 24 hours to reach this
target. As expected, the cylinders with the longest curing times (cylinders for Test Girder
and 2A) also had the highest compressive strengths.
64
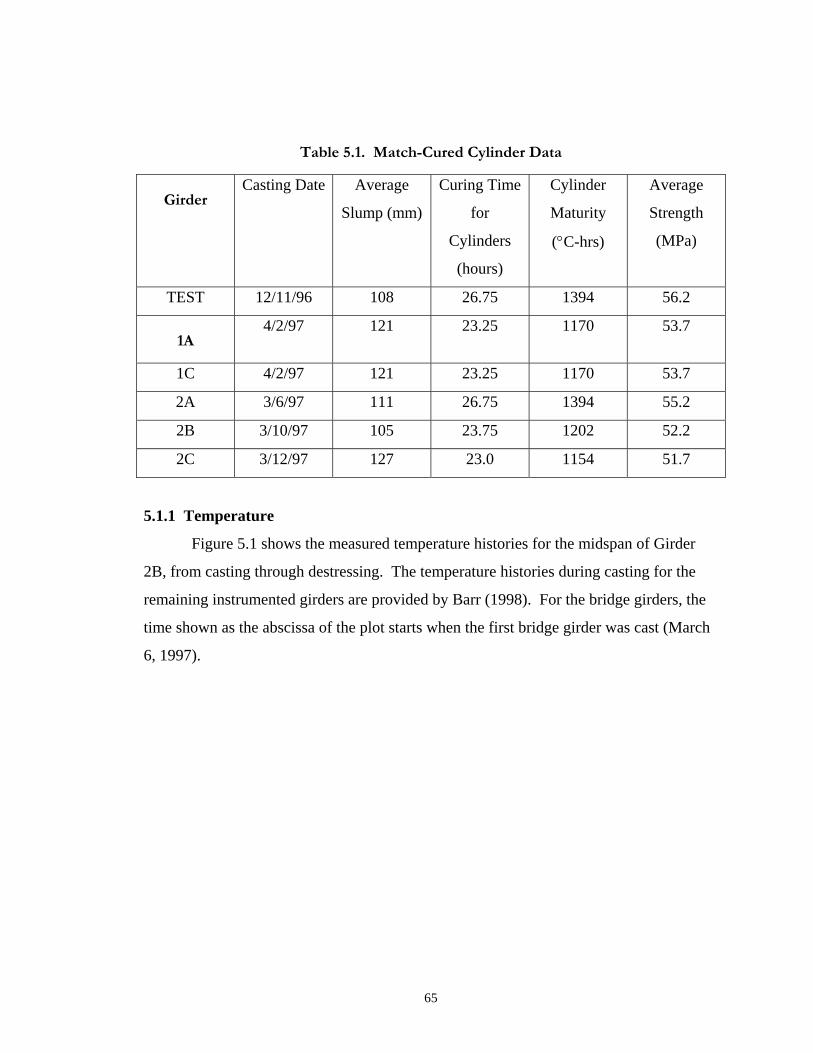
Table 5.1. Match-Cured Cylinder Data
Girder Casting Date Average
Slump (mm)
Curing Time
for
Cylinders
(hours)
Cylinder
Maturity
(°C-hrs)
Average
Strength
(MPa)
TEST 12/11/96 108 26.75 1394 56.2
1A 4/2/97 121 23.25 1170 53.7
1C 4/2/97 121 23.25 1170 53.7
2A 3/6/97 111 26.75 1394 55.2
2B 3/10/97 105 23.75 1202 52.2
2C 3/12/97 127 23.0 1154 51.7
5.1.1 Temperature
Figure 5.1 shows the measured temperature histories for the midspan of Girder
2B, from casting through destressing. The temperature histories during casting for the
remaining instrumented girders are provided by Barr (1998). For the bridge girders, the
time shown as the abscissa of the plot starts when the first bridge girder was cast (March
6, 1997).
65
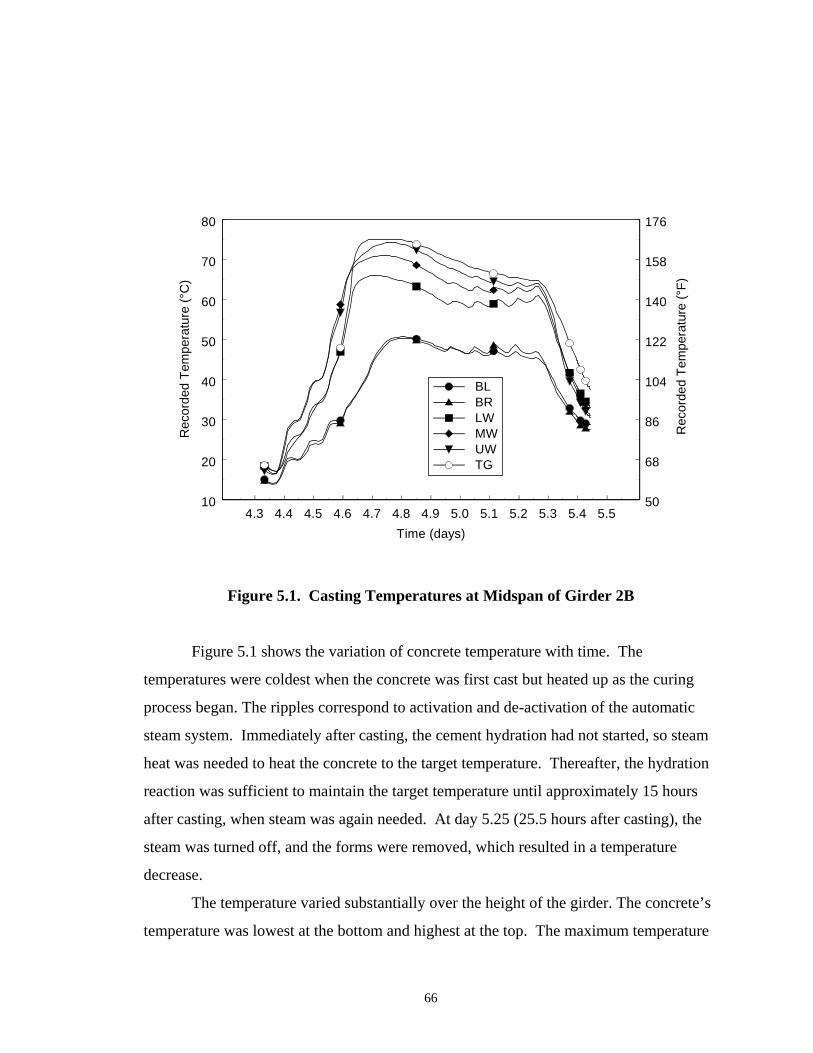
4.3 4.4 4.5 4.6 4.7 4.8 4.9 5.0 5.1 5.2 5.3 5.4 5.5Time (days)
10
20
30
40
50
60
70
80
Rec
orde
d Te
mpe
ratu
re (°
C)
50
68
86
104
122
140
158
176
Rec
orde
d Te
mpe
ratu
re (°
F)
BLBRLWMWUWTG
Figure 5.1. Casting Temperatures at Midspan of Girder 2B
Figure 5.1 shows the variation of concrete temperature with time. The
temperatures were coldest when the concrete was first cast but heated up as the curing
process began. The ripples correspond to activation and de-activation of the automatic
steam system. Immediately after casting, the cement hydration had not started, so steam
heat was needed to heat the concrete to the target temperature. Thereafter, the hydration
reaction was sufficient to maintain the target temperature until approximately 15 hours
after casting, when steam was again needed. At day 5.25 (25.5 hours after casting), the
steam was turned off, and the forms were removed, which resulted in a temperature
decrease.
The temperature varied substantially over the height of the girder. The concrete’s
temperature was lowest at the bottom and highest at the top. The maximum temperature
66
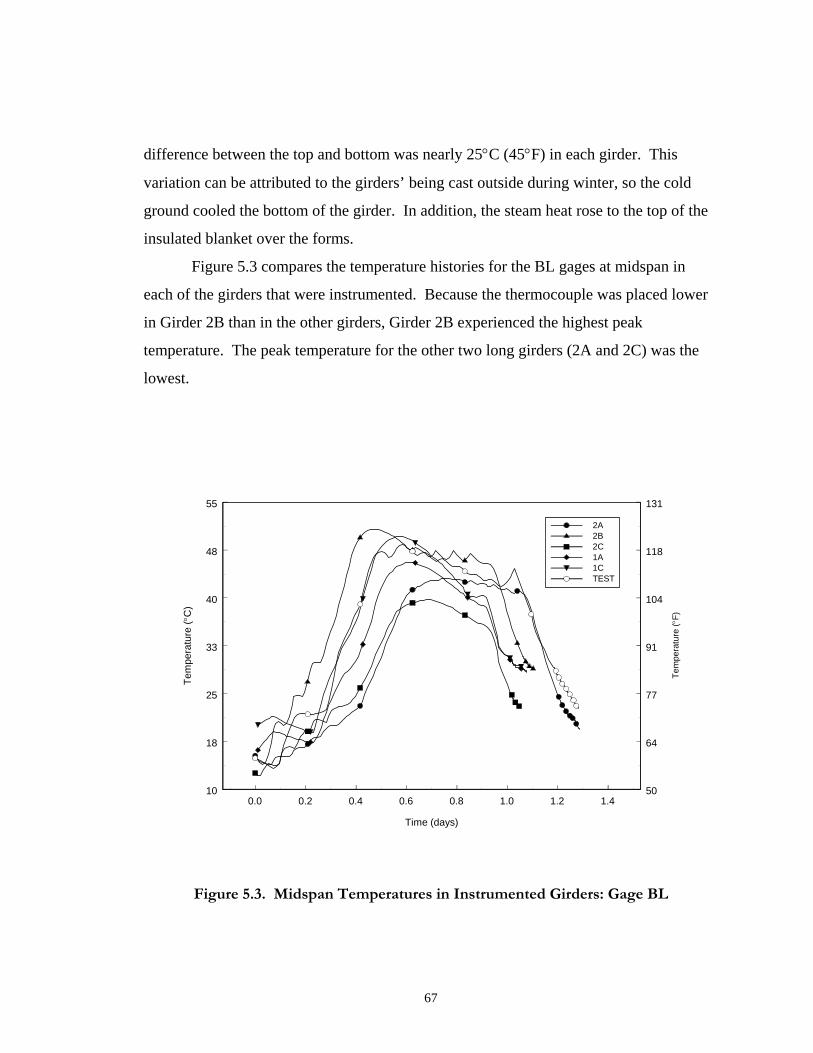
difference between the top and bottom was nearly 25°C (45°F) in each girder. This
variation can be attributed to the girders’ being cast outside during winter, so the cold
ground cooled the bottom of the girder. In addition, the steam heat rose to the top of the
insulated blanket over the forms.
Figure 5.3 compares the temperature histories for the BL gages at midspan in
each of the girders that were instrumented. Because the thermocouple was placed lower
in Girder 2B than in the other girders, Girder 2B experienced the highest peak
temperature. The peak temperature for the other two long girders (2A and 2C) was the
lowest.
0.0 0.2 0.4 0.6 0.8 1.0 1.2 1.4
Time (days)
10
18
25
33
40
48
55
Tem
pera
ture
(°C
)
50
64
77
91
104
118
131
Tem
pera
ture
(°F)
2A2B2C1A1CTEST
Figure 5.3. Midspan Temperatures in Instrumented Girders: Gage BL
67
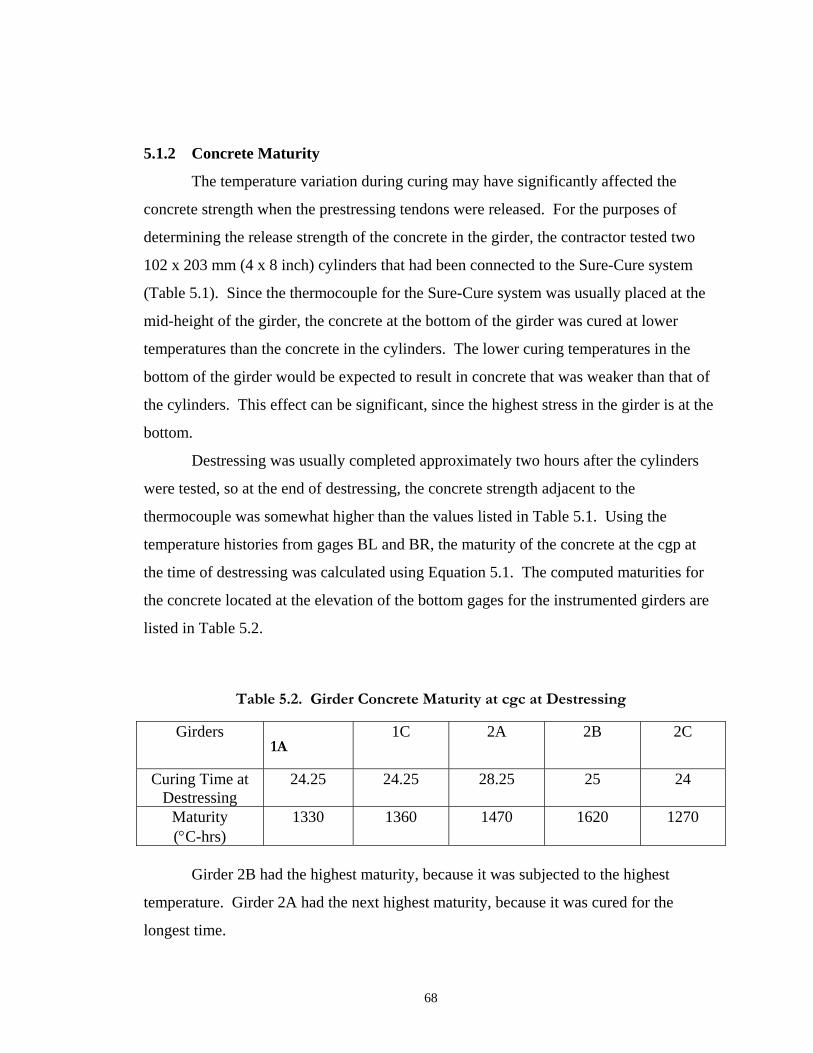
5.1.2 Concrete Maturity
The temperature variation during curing may have significantly affected the
concrete strength when the prestressing tendons were released. For the purposes of
determining the release strength of the concrete in the girder, the contractor tested two
102 x 203 mm (4 x 8 inch) cylinders that had been connected to the Sure-Cure system
(Table 5.1). Since the thermocouple for the Sure-Cure system was usually placed at the
mid-height of the girder, the concrete at the bottom of the girder was cured at lower
temperatures than the concrete in the cylinders. The lower curing temperatures in the
bottom of the girder would be expected to result in concrete that was weaker than that of
the cylinders. This effect can be significant, since the highest stress in the girder is at the
bottom.
Destressing was usually completed approximately two hours after the cylinders
were tested, so at the end of destressing, the concrete strength adjacent to the
thermocouple was somewhat higher than the values listed in Table 5.1. Using the
temperature histories from gages BL and BR, the maturity of the concrete at the cgp at
the time of destressing was calculated using Equation 5.1. The computed maturities for
the concrete located at the elevation of the bottom gages for the instrumented girders are
listed in Table 5.2.
Table 5.2. Girder Concrete Maturity at cgc at Destressing
Girders 1A
1C 2A 2B 2C
Curing Time at Destressing
24.25 24.25 28.25 25 24
Maturity (°C-hrs)
1330 1360 1470 1620 1270
Girder 2B had the highest maturity, because it was subjected to the highest
temperature. Girder 2A had the next highest maturity, because it was cured for the
longest time.
68
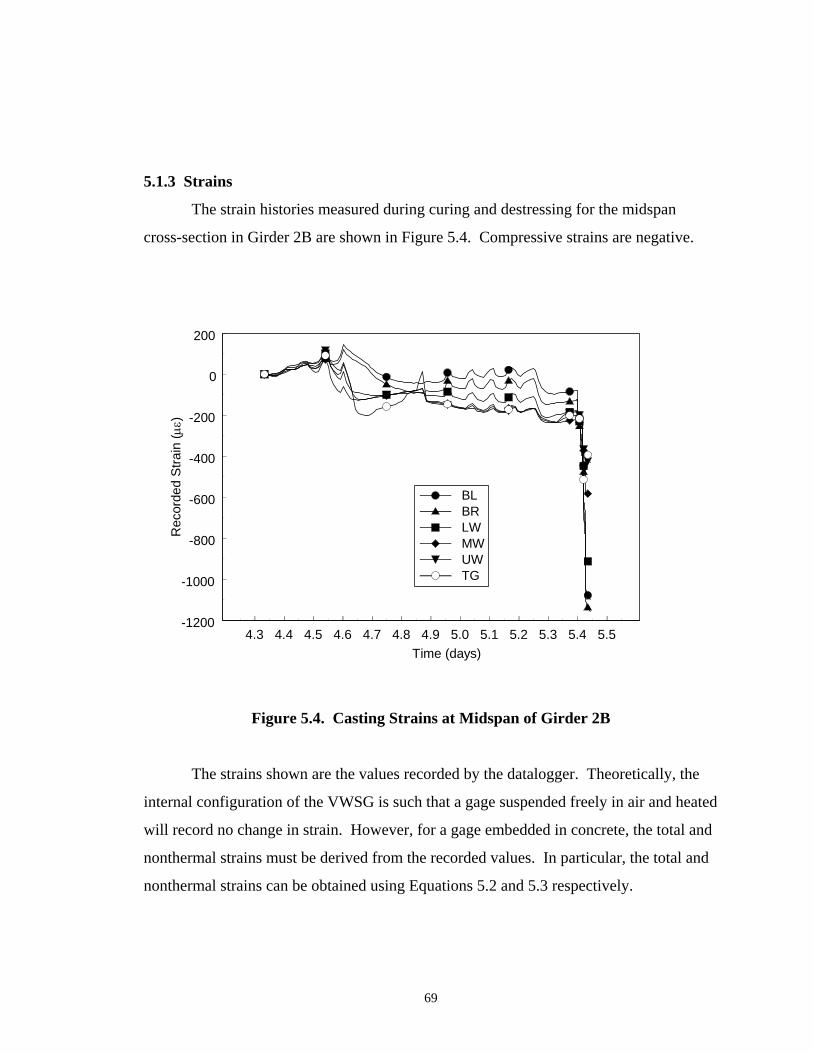
5.1.3 Strains
The strain histories measured during curing and destressing for the midspan
cross-section in Girder 2B are shown in Figure 5.4. Compressive strains are negative.
4.3 4.4 4.5 4.6 4.7 4.8 4.9 5.0 5.1 5.2 5.3 5.4 5.5Time (days)
-1200
-1000
-800
-600
-400
-200
0
200
Rec
orde
d S
train
(µε)
BLBRLWMWUWTG
Figure 5.4. Casting Strains at Midspan of Girder 2B
The strains shown are the values recorded by the datalogger. Theoretically, the
internal configuration of the VWSG is such that a gage suspended freely in air and heated
will record no change in strain. However, for a gage embedded in concrete, the total and
nonthermal strains must be derived from the recorded values. In particular, the total and
nonthermal strains can be obtained using Equations 5.2 and 5.3 respectively.
69
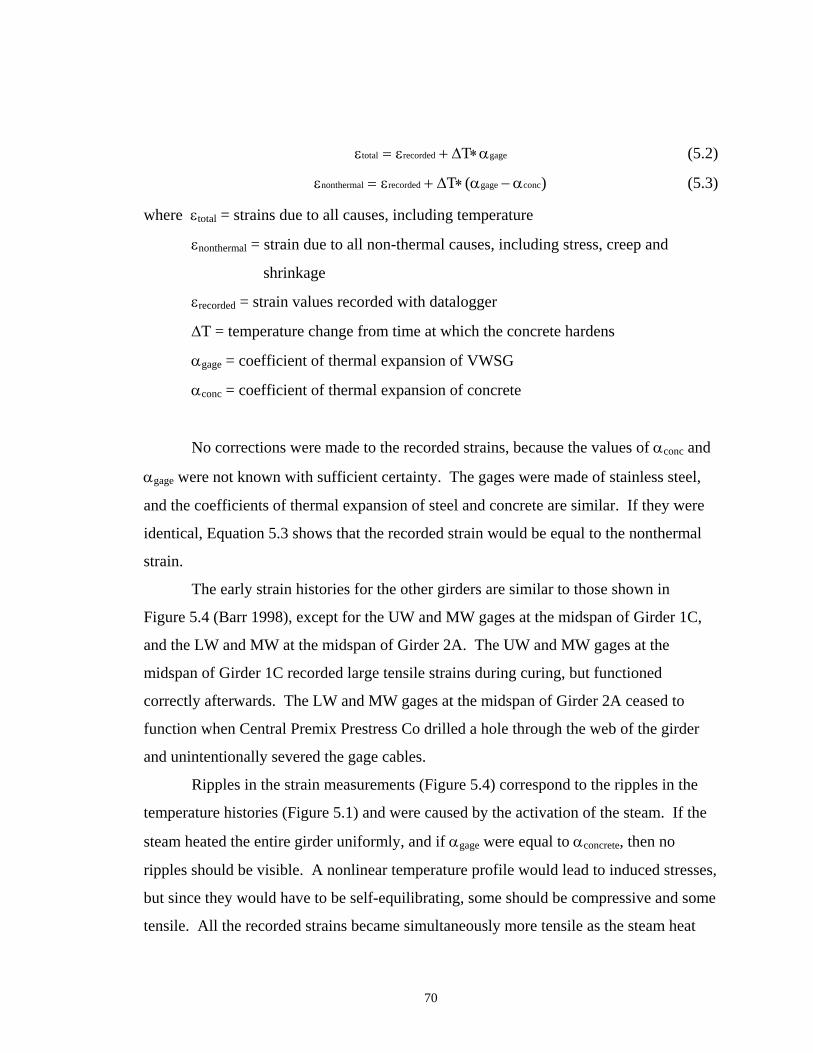
ε ε αtotal recorded gageT= + ∗∆ (5.2)
ε ε α αnonthermal recorded gage concT= + ∗ −∆ ( ) (5.3)
where εtotal = strains due to all causes, including temperature
εnonthermal = strain due to all non-thermal causes, including stress, creep and
shrinkage
εrecorded = strain values recorded with datalogger
∆T = temperature change from time at which the concrete hardens
αgage = coefficient of thermal expansion of VWSG
αconc = coefficient of thermal expansion of concrete
No corrections were made to the recorded strains, because the values of αconc and
αgage were not known with sufficient certainty. The gages were made of stainless steel,
and the coefficients of thermal expansion of steel and concrete are similar. If they were
identical, Equation 5.3 shows that the recorded strain would be equal to the nonthermal
strain.
The early strain histories for the other girders are similar to those shown in
Figure 5.4 (Barr 1998), except for the UW and MW gages at the midspan of Girder 1C,
and the LW and MW at the midspan of Girder 2A. The UW and MW gages at the
midspan of Girder 1C recorded large tensile strains during curing, but functioned
correctly afterwards. The LW and MW gages at the midspan of Girder 2A ceased to
function when Central Premix Prestress Co drilled a hole through the web of the girder
and unintentionally severed the gage cables.
Ripples in the strain measurements (Figure 5.4) correspond to the ripples in the
temperature histories (Figure 5.1) and were caused by the activation of the steam. If the
steam heated the entire girder uniformly, and if αgage were equal to αconcrete, then no
ripples should be visible. A nonlinear temperature profile would lead to induced stresses,
but since they would have to be self-equilibrating, some should be compressive and some
tensile. All the recorded strains became simultaneously more tensile as the steam heat
70
was applied, so the gages’ response cannot have been induced by stress alone. The other
probable excitation is thermal. Thus it is likely that αgage and αconcrete differed.
The abrupt change in strain at 5.45 days is a result of releasing the prestressing
strands. The destressing process lasted about two hours for Girder 2A and about one
hour for each of the other instrumented girders.
0.0 0.2 0.4 0.6 0.8 1.0 1.2 1.4
Time (days)
-1200
-1000
-800
-600
-400
-200
0
200
Rec
orde
d St
rain
(µε)
2A2B2CTEST
Figure 5.5. Midspan Strains in Most Highly Stressed Girders: Gage BL
Figure 5.5 compares the BL gage strain readings during curing and destressing of
the four most highly stressed girders. The abrupt change in strain shows the effect of
destressing. The differences in time at destressing reflect the different times for which
the girders were cured (Table 5.2). At the end of destressing, the bottom compressive
strains in girders 2A, 2C and the Test Girder were within 4.5 % of each other. The strain
in Girder 2B after destressing was less than that in the other girders, possibly because it
71
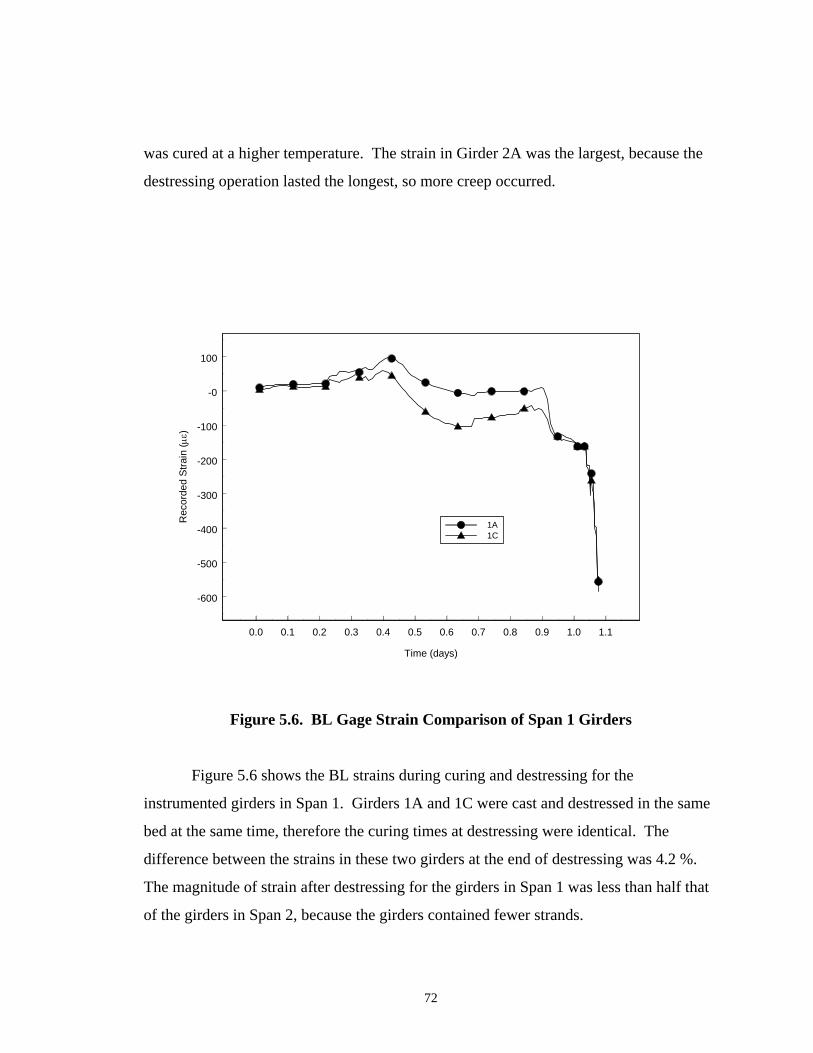
was cured at a higher temperature. The strain in Girder 2A was the largest, because the
destressing operation lasted the longest, so more creep occurred.
0.0 0.1 0.2 0.3 0.4 0.5 0.6 0.7 0.8 0.9 1.0 1.1
Time (days)
-600
-500
-400
-300
-200
-100
-0
100
Rec
orde
d St
rain
(µε)
1A1C
Figure 5.6. BL Gage Strain Comparison of Span 1 Girders
Figure 5.6 shows the BL strains during curing and destressing for the
instrumented girders in Span 1. Girders 1A and 1C were cast and destressed in the same
bed at the same time, therefore the curing times at destressing were identical. The
difference between the strains in these two girders at the end of destressing was 4.2 %.
The magnitude of strain after destressing for the girders in Span 1 was less than half that
of the girders in Span 2, because the girders contained fewer strands.
72
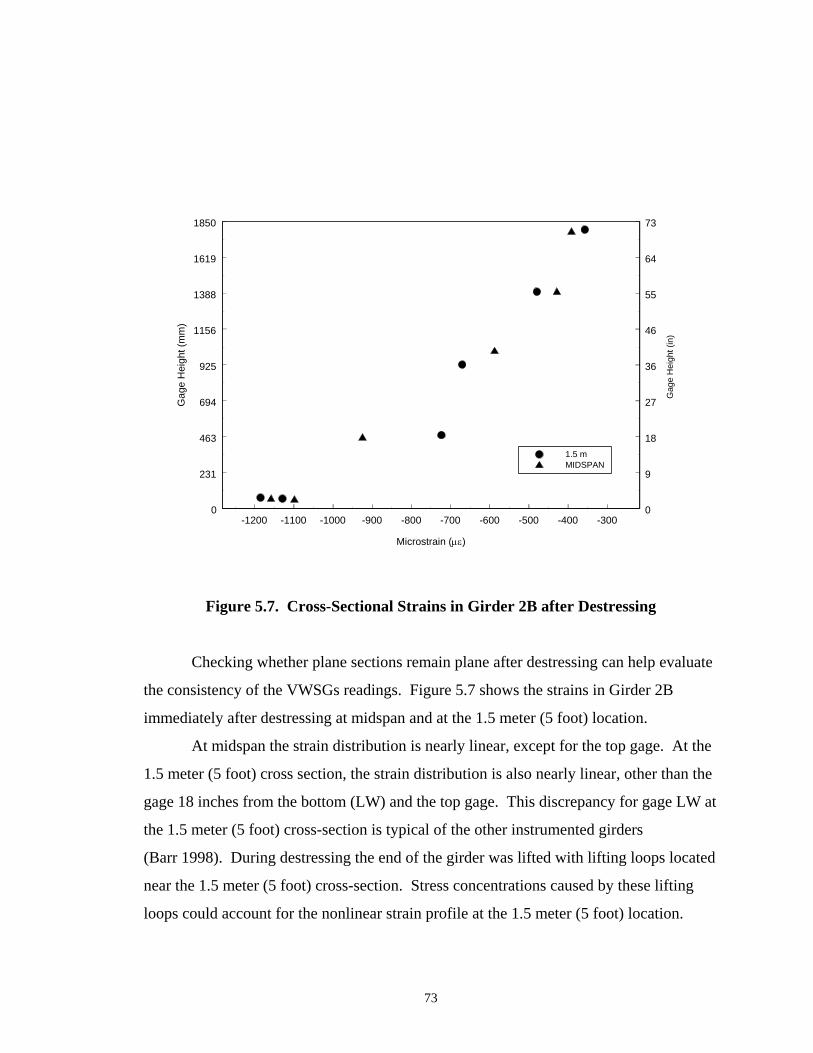
-1200 -1100 -1000 -900 -800 -700 -600 -500 -400 -300
Microstrain (µε)
0
231
463
694
925
1156
1388
1619
1850
Gag
e H
eigh
t (m
m)
0
9
18
27
36
46
55
64
73
Gag
e H
eigh
t (in
)
1.5 mMIDSPAN
Figure 5.7. Cross-Sectional Strains in Girder 2B after Destressing
Checking whether plane sections remain plane after destressing can help evaluate
the consistency of the VWSGs readings. Figure 5.7 shows the strains in Girder 2B
immediately after destressing at midspan and at the 1.5 meter (5 foot) location.
At midspan the strain distribution is nearly linear, except for the top gage. At the
1.5 meter (5 foot) cross section, the strain distribution is also nearly linear, other than the
gage 18 inches from the bottom (LW) and the top gage. This discrepancy for gage LW at
the 1.5 meter (5 foot) cross-section is typical of the other instrumented girders
(Barr 1998). During destressing the end of the girder was lifted with lifting loops located
near the 1.5 meter (5 foot) cross-section. Stress concentrations caused by these lifting
loops could account for the nonlinear strain profile at the 1.5 meter (5 foot) location.
73
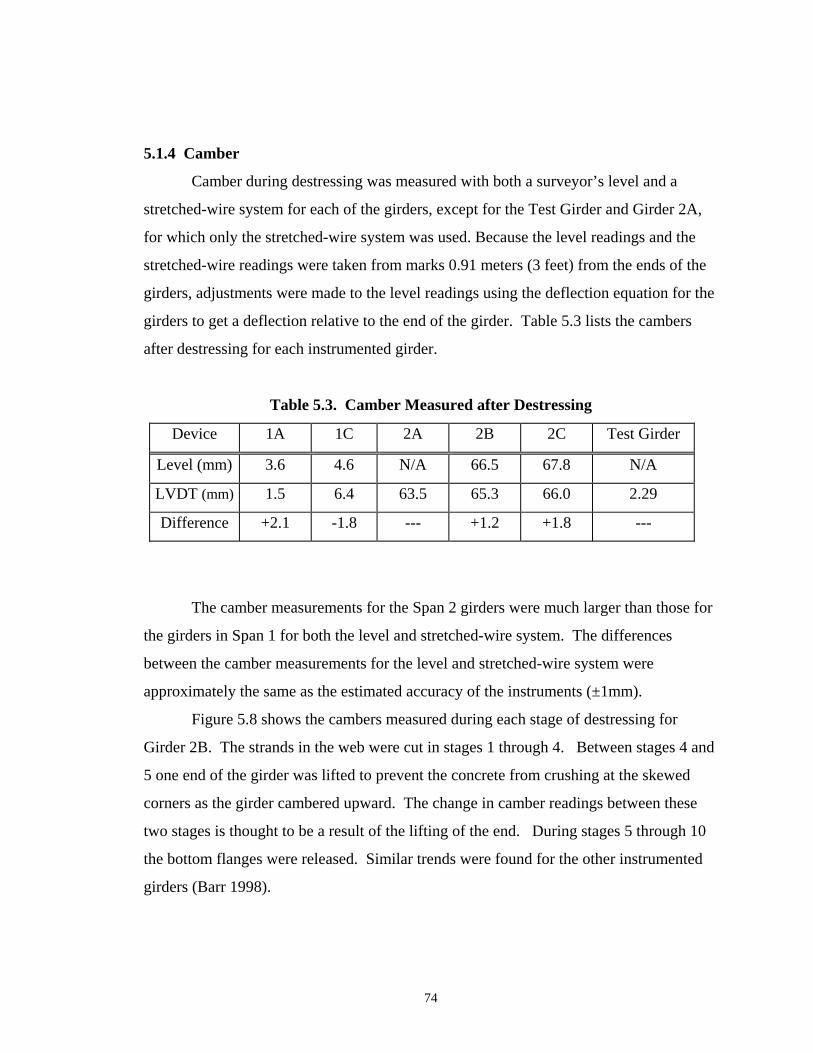
5.1.4 Camber
Camber during destressing was measured with both a surveyor’s level and a
stretched-wire system for each of the girders, except for the Test Girder and Girder 2A,
for which only the stretched-wire system was used. Because the level readings and the
stretched-wire readings were taken from marks 0.91 meters (3 feet) from the ends of the
girders, adjustments were made to the level readings using the deflection equation for the
girders to get a deflection relative to the end of the girder. Table 5.3 lists the cambers
after destressing for each instrumented girder.
Table 5.3. Camber Measured after Destressing
Device 1A 1C 2A 2B 2C Test Girder
Level (mm) 3.6 4.6 N/A 66.5 67.8 N/A
LVDT (mm) 1.5 6.4 63.5 65.3 66.0 2.29
Difference +2.1 -1.8 --- +1.2 +1.8 ---
The camber measurements for the Span 2 girders were much larger than those for
the girders in Span 1 for both the level and stretched-wire system. The differences
between the camber measurements for the level and stretched-wire system were
approximately the same as the estimated accuracy of the instruments (±1mm).
Figure 5.8 shows the cambers measured during each stage of destressing for
Girder 2B. The strands in the web were cut in stages 1 through 4. Between stages 4 and
5 one end of the girder was lifted to prevent the concrete from crushing at the skewed
corners as the girder cambered upward. The change in camber readings between these
two stages is thought to be a result of the lifting of the end. During stages 5 through 10
the bottom flanges were released. Similar trends were found for the other instrumented
girders (Barr 1998).
74
0 1 2 3 4 5 6 7 8 9 10
Destressing Stage
-20
-10
0
10
20
30
40
50
60
70
Cam
ber (
mm
)
-0.8
-0.3
0.1
0.5
1.0
1.4
1.9
2.3
2.8
Cam
ber (
in)
LVDTLEVEL
Figure 5.8. Camber During Destressing in Girder 2B
5.1.5 Transfer Length Voltage readings were taken from potentiometers attached to prestressing strands
in girders 1A, 2A and 2B using a hand held digital voltmeter. The voltage readings were
converted into end-slip readings by multiplying them by the gage factor. The end slip
measurements for Girder 2B are shown in Figure 5.9. Strands 27 and 35 were located in
the web and were destressed during stages 1 to 4. The others were bottom flange strands
and were destressed during stages 5 to 10.
75
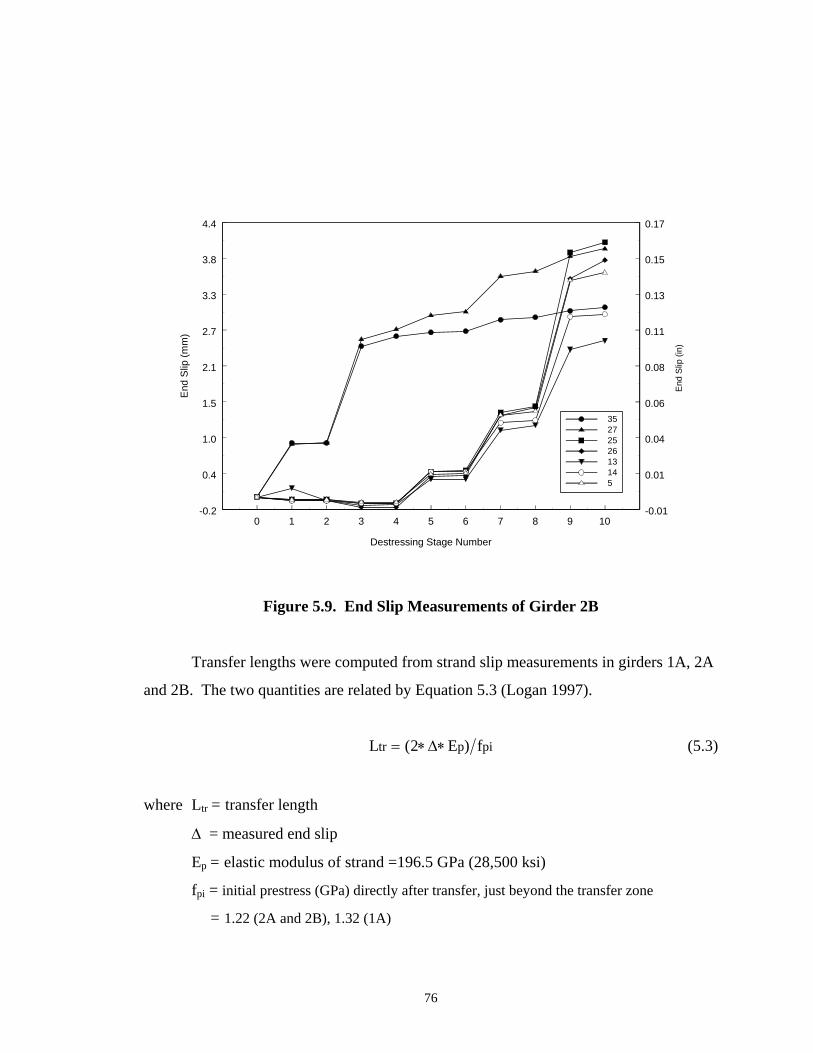
0 1 2 3 4 5 6 7 8 9 10
Destressing Stage Number
-0.2
0.4
1.0
1.5
2.1
2.7
3.3
3.8
4.4
End
Slip
(mm
)
-0.01
0.01
0.04
0.06
0.08
0.11
0.13
0.15
0.17
3527252613145
End
Slip
(in)
Figure 5.9. End Slip Measurements of Girder 2B
Transfer lengths were computed from strand slip measurements in girders 1A, 2A
and 2B. The two quantities are related by Equation 5.3 (Logan 1997).
L Etr p pif= ∗ ∗( )2 ∆ (5.3)
where Ltr = transfer length
∆ = measured end slip
Ep = elastic modulus of strand =196.5 GPa (28,500 ksi)
fpi = initial prestress (GPa) directly after transfer, just beyond the transfer zone
= 1.22 (2A and 2B), 1.32 (1A)
76
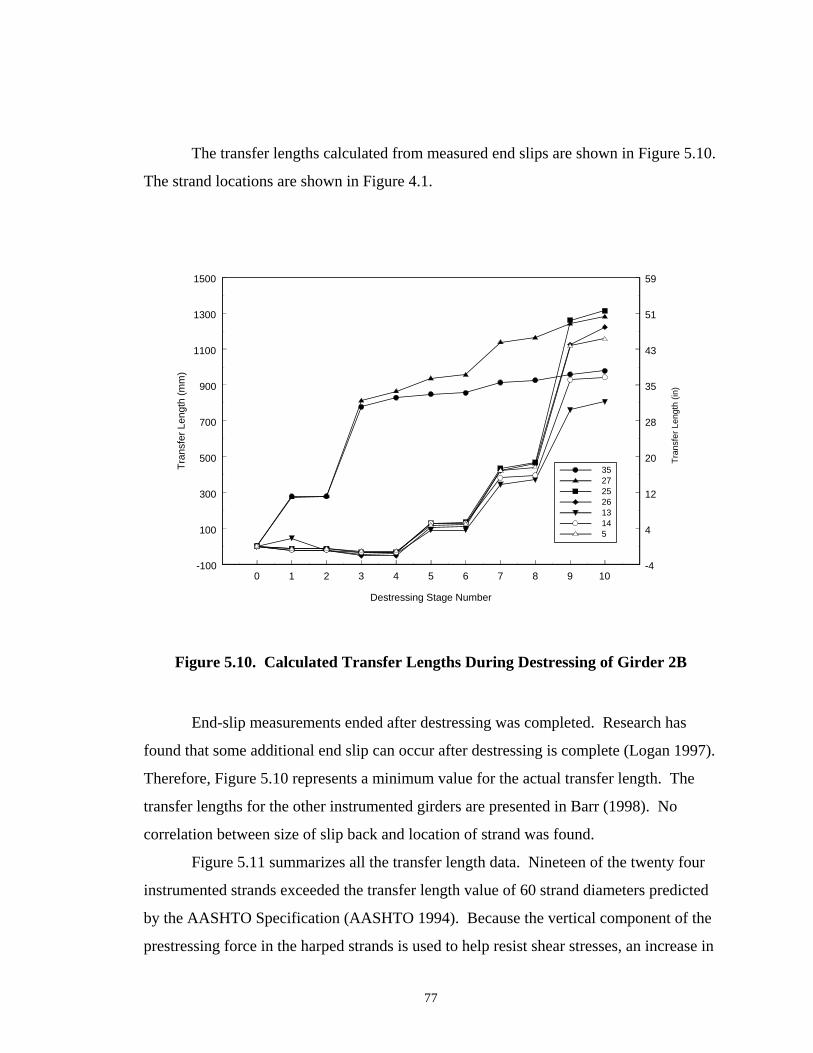
The transfer lengths calculated from measured end slips are shown in Figure 5.10.
The strand locations are shown in Figure 4.1.
0 1 2 3 4 5 6 7 8 9 10
Destressing Stage Number
-100
100
300
500
700
900
1100
1300
1500
Tran
sfer
Len
gth
(mm
)
-4
4
12
20
28
35
43
51
59
Tran
sfer
Len
gth
(in)
3527252613145
Figure 5.10. Calculated Transfer Lengths During Destressing of Girder 2B
End-slip measurements ended after destressing was completed. Research has
found that some additional end slip can occur after destressing is complete (Logan 1997).
Therefore, Figure 5.10 represents a minimum value for the actual transfer length. The
transfer lengths for the other instrumented girders are presented in Barr (1998). No
correlation between size of slip back and location of strand was found. Figure 5.11 summarizes all the transfer length data. Nineteen of the twenty four
instrumented strands exceeded the transfer length value of 60 strand diameters predicted
by the AASHTO Specification (AASHTO 1994). Because the vertical component of the
prestressing force in the harped strands is used to help resist shear stresses, an increase in
77
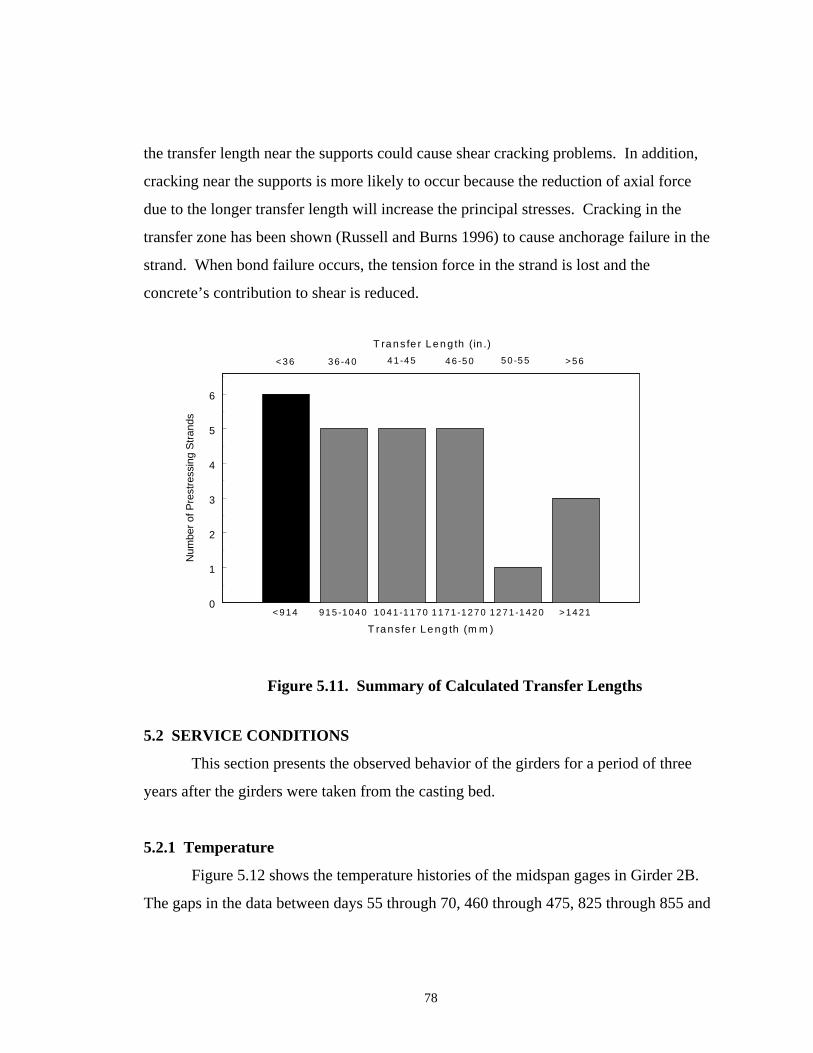
the transfer length near the supports could cause shear cracking problems. In addition,
cracking near the supports is more likely to occur because the reduction of axial force
due to the longer transfer length will increase the principal stresses. Cracking in the
transfer zone has been shown (Russell and Burns 1996) to cause anchorage failure in the
strand. When bond failure occurs, the tension force in the strand is lost and the
concrete’s contribution to shear is reduced.
< 9 14 91 5 -1 04 0 10 41 -1 17 0 1 17 1 -1 27 0 12 71 -1 42 0 > 14 21
T ra n s fe r Le ng th (m m )
0
1
2
3
4
5
6
Num
ber o
f Pre
stre
ssin
g St
rand
s
< 3 6 3 6 -4 0 4 1 -45 4 6 -5 0 50 -5 5 > 56
T ra ns fe r L en g th ( in .)
Figure 5.11. Summary of Calculated Transfer Lengths
5.2 SERVICE CONDITIONS
This section presents the observed behavior of the girders for a period of three
years after the girders were taken from the casting bed.
5.2.1 Temperature
Figure 5.12 shows the temperature histories of the midspan gages in Girder 2B.
The gaps in the data between days 55 through 70, 460 through 475, 825 through 855 and
78
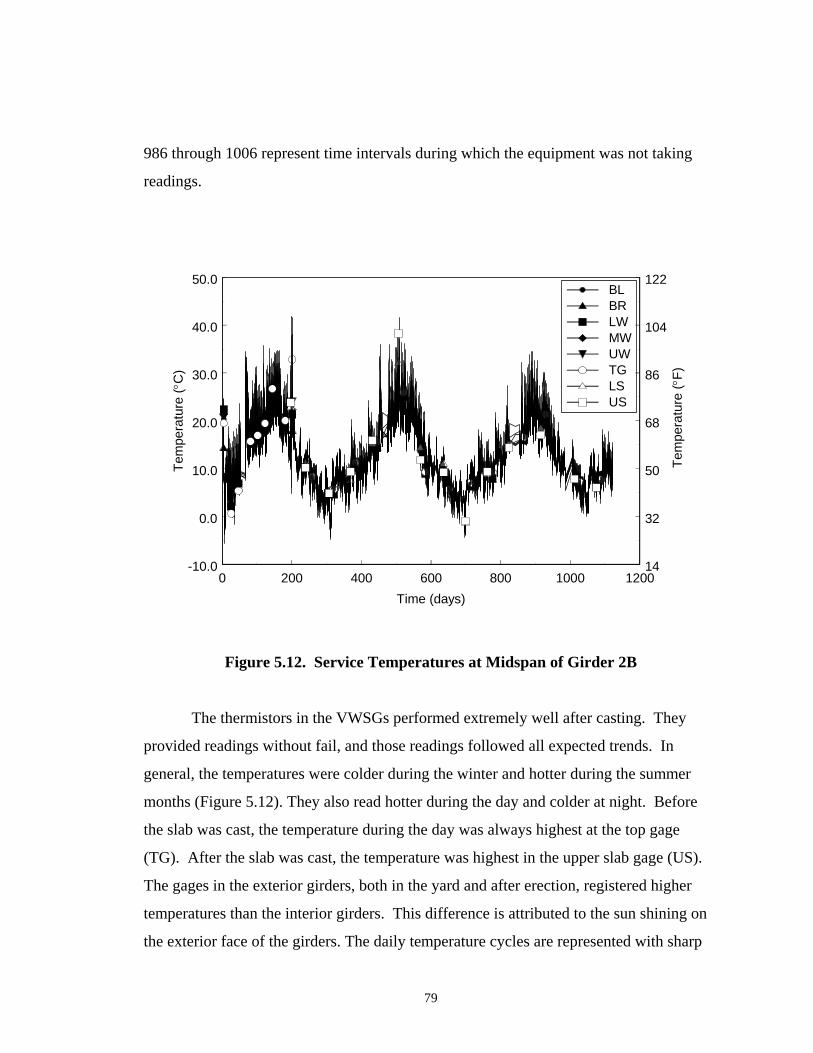
986 through 1006 represent time intervals during which the equipment was not taking
readings.
0 200 400 600 800 1000 1200Time (days)
-10.0
0.0
10.0
20.0
30.0
40.0
50.0
Tem
pera
ture
(°C
)
BLBRLWMWUWTGLSUS
14
32
50
68
86
104
122
Tem
pera
ture
(°F)
Figure 5.12. Service Temperatures at Midspan of Girder 2B
The thermistors in the VWSGs performed extremely well after casting. They
provided readings without fail, and those readings followed all expected trends. In
general, the temperatures were colder during the winter and hotter during the summer
months (Figure 5.12). They also read hotter during the day and colder at night. Before
the slab was cast, the temperature during the day was always highest at the top gage
(TG). After the slab was cast, the temperature was highest in the upper slab gage (US).
The gages in the exterior girders, both in the yard and after erection, registered higher
temperatures than the interior girders. This difference is attributed to the sun shining on
the exterior face of the girders. The daily temperature cycles are represented with sharp
79
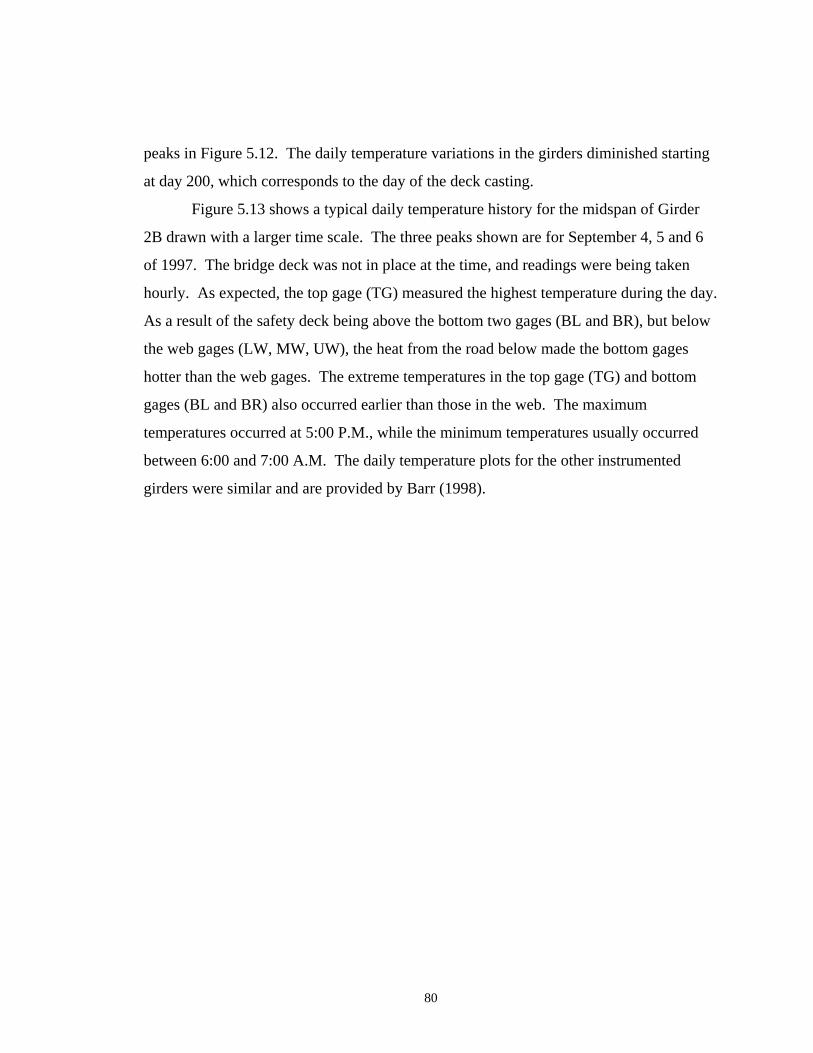
peaks in Figure 5.12. The daily temperature variations in the girders diminished starting
at day 200, which corresponds to the day of the deck casting.
Figure 5.13 shows a typical daily temperature history for the midspan of Girder
2B drawn with a larger time scale. The three peaks shown are for September 4, 5 and 6
of 1997. The bridge deck was not in place at the time, and readings were being taken
hourly. As expected, the top gage (TG) measured the highest temperature during the day.
As a result of the safety deck being above the bottom two gages (BL and BR), but below
the web gages (LW, MW, UW), the heat from the road below made the bottom gages
hotter than the web gages. The extreme temperatures in the top gage (TG) and bottom
gages (BL and BR) also occurred earlier than those in the web. The maximum
temperatures occurred at 5:00 P.M., while the minimum temperatures usually occurred
between 6:00 and 7:00 A.M. The daily temperature plots for the other instrumented
girders were similar and are provided by Barr (1998).
80
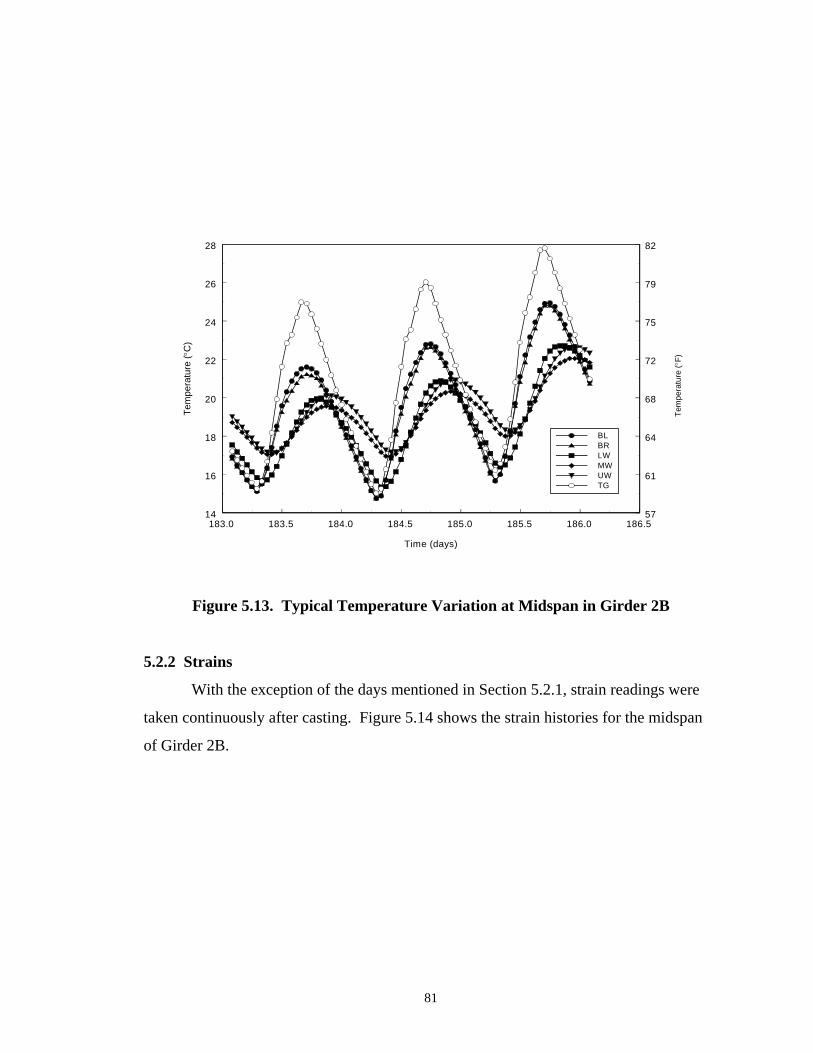
183.0 183.5 184.0 184.5 185.0 185.5 186.0 186.5
Time (days)
14
16
18
20
22
24
26
28
Tem
pera
ture
(°C
)
57
61
64
68
72
75
79
82
BLBRLWMWUWTG
Tem
pera
ture
(°F)
Figure 5.13. Typical Temperature Variation at Midspan in Girder 2B
5.2.2 Strains
With the exception of the days mentioned in Section 5.2.1, strain readings were
taken continuously after casting. Figure 5.14 shows the strain histories for the midspan
of Girder 2B.
81
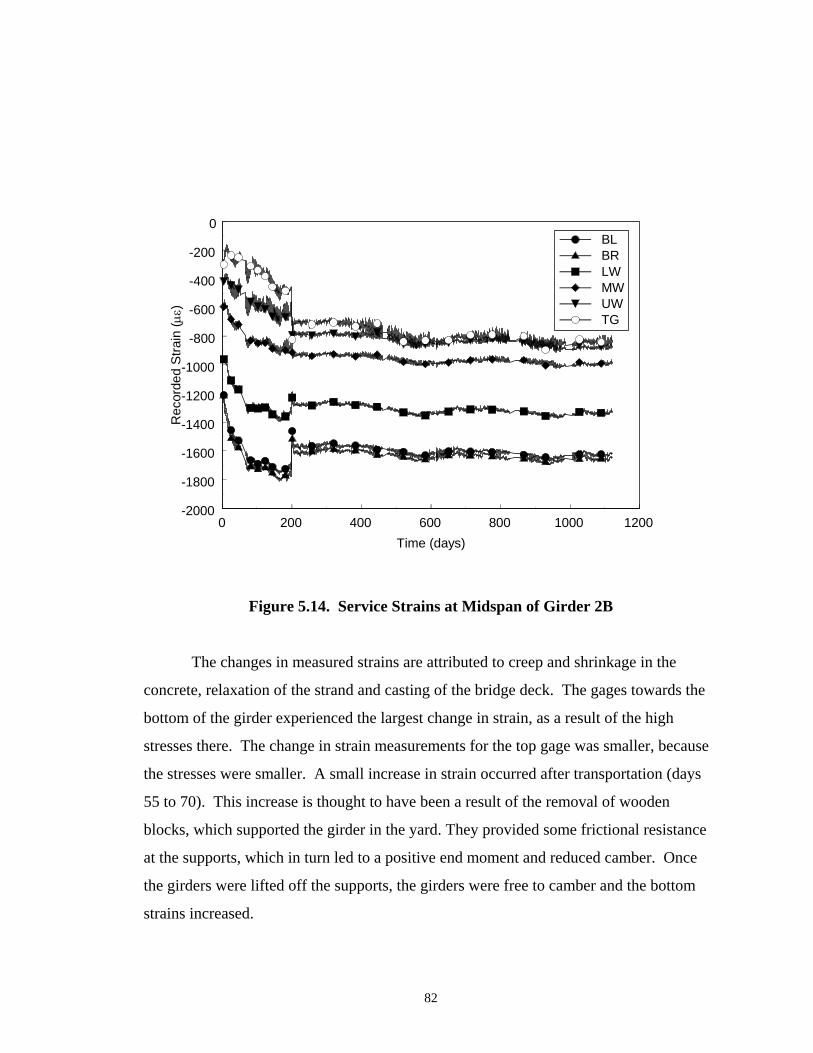
0 200 400 600 800 1000 1200Time (days)
-2000
-1800
-1600
-1400
-1200
-1000
-800
-600
-400
-200
0
Rec
orde
d S
train
(µε)
BLBRLWMWUWTG
Figure 5.14. Service Strains at Midspan of Girder 2B
The changes in measured strains are attributed to creep and shrinkage in the
concrete, relaxation of the strand and casting of the bridge deck. The gages towards the
bottom of the girder experienced the largest change in strain, as a result of the high
stresses there. The change in strain measurements for the top gage was smaller, because
the stresses were smaller. A small increase in strain occurred after transportation (days
55 to 70). This increase is thought to have been a result of the removal of wooden
blocks, which supported the girder in the yard. They provided some frictional resistance
at the supports, which in turn led to a positive end moment and reduced camber. Once
the girders were lifted off the supports, the girders were free to camber and the bottom
strains increased.
82
The abrupt change in strain on Day 200 corresponds to the deck casting. The
strains in gages BL, BR and LW decreased while strains increased in gages MW, UW
and TG. As expected, the change in strain was largest in the top (TG) and bottom (BL
and BR) gages. After Day 200 the stress in the concrete was nearly zero at the bottom
flange, and because nearly all of the shrinkage in the concrete and relaxation in the strand
had already occurred, the increase in strains after this time was attributed to differential
shrinkage (Section 2.8). The distribution of the recorded strains remained approximately
linear during this time. Figure 5.14 also shows that during the first 100 days the bottom
gages experienced much more change in strain than during any other period of time for
the girder. A slight increase in bottom strain occurred after the slab was cast. This trend
is consistent with the fact that the rates of creep and shrinkage decrease with time and the
stress in the bottom of the girder after the slab casting was almost zero.
The cross-sectional strains at three times during the service life of Girder 2B are
shown in Figure 5.15. The 200-day data is directly before casting of the deck. The
measured data show a strain distribution that is nearly linear. This finding agrees with
the assumptions of Euler-Bernoulli beam theory and thus provides verification that the
gages were working correctly.
The distribution of strain is slightly nonlinear, in that the strains in the upper
gages are larger than the values that would fit a linear profile. This tendency follows the
same trend as was found at destressing (Figure 5.7). This trend is consistent with the
other instrumented girders (Barr 1998)
83
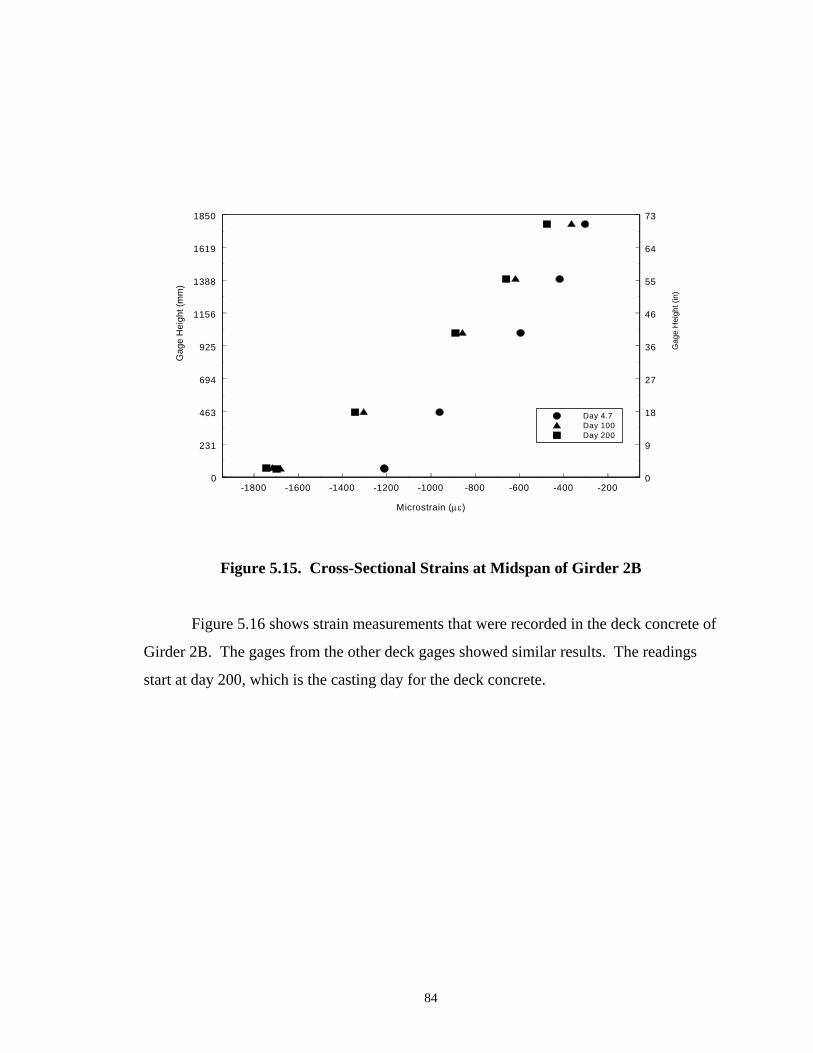
-1800 -1600 -1400 -1200 -1000 -800 -600 -400 -200
Microstrain (µε)
0
231
463
694
925
1156
1388
1619
1850
Gag
e H
eigh
t (m
m)
0
9
18
27
36
46
55
64
73
Gag
e H
eigh
t (in
)
Day 4.7Day 100Day 200
Figure 5.15. Cross-Sectional Strains at Midspan of Girder 2B
Figure 5.16 shows strain measurements that were recorded in the deck concrete of
Girder 2B. The gages from the other deck gages showed similar results. The readings
start at day 200, which is the casting day for the deck concrete.
84
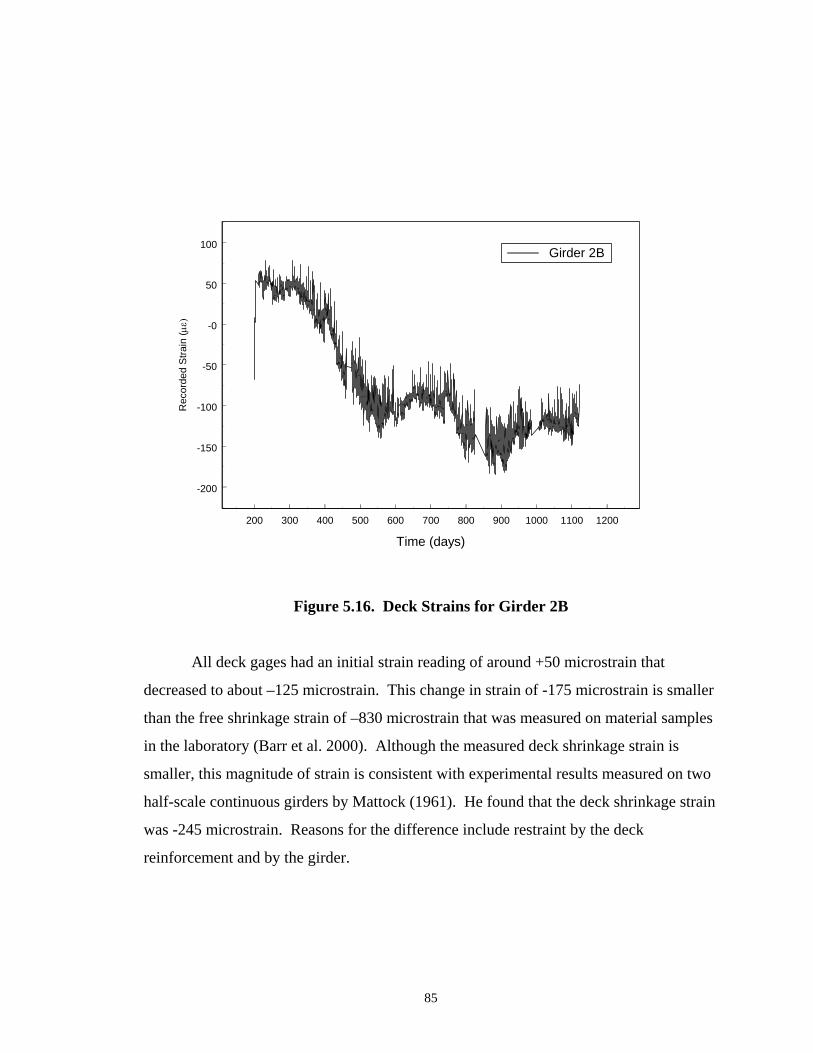
200 300 400 500 600 700 800 900 1000 1100 1200
Time (days)
-200
-150
-100
-50
-0
50
100
Rec
orde
d St
rain
(µε)
Girder 2B
Figure 5.16. Deck Strains for Girder 2B
All deck gages had an initial strain reading of around +50 microstrain that
decreased to about –125 microstrain. This change in strain of -175 microstrain is smaller
than the free shrinkage strain of –830 microstrain that was measured on material samples
in the laboratory (Barr et al. 2000). Although the measured deck shrinkage strain is
smaller, this magnitude of strain is consistent with experimental results measured on two
half-scale continuous girders by Mattock (1961). He found that the deck shrinkage strain
was -245 microstrain. Reasons for the difference include restraint by the deck
reinforcement and by the girder.
85
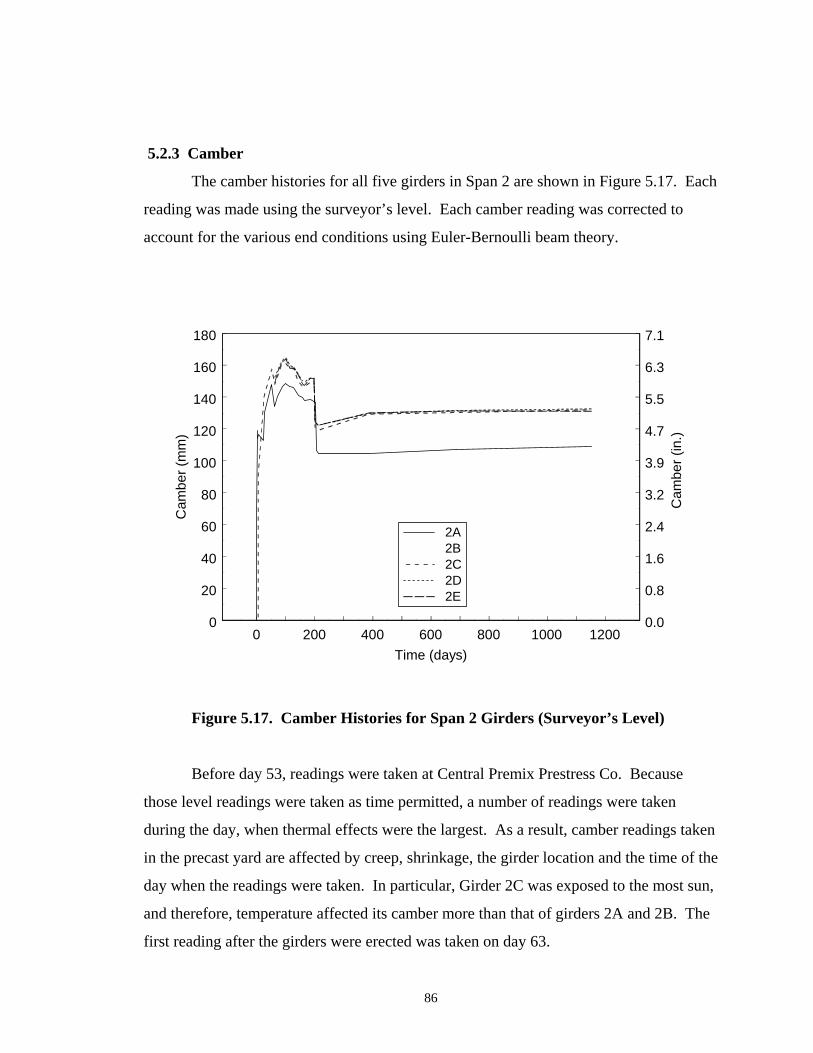
5.2.3 Camber
The camber histories for all five girders in Span 2 are shown in Figure 5.17. Each
reading was made using the surveyor’s level. Each camber reading was corrected to
account for the various end conditions using Euler-Bernoulli beam theory.
0 200 400 600 800 1000 1200Time (days)
0
20
40
60
80
100
120
140
160
180
Cam
ber (
mm
)
0.0
0.8
1.6
2.4
3.2
3.9
4.7
5.5
6.3
7.1
Cam
ber (
in.)
2A2B2C2D2E
Figure 5.17. Camber Histories for Span 2 Girders (Surveyor’s Level)
Before day 53, readings were taken at Central Premix Prestress Co. Because
those level readings were taken as time permitted, a number of readings were taken
during the day, when thermal effects were the largest. As a result, camber readings taken
in the precast yard are affected by creep, shrinkage, the girder location and the time of the
day when the readings were taken. In particular, Girder 2C was exposed to the most sun,
and therefore, temperature affected its camber more than that of girders 2A and 2B. The
first reading after the girders were erected was taken on day 63.
86
All the girders deflected downward by 10 to 20 mm (0.4 to 0.8 inches) between
the last reading in the yard and after erection (day 53 and 62) (Figure 5.17). The level
readings on days 53 were taken on a sunny afternoon at 3:30 P.M., and therefore included
some thermal camber. The readings on day 62 were taken at 5:30 A.M., which led to
minimal thermal camber. The difference in camber between days 53 and 62 is therefore
thought to be a result of thermal camber, the magnitude of which is consistent with
values after the girders were erected (Figure 5.21).
In addition to the instrumented girders, camber readings were also taken on
Girders 2D and 2E on the night that the girders were erected. After the girder erection,
camber readings were taken approximately every two weeks. The slight dips in the
curves of Figure 5.17 between the readings on days 101 and 114 are related to the casting
of the intermediate diaphragms.
The cause for the decline in the camber readings between days 128 and 164 is
unclear, however the bottom foot of the pier diaphragms was cast around day 130. The
girders had projecting end reinforcement and strand extensions, on some of which strand
chucks were mounted to add anchorage, so pouring part of the pier diaphragm connected
them in both tension and compression. The restraint to creep and shrinkage at the ends of
the girders from this concrete is a plausible explanation for the observed decrease. The
sudden drop in camber near day 200 corresponds to the deck casting. Each girder in
Span 2 deflected about 25.4 mm (1 inch) during casting of the deck. The camber
increased slightly after the slab was cast.
The camber histories for the instrumented girders in Span 1 are shown in
Figure 5.18. Each reading was taken with a surveyor’s level. Transportation, erection,
diaphragm casting and deck casting occurred on the same days as for the girders in
Span 2. Camber on Girder 1B was measured starting on day 73. Camber values could
not be taken on the night of erection. The deck casting caused each girder to deflect
3 mm (1/8 inch). There was also almost no change in the Span 1 girders’ camber after
the deck was cast.
87
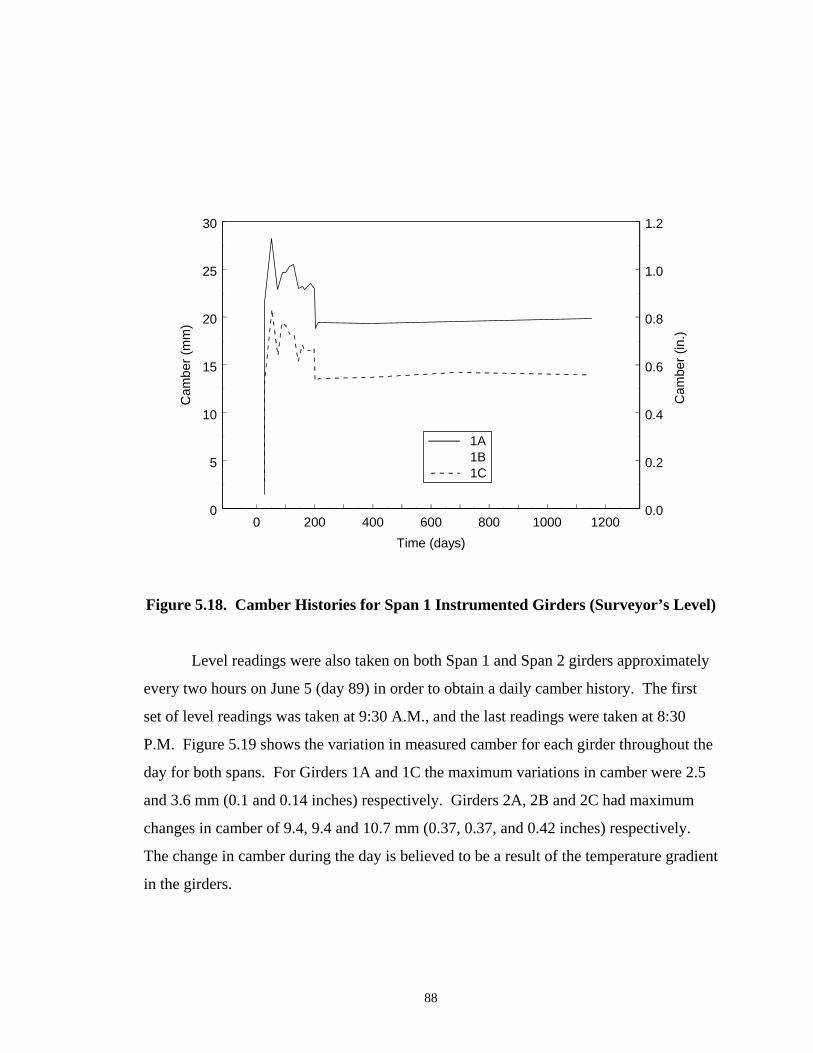
0 200 400 600 800 1000 1200Time (days)
0
5
10
15
20
25
30
Cam
ber (
mm
)
0.0
0.2
0.4
0.6
0.8
1.0
1.2
Cam
ber (
in.)
1A1B1C
Figure 5.18. Camber Histories for Span 1 Instrumented Girders (Surveyor’s Level)
Level readings were also taken on both Span 1 and Span 2 girders approximately
every two hours on June 5 (day 89) in order to obtain a daily camber history. The first
set of level readings was taken at 9:30 A.M., and the last readings were taken at 8:30
P.M. Figure 5.19 shows the variation in measured camber for each girder throughout the
day for both spans. For Girders 1A and 1C the maximum variations in camber were 2.5
and 3.6 mm (0.1 and 0.14 inches) respectively. Girders 2A, 2B and 2C had maximum
changes in camber of 9.4, 9.4 and 10.7 mm (0.37, 0.37, and 0.42 inches) respectively.
The change in camber during the day is believed to be a result of the temperature gradient
in the girders.
88
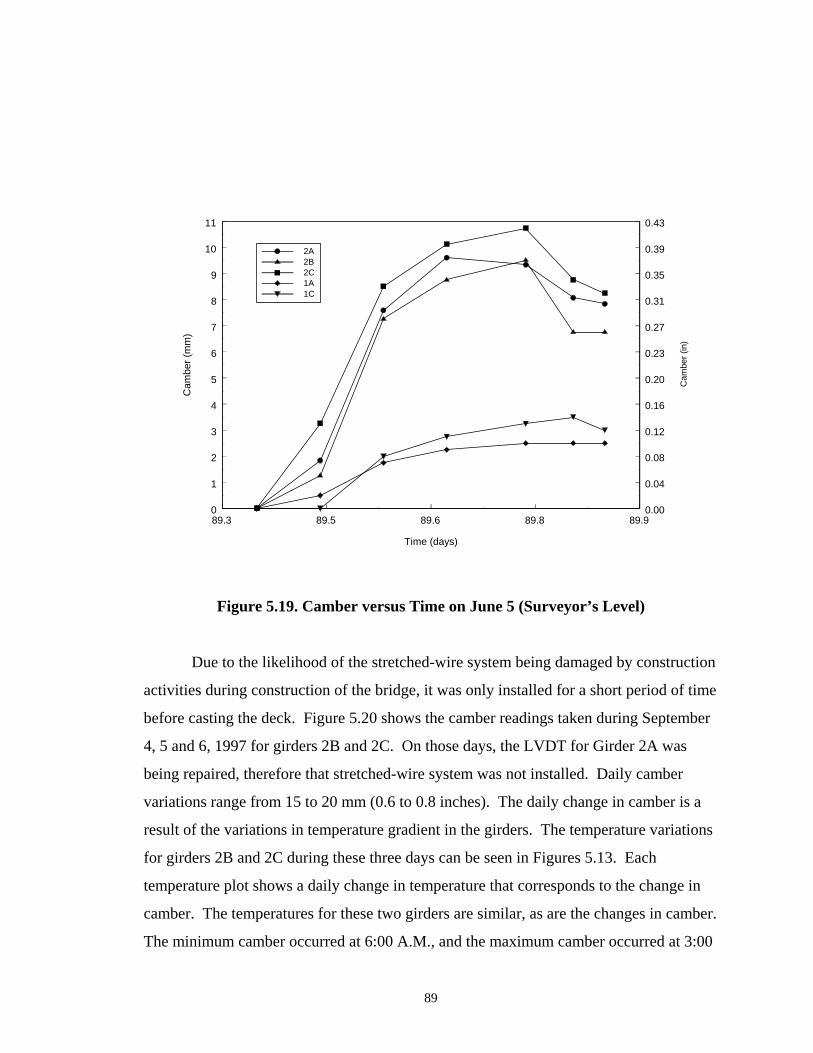
89.3 89.5 89.6 89.8 89.9
Time (days)
0
1
2
3
4
5
6
7
8
9
10
11
Cam
ber (
mm
)
0.00
0.04
0.08
0.12
0.16
0.20
0.23
0.27
0.31
0.35
0.39
0.43
Cam
ber (
in)
2A2B2C1A1C
Figure 5.19. Camber versus Time on June 5 (Surveyor’s Level)
Due to the likelihood of the stretched-wire system being damaged by construction
activities during construction of the bridge, it was only installed for a short period of time
before casting the deck. Figure 5.20 shows the camber readings taken during September
4, 5 and 6, 1997 for girders 2B and 2C. On those days, the LVDT for Girder 2A was
being repaired, therefore that stretched-wire system was not installed. Daily camber
variations range from 15 to 20 mm (0.6 to 0.8 inches). The daily change in camber is a
result of the variations in temperature gradient in the girders. The temperature variations
for girders 2B and 2C during these three days can be seen in Figures 5.13. Each
temperature plot shows a daily change in temperature that corresponds to the change in
camber. The temperatures for these two girders are similar, as are the changes in camber.
The minimum camber occurred at 6:00 A.M., and the maximum camber occurred at 3:00
89
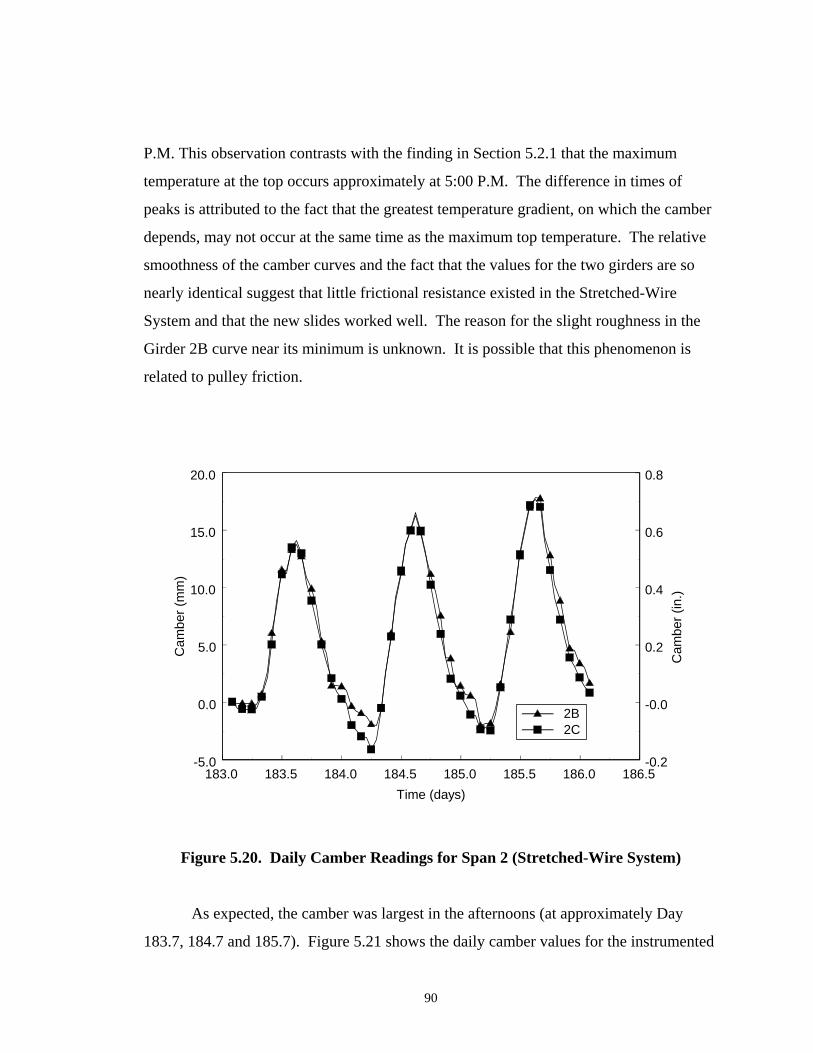
P.M. This observation contrasts with the finding in Section 5.2.1 that the maximum
temperature at the top occurs approximately at 5:00 P.M. The difference in times of
peaks is attributed to the fact that the greatest temperature gradient, on which the camber
depends, may not occur at the same time as the maximum top temperature. The relative
smoothness of the camber curves and the fact that the values for the two girders are so
nearly identical suggest that little frictional resistance existed in the Stretched-Wire
System and that the new slides worked well. The reason for the slight roughness in the
Girder 2B curve near its minimum is unknown. It is possible that this phenomenon is
related to pulley friction.
183.0 183.5 184.0 184.5 185.0 185.5 186.0 186.5Time (days)
-5.0
0.0
5.0
10.0
15.0
20.0
Cam
ber (
mm
)
-0.2
-0.0
0.2
0.4
0.6
0.8
Cam
ber (
in.)
2B2C
Figure 5.20. Daily Camber Readings for Span 2 (Stretched-Wire System)
As expected, the camber was largest in the afternoons (at approximately Day
183.7, 184.7 and 185.7). Figure 5.21 shows the daily camber values for the instrumented
90
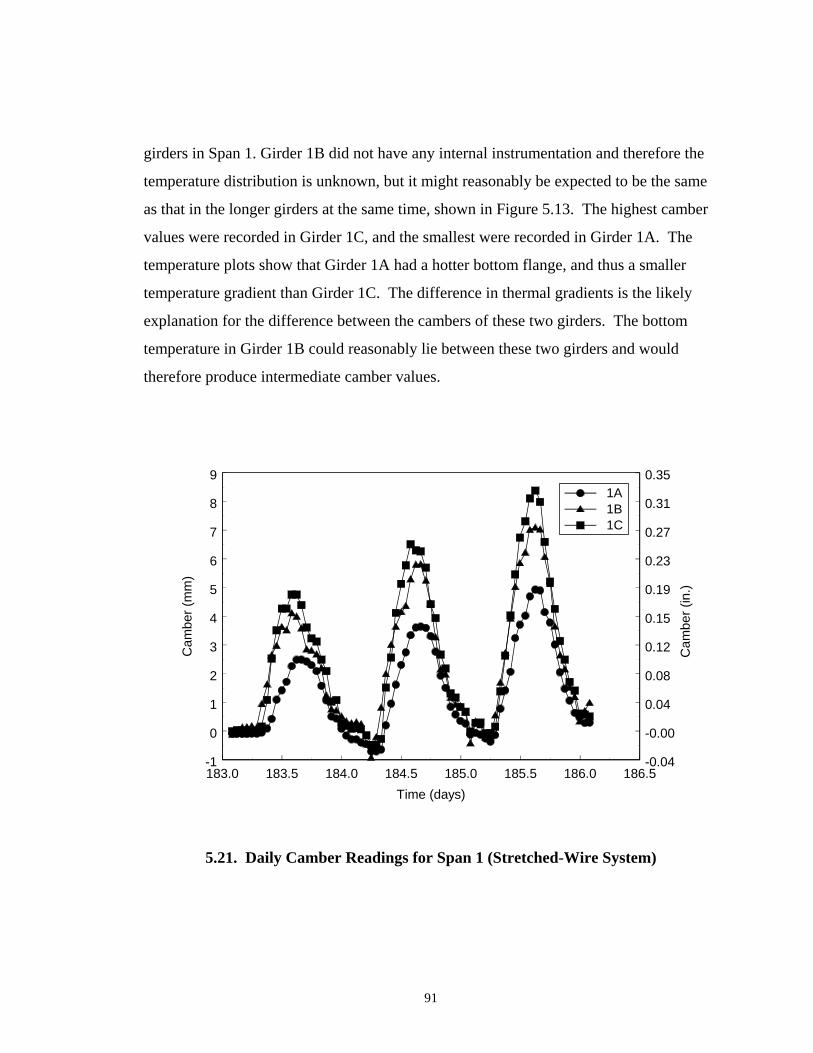
girders in Span 1. Girder 1B did not have any internal instrumentation and therefore the
temperature distribution is unknown, but it might reasonably be expected to be the same
as that in the longer girders at the same time, shown in Figure 5.13. The highest camber
values were recorded in Girder 1C, and the smallest were recorded in Girder 1A. The
temperature plots show that Girder 1A had a hotter bottom flange, and thus a smaller
temperature gradient than Girder 1C. The difference in thermal gradients is the likely
explanation for the difference between the cambers of these two girders. The bottom
temperature in Girder 1B could reasonably lie between these two girders and would
therefore produce intermediate camber values.
183.0 183.5 184.0 184.5 185.0 185.5 186.0 186.5Time (days)
-1
0
1
2
3
4
5
6
7
8
9
Cam
ber (
mm
)
1A1B1C
-0.04
-0.00
0.04
0.08
0.12
0.15
0.19
0.23
0.27
0.31
0.35
Cam
ber (
in.)
5.21. Daily Camber Readings for Span 1 (Stretched-Wire System)
91

CHAPTER 6
OBSERVED PRESTRESS LOSSES
This chapter discusses the prestress losses observed in the instrumented girders.
Prestress losses occur due to elastic shortening of the concrete (Section 6.1), and
shrinkage and creep of the concrete (Section 6.2). Additional changes in prestress occur
due to deck casting (Section 6.3) and relaxation of the prestressing strands (Section 6.4).
6.1 ELASTIC SHORTENING AND EARLY CREEP
After release of the strands, the compressive strain in the concrete at the centroid
of the prestressing strand cgc is composed of three parts: (1) axial strain due to
prestressing force, (2) bending strain due to eccentricity of prestressing force and (3)
bending strain due to self weight. As the concrete shortens, the tendons that are bonded
to the adjacent concrete also shorten. This shortening of the tendons reduces the
prestressing force. Equation 6.1 relates the change in concrete strain to the change in
prestressing stress due to elastic shortening.
∆ ∆fpES = ∗Ep cε (6.1)
where ∆fpES= change in steel stress due to elastic shortening
Ep = modulus of elasticity of prestressing steel (196.5 GPa (28,500 ksi) from
manufacturer)
∆εc = change in strand strain at release
Elastic shortening losses in the prestressing strands were estimated by measuring
the strain in the concrete near the centroid of the prestressing strands (gages BL and BR)
and multiplying this strain by the modulus of elasticity of the prestressing steel
92
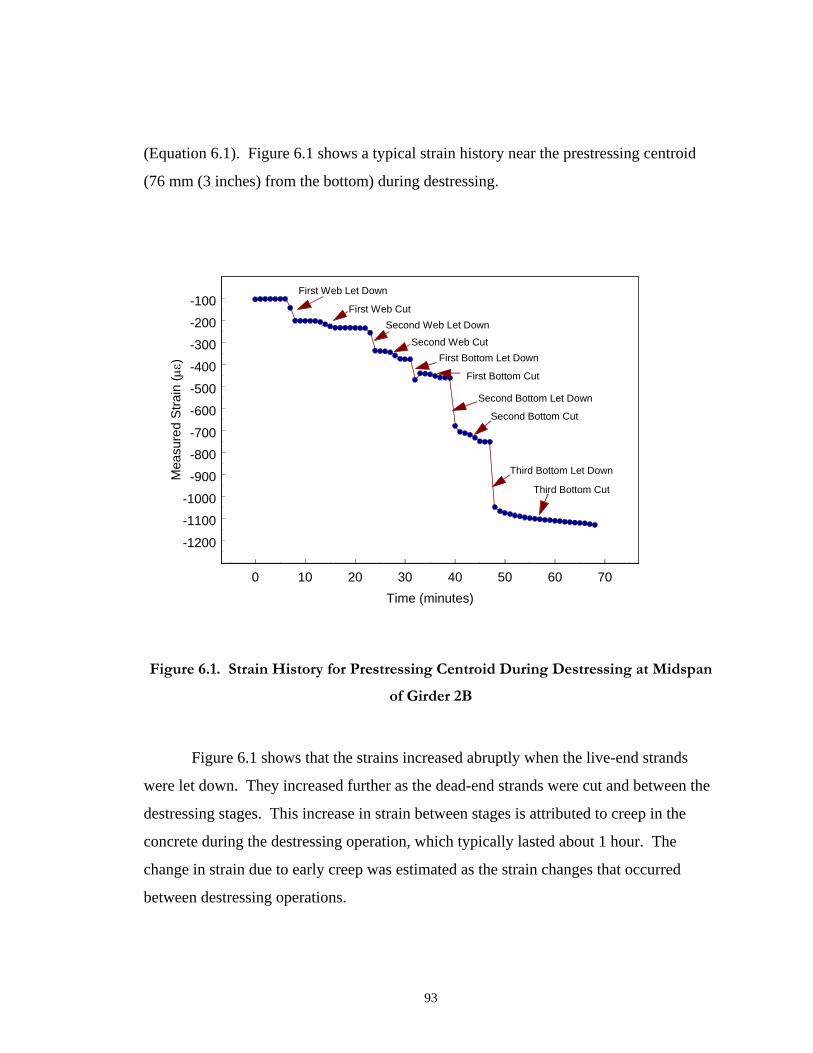
(Equation 6.1). Figure 6.1 shows a typical strain history near the prestressing centroid
(76 mm (3 inches) from the bottom) during destressing.
0 10 20 30 40 50 60 70Time (minutes)
-1200
-1100
-1000
-900
-800
-700
-600
-500
-400
-300
-200
-100
Mea
sure
d S
train
(µε)
First Web Let Down
First Web CutSecond Web Let Down
Second Web CutFirst Bottom Let Down
First Bottom Cut
Second Bottom Let Down
Second Bottom Cut
Third Bottom Let Down
Third Bottom Cut
Figure 6.1. Strain History for Prestressing Centroid During Destressing at Midspan
of Girder 2B
Figure 6.1 shows that the strains increased abruptly when the live-end strands
were let down. They increased further as the dead-end strands were cut and between the
destressing stages. This increase in strain between stages is attributed to creep in the
concrete during the destressing operation, which typically lasted about 1 hour. The
change in strain due to early creep was estimated as the strain changes that occurred
between destressing operations.
93
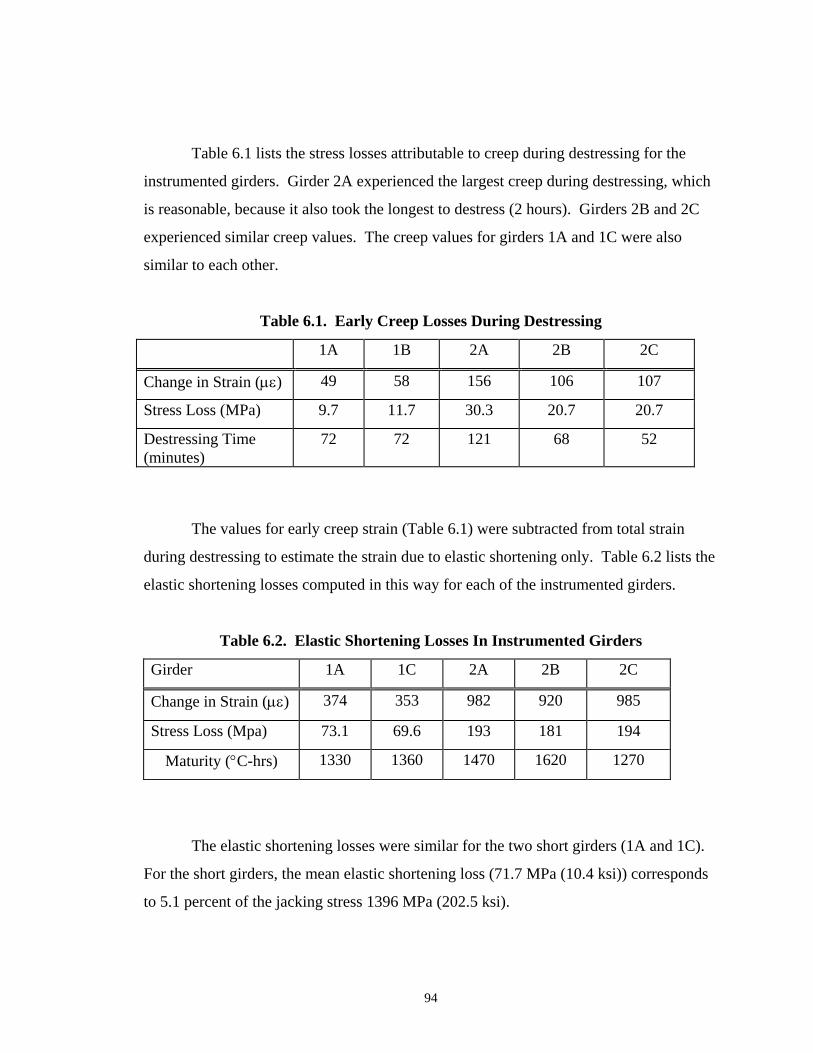
Table 6.1 lists the stress losses attributable to creep during destressing for the
instrumented girders. Girder 2A experienced the largest creep during destressing, which
is reasonable, because it also took the longest to destress (2 hours). Girders 2B and 2C
experienced similar creep values. The creep values for girders 1A and 1C were also
similar to each other.
Table 6.1. Early Creep Losses During Destressing
1A 1B 2A 2B 2C
Change in Strain (µε) 49 58 156 106 107
Stress Loss (MPa) 9.7 11.7 30.3 20.7 20.7
Destressing Time (minutes)
72 72 121 68 52
The values for early creep strain (Table 6.1) were subtracted from total strain
during destressing to estimate the strain due to elastic shortening only. Table 6.2 lists the
elastic shortening losses computed in this way for each of the instrumented girders.
Table 6.2. Elastic Shortening Losses In Instrumented Girders
Girder 1A 1C 2A 2B 2C
Change in Strain (µε) 374 353 982 920 985
Stress Loss (Mpa) 73.1 69.6 193 181 194
Maturity (°C-hrs) 1330 1360 1470 1620 1270
The elastic shortening losses were similar for the two short girders (1A and 1C).
For the short girders, the mean elastic shortening loss (71.7 MPa (10.4 ksi)) corresponds
to 5.1 percent of the jacking stress 1396 MPa (202.5 ksi).
94
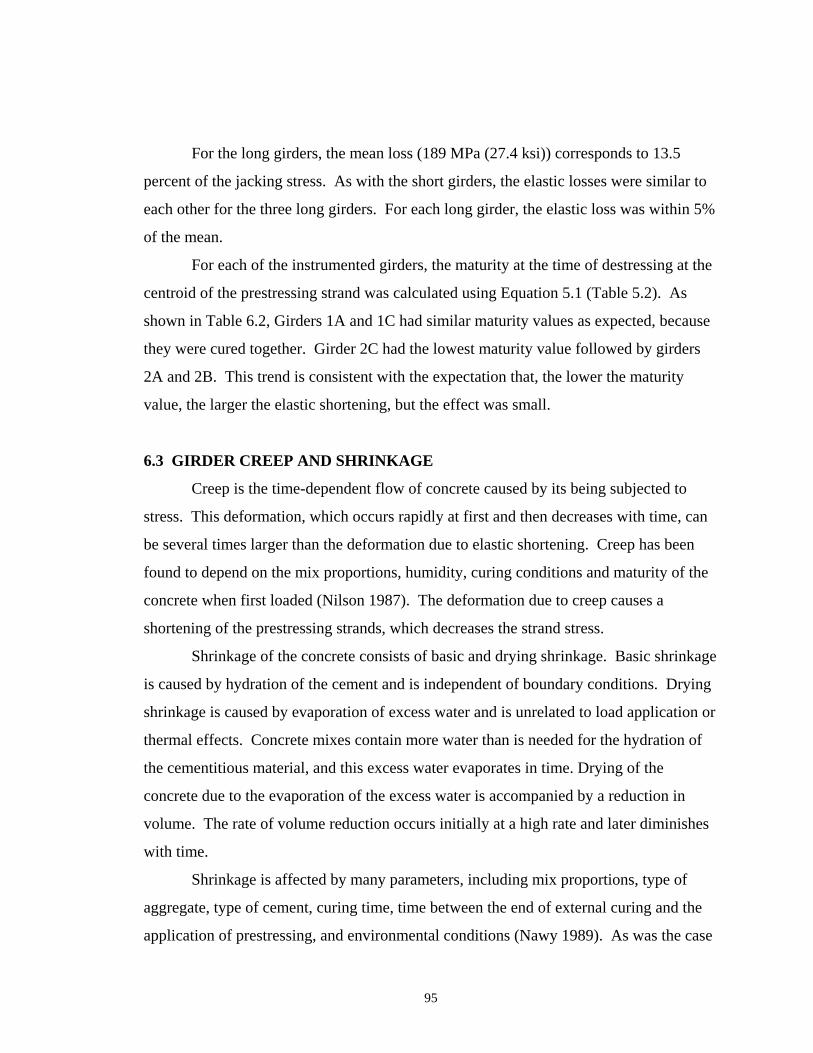
For the long girders, the mean loss (189 MPa (27.4 ksi)) corresponds to 13.5
percent of the jacking stress. As with the short girders, the elastic losses were similar to
each other for the three long girders. For each long girder, the elastic loss was within 5%
of the mean.
For each of the instrumented girders, the maturity at the time of destressing at the
centroid of the prestressing strand was calculated using Equation 5.1 (Table 5.2). As
shown in Table 6.2, Girders 1A and 1C had similar maturity values as expected, because
they were cured together. Girder 2C had the lowest maturity value followed by girders
2A and 2B. This trend is consistent with the expectation that, the lower the maturity
value, the larger the elastic shortening, but the effect was small.
6.3 GIRDER CREEP AND SHRINKAGE
Creep is the time-dependent flow of concrete caused by its being subjected to
stress. This deformation, which occurs rapidly at first and then decreases with time, can
be several times larger than the deformation due to elastic shortening. Creep has been
found to depend on the mix proportions, humidity, curing conditions and maturity of the
concrete when first loaded (Nilson 1987). The deformation due to creep causes a
shortening of the prestressing strands, which decreases the strand stress.
Shrinkage of the concrete consists of basic and drying shrinkage. Basic shrinkage
is caused by hydration of the cement and is independent of boundary conditions. Drying
shrinkage is caused by evaporation of excess water and is unrelated to load application or
thermal effects. Concrete mixes contain more water than is needed for the hydration of
the cementitious material, and this excess water evaporates in time. Drying of the
concrete due to the evaporation of the excess water is accompanied by a reduction in
volume. The rate of volume reduction occurs initially at a high rate and later diminishes
with time.
Shrinkage is affected by many parameters, including mix proportions, type of
aggregate, type of cement, curing time, time between the end of external curing and the
application of prestressing, and environmental conditions (Nawy 1989). As was the case
95
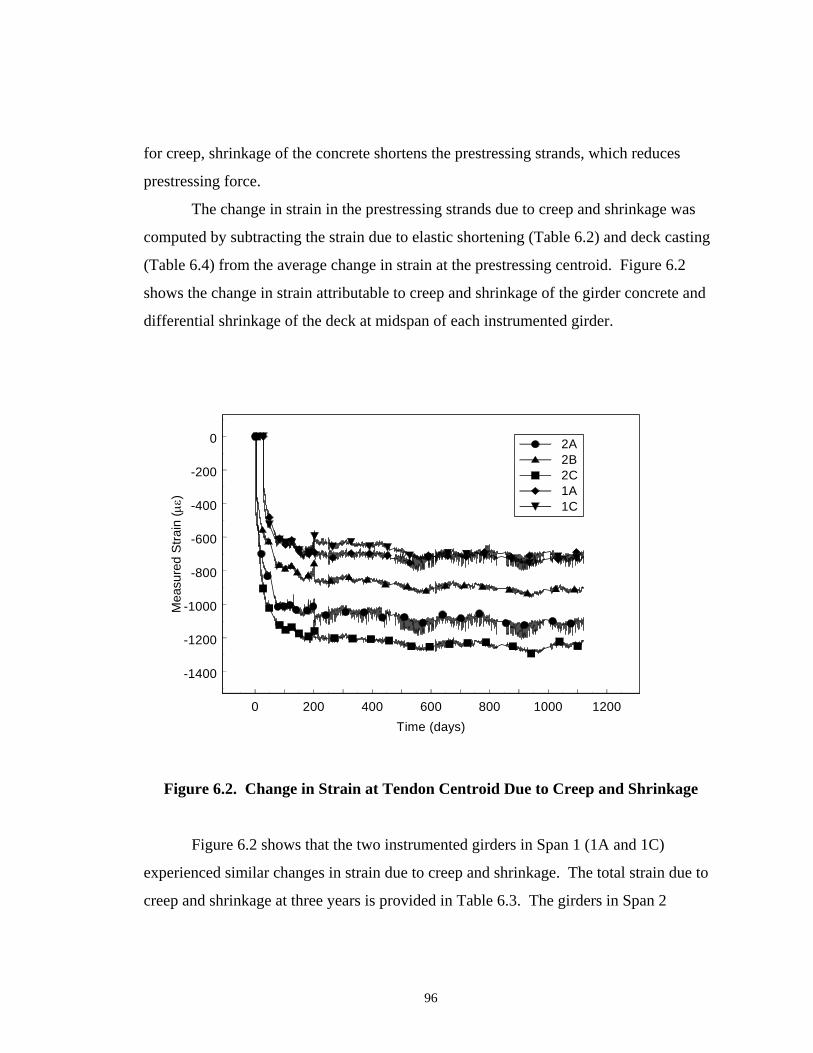
for creep, shrinkage of the concrete shortens the prestressing strands, which reduces
prestressing force.
The change in strain in the prestressing strands due to creep and shrinkage was
computed by subtracting the strain due to elastic shortening (Table 6.2) and deck casting
(Table 6.4) from the average change in strain at the prestressing centroid. Figure 6.2
shows the change in strain attributable to creep and shrinkage of the girder concrete and
differential shrinkage of the deck at midspan of each instrumented girder.
0 200 400 600 800 1000 1200Time (days)
-1400
-1200
-1000
-800
-600
-400
-200
0
Mea
sure
d St
rain
(µε)
2A2B2C1A1C
Figure 6.2. Change in Strain at Tendon Centroid Due to Creep and Shrinkage
Figure 6.2 shows that the two instrumented girders in Span 1 (1A and 1C)
experienced similar changes in strain due to creep and shrinkage. The total strain due to
creep and shrinkage at three years is provided in Table 6.3. The girders in Span 2
96
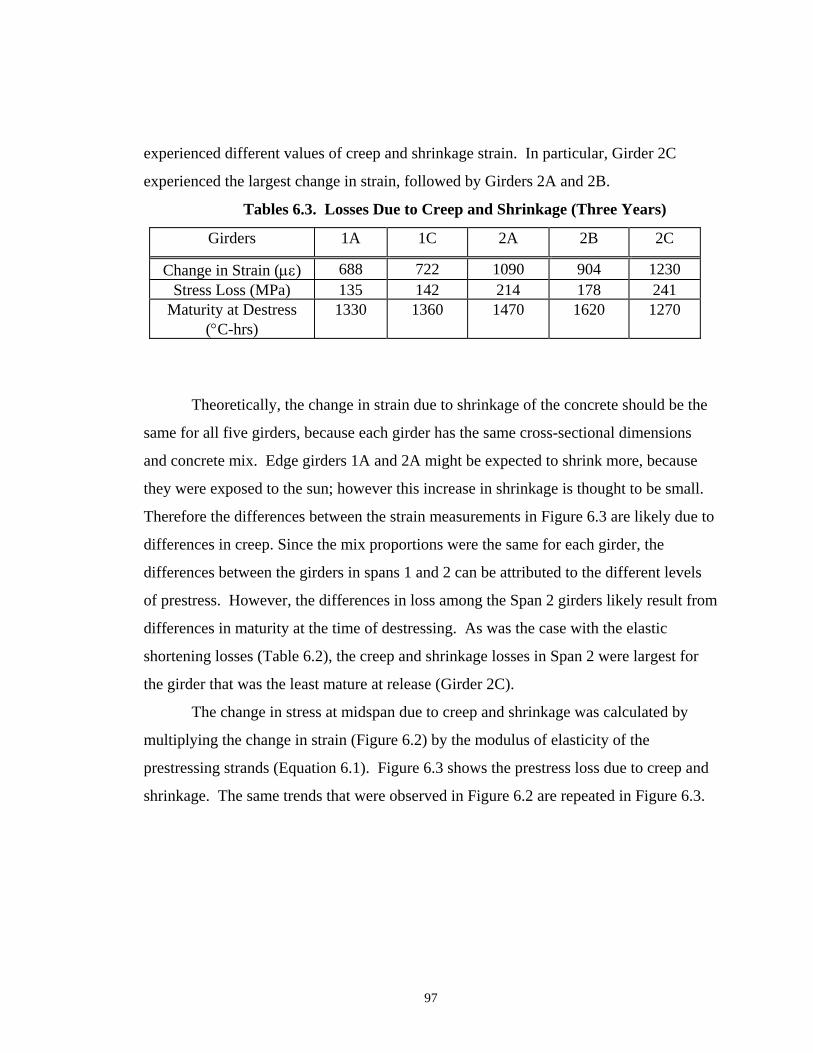
experienced different values of creep and shrinkage strain. In particular, Girder 2C
experienced the largest change in strain, followed by Girders 2A and 2B.
Tables 6.3. Losses Due to Creep and Shrinkage (Three Years)
Girders 1A 1C 2A 2B 2C
Change in Strain (µε) 688 722 1090 904 1230 Stress Loss (MPa) 135 142 214 178 241
Maturity at Destress (°C-hrs)
1330 1360 1470 1620 1270
Theoretically, the change in strain due to shrinkage of the concrete should be the
same for all five girders, because each girder has the same cross-sectional dimensions
and concrete mix. Edge girders 1A and 2A might be expected to shrink more, because
they were exposed to the sun; however this increase in shrinkage is thought to be small.
Therefore the differences between the strain measurements in Figure 6.3 are likely due to
differences in creep. Since the mix proportions were the same for each girder, the
differences between the girders in spans 1 and 2 can be attributed to the different levels
of prestress. However, the differences in loss among the Span 2 girders likely result from
differences in maturity at the time of destressing. As was the case with the elastic
shortening losses (Table 6.2), the creep and shrinkage losses in Span 2 were largest for
the girder that was the least mature at release (Girder 2C).
The change in stress at midspan due to creep and shrinkage was calculated by
multiplying the change in strain (Figure 6.2) by the modulus of elasticity of the
prestressing strands (Equation 6.1). Figure 6.3 shows the prestress loss due to creep and
shrinkage. The same trends that were observed in Figure 6.2 are repeated in Figure 6.3.
97
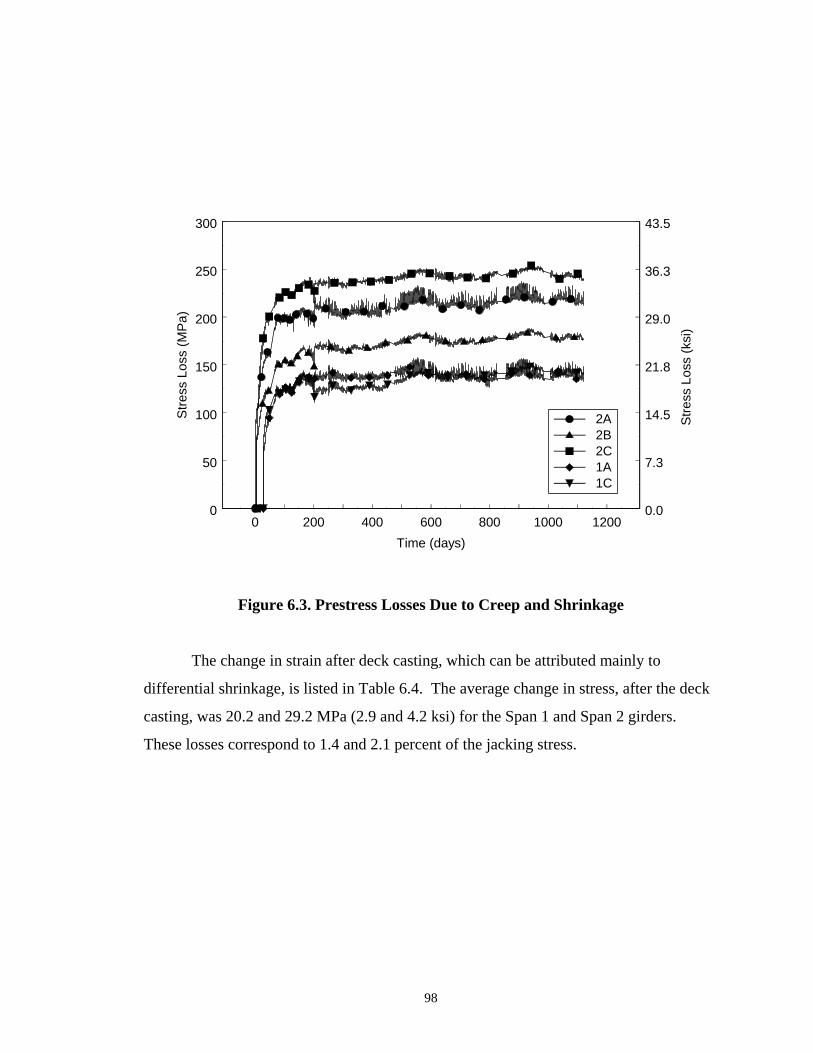
0 200 400 600 800 1000 1200Time (days)
0
50
100
150
200
250
300
Stre
ss L
oss
(MP
a)
2A2B2C1A1C
0.0
7.3
14.5
21.8
29.0
36.3
43.5
Stre
ss L
oss
(ksi
)
Figure 6.3. Prestress Losses Due to Creep and Shrinkage
The change in strain after deck casting, which can be attributed mainly to
differential shrinkage, is listed in Table 6.4. The average change in stress, after the deck
casting, was 20.2 and 29.2 MPa (2.9 and 4.2 ksi) for the Span 1 and Span 2 girders.
These losses correspond to 1.4 and 2.1 percent of the jacking stress.
98
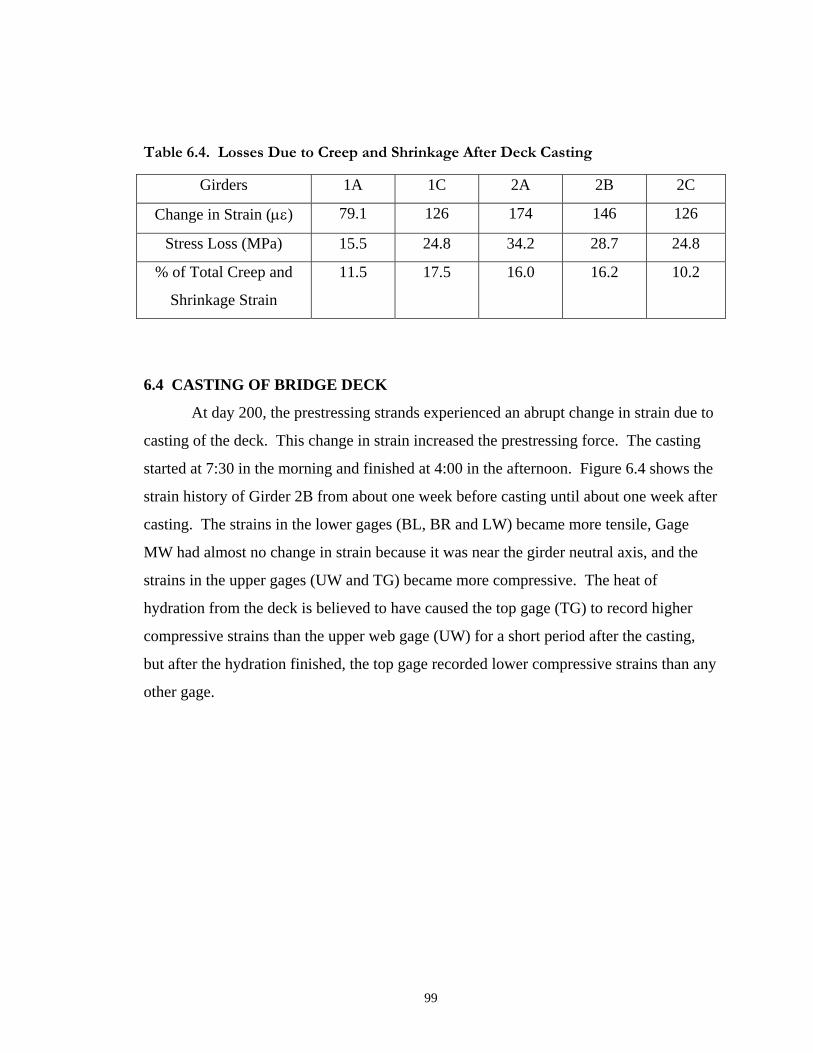
Table 6.4. Losses Due to Creep and Shrinkage After Deck Casting
Girders 1A 1C 2A 2B 2C
Change in Strain (µε) 79.1 126 174 146 126
Stress Loss (MPa) 15.5 24.8 34.2 28.7 24.8
% of Total Creep and
Shrinkage Strain
11.5 17.5 16.0 16.2 10.2
6.4 CASTING OF BRIDGE DECK
At day 200, the prestressing strands experienced an abrupt change in strain due to
casting of the deck. This change in strain increased the prestressing force. The casting
started at 7:30 in the morning and finished at 4:00 in the afternoon. Figure 6.4 shows the
strain history of Girder 2B from about one week before casting until about one week after
casting. The strains in the lower gages (BL, BR and LW) became more tensile, Gage
MW had almost no change in strain because it was near the girder neutral axis, and the
strains in the upper gages (UW and TG) became more compressive. The heat of
hydration from the deck is believed to have caused the top gage (TG) to record higher
compressive strains than the upper web gage (UW) for a short period after the casting,
but after the hydration finished, the top gage recorded lower compressive strains than any
other gage.
99
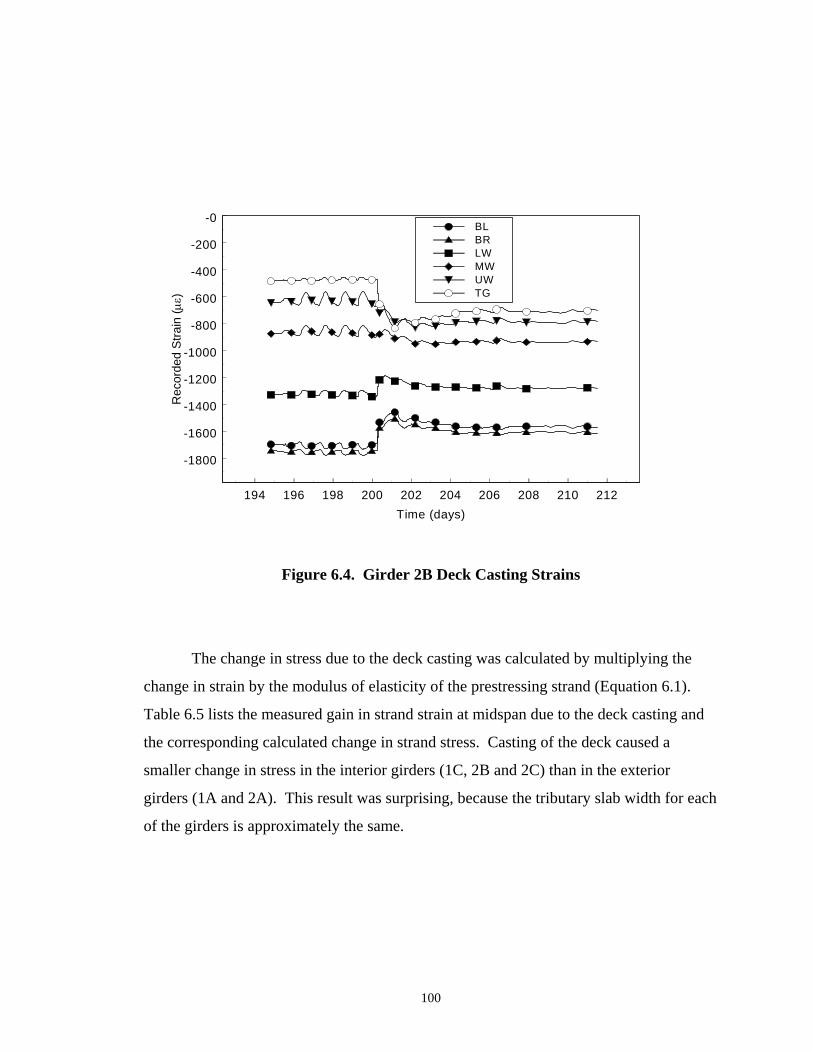
194 196 198 200 202 204 206 208 210 212Time (days)
-1800
-1600
-1400
-1200
-1000
-800
-600
-400
-200
-0
Rec
orde
d S
train
(µε)
BLBRLWMWUWTG
Figure 6.4. Girder 2B Deck Casting Strains
The change in stress due to the deck casting was calculated by multiplying the
change in strain by the modulus of elasticity of the prestressing strand (Equation 6.1).
Table 6.5 lists the measured gain in strand strain at midspan due to the deck casting and
the corresponding calculated change in strand stress. Casting of the deck caused a
smaller change in stress in the interior girders (1C, 2B and 2C) than in the exterior
girders (1A and 2A). This result was surprising, because the tributary slab width for each
of the girders is approximately the same.
100
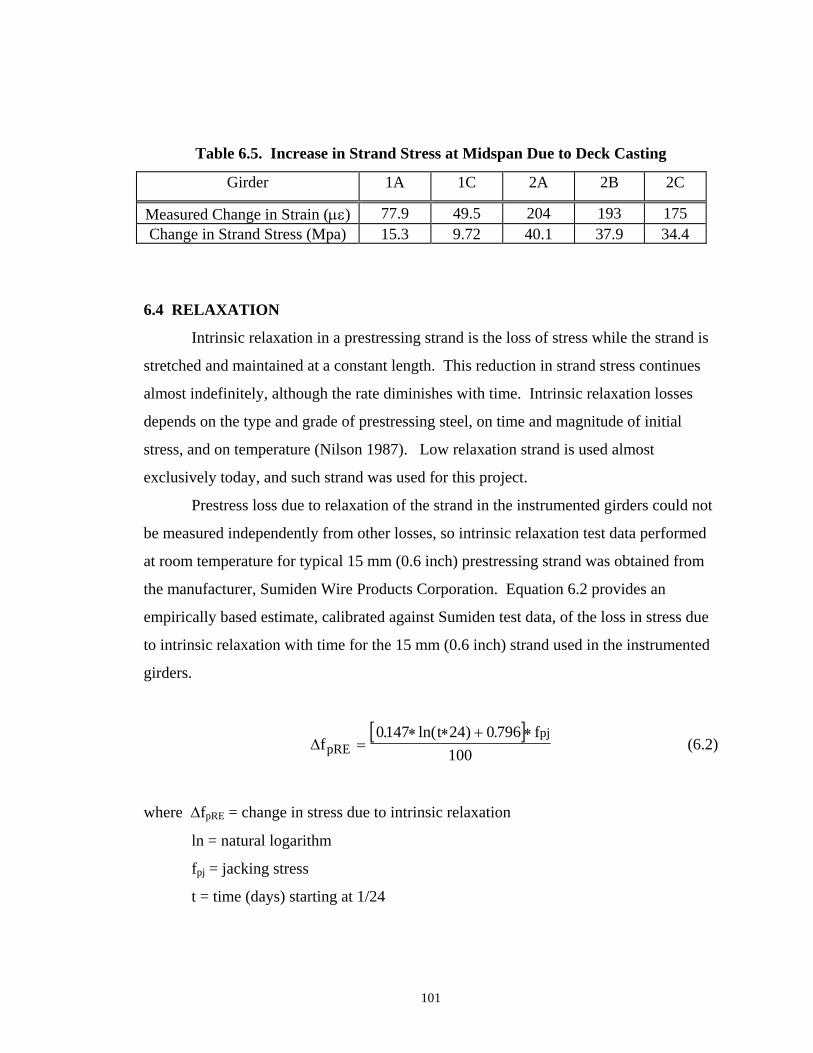
Table 6.5. Increase in Strand Stress at Midspan Due to Deck Casting
Girder 1A 1C 2A 2B 2C
Measured Change in Strain (µε) 77.9 49.5 204 193 175 Change in Strand Stress (Mpa) 15.3 9.72 40.1 37.9 34.4
6.4 RELAXATION
Intrinsic relaxation in a prestressing strand is the loss of stress while the strand is
stretched and maintained at a constant length. This reduction in strand stress continues
almost indefinitely, although the rate diminishes with time. Intrinsic relaxation losses
depends on the type and grade of prestressing steel, on time and magnitude of initial
stress, and on temperature (Nilson 1987). Low relaxation strand is used almost
exclusively today, and such strand was used for this project.
Prestress loss due to relaxation of the strand in the instrumented girders could not
be measured independently from other losses, so intrinsic relaxation test data performed
at room temperature for typical 15 mm (0.6 inch) prestressing strand was obtained from
the manufacturer, Sumiden Wire Products Corporation. Equation 6.2 provides an
empirically based estimate, calibrated against Sumiden test data, of the loss in stress due
to intrinsic relaxation with time for the 15 mm (0.6 inch) strand used in the instrumented
girders.
[ ]
∆fpRE =∗ ∗ + ∗0147 24 0 796
100. ln( ) .t fpj
(6.2)
where ∆fpRE = change in stress due to intrinsic relaxation
ln = natural logarithm
fpj = jacking stress
t = time (days) starting at 1/24
101
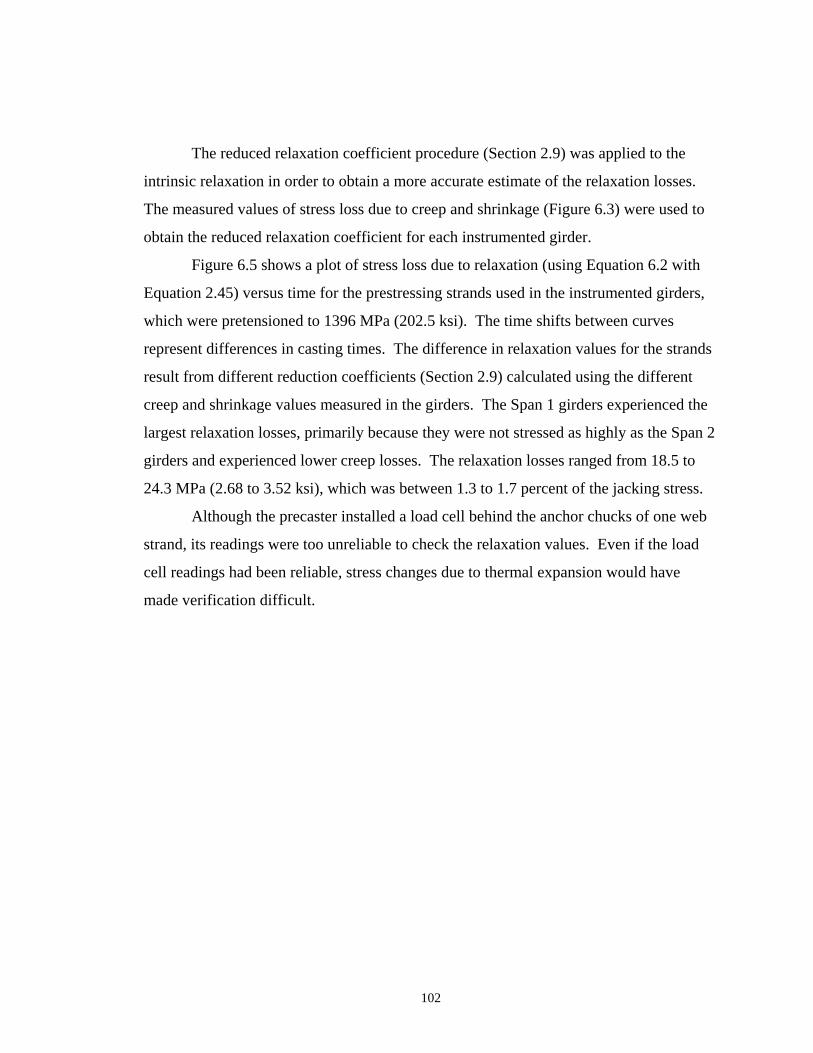
The reduced relaxation coefficient procedure (Section 2.9) was applied to the
intrinsic relaxation in order to obtain a more accurate estimate of the relaxation losses.
The measured values of stress loss due to creep and shrinkage (Figure 6.3) were used to
obtain the reduced relaxation coefficient for each instrumented girder.
Figure 6.5 shows a plot of stress loss due to relaxation (using Equation 6.2 with
Equation 2.45) versus time for the prestressing strands used in the instrumented girders,
which were pretensioned to 1396 MPa (202.5 ksi). The time shifts between curves
represent differences in casting times. The difference in relaxation values for the strands
result from different reduction coefficients (Section 2.9) calculated using the different
creep and shrinkage values measured in the girders. The Span 1 girders experienced the
largest relaxation losses, primarily because they were not stressed as highly as the Span 2
girders and experienced lower creep losses. The relaxation losses ranged from 18.5 to
24.3 MPa (2.68 to 3.52 ksi), which was between 1.3 to 1.7 percent of the jacking stress.
Although the precaster installed a load cell behind the anchor chucks of one web
strand, its readings were too unreliable to check the relaxation values. Even if the load
cell readings had been reliable, stress changes due to thermal expansion would have
made verification difficult.
102
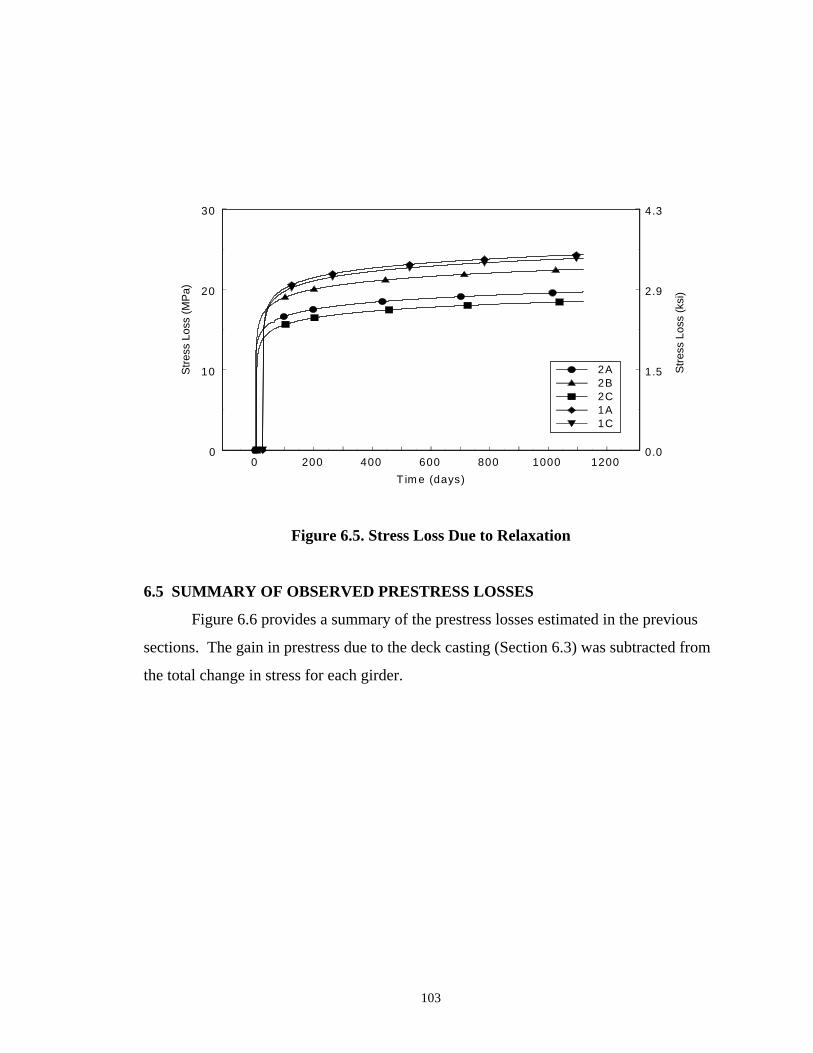
0 200 400 600 800 1000 1200T im e (days)
0
10
20
30
Stre
ss L
oss
(MPa
)
2A2B2C1A1C
0.0
1.5
2.9
4.3
Stre
ss L
oss
(ksi
)
Figure 6.5. Stress Loss Due to Relaxation
6.5 SUMMARY OF OBSERVED PRESTRESS LOSSES
Figure 6.6 provides a summary of the prestress losses estimated in the previous
sections. The gain in prestress due to the deck casting (Section 6.3) was subtracted from
the total change in stress for each girder.
103
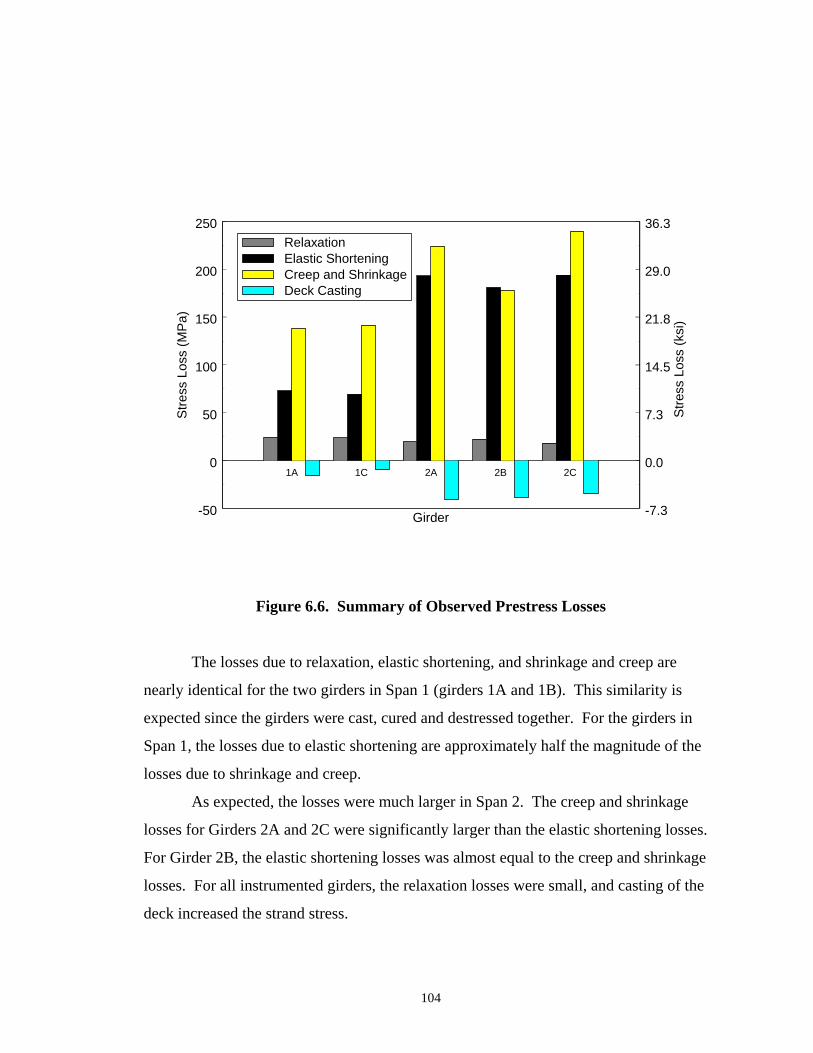
1A 1C 2A 2B 2C
Girder-50
0
50
100
150
200
250
Stre
ss L
oss
(MP
a)
-7.3
0.0
7.3
14.5
21.8
29.0
36.3
Stre
ss L
oss
(ksi
)
RelaxationElastic ShorteningCreep and ShrinkageDeck Casting
Figure 6.6. Summary of Observed Prestress Losses
The losses due to relaxation, elastic shortening, and shrinkage and creep are
nearly identical for the two girders in Span 1 (girders 1A and 1B). This similarity is
expected since the girders were cast, cured and destressed together. For the girders in
Span 1, the losses due to elastic shortening are approximately half the magnitude of the
losses due to shrinkage and creep.
As expected, the losses were much larger in Span 2. The creep and shrinkage
losses for Girders 2A and 2C were significantly larger than the elastic shortening losses.
For Girder 2B, the elastic shortening losses was almost equal to the creep and shrinkage
losses. For all instrumented girders, the relaxation losses were small, and casting of the
deck increased the strand stress.
104
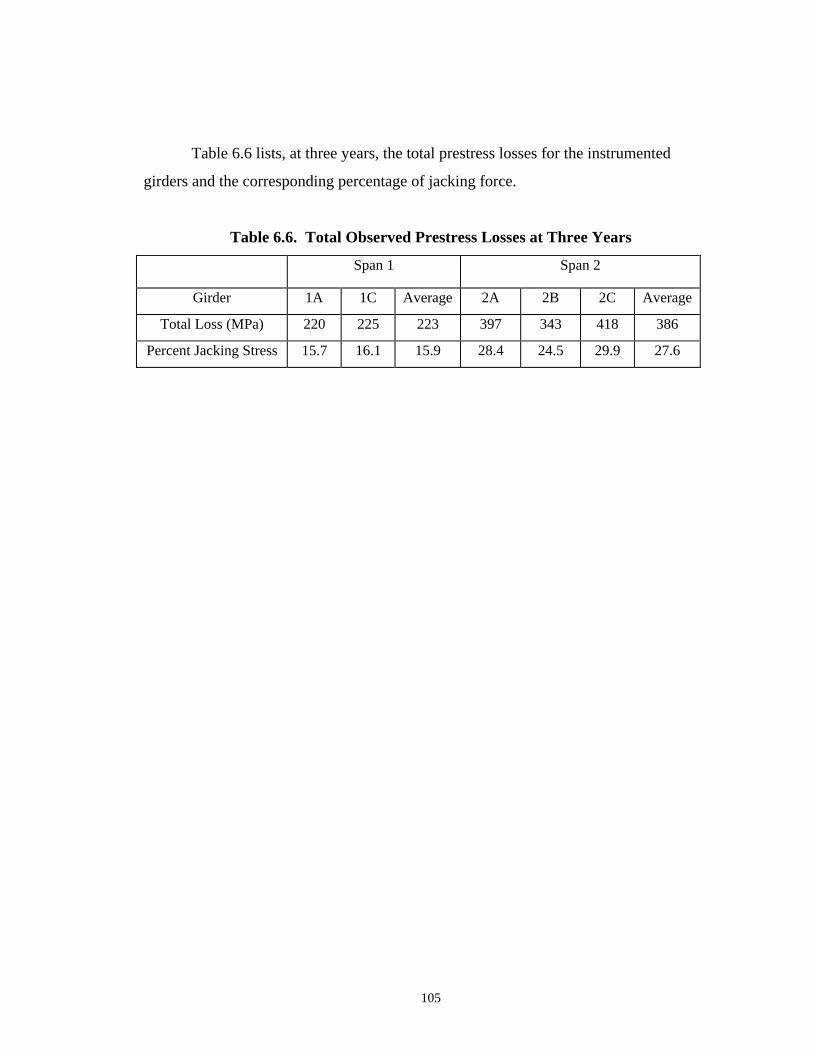
Table 6.6 lists, at three years, the total prestress losses for the instrumented
girders and the corresponding percentage of jacking force.
Table 6.6. Total Observed Prestress Losses at Three Years
Span 1 Span 2
Girder 1A 1C Average 2A 2B 2C Average
Total Loss (MPa) 220 225 223 397 343 418 386
Percent Jacking Stress 15.7 16.1 15.9 28.4 24.5 29.9 27.6
105

CHAPTER 7
COMPARISON WITH OBSERVED PRESTRESS LOSSES
In this chapter, the observed values of prestress losses (Chapter 6) are compared
with values calculated using the recommended PCI General Method (PCI 1975) and
AASHTO LRFD Specifications (AASHTO 1994). The material properties used in these
methods were based on design equations, rather than measured values, in order to
simulate the estimates that would be made during design.
The PCI General Method is a time-stepping algorithm, in which the incremental
loss of prestress in each time interval is calculated using the total stress at the start of the
interval (Section 2.6). The total stress is then updated before calculating the incremental
loss in the next interval. For the AASHTO Refined Method, the total prestress loss at the
end of the service life is calculated in a single step. The AASHTO Refined Method was
modified into a time-history method in this chapter by multiplying the ultimate prestress
loss predicted by the AASHTO method by creep and shrinkage coefficients provided in
the AASHTO Specifications (Section 2.3).
7.1 ELASTIC SHORTENING
In this section, the measured elastic shortening losses in the instrumented girders
(1A,1C, 2A, 2B and 2C), and the elastic shortening losses predicted using the AASHTO
LRFD Specifications (1994) and the PCI General Method (1975) are compared. The
predicted elastic shortening losses were calculated using the guidelines presented in
Section 2.2 (AASHTO LRFD Specifications) and Section 2.6 (PCI General Method).
The measured elastic shortening losses were reported in Section 6.2.
The assumed value of the modulus of elasticity at transfer (Eci) greatly affects the
calculated elastic shortening loss. According to the AASHTO LRFD Specifications
(1994), Eci should be calculated as
106
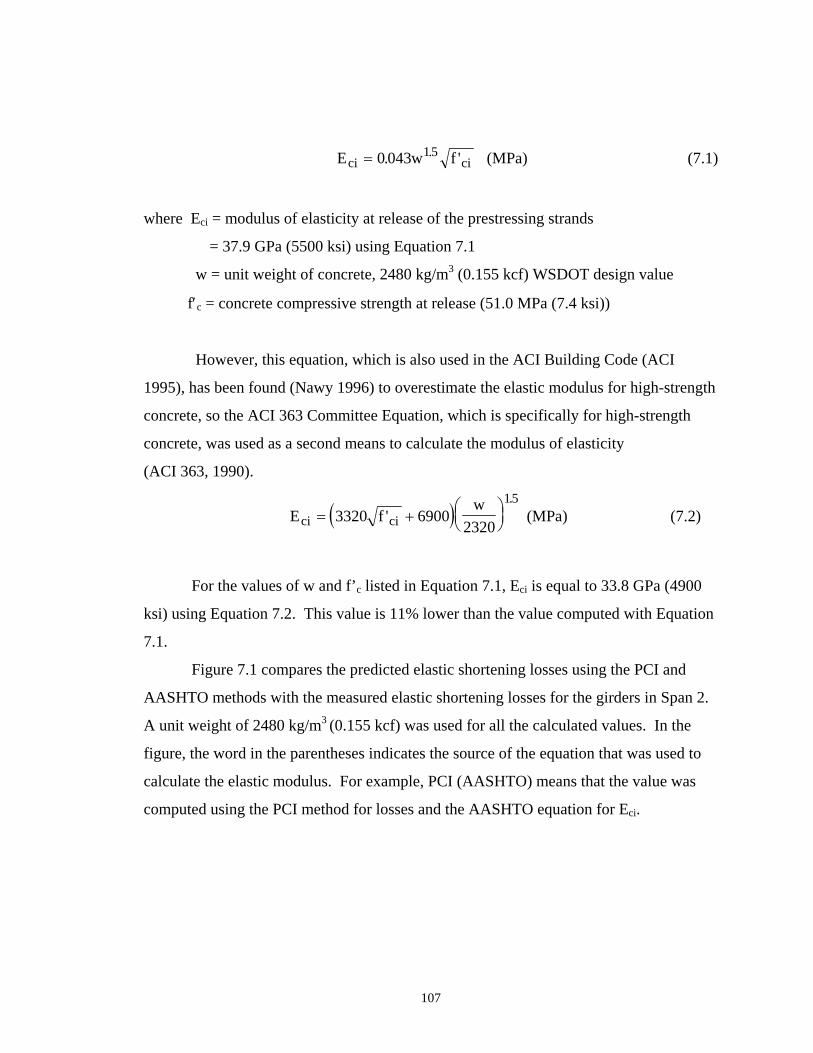
E wci ci= 0 043 15. . f ' (MPa) (7.1)
where Eci = modulus of elasticity at release of the prestressing strands
= 37.9 GPa (5500 ksi) using Equation 7.1
w = unit weight of concrete, 2480 kg/m3 (0.155 kcf) WSDOT design value
f′c = concrete compressive strength at release (51.0 MPa (7.4 ksi))
However, this equation, which is also used in the ACI Building Code (ACI
1995), has been found (Nawy 1996) to overestimate the elastic modulus for high-strength
concrete, so the ACI 363 Committee Equation, which is specifically for high-strength
concrete, was used as a second means to calculate the modulus of elasticity
(ACI 363, 1990).
( )E fw
ci ci= +⎛⎝⎜
⎞⎠⎟3320 6900
2320
15'
. (MPa) (7.2)
For the values of w and f’c listed in Equation 7.1, Eci is equal to 33.8 GPa (4900
ksi) using Equation 7.2. This value is 11% lower than the value computed with Equation
7.1.
Figure 7.1 compares the predicted elastic shortening losses using the PCI and
AASHTO methods with the measured elastic shortening losses for the girders in Span 2.
A unit weight of 2480 kg/m3 (0.155 kcf) was used for all the calculated values. In the
figure, the word in the parentheses indicates the source of the equation that was used to
calculate the elastic modulus. For example, PCI (AASHTO) means that the value was
computed using the PCI method for losses and the AASHTO equation for Eci.
107
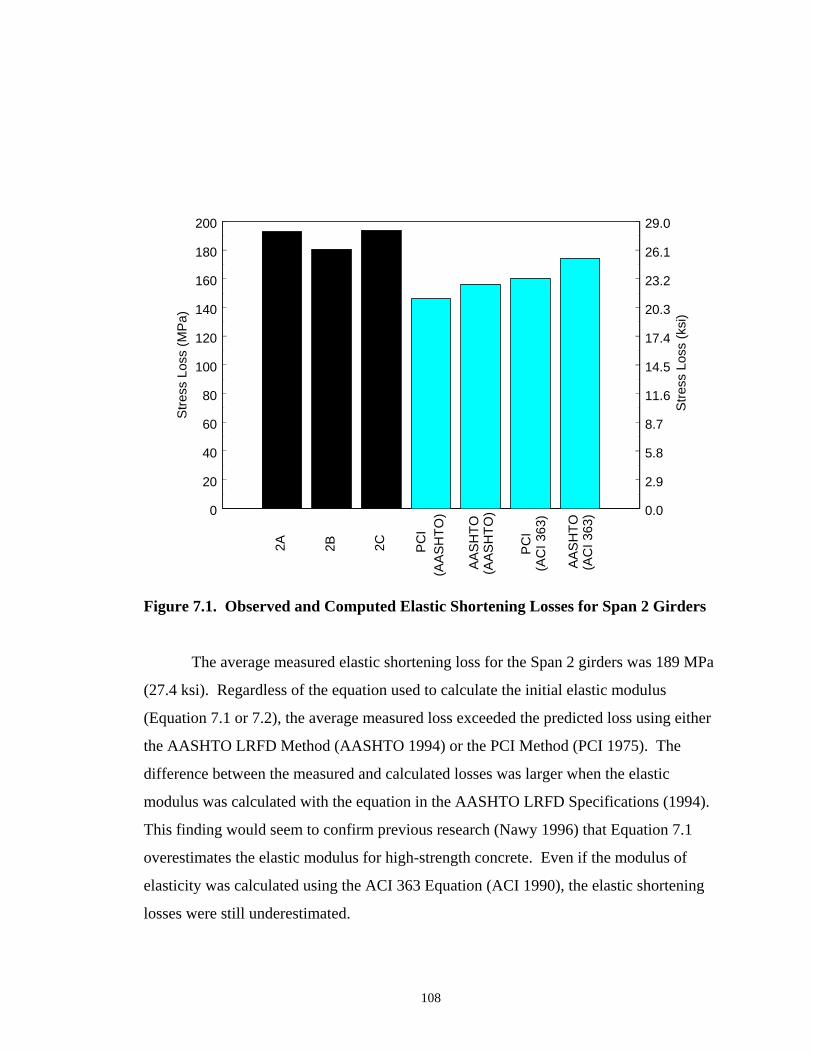
0
20
40
60
80
100
120
140
160
180
200
Stre
ss L
oss
(MP
a)
0.0
2.9
5.8
8.7
11.6
14.5
17.4
20.3
23.2
26.1
29.0
Stre
ss L
oss
(ksi
)
2A 2B 2C PC
I
AASH
TO
PC
I
AAS
HTO
(AAS
HTO
)
(AAS
HTO
)
(AC
I 363
)
(AC
I 363
)
Figure 7.1. Observed and Computed Elastic Shortening Losses for Span 2 Girders
The average measured elastic shortening loss for the Span 2 girders was 189 MPa
(27.4 ksi). Regardless of the equation used to calculate the initial elastic modulus
(Equation 7.1 or 7.2), the average measured loss exceeded the predicted loss using either
the AASHTO LRFD Method (AASHTO 1994) or the PCI Method (PCI 1975). The
difference between the measured and calculated losses was larger when the elastic
modulus was calculated with the equation in the AASHTO LRFD Specifications (1994).
This finding would seem to confirm previous research (Nawy 1996) that Equation 7.1
overestimates the elastic modulus for high-strength concrete. Even if the modulus of
elasticity was calculated using the ACI 363 Equation (ACI 1990), the elastic shortening
losses were still underestimated.
108
Compared with the PCI exact method, the approximate AASHTO LRFD Method
predicts elastic shortening losses that were closer to the measured losses. This result
does not indicate that the AASHTO method is better than the PCI method. Because the
same elastic modulus was used for both methods, the difference lies in the calculation of
the initial prestress force. The AASHTO method approximates the initial stress after
transfer as 0.7fpu (1300 MPa (189 ksi))(Equation 2.3). This value is higher than the
measured initial prestress stress (1396–189 =1207 MPa (202.5-27.4 = 175 ksi)).
Essentially, the AASHTO result is closer to the measured losses only because it
overestimated the initial prestress.
Figure 7.2 shows the measured and predicted elastic shortening losses for Span 1
using a unit weight of 2480 kg/m3 (0.155 kcf). The same notation that was used in Figure
7.1 is used in 7.2.
0
10
20
30
40
50
60
70
80
Stre
ss L
oss
(MPa
)
0.0
1.5
2.9
4.3
5.8
7.3
8.7
10.1
11.6
Stre
ss L
oss
(ksi
)
1A 1C PCI
PC
I
AA
SHTO
AA
SHTO
(AA
SHTO
)
(AA
SHTO
)
(AC
I 363
)
(AC
I 363
)
Figure 7.2. Observed and Predicted Elastic Shortening Losses for Span 1 Girder
109

For the Span 1 girders, the average measured loss was 71.3 MPa (10.3 ksi). The
losses are smaller than those in Span 2, because fewer prestressing strands were used. In
Span 1, the PCI and AASHTO methods again underestimated the measured elastic
shortening losses. As with the Span 2 girders, the predicted elastic shortening losses
were closer to the measured losses when the elastic modulus was calculated with the ACI
363 equation (Equation 7.2).
The elastic shortening losses predicted using the AASHTO LRFD Method and the
PCI Method were within 2% of each other, with the PCI Method predicting slightly
higher losses. For Span 1, the AASHTO method now predicts lower losses than the PCI
method, because the approximated initial prestress (1300 MPa (189 ksi)) is now lower
than the actual prestress (1396 - 71.3 = 1325 MPa (202.5 – 10.3 = 192 ksi)).
Two explanations are possible as to why the measured elastic shortening is higher
than the predicted: (1) either the calculated elastic modulus was larger than the actual
elastic modulus or (2) the estimated values of early creep losses was too low
(Section 6.1).
Part of the discrepancy between measured and predicted losses can be attributed
to using too high a value for the unit weight of concrete. The WSDOT used a value of
2480 kg/m3 (0.155 kcf) for the unit weight of the concrete. The unit weight of the
concrete measured by Central Premix Company was 2400 kg/m3 (0.150 kcf), which is 3%
lower. If the measured unit weight had been used in design, the calculated modulus of
elasticity would have decreased by 5%.
Table 7.1 lists the average observed and predicted elastic shortening losses as a
percentage of the total jacking stress for unit weights of 2480 kg/m3 (0.155 kcf) and 2400
kg/m3 (0.150 kcf). Table 7.1 shows that, when the measured value of concrete unit
weight (2400 kg/m3 (0.150 kcf)) was used, the predicted elastic shortening losses were
closer to the average measured values.
110
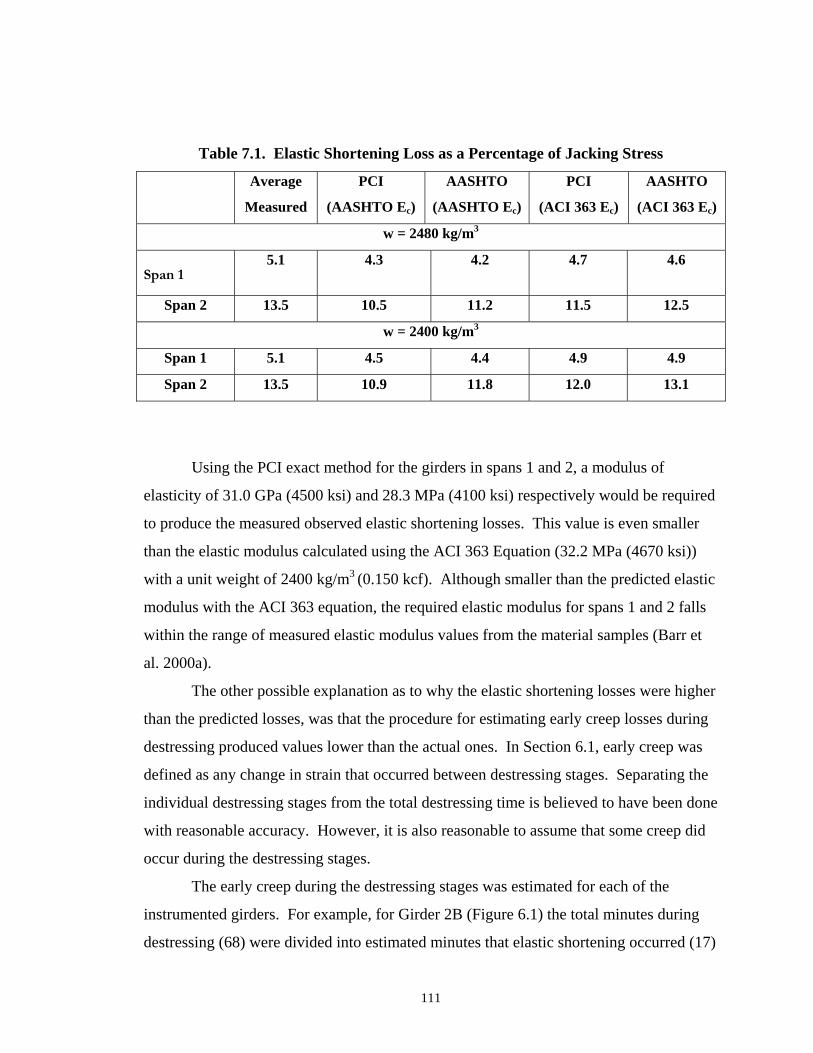
Table 7.1. Elastic Shortening Loss as a Percentage of Jacking Stress
Average
Measured
PCI
(AASHTO Ec)
AASHTO
(AASHTO Ec)
PCI
(ACI 363 Ec)
AASHTO
(ACI 363 Ec)
w = 2480 kg/m3
Span 1 5.1 4.3 4.2 4.7 4.6
Span 2 13.5 10.5 11.2 11.5 12.5
w = 2400 kg/m3
Span 1 5.1 4.5 4.4 4.9 4.9
Span 2 13.5 10.9 11.8 12.0 13.1
Using the PCI exact method for the girders in spans 1 and 2, a modulus of
elasticity of 31.0 GPa (4500 ksi) and 28.3 MPa (4100 ksi) respectively would be required
to produce the measured observed elastic shortening losses. This value is even smaller
than the elastic modulus calculated using the ACI 363 Equation (32.2 MPa (4670 ksi))
with a unit weight of 2400 kg/m3 (0.150 kcf). Although smaller than the predicted elastic
modulus with the ACI 363 equation, the required elastic modulus for spans 1 and 2 falls
within the range of measured elastic modulus values from the material samples (Barr et
al. 2000a).
The other possible explanation as to why the elastic shortening losses were higher
than the predicted losses, was that the procedure for estimating early creep losses during
destressing produced values lower than the actual ones. In Section 6.1, early creep was
defined as any change in strain that occurred between destressing stages. Separating the
individual destressing stages from the total destressing time is believed to have been done
with reasonable accuracy. However, it is also reasonable to assume that some creep did
occur during the destressing stages.
The early creep during the destressing stages was estimated for each of the
instrumented girders. For example, for Girder 2B (Figure 6.1) the total minutes during
destressing (68) were divided into estimated minutes that elastic shortening occurred (17)
111
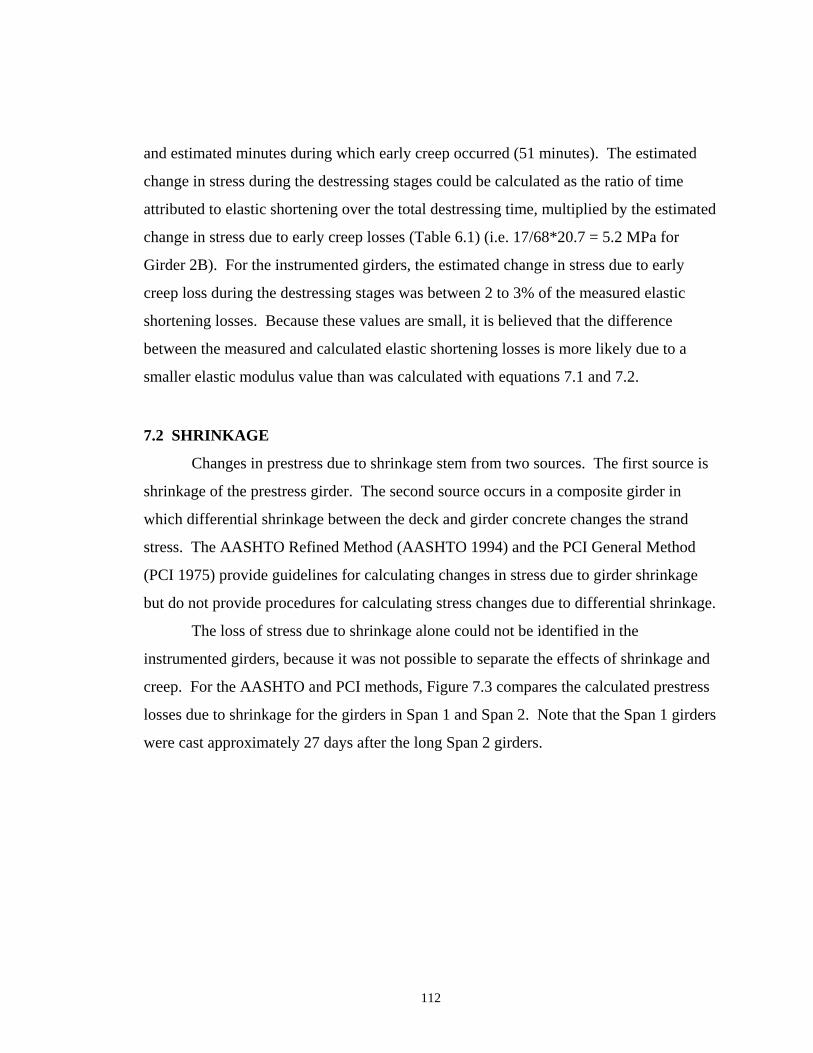
and estimated minutes during which early creep occurred (51 minutes). The estimated
change in stress during the destressing stages could be calculated as the ratio of time
attributed to elastic shortening over the total destressing time, multiplied by the estimated
change in stress due to early creep losses (Table 6.1) (i.e. 17/68*20.7 = 5.2 MPa for
Girder 2B). For the instrumented girders, the estimated change in stress due to early
creep loss during the destressing stages was between 2 to 3% of the measured elastic
shortening losses. Because these values are small, it is believed that the difference
between the measured and calculated elastic shortening losses is more likely due to a
smaller elastic modulus value than was calculated with equations 7.1 and 7.2.
7.2 SHRINKAGE
Changes in prestress due to shrinkage stem from two sources. The first source is
shrinkage of the prestress girder. The second source occurs in a composite girder in
which differential shrinkage between the deck and girder concrete changes the strand
stress. The AASHTO Refined Method (AASHTO 1994) and the PCI General Method
(PCI 1975) provide guidelines for calculating changes in stress due to girder shrinkage
but do not provide procedures for calculating stress changes due to differential shrinkage.
The loss of stress due to shrinkage alone could not be identified in the
instrumented girders, because it was not possible to separate the effects of shrinkage and
creep. For the AASHTO and PCI methods, Figure 7.3 compares the calculated prestress
losses due to shrinkage for the girders in Span 1 and Span 2. Note that the Span 1 girders
were cast approximately 27 days after the long Span 2 girders.
112
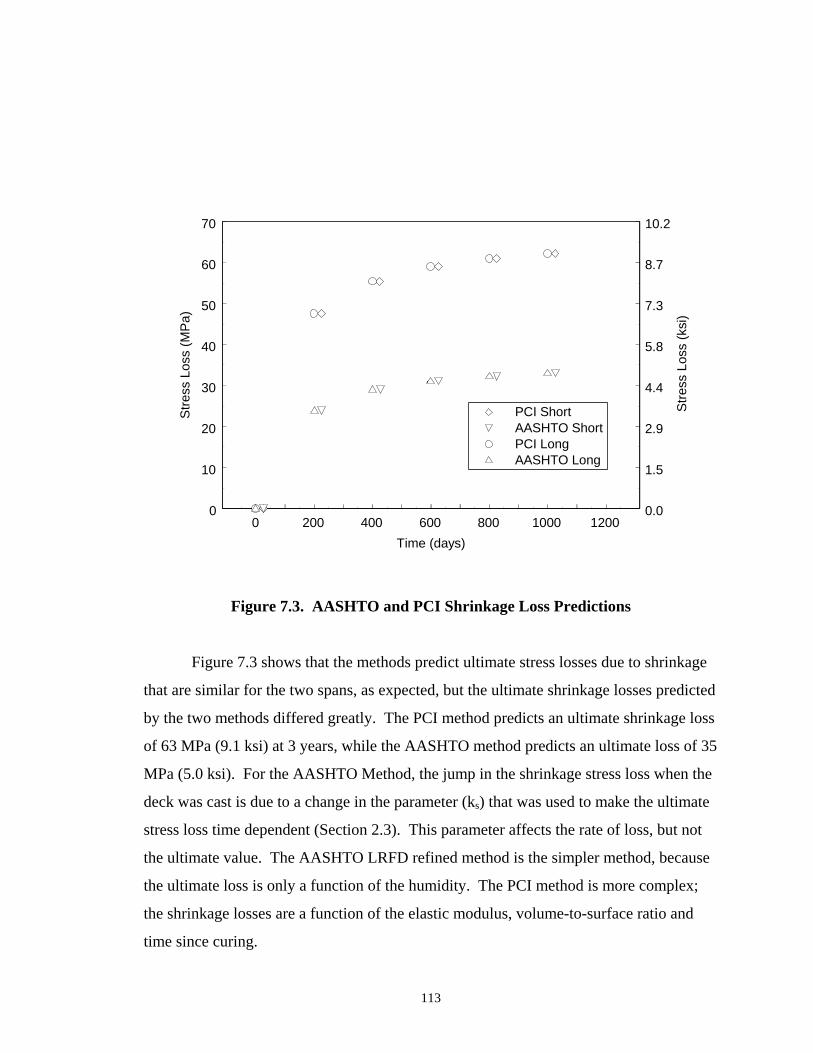
0 200 400 600 800 1000 1200Time (days)
0
10
20
30
40
50
60
70
Stre
ss L
oss
(MP
a)
0.0
1.5
2.9
4.4
5.8
7.3
8.7
10.2
Stre
ss L
oss
(ksi
)
PCI ShortAASHTO ShortPCI LongAASHTO Long
Figure 7.3. AASHTO and PCI Shrinkage Loss Predictions
Figure 7.3 shows that the methods predict ultimate stress losses due to shrinkage
that are similar for the two spans, as expected, but the ultimate shrinkage losses predicted
by the two methods differed greatly. The PCI method predicts an ultimate shrinkage loss
of 63 MPa (9.1 ksi) at 3 years, while the AASHTO method predicts an ultimate loss of 35
MPa (5.0 ksi). For the AASHTO Method, the jump in the shrinkage stress loss when the
deck was cast is due to a change in the parameter (ks) that was used to make the ultimate
stress loss time dependent (Section 2.3). This parameter affects the rate of loss, but not
the ultimate value. The AASHTO LRFD refined method is the simpler method, because
the ultimate loss is only a function of the humidity. The PCI method is more complex;
the shrinkage losses are a function of the elastic modulus, volume-to-surface ratio and
time since curing.
113
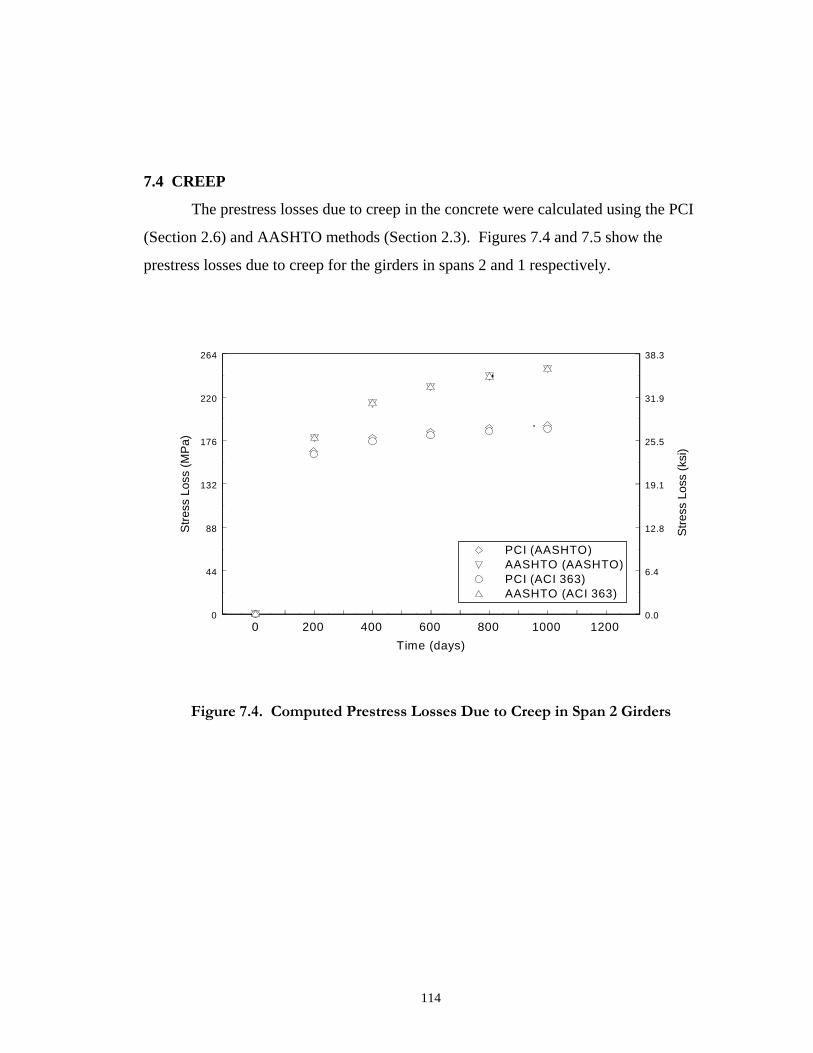
7.4 CREEP
The prestress losses due to creep in the concrete were calculated using the PCI
(Section 2.6) and AASHTO methods (Section 2.3). Figures 7.4 and 7.5 show the
prestress losses due to creep for the girders in spans 2 and 1 respectively.
0 200 400 600 800 1000 1200Time (days)
0
44
88
132
176
220
264
Stre
ss L
oss
(MPa
)
0.0
6.4
12.8
19.1
25.5
31.9
38.3
Stre
ss L
oss
(ksi
)
PCI (AASHTO)AASHTO (AASHTO)PCI (ACI 363)AASHTO (ACI 363)
Figure 7.4. Computed Prestress Losses Due to Creep in Span 2 Girders
114
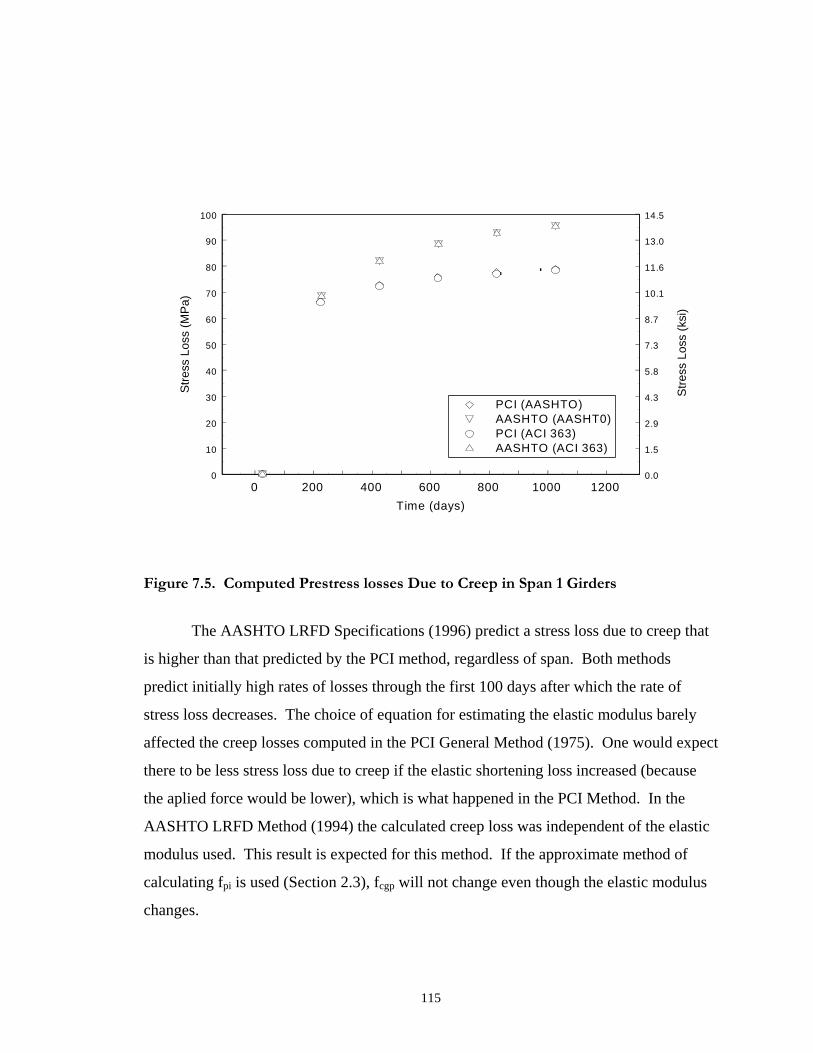
0 200 400 600 800 1000 1200Time (days)
0
10
20
30
40
50
60
70
80
90
100
Stre
ss L
oss
(MPa
)
0.0
1.5
2.9
4.3
5.8
7.3
8.7
10.1
11.6
13.0
14.5
Stre
ss L
oss
(ksi
)
PCI (AASHTO)AASHTO (AASHT0)PCI (ACI 363)AASHTO (ACI 363)
Figure 7.5. Computed Prestress losses Due to Creep in Span 1 Girders
The AASHTO LRFD Specifications (1996) predict a stress loss due to creep that
is higher than that predicted by the PCI method, regardless of span. Both methods
predict initially high rates of losses through the first 100 days after which the rate of
stress loss decreases. The choice of equation for estimating the elastic modulus barely
affected the creep losses computed in the PCI General Method (1975). One would expect
there to be less stress loss due to creep if the elastic shortening loss increased (because
the aplied force would be lower), which is what happened in the PCI Method. In the
AASHTO LRFD Method (1994) the calculated creep loss was independent of the elastic
modulus used. This result is expected for this method. If the approximate method of
calculating fpi is used (Section 2.3), fcgp will not change even though the elastic modulus
changes.
115
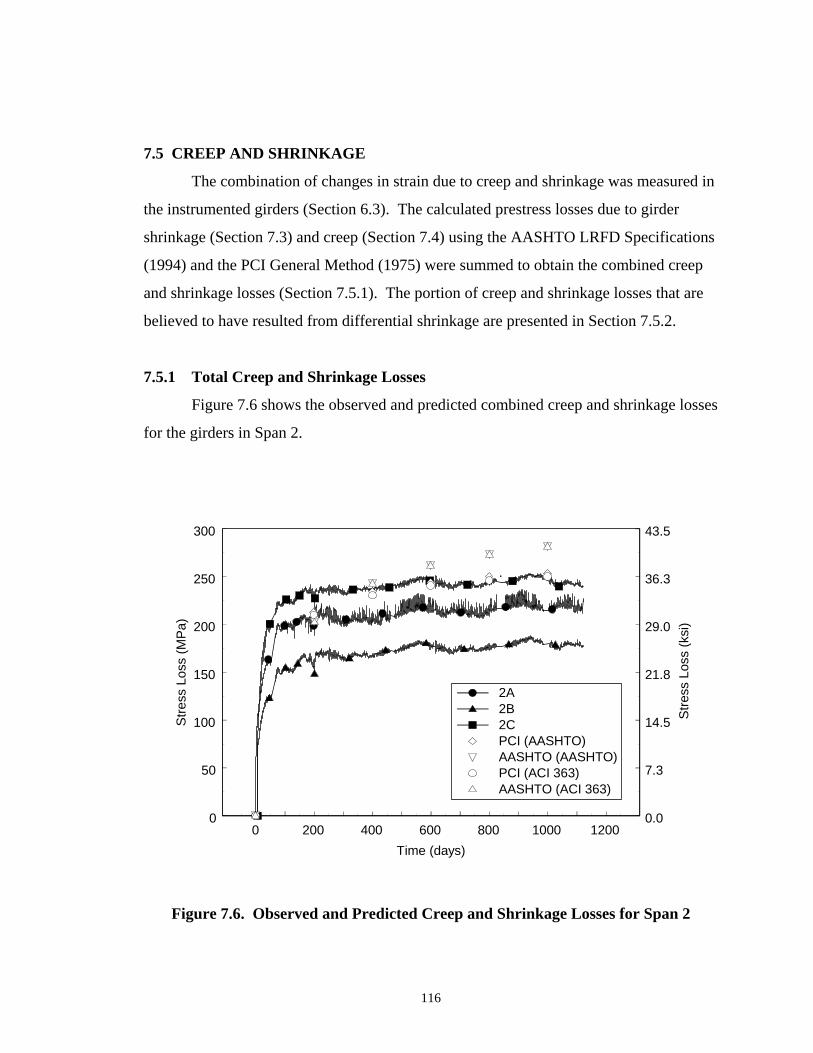
7.5 CREEP AND SHRINKAGE
The combination of changes in strain due to creep and shrinkage was measured in
the instrumented girders (Section 6.3). The calculated prestress losses due to girder
shrinkage (Section 7.3) and creep (Section 7.4) using the AASHTO LRFD Specifications
(1994) and the PCI General Method (1975) were summed to obtain the combined creep
and shrinkage losses (Section 7.5.1). The portion of creep and shrinkage losses that are
believed to have resulted from differential shrinkage are presented in Section 7.5.2.
7.5.1 Total Creep and Shrinkage Losses
Figure 7.6 shows the observed and predicted combined creep and shrinkage losses
for the girders in Span 2.
0 200 400 600 800 1000 1200Time (days)
0
50
100
150
200
250
300
Stre
ss L
oss
(MP
a)
2A2B2CPCI (AASHTO)AASHTO (AASHTO)PCI (ACI 363)AASHTO (ACI 363)
0.0
7.3
14.5
21.8
29.0
36.3
43.5
Stre
ss L
oss
(ksi
)
Figure 7.6. Observed and Predicted Creep and Shrinkage Losses for Span 2
116
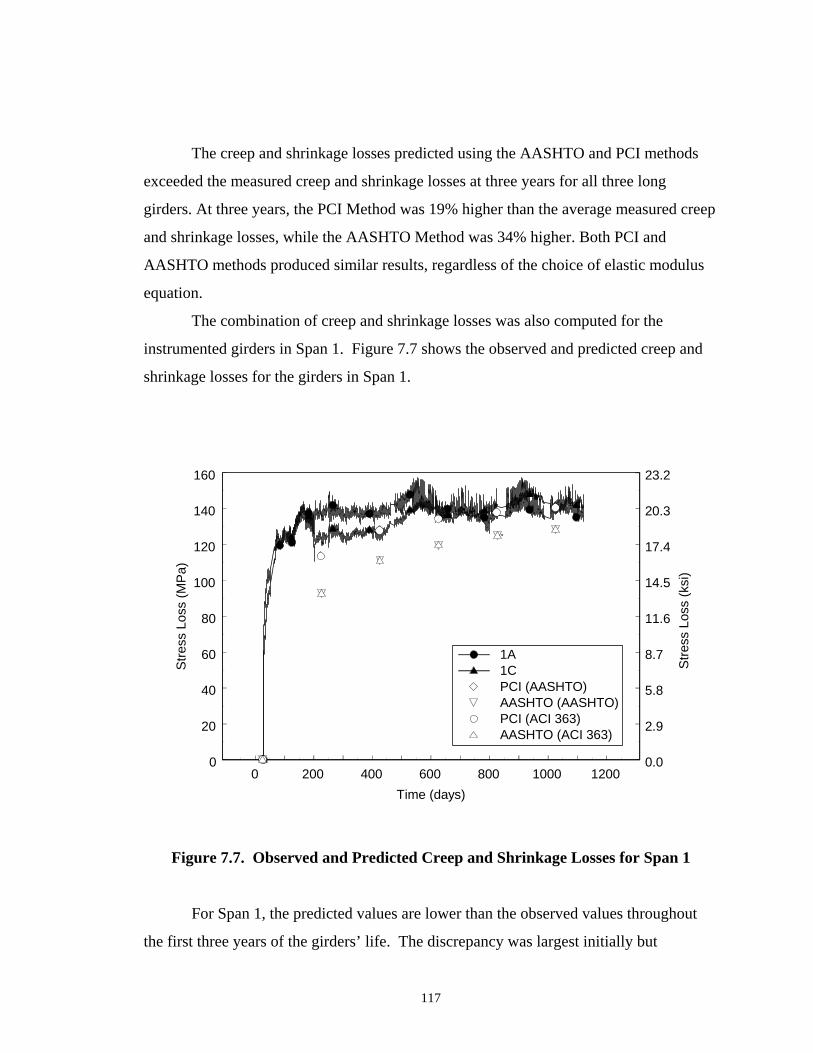
The creep and shrinkage losses predicted using the AASHTO and PCI methods
exceeded the measured creep and shrinkage losses at three years for all three long
girders. At three years, the PCI Method was 19% higher than the average measured creep
and shrinkage losses, while the AASHTO Method was 34% higher. Both PCI and
AASHTO methods produced similar results, regardless of the choice of elastic modulus
equation.
The combination of creep and shrinkage losses was also computed for the
instrumented girders in Span 1. Figure 7.7 shows the observed and predicted creep and
shrinkage losses for the girders in Span 1.
0 200 400 600 800 1000 1200Time (days)
0
20
40
60
80
100
120
140
160
Stre
ss L
oss
(MP
a)
1A1CPCI (AASHTO)AASHTO (AASHTO)PCI (ACI 363)AASHTO (ACI 363)
0.0
2.9
5.8
8.7
11.6
14.5
17.4
20.3
23.2
Stre
ss L
oss
(ksi
)
Figure 7.7. Observed and Predicted Creep and Shrinkage Losses for Span 1
For Span 1, the predicted values are lower than the observed values throughout
the first three years of the girders’ life. The discrepancy was largest initially but
117
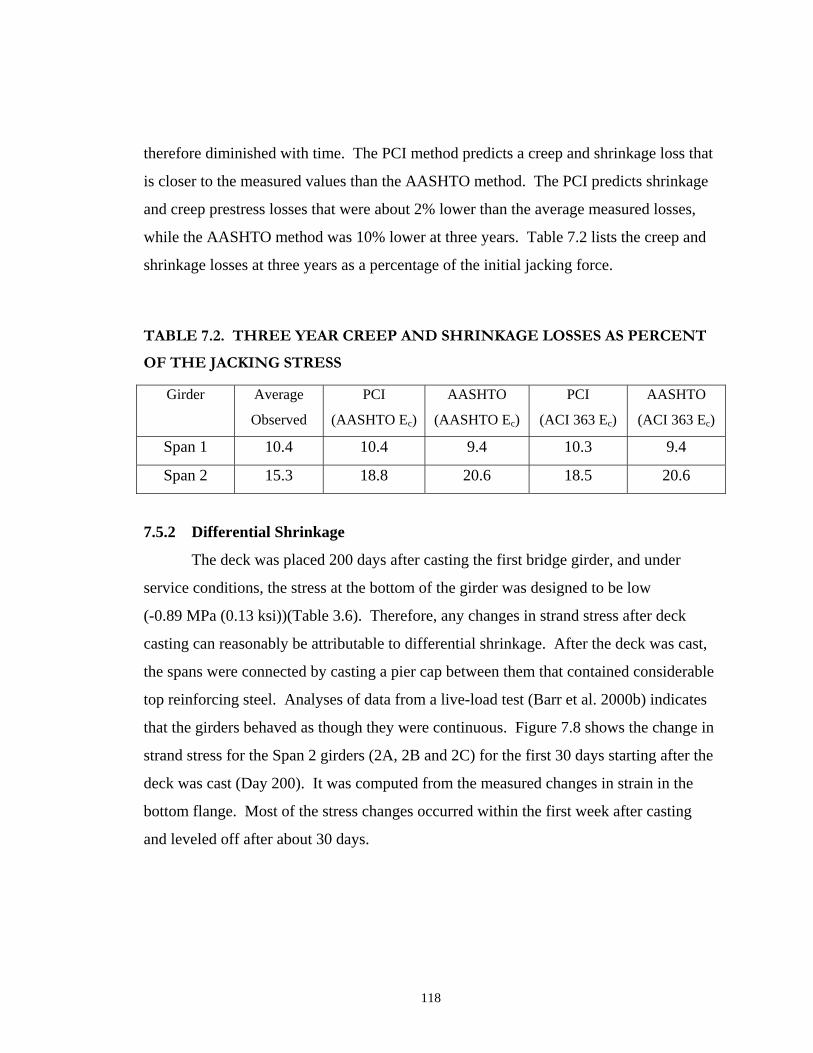
therefore diminished with time. The PCI method predicts a creep and shrinkage loss that
is closer to the measured values than the AASHTO method. The PCI predicts shrinkage
and creep prestress losses that were about 2% lower than the average measured losses,
while the AASHTO method was 10% lower at three years. Table 7.2 lists the creep and
shrinkage losses at three years as a percentage of the initial jacking force.
TABLE 7.2. THREE YEAR CREEP AND SHRINKAGE LOSSES AS PERCENT
OF THE JACKING STRESS
Girder Average
Observed
PCI
(AASHTO Ec)
AASHTO
(AASHTO Ec)
PCI
(ACI 363 Ec)
AASHTO
(ACI 363 Ec)
Span 1 10.4 10.4 9.4 10.3 9.4
Span 2 15.3 18.8 20.6 18.5 20.6
7.5.2 Differential Shrinkage
The deck was placed 200 days after casting the first bridge girder, and under
service conditions, the stress at the bottom of the girder was designed to be low
(-0.89 MPa (0.13 ksi))(Table 3.6). Therefore, any changes in strand stress after deck
casting can reasonably be attributable to differential shrinkage. After the deck was cast,
the spans were connected by casting a pier cap between them that contained considerable
top reinforcing steel. Analyses of data from a live-load test (Barr et al. 2000b) indicates
that the girders behaved as though they were continuous. Figure 7.8 shows the change in
strand stress for the Span 2 girders (2A, 2B and 2C) for the first 30 days starting after the
deck was cast (Day 200). It was computed from the measured changes in strain in the
bottom flange. Most of the stress changes occurred within the first week after casting
and leveled off after about 30 days.
118
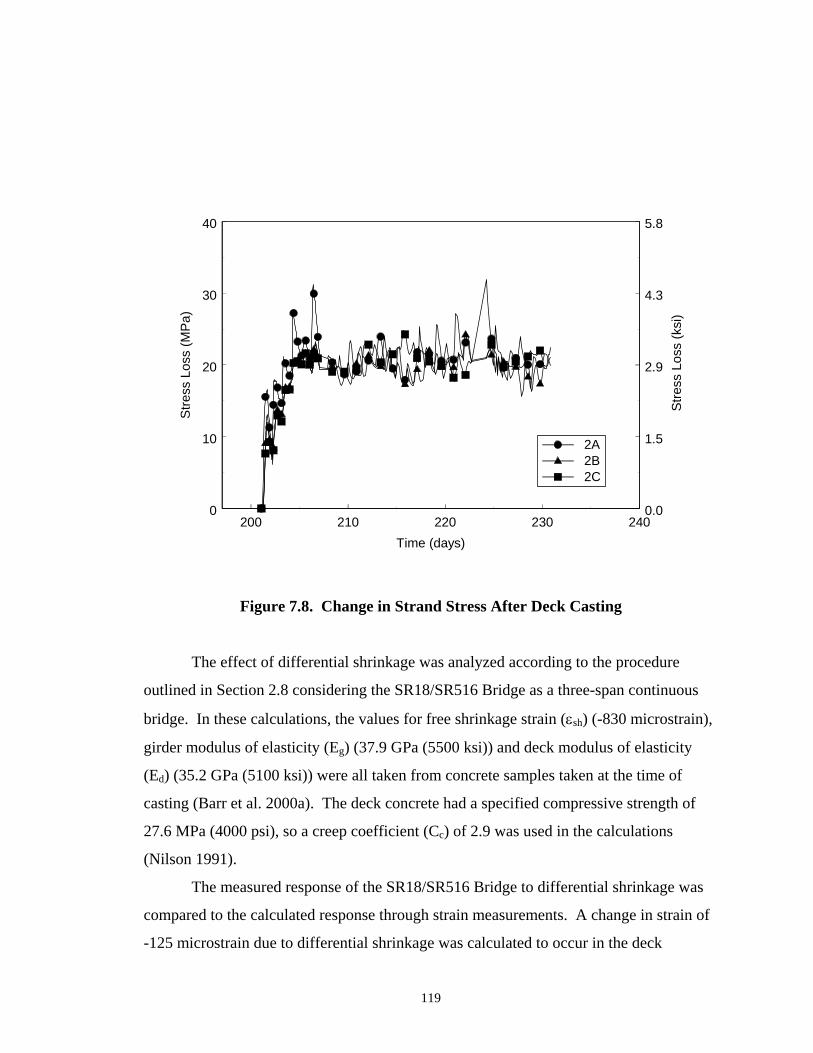
200 210 220 230 240Time (days)
0
10
20
30
40
Stre
ss L
oss
(MP
a)
0.0
1.5
2.9
4.3
5.8
2A2B2C
Stre
ss L
oss
(ksi
)
Figure 7.8. Change in Strand Stress After Deck Casting
The effect of differential shrinkage was analyzed according to the procedure
outlined in Section 2.8 considering the SR18/SR516 Bridge as a three-span continuous
bridge. In these calculations, the values for free shrinkage strain (εsh) (-830 microstrain),
girder modulus of elasticity (Eg) (37.9 GPa (5500 ksi)) and deck modulus of elasticity
(Ed) (35.2 GPa (5100 ksi)) were all taken from concrete samples taken at the time of
casting (Barr et al. 2000a). The deck concrete had a specified compressive strength of
27.6 MPa (4000 psi), so a creep coefficient (Cc) of 2.9 was used in the calculations
(Nilson 1991).
The measured response of the SR18/SR516 Bridge to differential shrinkage was
compared to the calculated response through strain measurements. A change in strain of
-125 microstrain due to differential shrinkage was calculated to occur in the deck
119
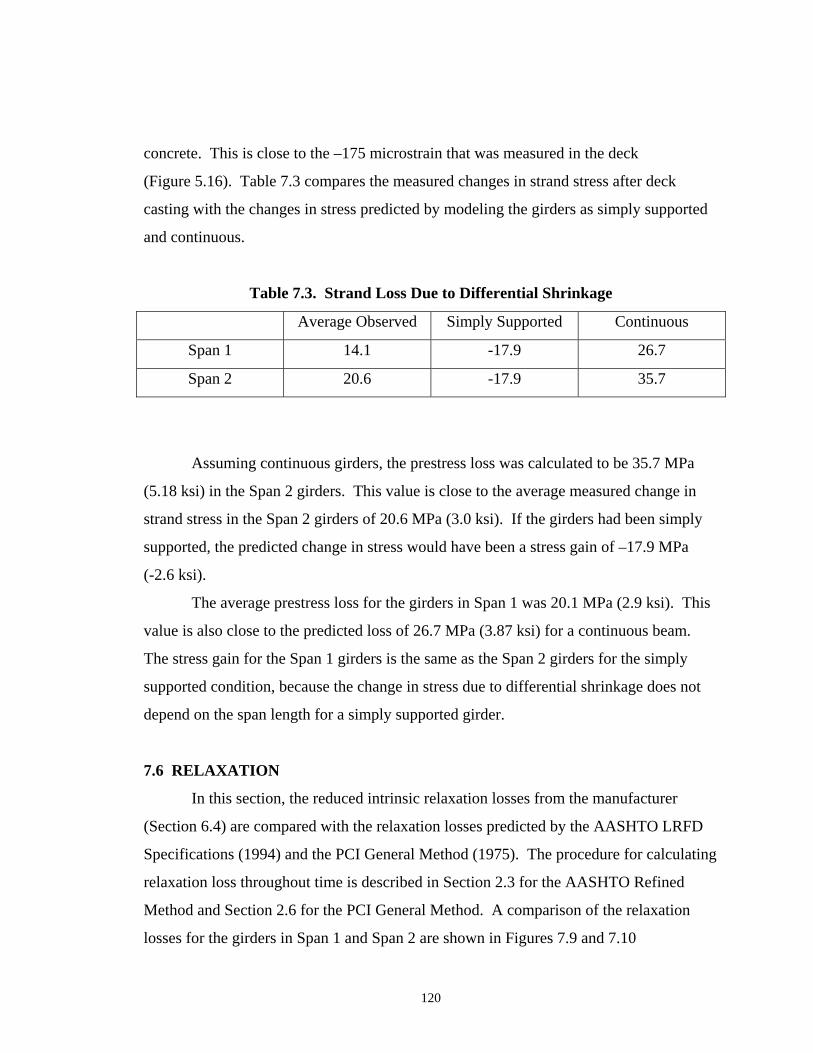
concrete. This is close to the –175 microstrain that was measured in the deck
(Figure 5.16). Table 7.3 compares the measured changes in strand stress after deck
casting with the changes in stress predicted by modeling the girders as simply supported
and continuous.
Table 7.3. Strand Loss Due to Differential Shrinkage
Average Observed Simply Supported Continuous
Span 1 14.1 -17.9 26.7
Span 2 20.6 -17.9 35.7
Assuming continuous girders, the prestress loss was calculated to be 35.7 MPa
(5.18 ksi) in the Span 2 girders. This value is close to the average measured change in
strand stress in the Span 2 girders of 20.6 MPa (3.0 ksi). If the girders had been simply
supported, the predicted change in stress would have been a stress gain of –17.9 MPa
(-2.6 ksi).
The average prestress loss for the girders in Span 1 was 20.1 MPa (2.9 ksi). This
value is also close to the predicted loss of 26.7 MPa (3.87 ksi) for a continuous beam.
The stress gain for the Span 1 girders is the same as the Span 2 girders for the simply
supported condition, because the change in stress due to differential shrinkage does not
depend on the span length for a simply supported girder.
7.6 RELAXATION
In this section, the reduced intrinsic relaxation losses from the manufacturer
(Section 6.4) are compared with the relaxation losses predicted by the AASHTO LRFD
Specifications (1994) and the PCI General Method (1975). The procedure for calculating
relaxation loss throughout time is described in Section 2.3 for the AASHTO Refined
Method and Section 2.6 for the PCI General Method. A comparison of the relaxation
losses for the girders in Span 1 and Span 2 are shown in Figures 7.9 and 7.10
120
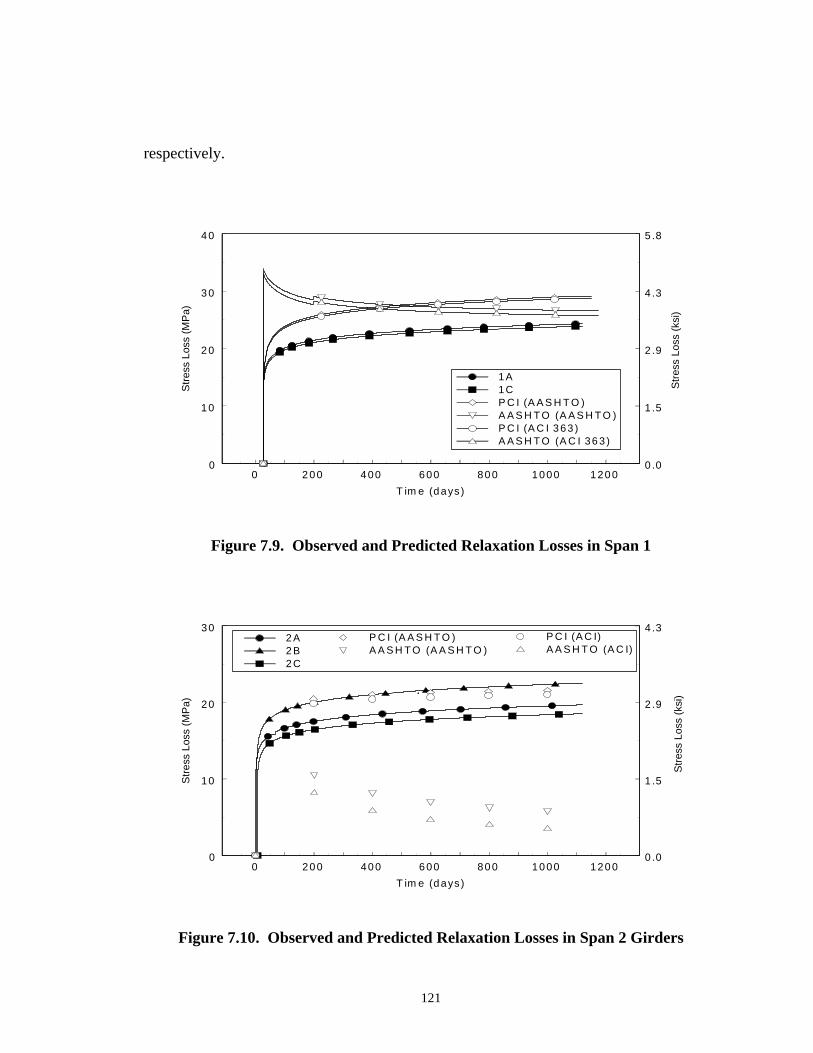
respectively.
0 200 400 600 800 1000 1200T im e (days )
0
10
20
30
40
Stre
ss L
oss
(MP
a)
0 .0
1 .5
2 .9
4 .3
5 .8
Stre
ss L
oss
(ksi
)
1A1CP C I (A A S H T O )A A S H T O (A A S H T O )P C I (A C I 3 63 )A A S H T O (A C I 36 3 )
Figure 7.9. Observed and Predicted Relaxation Losses in Span 1
0 200 400 600 800 1000 1200T im e (days )
0
10
20
30
Stre
ss L
oss
(MP
a)
0 .0
1 .5
2 .9
4 .3
Stre
ss L
oss
(ksi
)
2 A2 B2 C
P C I (A A S H T O )A A S H T O (A A S H T O )
P C I (A C I)A A S H T O (A C I)
Figure 7.10. Observed and Predicted Relaxation Losses in Span 2 Girders
121

In general, there was less relaxation loss for the Span 2 girders than the Span 1
girders. This result was expected, because the sustained strand stress was lower in
Span 2.
The PCI method predicts a loss that varies with time in a manner that resembles
the measured data. For Span 2, the values also lie within the scatter band of the
measured data. For Span 1, the predicted values are about 25% higher than the
measured.
The AASHTO method suggests a loss that, after transfer, decreases with time.
This prediction is counterintuitive and arises from the fact that the method is really
intended for calculation of prestress loss only at one time (e.g., the end of service life)
rather than continually over time. However, its use as a time-dependent function has
been suggested by Lwin and Khaleghi (1996). The jump in relaxation loss at day 200 is a
result of the change in volume-to-surface ratio when the deck is cast. This change in
volume-to-surface ratio causes a jump in the creep and shrinkage coefficients
(Equations 2.9 and 2.11 respectively), which in turn, causes a jump in the relaxation loss
(Equation 2.13).
The relaxation loss predicted with the AASHTO LRFD Specifications is small for
the Span 2 girders. According to the AASHTO LRFD Equation (Equation 2.13), the
relaxation loss will become smaller as the elastic shortening, creep and shrinkage losses
increase and, in extreme cases, could even become negative. Table 7.4 lists the values for
the relaxation prestress losses, as a percentage of the jacking stress, for the two methods
and the reduced intrinsic manufacturer’s data at 3 years.
Table 7.4. Predicted Relaxation Loss as a Percentage of Jacking Stress at 3 Years
Girder Average
Observed
PCI
(AASHTO Ec)
AASHTO
(AASHTO Ec)
PCI
(ACI 363 Ec)
AASHTO
(ACI 363 Ec)
122

Span 1 1.7 2.1 1.9 2.1 1.8
Span 2 1.4 1.6 0.4 1.5 0.2
7.7 DECK CASTING
In this section, the measured change in stress due to the deck casting is compared
with the predicted change in stress. The PCI General Method and the AASHTO LRFD
Method use a simply supported equation to estimate the change in stress due to deck
casting (Equation 2.36), the only variable that was changed in this section was the elastic
modulus of the concrete (either Equation 7.1 or 7.2). In addition to implementing the
PCI and AASHTO methods, the change in stress was also calculated using a two-degree
of freedom model (Section 2.7) that was developed for the SR18/SR516 Bridge with the
elastic modulus values calculated with Equations 7.1 and 7.2. The girder concrete was
assumed to have a compressive strength of 68.9 MPa (10 ksi) at the time the deck was
cast. Although the compressive strength was higher (Barr et al. 2000a) the value of 68.9
MPa (10 ksi) would be what a designer would use.
Figure 7.11 shows the average measured and the calculated change in stress for
the girders in Spans 1 and 2. Table 7.5 lists the calculated and average measured changes
as a percentage of total jacking stress due to deck casting.
123
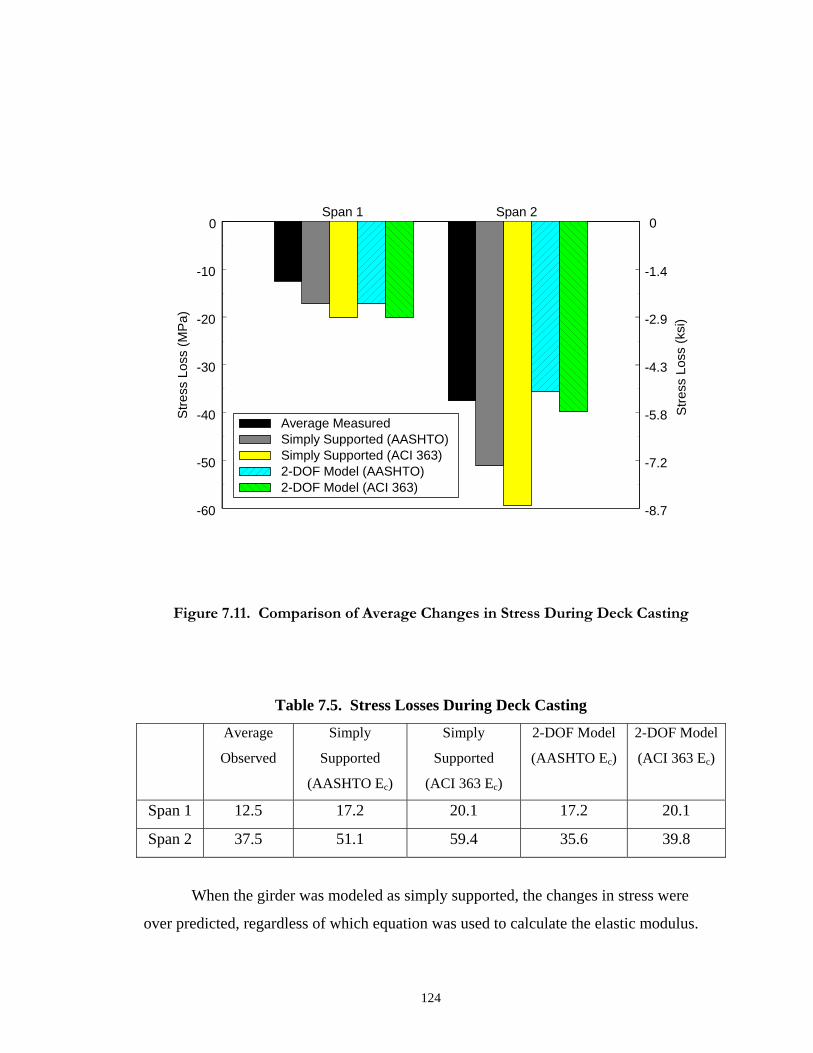
Span 1 Span 2
-60
-50
-40
-30
-20
-10
0
Stre
ss L
oss
(MP
a)
-8.7
-7.2
-5.8
-4.3
-2.9
-1.4
0
Average MeasuredSimply Supported (AASHTO)Simply Supported (ACI 363)2-DOF Model (AASHTO)2-DOF Model (ACI 363)
Stre
ss L
oss
(ksi
)
Figure 7.11. Comparison of Average Changes in Stress During Deck Casting
Table 7.5. Stress Losses During Deck Casting
Average
Observed
Simply
Supported
(AASHTO Ec)
Simply
Supported
(ACI 363 Ec)
2-DOF Model
(AASHTO Ec)
2-DOF Model
(ACI 363 Ec)
Span 1 12.5 17.2 20.1 17.2 20.1
Span 2 37.5 51.1 59.4 35.6 39.8
When the girder was modeled as simply supported, the changes in stress were
over predicted, regardless of which equation was used to calculate the elastic modulus.
124
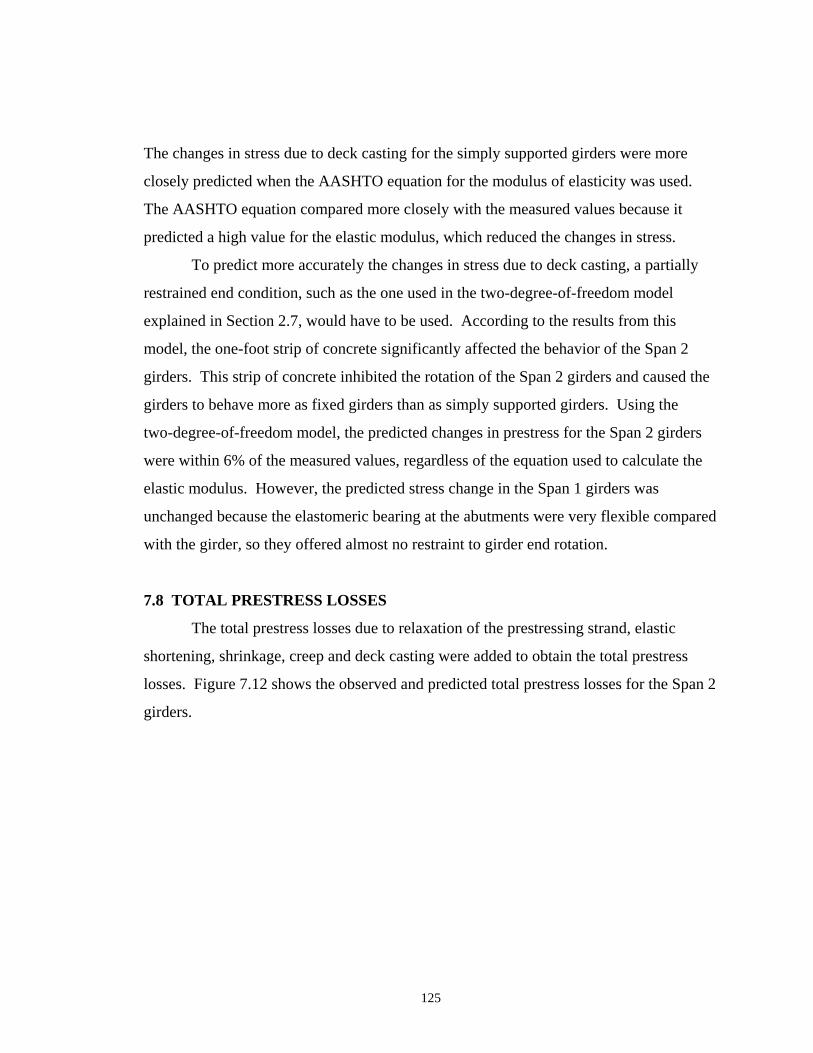
The changes in stress due to deck casting for the simply supported girders were more
closely predicted when the AASHTO equation for the modulus of elasticity was used.
The AASHTO equation compared more closely with the measured values because it
predicted a high value for the elastic modulus, which reduced the changes in stress.
To predict more accurately the changes in stress due to deck casting, a partially
restrained end condition, such as the one used in the two-degree-of-freedom model
explained in Section 2.7, would have to be used. According to the results from this
model, the one-foot strip of concrete significantly affected the behavior of the Span 2
girders. This strip of concrete inhibited the rotation of the Span 2 girders and caused the
girders to behave more as fixed girders than as simply supported girders. Using the
two-degree-of-freedom model, the predicted changes in prestress for the Span 2 girders
were within 6% of the measured values, regardless of the equation used to calculate the
elastic modulus. However, the predicted stress change in the Span 1 girders was
unchanged because the elastomeric bearing at the abutments were very flexible compared
with the girder, so they offered almost no restraint to girder end rotation.
7.8 TOTAL PRESTRESS LOSSES
The total prestress losses due to relaxation of the prestressing strand, elastic
shortening, shrinkage, creep and deck casting were added to obtain the total prestress
losses. Figure 7.12 shows the observed and predicted total prestress losses for the Span 2
girders.
125
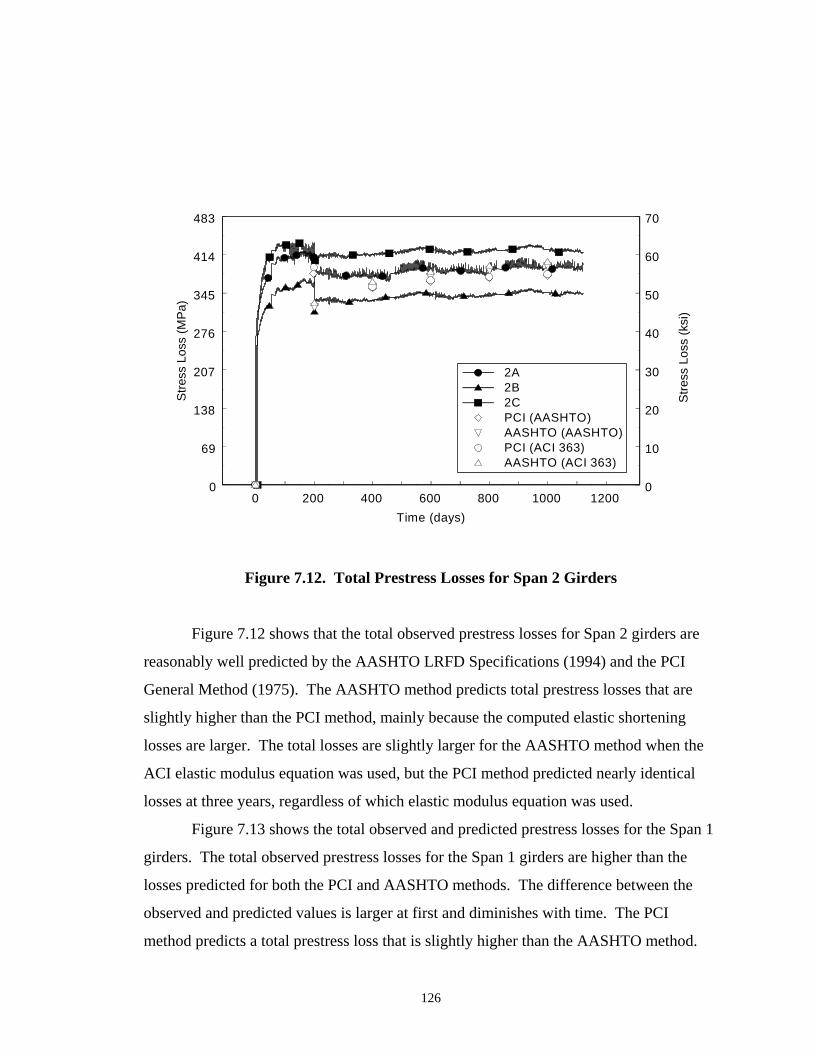
0 200 400 600 800 1000 1200Time (days)
0
69
138
207
276
345
414
483
Stre
ss L
oss
(MP
a)
2A2B2CPCI (AASHTO)AASHTO (AASHTO)PCI (ACI 363)AASHTO (ACI 363)
0
10
20
30
40
50
60
70
Stre
ss L
oss
(ksi
)
Figure 7.12. Total Prestress Losses for Span 2 Girders
Figure 7.12 shows that the total observed prestress losses for Span 2 girders are
reasonably well predicted by the AASHTO LRFD Specifications (1994) and the PCI
General Method (1975). The AASHTO method predicts total prestress losses that are
slightly higher than the PCI method, mainly because the computed elastic shortening
losses are larger. The total losses are slightly larger for the AASHTO method when the
ACI elastic modulus equation was used, but the PCI method predicted nearly identical
losses at three years, regardless of which elastic modulus equation was used.
Figure 7.13 shows the total observed and predicted prestress losses for the Span 1
girders. The total observed prestress losses for the Span 1 girders are higher than the
losses predicted for both the PCI and AASHTO methods. The difference between the
observed and predicted values is larger at first and diminishes with time. The PCI
method predicts a total prestress loss that is slightly higher than the AASHTO method.
126
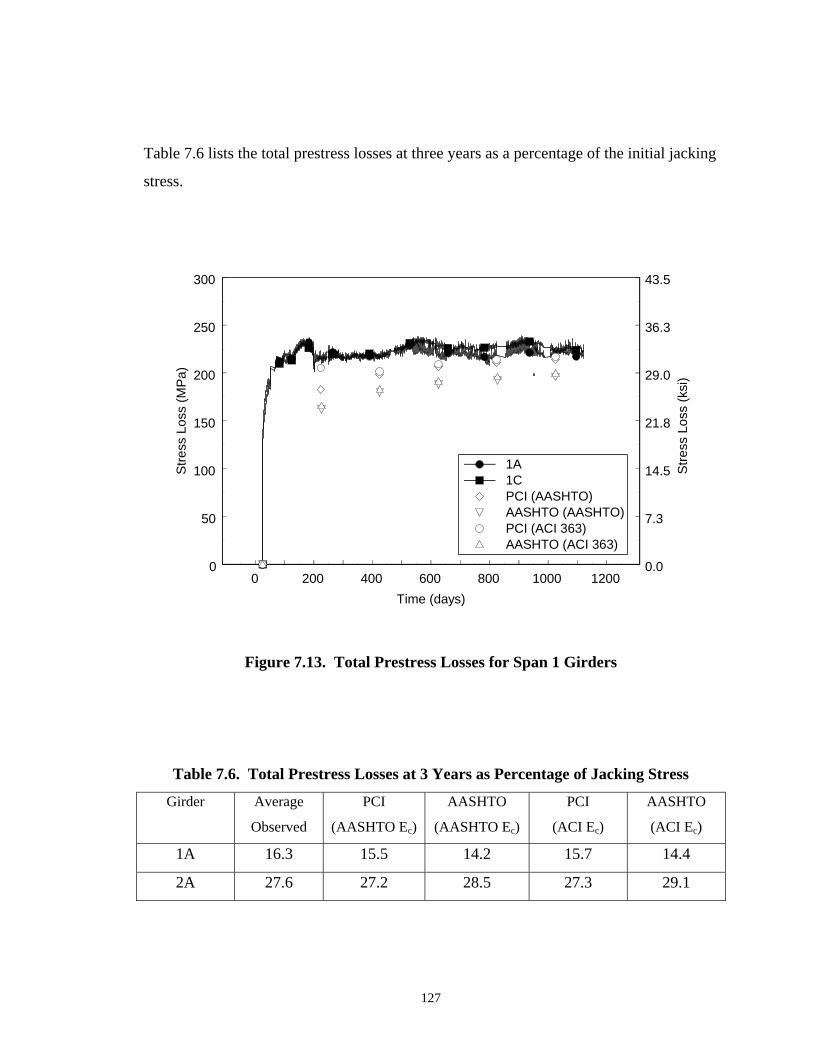
Table 7.6 lists the total prestress losses at three years as a percentage of the initial jacking
stress.
0 200 400 600 800 1000 1200Time (days)
0
50
100
150
200
250
300
Stre
ss L
oss
(MP
a)
1A1CPCI (AASHTO)AASHTO (AASHTO)PCI (ACI 363)AASHTO (ACI 363)
0.0
7.3
14.5
21.8
29.0
36.3
43.5
Stre
ss L
oss
(ksi
)
Figure 7.13. Total Prestress Losses for Span 1 Girders
Table 7.6. Total Prestress Losses at 3 Years as Percentage of Jacking Stress
Girder Average
Observed
PCI
(AASHTO Ec)
AASHTO
(AASHTO Ec)
PCI
(ACI Ec)
AASHTO
(ACI Ec)
1A 16.3 15.5 14.2 15.7 14.4
2A 27.6 27.2 28.5 27.3 29.1
127

The total prestress losses predicted using the AASHTO LRFD Specifications
(1994) and the PCI General Method (1975) were close to the average total measured
losses. However, this agreement is not a result of the methods accurately predicting each
of the individual components. Instead, the total changes in prestress compared well,
because some predictions were too low (e.g., elastic shortening) and others were too high
(e.g., creep and shrinkage, relaxation and deck casting).
Table 7.7 summarizes the measured changes in stress for each of the instrumented
girders and the calculated changes in stress at three years for each of the methods
investigated in this chapter.
128
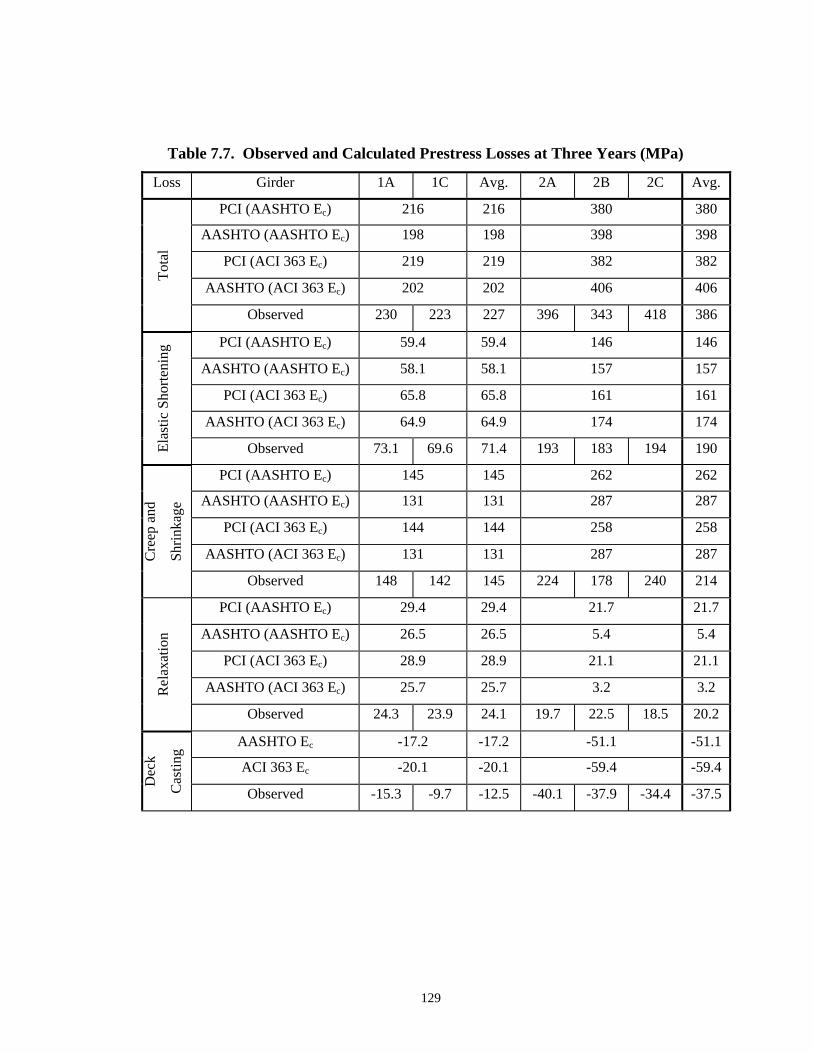
Table 7.7. Observed and Calculated Prestress Losses at Three Years (MPa)
Loss Girder 1A 1C Avg. 2A 2B 2C Avg.
PCI (AASHTO Ec) 216 216 380 380
AASHTO (AASHTO Ec) 198 198 398 398
PCI (ACI 363 Ec) 219 219 382 382
AASHTO (ACI 363 Ec) 202 202 406 406
Tota
l
Observed 230 223 227 396 343 418 386
PCI (AASHTO Ec) 59.4 59.4 146 146
AASHTO (AASHTO Ec) 58.1 58.1 157 157
PCI (ACI 363 Ec) 65.8 65.8 161 161
AASHTO (ACI 363 Ec) 64.9 64.9 174 174
Elas
tic S
horte
ning
Observed 73.1 69.6 71.4 193 183 194 190
PCI (AASHTO Ec) 145 145 262 262
AASHTO (AASHTO Ec) 131 131 287 287
PCI (ACI 363 Ec) 144 144 258 258
AASHTO (ACI 363 Ec) 131 131 287 287 Cre
ep a
nd
Shrin
kage
Observed 148 142 145 224 178 240 214
PCI (AASHTO Ec) 29.4 29.4 21.7 21.7
AASHTO (AASHTO Ec) 26.5 26.5 5.4 5.4
PCI (ACI 363 Ec) 28.9 28.9 21.1 21.1
AASHTO (ACI 363 Ec) 25.7 25.7 3.2 3.2 Rel
axat
ion
Observed 24.3 23.9 24.1 19.7 22.5 18.5 20.2
AASHTO Ec -17.2 -17.2 -51.1 -51.1
ACI 363 Ec -20.1 -20.1 -59.4 -59.4
Dec
k
Cas
ting
Observed -15.3 -9.7 -12.5 -40.1 -37.9 -34.4 -37.5
129
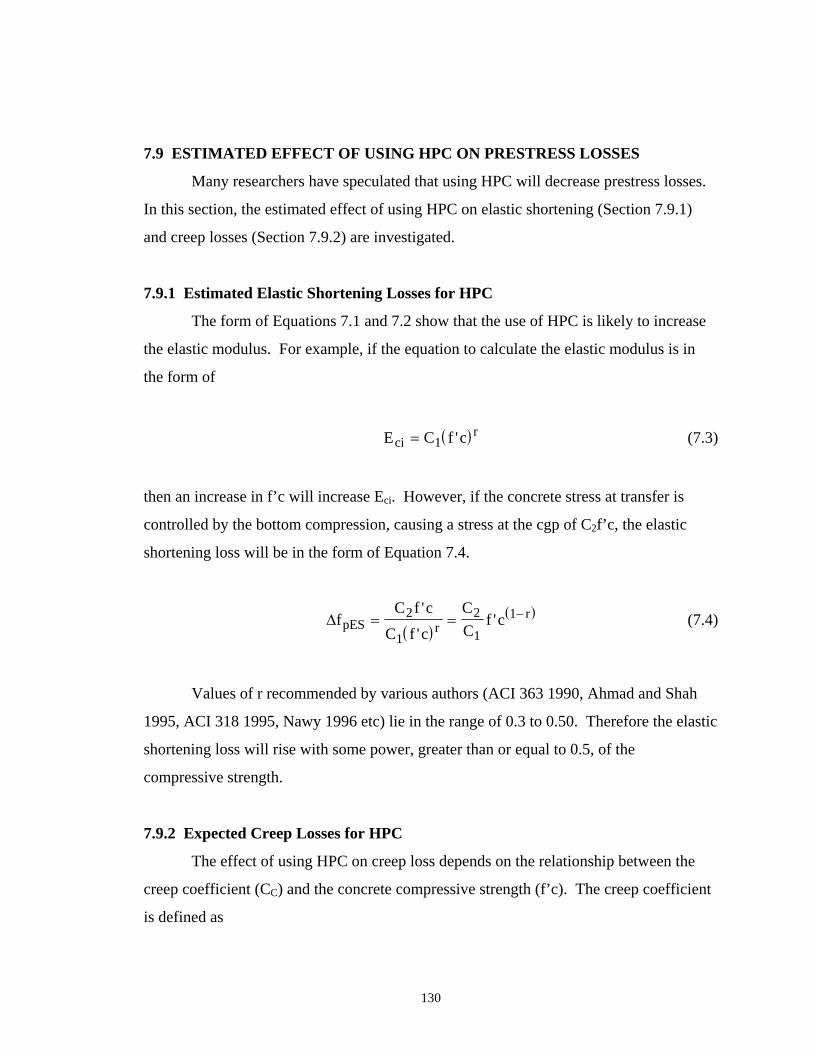
7.9 ESTIMATED EFFECT OF USING HPC ON PRESTRESS LOSSES
Many researchers have speculated that using HPC will decrease prestress losses.
In this section, the estimated effect of using HPC on elastic shortening (Section 7.9.1)
and creep losses (Section 7.9.2) are investigated.
7.9.1 Estimated Elastic Shortening Losses for HPC
The form of Equations 7.1 and 7.2 show that the use of HPC is likely to increase
the elastic modulus. For example, if the equation to calculate the elastic modulus is in
the form of
(7.3) ( )E C f ccir= 1 '
then an increase in f’c will increase Eci. However, if the concrete stress at transfer is
controlled by the bottom compression, causing a stress at the cgp of C2f’c, the elastic
shortening loss will be in the form of Equation 7.4.
( )
(∆fC f c
C f cCC
f cpES rr= = −2
1
2
1
1''
' ) (7.4)
Values of r recommended by various authors (ACI 363 1990, Ahmad and Shah
1995, ACI 318 1995, Nawy 1996 etc) lie in the range of 0.3 to 0.50. Therefore the elastic
shortening loss will rise with some power, greater than or equal to 0.5, of the
compressive strength.
7.9.2 Expected Creep Losses for HPC
The effect of using HPC on creep loss depends on the relationship between the
creep coefficient (CC) and the concrete compressive strength (f’c). The creep coefficient
is defined as
130
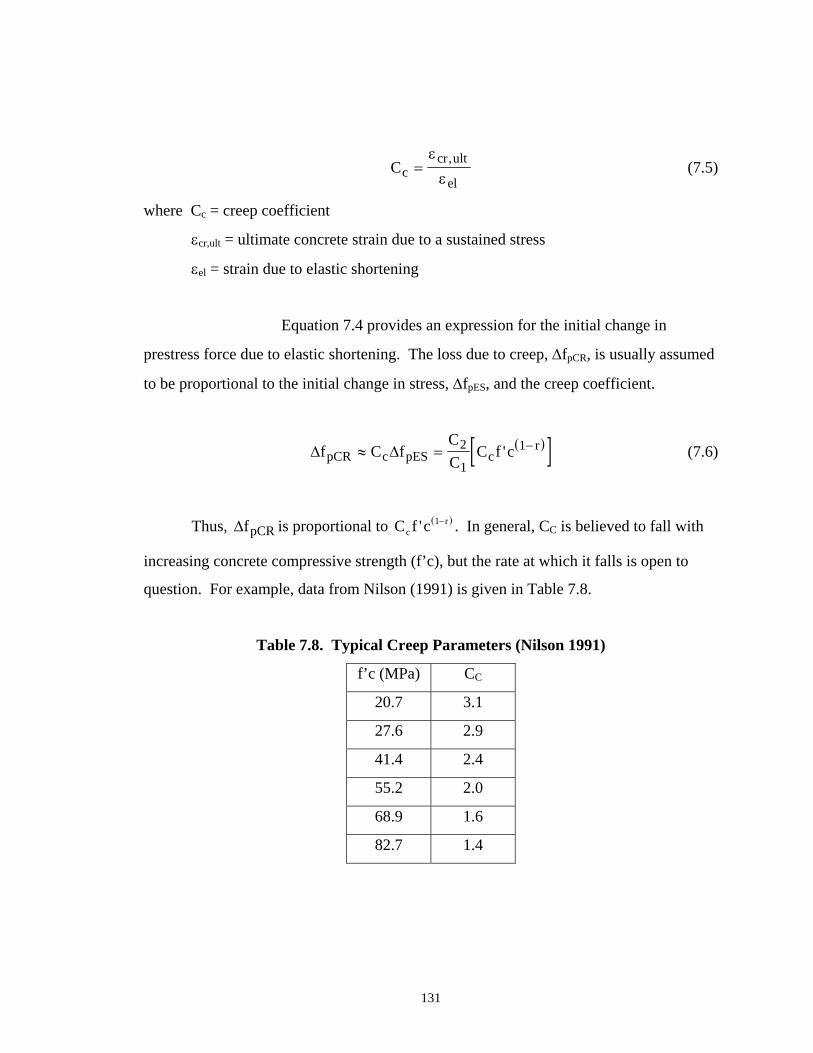
Cccr ult
el=
ε
ε, (7.5)
where Cc = creep coefficient
εcr,ult = ultimate concrete strain due to a sustained stress
εel = strain due to elastic shortening
Equation 7.4 provides an expression for the initial change in
prestress force due to elastic shortening. The loss due to creep, ∆fpCR, is usually assumed
to be proportional to the initial change in stress, ∆fpES, and the creep coefficient.
( )[ ]∆ ∆f C fCC
C f cpCR c pES cr≈ = −2
1
1' (7.6)
Thus, ∆ is proportional to . In general, CfpCR( )C f cc
r' 1−C is believed to fall with
increasing concrete compressive strength (f’c), but the rate at which it falls is open to
question. For example, data from Nilson (1991) is given in Table 7.8.
Table 7.8. Typical Creep Parameters (Nilson 1991)
f’c (MPa) CC
20.7 3.1
27.6 2.9
41.4 2.4
55.2 2.0
68.9 1.6
82.7 1.4
131
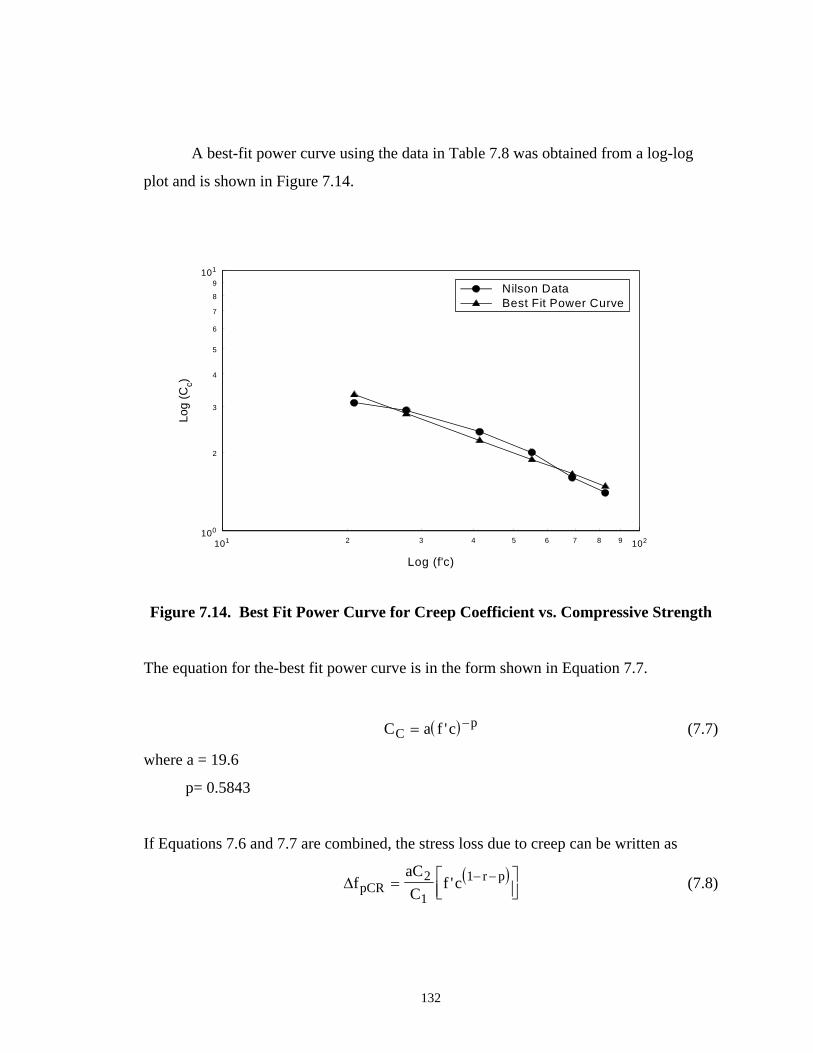
A best-fit power curve using the data in Table 7.8 was obtained from a log-log
plot and is shown in Figure 7.14.
101 1022 3 4 5 6 7 8 9
Log (f'c)
100
101
2
3
4
5
6
7
8
9
Log
(Cc)
Nilson DataBest Fit Power Curve
Figure 7.14. Best Fit Power Curve for Creep Coefficient vs. Compressive Strength
The equation for the-best fit power curve is in the form shown in Equation 7.7.
( )C a f cCp= −' (7.7)
where a = 19.6
p= 0.5843
If Equations 7.6 and 7.7 are combined, the stress loss due to creep can be written as
( )∆faCC
f cpCRr p= ⎡
⎣⎢⎤⎦⎥
− −2
1
1' (7.8)
132
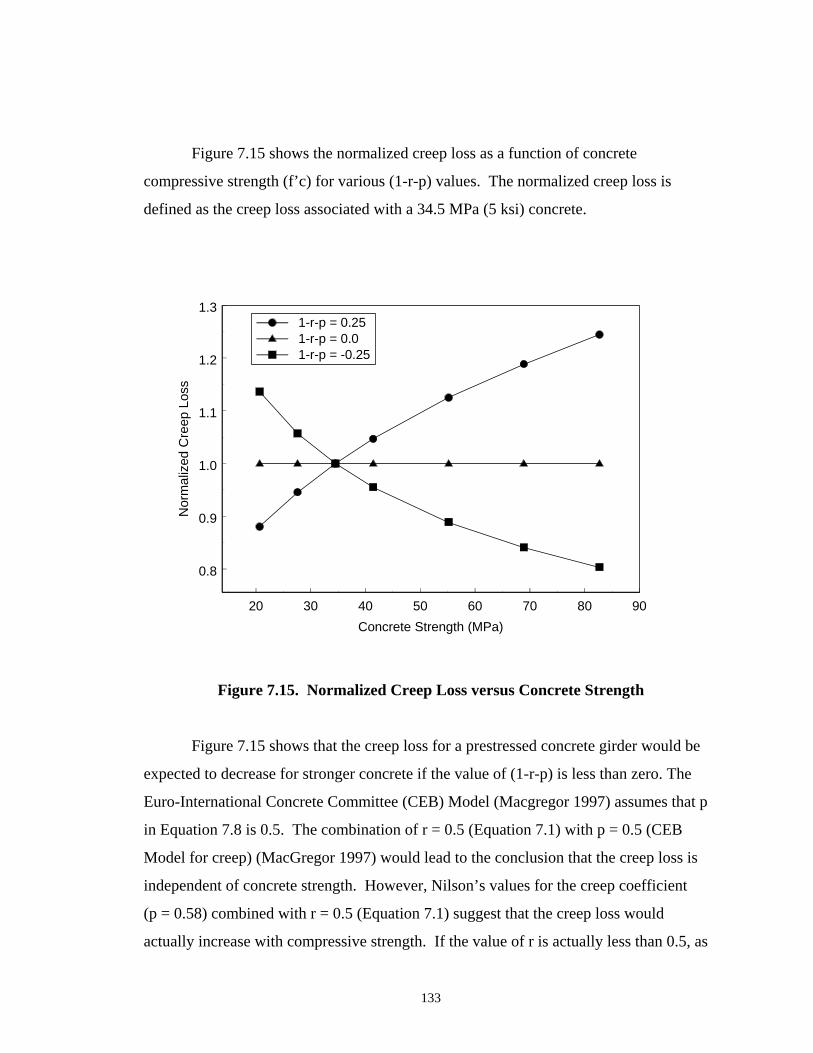
Figure 7.15 shows the normalized creep loss as a function of concrete
compressive strength (f’c) for various (1-r-p) values. The normalized creep loss is
defined as the creep loss associated with a 34.5 MPa (5 ksi) concrete.
20 30 40 50 60 70 80 90Concrete Strength (MPa)
0.8
0.9
1.0
1.1
1.2
1.3
Nor
mal
ized
Cre
ep L
oss
1-r-p = 0.251-r-p = 0.01-r-p = -0.25
Figure 7.15. Normalized Creep Loss versus Concrete Strength
Figure 7.15 shows that the creep loss for a prestressed concrete girder would be
expected to decrease for stronger concrete if the value of (1-r-p) is less than zero. The
Euro-International Concrete Committee (CEB) Model (Macgregor 1997) assumes that p
in Equation 7.8 is 0.5. The combination of r = 0.5 (Equation 7.1) with p = 0.5 (CEB
Model for creep) (MacGregor 1997) would lead to the conclusion that the creep loss is
independent of concrete strength. However, Nilson’s values for the creep coefficient
(p = 0.58) combined with r = 0.5 (Equation 7.1) suggest that the creep loss would
actually increase with compressive strength. If the value of r is actually less than 0.5, as
133

some authors have suggested (Ahmed and Shah 1985), then one would expect the creep
loss to decrease with increasing concrete compressive strength. This trend is opposite to
the trend in the AASHTO LRFD Specifications (AASHTO 1994) as shown in Equation
2.6 which predicts a decrease in prestress loss due to creep with an increase in
compressive strength. This analysis shows that loss of prestress cue to creep depends on
factors that may counteract each other as the concrete strength is changed. High strength
concrete may result in either more or less prestress loss than that found in conventional
concrete, depending on the properties of the mix and the details of the analytical model
used to describe the behavior. Therefore the use of HPC should not be assumed
automatically to decrease the prestress loss due to creep.
134

CHAPTER 8
COMPARISON OF CALCULATED AND OBSERVED CAMBERS
In this chapter, observed and estimated values of camber are compared. In
Section 8.1, the observed values of total girder camber (Section 5.2.3) are compared with
estimated values calculated using the recommended PCI multipliers (PCI 1992). The
observed camber due to differential shrinkage is compared with predicted camber in
Section 8.2.
8.1 PCI METHOD (1992)
The PCI method (PCI 1992) for estimating long-term camber consists of applying
long-term deflection multipliers to the immediate elastic deflections. The upward and
downward components of the immediate elastic deflection are separated, because the
upward component due to prestressing will be influenced by both creep and prestress
loss, whereas the downward component will be influenced by creep alone. Equation 8.1
calculates the initial downward deflection at midspan due to the weight of a simply
supported girder.
∆sw
ci
w LE I
sw=∗ ∗
∗ ∗5384
4 (8.1)
where ∆sw = downward deflection due to self weight
wsw = self weight of girder (0.012 KN/mm for ρ=2480 kg/m3 (0.0670 kips/in. for
ρ=155 lbs/ft3))
L = girder span
Eci = modulus of elasticity at transfer
I = girder moment of inertia (228x109 mm4 (547,000 in4))
135
The initial upward camber is caused by the eccentric prestressing force after
transfer. Equation 8.2 predicts the upward midspan camber after transfer for a
prestressed girder with two harping points.
( )∆psci
c e cP L
E Ie e e
aL
=∗
∗ ∗+ −
⎡
⎣⎢⎢
⎤
⎦⎥⎥
2 2
2843
(8.2)
where ∆ps = camber due to prestressing force
P = prestressing force in tendons after transfer
ec = eccentricity of prestressing strand at midspan
ee = eccentricity of prestressing strand at end
a = distance from end of girder to harping point
According to the PCI method, the deflection of a girder before slab casting is
estimated by applying PCI multipliers of 1.80 to the upward elastic deflection caused by
prestressing and 1.85 to the downwards elastic deflection caused by girder weight
(PCI 1992).
The deflection after slab casting is the deflection before slab casting plus the
downward deflection due to the casting of the deck. The equation for the downward
deflection due to the casting of the deck is the same as Equation 8.1, except that the
weight of the girder is replaced by the tributary weight of the slab (0.014 KN/mm
(0.082 kips/inch)), and the initial elastic modulus is replaced with the girder modulus at
deck casting.
The predicted long-term camber values are obtain by multiplying the camber due
to the prestressing force by 2.2, the deflection due to self weight by 2.4, the deflection
due to deck casting by 2.3 and the deflection due to any superimposed dead load by 3.0.
8.2 CALCULATED AND MEASURED CAMBERS
136

Figures 8.1 and 8.2 show the PCI estimated cambers and the cambers measured
with a surveyor’s level. The measured cambers were discussed in Section 5.2.3. The
predicted camber was calculated at transfer, before the slab was cast, after the slab was
cast, and at service for the Span 1 and Span 2 girders. The modulus of elasticity was
calculated using the equation in the AASHTO LRFD Specifications (AASHTO 1994)
with a concrete compressive strength of 51.0 Mpa (7.4 ksi) for the deflection at release
and 68.9 MPa (10 ksi) for the deflection at the time the slab was cast.
0 2 0 0 4 0 0 6 0 0 8 0 0 1 0 0 0 1 2 0 0T im e (d a ys)
0
2 0
4 0
6 0
8 0
1 0 0
1 2 0
1 4 0
1 6 0
1 8 0
Cam
ber (
mm
)
2 A2 B2 C2 D2 E
0 .0
0 .8
1 .6
2 .4
3 .2
3 .9
4 .7
5 .5
6 .3
7 .1
Cam
ber (
in.)
T ra ns fe r
B e fo re D e ck
A fte r D e ck
L on g T e rm
Figure 8.1. Comparison of Calculated and Measured Cambers for Span 2
137
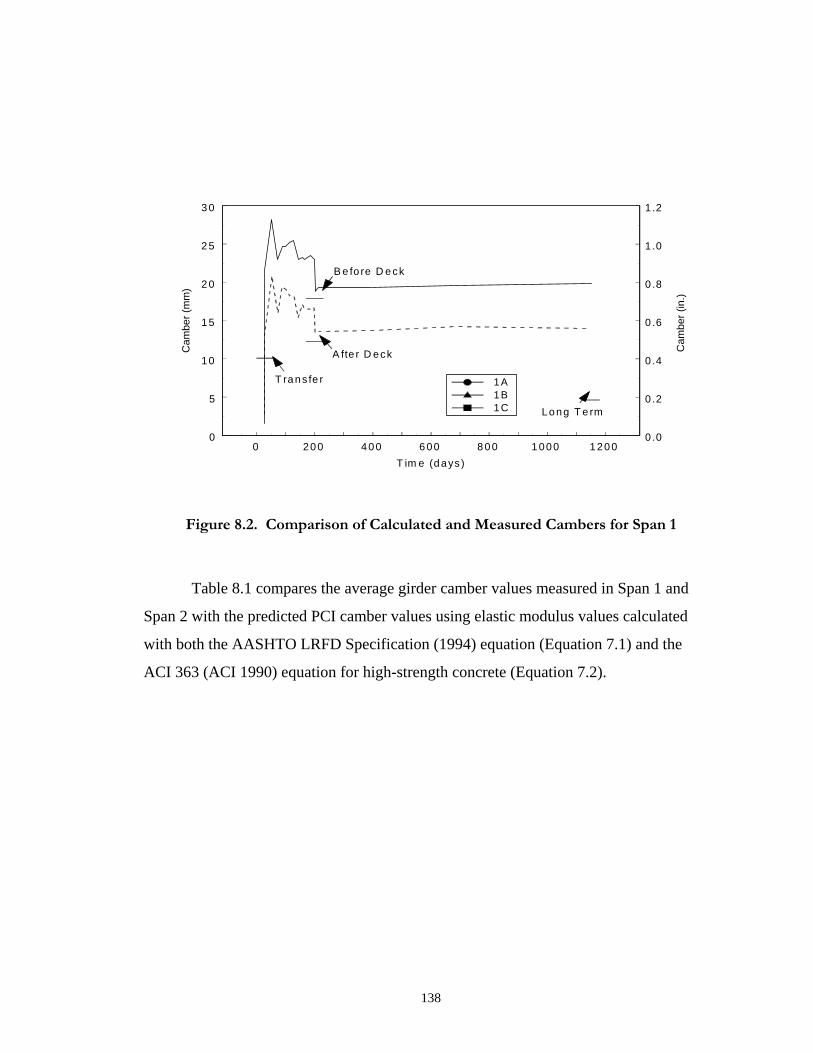
0 200 400 600 800 1000 1200T im e (days )
0
5
10
15
20
25
30
Cam
ber (
mm
)
1A1B1C
0.0
0 .2
0 .4
0 .6
0 .8
1 .0
1 .2
Cam
ber (
in.)
T rans fe r
B e fo re D eck
A fte r D eck
Long T e rm
Figure 8.2. Comparison of Calculated and Measured Cambers for Span 1
Table 8.1 compares the average girder camber values measured in Span 1 and
Span 2 with the predicted PCI camber values using elastic modulus values calculated
with both the AASHTO LRFD Specification (1994) equation (Equation 7.1) and the
ACI 363 (ACI 1990) equation for high-strength concrete (Equation 7.2).
138
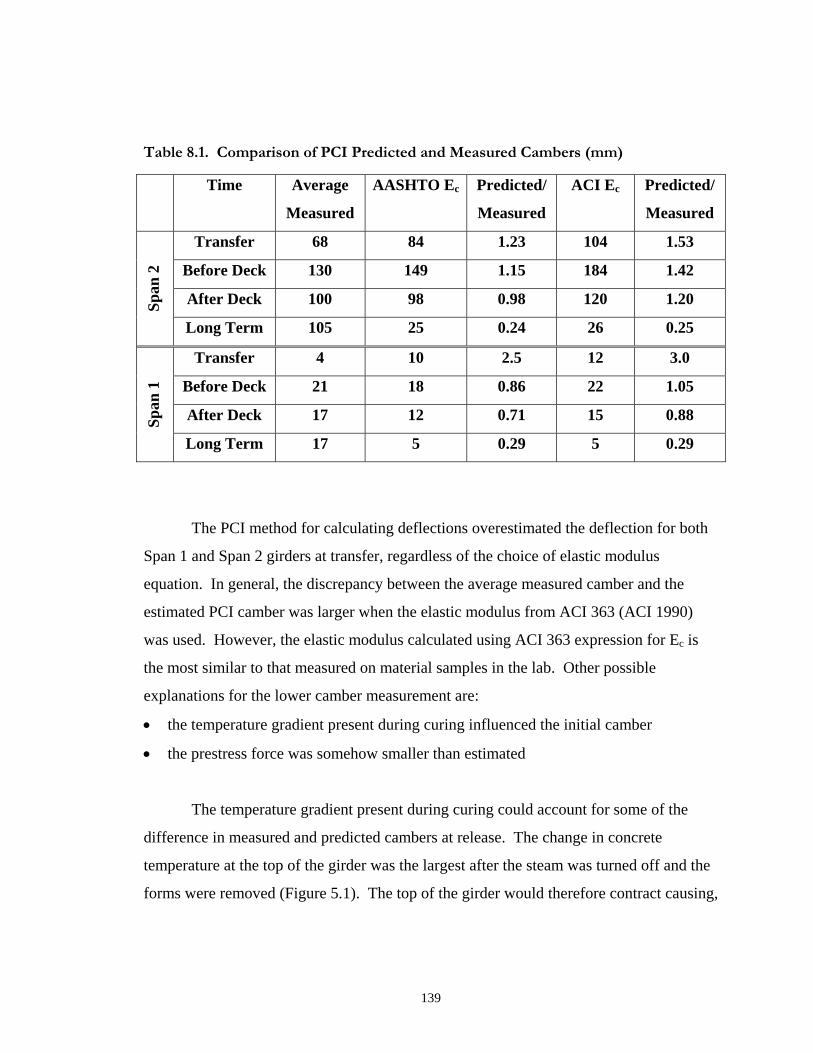
Table 8.1. Comparison of PCI Predicted and Measured Cambers (mm)
Time Average
Measured
AASHTO Ec Predicted/
Measured
ACI Ec Predicted/
Measured
Transfer 68 84 1.23 104 1.53
Before Deck 130 149 1.15 184 1.42
After Deck 100 98 0.98 120 1.20 Span
2
Long Term 105 25 0.24 26 0.25
Transfer 4 10 2.5 12 3.0
Before Deck 21 18 0.86 22 1.05
After Deck 17 12 0.71 15 0.88 Span
1
Long Term 17 5 0.29 5 0.29
The PCI method for calculating deflections overestimated the deflection for both
Span 1 and Span 2 girders at transfer, regardless of the choice of elastic modulus
equation. In general, the discrepancy between the average measured camber and the
estimated PCI camber was larger when the elastic modulus from ACI 363 (ACI 1990)
was used. However, the elastic modulus calculated using ACI 363 expression for Ec is
the most similar to that measured on material samples in the lab. Other possible
explanations for the lower camber measurement are:
• the temperature gradient present during curing influenced the initial camber
• the prestress force was somehow smaller than estimated
The temperature gradient present during curing could account for some of the
difference in measured and predicted cambers at release. The change in concrete
temperature at the top of the girder was the largest after the steam was turned off and the
forms were removed (Figure 5.1). The top of the girder would therefore contract causing,
139
a downward deflection. This downward deflection would be superimposed onto the
initial camber and the net camber would therefore be lower than expected.
Another possible explanation of the low initial camber is that the strand force was
reduced as a result of curing temperature. This could occur if strand stress is reduced by
expansion of the strand due to the high curing temperatures, or an increase in relaxation
loss due to the high curing temperature. A reduction in prestress force would decrease
the initial camber.
The long-term deflection was consistently underpredicted by the PCI multipliers,
regardless of the source of elastic modulus. For the Span 2 girders, the long-term camber
was only 23% of the camber estimated using the elastic modulus from the AASHTO
LRFD Specifications (1994) and only 12% of the camber estimated using the elastic
modulus from ACI 363 (1990). Most of the error was caused by inaccurate prediction of
the effects of the slab weight.
8.2 CAMBER DUE TO DIFFERENTIAL SHRINKAGE
For a simply supported girder, the deflection due to differential shrinkage can be
calculated as
∆DS SSDSL
, = −φ 2
8 (8.3)
where ∆DS,SS = deflection due to differential shrinkage of simply supported girder
φDS = curvature of composite system caused by differential shrinkage
( )=− Q eEI
d d
comp
Qd = restraint force
= -AdEdεsh
Ad = cross-sectional of deck
Ed = young’s modulus of deck concrete
140
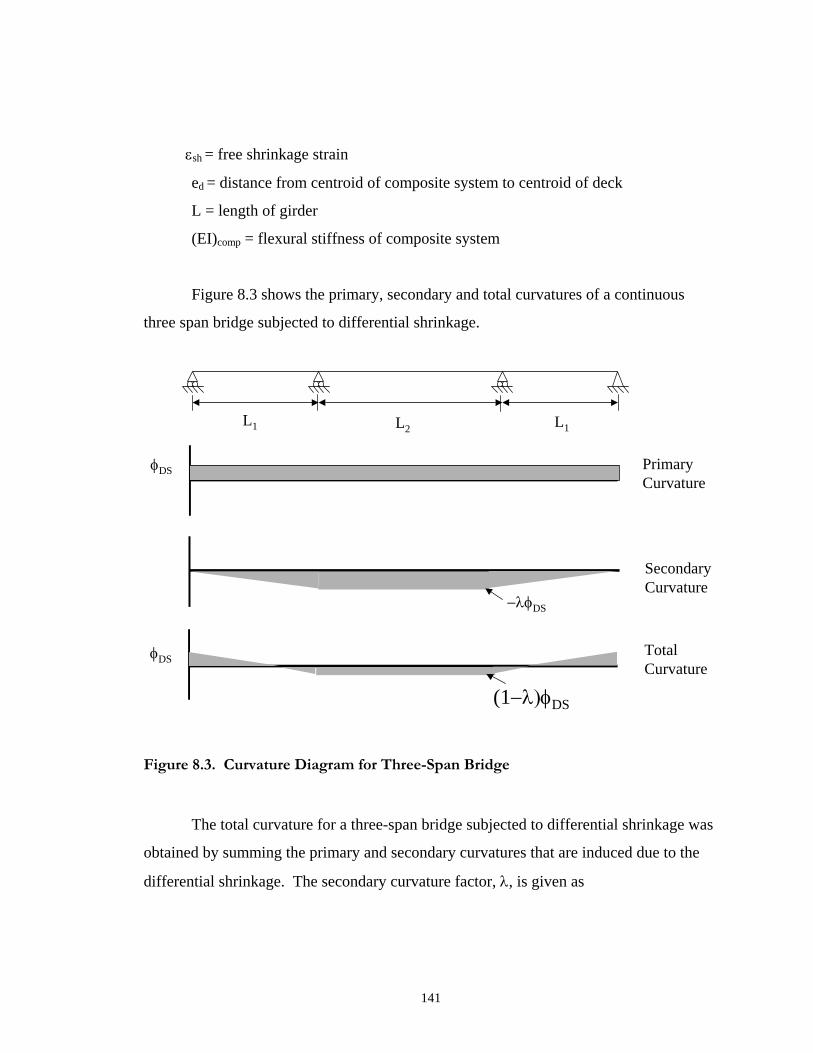
εsh = free shrinkage strain
ed = distance from centroid of composite system to centroid of deck
L = length of girder
(EI)comp = flexural stiffness of composite system
Figure 8.3 shows the primary, secondary and total curvatures of a continuous
three span bridge subjected to differential shrinkage.
SecondaryCurvature
L1 L1L2
φDS PrimaryCurvature
−λφDS
TotalCurvature
φDS
(1−λ)φDS
Figure 8.3. Curvature Diagram for Three-Span Bridge
The total curvature for a three-span bridge subjected to differential shrinkage was
obtained by summing the primary and secondary curvatures that are induced due to the
differential shrinkage. The secondary curvature factor, λ, is given as
141

λ =+
+⎛⎝⎜
⎞⎠⎟
L L
L L
1 2
1 223
(8.4)
where λ = secondary curvature factor
L1 = length of Span 1
L2 = length of Span 2
The deflection at midspan of Span 2 can be calculated as
( )
∆22
218
=− λ φDSL
(8.5)
where ∆2 = deflection at midspan of Span 2 (positive is downwards). The deflection at
midspan of the spans 1 and 3 can be calculated as
∆1 12
1618
=⎛⎝⎜
⎞⎠⎟φ
λDSL − (8.6)
The predicted and measured camber changes attributable to differential shrinkage
are listed in Table 8.2. The material properties used to obtain the calculated values are
the same as those used in Section 7.5.2.
Table 8.2. Comparison of Camber Due to Differential Shrinkage at Three Year
Span 1 Span 2
Average Measured (mm) -0.44 -6.4
Predicted (Simply Supported) (mm) 15.4 42.5
Predicted (Continuous) (mm) 6.6 -5.9
142

The continuous model provided the best prediction of camber for both spans. In
Span 2, the predictions were very close. In Span 1, the predictions were within 6 mm,
but, because the measured cambers were so small, the relative accuracy was poor.
The continuous model is a simplification of the true structure, but a more complex
model was not used because of lack of reliable material data (i.e. the rate of creep and
shrinkage). Characteristics to be taken into account in a more complex model should
include
• Changes in the structural confirmation over time. For example, the deck was cast in
the spans first, and was made continuous over the piers two weeks later.
• Translational and rotational restraint at the interior supports provided by the flexural
stiffness of the columns.
143
CHAPTER 9
CONCLUSIONS
This research focused on evaluating the effectiveness of using High-Performance
Concrete (HPC) in precast, prestressed concrete girders. HPC was used in the fabrication
of fifteen W74MG girders for a bridge located in Washington State (SR18/516
Overcrossing). The use of HPC permitted WSDOT engineers to reduce the number of
girder lines from seven to five. To obtain the required prestressing force, while
maintaining the minimum 50 mm (2 inch) strand spacing needed for bond, the
prestressing strands size was increased from the normal 12.7 mm diameter to 15.2 mm
diameter (0.5 in. to 0.6 in. diameter).
Five bridge girders were instrumented and monitored for three years. The
observed behavior of the instrumented bridge girders was compared with the behavior
predicted with current design methods. This chapter summarizes the research and its
conclusions.
9.1 FABRICATION
The fabricator used externally applied steam to attain the required release strength
of the concrete as rapidly as possible. Nonetheless, the average curing time until the start
of destressing was slightly over 25 hours for each of the five instrumented girders
(Table 5.2). This rapid curing raises two problems. First, requiring a high concrete
strength at release may force the fabricator to implement a two-day fabrication cycle.
The economic impacts of this choice should be considered during design. Second, curing
at high temperature improves the short-term strength needed at release, but detracts from
the long-term strength. The need for high strength at release is not in question, but the
real needs for high, long-term strength should be carefully assessed.
During the steam curing, the internal concrete temperatures varied approximately
25 °C (45 °F) over the depth of the girder (Figure 5.1). The lowest temperatures were
recorded at the bottom of the girders, which consequently had the lowest maturity and, by
144

implication, the lowest concrete strength. This finding is significant, because it means
that the weakest concrete was located where the compressive stress was the highest. This
temperature gradient is likely to be most significant in girders that are cast outdoors
during the winter.
The fabricator used a thermocouple in the girder that was connected to a
Sure-Cure system to monitor concrete strength prior to strand release. The thermocouple
was placed at mid-height for all of the girders (except Girder 2B, in which it was placed
457 mm (18 inches) from the bottom of the girder). Consequently, the concrete at the
bottom of the girder was weaker than the concrete in the cylinders connected to the
Sure-Cure system. Again, this finding is significant, because it means that the most
highly stressed concrete may have been weaker than the concrete in the Sure-Cure
cylinders.
Twenty-four strands were instrumented to measure end slip. For nineteen of these
strands, the computed transfer length exceeded the 914 mm (36 inches) predicted by the
AASHTO prediction method (AASHTO 1994). The unexpected long transfer length
would be expected to decrease the shear strength of the girders.
9.2 OBSERVED PRESTRESS LOSSES
Table 9.1 lists the average observed and calculated (using the PCI General
method or the AASHTO LRFD Method) prestress losses for the five instrumented girders
after three years.
145
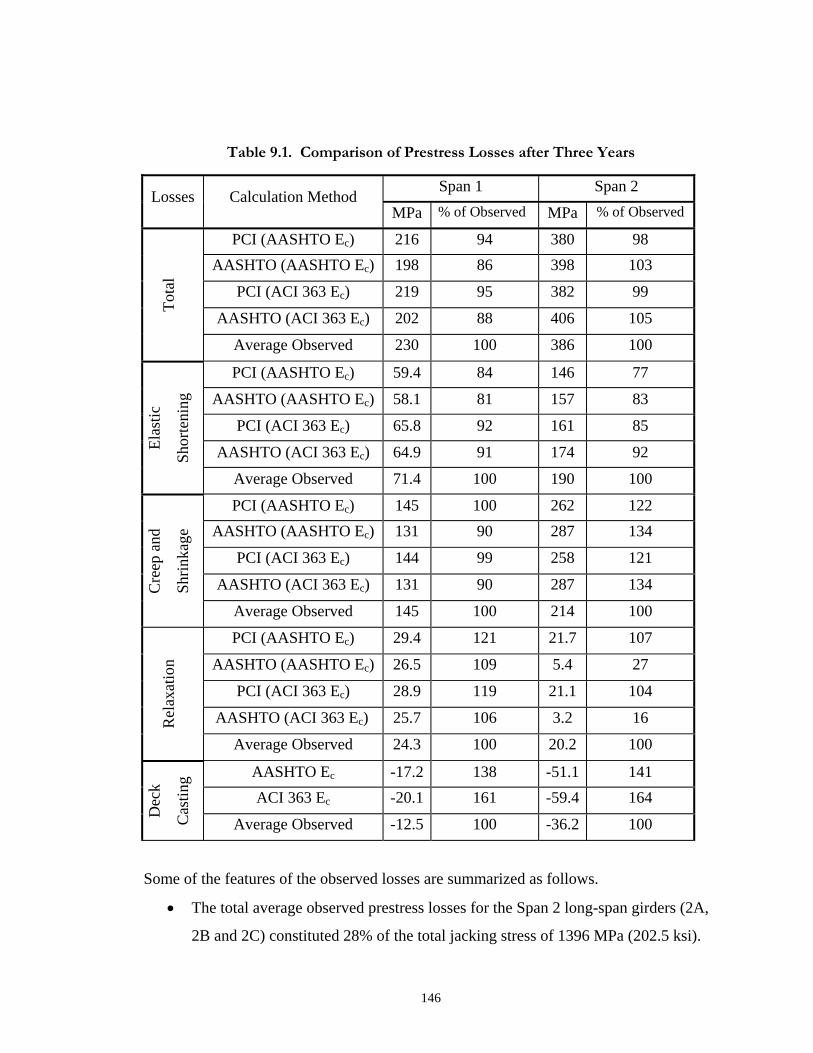
Table 9.1. Comparison of Prestress Losses after Three Years
Span 1 Span 2 Losses Calculation Method
MPa % of Observed MPa % of Observed
PCI (AASHTO Ec) 216 94 380 98 AASHTO (AASHTO Ec) 198 86 398 103
PCI (ACI 363 Ec) 219 95 382 99
AASHTO (ACI 363 Ec) 202 88 406 105
Tota
l
Average Observed 230 100 386 100
PCI (AASHTO Ec) 59.4 84 146 77
AASHTO (AASHTO Ec) 58.1 81 157 83
PCI (ACI 363 Ec) 65.8 92 161 85
AASHTO (ACI 363 Ec) 64.9 91 174 92 Elas
tic
Shor
teni
ng
Average Observed 71.4 100 190 100
PCI (AASHTO Ec) 145 100 262 122 AASHTO (AASHTO Ec) 131 90 287 134
PCI (ACI 363 Ec) 144 99 258 121
AASHTO (ACI 363 Ec) 131 90 287 134 Cre
ep a
nd
Shrin
kage
Average Observed 145 100 214 100
PCI (AASHTO Ec) 29.4 121 21.7 107
AASHTO (AASHTO Ec) 26.5 109 5.4 27
PCI (ACI 363 Ec) 28.9 119 21.1 104
AASHTO (ACI 363 Ec) 25.7 106 3.2 16 Rel
axat
ion
Average Observed 24.3 100 20.2 100
AASHTO Ec -17.2 138 -51.1 141 ACI 363 Ec -20.1 161 -59.4 164
Dec
k
Cas
ting
Average Observed -12.5 100 -36.2 100
Some of the features of the observed losses are summarized as follows.
• The total average observed prestress losses for the Span 2 long-span girders (2A,
2B and 2C) constituted 28% of the total jacking stress of 1396 MPa (202.5 ksi).
146
For the short-span girders (1A and 1C), the total average losses constituted
approximately 16% of the total jacking stress.
• The average observed elastic shortening losses for the long-span girders 2A, 2B
and 2C constitute approximately 14% of the total jacking stress. For girders 1A
and 1C, the elastic shortening loss constitute only 5% of the total jacking stress.
• The average observed creep and shrinkage losses after three years for girders 2A,
2B and 2C constitute 15% of the total jacking stress. For girders 1A and 1C, the
average creep and shrinkage losses constitute approximately 10% of the total
jacking stress. Between 7% to 14% of the creep and shrinkage losses occurred
during destressing. The magnitude of the contribution depended on the time
needed for destressing. For a given span length, the magnitude of the creep and
shrinkage losses correlated well with the maturity of the concrete at destressing
(Table 6.3).
• In general, prestress losses may be higher in HPC girders than in girders made
with conventional concrete (Section 7.9). The elastic shortening and creep
components dominate the losses. The elastic shortening component will almost
certainly be higher because the applied stress will likely increase in direct
proportion to the release strength, whereas the Young’s modulus (Eci) is usually
treated as increasing only with the square root, or even some lower power, of
concrete strength. Whether the creep component is larger depends on Eci/Cc,
where Cc is the creep coefficient.
9.3 COMPARISON WITH CALCULATED PRESTRESS LOSSES
Losses were calculated using the PCI (1979) and AASHTO methods (1994). The
elastic modulus used in each of these methods was calculated according to the AASHTO
LRFD Specifications (1994) and the ACI Committee 363 guidelines (ACI 1990). The
ACI 363 equation for calculating the elastic modulus was developed specifically for
high-strength concrete, but it was calibrated against data with compressive strengths
between 35 and 85 MPa (Carasquillo et al. 1980).
147
The average total observed prestress losses ranged from 13% lower to 5% higher
than the total prestress loss calculated with either the PCI method or the AASHTO
Method. The calculated total losses are particularly close to the total observed losses
when the ACI 363 (ACI 1990) equation was used to calculate the elastic modulus. This
apparently good prediction masks poor prediction of the individual components of loss.
This result does not suggest that either method would be reliable with other materials and
stress states.
On average, the observed elastic shortening losses were found to be 8% to 23%
higher than the elastic shortening losses calculated with the PCI and AASHTO methods
when the WSDOT design unit weight of concrete of 2480 kg/m3 (0.155 kcf) was used. If
the actual unit weight of concrete was used (2400 kg/m3 (0.150 kcf)), the predicted
elastic shortening losses for both methods increased by 5%. In comparison to the PCI
method, the AASHTO method predicted larger elastic shortening losses for the Span 2
girders, but smaller losses for the Span 1 girders.
The observed losses for creep and shrinkage were between 19% lower to 3%
higher than the losses calculated with the PCI method. The observed losses for creep and
shrinkage ranged from 10% lower to 35% higher than the losses calculated with the
AASHTO method. The PCI Method predicted creep and shrinkage losses closer to the
average measured losses in comparison to the AASHTO Method. The PCI and
AASHTO methods over predicted the creep and shrinkage losses for the Span 2 girders.
The AASHTO method under predicted the creep and shrinkage losses for the Span 1
girder, but the PCI method came fairly close to the observed values.
Relaxation loss could not be measured in the girders because it could not be
separated from the other time dependent effects. Therefore estimates based on
manufacturer’s data that were adjusted to take into account elastic shortening, creep and
shrinkage were used in place of the measured values. The predicted relaxation losses
ranged from 85% lower to 23% higher than the estimated values. Although this relative
error is large, the absolute error is still small, because relaxation contributes so little to
the total loss. The predicted losses using the AASHTO method differed the most in
148
comparison to the estimated relaxation losses. The AASHTO method correctly predicts
smaller relaxation losses with increasing elastic shortening, creep and shrinkage losses.
Theoretically, the relaxation losses predicted using the AASHTO method could become
negative under certain circumstances.
The measured magnitude of gain in prestress due to deck casting was on the same
order of magnitude as the relaxation losses. The predicted gain in prestress was up to
three times larger than the observed change. This discrepancy is attributed to the fact that
the SR18/SR516 girders experienced partial longitudinal restraint at the bottom flange
level due to concrete that was placed over the piercaps between the girders. This
concrete locked the girders to the piercaps and induced longitudinal resistance to the
column stiffness.
9.4 CAMBER
Camber was monitored with a stretched-wire system, and intermittently, with a
surveyor’s level. Both systems were capable of an accuracy of approximately ±1 mm,
but the stretched-wire system could only be mounted when no construction activities
were taking place. At three years, the cambers for Girders 2C, 2D and 2E were all
approximately 132 mm (5.2 inches), while the cambers for girders 2A and 2B were
24 and 57 mm (0.9 and 2.2 inches) lower. The anomalous camber in Girder 2B is
thought to be attributable to differences in curing time prior to release. The cambers for
the Span 2 girders used up nearly all the elevation tolerance (95 mm (3.75 inches)) built
into the lift/pad. At three years, the camber for girders 1A and 1B was about 19 mm
(0.75 inches), while the camber in girder 1C was approximately 14 mm (0.55 inches).
During the course of a typical late summer day, the peak-to-peak camber variation
in the long girders was approximately 20 mm (0.8 inches). This variation is attributed to
daily thermal effects. On the same day, the peak-to-peak thermal camber for the short
girders ranged from 5.1 to 8.1 mm (0.2 to 0.32 inches). The minimum and maximum
camber readings occurred at 6:00 a.m. and 3:00 p.m., respectively. The minimum and
maximum temperature readings for the same day occurred at 4:30 p.m. and 6:15 a.m.
149
The difference in time between maximum girder temperature and maximum camber is
attributed to the fact that the thermal camber depends on temperature gradient rather than
absolute temperature. Camber due to temperature gradients will be more of an issue with
HPC, since the girders will typically be more slender, and the stresses higher, than
girders built with conventional concrete.
9.5 RESEARCH RECOMMENDATIONS
A designer needs to be able to predict the prestress losses and cambers for the
concrete mix to be used. Ideally, this prediction is done with an instrumentation
program, but performing an instrumentation program for every mix would not be
feasible. A more economical approach would be to perform materials testing that could
be used to calibrate a prestress loss model. Research is needed to provide the link
between creep and shrinkage observed in the laboratory, and creep and shrinkage to be
expected in the field.
This study identified the critical need to improve the means of predicting girder
creep and shrinkage based on the measured behavior of cylinders. To achieve this goal,
it is necessary to closely simulate in the laboratory specimens the curing conditions and
time of loading of the girders. Greater consistency between the cylinder and girder
strains could be achieved by conducting a laboratory testing program in which the mix
proportions, curing conditions, and time of loading were more carefully controlled than
was possible in this study. The measured strains appear to be very sensitive to the curing
history, age at loading and environmental conditions. Such a study would also permit
investigation of the use of maturity as a measure of the intrinsic age of the concrete.
This project was one of several similar projects being performed in several states.
The prestress losses and camber values from girders various states need to be compared
and efforts made to construct a robust analytical model that will reliably predict prestress
losses and camber changes for a wide range of materials and construction conditions.
150
REFERENCES
ACI MANUEL OF CONCRETE PRACTICE. PART 1 – MATERIALS AND
GENERAL PROPERTIES OF CONCRETE. DETROIT, MICHIGAN. 1990.
AHMAD, S. H., AND SHAH, S. P. “STRUCTURAL PROPERTIES OF HIGH
STRENGTH CONCRETE AND ITS IMPLICATIONS FOR PRECAST
PRESTRESSED CONCRETE.” PRESTRESSED CONCRETE INSTITUTE
JOURNAL. VOLUME 30, NO.6, NOVEMBER/DECEMBER 1985.
American Association of State Highway and Transportation Officials. Standard
Specifications for Highway Bridges. 1st Edition LRFD. Washington, D.C. 1994. American Concrete Institute (ACI). Building Code Requirements for Structural
Concrete. Farmington Hills, Michigan. 1995. Burns, N. H., and B. W. Russell. “Measured Transfer Lengths of 0.5 and 0.6 inch
Strands in Pretensioned Concrete Girders.” Prestressed Concrete Institute Journal. Volume 41, No.5, September/October 1996, pp.44-63.
Barr, P. J. “Behavior of High Performance Prestressed Concrete Girders.” Master’s
Thesis. University of Washington. 1998. Barr, P. J., Fekete, E., Stanton, J. F., Eberhard, M. O., Janssen, D. “High Performance
Concrete in Washington State SR 15/ SR 516 Overcrossing: Final Report on Materials Tests.” Washington State Department of Transportation Bridge and Structures Office, report, Olympia, Washington, 2000a.
• Barr, P.J., Stanton, J.F., Eberhard, M.O. “Live Load Distribution Factors for
Washington State SR18/SR516 Overcrossing.” Washington State Department of
Transportation Bridge and Structures office, report WA-RD 477.1, Olympia,
Washington, 2000b.
Carrasquillo, R. L., Nilson, A. H., Slate, F. O. “Microcracking and Engineering
Properties of High-Strength Concrete.” Report No. 80-1. Department of Structural
151
Engineering School of Civil and Environmental Engineering, Cornell University, Ithaca, New York.
Fekete, E. “Prestress Losses in High Performance Concrete Girders.” Master’s Thesis.
University of Washington. 1997. Ghali, A. and Farve, R. Concrete Structures Stresses and Deformations. E & FN Spon.
London. 1994. Goodspeed, C. H., Vanikar, S., & Cook, R. A. “High-Performance Concrete Definition
for Highway Structures”. Concrete International. Volume 18, No.2, February 1996, pp.62-67.
Lew, H. S., and Reichard, T. W. “Prediction of Strength of concrete from Maturity.”
Accelerated Strength Testing. ACI Publication SP-56, American Concrete Institute, 1978, pp.229-248.
Logan, D. “Acceptance Criteria for Bond Quality of Strand for Pretensioned Prestressed
Concrete Applications.” Prestressed Concrete Institute Journal. Volume 42, No.4, March/April, pp.52-90.
Lwin, M. M., and Khaleghi, B. “Time-Dependent Prestress Losses in Prestress Concrete
Girders Built of High Performance Concrete (Preprint).” Transportation Research Board. 76th Annual Meeting. January 1997.
FHWA, The National Bridge Inventory. US Department of Transportation, Federal
Highway Administration, Washington, D.C. July 1997. MacGregor, J. G. Reinforced Concrete Mechanics and Design. Third Edition. Prentice
Hall. New Jersey. 1997. Nawy, E. G. Prestressed Concrete A Fundamental Approach. Prentice-Hall. New
Jersey. 1989. Nawy, E. G. Fundamentals of High Strength High Performance Concrete. Longman
Group Limited. London. 1996. Nilson, A. H. Design of Prestressed Concrete. Second Edition. John Wiley & Sons.
New York. 1987. Nilson, A. H., Winter, G. Design of Concrete Structures. McGraw-Hill Inc. New York,
New York. 1991.
152

PCI Committee on Prestress Losses. “Recommendations for Estimating Prestress Losses.” Prestressed Concrete Institute Journal. July/August 1975, pp.44-75.
PCI Industry Handbook Committee. PCI Design Handbook. Fourth Edition.
Precast/Prestressed Concrete Institute. Chicago. 1992. Russell, B. W., and Dallas R. R. “Investigation of Standardized Tests to Measure the
Bond Performance of Prestressing Strand.” Prestressed Concrete Institute Journal. July/August 1997.
153


![c Copyright 2015 [Please consult the author] Notice ... · Finite Element Modelling of Lamb Wave Propagation in Prestress concrete and Effect of the Prestress force on the wave’s](https://img.pdfslide.us/doc/110x75/5eac76d3a43df830eb44c797/c-copyright-2015-please-consult-the-author-notice-finite-element-modelling.jpg)