Embed Size (px)
Citation preview
8/7/2019 HIDALGO COUNTY - edcouch-elsa isd _ 2010 Texas School Survey of Drug and Alcohol Use
http://slidepdf.com/reader/full/hidalgo-county-edcouch-elsa-isd-2010-texas-school-survey-of-drug-and-alcohol 1/127
Edcouch-Elsa
SPRING 2010
Texas School Survey
of Drug and Alcohol Use
2010
Edcouch-Elsa ISD
Part I: District Results
Secondary
©Copyright 2010, Texas A&M University
All rights reserved.
Secondary Report-Page 1 of 127

8/7/2019 HIDALGO COUNTY - edcouch-elsa isd _ 2010 Texas School Survey of Drug and Alcohol Use
http://slidepdf.com/reader/full/hidalgo-county-edcouch-elsa-isd-2010-texas-school-survey-of-drug-and-alcohol 2/127
Edcouch-Elsa
SPRING 2010
©Copyright 2010, Texas A&M University
All rights reserved.
Secondary Report-Page 2 of 127
8/7/2019 HIDALGO COUNTY - edcouch-elsa isd _ 2010 Texas School Survey of Drug and Alcohol Use
http://slidepdf.com/reader/full/hidalgo-county-edcouch-elsa-isd-2010-texas-school-survey-of-drug-and-alcohol 3/127
Edcouch-Elsa
SPRING 2010
Part I: District ResultsSecondary (7-12)
Table of Contents
General Substance Tables 5-50
TobaccoAlcoholDrugsInhalantsMiscellaneous
Prevalence Tables 51-94
Selected Substances:
Table B1: All StudentsTable B2: Male StudentsTable B3: Female StudentsTable B4: White StudentsTable B5: African/American StudentsTable B6: Mexican/American StudentsTable B7: Students Reporting A GradesTable B8: Students Reporting Grades Lower Than an ATable B9: Students Living With 2 ParentsTable B10: Students Not Living With 2 ParentsTable B11: Students who would seek help from adults
Table B12: Students who wouldn’t seek help from adultsTable B13 Students Living in Town More Than 3 YearsTable B14: Students Living in Town 3 Years or Less
Margin Tables 95-113
©Copyright 2010, Texas A&M University
All rights reserved.
Secondary Report-Page 3 of 127

8/7/2019 HIDALGO COUNTY - edcouch-elsa isd _ 2010 Texas School Survey of Drug and Alcohol Use
http://slidepdf.com/reader/full/hidalgo-county-edcouch-elsa-isd-2010-texas-school-survey-of-drug-and-alcohol 4/127
Edcouch-Elsa
SPRING 2010
©Copyright 2010, Texas A&M University
All rights reserved.
Secondary Report-Page 4 of 127
8/7/2019 HIDALGO COUNTY - edcouch-elsa isd _ 2010 Texas School Survey of Drug and Alcohol Use
http://slidepdf.com/reader/full/hidalgo-county-edcouch-elsa-isd-2010-texas-school-survey-of-drug-and-alcohol 5/127
Edcouch-Elsa
SPRING 2010
1. General Substance Tables
©Copyright 2010, Texas A&M University
All rights reserved.
Secondary Report-Page 5 of 127
8/7/2019 HIDALGO COUNTY - edcouch-elsa isd _ 2010 Texas School Survey of Drug and Alcohol Use
http://slidepdf.com/reader/full/hidalgo-county-edcouch-elsa-isd-2010-texas-school-survey-of-drug-and-alcohol 6/127
Edcouch-Elsa
SPRING 2010
©Copyright 2010, Texas A&M University
All rights reserved.
Secondary Report-Page 6 of 127
8/7/2019 HIDALGO COUNTY - edcouch-elsa isd _ 2010 Texas School Survey of Drug and Alcohol Use
http://slidepdf.com/reader/full/hidalgo-county-edcouch-elsa-isd-2010-texas-school-survey-of-drug-and-alcohol 7/127
Edcouch-Elsa
SPRING 2010
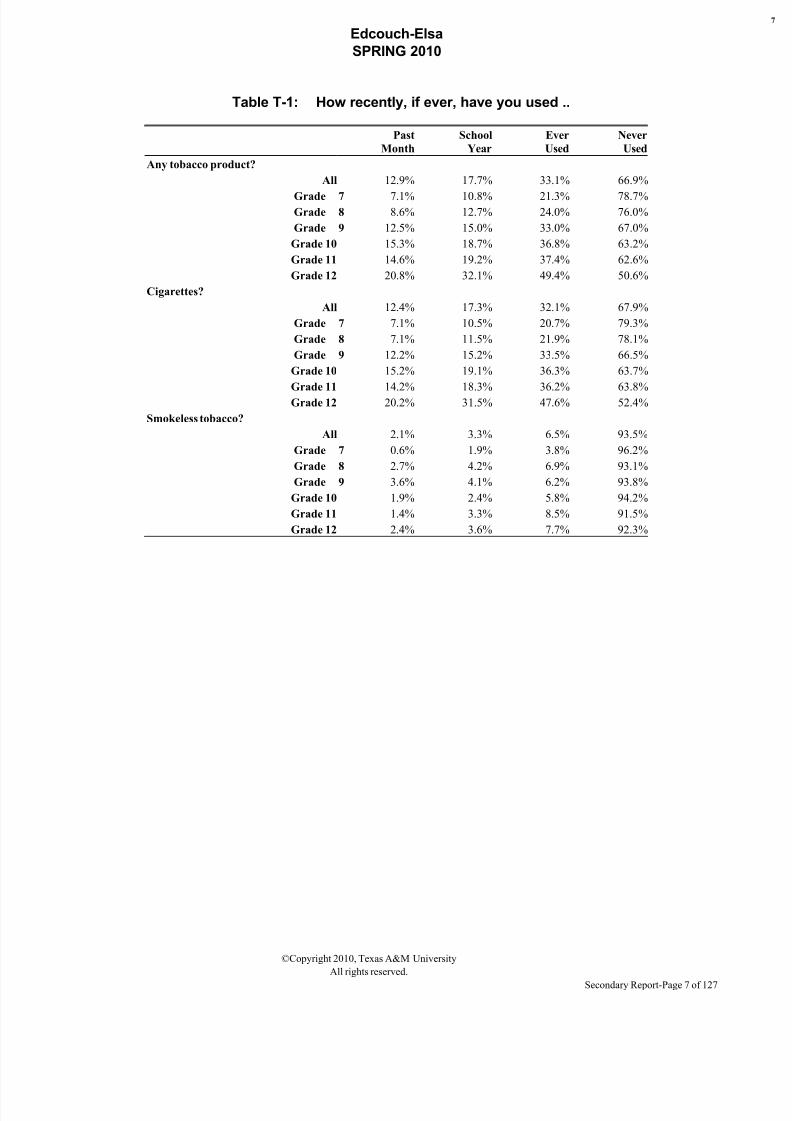
Table T-1: How recently, if ever, have you used ..
Past
Month
School
Year
Ever
Used
Never
Used
Any tobacco product?
All 12.9% 17.7% 33.1% 66.9%
Grade 7 7.1% 10.8% 21.3% 78.7%Grade 8 8.6% 12.7% 24.0% 76.0%
Grade 9 12.5% 15.0% 33.0% 67.0%
Grade 10 15.3% 18.7% 36.8% 63.2%
Grade 11 14.6% 19.2% 37.4% 62.6%
Grade 12 20.8% 32.1% 49.4% 50.6%
Cigarettes?
All 12.4% 17.3% 32.1% 67.9%
Grade 7 7.1% 10.5% 20.7% 79.3%
Grade 8 7.1% 11.5% 21.9% 78.1%
Grade 9 12.2% 15.2% 33.5% 66.5%
Grade 10 15.2% 19.1% 36.3% 63.7%
Grade 11 14.2% 18.3% 36.2% 63.8%Grade 12 20.2% 31.5% 47.6% 52.4%
Smokeless tobacco?
All 2.1% 3.3% 6.5% 93.5%
Grade 7 0.6% 1.9% 3.8% 96.2%
Grade 8 2.7% 4.2% 6.9% 93.1%
Grade 9 3.6% 4.1% 6.2% 93.8%
Grade 10 1.9% 2.4% 5.8% 94.2%
Grade 11 1.4% 3.3% 8.5% 91.5%
Grade 12 2.4% 3.6% 7.7% 92.3%
©Copyright 2010, Texas A&M University
All rights reserved.
Secondary Report-Page 7 of 127
8/7/2019 HIDALGO COUNTY - edcouch-elsa isd _ 2010 Texas School Survey of Drug and Alcohol Use
http://slidepdf.com/reader/full/hidalgo-county-edcouch-elsa-isd-2010-texas-school-survey-of-drug-and-alcohol 8/127
Edcouch-Elsa
SPRING 2010
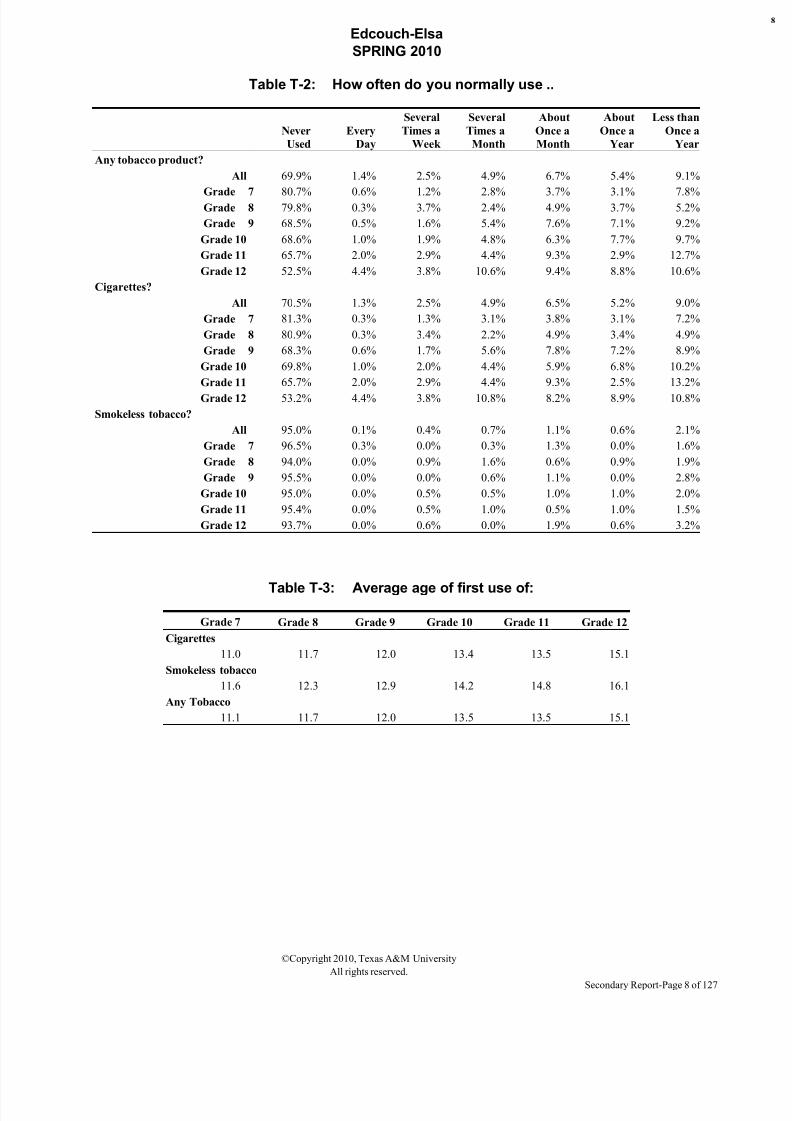
Table T-2: How often do you normally use ..
Never
Used
Every
Day
Several
Times a
Week
Several
Times a
Month
About
Once a
Month
About
Once a
Year
Less than
Once a
Year
Any tobacco product?
All 69.9% 1.4% 2.5% 4.9% 6.7% 5.4% 9.1%
Grade 7 80.7% 0.6% 1.2% 2.8% 3.7% 3.1% 7.8%Grade 8 79.8% 0.3% 3.7% 2.4% 4.9% 3.7% 5.2%
Grade 9 68.5% 0.5% 1.6% 5.4% 7.6% 7.1% 9.2%
Grade 10 68.6% 1.0% 1.9% 4.8% 6.3% 7.7% 9.7%
Grade 11 65.7% 2.0% 2.9% 4.4% 9.3% 2.9% 12.7%
Grade 12 52.5% 4.4% 3.8% 10.6% 9.4% 8.8% 10.6%
Cigarettes?
All 70.5% 1.3% 2.5% 4.9% 6.5% 5.2% 9.0%
Grade 7 81.3% 0.3% 1.3% 3.1% 3.8% 3.1% 7.2%
Grade 8 80.9% 0.3% 3.4% 2.2% 4.9% 3.4% 4.9%
Grade 9 68.3% 0.6% 1.7% 5.6% 7.8% 7.2% 8.9%
Grade 10 69.8% 1.0% 2.0% 4.4% 5.9% 6.8% 10.2%
Grade 11 65.7% 2.0% 2.9% 4.4% 9.3% 2.5% 13.2%
Grade 12 53.2% 4.4% 3.8% 10.8% 8.2% 8.9% 10.8%
Smokeless tobacco?
All 95.0% 0.1% 0.4% 0.7% 1.1% 0.6% 2.1%
Grade 7 96.5% 0.3% 0.0% 0.3% 1.3% 0.0% 1.6%
Grade 8 94.0% 0.0% 0.9% 1.6% 0.6% 0.9% 1.9%
Grade 9 95.5% 0.0% 0.0% 0.6% 1.1% 0.0% 2.8%
Grade 10 95.0% 0.0% 0.5% 0.5% 1.0% 1.0% 2.0%
Grade 11 95.4% 0.0% 0.5% 1.0% 0.5% 1.0% 1.5%
Grade 12 93.7% 0.0% 0.6% 0.0% 1.9% 0.6% 3.2%
Table T-3: Average age of first use of:
Grade 7 Grade 8 Grade 9 Grade 10 Grade 11 Grade 12
Cigarettes
11.0 11.7 12.0 13.4 13.5 15.1
Smokeless tobacco
11.6 12.3 12.9 14.2 14.8 16.1
Any Tobacco
11.1 11.7 12.0 13.5 13.5 15.1
©Copyright 2010, Texas A&M University
All rights reserved.
Secondary Report-Page 8 of 127
8/7/2019 HIDALGO COUNTY - edcouch-elsa isd _ 2010 Texas School Survey of Drug and Alcohol Use
http://slidepdf.com/reader/full/hidalgo-county-edcouch-elsa-isd-2010-texas-school-survey-of-drug-and-alcohol 9/127
Edcouch-Elsa
SPRING 2010
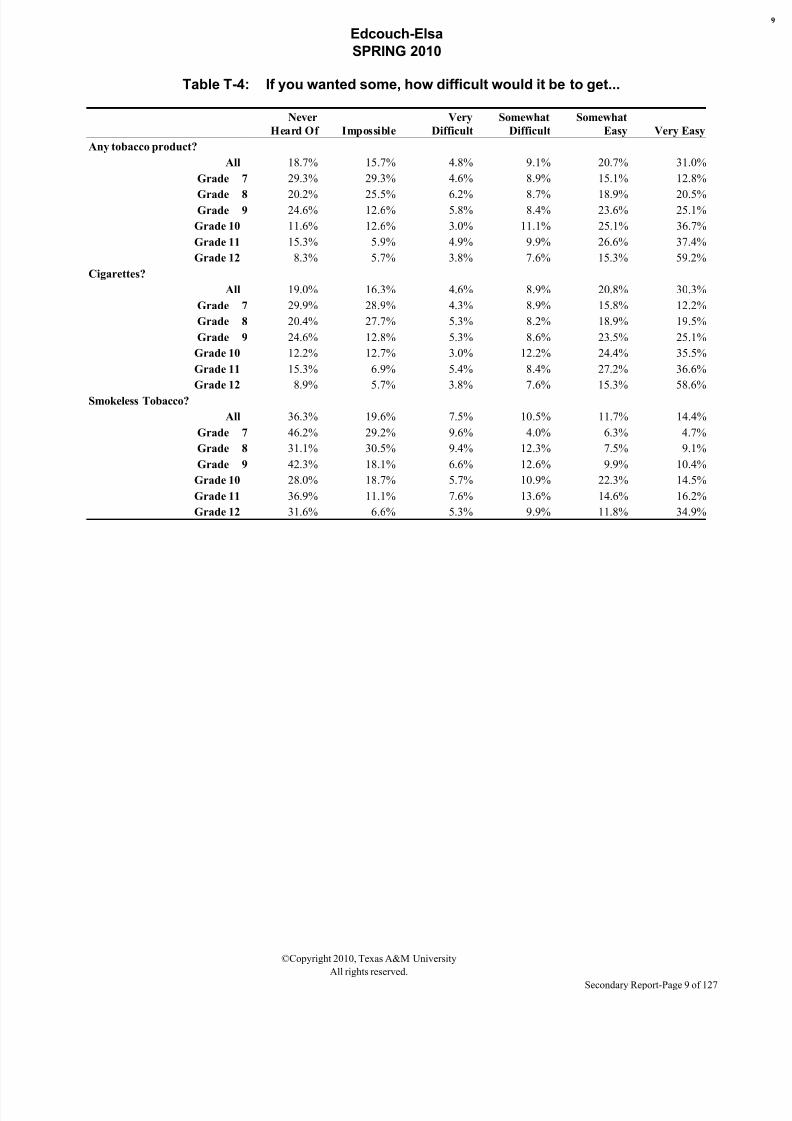
Table T-4: If you wanted some, how difficult would it be to get...
Never
Heard Of Impossible
Very
Difficult
Somewhat
Difficult
Somewhat
Easy Very Easy
Any tobacco product?
All 18.7% 15.7% 4.8% 9.1% 20.7% 31.0%
Grade 7 29.3% 29.3% 4.6% 8.9% 15.1% 12.8%
Grade 8 20.2% 25.5% 6.2% 8.7% 18.9% 20.5%Grade 9 24.6% 12.6% 5.8% 8.4% 23.6% 25.1%
Grade 10 11.6% 12.6% 3.0% 11.1% 25.1% 36.7%
Grade 11 15.3% 5.9% 4.9% 9.9% 26.6% 37.4%
Grade 12 8.3% 5.7% 3.8% 7.6% 15.3% 59.2%
Cigarettes?
All 19.0% 16.3% 4.6% 8.9% 20.8% 30.3%
Grade 7 29.9% 28.9% 4.3% 8.9% 15.8% 12.2%
Grade 8 20.4% 27.7% 5.3% 8.2% 18.9% 19.5%
Grade 9 24.6% 12.8% 5.3% 8.6% 23.5% 25.1%
Grade 10 12.2% 12.7% 3.0% 12.2% 24.4% 35.5%
Grade 11 15.3% 6.9% 5.4% 8.4% 27.2% 36.6%
Grade 12 8.9% 5.7% 3.8% 7.6% 15.3% 58.6%
Smokeless Tobacco?
All 36.3% 19.6% 7.5% 10.5% 11.7% 14.4%
Grade 7 46.2% 29.2% 9.6% 4.0% 6.3% 4.7%
Grade 8 31.1% 30.5% 9.4% 12.3% 7.5% 9.1%
Grade 9 42.3% 18.1% 6.6% 12.6% 9.9% 10.4%
Grade 10 28.0% 18.7% 5.7% 10.9% 22.3% 14.5%
Grade 11 36.9% 11.1% 7.6% 13.6% 14.6% 16.2%
Grade 12 31.6% 6.6% 5.3% 9.9% 11.8% 34.9%
©Copyright 2010, Texas A&M University
All rights reserved.
Secondary Report-Page 9 of 127

8/7/2019 HIDALGO COUNTY - edcouch-elsa isd _ 2010 Texas School Survey of Drug and Alcohol Use
http://slidepdf.com/reader/full/hidalgo-county-edcouch-elsa-isd-2010-texas-school-survey-of-drug-and-alcohol 10/127
Edcouch-Elsa
SPRING 2010
Table T-5: About how many of your close friends...
None A Few Some Most ALL
Use any tobacco product?
All 42.9% 33.5% 13.9% 7.7% 2.0%
Grade 7 61.8% 28.7% 4.7% 3.8% 0.9%
Grade 8 63.1% 23.1% 9.6% 3.3% 0.9%
Grade 9 36.8% 39.9% 18.1% 5.2% 0.0%
Grade 10 33.2% 39.1% 17.3% 7.4% 3.0%
Grade 11 32.4% 37.1% 13.6% 14.6% 2.3%
Grade 12 24.1% 35.2% 21.6% 13.6% 5.6%
Smoke cigarettes?
All 44.3% 33.4% 12.9% 7.4% 1.9%
Grade 7 63.4% 27.8% 4.1% 3.8% 0.9%
Grade 8 65.0% 23.4% 7.9% 3.0% 0.6%
Grade 9 40.0% 37.9% 17.9% 4.2% 0.0%
Grade 10 34.5% 38.0% 17.5% 7.5% 2.5%
Grade 11 32.9% 38.1% 12.9% 13.8% 2.4%
Grade 12 23.3% 37.7% 19.5% 13.8% 5.7%
Use a smokeless tobacco product?All 75.9% 15.2% 5.8% 2.4% 0.6%
Grade 7 83.2% 12.9% 1.9% 1.6% 0.3%
Grade 8 85.8% 7.7% 4.6% 0.9% 0.9%
Grade 9 71.9% 20.5% 4.3% 3.2% 0.0%
Grade 10 70.9% 19.6% 7.0% 2.0% 0.5%
Grade 11 73.1% 14.4% 5.8% 4.8% 1.9%
Grade 12 68.1% 17.5% 12.5% 1.9% 0.0%
©Copyright 2010, Texas A&M University
All rights reserved.
Secondary Report-Page 10 of 127
8/7/2019 HIDALGO COUNTY - edcouch-elsa isd _ 2010 Texas School Survey of Drug and Alcohol Use
http://slidepdf.com/reader/full/hidalgo-county-edcouch-elsa-isd-2010-texas-school-survey-of-drug-and-alcohol 11/127
Edcouch-Elsa
SPRING 2010
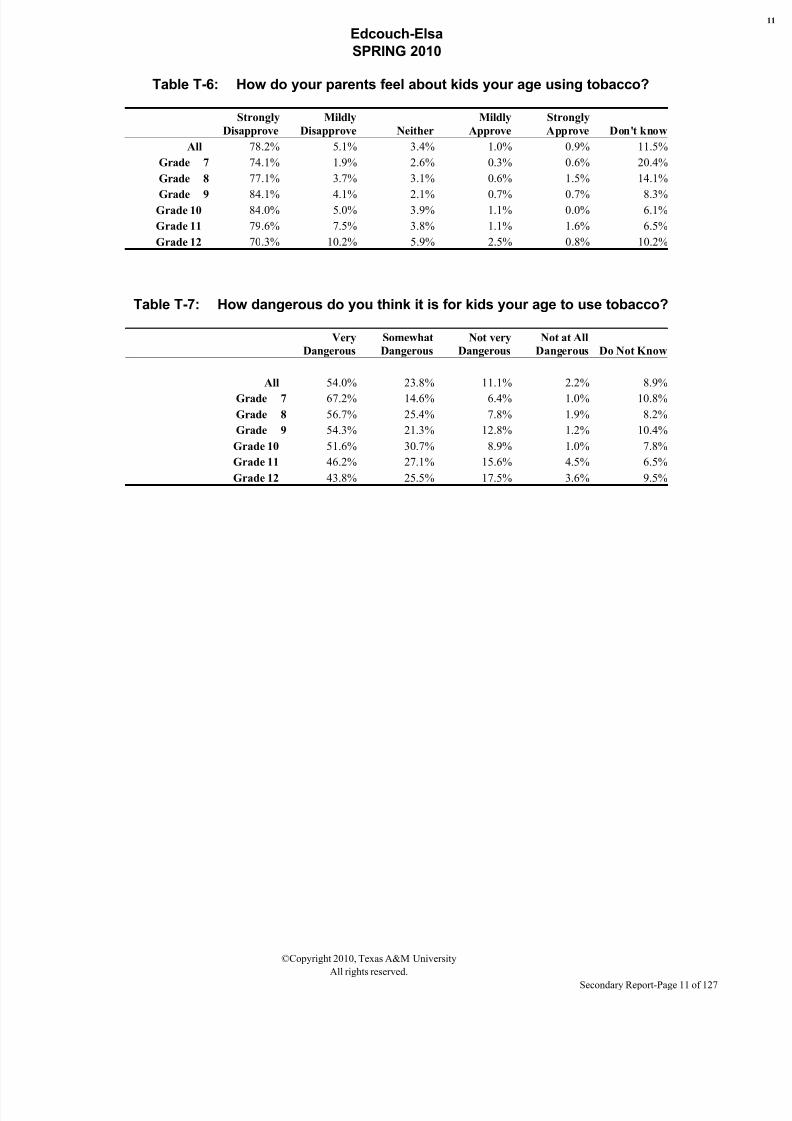
Table T-6: How do your parents feel about kids your age using tobacco?
Strongly
Disapprove
Mildly
Disapprove Neither
Mildly
Approve
Strongly
Approve Don't know
All 78.2% 5.1% 3.4% 1.0% 0.9% 11.5%
Grade 7 74.1% 1.9% 2.6% 0.3% 0.6% 20.4%
Grade 8 77.1% 3.7% 3.1% 0.6% 1.5% 14.1%
Grade 9 84.1% 4.1% 2.1% 0.7% 0.7% 8.3%Grade 10 84.0% 5.0% 3.9% 1.1% 0.0% 6.1%
Grade 11 79.6% 7.5% 3.8% 1.1% 1.6% 6.5%
Grade 12 70.3% 10.2% 5.9% 2.5% 0.8% 10.2%
Table T-7: How dangerous do you think it is for kids your age to use tobacco?
Very
Dangerous
Somewhat
Dangerous
Not very
Dangerous
Not at All
Dangerous Do Not Know
All 54.0% 23.8% 11.1% 2.2% 8.9%
Grade 7 67.2% 14.6% 6.4% 1.0% 10.8%
Grade 8 56.7% 25.4% 7.8% 1.9% 8.2%
Grade 9 54.3% 21.3% 12.8% 1.2% 10.4%
Grade 10 51.6% 30.7% 8.9% 1.0% 7.8%
Grade 11 46.2% 27.1% 15.6% 4.5% 6.5%
Grade 12 43.8% 25.5% 17.5% 3.6% 9.5%
©Copyright 2010, Texas A&M University
All rights reserved.
Secondary Report-Page 11 of 127
8/7/2019 HIDALGO COUNTY - edcouch-elsa isd _ 2010 Texas School Survey of Drug and Alcohol Use
http://slidepdf.com/reader/full/hidalgo-county-edcouch-elsa-isd-2010-texas-school-survey-of-drug-and-alcohol 12/127
Edcouch-Elsa
SPRING 2010
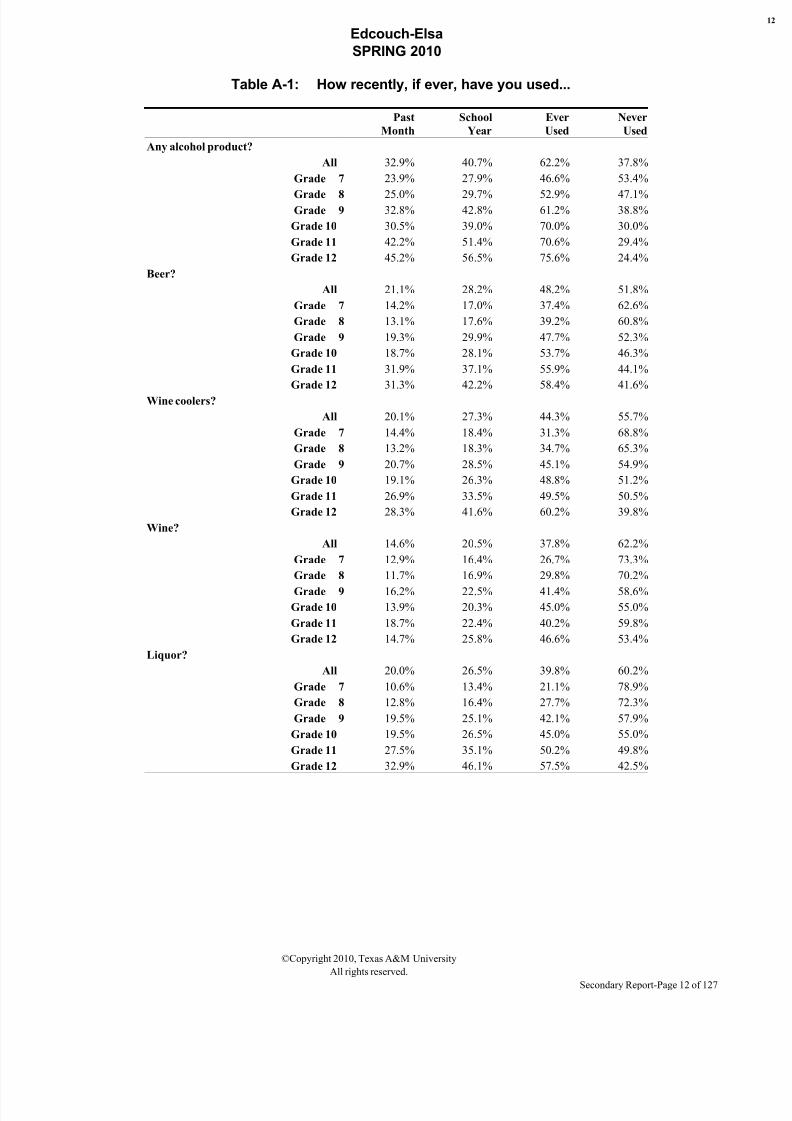
Table A-1: How recently, if ever, have you used...
Past
Month
School
Year
Ever
Used
Never
Used
Any alcohol product?
All 32.9% 40.7% 62.2% 37.8%
Grade 7 23.9% 27.9% 46.6% 53.4%
Grade 8 25.0% 29.7% 52.9% 47.1%Grade 9 32.8% 42.8% 61.2% 38.8%
Grade 10 30.5% 39.0% 70.0% 30.0%
Grade 11 42.2% 51.4% 70.6% 29.4%
Grade 12 45.2% 56.5% 75.6% 24.4%
Beer?
All 21.1% 28.2% 48.2% 51.8%
Grade 7 14.2% 17.0% 37.4% 62.6%
Grade 8 13.1% 17.6% 39.2% 60.8%
Grade 9 19.3% 29.9% 47.7% 52.3%
Grade 10 18.7% 28.1% 53.7% 46.3%
Grade 11 31.9% 37.1% 55.9% 44.1%
Grade 12 31.3% 42.2% 58.4% 41.6%
Wine coolers?
All 20.1% 27.3% 44.3% 55.7%
Grade 7 14.4% 18.4% 31.3% 68.8%
Grade 8 13.2% 18.3% 34.7% 65.3%
Grade 9 20.7% 28.5% 45.1% 54.9%
Grade 10 19.1% 26.3% 48.8% 51.2%
Grade 11 26.9% 33.5% 49.5% 50.5%
Grade 12 28.3% 41.6% 60.2% 39.8%
Wine?
All 14.6% 20.5% 37.8% 62.2%
Grade 7 12.9% 16.4% 26.7% 73.3%
Grade 8 11.7% 16.9% 29.8% 70.2%
Grade 9 16.2% 22.5% 41.4% 58.6%Grade 10 13.9% 20.3% 45.0% 55.0%
Grade 11 18.7% 22.4% 40.2% 59.8%
Grade 12 14.7% 25.8% 46.6% 53.4%
Liquor?
All 20.0% 26.5% 39.8% 60.2%
Grade 7 10.6% 13.4% 21.1% 78.9%
Grade 8 12.8% 16.4% 27.7% 72.3%
Grade 9 19.5% 25.1% 42.1% 57.9%
Grade 10 19.5% 26.5% 45.0% 55.0%
Grade 11 27.5% 35.1% 50.2% 49.8%
Grade 12 32.9% 46.1% 57.5% 42.5%
©Copyright 2010, Texas A&M University
All rights reserved.
Secondary Report-Page 12 of 127
8/7/2019 HIDALGO COUNTY - edcouch-elsa isd _ 2010 Texas School Survey of Drug and Alcohol Use
http://slidepdf.com/reader/full/hidalgo-county-edcouch-elsa-isd-2010-texas-school-survey-of-drug-and-alcohol 13/127
Edcouch-Elsa
SPRING 2010
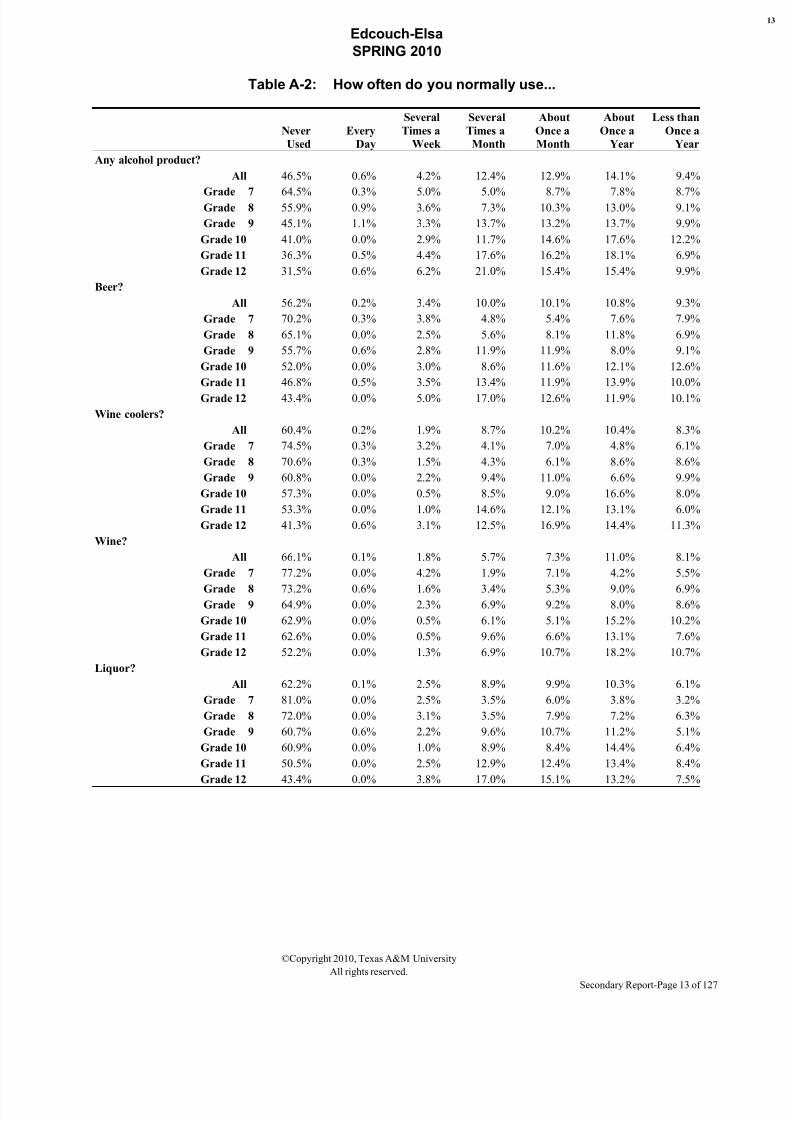
Table A-2: How often do you normally use...
Never
Used
Every
Day
Several
Times a
Week
Several
Times a
Month
About
Once a
Month
About
Once a
Year
Less than
Once a
Year
Any alcohol product?
All 46.5% 0.6% 4.2% 12.4% 12.9% 14.1% 9.4%
Grade 7 64.5% 0.3% 5.0% 5.0% 8.7% 7.8% 8.7%Grade 8 55.9% 0.9% 3.6% 7.3% 10.3% 13.0% 9.1%
Grade 9 45.1% 1.1% 3.3% 13.7% 13.2% 13.7% 9.9%
Grade 10 41.0% 0.0% 2.9% 11.7% 14.6% 17.6% 12.2%
Grade 11 36.3% 0.5% 4.4% 17.6% 16.2% 18.1% 6.9%
Grade 12 31.5% 0.6% 6.2% 21.0% 15.4% 15.4% 9.9%
Beer?
All 56.2% 0.2% 3.4% 10.0% 10.1% 10.8% 9.3%
Grade 7 70.2% 0.3% 3.8% 4.8% 5.4% 7.6% 7.9%
Grade 8 65.1% 0.0% 2.5% 5.6% 8.1% 11.8% 6.9%
Grade 9 55.7% 0.6% 2.8% 11.9% 11.9% 8.0% 9.1%
Grade 10 52.0% 0.0% 3.0% 8.6% 11.6% 12.1% 12.6%
Grade 11 46.8% 0.5% 3.5% 13.4% 11.9% 13.9% 10.0%
Grade 12 43.4% 0.0% 5.0% 17.0% 12.6% 11.9% 10.1%
Wine coolers?
All 60.4% 0.2% 1.9% 8.7% 10.2% 10.4% 8.3%
Grade 7 74.5% 0.3% 3.2% 4.1% 7.0% 4.8% 6.1%
Grade 8 70.6% 0.3% 1.5% 4.3% 6.1% 8.6% 8.6%
Grade 9 60.8% 0.0% 2.2% 9.4% 11.0% 6.6% 9.9%
Grade 10 57.3% 0.0% 0.5% 8.5% 9.0% 16.6% 8.0%
Grade 11 53.3% 0.0% 1.0% 14.6% 12.1% 13.1% 6.0%
Grade 12 41.3% 0.6% 3.1% 12.5% 16.9% 14.4% 11.3%
Wine?
All 66.1% 0.1% 1.8% 5.7% 7.3% 11.0% 8.1%
Grade 7 77.2% 0.0% 4.2% 1.9% 7.1% 4.2% 5.5%
Grade 8 73.2% 0.6% 1.6% 3.4% 5.3% 9.0% 6.9%Grade 9 64.9% 0.0% 2.3% 6.9% 9.2% 8.0% 8.6%
Grade 10 62.9% 0.0% 0.5% 6.1% 5.1% 15.2% 10.2%
Grade 11 62.6% 0.0% 0.5% 9.6% 6.6% 13.1% 7.6%
Grade 12 52.2% 0.0% 1.3% 6.9% 10.7% 18.2% 10.7%
Liquor?
All 62.2% 0.1% 2.5% 8.9% 9.9% 10.3% 6.1%
Grade 7 81.0% 0.0% 2.5% 3.5% 6.0% 3.8% 3.2%
Grade 8 72.0% 0.0% 3.1% 3.5% 7.9% 7.2% 6.3%
Grade 9 60.7% 0.6% 2.2% 9.6% 10.7% 11.2% 5.1%
Grade 10 60.9% 0.0% 1.0% 8.9% 8.4% 14.4% 6.4%
Grade 11 50.5% 0.0% 2.5% 12.9% 12.4% 13.4% 8.4%
Grade 12 43.4% 0.0% 3.8% 17.0% 15.1% 13.2% 7.5%
©Copyright 2010, Texas A&M University
All rights reserved.
Secondary Report-Page 13 of 127
8/7/2019 HIDALGO COUNTY - edcouch-elsa isd _ 2010 Texas School Survey of Drug and Alcohol Use
http://slidepdf.com/reader/full/hidalgo-county-edcouch-elsa-isd-2010-texas-school-survey-of-drug-and-alcohol 14/127
Edcouch-Elsa
SPRING 2010
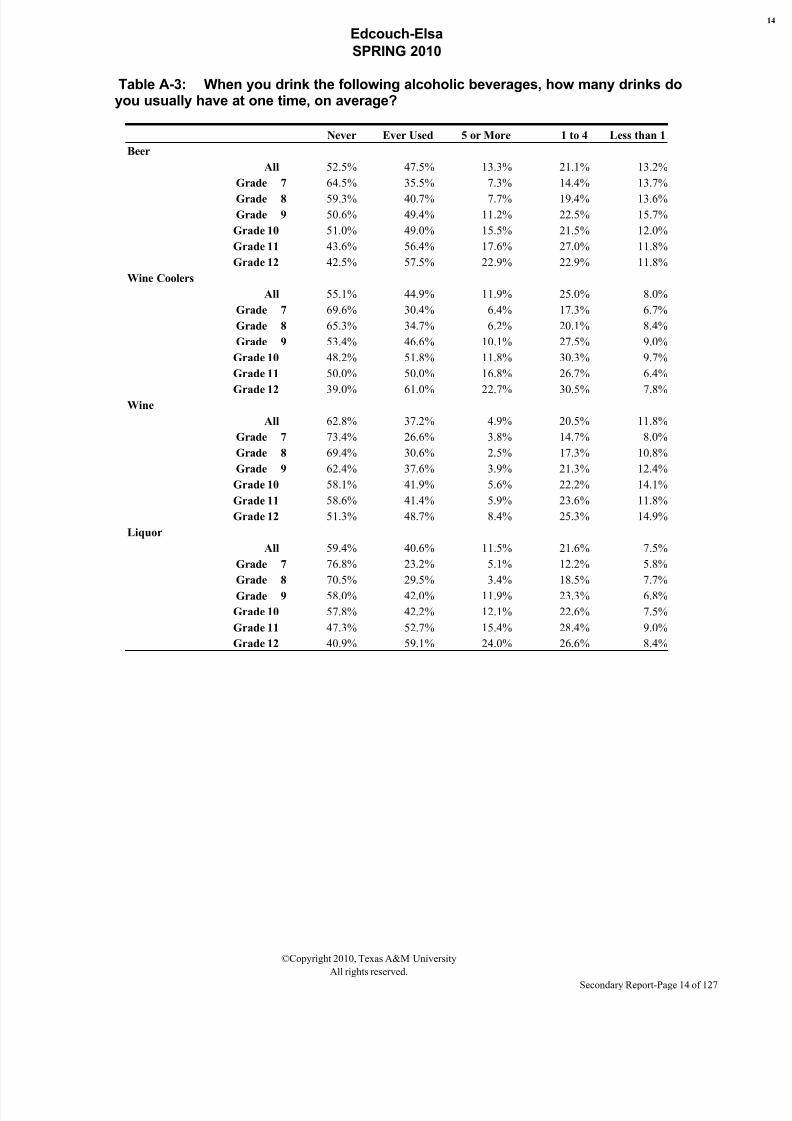
Table A-3: When you drink the following alcoholic beverages, how many drinks doyou usually have at one time, on average?
Never Ever Used 5 or More 1 to 4 Less than 1
Beer
All 52.5% 47.5% 13.3% 21.1% 13.2%
Grade 7 64.5% 35.5% 7.3% 14.4% 13.7%
Grade 8 59.3% 40.7% 7.7% 19.4% 13.6%
Grade 9 50.6% 49.4% 11.2% 22.5% 15.7%
Grade 10 51.0% 49.0% 15.5% 21.5% 12.0%
Grade 11 43.6% 56.4% 17.6% 27.0% 11.8%
Grade 12 42.5% 57.5% 22.9% 22.9% 11.8%
Wine Coolers
All 55.1% 44.9% 11.9% 25.0% 8.0%
Grade 7 69.6% 30.4% 6.4% 17.3% 6.7%
Grade 8 65.3% 34.7% 6.2% 20.1% 8.4%
Grade 9 53.4% 46.6% 10.1% 27.5% 9.0%
Grade 10 48.2% 51.8% 11.8% 30.3% 9.7%
Grade 11 50.0% 50.0% 16.8% 26.7% 6.4%
Grade 12 39.0% 61.0% 22.7% 30.5% 7.8%Wine
All 62.8% 37.2% 4.9% 20.5% 11.8%
Grade 7 73.4% 26.6% 3.8% 14.7% 8.0%
Grade 8 69.4% 30.6% 2.5% 17.3% 10.8%
Grade 9 62.4% 37.6% 3.9% 21.3% 12.4%
Grade 10 58.1% 41.9% 5.6% 22.2% 14.1%
Grade 11 58.6% 41.4% 5.9% 23.6% 11.8%
Grade 12 51.3% 48.7% 8.4% 25.3% 14.9%
Liquor
All 59.4% 40.6% 11.5% 21.6% 7.5%
Grade 7 76.8% 23.2% 5.1% 12.2% 5.8%
Grade 8 70.5% 29.5% 3.4% 18.5% 7.7%
Grade 9 58.0% 42.0% 11.9% 23.3% 6.8%
Grade 10 57.8% 42.2% 12.1% 22.6% 7.5%
Grade 11 47.3% 52.7% 15.4% 28.4% 9.0%
Grade 12 40.9% 59.1% 24.0% 26.6% 8.4%
©Copyright 2010, Texas A&M University
All rights reserved.
Secondary Report-Page 14 of 127
8/7/2019 HIDALGO COUNTY - edcouch-elsa isd _ 2010 Texas School Survey of Drug and Alcohol Use
http://slidepdf.com/reader/full/hidalgo-county-edcouch-elsa-isd-2010-texas-school-survey-of-drug-and-alcohol 15/127
Edcouch-Elsa
SPRING 2010
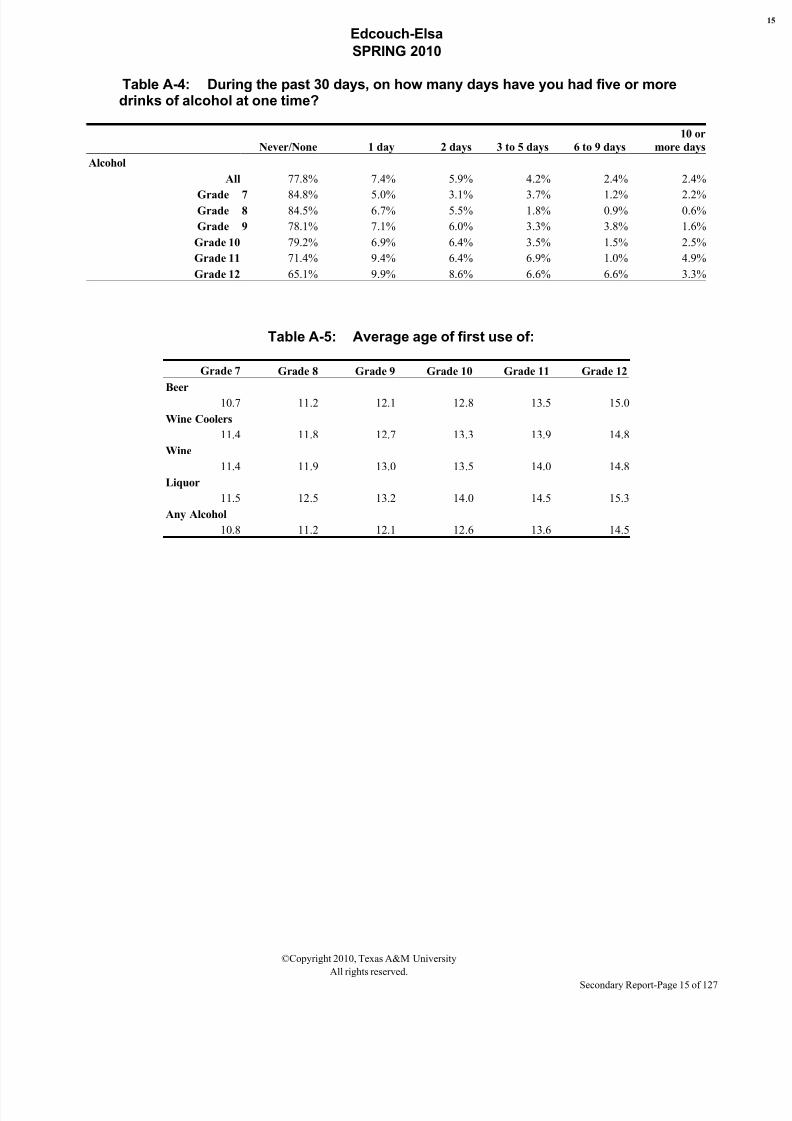
Table A-4: During the past 30 days, on how many days have you had five or moredrinks of alcohol at one time?
Never/None 1 day 2 days 3 to 5 days 6 to 9 days
10 or
more days
Alcohol
All 77.8% 7.4% 5.9% 4.2% 2.4% 2.4%
Grade 7 84.8% 5.0% 3.1% 3.7% 1.2% 2.2%Grade 8 84.5% 6.7% 5.5% 1.8% 0.9% 0.6%
Grade 9 78.1% 7.1% 6.0% 3.3% 3.8% 1.6%
Grade 10 79.2% 6.9% 6.4% 3.5% 1.5% 2.5%
Grade 11 71.4% 9.4% 6.4% 6.9% 1.0% 4.9%
Grade 12 65.1% 9.9% 8.6% 6.6% 6.6% 3.3%
Table A-5: Average age of first use of:
Grade 7 Grade 8 Grade 9 Grade 10 Grade 11 Grade 12
Beer10.7 11.2 12.1 12.8 13.5 15.0
Wine Coolers
11.4 11.8 12.7 13.3 13.9 14.8
Wine
11.4 11.9 13.0 13.5 14.0 14.8
Liquor
11.5 12.5 13.2 14.0 14.5 15.3
Any Alcohol
10.8 11.2 12.1 12.6 13.6 14.5
©Copyright 2010, Texas A&M University
All rights reserved.
Secondary Report-Page 15 of 127
8/7/2019 HIDALGO COUNTY - edcouch-elsa isd _ 2010 Texas School Survey of Drug and Alcohol Use
http://slidepdf.com/reader/full/hidalgo-county-edcouch-elsa-isd-2010-texas-school-survey-of-drug-and-alcohol 16/127
Edcouch-Elsa
SPRING 2010
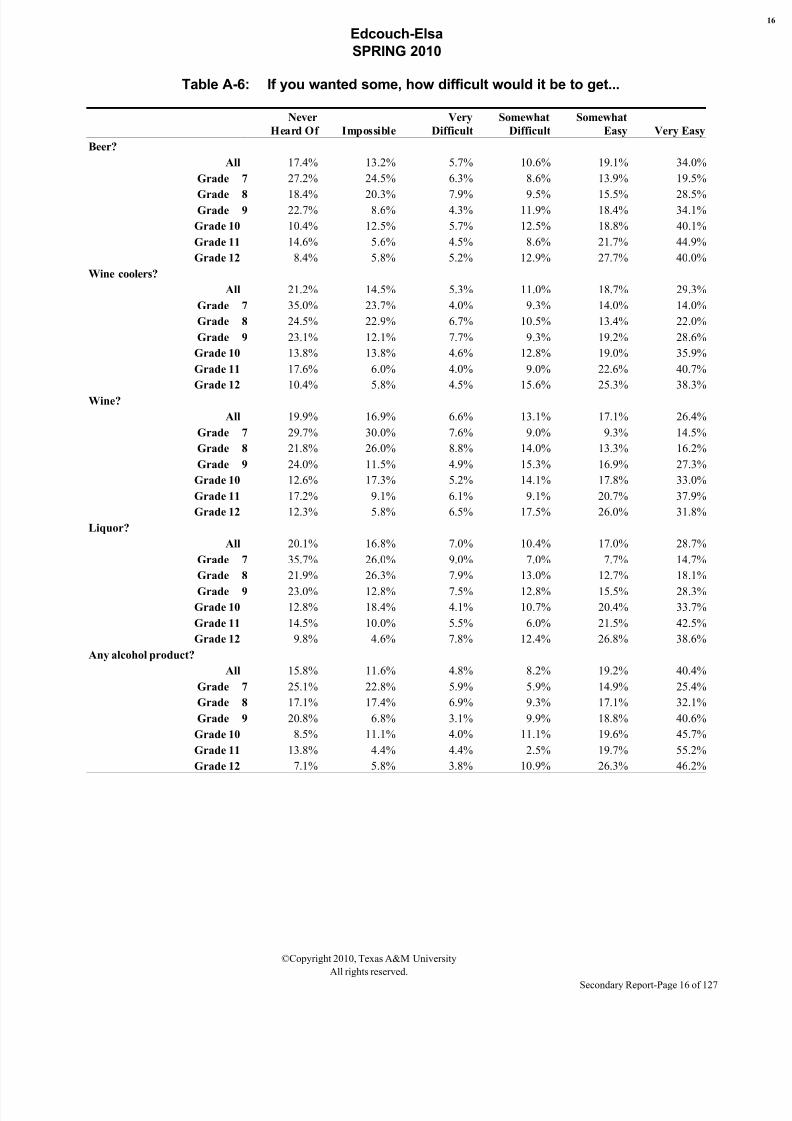
Table A-6: If you wanted some, how difficult would it be to get...
Never
Heard Of Impossible
Very
Difficult
Somewhat
Difficult
Somewhat
Easy Very Easy
Beer?
All 17.4% 13.2% 5.7% 10.6% 19.1% 34.0%
Grade 7 27.2% 24.5% 6.3% 8.6% 13.9% 19.5%
Grade 8 18.4% 20.3% 7.9% 9.5% 15.5% 28.5%Grade 9 22.7% 8.6% 4.3% 11.9% 18.4% 34.1%
Grade 10 10.4% 12.5% 5.7% 12.5% 18.8% 40.1%
Grade 11 14.6% 5.6% 4.5% 8.6% 21.7% 44.9%
Grade 12 8.4% 5.8% 5.2% 12.9% 27.7% 40.0%
Wine coolers?
All 21.2% 14.5% 5.3% 11.0% 18.7% 29.3%
Grade 7 35.0% 23.7% 4.0% 9.3% 14.0% 14.0%
Grade 8 24.5% 22.9% 6.7% 10.5% 13.4% 22.0%
Grade 9 23.1% 12.1% 7.7% 9.3% 19.2% 28.6%
Grade 10 13.8% 13.8% 4.6% 12.8% 19.0% 35.9%
Grade 11 17.6% 6.0% 4.0% 9.0% 22.6% 40.7%
Grade 12 10.4% 5.8% 4.5% 15.6% 25.3% 38.3%
Wine?
All 19.9% 16.9% 6.6% 13.1% 17.1% 26.4%
Grade 7 29.7% 30.0% 7.6% 9.0% 9.3% 14.5%
Grade 8 21.8% 26.0% 8.8% 14.0% 13.3% 16.2%
Grade 9 24.0% 11.5% 4.9% 15.3% 16.9% 27.3%
Grade 10 12.6% 17.3% 5.2% 14.1% 17.8% 33.0%
Grade 11 17.2% 9.1% 6.1% 9.1% 20.7% 37.9%
Grade 12 12.3% 5.8% 6.5% 17.5% 26.0% 31.8%
Liquor?
All 20.1% 16.8% 7.0% 10.4% 17.0% 28.7%
Grade 7 35.7% 26.0% 9.0% 7.0% 7.7% 14.7%
Grade 8 21.9% 26.3% 7.9% 13.0% 12.7% 18.1%
Grade 9 23.0% 12.8% 7.5% 12.8% 15.5% 28.3%Grade 10 12.8% 18.4% 4.1% 10.7% 20.4% 33.7%
Grade 11 14.5% 10.0% 5.5% 6.0% 21.5% 42.5%
Grade 12 9.8% 4.6% 7.8% 12.4% 26.8% 38.6%
Any alcohol product?
All 15.8% 11.6% 4.8% 8.2% 19.2% 40.4%
Grade 7 25.1% 22.8% 5.9% 5.9% 14.9% 25.4%
Grade 8 17.1% 17.4% 6.9% 9.3% 17.1% 32.1%
Grade 9 20.8% 6.8% 3.1% 9.9% 18.8% 40.6%
Grade 10 8.5% 11.1% 4.0% 11.1% 19.6% 45.7%
Grade 11 13.8% 4.4% 4.4% 2.5% 19.7% 55.2%
Grade 12 7.1% 5.8% 3.8% 10.9% 26.3% 46.2%
©Copyright 2010, Texas A&M University
All rights reserved.
Secondary Report-Page 16 of 127
8/7/2019 HIDALGO COUNTY - edcouch-elsa isd _ 2010 Texas School Survey of Drug and Alcohol Use
http://slidepdf.com/reader/full/hidalgo-county-edcouch-elsa-isd-2010-texas-school-survey-of-drug-and-alcohol 17/127
Edcouch-Elsa
SPRING 2010
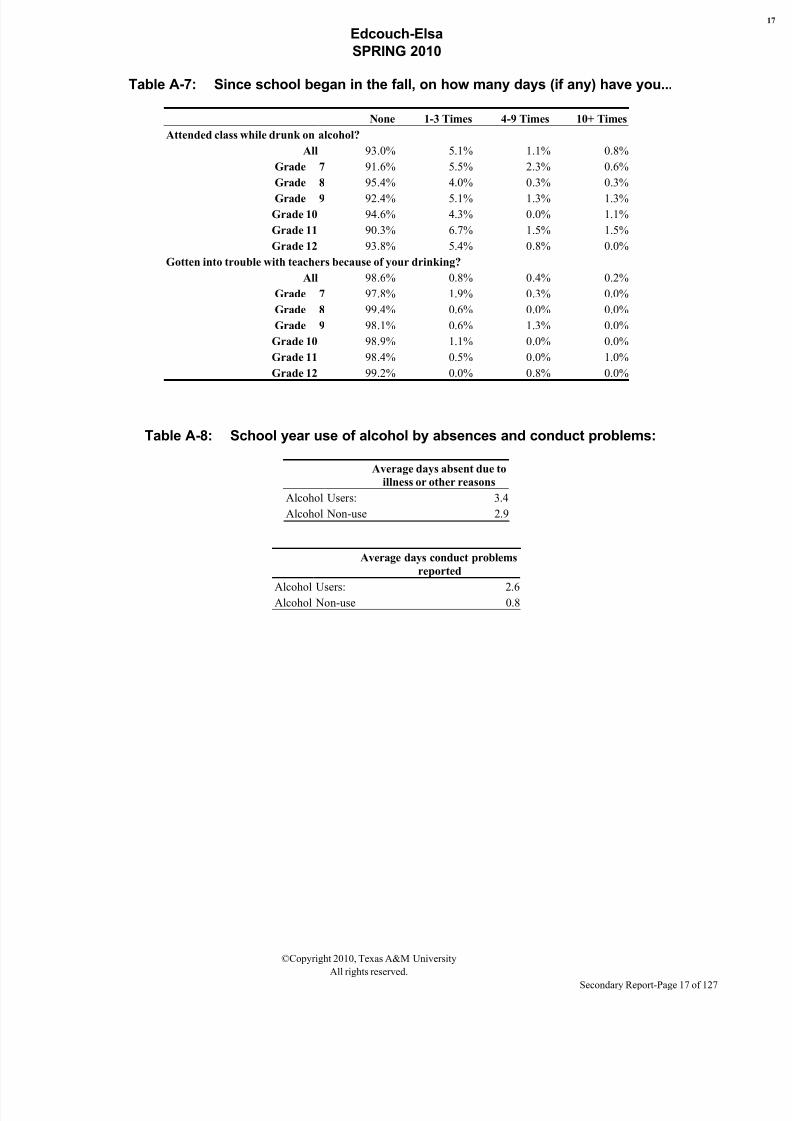
Table A-7: Since school began in the fall, on how many days (if any) have you...
None 1-3 Times 4-9 Times 10+ Times
Attended class while drunk on alcohol?
All 93.0% 5.1% 1.1% 0.8%
Grade 7 91.6% 5.5% 2.3% 0.6%
Grade 8 95.4% 4.0% 0.3% 0.3%
Grade 9 92.4% 5.1% 1.3% 1.3%
Grade 10 94.6% 4.3% 0.0% 1.1%
Grade 11 90.3% 6.7% 1.5% 1.5%
Grade 12 93.8% 5.4% 0.8% 0.0%
Gotten into trouble with teachers because of your drinking?
All 98.6% 0.8% 0.4% 0.2%
Grade 7 97.8% 1.9% 0.3% 0.0%
Grade 8 99.4% 0.6% 0.0% 0.0%
Grade 9 98.1% 0.6% 1.3% 0.0%
Grade 10 98.9% 1.1% 0.0% 0.0%
Grade 11 98.4% 0.5% 0.0% 1.0%
Grade 12 99.2% 0.0% 0.8% 0.0%
Table A-8: School year use of alcohol by absences and conduct problems:
Average days absent due to
illness or other reasons
Alcohol Users: 3.4
Alcohol Non-use 2.9
Average days conduct problems
reported
Alcohol Users: 2.6Alcohol Non-use 0.8
©Copyright 2010, Texas A&M University
All rights reserved.
Secondary Report-Page 17 of 127
8/7/2019 HIDALGO COUNTY - edcouch-elsa isd _ 2010 Texas School Survey of Drug and Alcohol Use
http://slidepdf.com/reader/full/hidalgo-county-edcouch-elsa-isd-2010-texas-school-survey-of-drug-and-alcohol 18/127
Edcouch-Elsa
SPRING 2010
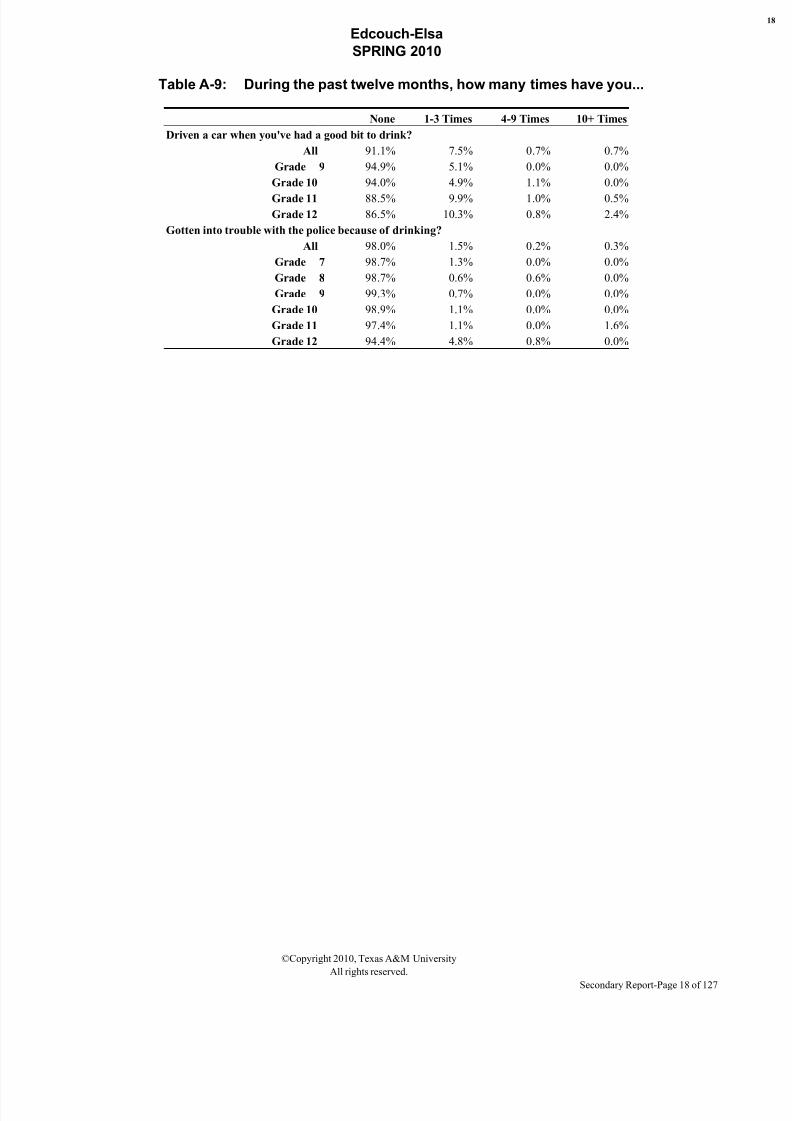
Table A-9: During the past twelve months, how many times have you...
None 1-3 Times 4-9 Times 10+ Times
Driven a car when you've had a good bit to drink?
All 91.1% 7.5% 0.7% 0.7%
Grade 9 94.9% 5.1% 0.0% 0.0%
Grade 10 94.0% 4.9% 1.1% 0.0%
Grade 11 88.5% 9.9% 1.0% 0.5%
Grade 12 86.5% 10.3% 0.8% 2.4%
Gotten into trouble with the police because of drinking?
All 98.0% 1.5% 0.2% 0.3%
Grade 7 98.7% 1.3% 0.0% 0.0%
Grade 8 98.7% 0.6% 0.6% 0.0%
Grade 9 99.3% 0.7% 0.0% 0.0%
Grade 10 98.9% 1.1% 0.0% 0.0%
Grade 11 97.4% 1.1% 0.0% 1.6%
Grade 12 94.4% 4.8% 0.8% 0.0%
©Copyright 2010, Texas A&M University
All rights reserved.
Secondary Report-Page 18 of 127
8/7/2019 HIDALGO COUNTY - edcouch-elsa isd _ 2010 Texas School Survey of Drug and Alcohol Use
http://slidepdf.com/reader/full/hidalgo-county-edcouch-elsa-isd-2010-texas-school-survey-of-drug-and-alcohol 19/127
Edcouch-Elsa
SPRING 2010
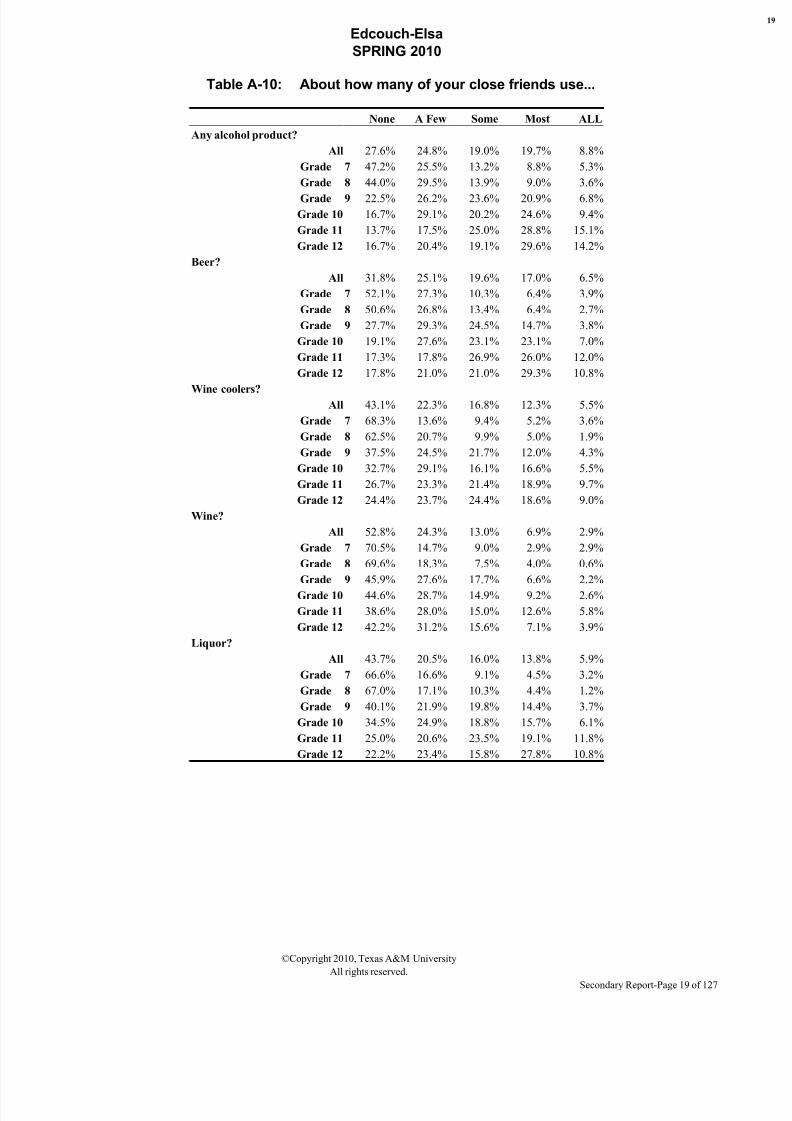
Table A-10: About how many of your close friends use...
None A Few Some Most ALL
Any alcohol product?
All 27.6% 24.8% 19.0% 19.7% 8.8%
Grade 7 47.2% 25.5% 13.2% 8.8% 5.3%
Grade 8 44.0% 29.5% 13.9% 9.0% 3.6%
Grade 9 22.5% 26.2% 23.6% 20.9% 6.8%
Grade 10 16.7% 29.1% 20.2% 24.6% 9.4%
Grade 11 13.7% 17.5% 25.0% 28.8% 15.1%
Grade 12 16.7% 20.4% 19.1% 29.6% 14.2%
Beer?
All 31.8% 25.1% 19.6% 17.0% 6.5%
Grade 7 52.1% 27.3% 10.3% 6.4% 3.9%
Grade 8 50.6% 26.8% 13.4% 6.4% 2.7%
Grade 9 27.7% 29.3% 24.5% 14.7% 3.8%
Grade 10 19.1% 27.6% 23.1% 23.1% 7.0%
Grade 11 17.3% 17.8% 26.9% 26.0% 12.0%
Grade 12 17.8% 21.0% 21.0% 29.3% 10.8%
Wine coolers?All 43.1% 22.3% 16.8% 12.3% 5.5%
Grade 7 68.3% 13.6% 9.4% 5.2% 3.6%
Grade 8 62.5% 20.7% 9.9% 5.0% 1.9%
Grade 9 37.5% 24.5% 21.7% 12.0% 4.3%
Grade 10 32.7% 29.1% 16.1% 16.6% 5.5%
Grade 11 26.7% 23.3% 21.4% 18.9% 9.7%
Grade 12 24.4% 23.7% 24.4% 18.6% 9.0%
Wine?
All 52.8% 24.3% 13.0% 6.9% 2.9%
Grade 7 70.5% 14.7% 9.0% 2.9% 2.9%
Grade 8 69.6% 18.3% 7.5% 4.0% 0.6%
Grade 9 45.9% 27.6% 17.7% 6.6% 2.2%
Grade 10 44.6% 28.7% 14.9% 9.2% 2.6%
Grade 11 38.6% 28.0% 15.0% 12.6% 5.8%
Grade 12 42.2% 31.2% 15.6% 7.1% 3.9%
Liquor?
All 43.7% 20.5% 16.0% 13.8% 5.9%
Grade 7 66.6% 16.6% 9.1% 4.5% 3.2%
Grade 8 67.0% 17.1% 10.3% 4.4% 1.2%
Grade 9 40.1% 21.9% 19.8% 14.4% 3.7%
Grade 10 34.5% 24.9% 18.8% 15.7% 6.1%
Grade 11 25.0% 20.6% 23.5% 19.1% 11.8%
Grade 12 22.2% 23.4% 15.8% 27.8% 10.8%
©Copyright 2010, Texas A&M University
All rights reserved.
Secondary Report-Page 19 of 127
8/7/2019 HIDALGO COUNTY - edcouch-elsa isd _ 2010 Texas School Survey of Drug and Alcohol Use
http://slidepdf.com/reader/full/hidalgo-county-edcouch-elsa-isd-2010-texas-school-survey-of-drug-and-alcohol 20/127
Edcouch-Elsa
SPRING 2010
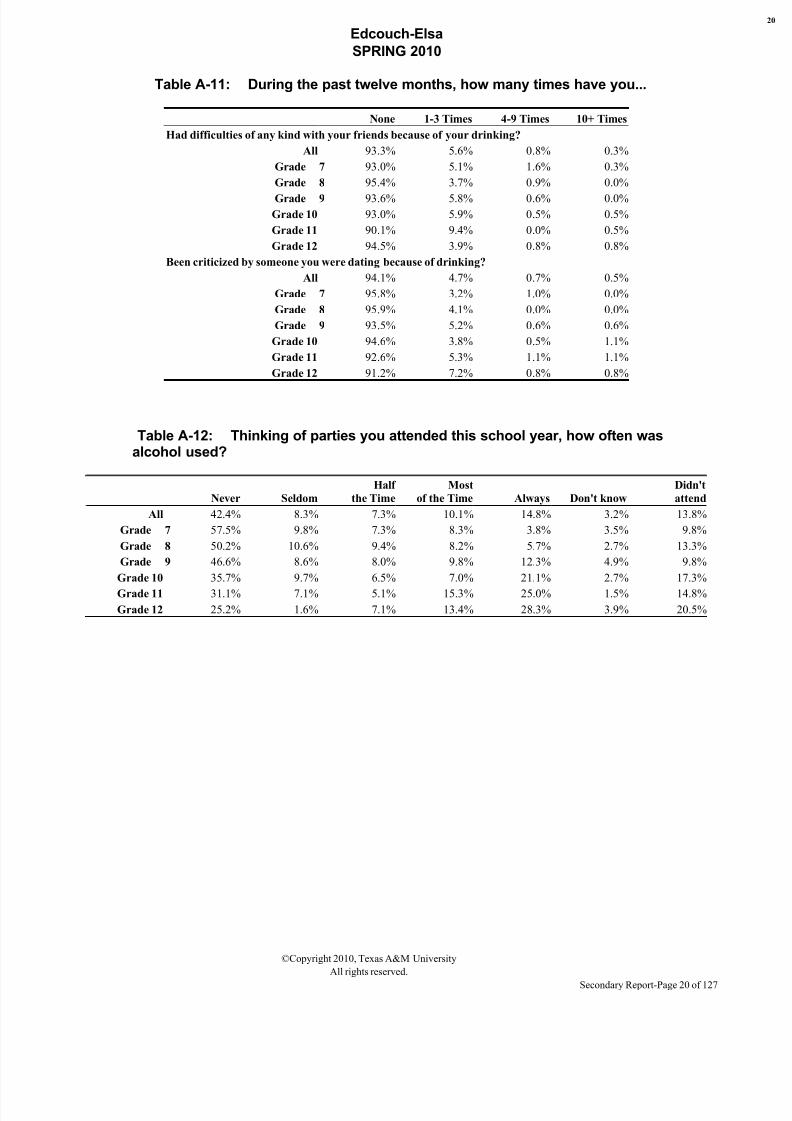
Table A-11: During the past twelve months, how many times have you...
None 1-3 Times 4-9 Times 10+ Times
Had difficulties of any kind with your friends because of your drinking?
All 93.3% 5.6% 0.8% 0.3%
Grade 7 93.0% 5.1% 1.6% 0.3%
Grade 8 95.4% 3.7% 0.9% 0.0%
Grade 9 93.6% 5.8% 0.6% 0.0%
Grade 10 93.0% 5.9% 0.5% 0.5%
Grade 11 90.1% 9.4% 0.0% 0.5%
Grade 12 94.5% 3.9% 0.8% 0.8%
Been criticized by someone you were dating because of drinking?
All 94.1% 4.7% 0.7% 0.5%
Grade 7 95.8% 3.2% 1.0% 0.0%
Grade 8 95.9% 4.1% 0.0% 0.0%
Grade 9 93.5% 5.2% 0.6% 0.6%
Grade 10 94.6% 3.8% 0.5% 1.1%
Grade 11 92.6% 5.3% 1.1% 1.1%
Grade 12 91.2% 7.2% 0.8% 0.8%
Table A-12: Thinking of parties you attended this school year, how often wasalcohol used?
Never Seldom
Half
the Time
Most
of the Time Always Don't know
Didn't
attend
All 42.4% 8.3% 7.3% 10.1% 14.8% 3.2% 13.8%
Grade 7 57.5% 9.8% 7.3% 8.3% 3.8% 3.5% 9.8%
Grade 8 50.2% 10.6% 9.4% 8.2% 5.7% 2.7% 13.3%
Grade 9 46.6% 8.6% 8.0% 9.8% 12.3% 4.9% 9.8%
Grade 10 35.7% 9.7% 6.5% 7.0% 21.1% 2.7% 17.3%
Grade 11 31.1% 7.1% 5.1% 15.3% 25.0% 1.5% 14.8%
Grade 12 25.2% 1.6% 7.1% 13.4% 28.3% 3.9% 20.5%
©Copyright 2010, Texas A&M University
All rights reserved.
Secondary Report-Page 20 of 127
8/7/2019 HIDALGO COUNTY - edcouch-elsa isd _ 2010 Texas School Survey of Drug and Alcohol Use
http://slidepdf.com/reader/full/hidalgo-county-edcouch-elsa-isd-2010-texas-school-survey-of-drug-and-alcohol 21/127
Edcouch-Elsa
SPRING 2010
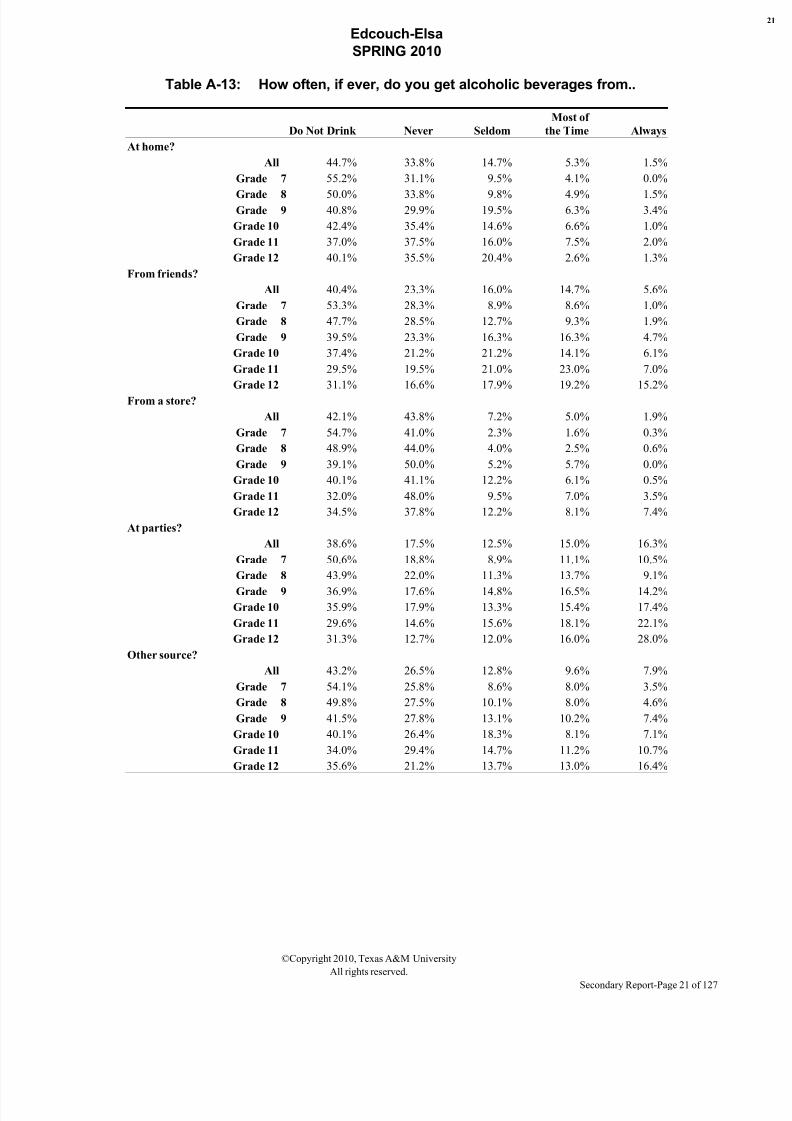
Table A-13: How often, if ever, do you get alcoholic beverages from..
Do Not Drink Never Seldom
Most of
the Time Always
At home?
All 44.7% 33.8% 14.7% 5.3% 1.5%
Grade 7 55.2% 31.1% 9.5% 4.1% 0.0%
Grade 8 50.0% 33.8% 9.8% 4.9% 1.5%Grade 9 40.8% 29.9% 19.5% 6.3% 3.4%
Grade 10 42.4% 35.4% 14.6% 6.6% 1.0%
Grade 11 37.0% 37.5% 16.0% 7.5% 2.0%
Grade 12 40.1% 35.5% 20.4% 2.6% 1.3%
From friends?
All 40.4% 23.3% 16.0% 14.7% 5.6%
Grade 7 53.3% 28.3% 8.9% 8.6% 1.0%
Grade 8 47.7% 28.5% 12.7% 9.3% 1.9%
Grade 9 39.5% 23.3% 16.3% 16.3% 4.7%
Grade 10 37.4% 21.2% 21.2% 14.1% 6.1%
Grade 11 29.5% 19.5% 21.0% 23.0% 7.0%
Grade 12 31.1% 16.6% 17.9% 19.2% 15.2%
From a store?
All 42.1% 43.8% 7.2% 5.0% 1.9%
Grade 7 54.7% 41.0% 2.3% 1.6% 0.3%
Grade 8 48.9% 44.0% 4.0% 2.5% 0.6%
Grade 9 39.1% 50.0% 5.2% 5.7% 0.0%
Grade 10 40.1% 41.1% 12.2% 6.1% 0.5%
Grade 11 32.0% 48.0% 9.5% 7.0% 3.5%
Grade 12 34.5% 37.8% 12.2% 8.1% 7.4%
At parties?
All 38.6% 17.5% 12.5% 15.0% 16.3%
Grade 7 50.6% 18.8% 8.9% 11.1% 10.5%
Grade 8 43.9% 22.0% 11.3% 13.7% 9.1%
Grade 9 36.9% 17.6% 14.8% 16.5% 14.2%Grade 10 35.9% 17.9% 13.3% 15.4% 17.4%
Grade 11 29.6% 14.6% 15.6% 18.1% 22.1%
Grade 12 31.3% 12.7% 12.0% 16.0% 28.0%
Other source?
All 43.2% 26.5% 12.8% 9.6% 7.9%
Grade 7 54.1% 25.8% 8.6% 8.0% 3.5%
Grade 8 49.8% 27.5% 10.1% 8.0% 4.6%
Grade 9 41.5% 27.8% 13.1% 10.2% 7.4%
Grade 10 40.1% 26.4% 18.3% 8.1% 7.1%
Grade 11 34.0% 29.4% 14.7% 11.2% 10.7%
Grade 12 35.6% 21.2% 13.7% 13.0% 16.4%
©Copyright 2010, Texas A&M University
All rights reserved.
Secondary Report-Page 21 of 127
8/7/2019 HIDALGO COUNTY - edcouch-elsa isd _ 2010 Texas School Survey of Drug and Alcohol Use
http://slidepdf.com/reader/full/hidalgo-county-edcouch-elsa-isd-2010-texas-school-survey-of-drug-and-alcohol 22/127
Edcouch-Elsa
SPRING 2010
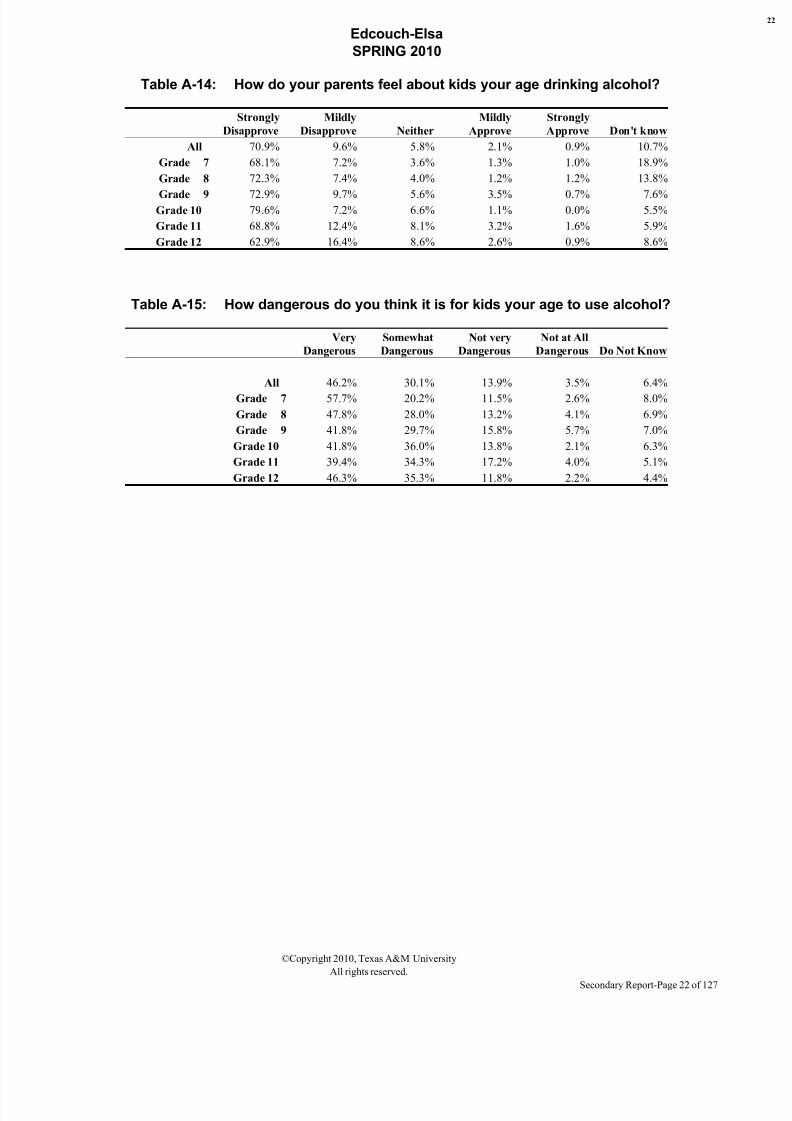
Table A-14: How do your parents feel about kids your age drinking alcohol?
Strongly
Disapprove
Mildly
Disapprove Neither
Mildly
Approve
Strongly
Approve Don't know
All 70.9% 9.6% 5.8% 2.1% 0.9% 10.7%
Grade 7 68.1% 7.2% 3.6% 1.3% 1.0% 18.9%
Grade 8 72.3% 7.4% 4.0% 1.2% 1.2% 13.8%
Grade 9 72.9% 9.7% 5.6% 3.5% 0.7% 7.6%Grade 10 79.6% 7.2% 6.6% 1.1% 0.0% 5.5%
Grade 11 68.8% 12.4% 8.1% 3.2% 1.6% 5.9%
Grade 12 62.9% 16.4% 8.6% 2.6% 0.9% 8.6%
Table A-15: How dangerous do you think it is for kids your age to use alcohol?
Very
Dangerous
Somewhat
Dangerous
Not very
Dangerous
Not at All
Dangerous Do Not Know
All 46.2% 30.1% 13.9% 3.5% 6.4%
Grade 7 57.7% 20.2% 11.5% 2.6% 8.0%
Grade 8 47.8% 28.0% 13.2% 4.1% 6.9%
Grade 9 41.8% 29.7% 15.8% 5.7% 7.0%
Grade 10 41.8% 36.0% 13.8% 2.1% 6.3%
Grade 11 39.4% 34.3% 17.2% 4.0% 5.1%
Grade 12 46.3% 35.3% 11.8% 2.2% 4.4%
©Copyright 2010, Texas A&M University
All rights reserved.
Secondary Report-Page 22 of 127
8/7/2019 HIDALGO COUNTY - edcouch-elsa isd _ 2010 Texas School Survey of Drug and Alcohol Use
http://slidepdf.com/reader/full/hidalgo-county-edcouch-elsa-isd-2010-texas-school-survey-of-drug-and-alcohol 23/127
Edcouch-Elsa
SPRING 2010
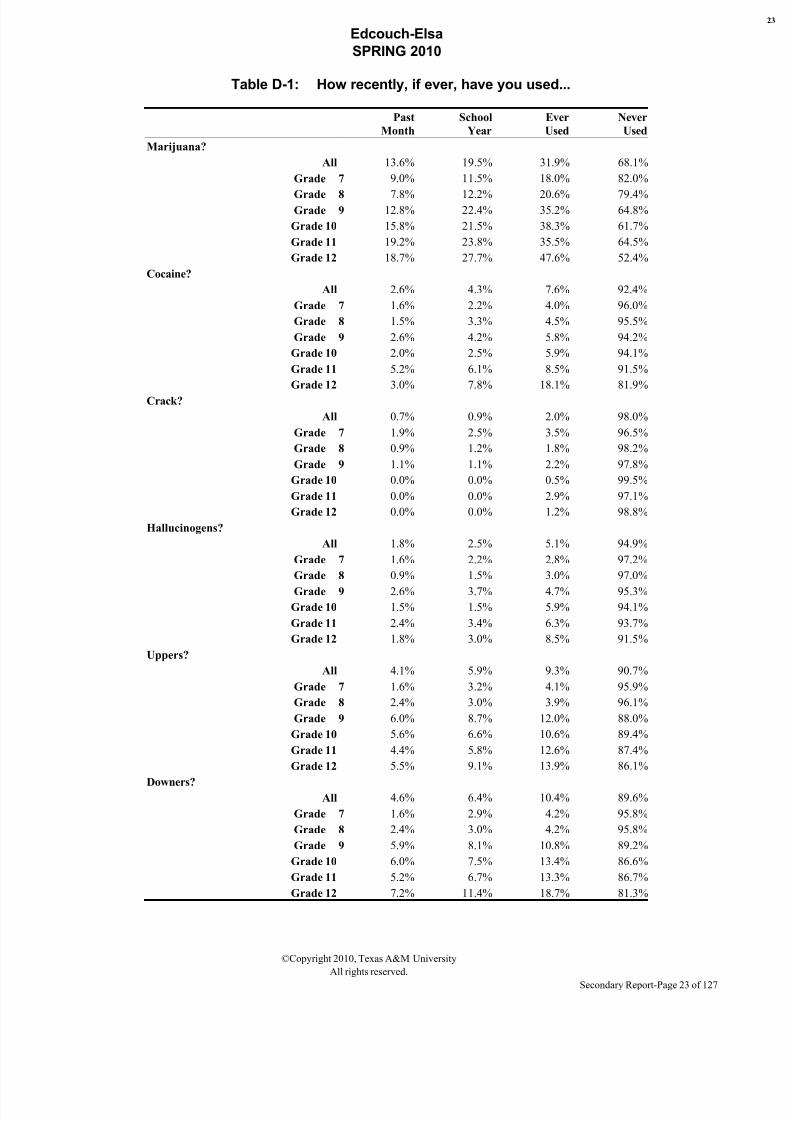
Table D-1: How recently, if ever, have you used...
Past
Month
School
Year
Ever
Used
Never
Used
Marijuana?
All 13.6% 19.5% 31.9% 68.1%
Grade 7 9.0% 11.5% 18.0% 82.0%
Grade 8 7.8% 12.2% 20.6% 79.4%Grade 9 12.8% 22.4% 35.2% 64.8%
Grade 10 15.8% 21.5% 38.3% 61.7%
Grade 11 19.2% 23.8% 35.5% 64.5%
Grade 12 18.7% 27.7% 47.6% 52.4%
Cocaine?
All 2.6% 4.3% 7.6% 92.4%
Grade 7 1.6% 2.2% 4.0% 96.0%
Grade 8 1.5% 3.3% 4.5% 95.5%
Grade 9 2.6% 4.2% 5.8% 94.2%
Grade 10 2.0% 2.5% 5.9% 94.1%
Grade 11 5.2% 6.1% 8.5% 91.5%
Grade 12 3.0% 7.8% 18.1% 81.9%
Crack?
All 0.7% 0.9% 2.0% 98.0%
Grade 7 1.9% 2.5% 3.5% 96.5%
Grade 8 0.9% 1.2% 1.8% 98.2%
Grade 9 1.1% 1.1% 2.2% 97.8%
Grade 10 0.0% 0.0% 0.5% 99.5%
Grade 11 0.0% 0.0% 2.9% 97.1%
Grade 12 0.0% 0.0% 1.2% 98.8%
Hallucinogens?
All 1.8% 2.5% 5.1% 94.9%
Grade 7 1.6% 2.2% 2.8% 97.2%
Grade 8 0.9% 1.5% 3.0% 97.0%
Grade 9 2.6% 3.7% 4.7% 95.3%Grade 10 1.5% 1.5% 5.9% 94.1%
Grade 11 2.4% 3.4% 6.3% 93.7%
Grade 12 1.8% 3.0% 8.5% 91.5%
Uppers?
All 4.1% 5.9% 9.3% 90.7%
Grade 7 1.6% 3.2% 4.1% 95.9%
Grade 8 2.4% 3.0% 3.9% 96.1%
Grade 9 6.0% 8.7% 12.0% 88.0%
Grade 10 5.6% 6.6% 10.6% 89.4%
Grade 11 4.4% 5.8% 12.6% 87.4%
Grade 12 5.5% 9.1% 13.9% 86.1%
Downers?All 4.6% 6.4% 10.4% 89.6%
Grade 7 1.6% 2.9% 4.2% 95.8%
Grade 8 2.4% 3.0% 4.2% 95.8%
Grade 9 5.9% 8.1% 10.8% 89.2%
Grade 10 6.0% 7.5% 13.4% 86.6%
Grade 11 5.2% 6.7% 13.3% 86.7%
Grade 12 7.2% 11.4% 18.7% 81.3%
©Copyright 2010, Texas A&M University
All rights reserved.
Secondary Report-Page 23 of 127
8/7/2019 HIDALGO COUNTY - edcouch-elsa isd _ 2010 Texas School Survey of Drug and Alcohol Use
http://slidepdf.com/reader/full/hidalgo-county-edcouch-elsa-isd-2010-texas-school-survey-of-drug-and-alcohol 24/127
Edcouch-Elsa
SPRING 2010
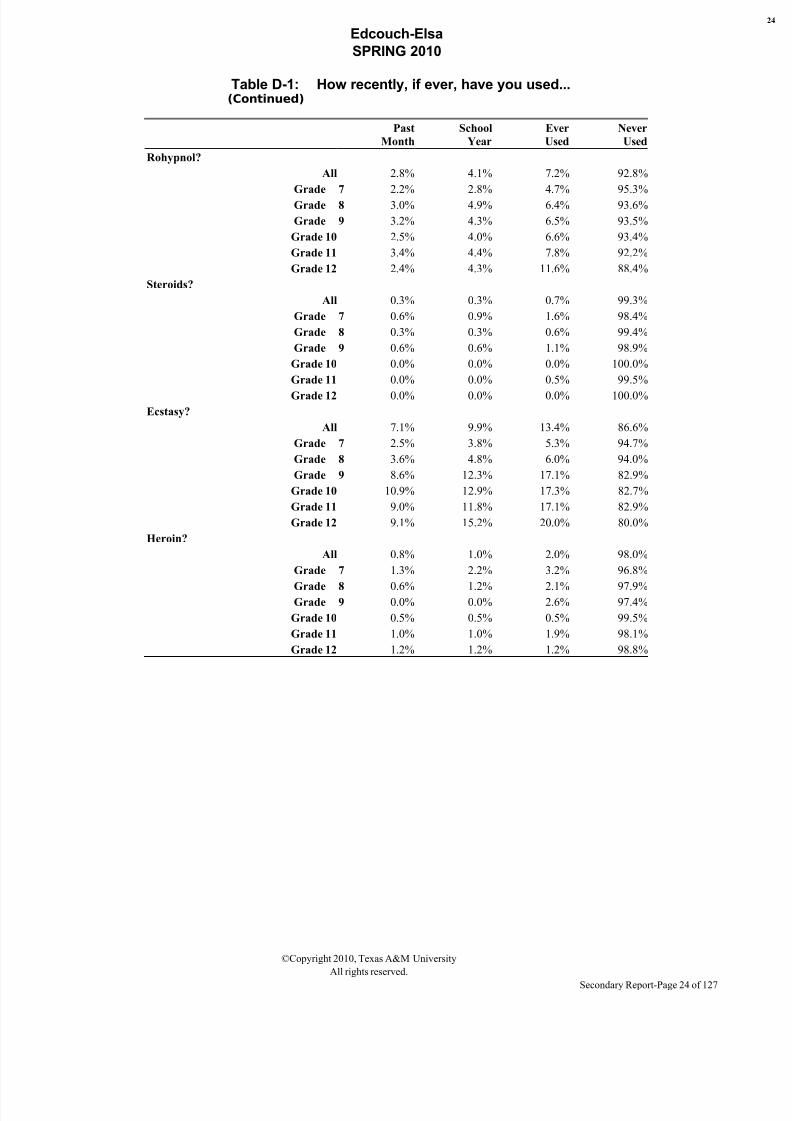
Table D-1: How recently, if ever, have you used...(Continued)
Past
Month
School
Year
Ever
Used
Never
Used
Rohypnol?
All 2.8% 4.1% 7.2% 92.8%
Grade 7 2.2% 2.8% 4.7% 95.3%
Grade 8 3.0% 4.9% 6.4% 93.6%
Grade 9 3.2% 4.3% 6.5% 93.5%
Grade 10 2.5% 4.0% 6.6% 93.4%
Grade 11 3.4% 4.4% 7.8% 92.2%
Grade 12 2.4% 4.3% 11.6% 88.4%
Steroids?
All 0.3% 0.3% 0.7% 99.3%
Grade 7 0.6% 0.9% 1.6% 98.4%
Grade 8 0.3% 0.3% 0.6% 99.4%
Grade 9 0.6% 0.6% 1.1% 98.9%
Grade 10 0.0% 0.0% 0.0% 100.0%
Grade 11 0.0% 0.0% 0.5% 99.5%
Grade 12 0.0% 0.0% 0.0% 100.0%
Ecstasy?
All 7.1% 9.9% 13.4% 86.6%
Grade 7 2.5% 3.8% 5.3% 94.7%
Grade 8 3.6% 4.8% 6.0% 94.0%
Grade 9 8.6% 12.3% 17.1% 82.9%
Grade 10 10.9% 12.9% 17.3% 82.7%
Grade 11 9.0% 11.8% 17.1% 82.9%
Grade 12 9.1% 15.2% 20.0% 80.0%
Heroin?
All 0.8% 1.0% 2.0% 98.0%
Grade 7 1.3% 2.2% 3.2% 96.8%
Grade 8 0.6% 1.2% 2.1% 97.9%Grade 9 0.0% 0.0% 2.6% 97.4%
Grade 10 0.5% 0.5% 0.5% 99.5%
Grade 11 1.0% 1.0% 1.9% 98.1%
Grade 12 1.2% 1.2% 1.2% 98.8%
©Copyright 2010, Texas A&M University
All rights reserved.
Secondary Report-Page 24 of 127
8/7/2019 HIDALGO COUNTY - edcouch-elsa isd _ 2010 Texas School Survey of Drug and Alcohol Use
http://slidepdf.com/reader/full/hidalgo-county-edcouch-elsa-isd-2010-texas-school-survey-of-drug-and-alcohol 25/127
Edcouch-Elsa
SPRING 2010
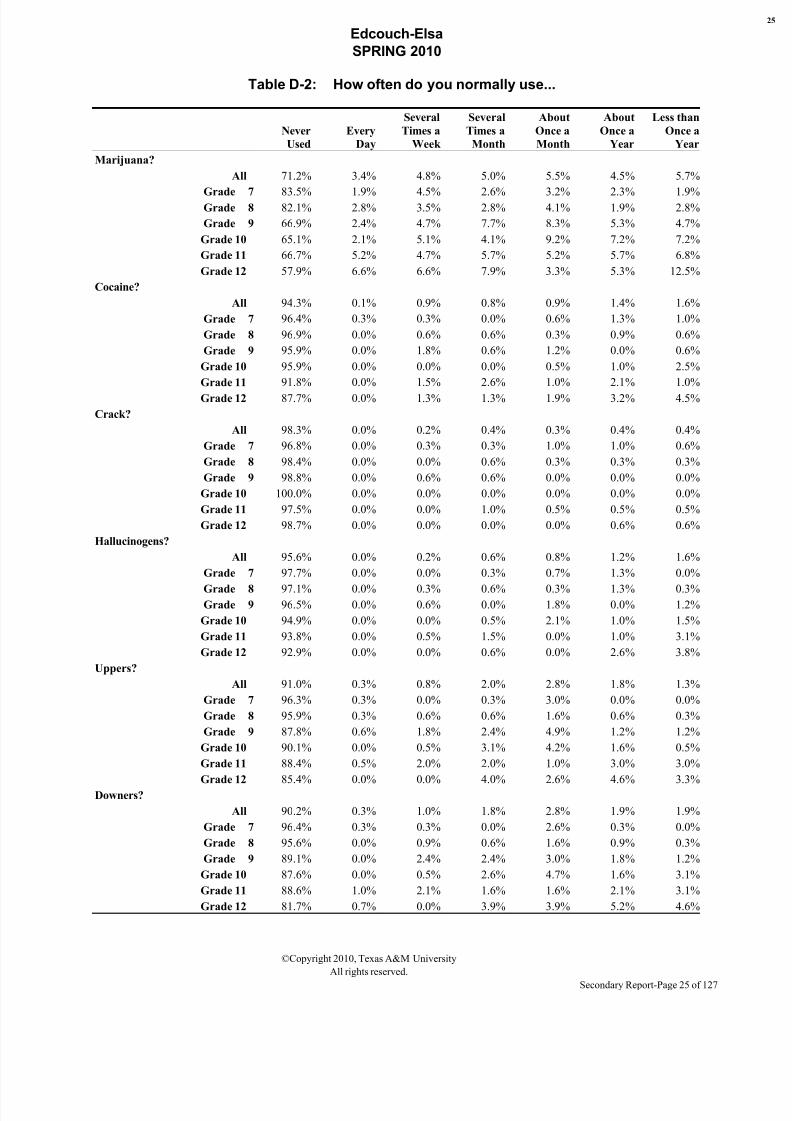
Table D-2: How often do you normally use...
Never
Used
Every
Day
Several
Times a
Week
Several
Times a
Month
About
Once a
Month
About
Once a
Year
Less than
Once a
Year
Marijuana?
All 71.2% 3.4% 4.8% 5.0% 5.5% 4.5% 5.7%
Grade 7 83.5% 1.9% 4.5% 2.6% 3.2% 2.3% 1.9%Grade 8 82.1% 2.8% 3.5% 2.8% 4.1% 1.9% 2.8%
Grade 9 66.9% 2.4% 4.7% 7.7% 8.3% 5.3% 4.7%
Grade 10 65.1% 2.1% 5.1% 4.1% 9.2% 7.2% 7.2%
Grade 11 66.7% 5.2% 4.7% 5.7% 5.2% 5.7% 6.8%
Grade 12 57.9% 6.6% 6.6% 7.9% 3.3% 5.3% 12.5%
Cocaine?
All 94.3% 0.1% 0.9% 0.8% 0.9% 1.4% 1.6%
Grade 7 96.4% 0.3% 0.3% 0.0% 0.6% 1.3% 1.0%
Grade 8 96.9% 0.0% 0.6% 0.6% 0.3% 0.9% 0.6%
Grade 9 95.9% 0.0% 1.8% 0.6% 1.2% 0.0% 0.6%
Grade 10 95.9% 0.0% 0.0% 0.0% 0.5% 1.0% 2.5%
Grade 11 91.8% 0.0% 1.5% 2.6% 1.0% 2.1% 1.0%
Grade 12 87.7% 0.0% 1.3% 1.3% 1.9% 3.2% 4.5%
Crack?
All 98.3% 0.0% 0.2% 0.4% 0.3% 0.4% 0.4%
Grade 7 96.8% 0.0% 0.3% 0.3% 1.0% 1.0% 0.6%
Grade 8 98.4% 0.0% 0.0% 0.6% 0.3% 0.3% 0.3%
Grade 9 98.8% 0.0% 0.6% 0.6% 0.0% 0.0% 0.0%
Grade 10 100.0% 0.0% 0.0% 0.0% 0.0% 0.0% 0.0%
Grade 11 97.5% 0.0% 0.0% 1.0% 0.5% 0.5% 0.5%
Grade 12 98.7% 0.0% 0.0% 0.0% 0.0% 0.6% 0.6%
Hallucinogens?
All 95.6% 0.0% 0.2% 0.6% 0.8% 1.2% 1.6%
Grade 7 97.7% 0.0% 0.0% 0.3% 0.7% 1.3% 0.0%
Grade 8 97.1% 0.0% 0.3% 0.6% 0.3% 1.3% 0.3%Grade 9 96.5% 0.0% 0.6% 0.0% 1.8% 0.0% 1.2%
Grade 10 94.9% 0.0% 0.0% 0.5% 2.1% 1.0% 1.5%
Grade 11 93.8% 0.0% 0.5% 1.5% 0.0% 1.0% 3.1%
Grade 12 92.9% 0.0% 0.0% 0.6% 0.0% 2.6% 3.8%
Uppers?
All 91.0% 0.3% 0.8% 2.0% 2.8% 1.8% 1.3%
Grade 7 96.3% 0.3% 0.0% 0.3% 3.0% 0.0% 0.0%
Grade 8 95.9% 0.3% 0.6% 0.6% 1.6% 0.6% 0.3%
Grade 9 87.8% 0.6% 1.8% 2.4% 4.9% 1.2% 1.2%
Grade 10 90.1% 0.0% 0.5% 3.1% 4.2% 1.6% 0.5%
Grade 11 88.4% 0.5% 2.0% 2.0% 1.0% 3.0% 3.0%
Grade 12 85.4% 0.0% 0.0% 4.0% 2.6% 4.6% 3.3%
Downers?
All 90.2% 0.3% 1.0% 1.8% 2.8% 1.9% 1.9%
Grade 7 96.4% 0.3% 0.3% 0.0% 2.6% 0.3% 0.0%
Grade 8 95.6% 0.0% 0.9% 0.6% 1.6% 0.9% 0.3%
Grade 9 89.1% 0.0% 2.4% 2.4% 3.0% 1.8% 1.2%
Grade 10 87.6% 0.0% 0.5% 2.6% 4.7% 1.6% 3.1%
Grade 11 88.6% 1.0% 2.1% 1.6% 1.6% 2.1% 3.1%
Grade 12 81.7% 0.7% 0.0% 3.9% 3.9% 5.2% 4.6%
©Copyright 2010, Texas A&M University
All rights reserved.
Secondary Report-Page 25 of 127
8/7/2019 HIDALGO COUNTY - edcouch-elsa isd _ 2010 Texas School Survey of Drug and Alcohol Use
http://slidepdf.com/reader/full/hidalgo-county-edcouch-elsa-isd-2010-texas-school-survey-of-drug-and-alcohol 26/127
Edcouch-Elsa
SPRING 2010
©Copyright 2010, Texas A&M University
All rights reserved.
Secondary Report-Page 26 of 127
8/7/2019 HIDALGO COUNTY - edcouch-elsa isd _ 2010 Texas School Survey of Drug and Alcohol Use
http://slidepdf.com/reader/full/hidalgo-county-edcouch-elsa-isd-2010-texas-school-survey-of-drug-and-alcohol 27/127
Edcouch-Elsa
SPRING 2010
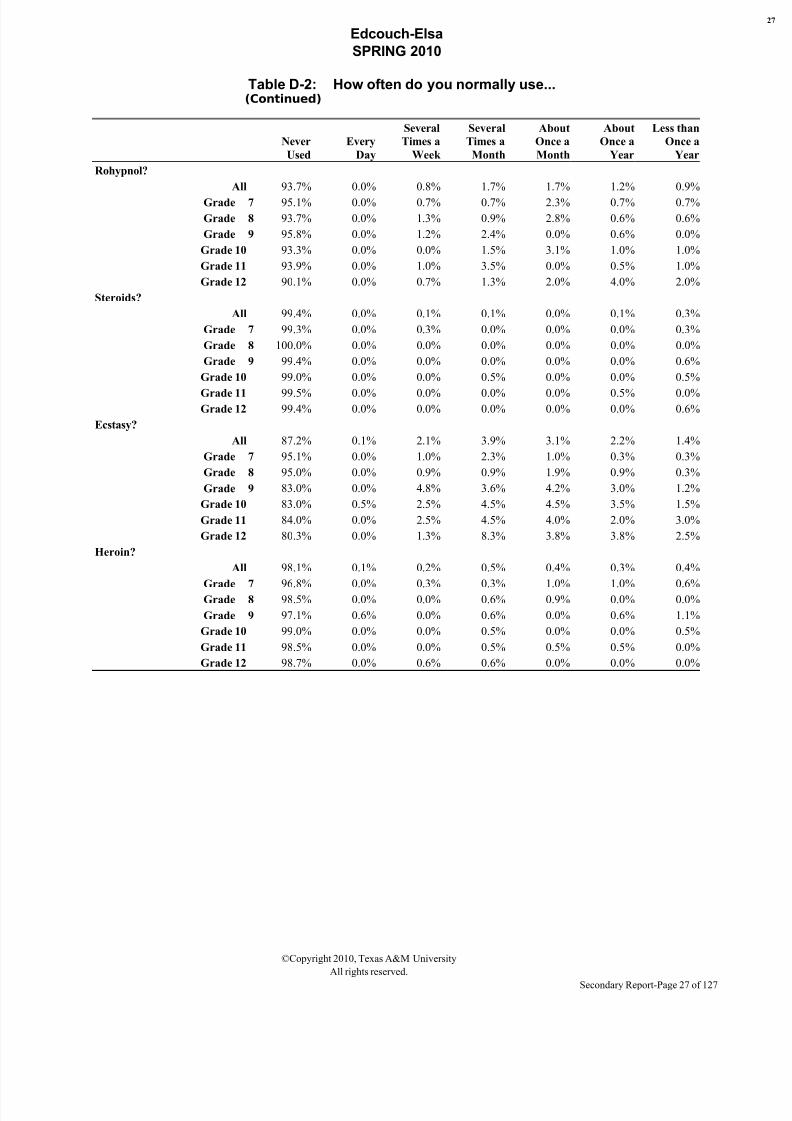
Table D-2: How often do you normally use...(Continued)
Never
Used
Every
Day
Several
Times a
Week
Several
Times a
Month
About
Once a
Month
About
Once a
Year
Less than
Once a
Year
Rohypnol?
All 93.7% 0.0% 0.8% 1.7% 1.7% 1.2% 0.9%
Grade 7 95.1% 0.0% 0.7% 0.7% 2.3% 0.7% 0.7%
Grade 8 93.7% 0.0% 1.3% 0.9% 2.8% 0.6% 0.6%
Grade 9 95.8% 0.0% 1.2% 2.4% 0.0% 0.6% 0.0%
Grade 10 93.3% 0.0% 0.0% 1.5% 3.1% 1.0% 1.0%
Grade 11 93.9% 0.0% 1.0% 3.5% 0.0% 0.5% 1.0%
Grade 12 90.1% 0.0% 0.7% 1.3% 2.0% 4.0% 2.0%
Steroids?
All 99.4% 0.0% 0.1% 0.1% 0.0% 0.1% 0.3%
Grade 7 99.3% 0.0% 0.3% 0.0% 0.0% 0.0% 0.3%
Grade 8 100.0% 0.0% 0.0% 0.0% 0.0% 0.0% 0.0%
Grade 9 99.4% 0.0% 0.0% 0.0% 0.0% 0.0% 0.6%
Grade 10 99.0% 0.0% 0.0% 0.5% 0.0% 0.0% 0.5%
Grade 11 99.5% 0.0% 0.0% 0.0% 0.0% 0.5% 0.0%Grade 12 99.4% 0.0% 0.0% 0.0% 0.0% 0.0% 0.6%
Ecstasy?
All 87.2% 0.1% 2.1% 3.9% 3.1% 2.2% 1.4%
Grade 7 95.1% 0.0% 1.0% 2.3% 1.0% 0.3% 0.3%
Grade 8 95.0% 0.0% 0.9% 0.9% 1.9% 0.9% 0.3%
Grade 9 83.0% 0.0% 4.8% 3.6% 4.2% 3.0% 1.2%
Grade 10 83.0% 0.5% 2.5% 4.5% 4.5% 3.5% 1.5%
Grade 11 84.0% 0.0% 2.5% 4.5% 4.0% 2.0% 3.0%
Grade 12 80.3% 0.0% 1.3% 8.3% 3.8% 3.8% 2.5%
Heroin?
All 98.1% 0.1% 0.2% 0.5% 0.4% 0.3% 0.4%
Grade 7 96.8% 0.0% 0.3% 0.3% 1.0% 1.0% 0.6%Grade 8 98.5% 0.0% 0.0% 0.6% 0.9% 0.0% 0.0%
Grade 9 97.1% 0.6% 0.0% 0.6% 0.0% 0.6% 1.1%
Grade 10 99.0% 0.0% 0.0% 0.5% 0.0% 0.0% 0.5%
Grade 11 98.5% 0.0% 0.0% 0.5% 0.5% 0.5% 0.0%
Grade 12 98.7% 0.0% 0.6% 0.6% 0.0% 0.0% 0.0%
©Copyright 2010, Texas A&M University
All rights reserved.
Secondary Report-Page 27 of 127
8/7/2019 HIDALGO COUNTY - edcouch-elsa isd _ 2010 Texas School Survey of Drug and Alcohol Use
http://slidepdf.com/reader/full/hidalgo-county-edcouch-elsa-isd-2010-texas-school-survey-of-drug-and-alcohol 28/127
Edcouch-Elsa
SPRING 2010
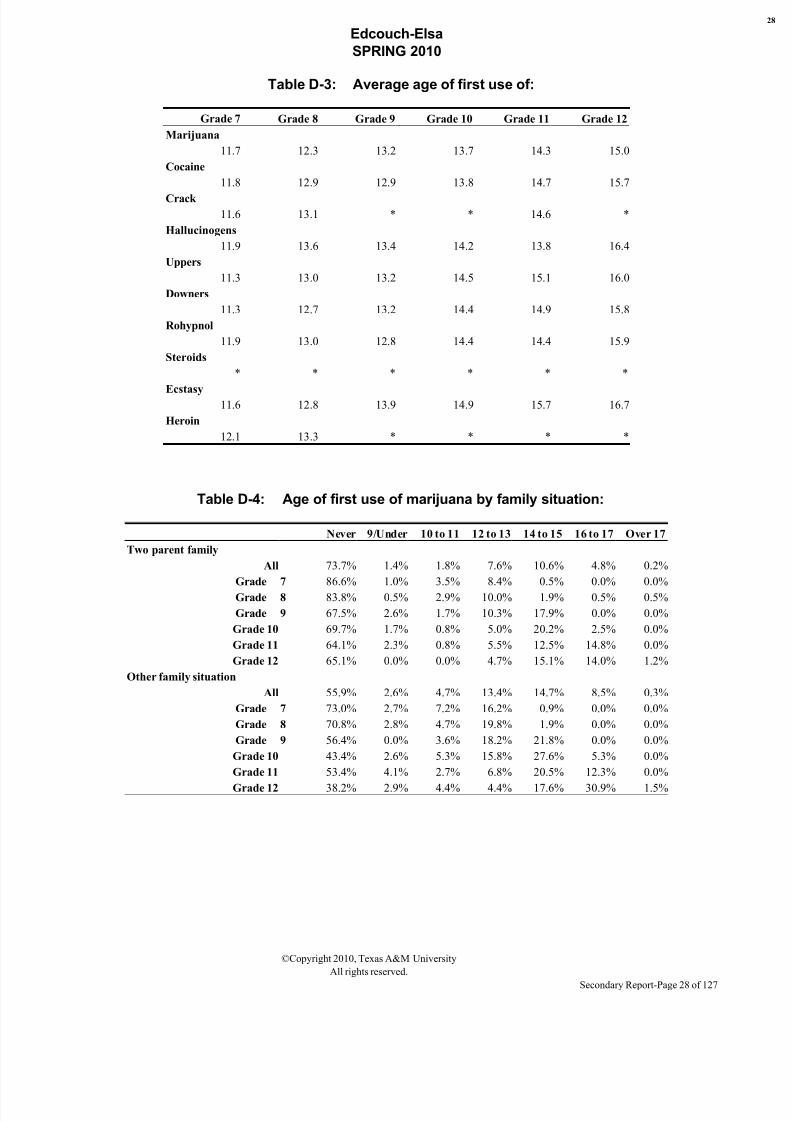
Table D-3: Average age of first use of:
Grade 7 Grade 8 Grade 9 Grade 10 Grade 11 Grade 12
Marijuana
11.7 12.3 13.2 13.7 14.3 15.0
Cocaine
11.8 12.9 12.9 13.8 14.7 15.7
Crack
11.6 13.1 * * 14.6 *
Hallucinogens
11.9 13.6 13.4 14.2 13.8 16.4
Uppers
11.3 13.0 13.2 14.5 15.1 16.0
Downers
11.3 12.7 13.2 14.4 14.9 15.8
Rohypnol
11.9 13.0 12.8 14.4 14.4 15.9
Steroids
* * * * * *
Ecstasy11.6 12.8 13.9 14.9 15.7 16.7
Heroin
12.1 13.3 * * * *
Table D-4: Age of first use of marijuana by family situation:
Never 9/Under 10 to 11 12 to 13 14 to 15 16 to 17 Over 17
Two parent family
All 73.7% 1.4% 1.8% 7.6% 10.6% 4.8% 0.2%
Grade 7 86.6% 1.0% 3.5% 8.4% 0.5% 0.0% 0.0%
Grade 8 83.8% 0.5% 2.9% 10.0% 1.9% 0.5% 0.5%
Grade 9 67.5% 2.6% 1.7% 10.3% 17.9% 0.0% 0.0%
Grade 10 69.7% 1.7% 0.8% 5.0% 20.2% 2.5% 0.0%
Grade 11 64.1% 2.3% 0.8% 5.5% 12.5% 14.8% 0.0%
Grade 12 65.1% 0.0% 0.0% 4.7% 15.1% 14.0% 1.2%
Other family situation
All 55.9% 2.6% 4.7% 13.4% 14.7% 8.5% 0.3%
Grade 7 73.0% 2.7% 7.2% 16.2% 0.9% 0.0% 0.0%
Grade 8 70.8% 2.8% 4.7% 19.8% 1.9% 0.0% 0.0%
Grade 9 56.4% 0.0% 3.6% 18.2% 21.8% 0.0% 0.0%
Grade 10 43.4% 2.6% 5.3% 15.8% 27.6% 5.3% 0.0%
Grade 11 53.4% 4.1% 2.7% 6.8% 20.5% 12.3% 0.0%
Grade 12 38.2% 2.9% 4.4% 4.4% 17.6% 30.9% 1.5%
©Copyright 2010, Texas A&M University
All rights reserved.
Secondary Report-Page 28 of 127
8/7/2019 HIDALGO COUNTY - edcouch-elsa isd _ 2010 Texas School Survey of Drug and Alcohol Use
http://slidepdf.com/reader/full/hidalgo-county-edcouch-elsa-isd-2010-texas-school-survey-of-drug-and-alcohol 29/127
Edcouch-Elsa
SPRING 2010
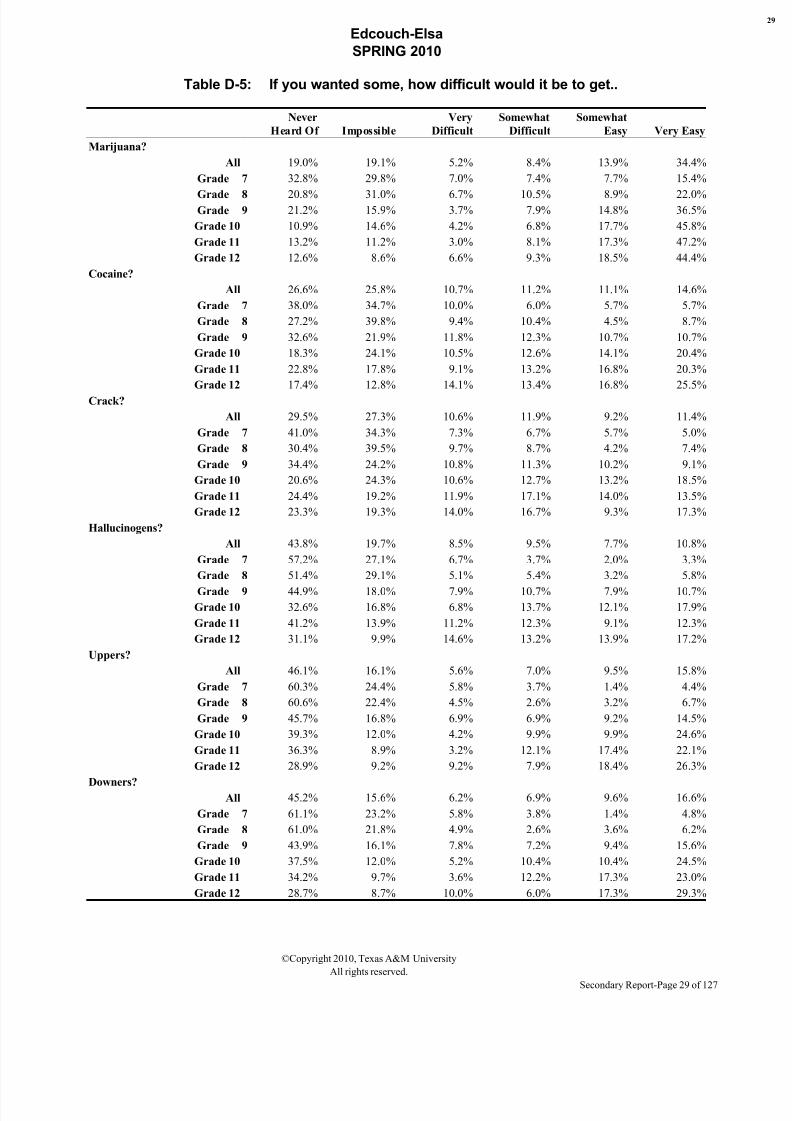
Table D-5: If you wanted some, how difficult would it be to get..
Never
Heard Of Impossible
Very
Difficult
Somewhat
Difficult
Somewhat
Easy Very Easy
Marijuana?
All 19.0% 19.1% 5.2% 8.4% 13.9% 34.4%
Grade 7 32.8% 29.8% 7.0% 7.4% 7.7% 15.4%
Grade 8 20.8% 31.0% 6.7% 10.5% 8.9% 22.0%Grade 9 21.2% 15.9% 3.7% 7.9% 14.8% 36.5%
Grade 10 10.9% 14.6% 4.2% 6.8% 17.7% 45.8%
Grade 11 13.2% 11.2% 3.0% 8.1% 17.3% 47.2%
Grade 12 12.6% 8.6% 6.6% 9.3% 18.5% 44.4%
Cocaine?
All 26.6% 25.8% 10.7% 11.2% 11.1% 14.6%
Grade 7 38.0% 34.7% 10.0% 6.0% 5.7% 5.7%
Grade 8 27.2% 39.8% 9.4% 10.4% 4.5% 8.7%
Grade 9 32.6% 21.9% 11.8% 12.3% 10.7% 10.7%
Grade 10 18.3% 24.1% 10.5% 12.6% 14.1% 20.4%
Grade 11 22.8% 17.8% 9.1% 13.2% 16.8% 20.3%
Grade 12 17.4% 12.8% 14.1% 13.4% 16.8% 25.5%
Crack?
All 29.5% 27.3% 10.6% 11.9% 9.2% 11.4%
Grade 7 41.0% 34.3% 7.3% 6.7% 5.7% 5.0%
Grade 8 30.4% 39.5% 9.7% 8.7% 4.2% 7.4%
Grade 9 34.4% 24.2% 10.8% 11.3% 10.2% 9.1%
Grade 10 20.6% 24.3% 10.6% 12.7% 13.2% 18.5%
Grade 11 24.4% 19.2% 11.9% 17.1% 14.0% 13.5%
Grade 12 23.3% 19.3% 14.0% 16.7% 9.3% 17.3%
Hallucinogens?
All 43.8% 19.7% 8.5% 9.5% 7.7% 10.8%
Grade 7 57.2% 27.1% 6.7% 3.7% 2.0% 3.3%
Grade 8 51.4% 29.1% 5.1% 5.4% 3.2% 5.8%
Grade 9 44.9% 18.0% 7.9% 10.7% 7.9% 10.7%Grade 10 32.6% 16.8% 6.8% 13.7% 12.1% 17.9%
Grade 11 41.2% 13.9% 11.2% 12.3% 9.1% 12.3%
Grade 12 31.1% 9.9% 14.6% 13.2% 13.9% 17.2%
Uppers?
All 46.1% 16.1% 5.6% 7.0% 9.5% 15.8%
Grade 7 60.3% 24.4% 5.8% 3.7% 1.4% 4.4%
Grade 8 60.6% 22.4% 4.5% 2.6% 3.2% 6.7%
Grade 9 45.7% 16.8% 6.9% 6.9% 9.2% 14.5%
Grade 10 39.3% 12.0% 4.2% 9.9% 9.9% 24.6%
Grade 11 36.3% 8.9% 3.2% 12.1% 17.4% 22.1%
Grade 12 28.9% 9.2% 9.2% 7.9% 18.4% 26.3%
Downers?All 45.2% 15.6% 6.2% 6.9% 9.6% 16.6%
Grade 7 61.1% 23.2% 5.8% 3.8% 1.4% 4.8%
Grade 8 61.0% 21.8% 4.9% 2.6% 3.6% 6.2%
Grade 9 43.9% 16.1% 7.8% 7.2% 9.4% 15.6%
Grade 10 37.5% 12.0% 5.2% 10.4% 10.4% 24.5%
Grade 11 34.2% 9.7% 3.6% 12.2% 17.3% 23.0%
Grade 12 28.7% 8.7% 10.0% 6.0% 17.3% 29.3%
©Copyright 2010, Texas A&M University
All rights reserved.
Secondary Report-Page 29 of 127
8/7/2019 HIDALGO COUNTY - edcouch-elsa isd _ 2010 Texas School Survey of Drug and Alcohol Use
http://slidepdf.com/reader/full/hidalgo-county-edcouch-elsa-isd-2010-texas-school-survey-of-drug-and-alcohol 30/127
Edcouch-Elsa
SPRING 2010
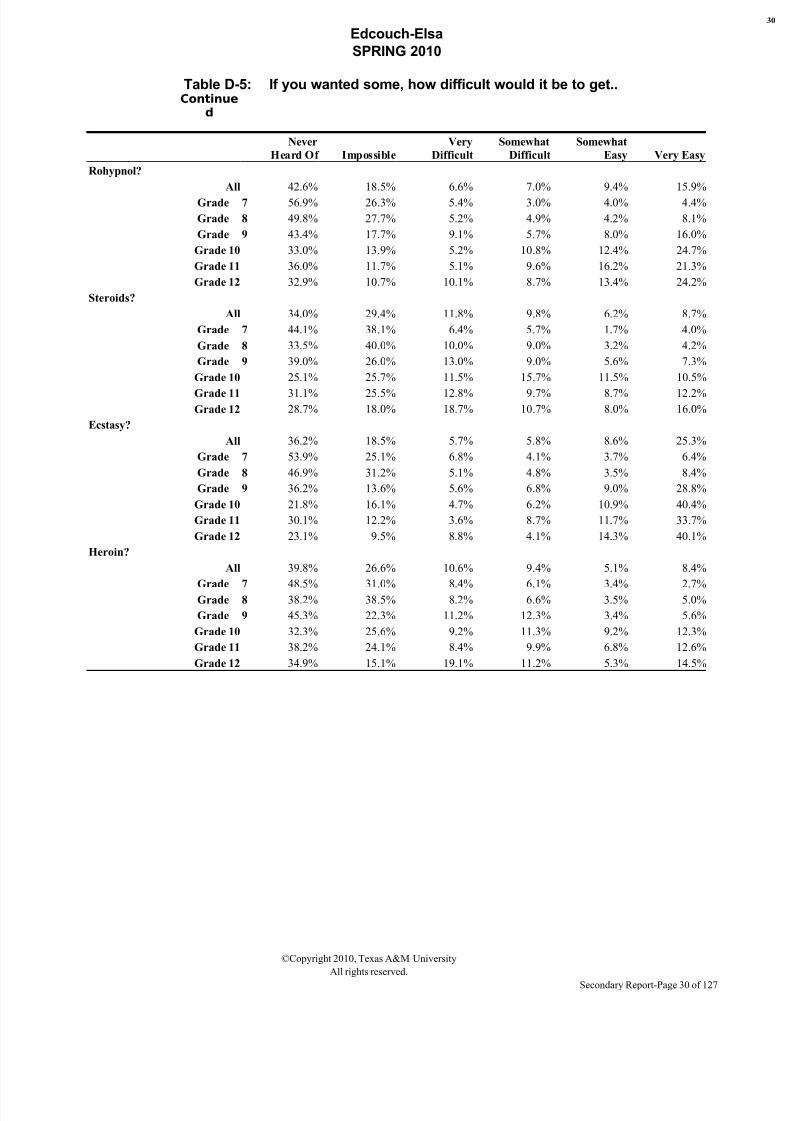
Table D-5: If you wanted some, how difficult would it be to get..Continue
d
Never
Heard Of Impossible
Very
Difficult
Somewhat
Difficult
Somewhat
Easy Very Easy
Rohypnol?
All 42.6% 18.5% 6.6% 7.0% 9.4% 15.9%
Grade 7 56.9% 26.3% 5.4% 3.0% 4.0% 4.4%
Grade 8 49.8% 27.7% 5.2% 4.9% 4.2% 8.1%
Grade 9 43.4% 17.7% 9.1% 5.7% 8.0% 16.0%
Grade 10 33.0% 13.9% 5.2% 10.8% 12.4% 24.7%
Grade 11 36.0% 11.7% 5.1% 9.6% 16.2% 21.3%
Grade 12 32.9% 10.7% 10.1% 8.7% 13.4% 24.2%
Steroids?
All 34.0% 29.4% 11.8% 9.8% 6.2% 8.7%
Grade 7 44.1% 38.1% 6.4% 5.7% 1.7% 4.0%
Grade 8 33.5% 40.0% 10.0% 9.0% 3.2% 4.2%
Grade 9 39.0% 26.0% 13.0% 9.0% 5.6% 7.3%
Grade 10 25.1% 25.7% 11.5% 15.7% 11.5% 10.5%
Grade 11 31.1% 25.5% 12.8% 9.7% 8.7% 12.2%Grade 12 28.7% 18.0% 18.7% 10.7% 8.0% 16.0%
Ecstasy?
All 36.2% 18.5% 5.7% 5.8% 8.6% 25.3%
Grade 7 53.9% 25.1% 6.8% 4.1% 3.7% 6.4%
Grade 8 46.9% 31.2% 5.1% 4.8% 3.5% 8.4%
Grade 9 36.2% 13.6% 5.6% 6.8% 9.0% 28.8%
Grade 10 21.8% 16.1% 4.7% 6.2% 10.9% 40.4%
Grade 11 30.1% 12.2% 3.6% 8.7% 11.7% 33.7%
Grade 12 23.1% 9.5% 8.8% 4.1% 14.3% 40.1%
Heroin?
All 39.8% 26.6% 10.6% 9.4% 5.1% 8.4%
Grade 7 48.5% 31.0% 8.4% 6.1% 3.4% 2.7%Grade 8 38.2% 38.5% 8.2% 6.6% 3.5% 5.0%
Grade 9 45.3% 22.3% 11.2% 12.3% 3.4% 5.6%
Grade 10 32.3% 25.6% 9.2% 11.3% 9.2% 12.3%
Grade 11 38.2% 24.1% 8.4% 9.9% 6.8% 12.6%
Grade 12 34.9% 15.1% 19.1% 11.2% 5.3% 14.5%
©Copyright 2010, Texas A&M University
All rights reserved.
Secondary Report-Page 30 of 127
8/7/2019 HIDALGO COUNTY - edcouch-elsa isd _ 2010 Texas School Survey of Drug and Alcohol Use
http://slidepdf.com/reader/full/hidalgo-county-edcouch-elsa-isd-2010-texas-school-survey-of-drug-and-alcohol 31/127
Edcouch-Elsa
SPRING 2010
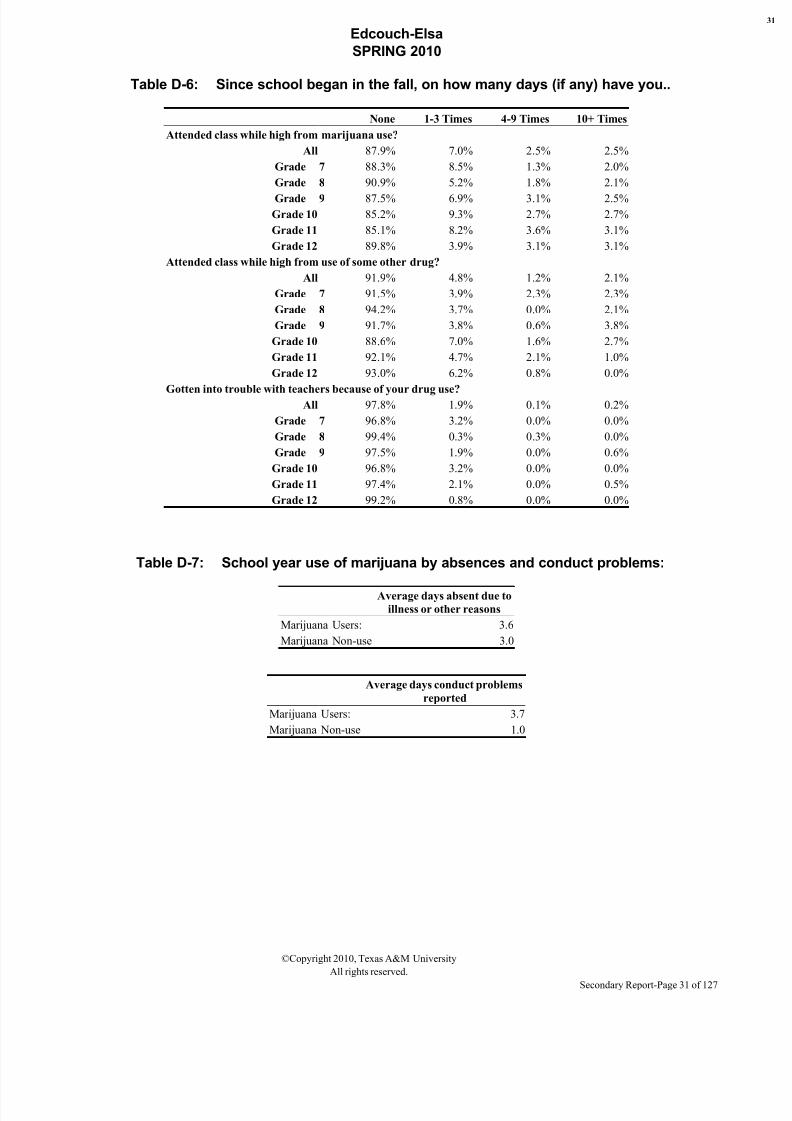
Table D-6: Since school began in the fall, on how many days (if any) have you..
None 1-3 Times 4-9 Times 10+ Times
Attended class while high from marijuana use?
All 87.9% 7.0% 2.5% 2.5%
Grade 7 88.3% 8.5% 1.3% 2.0%
Grade 8 90.9% 5.2% 1.8% 2.1%
Grade 9 87.5% 6.9% 3.1% 2.5%
Grade 10 85.2% 9.3% 2.7% 2.7%
Grade 11 85.1% 8.2% 3.6% 3.1%
Grade 12 89.8% 3.9% 3.1% 3.1%
Attended class while high from use of some other drug?
All 91.9% 4.8% 1.2% 2.1%
Grade 7 91.5% 3.9% 2.3% 2.3%
Grade 8 94.2% 3.7% 0.0% 2.1%
Grade 9 91.7% 3.8% 0.6% 3.8%
Grade 10 88.6% 7.0% 1.6% 2.7%
Grade 11 92.1% 4.7% 2.1% 1.0%
Grade 12 93.0% 6.2% 0.8% 0.0%
Gotten into trouble with teachers because of your drug use?All 97.8% 1.9% 0.1% 0.2%
Grade 7 96.8% 3.2% 0.0% 0.0%
Grade 8 99.4% 0.3% 0.3% 0.0%
Grade 9 97.5% 1.9% 0.0% 0.6%
Grade 10 96.8% 3.2% 0.0% 0.0%
Grade 11 97.4% 2.1% 0.0% 0.5%
Grade 12 99.2% 0.8% 0.0% 0.0%
Table D-7: School year use of marijuana by absences and conduct problems:
Average days absent due to
illness or other reasons
Marijuana Users: 3.6
Marijuana Non-use 3.0
Average days conduct problems
reported
Marijuana Users: 3.7
Marijuana Non-use 1.0
©Copyright 2010, Texas A&M University
All rights reserved.
Secondary Report-Page 31 of 127
8/7/2019 HIDALGO COUNTY - edcouch-elsa isd _ 2010 Texas School Survey of Drug and Alcohol Use
http://slidepdf.com/reader/full/hidalgo-county-edcouch-elsa-isd-2010-texas-school-survey-of-drug-and-alcohol 32/127
Edcouch-Elsa
SPRING 2010
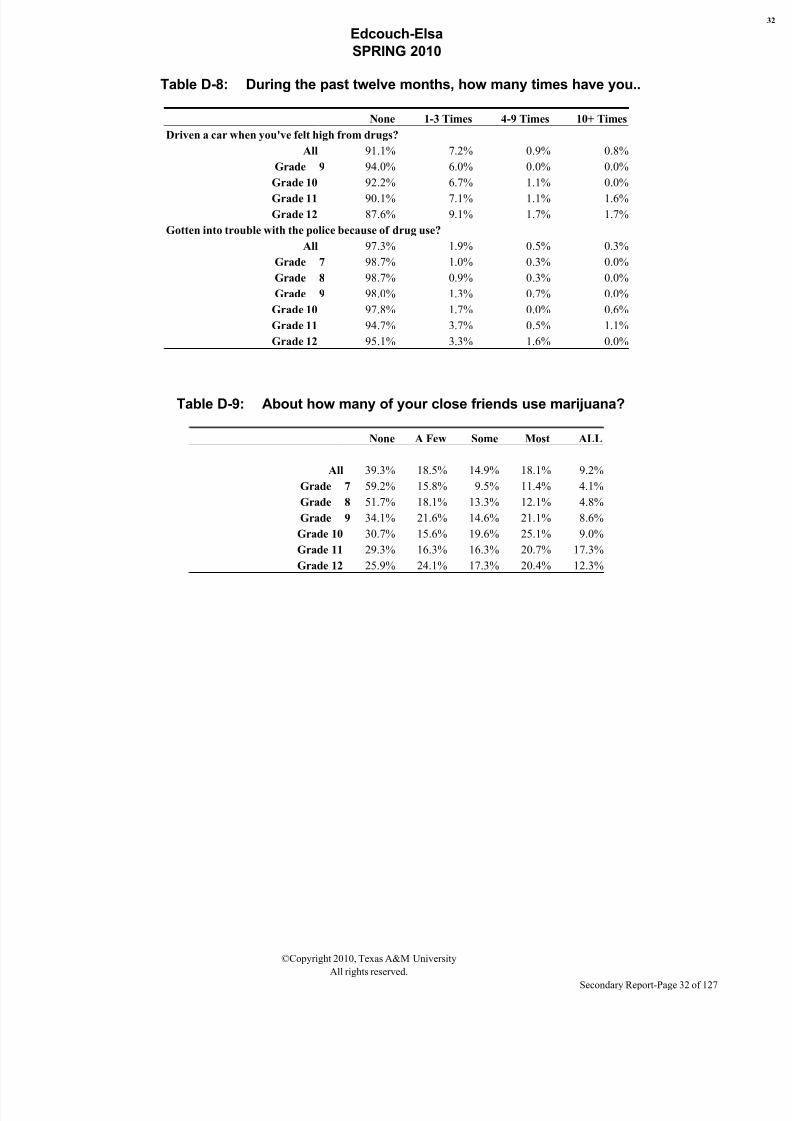
Table D-8: During the past twelve months, how many times have you..
None 1-3 Times 4-9 Times 10+ Times
Driven a car when you've felt high from drugs?
All 91.1% 7.2% 0.9% 0.8%
Grade 9 94.0% 6.0% 0.0% 0.0%
Grade 10 92.2% 6.7% 1.1% 0.0%
Grade 11 90.1% 7.1% 1.1% 1.6%
Grade 12 87.6% 9.1% 1.7% 1.7%
Gotten into trouble with the police because of drug use?
All 97.3% 1.9% 0.5% 0.3%
Grade 7 98.7% 1.0% 0.3% 0.0%
Grade 8 98.7% 0.9% 0.3% 0.0%
Grade 9 98.0% 1.3% 0.7% 0.0%
Grade 10 97.8% 1.7% 0.0% 0.6%
Grade 11 94.7% 3.7% 0.5% 1.1%
Grade 12 95.1% 3.3% 1.6% 0.0%
Table D-9: About how many of your close friends use marijuana?
None A Few Some Most ALL
All 39.3% 18.5% 14.9% 18.1% 9.2%
Grade 7 59.2% 15.8% 9.5% 11.4% 4.1%
Grade 8 51.7% 18.1% 13.3% 12.1% 4.8%
Grade 9 34.1% 21.6% 14.6% 21.1% 8.6%
Grade 10 30.7% 15.6% 19.6% 25.1% 9.0%
Grade 11 29.3% 16.3% 16.3% 20.7% 17.3%
Grade 12 25.9% 24.1% 17.3% 20.4% 12.3%
©Copyright 2010, Texas A&M University
All rights reserved.
Secondary Report-Page 32 of 127
8/7/2019 HIDALGO COUNTY - edcouch-elsa isd _ 2010 Texas School Survey of Drug and Alcohol Use
http://slidepdf.com/reader/full/hidalgo-county-edcouch-elsa-isd-2010-texas-school-survey-of-drug-and-alcohol 33/127
Edcouch-Elsa
SPRING 2010
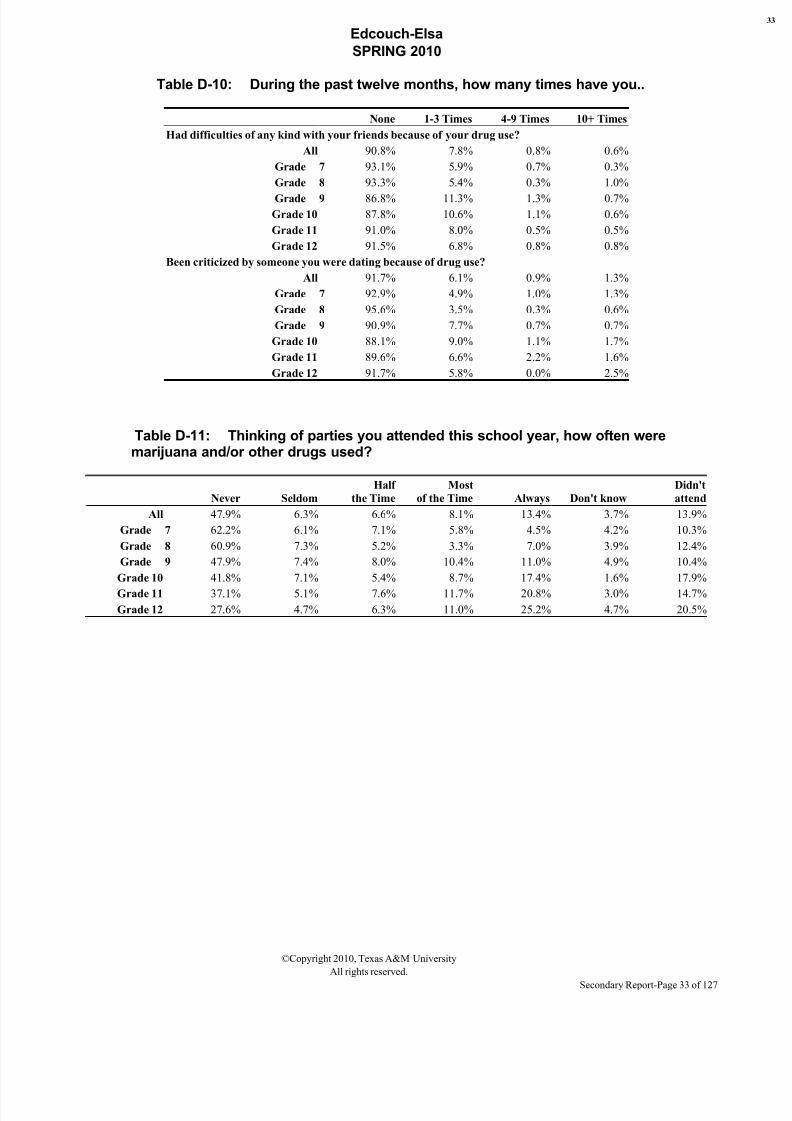
Table D-10: During the past twelve months, how many times have you..
None 1-3 Times 4-9 Times 10+ Times
Had difficulties of any kind with your friends because of your drug use?
All 90.8% 7.8% 0.8% 0.6%
Grade 7 93.1% 5.9% 0.7% 0.3%
Grade 8 93.3% 5.4% 0.3% 1.0%
Grade 9 86.8% 11.3% 1.3% 0.7%
Grade 10 87.8% 10.6% 1.1% 0.6%
Grade 11 91.0% 8.0% 0.5% 0.5%
Grade 12 91.5% 6.8% 0.8% 0.8%
Been criticized by someone you were dating because of drug use?
All 91.7% 6.1% 0.9% 1.3%
Grade 7 92.9% 4.9% 1.0% 1.3%
Grade 8 95.6% 3.5% 0.3% 0.6%
Grade 9 90.9% 7.7% 0.7% 0.7%
Grade 10 88.1% 9.0% 1.1% 1.7%
Grade 11 89.6% 6.6% 2.2% 1.6%
Grade 12 91.7% 5.8% 0.0% 2.5%
Table D-11: Thinking of parties you attended this school year, how often weremarijuana and/or other drugs used?
Never Seldom
Half
the Time
Most
of the Time Always Don't know
Didn't
attend
All 47.9% 6.3% 6.6% 8.1% 13.4% 3.7% 13.9%
Grade 7 62.2% 6.1% 7.1% 5.8% 4.5% 4.2% 10.3%
Grade 8 60.9% 7.3% 5.2% 3.3% 7.0% 3.9% 12.4%
Grade 9 47.9% 7.4% 8.0% 10.4% 11.0% 4.9% 10.4%
Grade 10 41.8% 7.1% 5.4% 8.7% 17.4% 1.6% 17.9%
Grade 11 37.1% 5.1% 7.6% 11.7% 20.8% 3.0% 14.7%
Grade 12 27.6% 4.7% 6.3% 11.0% 25.2% 4.7% 20.5%
©Copyright 2010, Texas A&M University
All rights reserved.
Secondary Report-Page 33 of 127
8/7/2019 HIDALGO COUNTY - edcouch-elsa isd _ 2010 Texas School Survey of Drug and Alcohol Use
http://slidepdf.com/reader/full/hidalgo-county-edcouch-elsa-isd-2010-texas-school-survey-of-drug-and-alcohol 34/127
Edcouch-Elsa
SPRING 2010
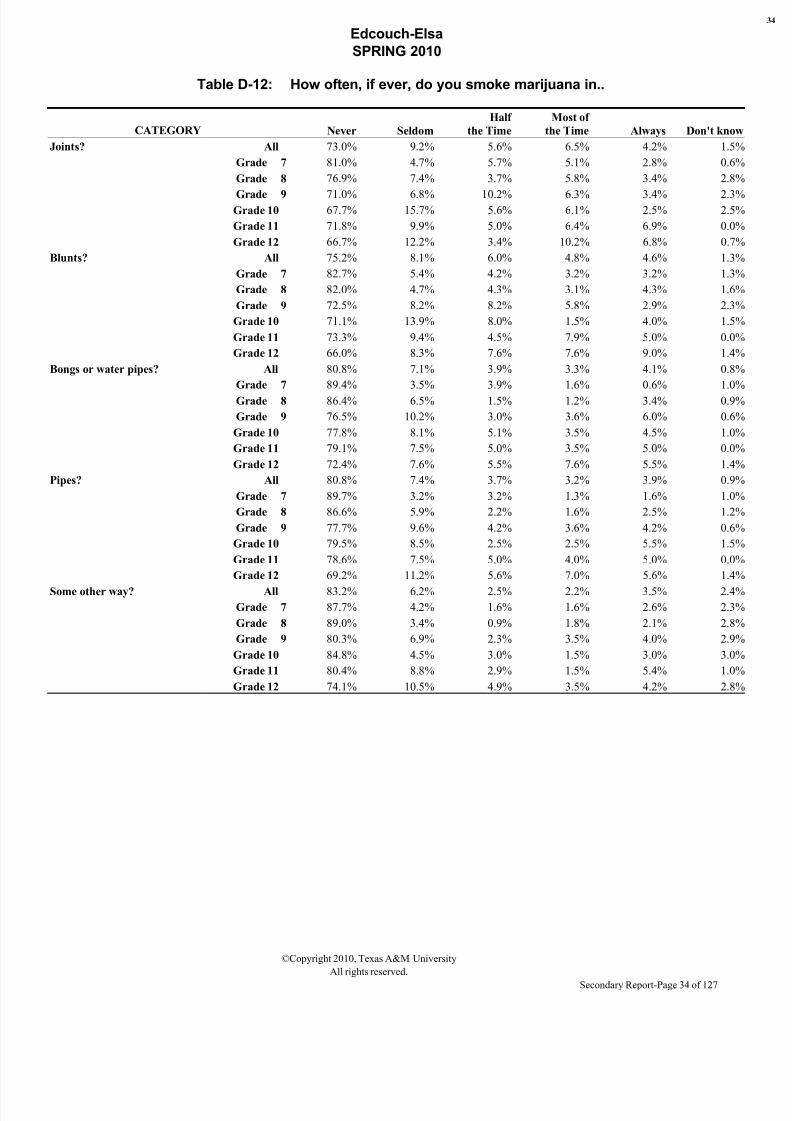
Table D-12: How often, if ever, do you smoke marijuana in..
CATEGORY Never Seldom
Half
the Time
Most of
the Time Always Don't know
Joints? All 73.0% 9.2% 5.6% 6.5% 4.2% 1.5%
Grade 7 81.0% 4.7% 5.7% 5.1% 2.8% 0.6%
Grade 8 76.9% 7.4% 3.7% 5.8% 3.4% 2.8%
Grade 9 71.0% 6.8% 10.2% 6.3% 3.4% 2.3%Grade 10 67.7% 15.7% 5.6% 6.1% 2.5% 2.5%
Grade 11 71.8% 9.9% 5.0% 6.4% 6.9% 0.0%
Grade 12 66.7% 12.2% 3.4% 10.2% 6.8% 0.7%
Blunts? All 75.2% 8.1% 6.0% 4.8% 4.6% 1.3%
Grade 7 82.7% 5.4% 4.2% 3.2% 3.2% 1.3%
Grade 8 82.0% 4.7% 4.3% 3.1% 4.3% 1.6%
Grade 9 72.5% 8.2% 8.2% 5.8% 2.9% 2.3%
Grade 10 71.1% 13.9% 8.0% 1.5% 4.0% 1.5%
Grade 11 73.3% 9.4% 4.5% 7.9% 5.0% 0.0%
Grade 12 66.0% 8.3% 7.6% 7.6% 9.0% 1.4%
Bongs or water pipes? All 80.8% 7.1% 3.9% 3.3% 4.1% 0.8%
Grade 7 89.4% 3.5% 3.9% 1.6% 0.6% 1.0%
Grade 8 86.4% 6.5% 1.5% 1.2% 3.4% 0.9%
Grade 9 76.5% 10.2% 3.0% 3.6% 6.0% 0.6%
Grade 10 77.8% 8.1% 5.1% 3.5% 4.5% 1.0%
Grade 11 79.1% 7.5% 5.0% 3.5% 5.0% 0.0%
Grade 12 72.4% 7.6% 5.5% 7.6% 5.5% 1.4%
Pipes? All 80.8% 7.4% 3.7% 3.2% 3.9% 0.9%
Grade 7 89.7% 3.2% 3.2% 1.3% 1.6% 1.0%
Grade 8 86.6% 5.9% 2.2% 1.6% 2.5% 1.2%
Grade 9 77.7% 9.6% 4.2% 3.6% 4.2% 0.6%
Grade 10 79.5% 8.5% 2.5% 2.5% 5.5% 1.5%
Grade 11 78.6% 7.5% 5.0% 4.0% 5.0% 0.0%
Grade 12 69.2% 11.2% 5.6% 7.0% 5.6% 1.4%
Some other way? All 83.2% 6.2% 2.5% 2.2% 3.5% 2.4%Grade 7 87.7% 4.2% 1.6% 1.6% 2.6% 2.3%
Grade 8 89.0% 3.4% 0.9% 1.8% 2.1% 2.8%
Grade 9 80.3% 6.9% 2.3% 3.5% 4.0% 2.9%
Grade 10 84.8% 4.5% 3.0% 1.5% 3.0% 3.0%
Grade 11 80.4% 8.8% 2.9% 1.5% 5.4% 1.0%
Grade 12 74.1% 10.5% 4.9% 3.5% 4.2% 2.8%
©Copyright 2010, Texas A&M University
All rights reserved.
Secondary Report-Page 34 of 127
8/7/2019 HIDALGO COUNTY - edcouch-elsa isd _ 2010 Texas School Survey of Drug and Alcohol Use
http://slidepdf.com/reader/full/hidalgo-county-edcouch-elsa-isd-2010-texas-school-survey-of-drug-and-alcohol 35/127
Edcouch-Elsa
SPRING 2010
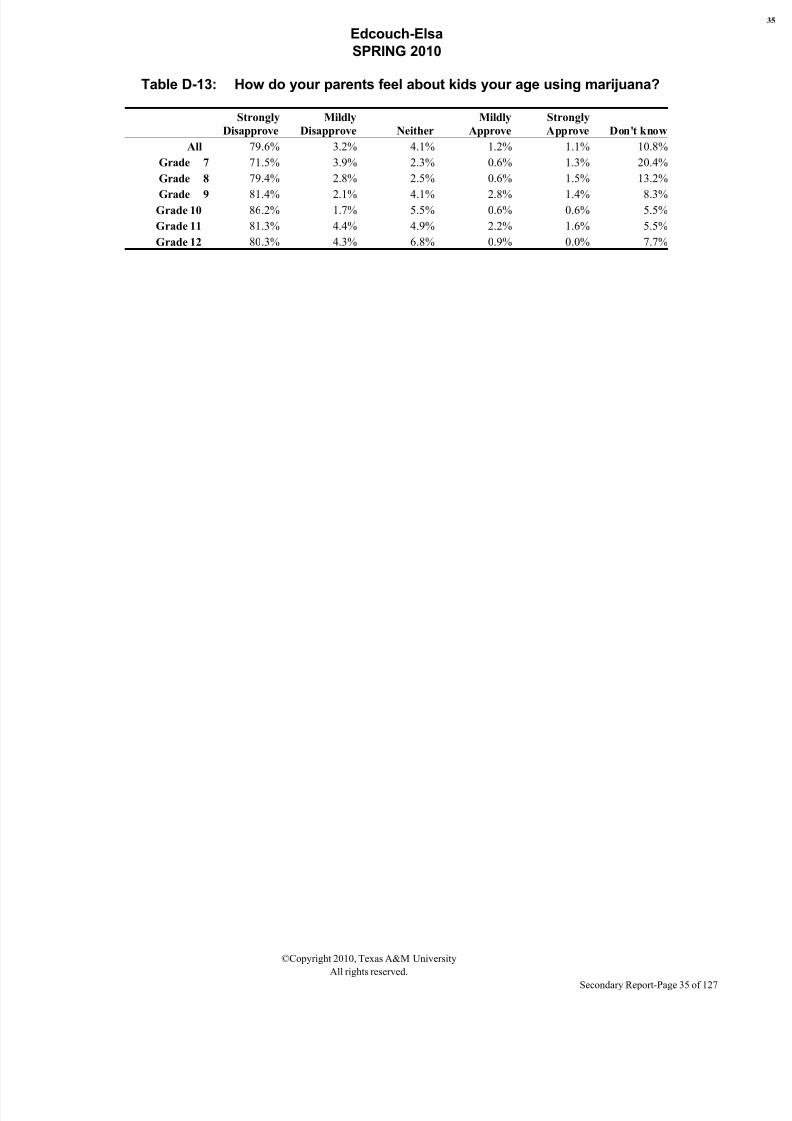
Table D-13: How do your parents feel about kids your age using marijuana?
Strongly
Disapprove
Mildly
Disapprove Neither
Mildly
Approve
Strongly
Approve Don't know
All 79.6% 3.2% 4.1% 1.2% 1.1% 10.8%
Grade 7 71.5% 3.9% 2.3% 0.6% 1.3% 20.4%
Grade 8 79.4% 2.8% 2.5% 0.6% 1.5% 13.2%
Grade 9 81.4% 2.1% 4.1% 2.8% 1.4% 8.3%Grade 10 86.2% 1.7% 5.5% 0.6% 0.6% 5.5%
Grade 11 81.3% 4.4% 4.9% 2.2% 1.6% 5.5%
Grade 12 80.3% 4.3% 6.8% 0.9% 0.0% 7.7%
©Copyright 2010, Texas A&M University
All rights reserved.
Secondary Report-Page 35 of 127
8/7/2019 HIDALGO COUNTY - edcouch-elsa isd _ 2010 Texas School Survey of Drug and Alcohol Use
http://slidepdf.com/reader/full/hidalgo-county-edcouch-elsa-isd-2010-texas-school-survey-of-drug-and-alcohol 36/127
Edcouch-Elsa
SPRING 2010
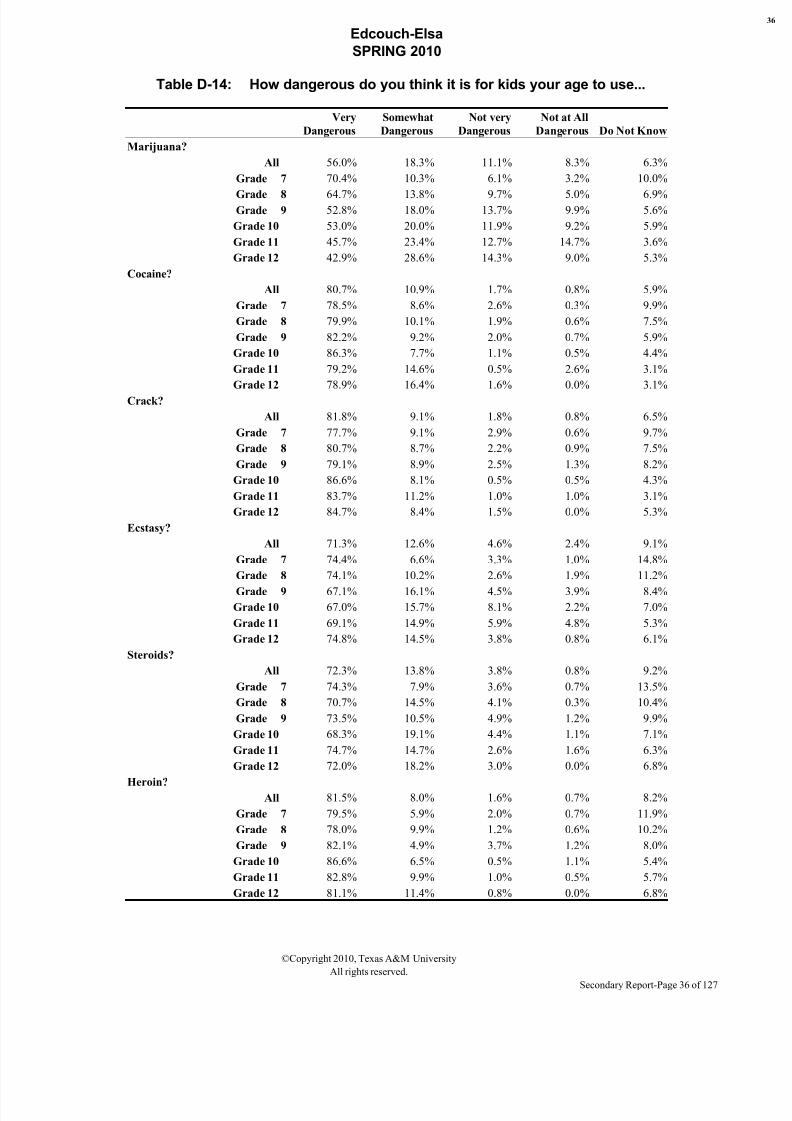
Table D-14: How dangerous do you think it is for kids your age to use...
Very
Dangerous
Somewhat
Dangerous
Not very
Dangerous
Not at All
Dangerous Do Not Know
Marijuana?
All 56.0% 18.3% 11.1% 8.3% 6.3%
Grade 7 70.4% 10.3% 6.1% 3.2% 10.0%
Grade 8 64.7% 13.8% 9.7% 5.0% 6.9%Grade 9 52.8% 18.0% 13.7% 9.9% 5.6%
Grade 10 53.0% 20.0% 11.9% 9.2% 5.9%
Grade 11 45.7% 23.4% 12.7% 14.7% 3.6%
Grade 12 42.9% 28.6% 14.3% 9.0% 5.3%
Cocaine?
All 80.7% 10.9% 1.7% 0.8% 5.9%
Grade 7 78.5% 8.6% 2.6% 0.3% 9.9%
Grade 8 79.9% 10.1% 1.9% 0.6% 7.5%
Grade 9 82.2% 9.2% 2.0% 0.7% 5.9%
Grade 10 86.3% 7.7% 1.1% 0.5% 4.4%
Grade 11 79.2% 14.6% 0.5% 2.6% 3.1%
Grade 12 78.9% 16.4% 1.6% 0.0% 3.1%
Crack?
All 81.8% 9.1% 1.8% 0.8% 6.5%
Grade 7 77.7% 9.1% 2.9% 0.6% 9.7%
Grade 8 80.7% 8.7% 2.2% 0.9% 7.5%
Grade 9 79.1% 8.9% 2.5% 1.3% 8.2%
Grade 10 86.6% 8.1% 0.5% 0.5% 4.3%
Grade 11 83.7% 11.2% 1.0% 1.0% 3.1%
Grade 12 84.7% 8.4% 1.5% 0.0% 5.3%
Ecstasy?
All 71.3% 12.6% 4.6% 2.4% 9.1%
Grade 7 74.4% 6.6% 3.3% 1.0% 14.8%
Grade 8 74.1% 10.2% 2.6% 1.9% 11.2%
Grade 9 67.1% 16.1% 4.5% 3.9% 8.4%Grade 10 67.0% 15.7% 8.1% 2.2% 7.0%
Grade 11 69.1% 14.9% 5.9% 4.8% 5.3%
Grade 12 74.8% 14.5% 3.8% 0.8% 6.1%
Steroids?
All 72.3% 13.8% 3.8% 0.8% 9.2%
Grade 7 74.3% 7.9% 3.6% 0.7% 13.5%
Grade 8 70.7% 14.5% 4.1% 0.3% 10.4%
Grade 9 73.5% 10.5% 4.9% 1.2% 9.9%
Grade 10 68.3% 19.1% 4.4% 1.1% 7.1%
Grade 11 74.7% 14.7% 2.6% 1.6% 6.3%
Grade 12 72.0% 18.2% 3.0% 0.0% 6.8%
Heroin?All 81.5% 8.0% 1.6% 0.7% 8.2%
Grade 7 79.5% 5.9% 2.0% 0.7% 11.9%
Grade 8 78.0% 9.9% 1.2% 0.6% 10.2%
Grade 9 82.1% 4.9% 3.7% 1.2% 8.0%
Grade 10 86.6% 6.5% 0.5% 1.1% 5.4%
Grade 11 82.8% 9.9% 1.0% 0.5% 5.7%
Grade 12 81.1% 11.4% 0.8% 0.0% 6.8%
©Copyright 2010, Texas A&M University
All rights reserved.
Secondary Report-Page 36 of 127
8/7/2019 HIDALGO COUNTY - edcouch-elsa isd _ 2010 Texas School Survey of Drug and Alcohol Use
http://slidepdf.com/reader/full/hidalgo-county-edcouch-elsa-isd-2010-texas-school-survey-of-drug-and-alcohol 37/127
Edcouch-Elsa
SPRING 2010
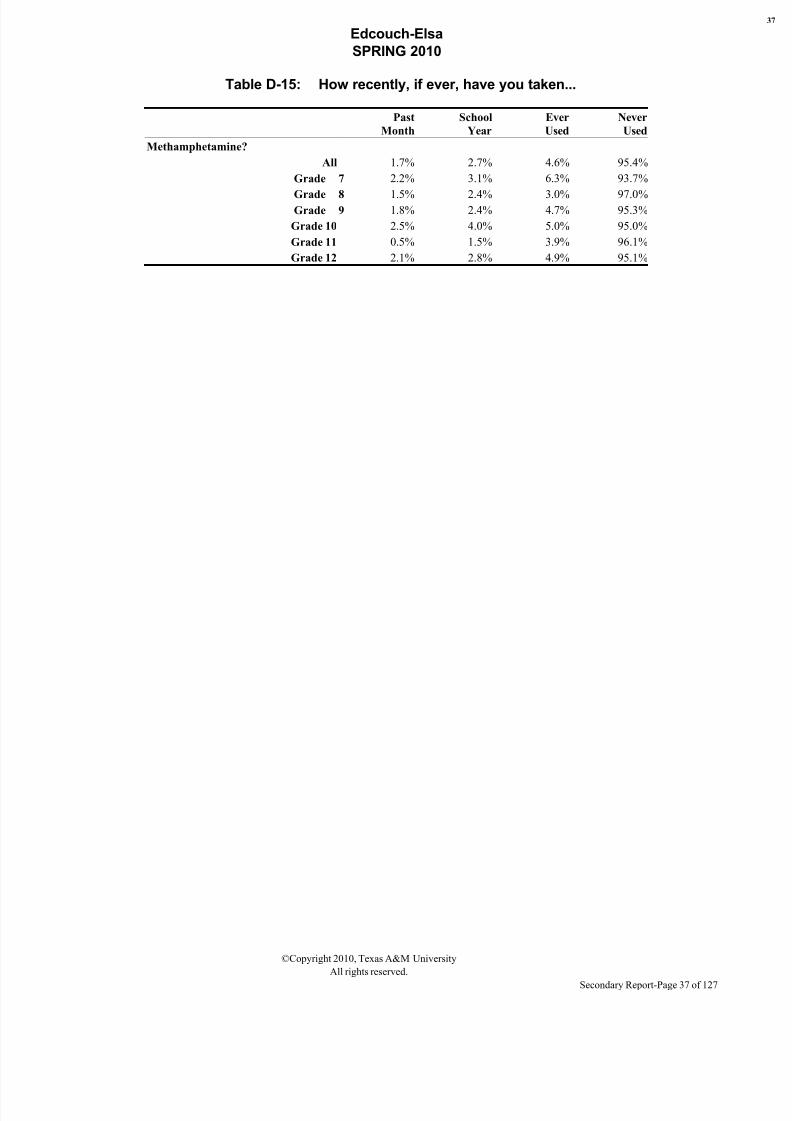
Table D-15: How recently, if ever, have you taken...
Past
Month
School
Year
Ever
Used
Never
Used
Methamphetamine?
All 1.7% 2.7% 4.6% 95.4%
Grade 7 2.2% 3.1% 6.3% 93.7%
Grade 8 1.5% 2.4% 3.0% 97.0%Grade 9 1.8% 2.4% 4.7% 95.3%
Grade 10 2.5% 4.0% 5.0% 95.0%
Grade 11 0.5% 1.5% 3.9% 96.1%
Grade 12 2.1% 2.8% 4.9% 95.1%
©Copyright 2010, Texas A&M University
All rights reserved.
Secondary Report-Page 37 of 127
8/7/2019 HIDALGO COUNTY - edcouch-elsa isd _ 2010 Texas School Survey of Drug and Alcohol Use
http://slidepdf.com/reader/full/hidalgo-county-edcouch-elsa-isd-2010-texas-school-survey-of-drug-and-alcohol 38/127
Edcouch-Elsa
SPRING 2010
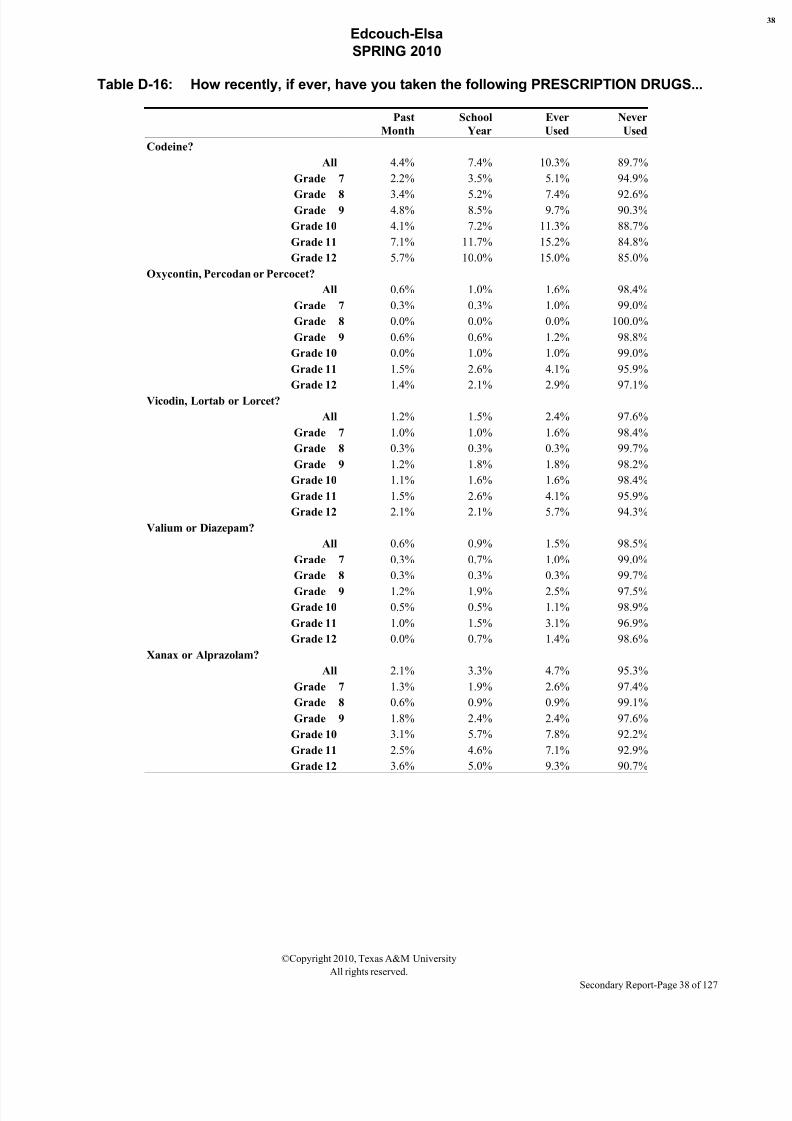
Table D-16: How recently, if ever, have you taken the following PRESCRIPTION DRUGS...
Past
Month
School
Year
Ever
Used
Never
Used
Codeine?
All 4.4% 7.4% 10.3% 89.7%
Grade 7 2.2% 3.5% 5.1% 94.9%
Grade 8 3.4% 5.2% 7.4% 92.6%Grade 9 4.8% 8.5% 9.7% 90.3%
Grade 10 4.1% 7.2% 11.3% 88.7%
Grade 11 7.1% 11.7% 15.2% 84.8%
Grade 12 5.7% 10.0% 15.0% 85.0%
Oxycontin, Percodan or Percocet?
All 0.6% 1.0% 1.6% 98.4%
Grade 7 0.3% 0.3% 1.0% 99.0%
Grade 8 0.0% 0.0% 0.0% 100.0%
Grade 9 0.6% 0.6% 1.2% 98.8%
Grade 10 0.0% 1.0% 1.0% 99.0%
Grade 11 1.5% 2.6% 4.1% 95.9%
Grade 12 1.4% 2.1% 2.9% 97.1%
Vicodin, Lortab or Lorcet?
All 1.2% 1.5% 2.4% 97.6%
Grade 7 1.0% 1.0% 1.6% 98.4%
Grade 8 0.3% 0.3% 0.3% 99.7%
Grade 9 1.2% 1.8% 1.8% 98.2%
Grade 10 1.1% 1.6% 1.6% 98.4%
Grade 11 1.5% 2.6% 4.1% 95.9%
Grade 12 2.1% 2.1% 5.7% 94.3%
Valium or Diazepam?
All 0.6% 0.9% 1.5% 98.5%
Grade 7 0.3% 0.7% 1.0% 99.0%
Grade 8 0.3% 0.3% 0.3% 99.7%
Grade 9 1.2% 1.9% 2.5% 97.5%Grade 10 0.5% 0.5% 1.1% 98.9%
Grade 11 1.0% 1.5% 3.1% 96.9%
Grade 12 0.0% 0.7% 1.4% 98.6%
Xanax or Alprazolam?
All 2.1% 3.3% 4.7% 95.3%
Grade 7 1.3% 1.9% 2.6% 97.4%
Grade 8 0.6% 0.9% 0.9% 99.1%
Grade 9 1.8% 2.4% 2.4% 97.6%
Grade 10 3.1% 5.7% 7.8% 92.2%
Grade 11 2.5% 4.6% 7.1% 92.9%
Grade 12 3.6% 5.0% 9.3% 90.7%
©Copyright 2010, Texas A&M University
All rights reserved.
Secondary Report-Page 38 of 127
8/7/2019 HIDALGO COUNTY - edcouch-elsa isd _ 2010 Texas School Survey of Drug and Alcohol Use
http://slidepdf.com/reader/full/hidalgo-county-edcouch-elsa-isd-2010-texas-school-survey-of-drug-and-alcohol 39/127
Edcouch-Elsa
SPRING 2010
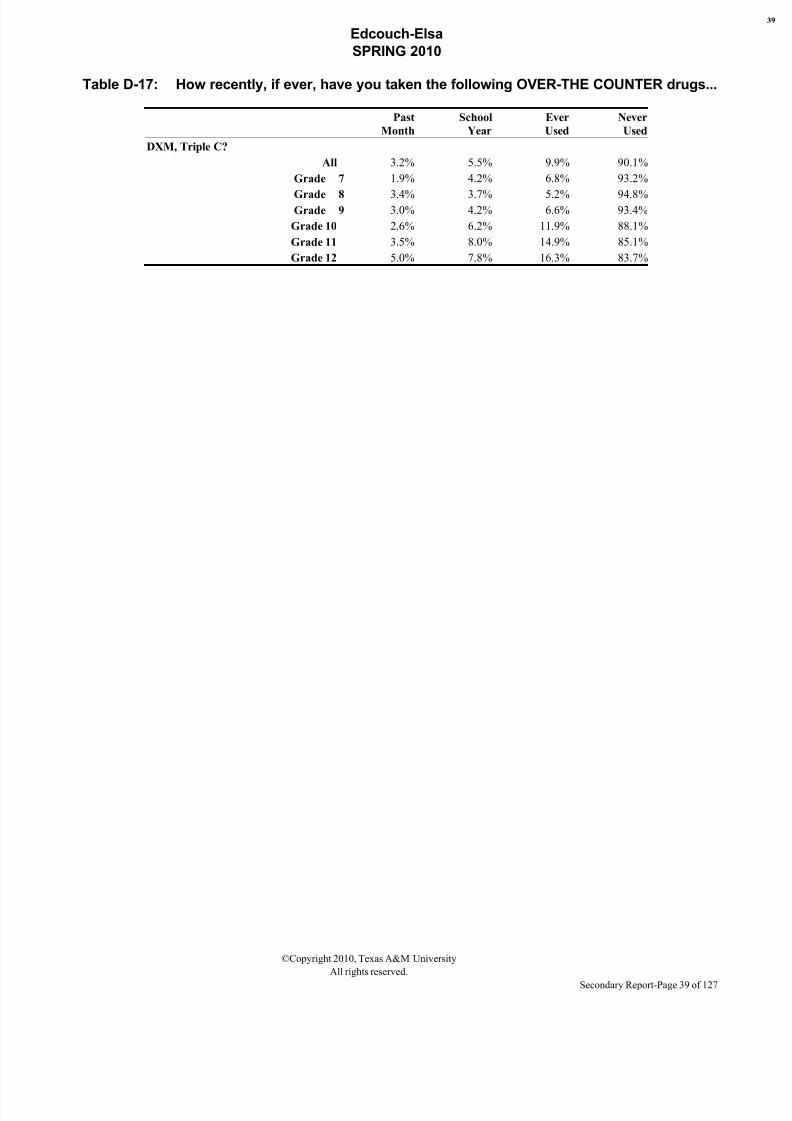
Table D-17: How recently, if ever, have you taken the following OVER-THE COUNTER drugs...
Past
Month
School
Year
Ever
Used
Never
Used
DXM, Triple C?
All 3.2% 5.5% 9.9% 90.1%
Grade 7 1.9% 4.2% 6.8% 93.2%
Grade 8 3.4% 3.7% 5.2% 94.8%Grade 9 3.0% 4.2% 6.6% 93.4%
Grade 10 2.6% 6.2% 11.9% 88.1%
Grade 11 3.5% 8.0% 14.9% 85.1%
Grade 12 5.0% 7.8% 16.3% 83.7%
©Copyright 2010, Texas A&M University
All rights reserved.
Secondary Report-Page 39 of 127
8/7/2019 HIDALGO COUNTY - edcouch-elsa isd _ 2010 Texas School Survey of Drug and Alcohol Use
http://slidepdf.com/reader/full/hidalgo-county-edcouch-elsa-isd-2010-texas-school-survey-of-drug-and-alcohol 40/127
Edcouch-Elsa
SPRING 2010
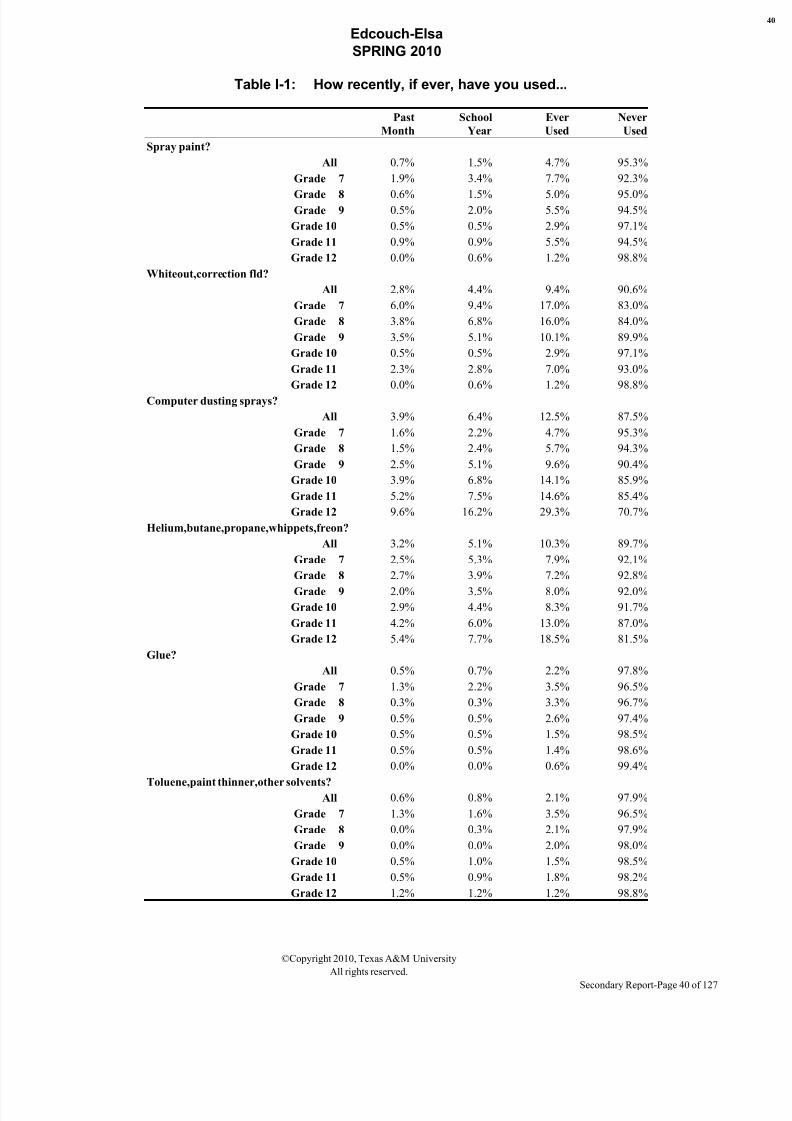
Table I-1: How recently, if ever, have you used...
Past
Month
School
Year
Ever
Used
Never
Used
Spray paint?
All 0.7% 1.5% 4.7% 95.3%
Grade 7 1.9% 3.4% 7.7% 92.3%
Grade 8 0.6% 1.5% 5.0% 95.0%Grade 9 0.5% 2.0% 5.5% 94.5%
Grade 10 0.5% 0.5% 2.9% 97.1%
Grade 11 0.9% 0.9% 5.5% 94.5%
Grade 12 0.0% 0.6% 1.2% 98.8%
Whiteout,correction fld?
All 2.8% 4.4% 9.4% 90.6%
Grade 7 6.0% 9.4% 17.0% 83.0%
Grade 8 3.8% 6.8% 16.0% 84.0%
Grade 9 3.5% 5.1% 10.1% 89.9%
Grade 10 0.5% 0.5% 2.9% 97.1%
Grade 11 2.3% 2.8% 7.0% 93.0%
Grade 12 0.0% 0.6% 1.2% 98.8%
Computer dusting sprays?
All 3.9% 6.4% 12.5% 87.5%
Grade 7 1.6% 2.2% 4.7% 95.3%
Grade 8 1.5% 2.4% 5.7% 94.3%
Grade 9 2.5% 5.1% 9.6% 90.4%
Grade 10 3.9% 6.8% 14.1% 85.9%
Grade 11 5.2% 7.5% 14.6% 85.4%
Grade 12 9.6% 16.2% 29.3% 70.7%
Helium,butane,propane,whippets,freon?
All 3.2% 5.1% 10.3% 89.7%
Grade 7 2.5% 5.3% 7.9% 92.1%
Grade 8 2.7% 3.9% 7.2% 92.8%
Grade 9 2.0% 3.5% 8.0% 92.0%Grade 10 2.9% 4.4% 8.3% 91.7%
Grade 11 4.2% 6.0% 13.0% 87.0%
Grade 12 5.4% 7.7% 18.5% 81.5%
Glue?
All 0.5% 0.7% 2.2% 97.8%
Grade 7 1.3% 2.2% 3.5% 96.5%
Grade 8 0.3% 0.3% 3.3% 96.7%
Grade 9 0.5% 0.5% 2.6% 97.4%
Grade 10 0.5% 0.5% 1.5% 98.5%
Grade 11 0.5% 0.5% 1.4% 98.6%
Grade 12 0.0% 0.0% 0.6% 99.4%
Toluene,paint thinner,other solvents?All 0.6% 0.8% 2.1% 97.9%
Grade 7 1.3% 1.6% 3.5% 96.5%
Grade 8 0.0% 0.3% 2.1% 97.9%
Grade 9 0.0% 0.0% 2.0% 98.0%
Grade 10 0.5% 1.0% 1.5% 98.5%
Grade 11 0.5% 0.9% 1.8% 98.2%
Grade 12 1.2% 1.2% 1.2% 98.8%
©Copyright 2010, Texas A&M University
All rights reserved.
Secondary Report-Page 40 of 127
8/7/2019 HIDALGO COUNTY - edcouch-elsa isd _ 2010 Texas School Survey of Drug and Alcohol Use
http://slidepdf.com/reader/full/hidalgo-county-edcouch-elsa-isd-2010-texas-school-survey-of-drug-and-alcohol 41/127
Edcouch-Elsa
SPRING 2010
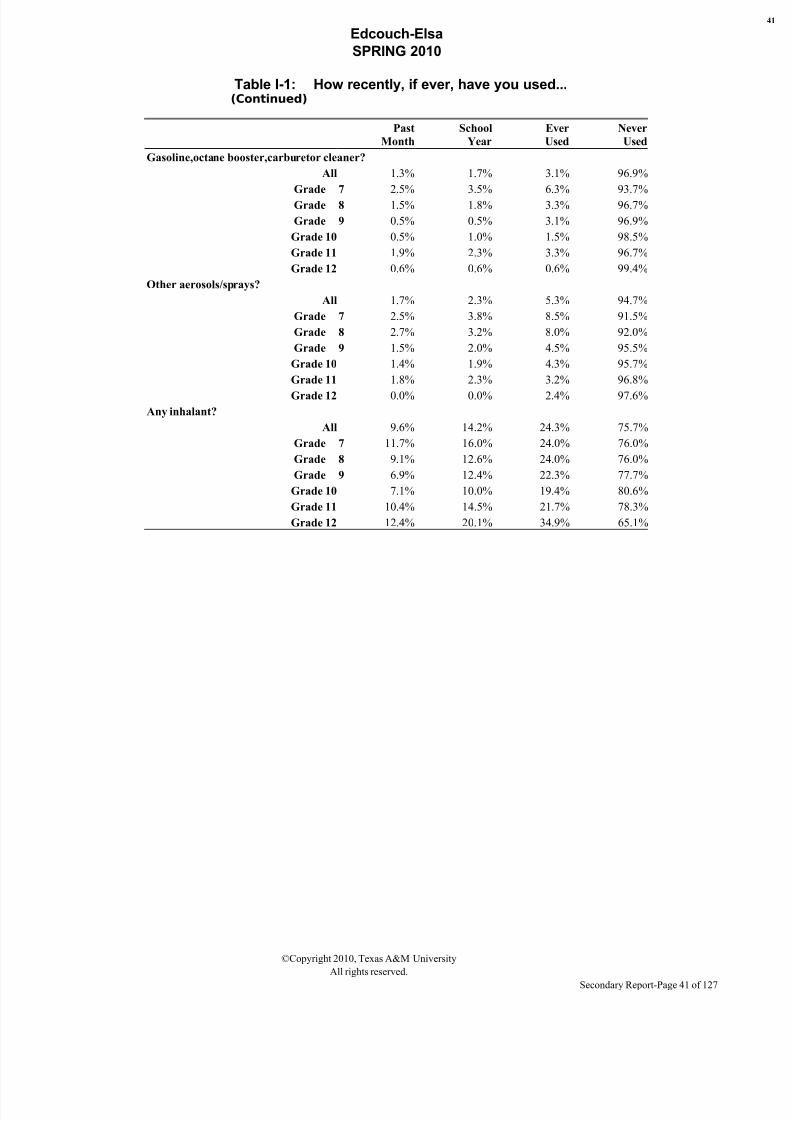
Table I-1: How recently, if ever, have you used...(Continued)
Past
Month
School
Year
Ever
Used
Never
Used
Gasoline,octane booster,carburetor cleaner?
All 1.3% 1.7% 3.1% 96.9%
Grade 7 2.5% 3.5% 6.3% 93.7%
Grade 8 1.5% 1.8% 3.3% 96.7%
Grade 9 0.5% 0.5% 3.1% 96.9%
Grade 10 0.5% 1.0% 1.5% 98.5%
Grade 11 1.9% 2.3% 3.3% 96.7%
Grade 12 0.6% 0.6% 0.6% 99.4%
Other aerosols/sprays?
All 1.7% 2.3% 5.3% 94.7%
Grade 7 2.5% 3.8% 8.5% 91.5%
Grade 8 2.7% 3.2% 8.0% 92.0%
Grade 9 1.5% 2.0% 4.5% 95.5%
Grade 10 1.4% 1.9% 4.3% 95.7%
Grade 11 1.8% 2.3% 3.2% 96.8%
Grade 12 0.0% 0.0% 2.4% 97.6%
Any inhalant?
All 9.6% 14.2% 24.3% 75.7%
Grade 7 11.7% 16.0% 24.0% 76.0%
Grade 8 9.1% 12.6% 24.0% 76.0%
Grade 9 6.9% 12.4% 22.3% 77.7%
Grade 10 7.1% 10.0% 19.4% 80.6%
Grade 11 10.4% 14.5% 21.7% 78.3%
Grade 12 12.4% 20.1% 34.9% 65.1%
©Copyright 2010, Texas A&M University
All rights reserved.
Secondary Report-Page 41 of 127
8/7/2019 HIDALGO COUNTY - edcouch-elsa isd _ 2010 Texas School Survey of Drug and Alcohol Use
http://slidepdf.com/reader/full/hidalgo-county-edcouch-elsa-isd-2010-texas-school-survey-of-drug-and-alcohol 42/127
Edcouch-Elsa
SPRING 2010
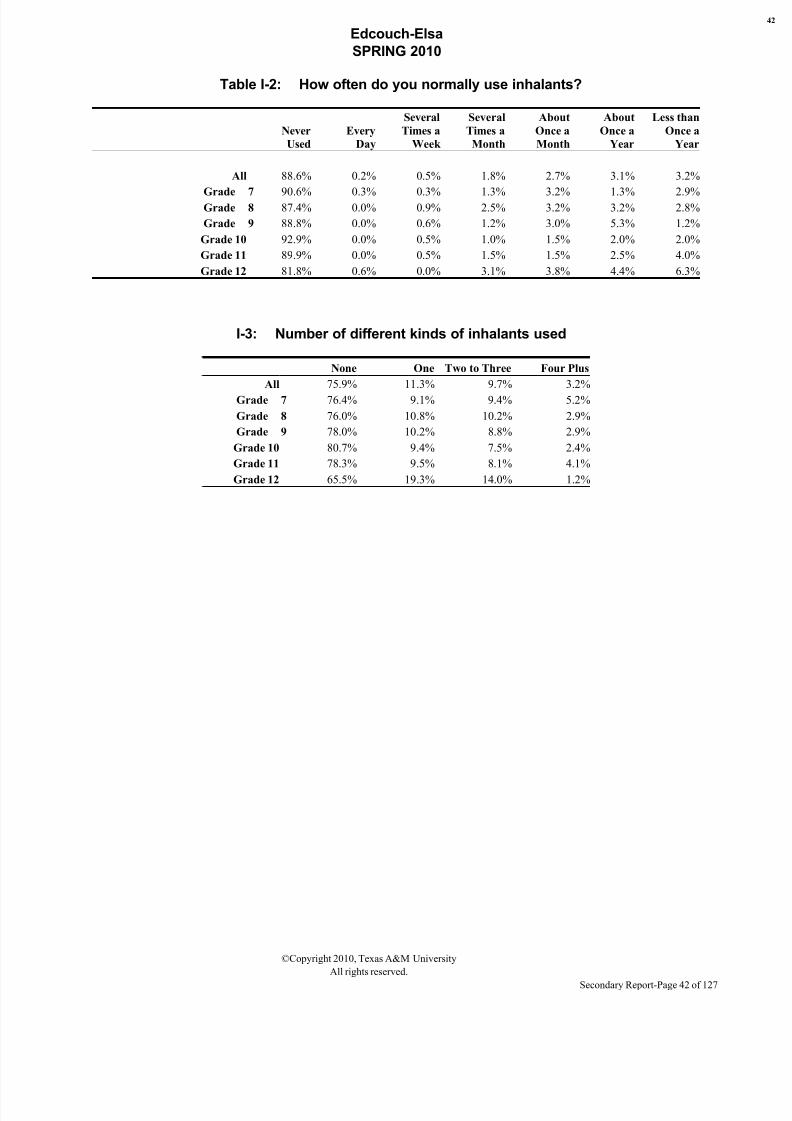
Table I-2: How often do you normally use inhalants?
Never
Used
Every
Day
Several
Times a
Week
Several
Times a
Month
About
Once a
Month
About
Once a
Year
Less than
Once a
Year
All 88.6% 0.2% 0.5% 1.8% 2.7% 3.1% 3.2%
Grade 7 90.6% 0.3% 0.3% 1.3% 3.2% 1.3% 2.9%Grade 8 87.4% 0.0% 0.9% 2.5% 3.2% 3.2% 2.8%
Grade 9 88.8% 0.0% 0.6% 1.2% 3.0% 5.3% 1.2%
Grade 10 92.9% 0.0% 0.5% 1.0% 1.5% 2.0% 2.0%
Grade 11 89.9% 0.0% 0.5% 1.5% 1.5% 2.5% 4.0%
Grade 12 81.8% 0.6% 0.0% 3.1% 3.8% 4.4% 6.3%
I-3: Number of different kinds of inhalants used
None One Two to Three Four Plus
All 75.9% 11.3% 9.7% 3.2%
Grade 7 76.4% 9.1% 9.4% 5.2%
Grade 8 76.0% 10.8% 10.2% 2.9%
Grade 9 78.0% 10.2% 8.8% 2.9%
Grade 10 80.7% 9.4% 7.5% 2.4%
Grade 11 78.3% 9.5% 8.1% 4.1%
Grade 12 65.5% 19.3% 14.0% 1.2%
©Copyright 2010, Texas A&M University
All rights reserved.
Secondary Report-Page 42 of 127
8/7/2019 HIDALGO COUNTY - edcouch-elsa isd _ 2010 Texas School Survey of Drug and Alcohol Use
http://slidepdf.com/reader/full/hidalgo-county-edcouch-elsa-isd-2010-texas-school-survey-of-drug-and-alcohol 43/127
Edcouch-Elsa
SPRING 2010
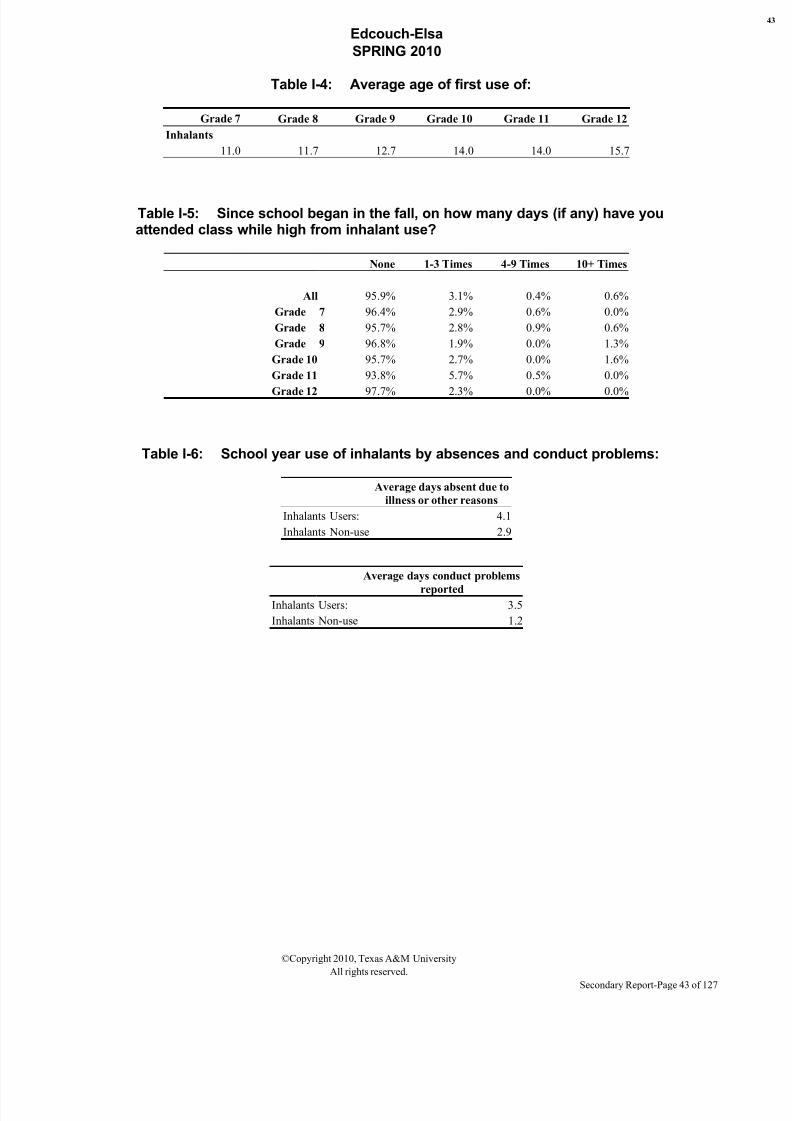
Table I-4: Average age of first use of:
Grade 7 Grade 8 Grade 9 Grade 10 Grade 11 Grade 12
Inhalants
11.0 11.7 12.7 14.0 14.0 15.7
Table I-5: Since school began in the fall, on how many days (if any) have youattended class while high from inhalant use?
None 1-3 Times 4-9 Times 10+ Times
All 95.9% 3.1% 0.4% 0.6%
Grade 7 96.4% 2.9% 0.6% 0.0%
Grade 8 95.7% 2.8% 0.9% 0.6%
Grade 9 96.8% 1.9% 0.0% 1.3%
Grade 10 95.7% 2.7% 0.0% 1.6%
Grade 11 93.8% 5.7% 0.5% 0.0%
Grade 12 97.7% 2.3% 0.0% 0.0%
Table I-6: School year use of inhalants by absences and conduct problems:
Average days absent due to
illness or other reasons
Inhalants Users: 4.1
Inhalants Non-use 2.9
Average days conduct problems
reportedInhalants Users: 3.5
Inhalants Non-use 1.2
©Copyright 2010, Texas A&M University
All rights reserved.
Secondary Report-Page 43 of 127
8/7/2019 HIDALGO COUNTY - edcouch-elsa isd _ 2010 Texas School Survey of Drug and Alcohol Use
http://slidepdf.com/reader/full/hidalgo-county-edcouch-elsa-isd-2010-texas-school-survey-of-drug-and-alcohol 44/127
Edcouch-Elsa
SPRING 2010
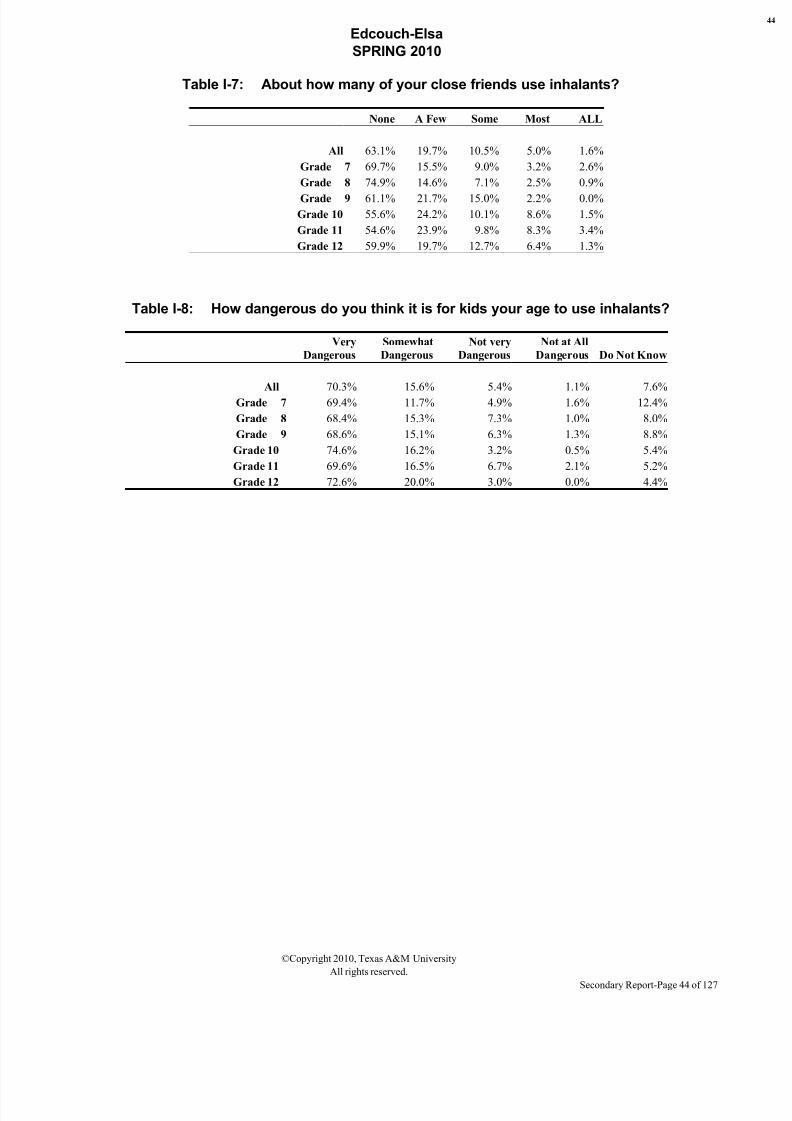
Table I-7: About how many of your close friends use inhalants?
None A Few Some Most ALL
All 63.1% 19.7% 10.5% 5.0% 1.6%
Grade 7 69.7% 15.5% 9.0% 3.2% 2.6%
Grade 8 74.9% 14.6% 7.1% 2.5% 0.9%
Grade 9 61.1% 21.7% 15.0% 2.2% 0.0%
Grade 10 55.6% 24.2% 10.1% 8.6% 1.5%
Grade 11 54.6% 23.9% 9.8% 8.3% 3.4%
Grade 12 59.9% 19.7% 12.7% 6.4% 1.3%
Table I-8: How dangerous do you think it is for kids your age to use inhalants?
Very
Dangerous
Somewhat
Dangerous
Not very
Dangerous
Not at All
Dangerous Do Not Know
All 70.3% 15.6% 5.4% 1.1% 7.6%Grade 7 69.4% 11.7% 4.9% 1.6% 12.4%
Grade 8 68.4% 15.3% 7.3% 1.0% 8.0%
Grade 9 68.6% 15.1% 6.3% 1.3% 8.8%
Grade 10 74.6% 16.2% 3.2% 0.5% 5.4%
Grade 11 69.6% 16.5% 6.7% 2.1% 5.2%
Grade 12 72.6% 20.0% 3.0% 0.0% 4.4%
©Copyright 2010, Texas A&M University
All rights reserved.
Secondary Report-Page 44 of 127
8/7/2019 HIDALGO COUNTY - edcouch-elsa isd _ 2010 Texas School Survey of Drug and Alcohol Use
http://slidepdf.com/reader/full/hidalgo-county-edcouch-elsa-isd-2010-texas-school-survey-of-drug-and-alcohol 45/127
Edcouch-Elsa
SPRING 2010
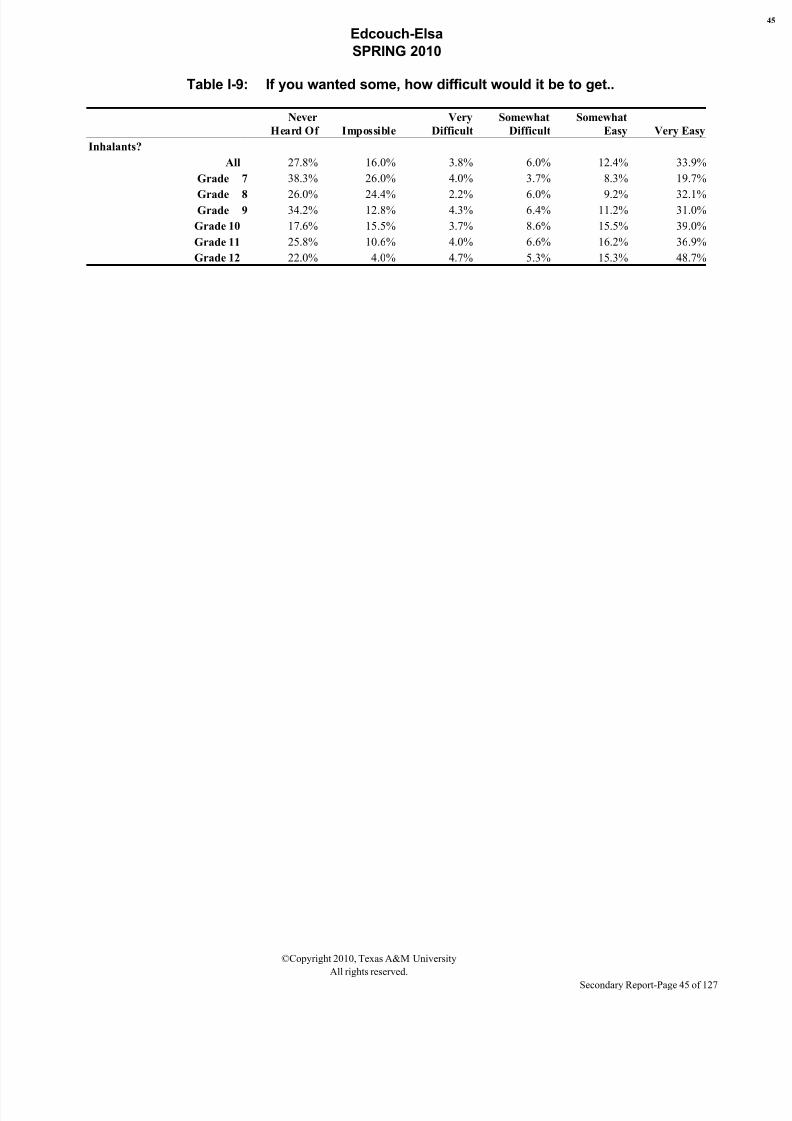
Table I-9: If you wanted some, how difficult would it be to get..
Never
Heard Of Impossible
Very
Difficult
Somewhat
Difficult
Somewhat
Easy Very Easy
Inhalants?
All 27.8% 16.0% 3.8% 6.0% 12.4% 33.9%
Grade 7 38.3% 26.0% 4.0% 3.7% 8.3% 19.7%
Grade 8 26.0% 24.4% 2.2% 6.0% 9.2% 32.1%Grade 9 34.2% 12.8% 4.3% 6.4% 11.2% 31.0%
Grade 10 17.6% 15.5% 3.7% 8.6% 15.5% 39.0%
Grade 11 25.8% 10.6% 4.0% 6.6% 16.2% 36.9%
Grade 12 22.0% 4.0% 4.7% 5.3% 15.3% 48.7%
©Copyright 2010, Texas A&M University
All rights reserved.
Secondary Report-Page 45 of 127
8/7/2019 HIDALGO COUNTY - edcouch-elsa isd _ 2010 Texas School Survey of Drug and Alcohol Use
http://slidepdf.com/reader/full/hidalgo-county-edcouch-elsa-isd-2010-texas-school-survey-of-drug-and-alcohol 46/127
Edcouch-Elsa
SPRING 2010
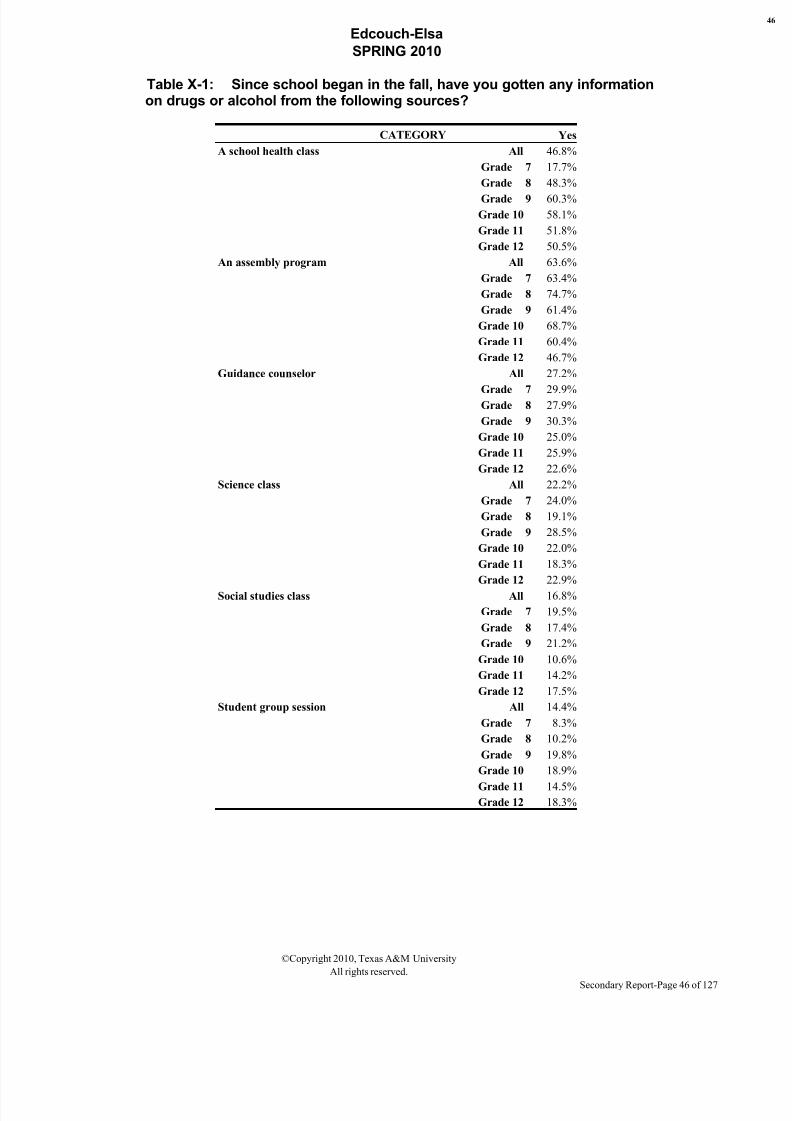
Table X-1: Since school began in the fall, have you gotten any informationon drugs or alcohol from the following sources?
CATEGORY Yes
A school health class All 46.8%
Grade 7 17.7%
Grade 8 48.3%
Grade 9 60.3%
Grade 10 58.1%
Grade 11 51.8%
Grade 12 50.5%
An assembly program All 63.6%
Grade 7 63.4%
Grade 8 74.7%
Grade 9 61.4%
Grade 10 68.7%
Grade 11 60.4%
Grade 12 46.7%
Guidance counselor All 27.2%
Grade 7 29.9%Grade 8 27.9%
Grade 9 30.3%
Grade 10 25.0%
Grade 11 25.9%
Grade 12 22.6%
Science class All 22.2%
Grade 7 24.0%
Grade 8 19.1%
Grade 9 28.5%
Grade 10 22.0%
Grade 11 18.3%
Grade 12 22.9%
Social studies class All 16.8%
Grade 7 19.5%
Grade 8 17.4%
Grade 9 21.2%
Grade 10 10.6%
Grade 11 14.2%
Grade 12 17.5%
Student group session All 14.4%
Grade 7 8.3%
Grade 8 10.2%
Grade 9 19.8%
Grade 10 18.9%
Grade 11 14.5%Grade 12 18.3%
©Copyright 2010, Texas A&M University
All rights reserved.
Secondary Report-Page 46 of 127
8/7/2019 HIDALGO COUNTY - edcouch-elsa isd _ 2010 Texas School Survey of Drug and Alcohol Use
http://slidepdf.com/reader/full/hidalgo-county-edcouch-elsa-isd-2010-texas-school-survey-of-drug-and-alcohol 47/127
Edcouch-Elsa
SPRING 2010
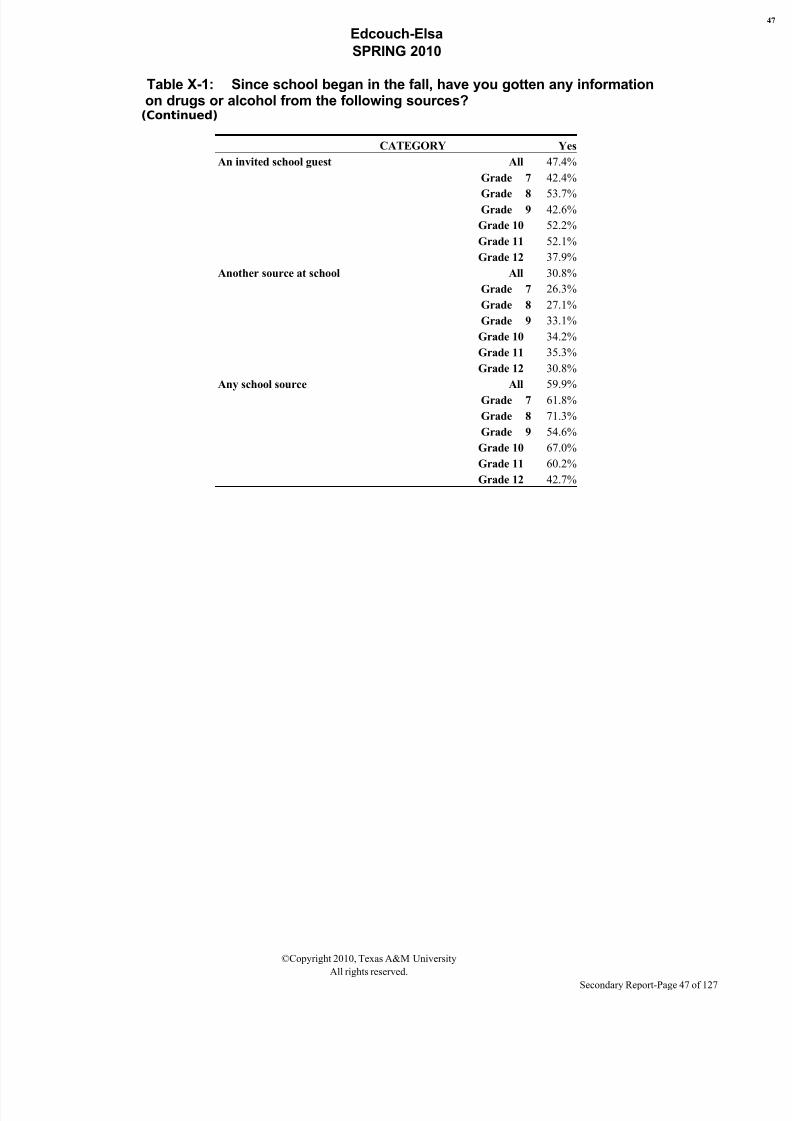
Table X-1: Since school began in the fall, have you gotten any informationon drugs or alcohol from the following sources?(Continued)
CATEGORY Yes
An invited school guest All 47.4%
Grade 7 42.4%
Grade 8 53.7%Grade 9 42.6%
Grade 10 52.2%
Grade 11 52.1%
Grade 12 37.9%
Another source at school All 30.8%
Grade 7 26.3%
Grade 8 27.1%
Grade 9 33.1%
Grade 10 34.2%
Grade 11 35.3%
Grade 12 30.8%
Any school source All 59.9%
Grade 7 61.8%
Grade 8 71.3%
Grade 9 54.6%
Grade 10 67.0%
Grade 11 60.2%
Grade 12 42.7%
©Copyright 2010, Texas A&M University
All rights reserved.
Secondary Report-Page 47 of 127
8/7/2019 HIDALGO COUNTY - edcouch-elsa isd _ 2010 Texas School Survey of Drug and Alcohol Use
http://slidepdf.com/reader/full/hidalgo-county-edcouch-elsa-isd-2010-texas-school-survey-of-drug-and-alcohol 48/127
Edcouch-Elsa
SPRING 2010
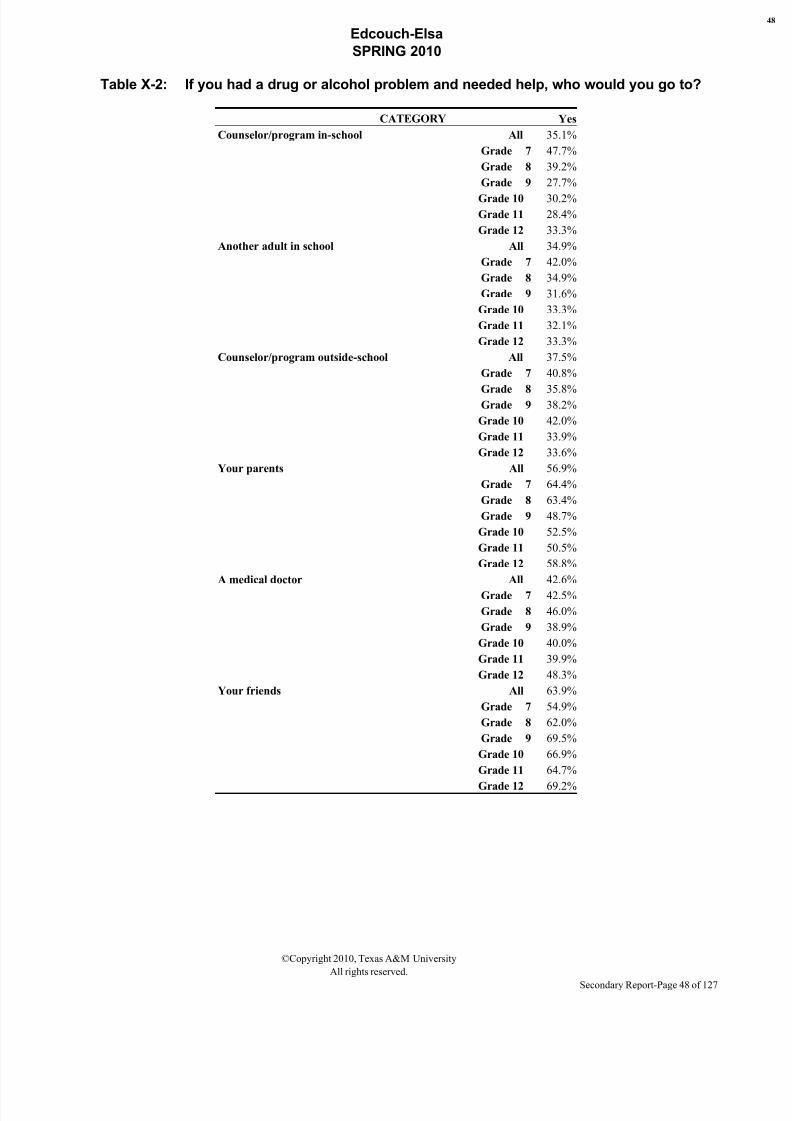
Table X-2: If you had a drug or alcohol problem and needed help, who would you go to?
CATEGORY Yes
Counselor/program in-school All 35.1%
Grade 7 47.7%
Grade 8 39.2%
Grade 9 27.7%
Grade 10 30.2%
Grade 11 28.4%
Grade 12 33.3%
Another adult in school All 34.9%
Grade 7 42.0%
Grade 8 34.9%
Grade 9 31.6%
Grade 10 33.3%
Grade 11 32.1%
Grade 12 33.3%
Counselor/program outside-school All 37.5%
Grade 7 40.8%
Grade 8 35.8%Grade 9 38.2%
Grade 10 42.0%
Grade 11 33.9%
Grade 12 33.6%
Your parents All 56.9%
Grade 7 64.4%
Grade 8 63.4%
Grade 9 48.7%
Grade 10 52.5%
Grade 11 50.5%
Grade 12 58.8%
A medical doctor All 42.6%
Grade 7 42.5%
Grade 8 46.0%
Grade 9 38.9%
Grade 10 40.0%
Grade 11 39.9%
Grade 12 48.3%
Your friends All 63.9%
Grade 7 54.9%
Grade 8 62.0%
Grade 9 69.5%
Grade 10 66.9%
Grade 11 64.7%
Grade 12 69.2%
©Copyright 2010, Texas A&M University
All rights reserved.
Secondary Report-Page 48 of 127
8/7/2019 HIDALGO COUNTY - edcouch-elsa isd _ 2010 Texas School Survey of Drug and Alcohol Use
http://slidepdf.com/reader/full/hidalgo-county-edcouch-elsa-isd-2010-texas-school-survey-of-drug-and-alcohol 49/127
Edcouch-Elsa
SPRING 2010
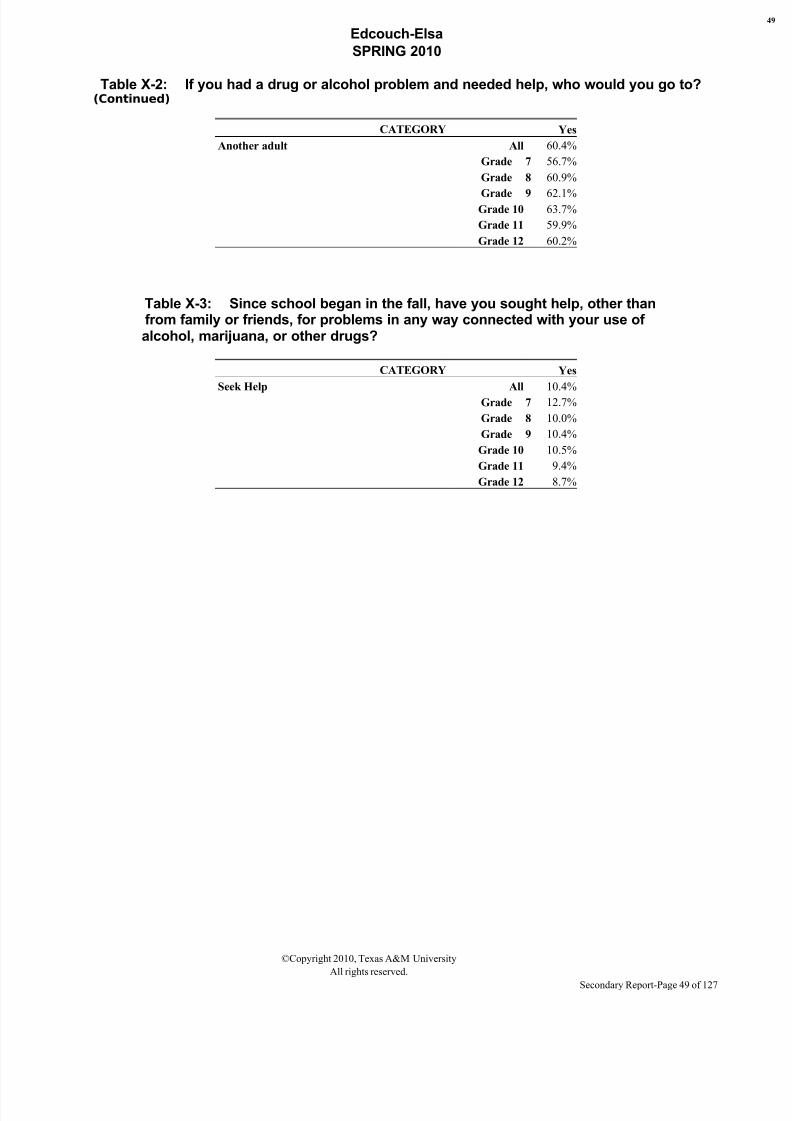
Table X-2: If you had a drug or alcohol problem and needed help, who would you go to?(Continued)
CATEGORY Yes
Another adult All 60.4%
Grade 7 56.7%
Grade 8 60.9%
Grade 9 62.1%Grade 10 63.7%
Grade 11 59.9%
Grade 12 60.2%
Table X-3: Since school began in the fall, have you sought help, other thanfrom family or friends, for problems in any way connected with your use of alcohol, marijuana, or other drugs?
CATEGORY Yes
Seek Help All 10.4%
Grade 7 12.7%
Grade 8 10.0%
Grade 9 10.4%
Grade 10 10.5%
Grade 11 9.4%
Grade 12 8.7%
©Copyright 2010, Texas A&M University
All rights reserved.
Secondary Report-Page 49 of 127
8/7/2019 HIDALGO COUNTY - edcouch-elsa isd _ 2010 Texas School Survey of Drug and Alcohol Use
http://slidepdf.com/reader/full/hidalgo-county-edcouch-elsa-isd-2010-texas-school-survey-of-drug-and-alcohol 50/127
Edcouch-Elsa
SPRING 2010
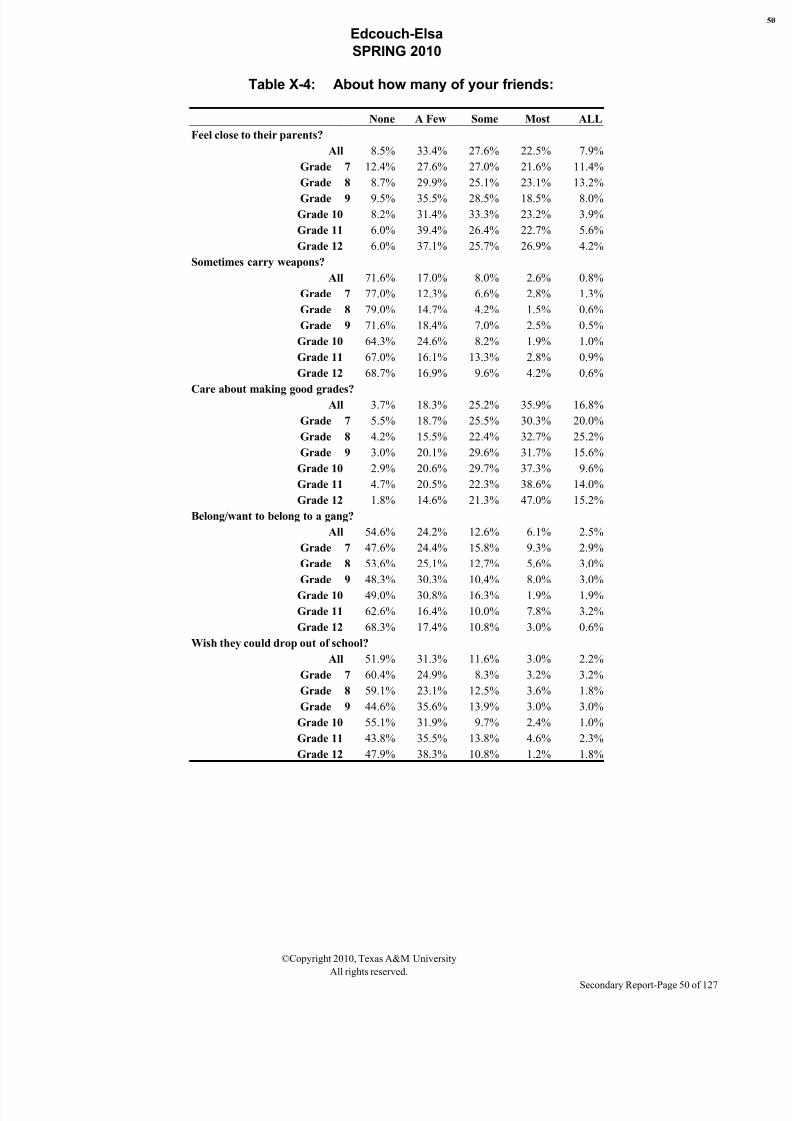
Table X-4: About how many of your friends:
None A Few Some Most ALL
Feel close to their parents?
All 8.5% 33.4% 27.6% 22.5% 7.9%
Grade 7 12.4% 27.6% 27.0% 21.6% 11.4%
Grade 8 8.7% 29.9% 25.1% 23.1% 13.2%
Grade 9 9.5% 35.5% 28.5% 18.5% 8.0%
Grade 10 8.2% 31.4% 33.3% 23.2% 3.9%
Grade 11 6.0% 39.4% 26.4% 22.7% 5.6%
Grade 12 6.0% 37.1% 25.7% 26.9% 4.2%
Sometimes carry weapons?
All 71.6% 17.0% 8.0% 2.6% 0.8%
Grade 7 77.0% 12.3% 6.6% 2.8% 1.3%
Grade 8 79.0% 14.7% 4.2% 1.5% 0.6%
Grade 9 71.6% 18.4% 7.0% 2.5% 0.5%
Grade 10 64.3% 24.6% 8.2% 1.9% 1.0%
Grade 11 67.0% 16.1% 13.3% 2.8% 0.9%
Grade 12 68.7% 16.9% 9.6% 4.2% 0.6%
Care about making good grades?All 3.7% 18.3% 25.2% 35.9% 16.8%
Grade 7 5.5% 18.7% 25.5% 30.3% 20.0%
Grade 8 4.2% 15.5% 22.4% 32.7% 25.2%
Grade 9 3.0% 20.1% 29.6% 31.7% 15.6%
Grade 10 2.9% 20.6% 29.7% 37.3% 9.6%
Grade 11 4.7% 20.5% 22.3% 38.6% 14.0%
Grade 12 1.8% 14.6% 21.3% 47.0% 15.2%
Belong/want to belong to a gang?
All 54.6% 24.2% 12.6% 6.1% 2.5%
Grade 7 47.6% 24.4% 15.8% 9.3% 2.9%
Grade 8 53.6% 25.1% 12.7% 5.6% 3.0%
Grade 9 48.3% 30.3% 10.4% 8.0% 3.0%
Grade 10 49.0% 30.8% 16.3% 1.9% 1.9%
Grade 11 62.6% 16.4% 10.0% 7.8% 3.2%
Grade 12 68.3% 17.4% 10.8% 3.0% 0.6%
Wish they could drop out of school?
All 51.9% 31.3% 11.6% 3.0% 2.2%
Grade 7 60.4% 24.9% 8.3% 3.2% 3.2%
Grade 8 59.1% 23.1% 12.5% 3.6% 1.8%
Grade 9 44.6% 35.6% 13.9% 3.0% 3.0%
Grade 10 55.1% 31.9% 9.7% 2.4% 1.0%
Grade 11 43.8% 35.5% 13.8% 4.6% 2.3%
Grade 12 47.9% 38.3% 10.8% 1.2% 1.8%
©Copyright 2010, Texas A&M University
All rights reserved.
Secondary Report-Page 50 of 127
8/7/2019 HIDALGO COUNTY - edcouch-elsa isd _ 2010 Texas School Survey of Drug and Alcohol Use
http://slidepdf.com/reader/full/hidalgo-county-edcouch-elsa-isd-2010-texas-school-survey-of-drug-and-alcohol 51/127
Edcouch-Elsa
SPRING 2010
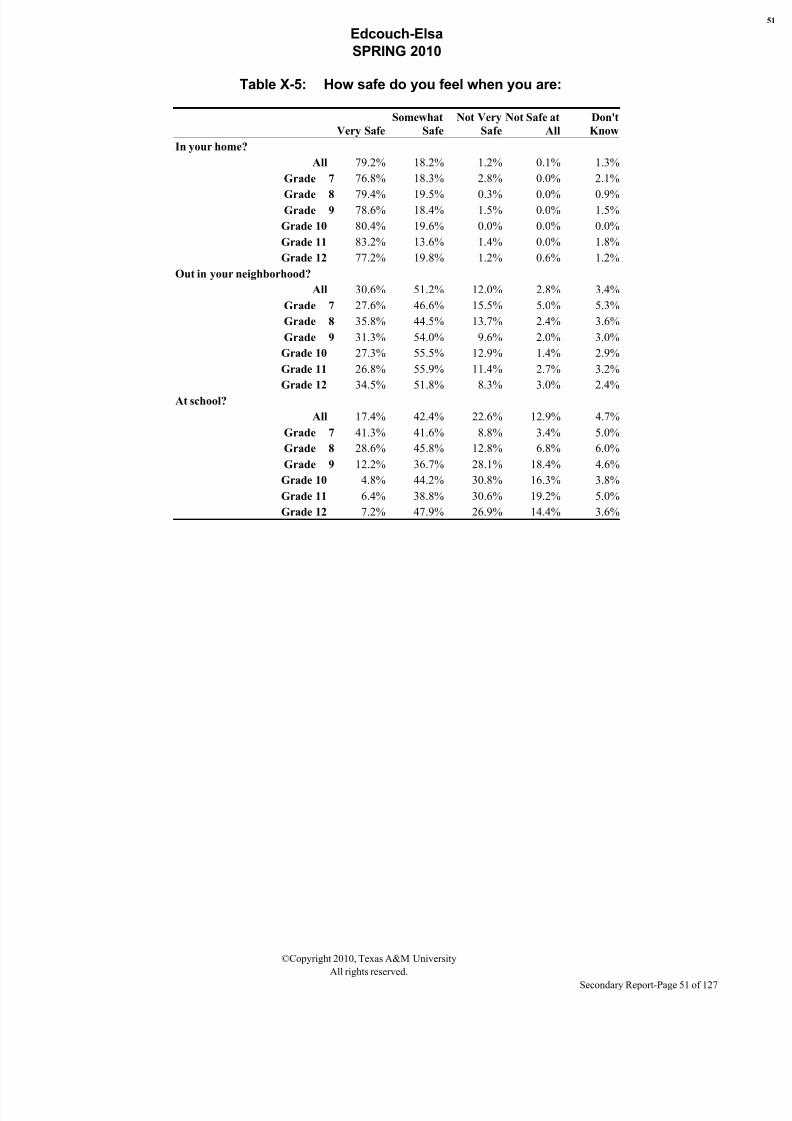
Table X-5: How safe do you feel when you are:
Very Safe
Somewhat
Safe
Not Very
Safe
Not Safe at
All
Don't
Know
In your home?
All 79.2% 18.2% 1.2% 0.1% 1.3%
Grade 7 76.8% 18.3% 2.8% 0.0% 2.1%
Grade 8 79.4% 19.5% 0.3% 0.0% 0.9%Grade 9 78.6% 18.4% 1.5% 0.0% 1.5%
Grade 10 80.4% 19.6% 0.0% 0.0% 0.0%
Grade 11 83.2% 13.6% 1.4% 0.0% 1.8%
Grade 12 77.2% 19.8% 1.2% 0.6% 1.2%
Out in your neighborhood?
All 30.6% 51.2% 12.0% 2.8% 3.4%
Grade 7 27.6% 46.6% 15.5% 5.0% 5.3%
Grade 8 35.8% 44.5% 13.7% 2.4% 3.6%
Grade 9 31.3% 54.0% 9.6% 2.0% 3.0%
Grade 10 27.3% 55.5% 12.9% 1.4% 2.9%
Grade 11 26.8% 55.9% 11.4% 2.7% 3.2%
Grade 12 34.5% 51.8% 8.3% 3.0% 2.4%
At school?
All 17.4% 42.4% 22.6% 12.9% 4.7%
Grade 7 41.3% 41.6% 8.8% 3.4% 5.0%
Grade 8 28.6% 45.8% 12.8% 6.8% 6.0%
Grade 9 12.2% 36.7% 28.1% 18.4% 4.6%
Grade 10 4.8% 44.2% 30.8% 16.3% 3.8%
Grade 11 6.4% 38.8% 30.6% 19.2% 5.0%
Grade 12 7.2% 47.9% 26.9% 14.4% 3.6%
©Copyright 2010, Texas A&M University
All rights reserved.
Secondary Report-Page 51 of 127
8/7/2019 HIDALGO COUNTY - edcouch-elsa isd _ 2010 Texas School Survey of Drug and Alcohol Use
http://slidepdf.com/reader/full/hidalgo-county-edcouch-elsa-isd-2010-texas-school-survey-of-drug-and-alcohol 52/127
Edcouch-Elsa
SPRING 2010
2. Prevalence Tables
©Copyright 2010, Texas A&M University
All rights reserved.
Secondary Report-Page 52 of 127

8/7/2019 HIDALGO COUNTY - edcouch-elsa isd _ 2010 Texas School Survey of Drug and Alcohol Use
http://slidepdf.com/reader/full/hidalgo-county-edcouch-elsa-isd-2010-texas-school-survey-of-drug-and-alcohol 53/127
Edcouch-Elsa
SPRING 2010
©Copyright 2010, Texas A&M University
All rights reserved.
Secondary Report-Page 53 of 127
8/7/2019 HIDALGO COUNTY - edcouch-elsa isd _ 2010 Texas School Survey of Drug and Alcohol Use
http://slidepdf.com/reader/full/hidalgo-county-edcouch-elsa-isd-2010-texas-school-survey-of-drug-and-alcohol 54/127
Edcouch-Elsa
SPRING 2010
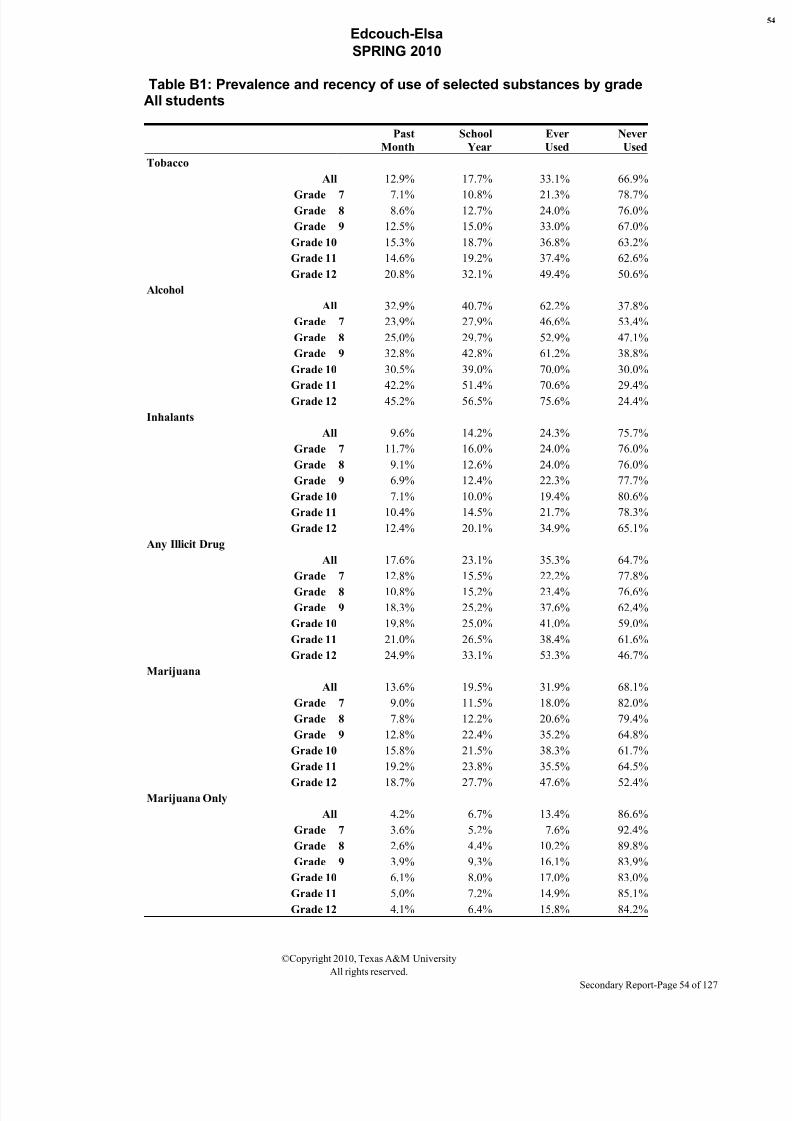
Table B1: Prevalence and recency of use of selected substances by gradeAll students
Past
Month
School
Year
Ever
Used
Never
Used
Tobacco
All 12.9% 17.7% 33.1% 66.9%
Grade 7 7.1% 10.8% 21.3% 78.7%Grade 8 8.6% 12.7% 24.0% 76.0%
Grade 9 12.5% 15.0% 33.0% 67.0%
Grade 10 15.3% 18.7% 36.8% 63.2%
Grade 11 14.6% 19.2% 37.4% 62.6%
Grade 12 20.8% 32.1% 49.4% 50.6%
Alcohol
All 32.9% 40.7% 62.2% 37.8%
Grade 7 23.9% 27.9% 46.6% 53.4%
Grade 8 25.0% 29.7% 52.9% 47.1%
Grade 9 32.8% 42.8% 61.2% 38.8%
Grade 10 30.5% 39.0% 70.0% 30.0%
Grade 11 42.2% 51.4% 70.6% 29.4%
Grade 12 45.2% 56.5% 75.6% 24.4%
Inhalants
All 9.6% 14.2% 24.3% 75.7%
Grade 7 11.7% 16.0% 24.0% 76.0%
Grade 8 9.1% 12.6% 24.0% 76.0%
Grade 9 6.9% 12.4% 22.3% 77.7%
Grade 10 7.1% 10.0% 19.4% 80.6%
Grade 11 10.4% 14.5% 21.7% 78.3%
Grade 12 12.4% 20.1% 34.9% 65.1%
Any Illicit Drug
All 17.6% 23.1% 35.3% 64.7%
Grade 7 12.8% 15.5% 22.2% 77.8%
Grade 8 10.8% 15.2% 23.4% 76.6%
Grade 9 18.3% 25.2% 37.6% 62.4%
Grade 10 19.8% 25.0% 41.0% 59.0%
Grade 11 21.0% 26.5% 38.4% 61.6%
Grade 12 24.9% 33.1% 53.3% 46.7%
Marijuana
All 13.6% 19.5% 31.9% 68.1%
Grade 7 9.0% 11.5% 18.0% 82.0%
Grade 8 7.8% 12.2% 20.6% 79.4%
Grade 9 12.8% 22.4% 35.2% 64.8%
Grade 10 15.8% 21.5% 38.3% 61.7%
Grade 11 19.2% 23.8% 35.5% 64.5%
Grade 12 18.7% 27.7% 47.6% 52.4%Marijuana Only
All 4.2% 6.7% 13.4% 86.6%
Grade 7 3.6% 5.2% 7.6% 92.4%
Grade 8 2.6% 4.4% 10.2% 89.8%
Grade 9 3.9% 9.3% 16.1% 83.9%
Grade 10 6.1% 8.0% 17.0% 83.0%
Grade 11 5.0% 7.2% 14.9% 85.1%
Grade 12 4.1% 6.4% 15.8% 84.2%
©Copyright 2010, Texas A&M University
All rights reserved.
Secondary Report-Page 54 of 127

8/7/2019 HIDALGO COUNTY - edcouch-elsa isd _ 2010 Texas School Survey of Drug and Alcohol Use
http://slidepdf.com/reader/full/hidalgo-county-edcouch-elsa-isd-2010-texas-school-survey-of-drug-and-alcohol 55/127
Edcouch-Elsa
SPRING 2010
©Copyright 2010, Texas A&M University
All rights reserved.
Secondary Report-Page 55 of 127
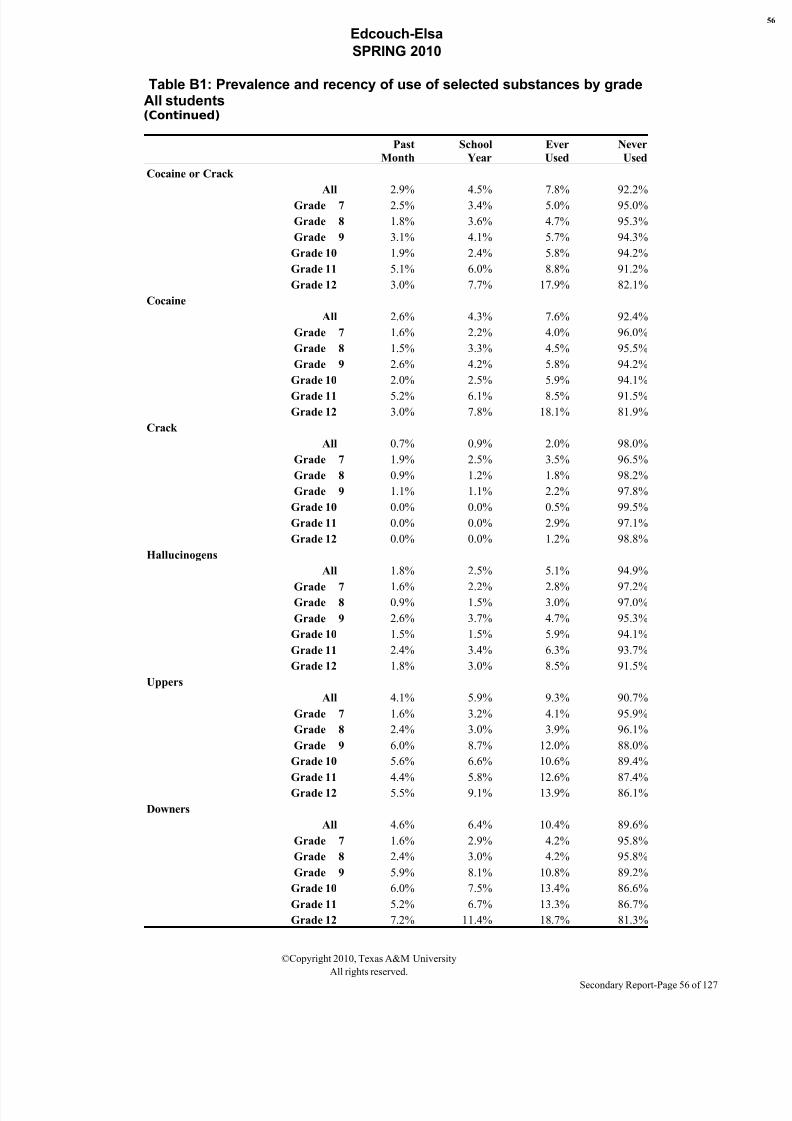
8/7/2019 HIDALGO COUNTY - edcouch-elsa isd _ 2010 Texas School Survey of Drug and Alcohol Use
http://slidepdf.com/reader/full/hidalgo-county-edcouch-elsa-isd-2010-texas-school-survey-of-drug-and-alcohol 56/127
Edcouch-Elsa
SPRING 2010
Table B1: Prevalence and recency of use of selected substances by gradeAll students(Continued)
Past
Month
School
Year
Ever
Used
Never
Used
Cocaine or Crack
All 2.9% 4.5% 7.8% 92.2%
Grade 7 2.5% 3.4% 5.0% 95.0%
Grade 8 1.8% 3.6% 4.7% 95.3%
Grade 9 3.1% 4.1% 5.7% 94.3%
Grade 10 1.9% 2.4% 5.8% 94.2%
Grade 11 5.1% 6.0% 8.8% 91.2%
Grade 12 3.0% 7.7% 17.9% 82.1%
Cocaine
All 2.6% 4.3% 7.6% 92.4%
Grade 7 1.6% 2.2% 4.0% 96.0%
Grade 8 1.5% 3.3% 4.5% 95.5%
Grade 9 2.6% 4.2% 5.8% 94.2%
Grade 10 2.0% 2.5% 5.9% 94.1%
Grade 11 5.2% 6.1% 8.5% 91.5%
Grade 12 3.0% 7.8% 18.1% 81.9%
Crack
All 0.7% 0.9% 2.0% 98.0%
Grade 7 1.9% 2.5% 3.5% 96.5%
Grade 8 0.9% 1.2% 1.8% 98.2%
Grade 9 1.1% 1.1% 2.2% 97.8%
Grade 10 0.0% 0.0% 0.5% 99.5%
Grade 11 0.0% 0.0% 2.9% 97.1%
Grade 12 0.0% 0.0% 1.2% 98.8%
Hallucinogens
All 1.8% 2.5% 5.1% 94.9%
Grade 7 1.6% 2.2% 2.8% 97.2%Grade 8 0.9% 1.5% 3.0% 97.0%
Grade 9 2.6% 3.7% 4.7% 95.3%
Grade 10 1.5% 1.5% 5.9% 94.1%
Grade 11 2.4% 3.4% 6.3% 93.7%
Grade 12 1.8% 3.0% 8.5% 91.5%
Uppers
All 4.1% 5.9% 9.3% 90.7%
Grade 7 1.6% 3.2% 4.1% 95.9%
Grade 8 2.4% 3.0% 3.9% 96.1%
Grade 9 6.0% 8.7% 12.0% 88.0%
Grade 10 5.6% 6.6% 10.6% 89.4%
Grade 11 4.4% 5.8% 12.6% 87.4%
Grade 12 5.5% 9.1% 13.9% 86.1%
Downers
All 4.6% 6.4% 10.4% 89.6%
Grade 7 1.6% 2.9% 4.2% 95.8%
Grade 8 2.4% 3.0% 4.2% 95.8%
Grade 9 5.9% 8.1% 10.8% 89.2%
Grade 10 6.0% 7.5% 13.4% 86.6%
Grade 11 5.2% 6.7% 13.3% 86.7%
Grade 12 7.2% 11.4% 18.7% 81.3%
©Copyright 2010, Texas A&M University
All rights reserved.
Secondary Report-Page 56 of 127
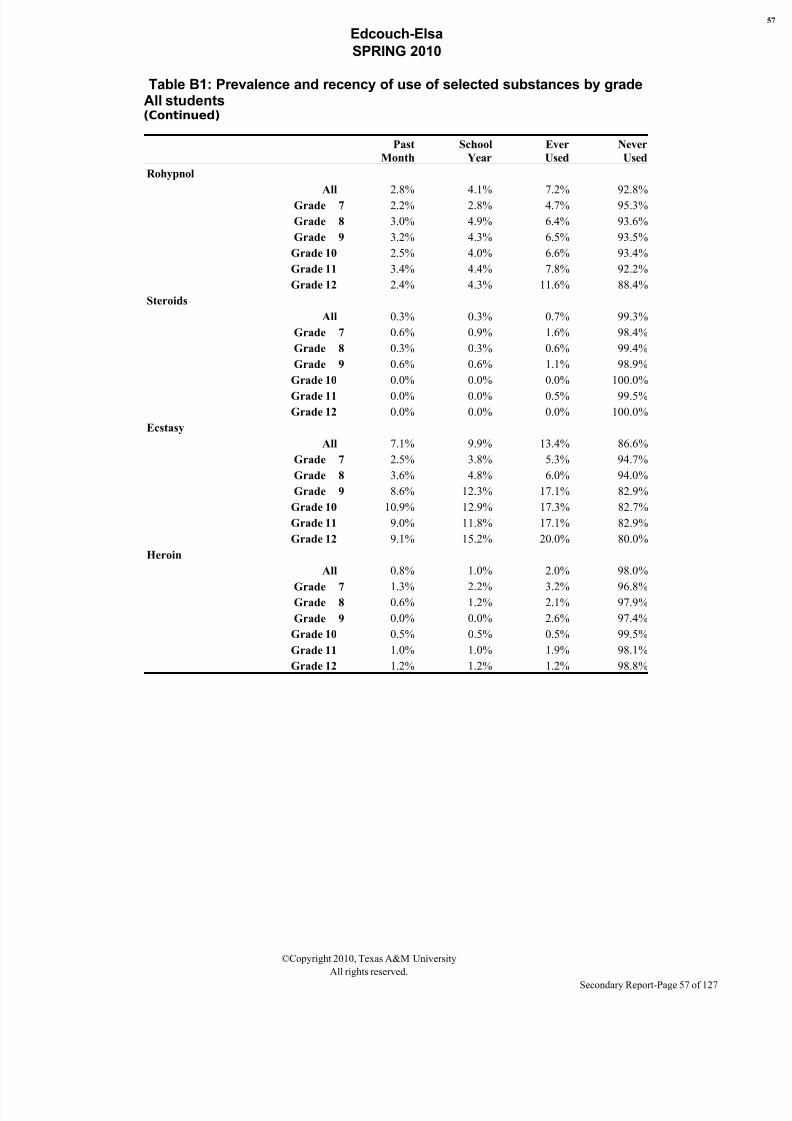
8/7/2019 HIDALGO COUNTY - edcouch-elsa isd _ 2010 Texas School Survey of Drug and Alcohol Use
http://slidepdf.com/reader/full/hidalgo-county-edcouch-elsa-isd-2010-texas-school-survey-of-drug-and-alcohol 57/127
Edcouch-Elsa
SPRING 2010
Table B1: Prevalence and recency of use of selected substances by gradeAll students(Continued)
Past
Month
School
Year
Ever
Used
Never
Used
Rohypnol
All 2.8% 4.1% 7.2% 92.8%
Grade 7 2.2% 2.8% 4.7% 95.3%
Grade 8 3.0% 4.9% 6.4% 93.6%
Grade 9 3.2% 4.3% 6.5% 93.5%
Grade 10 2.5% 4.0% 6.6% 93.4%
Grade 11 3.4% 4.4% 7.8% 92.2%
Grade 12 2.4% 4.3% 11.6% 88.4%
Steroids
All 0.3% 0.3% 0.7% 99.3%
Grade 7 0.6% 0.9% 1.6% 98.4%
Grade 8 0.3% 0.3% 0.6% 99.4%
Grade 9 0.6% 0.6% 1.1% 98.9%
Grade 10 0.0% 0.0% 0.0% 100.0%
Grade 11 0.0% 0.0% 0.5% 99.5%
Grade 12 0.0% 0.0% 0.0% 100.0%
Ecstasy
All 7.1% 9.9% 13.4% 86.6%
Grade 7 2.5% 3.8% 5.3% 94.7%
Grade 8 3.6% 4.8% 6.0% 94.0%
Grade 9 8.6% 12.3% 17.1% 82.9%
Grade 10 10.9% 12.9% 17.3% 82.7%
Grade 11 9.0% 11.8% 17.1% 82.9%
Grade 12 9.1% 15.2% 20.0% 80.0%
Heroin
All 0.8% 1.0% 2.0% 98.0%
Grade 7 1.3% 2.2% 3.2% 96.8%Grade 8 0.6% 1.2% 2.1% 97.9%
Grade 9 0.0% 0.0% 2.6% 97.4%
Grade 10 0.5% 0.5% 0.5% 99.5%
Grade 11 1.0% 1.0% 1.9% 98.1%
Grade 12 1.2% 1.2% 1.2% 98.8%
©Copyright 2010, Texas A&M University
All rights reserved.
Secondary Report-Page 57 of 127

8/7/2019 HIDALGO COUNTY - edcouch-elsa isd _ 2010 Texas School Survey of Drug and Alcohol Use
http://slidepdf.com/reader/full/hidalgo-county-edcouch-elsa-isd-2010-texas-school-survey-of-drug-and-alcohol 58/127
Edcouch-Elsa
SPRING 2010
Table B2: Prevalence and recency of use of selected substances by gradeMale students
Past
Month
School
Year
Ever
Used
Never
Used
Tobacco
All 13.8% 19.6% 34.4% 65.6%
Grade 7 6.8% 11.6% 20.5% 79.5%Grade 8 8.2% 13.2% 26.4% 73.6%
Grade 9 13.6% 16.0% 39.5% 60.5%
Grade 10 15.1% 19.4% 37.6% 62.4%
Grade 11 16.3% 24.5% 40.8% 59.2%
Grade 12 27.9% 39.3% 47.5% 52.5%
Alcohol
All 30.6% 37.6% 56.9% 43.1%
Grade 7 23.3% 28.1% 41.1% 58.9%
Grade 8 23.0% 26.7% 50.9% 49.1%
Grade 9 30.5% 41.5% 58.5% 41.5%
Grade 10 29.8% 39.4% 68.1% 31.9%
Grade 11 37.1% 46.4% 62.9% 37.1%
Grade 12 45.9% 49.2% 65.6% 34.4%
Inhalants
All 7.5% 10.6% 20.1% 79.9%
Grade 7 7.5% 12.3% 19.9% 80.1%
Grade 8 4.3% 5.6% 17.3% 82.7%
Grade 9 8.6% 9.9% 18.5% 81.5%
Grade 10 4.2% 8.3% 16.7% 83.3%
Grade 11 9.0% 11.0% 19.0% 81.0%
Grade 12 12.9% 19.4% 32.3% 67.7%
Any Illicit Drug
All 19.6% 25.4% 34.7% 65.3%
Grade 7 14.9% 18.2% 25.7% 74.3%
Grade 8 8.0% 13.0% 22.2% 77.8%
Grade 9 20.5% 27.7% 37.3% 62.7%
Grade 10 21.9% 28.1% 39.6% 60.4%
Grade 11 23.5% 29.6% 37.8% 62.2%
Grade 12 35.5% 43.5% 53.2% 46.8%
Marijuana
All 15.2% 21.6% 31.7% 68.3%
Grade 7 11.0% 13.8% 21.4% 78.6%
Grade 8 6.2% 10.6% 19.9% 80.1%
Grade 9 11.1% 23.5% 35.8% 64.2%
Grade 10 19.1% 26.6% 38.3% 61.7%
Grade 11 22.1% 28.4% 35.8% 64.2%
Grade 12 26.7% 33.3% 46.7% 53.3%Marijuana Only
All 5.1% 8.3% 13.6% 86.4%
Grade 7 5.4% 7.4% 10.1% 89.9%
Grade 8 1.9% 3.7% 10.5% 89.5%
Grade 9 4.8% 11.9% 17.9% 82.1%
Grade 10 6.3% 8.3% 15.6% 84.4%
Grade 11 6.0% 9.0% 13.0% 87.0%
Grade 12 7.9% 11.1% 15.9% 84.1%
©Copyright 2010, Texas A&M University
All rights reserved.
Secondary Report-Page 58 of 127

8/7/2019 HIDALGO COUNTY - edcouch-elsa isd _ 2010 Texas School Survey of Drug and Alcohol Use
http://slidepdf.com/reader/full/hidalgo-county-edcouch-elsa-isd-2010-texas-school-survey-of-drug-and-alcohol 59/127
Edcouch-Elsa
SPRING 2010
©Copyright 2010, Texas A&M University
All rights reserved.
Secondary Report-Page 59 of 127
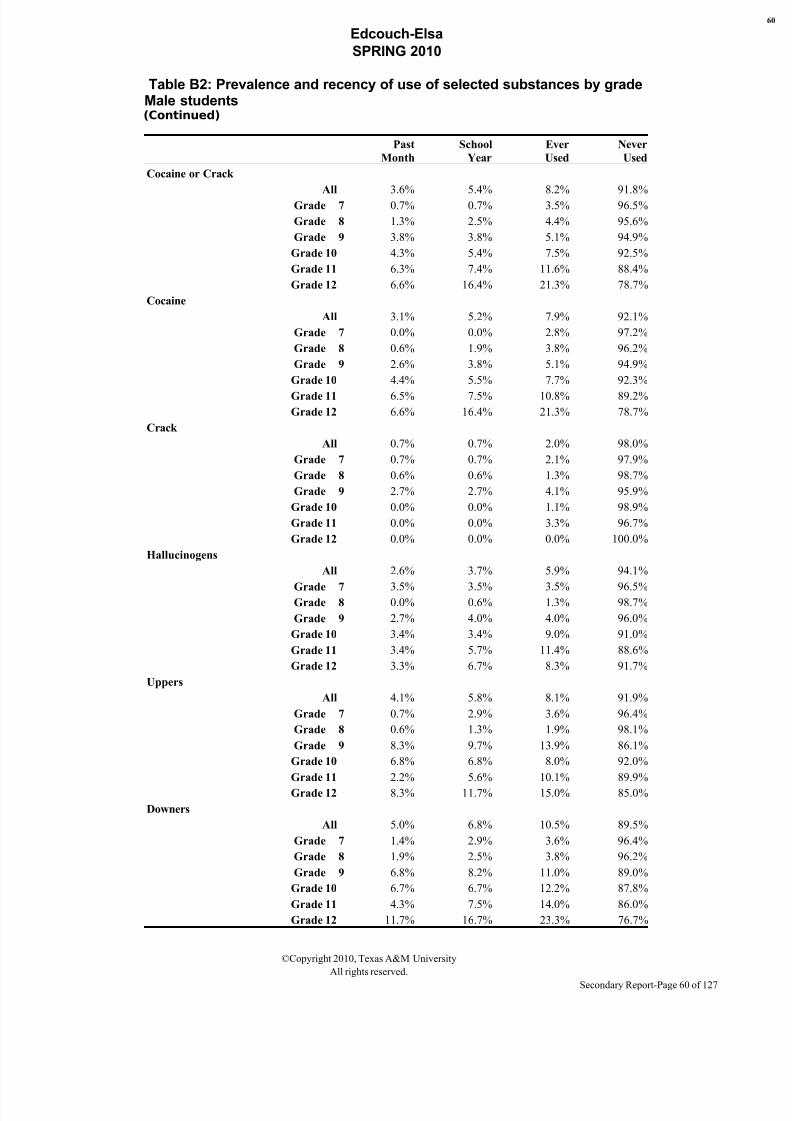
8/7/2019 HIDALGO COUNTY - edcouch-elsa isd _ 2010 Texas School Survey of Drug and Alcohol Use
http://slidepdf.com/reader/full/hidalgo-county-edcouch-elsa-isd-2010-texas-school-survey-of-drug-and-alcohol 60/127
Edcouch-Elsa
SPRING 2010
Table B2: Prevalence and recency of use of selected substances by gradeMale students(Continued)
Past
Month
School
Year
Ever
Used
Never
Used
Cocaine or Crack
All 3.6% 5.4% 8.2% 91.8%
Grade 7 0.7% 0.7% 3.5% 96.5%
Grade 8 1.3% 2.5% 4.4% 95.6%
Grade 9 3.8% 3.8% 5.1% 94.9%
Grade 10 4.3% 5.4% 7.5% 92.5%
Grade 11 6.3% 7.4% 11.6% 88.4%
Grade 12 6.6% 16.4% 21.3% 78.7%
Cocaine
All 3.1% 5.2% 7.9% 92.1%
Grade 7 0.0% 0.0% 2.8% 97.2%
Grade 8 0.6% 1.9% 3.8% 96.2%
Grade 9 2.6% 3.8% 5.1% 94.9%
Grade 10 4.4% 5.5% 7.7% 92.3%
Grade 11 6.5% 7.5% 10.8% 89.2%
Grade 12 6.6% 16.4% 21.3% 78.7%
Crack
All 0.7% 0.7% 2.0% 98.0%
Grade 7 0.7% 0.7% 2.1% 97.9%
Grade 8 0.6% 0.6% 1.3% 98.7%
Grade 9 2.7% 2.7% 4.1% 95.9%
Grade 10 0.0% 0.0% 1.1% 98.9%
Grade 11 0.0% 0.0% 3.3% 96.7%
Grade 12 0.0% 0.0% 0.0% 100.0%
Hallucinogens
All 2.6% 3.7% 5.9% 94.1%
Grade 7 3.5% 3.5% 3.5% 96.5%Grade 8 0.0% 0.6% 1.3% 98.7%
Grade 9 2.7% 4.0% 4.0% 96.0%
Grade 10 3.4% 3.4% 9.0% 91.0%
Grade 11 3.4% 5.7% 11.4% 88.6%
Grade 12 3.3% 6.7% 8.3% 91.7%
Uppers
All 4.1% 5.8% 8.1% 91.9%
Grade 7 0.7% 2.9% 3.6% 96.4%
Grade 8 0.6% 1.3% 1.9% 98.1%
Grade 9 8.3% 9.7% 13.9% 86.1%
Grade 10 6.8% 6.8% 8.0% 92.0%
Grade 11 2.2% 5.6% 10.1% 89.9%
Grade 12 8.3% 11.7% 15.0% 85.0%
Downers
All 5.0% 6.8% 10.5% 89.5%
Grade 7 1.4% 2.9% 3.6% 96.4%
Grade 8 1.9% 2.5% 3.8% 96.2%
Grade 9 6.8% 8.2% 11.0% 89.0%
Grade 10 6.7% 6.7% 12.2% 87.8%
Grade 11 4.3% 7.5% 14.0% 86.0%
Grade 12 11.7% 16.7% 23.3% 76.7%
©Copyright 2010, Texas A&M University
All rights reserved.
Secondary Report-Page 60 of 127
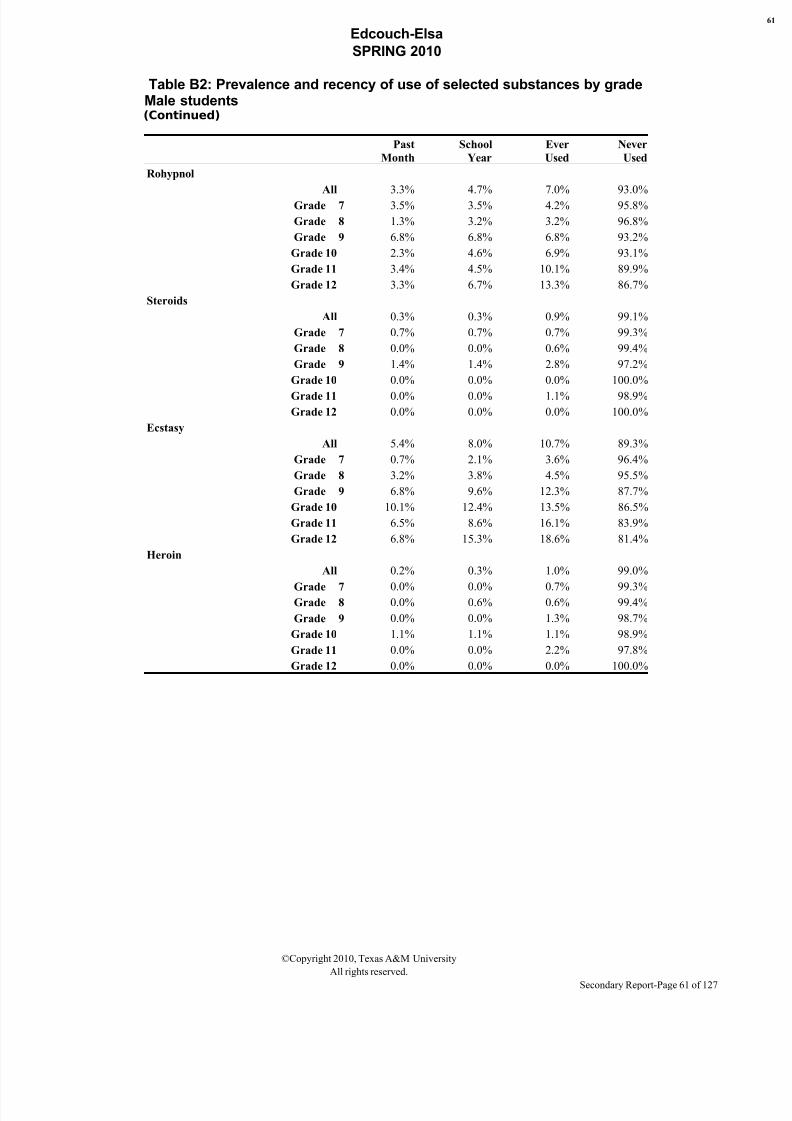
8/7/2019 HIDALGO COUNTY - edcouch-elsa isd _ 2010 Texas School Survey of Drug and Alcohol Use
http://slidepdf.com/reader/full/hidalgo-county-edcouch-elsa-isd-2010-texas-school-survey-of-drug-and-alcohol 61/127
Edcouch-Elsa
SPRING 2010
Table B2: Prevalence and recency of use of selected substances by gradeMale students(Continued)
Past
Month
School
Year
Ever
Used
Never
Used
Rohypnol
All 3.3% 4.7% 7.0% 93.0%
Grade 7 3.5% 3.5% 4.2% 95.8%
Grade 8 1.3% 3.2% 3.2% 96.8%
Grade 9 6.8% 6.8% 6.8% 93.2%
Grade 10 2.3% 4.6% 6.9% 93.1%
Grade 11 3.4% 4.5% 10.1% 89.9%
Grade 12 3.3% 6.7% 13.3% 86.7%
Steroids
All 0.3% 0.3% 0.9% 99.1%
Grade 7 0.7% 0.7% 0.7% 99.3%
Grade 8 0.0% 0.0% 0.6% 99.4%
Grade 9 1.4% 1.4% 2.8% 97.2%
Grade 10 0.0% 0.0% 0.0% 100.0%
Grade 11 0.0% 0.0% 1.1% 98.9%
Grade 12 0.0% 0.0% 0.0% 100.0%
Ecstasy
All 5.4% 8.0% 10.7% 89.3%
Grade 7 0.7% 2.1% 3.6% 96.4%
Grade 8 3.2% 3.8% 4.5% 95.5%
Grade 9 6.8% 9.6% 12.3% 87.7%
Grade 10 10.1% 12.4% 13.5% 86.5%
Grade 11 6.5% 8.6% 16.1% 83.9%
Grade 12 6.8% 15.3% 18.6% 81.4%
Heroin
All 0.2% 0.3% 1.0% 99.0%
Grade 7 0.0% 0.0% 0.7% 99.3%Grade 8 0.0% 0.6% 0.6% 99.4%
Grade 9 0.0% 0.0% 1.3% 98.7%
Grade 10 1.1% 1.1% 1.1% 98.9%
Grade 11 0.0% 0.0% 2.2% 97.8%
Grade 12 0.0% 0.0% 0.0% 100.0%
©Copyright 2010, Texas A&M University
All rights reserved.
Secondary Report-Page 61 of 127

8/7/2019 HIDALGO COUNTY - edcouch-elsa isd _ 2010 Texas School Survey of Drug and Alcohol Use
http://slidepdf.com/reader/full/hidalgo-county-edcouch-elsa-isd-2010-texas-school-survey-of-drug-and-alcohol 62/127
Edcouch-Elsa
SPRING 2010
Table B3: Prevalence and recency of use of selected substances by gradeFemale students
Past
Month
School
Year
Ever
Used
Never
Used
Tobacco
All 12.1% 16.1% 32.1% 67.9%
Grade 7 7.3% 10.1% 21.9% 78.1%Grade 8 9.0% 12.4% 21.9% 78.1%
Grade 9 11.8% 14.3% 28.6% 71.4%
Grade 10 15.7% 18.3% 36.5% 63.5%
Grade 11 13.2% 14.9% 34.7% 65.3%
Grade 12 16.0% 27.4% 50.0% 50.0%
Alcohol
All 34.6% 43.1% 66.3% 33.7%
Grade 7 24.6% 27.9% 51.4% 48.6%
Grade 8 27.0% 32.6% 55.1% 44.9%
Grade 9 34.5% 43.7% 63.0% 37.0%
Grade 10 31.3% 39.1% 72.2% 27.8%
Grade 11 46.3% 55.4% 76.9% 23.1%
Grade 12 44.3% 60.4% 81.1% 18.9%
Inhalants
All 11.1% 16.9% 27.5% 72.5%
Grade 7 15.2% 19.1% 27.5% 72.5%
Grade 8 13.4% 19.0% 30.2% 69.8%
Grade 9 5.8% 14.0% 24.8% 75.2%
Grade 10 9.6% 11.4% 21.9% 78.1%
Grade 11 11.6% 17.4% 24.0% 76.0%
Grade 12 11.3% 19.8% 35.8% 64.2%
Any Illicit Drug
All 16.0% 21.1% 35.8% 64.2%
Grade 7 11.1% 13.3% 19.4% 80.6%
Grade 8 13.4% 17.3% 24.6% 75.4%
Grade 9 16.8% 23.5% 37.8% 62.2%
Grade 10 18.3% 22.6% 42.6% 57.4%
Grade 11 19.0% 24.0% 38.8% 61.2%
Grade 12 17.9% 26.4% 52.8% 47.2%
Marijuana
All 12.2% 17.8% 32.0% 68.0%
Grade 7 7.3% 9.6% 15.2% 84.8%
Grade 8 9.2% 13.9% 21.4% 78.6%
Grade 9 13.9% 21.7% 34.8% 65.2%
Grade 10 13.2% 17.5% 38.6% 61.4%
Grade 11 16.8% 20.2% 35.3% 64.7%
Grade 12 13.3% 23.8% 47.6% 52.4%Marijuana Only
All 3.4% 5.5% 13.4% 86.6%
Grade 7 2.2% 3.3% 5.6% 94.4%
Grade 8 3.4% 5.0% 10.1% 89.9%
Grade 9 3.3% 7.4% 14.9% 85.1%
Grade 10 6.1% 7.8% 18.3% 81.7%
Grade 11 4.1% 5.8% 16.5% 83.5%
Grade 12 1.9% 3.7% 15.9% 84.1%
©Copyright 2010, Texas A&M University
All rights reserved.
Secondary Report-Page 62 of 127

8/7/2019 HIDALGO COUNTY - edcouch-elsa isd _ 2010 Texas School Survey of Drug and Alcohol Use
http://slidepdf.com/reader/full/hidalgo-county-edcouch-elsa-isd-2010-texas-school-survey-of-drug-and-alcohol 63/127
Edcouch-Elsa
SPRING 2010
©Copyright 2010, Texas A&M University
All rights reserved.
Secondary Report-Page 63 of 127
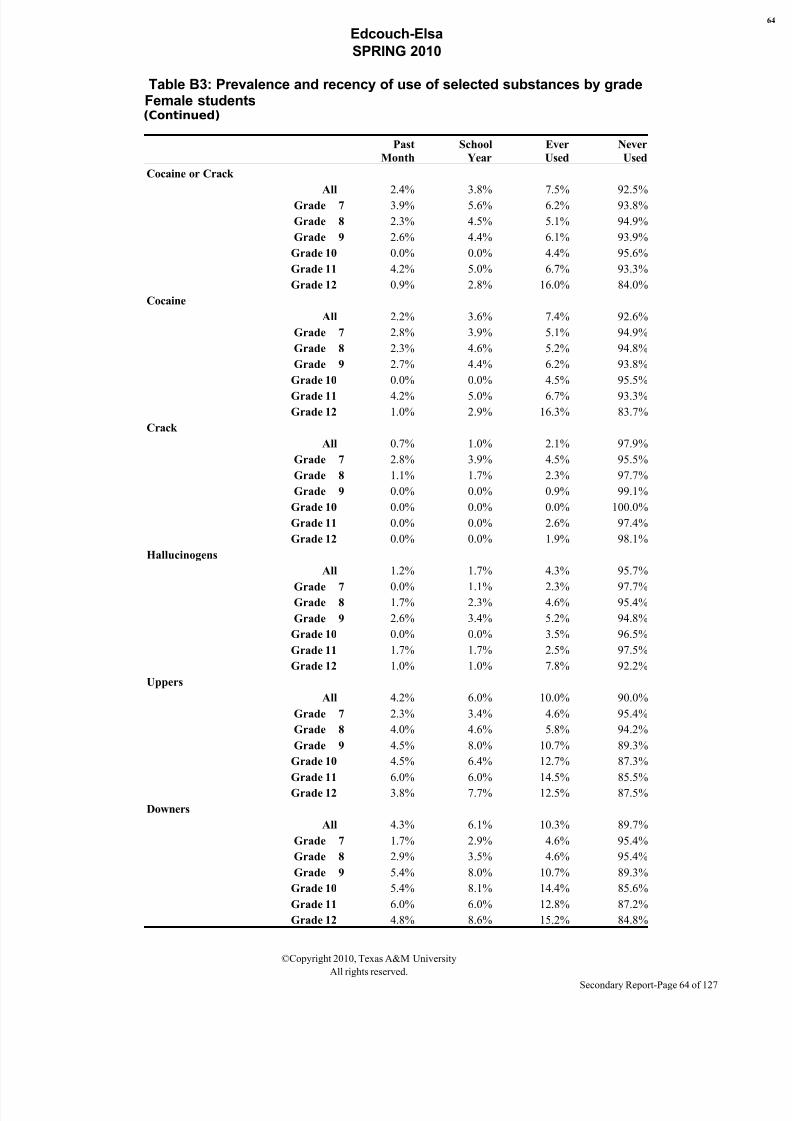
8/7/2019 HIDALGO COUNTY - edcouch-elsa isd _ 2010 Texas School Survey of Drug and Alcohol Use
http://slidepdf.com/reader/full/hidalgo-county-edcouch-elsa-isd-2010-texas-school-survey-of-drug-and-alcohol 64/127
Edcouch-Elsa
SPRING 2010
Table B3: Prevalence and recency of use of selected substances by gradeFemale students(Continued)
Past
Month
School
Year
Ever
Used
Never
Used
Cocaine or Crack
All 2.4% 3.8% 7.5% 92.5%
Grade 7 3.9% 5.6% 6.2% 93.8%
Grade 8 2.3% 4.5% 5.1% 94.9%
Grade 9 2.6% 4.4% 6.1% 93.9%
Grade 10 0.0% 0.0% 4.4% 95.6%
Grade 11 4.2% 5.0% 6.7% 93.3%
Grade 12 0.9% 2.8% 16.0% 84.0%
Cocaine
All 2.2% 3.6% 7.4% 92.6%
Grade 7 2.8% 3.9% 5.1% 94.9%
Grade 8 2.3% 4.6% 5.2% 94.8%
Grade 9 2.7% 4.4% 6.2% 93.8%
Grade 10 0.0% 0.0% 4.5% 95.5%
Grade 11 4.2% 5.0% 6.7% 93.3%
Grade 12 1.0% 2.9% 16.3% 83.7%
Crack
All 0.7% 1.0% 2.1% 97.9%
Grade 7 2.8% 3.9% 4.5% 95.5%
Grade 8 1.1% 1.7% 2.3% 97.7%
Grade 9 0.0% 0.0% 0.9% 99.1%
Grade 10 0.0% 0.0% 0.0% 100.0%
Grade 11 0.0% 0.0% 2.6% 97.4%
Grade 12 0.0% 0.0% 1.9% 98.1%
Hallucinogens
All 1.2% 1.7% 4.3% 95.7%
Grade 7 0.0% 1.1% 2.3% 97.7%Grade 8 1.7% 2.3% 4.6% 95.4%
Grade 9 2.6% 3.4% 5.2% 94.8%
Grade 10 0.0% 0.0% 3.5% 96.5%
Grade 11 1.7% 1.7% 2.5% 97.5%
Grade 12 1.0% 1.0% 7.8% 92.2%
Uppers
All 4.2% 6.0% 10.0% 90.0%
Grade 7 2.3% 3.4% 4.6% 95.4%
Grade 8 4.0% 4.6% 5.8% 94.2%
Grade 9 4.5% 8.0% 10.7% 89.3%
Grade 10 4.5% 6.4% 12.7% 87.3%
Grade 11 6.0% 6.0% 14.5% 85.5%
Grade 12 3.8% 7.7% 12.5% 87.5%
Downers
All 4.3% 6.1% 10.3% 89.7%
Grade 7 1.7% 2.9% 4.6% 95.4%
Grade 8 2.9% 3.5% 4.6% 95.4%
Grade 9 5.4% 8.0% 10.7% 89.3%
Grade 10 5.4% 8.1% 14.4% 85.6%
Grade 11 6.0% 6.0% 12.8% 87.2%
Grade 12 4.8% 8.6% 15.2% 84.8%
©Copyright 2010, Texas A&M University
All rights reserved.
Secondary Report-Page 64 of 127
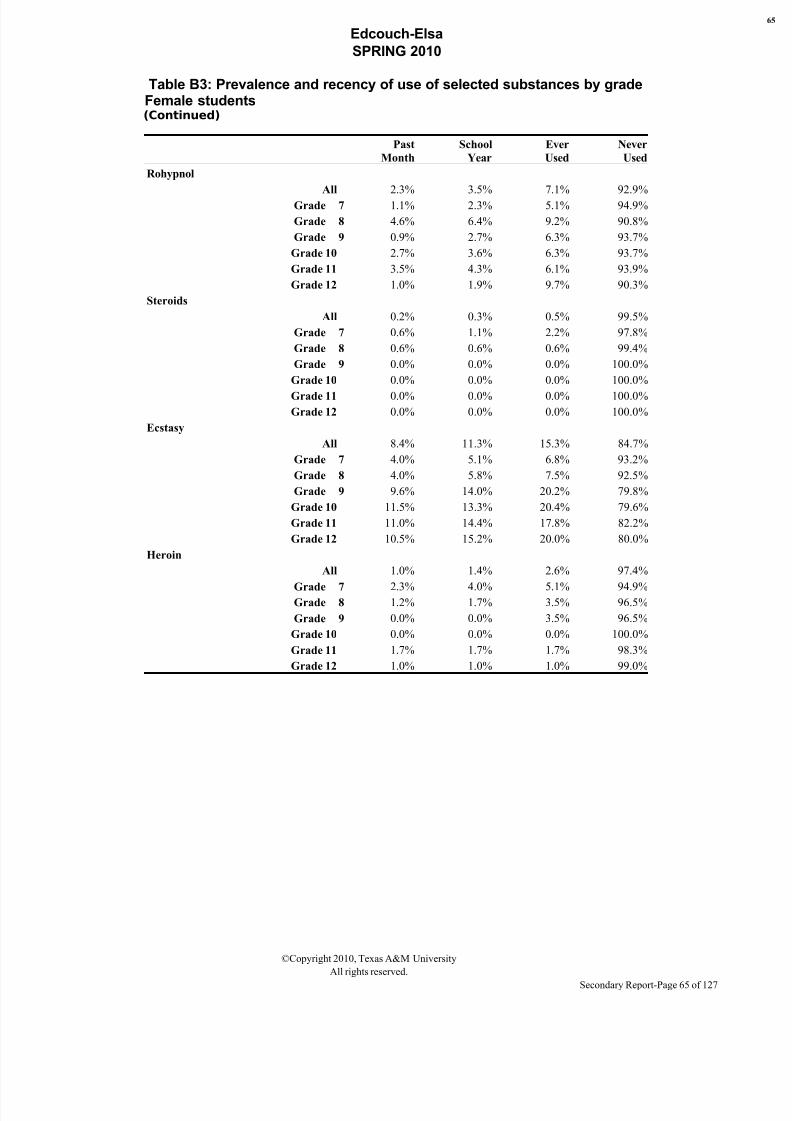
8/7/2019 HIDALGO COUNTY - edcouch-elsa isd _ 2010 Texas School Survey of Drug and Alcohol Use
http://slidepdf.com/reader/full/hidalgo-county-edcouch-elsa-isd-2010-texas-school-survey-of-drug-and-alcohol 65/127
Edcouch-Elsa
SPRING 2010
Table B3: Prevalence and recency of use of selected substances by gradeFemale students(Continued)
Past
Month
School
Year
Ever
Used
Never
Used
Rohypnol
All 2.3% 3.5% 7.1% 92.9%
Grade 7 1.1% 2.3% 5.1% 94.9%
Grade 8 4.6% 6.4% 9.2% 90.8%
Grade 9 0.9% 2.7% 6.3% 93.7%
Grade 10 2.7% 3.6% 6.3% 93.7%
Grade 11 3.5% 4.3% 6.1% 93.9%
Grade 12 1.0% 1.9% 9.7% 90.3%
Steroids
All 0.2% 0.3% 0.5% 99.5%
Grade 7 0.6% 1.1% 2.2% 97.8%
Grade 8 0.6% 0.6% 0.6% 99.4%
Grade 9 0.0% 0.0% 0.0% 100.0%
Grade 10 0.0% 0.0% 0.0% 100.0%
Grade 11 0.0% 0.0% 0.0% 100.0%
Grade 12 0.0% 0.0% 0.0% 100.0%
Ecstasy
All 8.4% 11.3% 15.3% 84.7%
Grade 7 4.0% 5.1% 6.8% 93.2%
Grade 8 4.0% 5.8% 7.5% 92.5%
Grade 9 9.6% 14.0% 20.2% 79.8%
Grade 10 11.5% 13.3% 20.4% 79.6%
Grade 11 11.0% 14.4% 17.8% 82.2%
Grade 12 10.5% 15.2% 20.0% 80.0%
Heroin
All 1.0% 1.4% 2.6% 97.4%
Grade 7 2.3% 4.0% 5.1% 94.9%Grade 8 1.2% 1.7% 3.5% 96.5%
Grade 9 0.0% 0.0% 3.5% 96.5%
Grade 10 0.0% 0.0% 0.0% 100.0%
Grade 11 1.7% 1.7% 1.7% 98.3%
Grade 12 1.0% 1.0% 1.0% 99.0%
©Copyright 2010, Texas A&M University
All rights reserved.
Secondary Report-Page 65 of 127
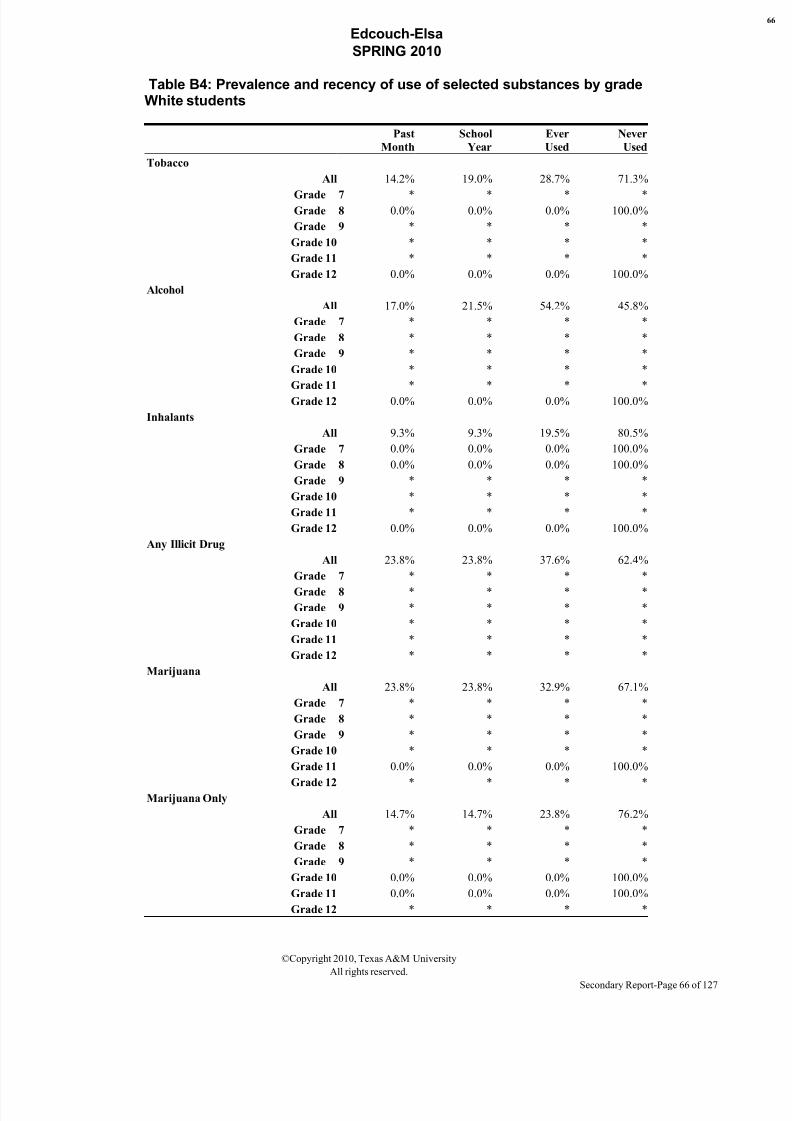
8/7/2019 HIDALGO COUNTY - edcouch-elsa isd _ 2010 Texas School Survey of Drug and Alcohol Use
http://slidepdf.com/reader/full/hidalgo-county-edcouch-elsa-isd-2010-texas-school-survey-of-drug-and-alcohol 66/127
Edcouch-Elsa
SPRING 2010
Table B4: Prevalence and recency of use of selected substances by gradeWhite students
Past
Month
School
Year
Ever
Used
Never
Used
Tobacco
All 14.2% 19.0% 28.7% 71.3%
Grade 7 * * * *Grade 8 0.0% 0.0% 0.0% 100.0%
Grade 9 * * * *
Grade 10 * * * *
Grade 11 * * * *
Grade 12 0.0% 0.0% 0.0% 100.0%
Alcohol
All 17.0% 21.5% 54.2% 45.8%
Grade 7 * * * *
Grade 8 * * * *
Grade 9 * * * *
Grade 10 * * * *
Grade 11 * * * *
Grade 12 0.0% 0.0% 0.0% 100.0%
Inhalants
All 9.3% 9.3% 19.5% 80.5%
Grade 7 0.0% 0.0% 0.0% 100.0%
Grade 8 0.0% 0.0% 0.0% 100.0%
Grade 9 * * * *
Grade 10 * * * *
Grade 11 * * * *
Grade 12 0.0% 0.0% 0.0% 100.0%
Any Illicit Drug
All 23.8% 23.8% 37.6% 62.4%
Grade 7 * * * *
Grade 8 * * * *
Grade 9 * * * *
Grade 10 * * * *
Grade 11 * * * *
Grade 12 * * * *
Marijuana
All 23.8% 23.8% 32.9% 67.1%
Grade 7 * * * *
Grade 8 * * * *
Grade 9 * * * *
Grade 10 * * * *
Grade 11 0.0% 0.0% 0.0% 100.0%
Grade 12 * * * *Marijuana Only
All 14.7% 14.7% 23.8% 76.2%
Grade 7 * * * *
Grade 8 * * * *
Grade 9 * * * *
Grade 10 0.0% 0.0% 0.0% 100.0%
Grade 11 0.0% 0.0% 0.0% 100.0%
Grade 12 * * * *
©Copyright 2010, Texas A&M University
All rights reserved.
Secondary Report-Page 66 of 127

8/7/2019 HIDALGO COUNTY - edcouch-elsa isd _ 2010 Texas School Survey of Drug and Alcohol Use
http://slidepdf.com/reader/full/hidalgo-county-edcouch-elsa-isd-2010-texas-school-survey-of-drug-and-alcohol 67/127
Edcouch-Elsa
SPRING 2010
©Copyright 2010, Texas A&M University
All rights reserved.
Secondary Report-Page 67 of 127
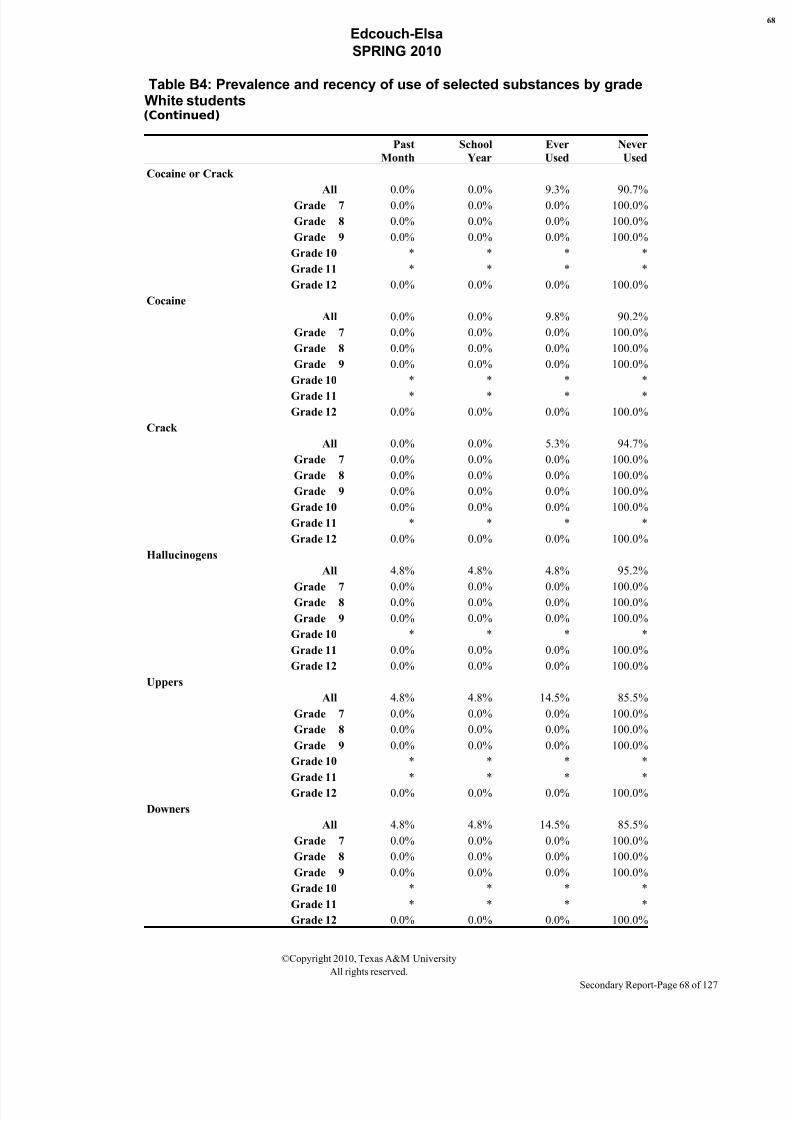
8/7/2019 HIDALGO COUNTY - edcouch-elsa isd _ 2010 Texas School Survey of Drug and Alcohol Use
http://slidepdf.com/reader/full/hidalgo-county-edcouch-elsa-isd-2010-texas-school-survey-of-drug-and-alcohol 68/127
Edcouch-Elsa
SPRING 2010
Table B4: Prevalence and recency of use of selected substances by gradeWhite students(Continued)
Past
Month
School
Year
Ever
Used
Never
Used
Cocaine or Crack
All 0.0% 0.0% 9.3% 90.7%
Grade 7 0.0% 0.0% 0.0% 100.0%
Grade 8 0.0% 0.0% 0.0% 100.0%
Grade 9 0.0% 0.0% 0.0% 100.0%
Grade 10 * * * *
Grade 11 * * * *
Grade 12 0.0% 0.0% 0.0% 100.0%
Cocaine
All 0.0% 0.0% 9.8% 90.2%
Grade 7 0.0% 0.0% 0.0% 100.0%
Grade 8 0.0% 0.0% 0.0% 100.0%
Grade 9 0.0% 0.0% 0.0% 100.0%
Grade 10 * * * *
Grade 11 * * * *
Grade 12 0.0% 0.0% 0.0% 100.0%
Crack
All 0.0% 0.0% 5.3% 94.7%
Grade 7 0.0% 0.0% 0.0% 100.0%
Grade 8 0.0% 0.0% 0.0% 100.0%
Grade 9 0.0% 0.0% 0.0% 100.0%
Grade 10 0.0% 0.0% 0.0% 100.0%
Grade 11 * * * *
Grade 12 0.0% 0.0% 0.0% 100.0%
Hallucinogens
All 4.8% 4.8% 4.8% 95.2%
Grade 7 0.0% 0.0% 0.0% 100.0%Grade 8 0.0% 0.0% 0.0% 100.0%
Grade 9 0.0% 0.0% 0.0% 100.0%
Grade 10 * * * *
Grade 11 0.0% 0.0% 0.0% 100.0%
Grade 12 0.0% 0.0% 0.0% 100.0%
Uppers
All 4.8% 4.8% 14.5% 85.5%
Grade 7 0.0% 0.0% 0.0% 100.0%
Grade 8 0.0% 0.0% 0.0% 100.0%
Grade 9 0.0% 0.0% 0.0% 100.0%
Grade 10 * * * *
Grade 11 * * * *
Grade 12 0.0% 0.0% 0.0% 100.0%
Downers
All 4.8% 4.8% 14.5% 85.5%
Grade 7 0.0% 0.0% 0.0% 100.0%
Grade 8 0.0% 0.0% 0.0% 100.0%
Grade 9 0.0% 0.0% 0.0% 100.0%
Grade 10 * * * *
Grade 11 * * * *
Grade 12 0.0% 0.0% 0.0% 100.0%
©Copyright 2010, Texas A&M University
All rights reserved.
Secondary Report-Page 68 of 127
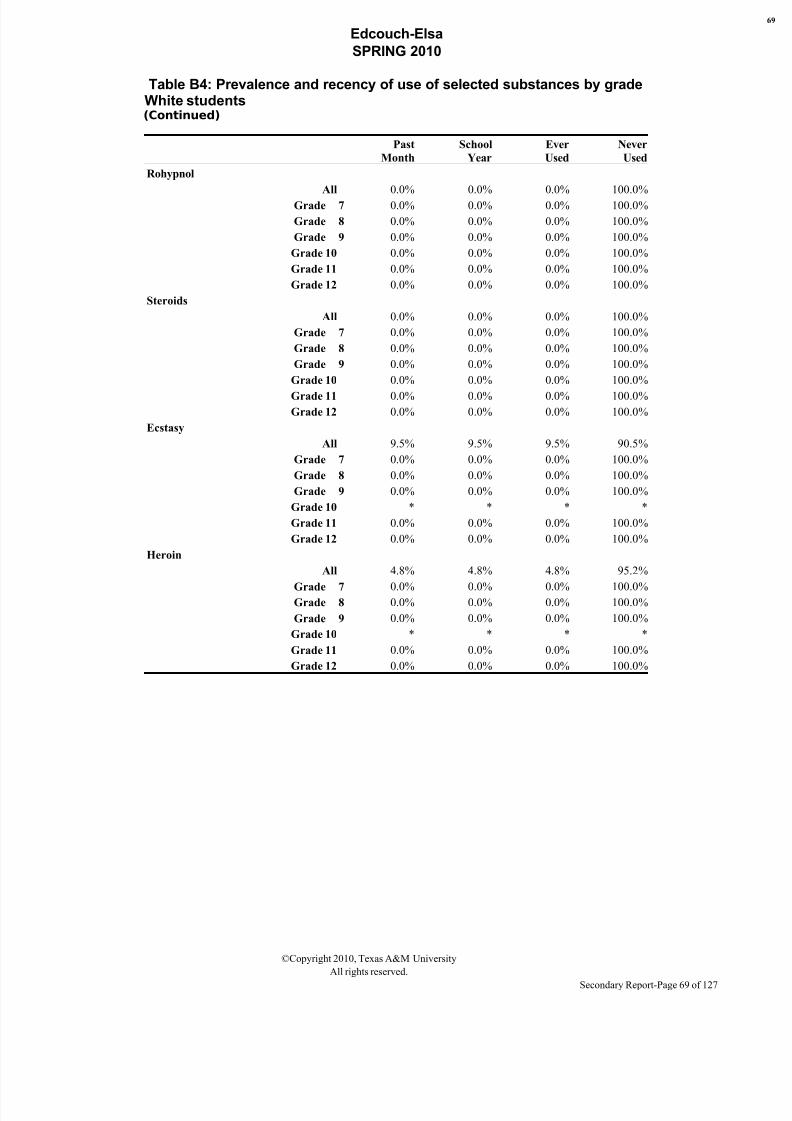
8/7/2019 HIDALGO COUNTY - edcouch-elsa isd _ 2010 Texas School Survey of Drug and Alcohol Use
http://slidepdf.com/reader/full/hidalgo-county-edcouch-elsa-isd-2010-texas-school-survey-of-drug-and-alcohol 69/127
Edcouch-Elsa
SPRING 2010
Table B4: Prevalence and recency of use of selected substances by gradeWhite students(Continued)
Past
Month
School
Year
Ever
Used
Never
Used
Rohypnol
All 0.0% 0.0% 0.0% 100.0%
Grade 7 0.0% 0.0% 0.0% 100.0%
Grade 8 0.0% 0.0% 0.0% 100.0%
Grade 9 0.0% 0.0% 0.0% 100.0%
Grade 10 0.0% 0.0% 0.0% 100.0%
Grade 11 0.0% 0.0% 0.0% 100.0%
Grade 12 0.0% 0.0% 0.0% 100.0%
Steroids
All 0.0% 0.0% 0.0% 100.0%
Grade 7 0.0% 0.0% 0.0% 100.0%
Grade 8 0.0% 0.0% 0.0% 100.0%
Grade 9 0.0% 0.0% 0.0% 100.0%
Grade 10 0.0% 0.0% 0.0% 100.0%
Grade 11 0.0% 0.0% 0.0% 100.0%
Grade 12 0.0% 0.0% 0.0% 100.0%
Ecstasy
All 9.5% 9.5% 9.5% 90.5%
Grade 7 0.0% 0.0% 0.0% 100.0%
Grade 8 0.0% 0.0% 0.0% 100.0%
Grade 9 0.0% 0.0% 0.0% 100.0%
Grade 10 * * * *
Grade 11 0.0% 0.0% 0.0% 100.0%
Grade 12 0.0% 0.0% 0.0% 100.0%
Heroin
All 4.8% 4.8% 4.8% 95.2%
Grade 7 0.0% 0.0% 0.0% 100.0%Grade 8 0.0% 0.0% 0.0% 100.0%
Grade 9 0.0% 0.0% 0.0% 100.0%
Grade 10 * * * *
Grade 11 0.0% 0.0% 0.0% 100.0%
Grade 12 0.0% 0.0% 0.0% 100.0%
©Copyright 2010, Texas A&M University
All rights reserved.
Secondary Report-Page 69 of 127
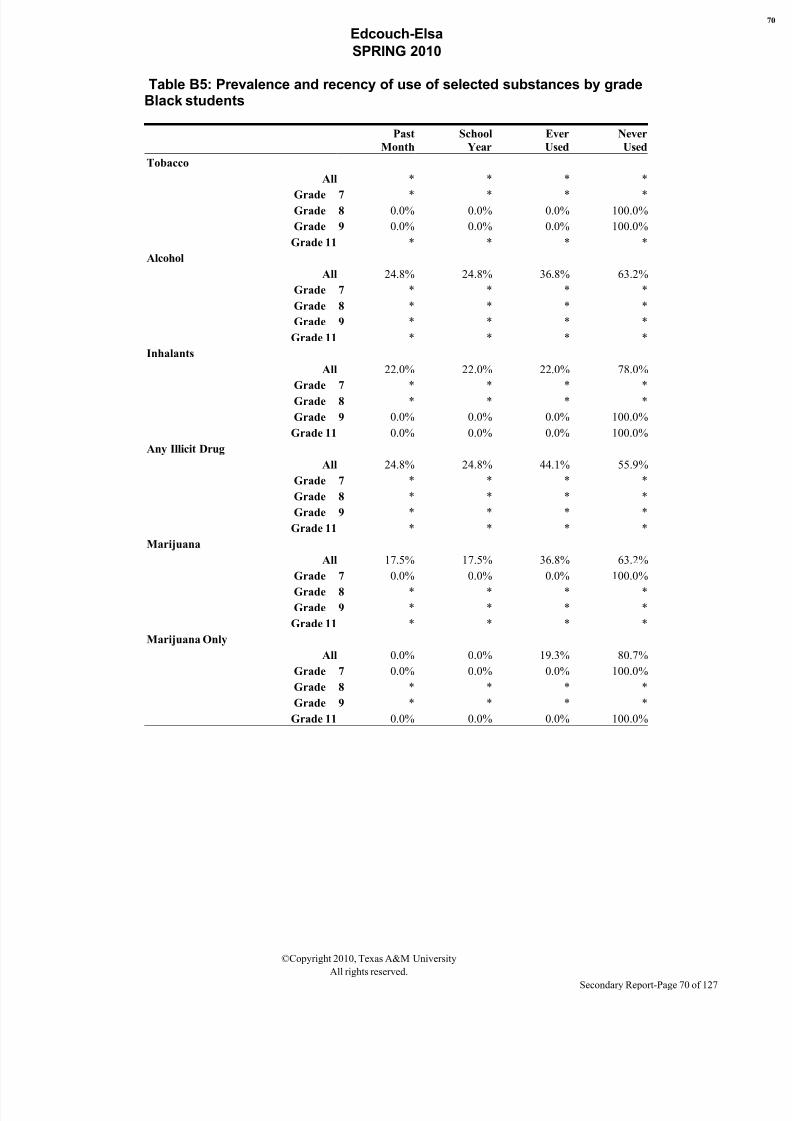
8/7/2019 HIDALGO COUNTY - edcouch-elsa isd _ 2010 Texas School Survey of Drug and Alcohol Use
http://slidepdf.com/reader/full/hidalgo-county-edcouch-elsa-isd-2010-texas-school-survey-of-drug-and-alcohol 70/127
Edcouch-Elsa
SPRING 2010
Table B5: Prevalence and recency of use of selected substances by gradeBlack students
Past
Month
School
Year
Ever
Used
Never
Used
Tobacco
All * * * *
Grade 7 * * * *Grade 8 0.0% 0.0% 0.0% 100.0%
Grade 9 0.0% 0.0% 0.0% 100.0%
Grade 11 * * * *
Alcohol
All 24.8% 24.8% 36.8% 63.2%
Grade 7 * * * *
Grade 8 * * * *
Grade 9 * * * *
Grade 11 * * * *
Inhalants
All 22.0% 22.0% 22.0% 78.0%
Grade 7 * * * *
Grade 8 * * * *
Grade 9 0.0% 0.0% 0.0% 100.0%
Grade 11 0.0% 0.0% 0.0% 100.0%
Any Illicit Drug
All 24.8% 24.8% 44.1% 55.9%
Grade 7 * * * *
Grade 8 * * * *
Grade 9 * * * *
Grade 11 * * * *
Marijuana
All 17.5% 17.5% 36.8% 63.2%
Grade 7 0.0% 0.0% 0.0% 100.0%
Grade 8 * * * *
Grade 9 * * * *
Grade 11 * * * *
Marijuana Only
All 0.0% 0.0% 19.3% 80.7%
Grade 7 0.0% 0.0% 0.0% 100.0%
Grade 8 * * * *
Grade 9 * * * *
Grade 11 0.0% 0.0% 0.0% 100.0%
©Copyright 2010, Texas A&M University
All rights reserved.
Secondary Report-Page 70 of 127
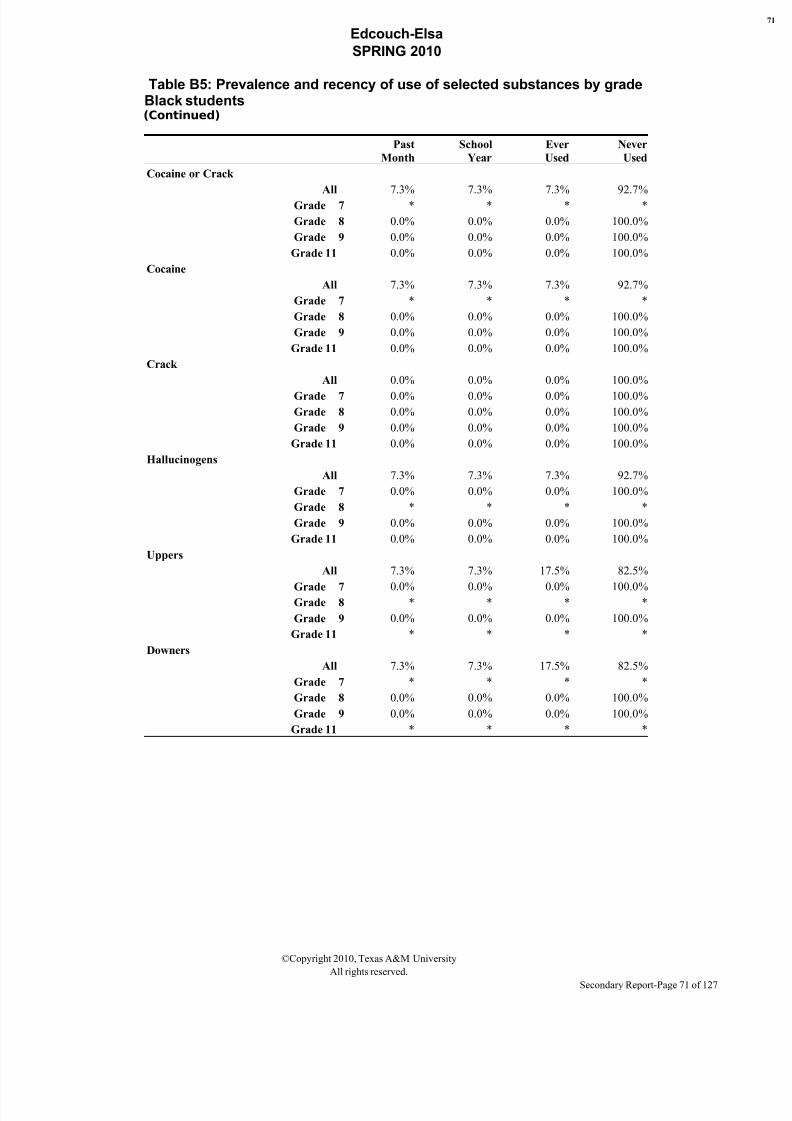
8/7/2019 HIDALGO COUNTY - edcouch-elsa isd _ 2010 Texas School Survey of Drug and Alcohol Use
http://slidepdf.com/reader/full/hidalgo-county-edcouch-elsa-isd-2010-texas-school-survey-of-drug-and-alcohol 71/127
Edcouch-Elsa
SPRING 2010
Table B5: Prevalence and recency of use of selected substances by gradeBlack students(Continued)
Past
Month
School
Year
Ever
Used
Never
Used
Cocaine or Crack
All 7.3% 7.3% 7.3% 92.7%
Grade 7 * * * *
Grade 8 0.0% 0.0% 0.0% 100.0%
Grade 9 0.0% 0.0% 0.0% 100.0%
Grade 11 0.0% 0.0% 0.0% 100.0%
Cocaine
All 7.3% 7.3% 7.3% 92.7%
Grade 7 * * * *
Grade 8 0.0% 0.0% 0.0% 100.0%
Grade 9 0.0% 0.0% 0.0% 100.0%
Grade 11 0.0% 0.0% 0.0% 100.0%
Crack
All 0.0% 0.0% 0.0% 100.0%
Grade 7 0.0% 0.0% 0.0% 100.0%
Grade 8 0.0% 0.0% 0.0% 100.0%
Grade 9 0.0% 0.0% 0.0% 100.0%
Grade 11 0.0% 0.0% 0.0% 100.0%
Hallucinogens
All 7.3% 7.3% 7.3% 92.7%
Grade 7 0.0% 0.0% 0.0% 100.0%
Grade 8 * * * *
Grade 9 0.0% 0.0% 0.0% 100.0%
Grade 11 0.0% 0.0% 0.0% 100.0%
Uppers
All 7.3% 7.3% 17.5% 82.5%
Grade 7 0.0% 0.0% 0.0% 100.0%Grade 8 * * * *
Grade 9 0.0% 0.0% 0.0% 100.0%
Grade 11 * * * *
Downers
All 7.3% 7.3% 17.5% 82.5%
Grade 7 * * * *
Grade 8 0.0% 0.0% 0.0% 100.0%
Grade 9 0.0% 0.0% 0.0% 100.0%
Grade 11 * * * *
©Copyright 2010, Texas A&M University
All rights reserved.
Secondary Report-Page 71 of 127
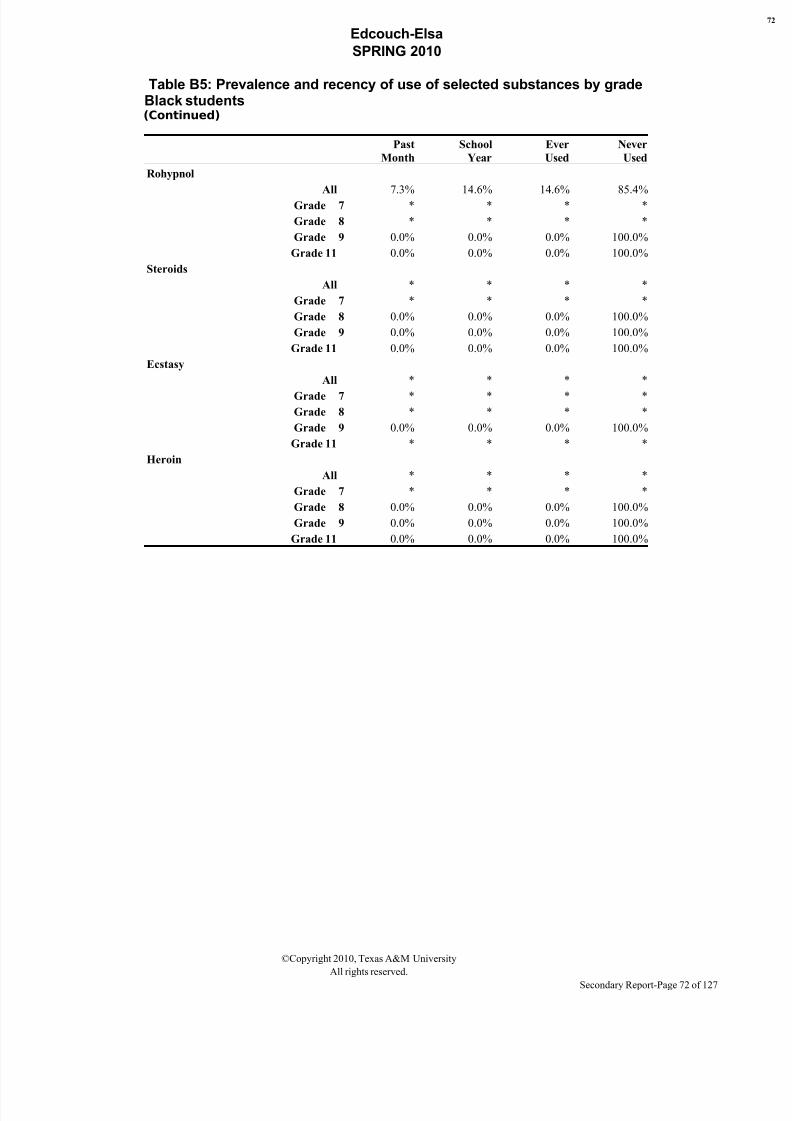
8/7/2019 HIDALGO COUNTY - edcouch-elsa isd _ 2010 Texas School Survey of Drug and Alcohol Use
http://slidepdf.com/reader/full/hidalgo-county-edcouch-elsa-isd-2010-texas-school-survey-of-drug-and-alcohol 72/127
Edcouch-Elsa
SPRING 2010
Table B5: Prevalence and recency of use of selected substances by gradeBlack students(Continued)
Past
Month
School
Year
Ever
Used
Never
Used
Rohypnol
All 7.3% 14.6% 14.6% 85.4%
Grade 7 * * * *
Grade 8 * * * *
Grade 9 0.0% 0.0% 0.0% 100.0%
Grade 11 0.0% 0.0% 0.0% 100.0%
Steroids
All * * * *
Grade 7 * * * *
Grade 8 0.0% 0.0% 0.0% 100.0%
Grade 9 0.0% 0.0% 0.0% 100.0%
Grade 11 0.0% 0.0% 0.0% 100.0%
Ecstasy
All * * * *
Grade 7 * * * *
Grade 8 * * * *
Grade 9 0.0% 0.0% 0.0% 100.0%
Grade 11 * * * *
Heroin
All * * * *
Grade 7 * * * *
Grade 8 0.0% 0.0% 0.0% 100.0%
Grade 9 0.0% 0.0% 0.0% 100.0%
Grade 11 0.0% 0.0% 0.0% 100.0%
©Copyright 2010, Texas A&M University
All rights reserved.
Secondary Report-Page 72 of 127
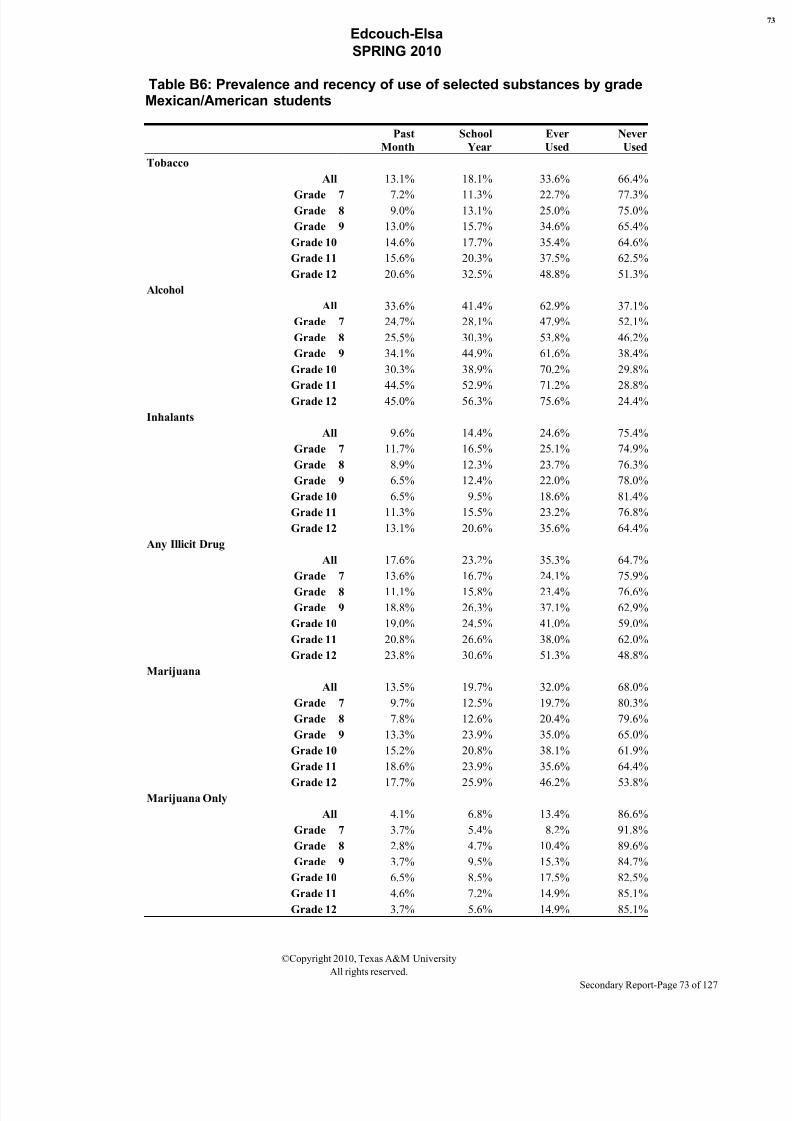
8/7/2019 HIDALGO COUNTY - edcouch-elsa isd _ 2010 Texas School Survey of Drug and Alcohol Use
http://slidepdf.com/reader/full/hidalgo-county-edcouch-elsa-isd-2010-texas-school-survey-of-drug-and-alcohol 73/127
Edcouch-Elsa
SPRING 2010
Table B6: Prevalence and recency of use of selected substances by gradeMexican/American students
Past
Month
School
Year
Ever
Used
Never
Used
Tobacco
All 13.1% 18.1% 33.6% 66.4%
Grade 7 7.2% 11.3% 22.7% 77.3%Grade 8 9.0% 13.1% 25.0% 75.0%
Grade 9 13.0% 15.7% 34.6% 65.4%
Grade 10 14.6% 17.7% 35.4% 64.6%
Grade 11 15.6% 20.3% 37.5% 62.5%
Grade 12 20.6% 32.5% 48.8% 51.3%
Alcohol
All 33.6% 41.4% 62.9% 37.1%
Grade 7 24.7% 28.1% 47.9% 52.1%
Grade 8 25.5% 30.3% 53.8% 46.2%
Grade 9 34.1% 44.9% 61.6% 38.4%
Grade 10 30.3% 38.9% 70.2% 29.8%
Grade 11 44.5% 52.9% 71.2% 28.8%
Grade 12 45.0% 56.3% 75.6% 24.4%
Inhalants
All 9.6% 14.4% 24.6% 75.4%
Grade 7 11.7% 16.5% 25.1% 74.9%
Grade 8 8.9% 12.3% 23.7% 76.3%
Grade 9 6.5% 12.4% 22.0% 78.0%
Grade 10 6.5% 9.5% 18.6% 81.4%
Grade 11 11.3% 15.5% 23.2% 76.8%
Grade 12 13.1% 20.6% 35.6% 64.4%
Any Illicit Drug
All 17.6% 23.2% 35.3% 64.7%
Grade 7 13.6% 16.7% 24.1% 75.9%
Grade 8 11.1% 15.8% 23.4% 76.6%
Grade 9 18.8% 26.3% 37.1% 62.9%
Grade 10 19.0% 24.5% 41.0% 59.0%
Grade 11 20.8% 26.6% 38.0% 62.0%
Grade 12 23.8% 30.6% 51.3% 48.8%
Marijuana
All 13.5% 19.7% 32.0% 68.0%
Grade 7 9.7% 12.5% 19.7% 80.3%
Grade 8 7.8% 12.6% 20.4% 79.6%
Grade 9 13.3% 23.9% 35.0% 65.0%
Grade 10 15.2% 20.8% 38.1% 61.9%
Grade 11 18.6% 23.9% 35.6% 64.4%
Grade 12 17.7% 25.9% 46.2% 53.8%Marijuana Only
All 4.1% 6.8% 13.4% 86.6%
Grade 7 3.7% 5.4% 8.2% 91.8%
Grade 8 2.8% 4.7% 10.4% 89.6%
Grade 9 3.7% 9.5% 15.3% 84.7%
Grade 10 6.5% 8.5% 17.5% 82.5%
Grade 11 4.6% 7.2% 14.9% 85.1%
Grade 12 3.7% 5.6% 14.9% 85.1%
©Copyright 2010, Texas A&M University
All rights reserved.
Secondary Report-Page 73 of 127

8/7/2019 HIDALGO COUNTY - edcouch-elsa isd _ 2010 Texas School Survey of Drug and Alcohol Use
http://slidepdf.com/reader/full/hidalgo-county-edcouch-elsa-isd-2010-texas-school-survey-of-drug-and-alcohol 74/127
Edcouch-Elsa
SPRING 2010
©Copyright 2010, Texas A&M University
All rights reserved.
Secondary Report-Page 74 of 127
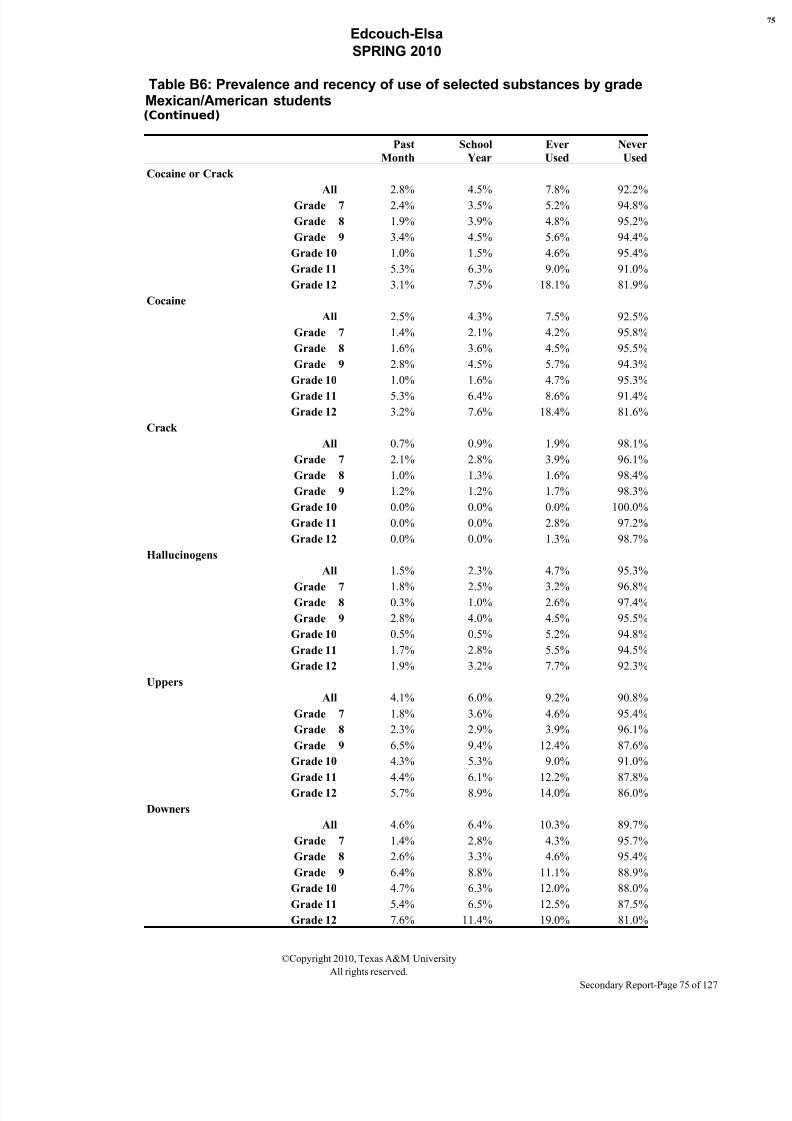
8/7/2019 HIDALGO COUNTY - edcouch-elsa isd _ 2010 Texas School Survey of Drug and Alcohol Use
http://slidepdf.com/reader/full/hidalgo-county-edcouch-elsa-isd-2010-texas-school-survey-of-drug-and-alcohol 75/127
Edcouch-Elsa
SPRING 2010
Table B6: Prevalence and recency of use of selected substances by gradeMexican/American students(Continued)
Past
Month
School
Year
Ever
Used
Never
Used
Cocaine or Crack
All 2.8% 4.5% 7.8% 92.2%
Grade 7 2.4% 3.5% 5.2% 94.8%
Grade 8 1.9% 3.9% 4.8% 95.2%
Grade 9 3.4% 4.5% 5.6% 94.4%
Grade 10 1.0% 1.5% 4.6% 95.4%
Grade 11 5.3% 6.3% 9.0% 91.0%
Grade 12 3.1% 7.5% 18.1% 81.9%
Cocaine
All 2.5% 4.3% 7.5% 92.5%
Grade 7 1.4% 2.1% 4.2% 95.8%
Grade 8 1.6% 3.6% 4.5% 95.5%
Grade 9 2.8% 4.5% 5.7% 94.3%
Grade 10 1.0% 1.6% 4.7% 95.3%
Grade 11 5.3% 6.4% 8.6% 91.4%
Grade 12 3.2% 7.6% 18.4% 81.6%
Crack
All 0.7% 0.9% 1.9% 98.1%
Grade 7 2.1% 2.8% 3.9% 96.1%
Grade 8 1.0% 1.3% 1.6% 98.4%
Grade 9 1.2% 1.2% 1.7% 98.3%
Grade 10 0.0% 0.0% 0.0% 100.0%
Grade 11 0.0% 0.0% 2.8% 97.2%
Grade 12 0.0% 0.0% 1.3% 98.7%
Hallucinogens
All 1.5% 2.3% 4.7% 95.3%
Grade 7 1.8% 2.5% 3.2% 96.8%Grade 8 0.3% 1.0% 2.6% 97.4%
Grade 9 2.8% 4.0% 4.5% 95.5%
Grade 10 0.5% 0.5% 5.2% 94.8%
Grade 11 1.7% 2.8% 5.5% 94.5%
Grade 12 1.9% 3.2% 7.7% 92.3%
Uppers
All 4.1% 6.0% 9.2% 90.8%
Grade 7 1.8% 3.6% 4.6% 95.4%
Grade 8 2.3% 2.9% 3.9% 96.1%
Grade 9 6.5% 9.4% 12.4% 87.6%
Grade 10 4.3% 5.3% 9.0% 91.0%
Grade 11 4.4% 6.1% 12.2% 87.8%
Grade 12 5.7% 8.9% 14.0% 86.0%
Downers
All 4.6% 6.4% 10.3% 89.7%
Grade 7 1.4% 2.8% 4.3% 95.7%
Grade 8 2.6% 3.3% 4.6% 95.4%
Grade 9 6.4% 8.8% 11.1% 88.9%
Grade 10 4.7% 6.3% 12.0% 88.0%
Grade 11 5.4% 6.5% 12.5% 87.5%
Grade 12 7.6% 11.4% 19.0% 81.0%
©Copyright 2010, Texas A&M University
All rights reserved.
Secondary Report-Page 75 of 127

8/7/2019 HIDALGO COUNTY - edcouch-elsa isd _ 2010 Texas School Survey of Drug and Alcohol Use
http://slidepdf.com/reader/full/hidalgo-county-edcouch-elsa-isd-2010-texas-school-survey-of-drug-and-alcohol 76/127
Edcouch-Elsa
SPRING 2010
Table B6: Prevalence and recency of use of selected substances by gradeMexican/American students(Continued)
Past
Month
School
Year
Ever
Used
Never
Used
Rohypnol
All 2.8% 3.9% 6.9% 93.1%
Grade 7 2.5% 2.8% 4.9% 95.1%
Grade 8 3.0% 4.6% 5.9% 94.1%
Grade 9 3.5% 4.7% 6.4% 93.6%
Grade 10 2.1% 3.2% 5.9% 94.1%
Grade 11 3.4% 4.5% 7.3% 92.7%
Grade 12 2.6% 3.8% 11.5% 88.5%
Steroids
All 0.3% 0.3% 0.7% 99.3%
Grade 7 0.7% 1.1% 1.4% 98.6%
Grade 8 0.3% 0.3% 0.7% 99.3%
Grade 9 0.6% 0.6% 1.2% 98.8%
Grade 10 0.0% 0.0% 0.0% 100.0%
Grade 11 0.0% 0.0% 0.5% 99.5%
Grade 12 0.0% 0.0% 0.0% 100.0%
Ecstasy
All 7.1% 9.8% 13.4% 86.6%
Grade 7 2.8% 3.9% 5.6% 94.4%
Grade 8 3.6% 4.6% 5.9% 94.1%
Grade 9 8.6% 12.6% 17.2% 82.8%
Grade 10 9.4% 11.5% 16.1% 83.9%
Grade 11 9.7% 12.4% 16.8% 83.2%
Grade 12 9.6% 15.3% 20.4% 79.6%
Heroin
All 0.7% 1.0% 1.8% 98.2%
Grade 7 1.1% 2.1% 3.2% 96.8%Grade 8 0.7% 1.3% 2.3% 97.7%
Grade 9 0.0% 0.0% 2.3% 97.7%
Grade 10 0.0% 0.0% 0.0% 100.0%
Grade 11 1.1% 1.1% 1.6% 98.4%
Grade 12 1.3% 1.3% 1.3% 98.7%
©Copyright 2010, Texas A&M University
All rights reserved.
Secondary Report-Page 76 of 127
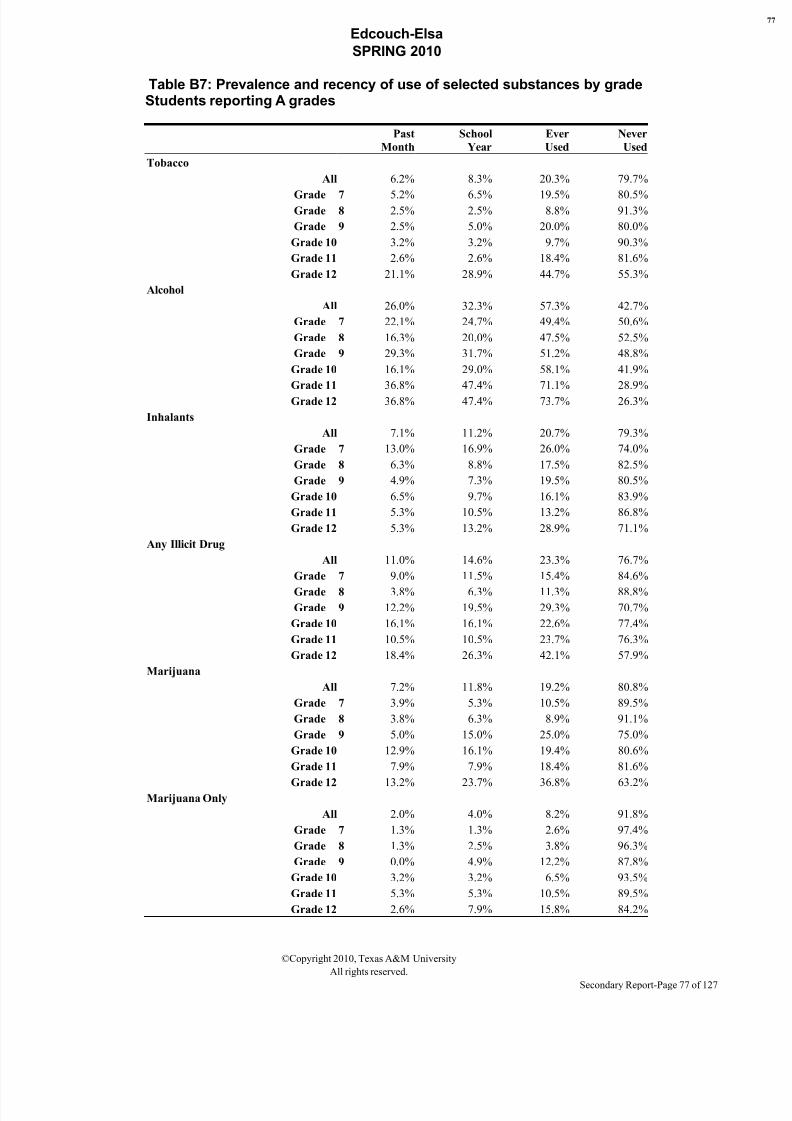
8/7/2019 HIDALGO COUNTY - edcouch-elsa isd _ 2010 Texas School Survey of Drug and Alcohol Use
http://slidepdf.com/reader/full/hidalgo-county-edcouch-elsa-isd-2010-texas-school-survey-of-drug-and-alcohol 77/127
Edcouch-Elsa
SPRING 2010
Table B7: Prevalence and recency of use of selected substances by gradeStudents reporting A grades
Past
Month
School
Year
Ever
Used
Never
Used
Tobacco
All 6.2% 8.3% 20.3% 79.7%
Grade 7 5.2% 6.5% 19.5% 80.5%Grade 8 2.5% 2.5% 8.8% 91.3%
Grade 9 2.5% 5.0% 20.0% 80.0%
Grade 10 3.2% 3.2% 9.7% 90.3%
Grade 11 2.6% 2.6% 18.4% 81.6%
Grade 12 21.1% 28.9% 44.7% 55.3%
Alcohol
All 26.0% 32.3% 57.3% 42.7%
Grade 7 22.1% 24.7% 49.4% 50.6%
Grade 8 16.3% 20.0% 47.5% 52.5%
Grade 9 29.3% 31.7% 51.2% 48.8%
Grade 10 16.1% 29.0% 58.1% 41.9%
Grade 11 36.8% 47.4% 71.1% 28.9%
Grade 12 36.8% 47.4% 73.7% 26.3%
Inhalants
All 7.1% 11.2% 20.7% 79.3%
Grade 7 13.0% 16.9% 26.0% 74.0%
Grade 8 6.3% 8.8% 17.5% 82.5%
Grade 9 4.9% 7.3% 19.5% 80.5%
Grade 10 6.5% 9.7% 16.1% 83.9%
Grade 11 5.3% 10.5% 13.2% 86.8%
Grade 12 5.3% 13.2% 28.9% 71.1%
Any Illicit Drug
All 11.0% 14.6% 23.3% 76.7%
Grade 7 9.0% 11.5% 15.4% 84.6%
Grade 8 3.8% 6.3% 11.3% 88.8%
Grade 9 12.2% 19.5% 29.3% 70.7%
Grade 10 16.1% 16.1% 22.6% 77.4%
Grade 11 10.5% 10.5% 23.7% 76.3%
Grade 12 18.4% 26.3% 42.1% 57.9%
Marijuana
All 7.2% 11.8% 19.2% 80.8%
Grade 7 3.9% 5.3% 10.5% 89.5%
Grade 8 3.8% 6.3% 8.9% 91.1%
Grade 9 5.0% 15.0% 25.0% 75.0%
Grade 10 12.9% 16.1% 19.4% 80.6%
Grade 11 7.9% 7.9% 18.4% 81.6%
Grade 12 13.2% 23.7% 36.8% 63.2%Marijuana Only
All 2.0% 4.0% 8.2% 91.8%
Grade 7 1.3% 1.3% 2.6% 97.4%
Grade 8 1.3% 2.5% 3.8% 96.3%
Grade 9 0.0% 4.9% 12.2% 87.8%
Grade 10 3.2% 3.2% 6.5% 93.5%
Grade 11 5.3% 5.3% 10.5% 89.5%
Grade 12 2.6% 7.9% 15.8% 84.2%
©Copyright 2010, Texas A&M University
All rights reserved.
Secondary Report-Page 77 of 127

8/7/2019 HIDALGO COUNTY - edcouch-elsa isd _ 2010 Texas School Survey of Drug and Alcohol Use
http://slidepdf.com/reader/full/hidalgo-county-edcouch-elsa-isd-2010-texas-school-survey-of-drug-and-alcohol 78/127
Edcouch-Elsa
SPRING 2010
©Copyright 2010, Texas A&M University
All rights reserved.
Secondary Report-Page 78 of 127

8/7/2019 HIDALGO COUNTY - edcouch-elsa isd _ 2010 Texas School Survey of Drug and Alcohol Use
http://slidepdf.com/reader/full/hidalgo-county-edcouch-elsa-isd-2010-texas-school-survey-of-drug-and-alcohol 79/127
Edcouch-Elsa
SPRING 2010
Table B7: Prevalence and recency of use of selected substances by gradeStudents reporting A grades(Continued)
Past
Month
School
Year
Ever
Used
Never
Used
Cocaine or Crack
All 2.2% 2.9% 6.0% 94.0%
Grade 7 1.3% 2.6% 5.3% 94.7%
Grade 8 1.3% 1.3% 3.8% 96.3%
Grade 9 2.5% 2.5% 2.5% 97.5%
Grade 10 3.2% 3.2% 6.5% 93.5%
Grade 11 0.0% 0.0% 2.6% 97.4%
Grade 12 5.3% 7.9% 15.8% 84.2%
Cocaine
All 1.8% 2.9% 6.1% 93.9%
Grade 7 1.3% 2.6% 5.3% 94.7%
Grade 8 1.3% 1.3% 3.8% 96.2%
Grade 9 0.0% 2.5% 2.5% 97.5%
Grade 10 3.2% 3.2% 6.5% 93.5%
Grade 11 0.0% 0.0% 2.7% 97.3%
Grade 12 5.4% 8.1% 16.2% 83.8%
Crack
All 0.4% 0.7% 1.9% 98.1%
Grade 7 0.0% 1.3% 4.0% 96.0%
Grade 8 0.0% 0.0% 1.3% 98.8%
Grade 9 2.5% 2.5% 2.5% 97.5%
Grade 10 0.0% 0.0% 0.0% 100.0%
Grade 11 0.0% 0.0% 2.7% 97.3%
Grade 12 0.0% 0.0% 0.0% 100.0%
Hallucinogens
All 0.9% 1.2% 3.2% 96.8%
Grade 7 0.0% 0.0% 0.0% 100.0%Grade 8 0.0% 1.3% 1.3% 98.7%
Grade 9 2.6% 2.6% 2.6% 97.4%
Grade 10 0.0% 0.0% 10.0% 90.0%
Grade 11 0.0% 0.0% 0.0% 100.0%
Grade 12 2.7% 2.7% 8.1% 91.9%
Uppers
All 2.2% 3.7% 6.5% 93.5%
Grade 7 1.3% 1.3% 1.3% 98.7%
Grade 8 1.3% 2.6% 2.6% 97.4%
Grade 9 2.6% 5.1% 7.7% 92.3%
Grade 10 6.5% 9.7% 12.9% 87.1%
Grade 11 0.0% 0.0% 8.1% 91.9%
Grade 12 2.8% 5.6% 11.1% 88.9%
Downers
All 2.6% 3.9% 6.0% 94.0%
Grade 7 2.7% 2.7% 2.7% 97.3%
Grade 8 0.0% 2.6% 2.6% 97.4%
Grade 9 2.6% 2.6% 2.6% 97.4%
Grade 10 6.5% 9.7% 9.7% 90.3%
Grade 11 0.0% 0.0% 5.3% 94.7%
Grade 12 5.4% 8.1% 16.2% 83.8%
©Copyright 2010, Texas A&M University
All rights reserved.
Secondary Report-Page 79 of 127
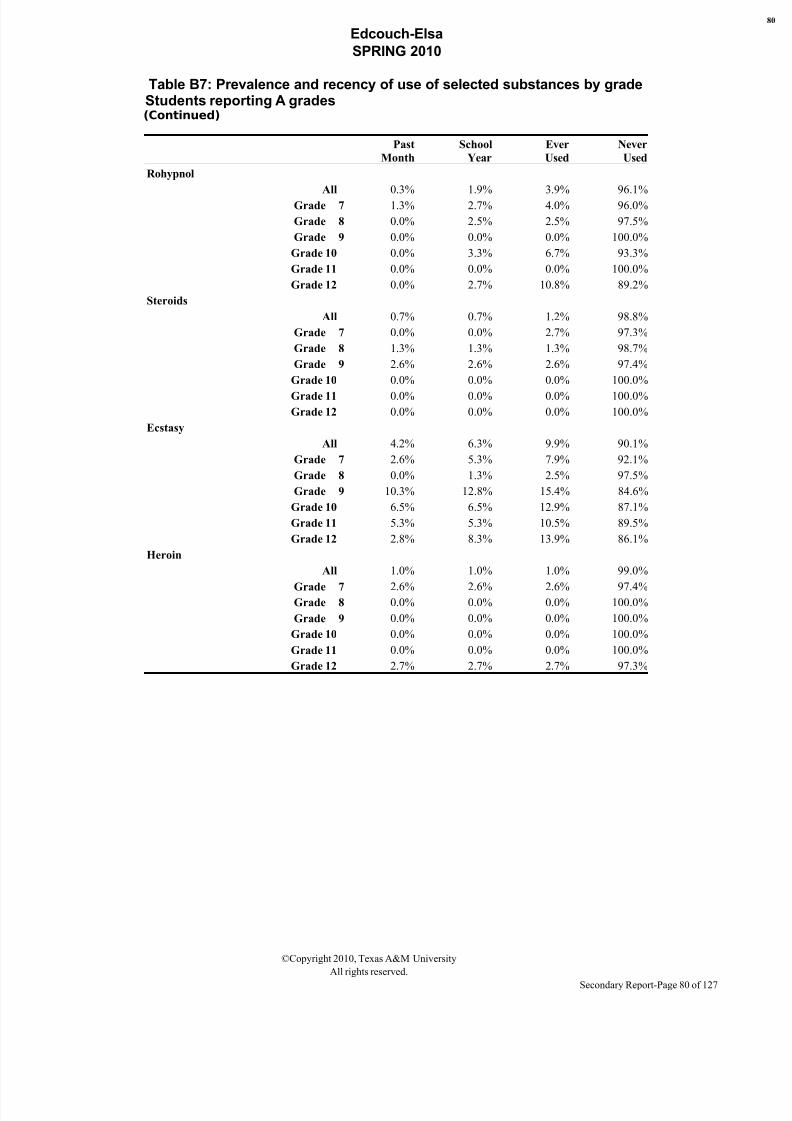
8/7/2019 HIDALGO COUNTY - edcouch-elsa isd _ 2010 Texas School Survey of Drug and Alcohol Use
http://slidepdf.com/reader/full/hidalgo-county-edcouch-elsa-isd-2010-texas-school-survey-of-drug-and-alcohol 80/127
Edcouch-Elsa
SPRING 2010
Table B7: Prevalence and recency of use of selected substances by gradeStudents reporting A grades(Continued)
Past
Month
School
Year
Ever
Used
Never
Used
Rohypnol
All 0.3% 1.9% 3.9% 96.1%
Grade 7 1.3% 2.7% 4.0% 96.0%
Grade 8 0.0% 2.5% 2.5% 97.5%
Grade 9 0.0% 0.0% 0.0% 100.0%
Grade 10 0.0% 3.3% 6.7% 93.3%
Grade 11 0.0% 0.0% 0.0% 100.0%
Grade 12 0.0% 2.7% 10.8% 89.2%
Steroids
All 0.7% 0.7% 1.2% 98.8%
Grade 7 0.0% 0.0% 2.7% 97.3%
Grade 8 1.3% 1.3% 1.3% 98.7%
Grade 9 2.6% 2.6% 2.6% 97.4%
Grade 10 0.0% 0.0% 0.0% 100.0%
Grade 11 0.0% 0.0% 0.0% 100.0%
Grade 12 0.0% 0.0% 0.0% 100.0%
Ecstasy
All 4.2% 6.3% 9.9% 90.1%
Grade 7 2.6% 5.3% 7.9% 92.1%
Grade 8 0.0% 1.3% 2.5% 97.5%
Grade 9 10.3% 12.8% 15.4% 84.6%
Grade 10 6.5% 6.5% 12.9% 87.1%
Grade 11 5.3% 5.3% 10.5% 89.5%
Grade 12 2.8% 8.3% 13.9% 86.1%
Heroin
All 1.0% 1.0% 1.0% 99.0%
Grade 7 2.6% 2.6% 2.6% 97.4%Grade 8 0.0% 0.0% 0.0% 100.0%
Grade 9 0.0% 0.0% 0.0% 100.0%
Grade 10 0.0% 0.0% 0.0% 100.0%
Grade 11 0.0% 0.0% 0.0% 100.0%
Grade 12 2.7% 2.7% 2.7% 97.3%
©Copyright 2010, Texas A&M University
All rights reserved.
Secondary Report-Page 80 of 127
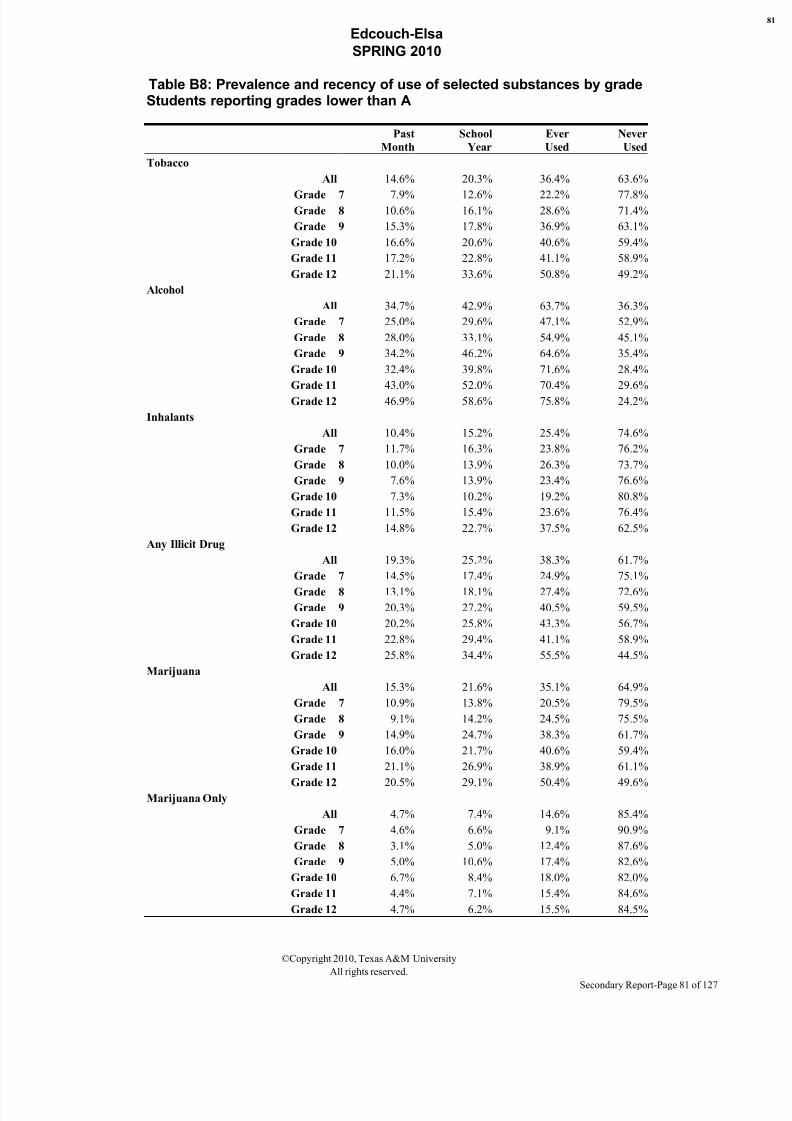
8/7/2019 HIDALGO COUNTY - edcouch-elsa isd _ 2010 Texas School Survey of Drug and Alcohol Use
http://slidepdf.com/reader/full/hidalgo-county-edcouch-elsa-isd-2010-texas-school-survey-of-drug-and-alcohol 81/127
Edcouch-Elsa
SPRING 2010
Table B8: Prevalence and recency of use of selected substances by gradeStudents reporting grades lower than A
Past
Month
School
Year
Ever
Used
Never
Used
Tobacco
All 14.6% 20.3% 36.4% 63.6%
Grade 7 7.9% 12.6% 22.2% 77.8%Grade 8 10.6% 16.1% 28.6% 71.4%
Grade 9 15.3% 17.8% 36.9% 63.1%
Grade 10 16.6% 20.6% 40.6% 59.4%
Grade 11 17.2% 22.8% 41.1% 58.9%
Grade 12 21.1% 33.6% 50.8% 49.2%
Alcohol
All 34.7% 42.9% 63.7% 36.3%
Grade 7 25.0% 29.6% 47.1% 52.9%
Grade 8 28.0% 33.1% 54.9% 45.1%
Grade 9 34.2% 46.2% 64.6% 35.4%
Grade 10 32.4% 39.8% 71.6% 28.4%
Grade 11 43.0% 52.0% 70.4% 29.6%
Grade 12 46.9% 58.6% 75.8% 24.2%
Inhalants
All 10.4% 15.2% 25.4% 74.6%
Grade 7 11.7% 16.3% 23.8% 76.2%
Grade 8 10.0% 13.9% 26.3% 73.7%
Grade 9 7.6% 13.9% 23.4% 76.6%
Grade 10 7.3% 10.2% 19.2% 80.8%
Grade 11 11.5% 15.4% 23.6% 76.4%
Grade 12 14.8% 22.7% 37.5% 62.5%
Any Illicit Drug
All 19.3% 25.2% 38.3% 61.7%
Grade 7 14.5% 17.4% 24.9% 75.1%
Grade 8 13.1% 18.1% 27.4% 72.6%
Grade 9 20.3% 27.2% 40.5% 59.5%
Grade 10 20.2% 25.8% 43.3% 56.7%
Grade 11 22.8% 29.4% 41.1% 58.9%
Grade 12 25.8% 34.4% 55.5% 44.5%
Marijuana
All 15.3% 21.6% 35.1% 64.9%
Grade 7 10.9% 13.8% 20.5% 79.5%
Grade 8 9.1% 14.2% 24.5% 75.5%
Grade 9 14.9% 24.7% 38.3% 61.7%
Grade 10 16.0% 21.7% 40.6% 59.4%
Grade 11 21.1% 26.9% 38.9% 61.1%
Grade 12 20.5% 29.1% 50.4% 49.6%Marijuana Only
All 4.7% 7.4% 14.6% 85.4%
Grade 7 4.6% 6.6% 9.1% 90.9%
Grade 8 3.1% 5.0% 12.4% 87.6%
Grade 9 5.0% 10.6% 17.4% 82.6%
Grade 10 6.7% 8.4% 18.0% 82.0%
Grade 11 4.4% 7.1% 15.4% 84.6%
Grade 12 4.7% 6.2% 15.5% 84.5%
©Copyright 2010, Texas A&M University
All rights reserved.
Secondary Report-Page 81 of 127

8/7/2019 HIDALGO COUNTY - edcouch-elsa isd _ 2010 Texas School Survey of Drug and Alcohol Use
http://slidepdf.com/reader/full/hidalgo-county-edcouch-elsa-isd-2010-texas-school-survey-of-drug-and-alcohol 82/127
Edcouch-Elsa
SPRING 2010
©Copyright 2010, Texas A&M University
All rights reserved.
Secondary Report-Page 82 of 127
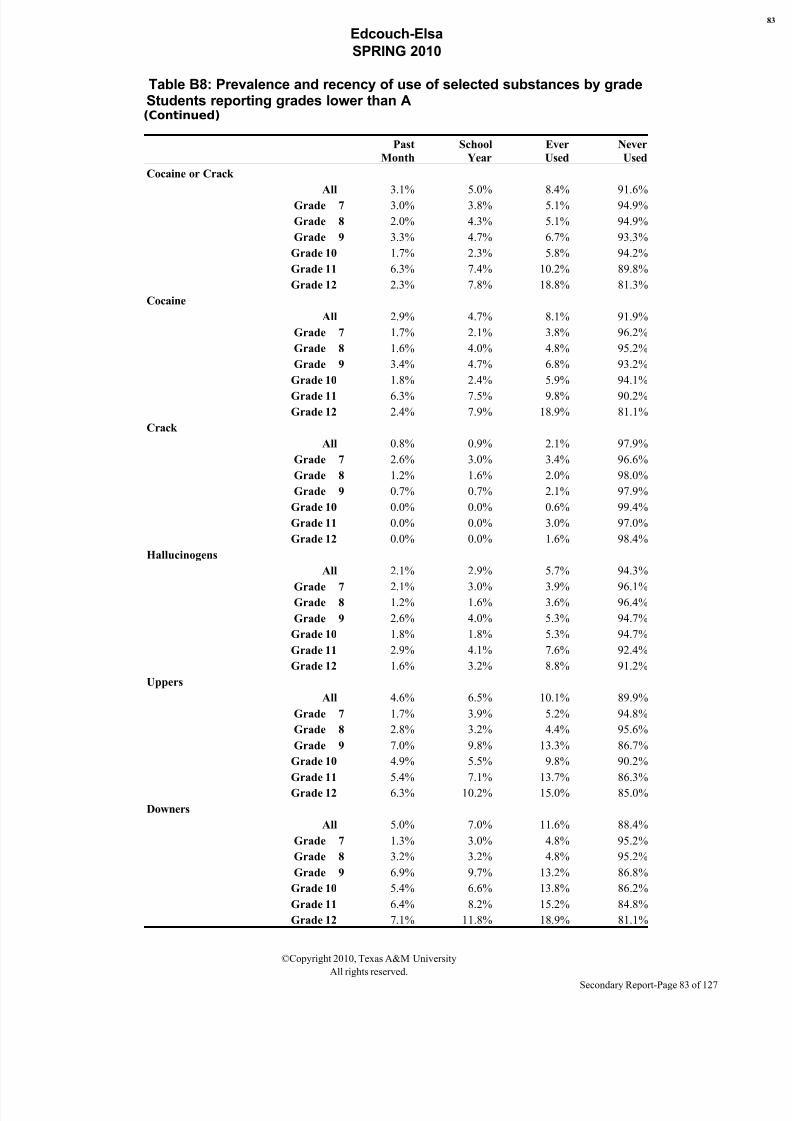
8/7/2019 HIDALGO COUNTY - edcouch-elsa isd _ 2010 Texas School Survey of Drug and Alcohol Use
http://slidepdf.com/reader/full/hidalgo-county-edcouch-elsa-isd-2010-texas-school-survey-of-drug-and-alcohol 83/127
Edcouch-Elsa
SPRING 2010
Table B8: Prevalence and recency of use of selected substances by gradeStudents reporting grades lower than A(Continued)
Past
Month
School
Year
Ever
Used
Never
Used
Cocaine or Crack
All 3.1% 5.0% 8.4% 91.6%
Grade 7 3.0% 3.8% 5.1% 94.9%
Grade 8 2.0% 4.3% 5.1% 94.9%
Grade 9 3.3% 4.7% 6.7% 93.3%
Grade 10 1.7% 2.3% 5.8% 94.2%
Grade 11 6.3% 7.4% 10.2% 89.8%
Grade 12 2.3% 7.8% 18.8% 81.3%
Cocaine
All 2.9% 4.7% 8.1% 91.9%
Grade 7 1.7% 2.1% 3.8% 96.2%
Grade 8 1.6% 4.0% 4.8% 95.2%
Grade 9 3.4% 4.7% 6.8% 93.2%
Grade 10 1.8% 2.4% 5.9% 94.1%
Grade 11 6.3% 7.5% 9.8% 90.2%
Grade 12 2.4% 7.9% 18.9% 81.1%
Crack
All 0.8% 0.9% 2.1% 97.9%
Grade 7 2.6% 3.0% 3.4% 96.6%
Grade 8 1.2% 1.6% 2.0% 98.0%
Grade 9 0.7% 0.7% 2.1% 97.9%
Grade 10 0.0% 0.0% 0.6% 99.4%
Grade 11 0.0% 0.0% 3.0% 97.0%
Grade 12 0.0% 0.0% 1.6% 98.4%
Hallucinogens
All 2.1% 2.9% 5.7% 94.3%
Grade 7 2.1% 3.0% 3.9% 96.1%Grade 8 1.2% 1.6% 3.6% 96.4%
Grade 9 2.6% 4.0% 5.3% 94.7%
Grade 10 1.8% 1.8% 5.3% 94.7%
Grade 11 2.9% 4.1% 7.6% 92.4%
Grade 12 1.6% 3.2% 8.8% 91.2%
Uppers
All 4.6% 6.5% 10.1% 89.9%
Grade 7 1.7% 3.9% 5.2% 94.8%
Grade 8 2.8% 3.2% 4.4% 95.6%
Grade 9 7.0% 9.8% 13.3% 86.7%
Grade 10 4.9% 5.5% 9.8% 90.2%
Grade 11 5.4% 7.1% 13.7% 86.3%
Grade 12 6.3% 10.2% 15.0% 85.0%
Downers
All 5.0% 7.0% 11.6% 88.4%
Grade 7 1.3% 3.0% 4.8% 95.2%
Grade 8 3.2% 3.2% 4.8% 95.2%
Grade 9 6.9% 9.7% 13.2% 86.8%
Grade 10 5.4% 6.6% 13.8% 86.2%
Grade 11 6.4% 8.2% 15.2% 84.8%
Grade 12 7.1% 11.8% 18.9% 81.1%
©Copyright 2010, Texas A&M University
All rights reserved.
Secondary Report-Page 83 of 127
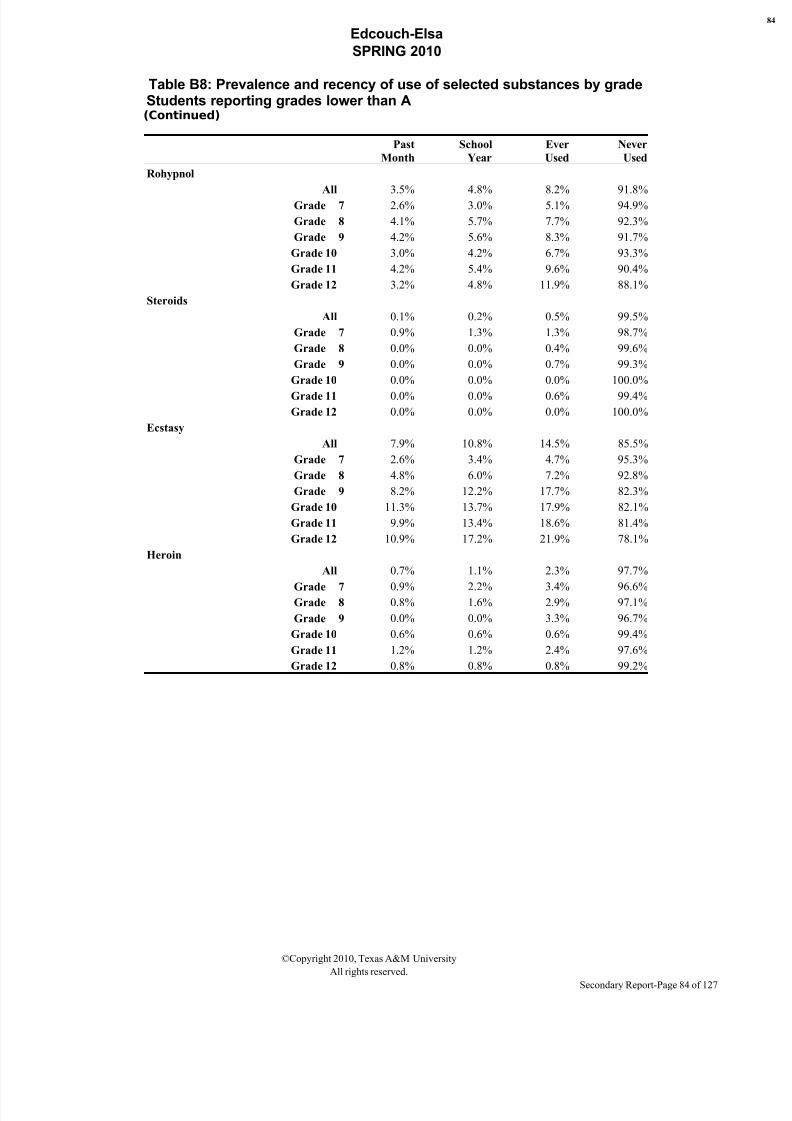
8/7/2019 HIDALGO COUNTY - edcouch-elsa isd _ 2010 Texas School Survey of Drug and Alcohol Use
http://slidepdf.com/reader/full/hidalgo-county-edcouch-elsa-isd-2010-texas-school-survey-of-drug-and-alcohol 84/127
Edcouch-Elsa
SPRING 2010
Table B8: Prevalence and recency of use of selected substances by gradeStudents reporting grades lower than A(Continued)
Past
Month
School
Year
Ever
Used
Never
Used
Rohypnol
All 3.5% 4.8% 8.2% 91.8%
Grade 7 2.6% 3.0% 5.1% 94.9%
Grade 8 4.1% 5.7% 7.7% 92.3%
Grade 9 4.2% 5.6% 8.3% 91.7%
Grade 10 3.0% 4.2% 6.7% 93.3%
Grade 11 4.2% 5.4% 9.6% 90.4%
Grade 12 3.2% 4.8% 11.9% 88.1%
Steroids
All 0.1% 0.2% 0.5% 99.5%
Grade 7 0.9% 1.3% 1.3% 98.7%
Grade 8 0.0% 0.0% 0.4% 99.6%
Grade 9 0.0% 0.0% 0.7% 99.3%
Grade 10 0.0% 0.0% 0.0% 100.0%
Grade 11 0.0% 0.0% 0.6% 99.4%
Grade 12 0.0% 0.0% 0.0% 100.0%
Ecstasy
All 7.9% 10.8% 14.5% 85.5%
Grade 7 2.6% 3.4% 4.7% 95.3%
Grade 8 4.8% 6.0% 7.2% 92.8%
Grade 9 8.2% 12.2% 17.7% 82.3%
Grade 10 11.3% 13.7% 17.9% 82.1%
Grade 11 9.9% 13.4% 18.6% 81.4%
Grade 12 10.9% 17.2% 21.9% 78.1%
Heroin
All 0.7% 1.1% 2.3% 97.7%
Grade 7 0.9% 2.2% 3.4% 96.6%Grade 8 0.8% 1.6% 2.9% 97.1%
Grade 9 0.0% 0.0% 3.3% 96.7%
Grade 10 0.6% 0.6% 0.6% 99.4%
Grade 11 1.2% 1.2% 2.4% 97.6%
Grade 12 0.8% 0.8% 0.8% 99.2%
©Copyright 2010, Texas A&M University
All rights reserved.
Secondary Report-Page 84 of 127
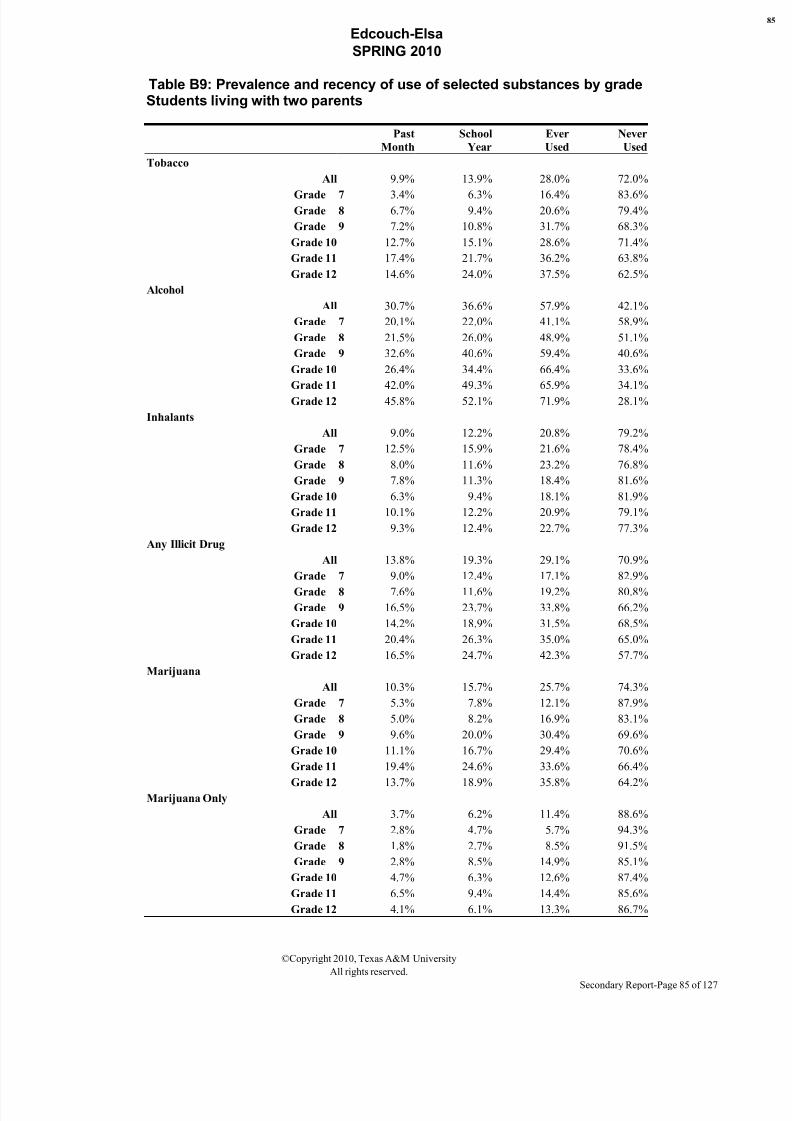
8/7/2019 HIDALGO COUNTY - edcouch-elsa isd _ 2010 Texas School Survey of Drug and Alcohol Use
http://slidepdf.com/reader/full/hidalgo-county-edcouch-elsa-isd-2010-texas-school-survey-of-drug-and-alcohol 85/127
Edcouch-Elsa
SPRING 2010
Table B9: Prevalence and recency of use of selected substances by gradeStudents living with two parents
Past
Month
School
Year
Ever
Used
Never
Used
Tobacco
All 9.9% 13.9% 28.0% 72.0%
Grade 7 3.4% 6.3% 16.4% 83.6%Grade 8 6.7% 9.4% 20.6% 79.4%
Grade 9 7.2% 10.8% 31.7% 68.3%
Grade 10 12.7% 15.1% 28.6% 71.4%
Grade 11 17.4% 21.7% 36.2% 63.8%
Grade 12 14.6% 24.0% 37.5% 62.5%
Alcohol
All 30.7% 36.6% 57.9% 42.1%
Grade 7 20.1% 22.0% 41.1% 58.9%
Grade 8 21.5% 26.0% 48.9% 51.1%
Grade 9 32.6% 40.6% 59.4% 40.6%
Grade 10 26.4% 34.4% 66.4% 33.6%
Grade 11 42.0% 49.3% 65.9% 34.1%
Grade 12 45.8% 52.1% 71.9% 28.1%
Inhalants
All 9.0% 12.2% 20.8% 79.2%
Grade 7 12.5% 15.9% 21.6% 78.4%
Grade 8 8.0% 11.6% 23.2% 76.8%
Grade 9 7.8% 11.3% 18.4% 81.6%
Grade 10 6.3% 9.4% 18.1% 81.9%
Grade 11 10.1% 12.2% 20.9% 79.1%
Grade 12 9.3% 12.4% 22.7% 77.3%
Any Illicit Drug
All 13.8% 19.3% 29.1% 70.9%
Grade 7 9.0% 12.4% 17.1% 82.9%
Grade 8 7.6% 11.6% 19.2% 80.8%
Grade 9 16.5% 23.7% 33.8% 66.2%
Grade 10 14.2% 18.9% 31.5% 68.5%
Grade 11 20.4% 26.3% 35.0% 65.0%
Grade 12 16.5% 24.7% 42.3% 57.7%
Marijuana
All 10.3% 15.7% 25.7% 74.3%
Grade 7 5.3% 7.8% 12.1% 87.9%
Grade 8 5.0% 8.2% 16.9% 83.1%
Grade 9 9.6% 20.0% 30.4% 69.6%
Grade 10 11.1% 16.7% 29.4% 70.6%
Grade 11 19.4% 24.6% 33.6% 66.4%
Grade 12 13.7% 18.9% 35.8% 64.2%Marijuana Only
All 3.7% 6.2% 11.4% 88.6%
Grade 7 2.8% 4.7% 5.7% 94.3%
Grade 8 1.8% 2.7% 8.5% 91.5%
Grade 9 2.8% 8.5% 14.9% 85.1%
Grade 10 4.7% 6.3% 12.6% 87.4%
Grade 11 6.5% 9.4% 14.4% 85.6%
Grade 12 4.1% 6.1% 13.3% 86.7%
©Copyright 2010, Texas A&M University
All rights reserved.
Secondary Report-Page 85 of 127

8/7/2019 HIDALGO COUNTY - edcouch-elsa isd _ 2010 Texas School Survey of Drug and Alcohol Use
http://slidepdf.com/reader/full/hidalgo-county-edcouch-elsa-isd-2010-texas-school-survey-of-drug-and-alcohol 86/127
Edcouch-Elsa
SPRING 2010
©Copyright 2010, Texas A&M University
All rights reserved.
Secondary Report-Page 86 of 127

8/7/2019 HIDALGO COUNTY - edcouch-elsa isd _ 2010 Texas School Survey of Drug and Alcohol Use
http://slidepdf.com/reader/full/hidalgo-county-edcouch-elsa-isd-2010-texas-school-survey-of-drug-and-alcohol 87/127
Edcouch-Elsa
SPRING 2010
Table B9: Prevalence and recency of use of selected substances by gradeStudents living with two parents(Continued)
Past
Month
School
Year
Ever
Used
Never
Used
Cocaine or Crack
All 2.6% 3.9% 6.6% 93.4%
Grade 7 2.4% 3.4% 4.4% 95.6%
Grade 8 1.8% 4.1% 5.0% 95.0%
Grade 9 3.8% 3.8% 4.5% 95.5%
Grade 10 0.8% 1.6% 4.8% 95.2%
Grade 11 5.2% 6.0% 9.0% 91.0%
Grade 12 1.0% 4.2% 13.5% 86.5%
Cocaine
All 2.3% 3.6% 6.5% 93.5%
Grade 7 2.0% 2.4% 3.9% 96.1%
Grade 8 1.4% 3.6% 4.5% 95.5%
Grade 9 3.1% 3.8% 4.6% 95.4%
Grade 10 0.8% 1.6% 4.9% 95.1%
Grade 11 5.3% 6.0% 9.0% 91.0%
Grade 12 1.1% 4.2% 13.7% 86.3%
Crack
All 0.9% 1.2% 2.1% 97.9%
Grade 7 2.0% 3.0% 3.5% 96.5%
Grade 8 1.4% 1.8% 2.3% 97.7%
Grade 9 1.5% 1.5% 2.3% 97.7%
Grade 10 0.0% 0.0% 0.0% 100.0%
Grade 11 0.0% 0.0% 3.1% 96.9%
Grade 12 0.0% 0.0% 1.1% 98.9%
Hallucinogens
All 0.8% 1.2% 3.3% 96.7%
Grade 7 0.5% 1.0% 2.0% 98.0%Grade 8 0.9% 0.9% 1.8% 98.2%
Grade 9 2.3% 3.0% 4.5% 95.5%
Grade 10 0.0% 0.0% 3.2% 96.8%
Grade 11 0.8% 1.5% 5.3% 94.7%
Grade 12 0.0% 0.0% 3.2% 96.8%
Uppers
All 3.1% 4.6% 7.3% 92.7%
Grade 7 2.0% 3.0% 3.5% 96.5%
Grade 8 1.8% 2.3% 3.6% 96.4%
Grade 9 5.6% 7.1% 11.1% 88.9%
Grade 10 4.2% 5.8% 9.2% 90.8%
Grade 11 4.6% 6.2% 11.5% 88.5%
Grade 12 0.0% 3.2% 5.3% 94.7%
Downers
All 3.5% 4.6% 7.6% 92.4%
Grade 7 1.5% 2.5% 3.0% 97.0%
Grade 8 1.8% 1.8% 3.2% 96.8%
Grade 9 4.8% 6.3% 8.7% 91.3%
Grade 10 4.9% 6.6% 9.8% 90.2%
Grade 11 6.0% 6.8% 12.0% 88.0%
Grade 12 2.1% 4.2% 10.5% 89.5%
©Copyright 2010, Texas A&M University
All rights reserved.
Secondary Report-Page 87 of 127
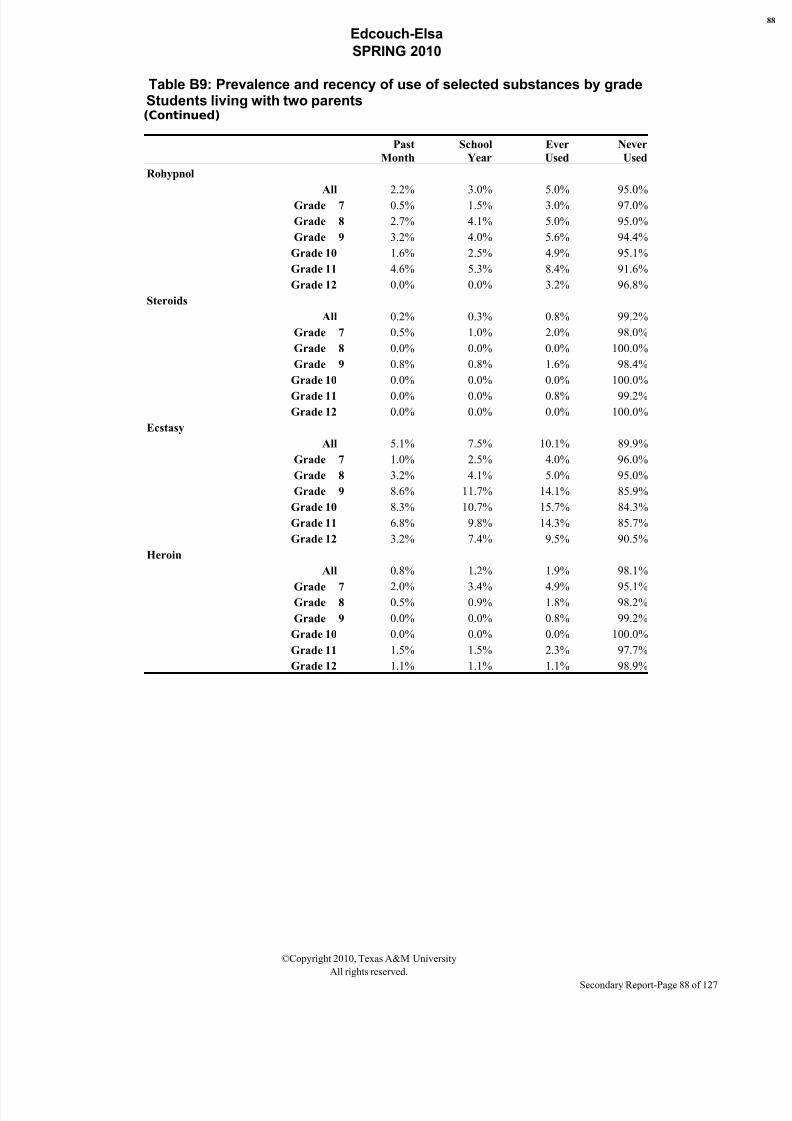
8/7/2019 HIDALGO COUNTY - edcouch-elsa isd _ 2010 Texas School Survey of Drug and Alcohol Use
http://slidepdf.com/reader/full/hidalgo-county-edcouch-elsa-isd-2010-texas-school-survey-of-drug-and-alcohol 88/127
Edcouch-Elsa
SPRING 2010
Table B9: Prevalence and recency of use of selected substances by gradeStudents living with two parents(Continued)
Past
Month
School
Year
Ever
Used
Never
Used
Rohypnol
All 2.2% 3.0% 5.0% 95.0%
Grade 7 0.5% 1.5% 3.0% 97.0%
Grade 8 2.7% 4.1% 5.0% 95.0%
Grade 9 3.2% 4.0% 5.6% 94.4%
Grade 10 1.6% 2.5% 4.9% 95.1%
Grade 11 4.6% 5.3% 8.4% 91.6%
Grade 12 0.0% 0.0% 3.2% 96.8%
Steroids
All 0.2% 0.3% 0.8% 99.2%
Grade 7 0.5% 1.0% 2.0% 98.0%
Grade 8 0.0% 0.0% 0.0% 100.0%
Grade 9 0.8% 0.8% 1.6% 98.4%
Grade 10 0.0% 0.0% 0.0% 100.0%
Grade 11 0.0% 0.0% 0.8% 99.2%
Grade 12 0.0% 0.0% 0.0% 100.0%
Ecstasy
All 5.1% 7.5% 10.1% 89.9%
Grade 7 1.0% 2.5% 4.0% 96.0%
Grade 8 3.2% 4.1% 5.0% 95.0%
Grade 9 8.6% 11.7% 14.1% 85.9%
Grade 10 8.3% 10.7% 15.7% 84.3%
Grade 11 6.8% 9.8% 14.3% 85.7%
Grade 12 3.2% 7.4% 9.5% 90.5%
Heroin
All 0.8% 1.2% 1.9% 98.1%
Grade 7 2.0% 3.4% 4.9% 95.1%Grade 8 0.5% 0.9% 1.8% 98.2%
Grade 9 0.0% 0.0% 0.8% 99.2%
Grade 10 0.0% 0.0% 0.0% 100.0%
Grade 11 1.5% 1.5% 2.3% 97.7%
Grade 12 1.1% 1.1% 1.1% 98.9%
©Copyright 2010, Texas A&M University
All rights reserved.
Secondary Report-Page 88 of 127
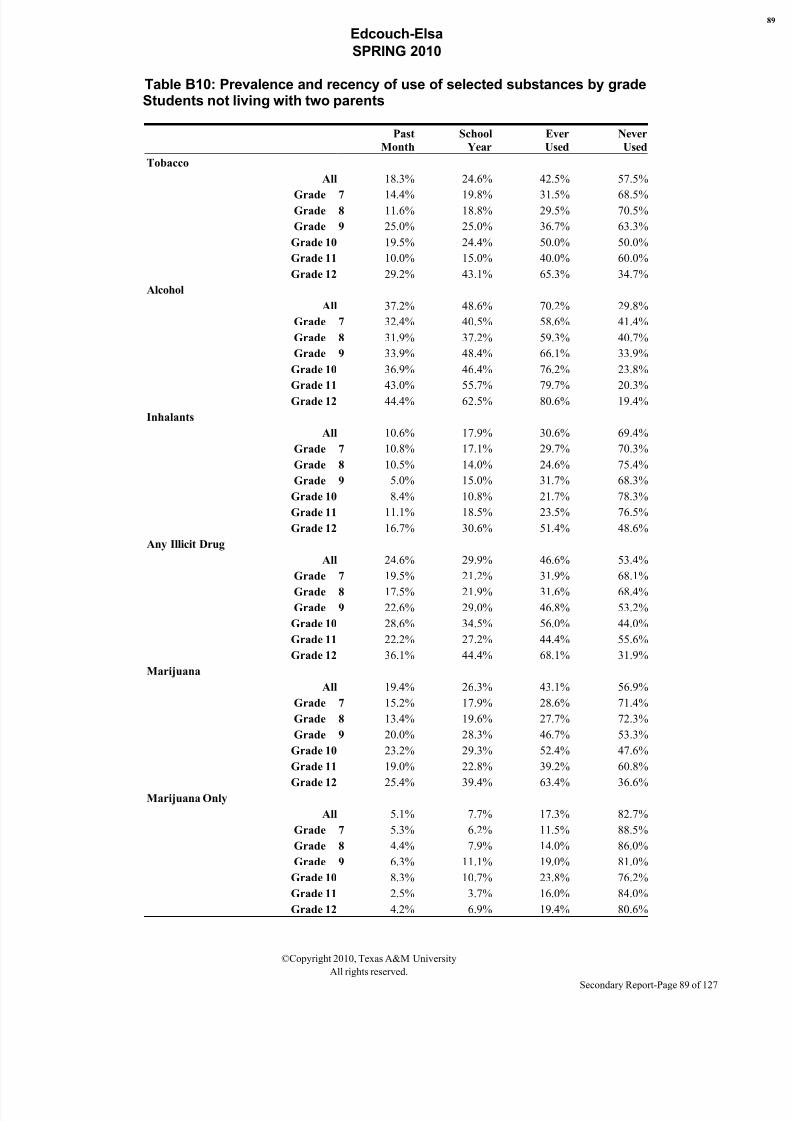
8/7/2019 HIDALGO COUNTY - edcouch-elsa isd _ 2010 Texas School Survey of Drug and Alcohol Use
http://slidepdf.com/reader/full/hidalgo-county-edcouch-elsa-isd-2010-texas-school-survey-of-drug-and-alcohol 89/127
Edcouch-Elsa
SPRING 2010
Table B10: Prevalence and recency of use of selected substances by gradeStudents not living with two parents
Past
Month
School
Year
Ever
Used
Never
Used
Tobacco
All 18.3% 24.6% 42.5% 57.5%
Grade 7 14.4% 19.8% 31.5% 68.5%Grade 8 11.6% 18.8% 29.5% 70.5%
Grade 9 25.0% 25.0% 36.7% 63.3%
Grade 10 19.5% 24.4% 50.0% 50.0%
Grade 11 10.0% 15.0% 40.0% 60.0%
Grade 12 29.2% 43.1% 65.3% 34.7%
Alcohol
All 37.2% 48.6% 70.2% 29.8%
Grade 7 32.4% 40.5% 58.6% 41.4%
Grade 8 31.9% 37.2% 59.3% 40.7%
Grade 9 33.9% 48.4% 66.1% 33.9%
Grade 10 36.9% 46.4% 76.2% 23.8%
Grade 11 43.0% 55.7% 79.7% 20.3%
Grade 12 44.4% 62.5% 80.6% 19.4%
Inhalants
All 10.6% 17.9% 30.6% 69.4%
Grade 7 10.8% 17.1% 29.7% 70.3%
Grade 8 10.5% 14.0% 24.6% 75.4%
Grade 9 5.0% 15.0% 31.7% 68.3%
Grade 10 8.4% 10.8% 21.7% 78.3%
Grade 11 11.1% 18.5% 23.5% 76.5%
Grade 12 16.7% 30.6% 51.4% 48.6%
Any Illicit Drug
All 24.6% 29.9% 46.6% 53.4%
Grade 7 19.5% 21.2% 31.9% 68.1%
Grade 8 17.5% 21.9% 31.6% 68.4%
Grade 9 22.6% 29.0% 46.8% 53.2%
Grade 10 28.6% 34.5% 56.0% 44.0%
Grade 11 22.2% 27.2% 44.4% 55.6%
Grade 12 36.1% 44.4% 68.1% 31.9%
Marijuana
All 19.4% 26.3% 43.1% 56.9%
Grade 7 15.2% 17.9% 28.6% 71.4%
Grade 8 13.4% 19.6% 27.7% 72.3%
Grade 9 20.0% 28.3% 46.7% 53.3%
Grade 10 23.2% 29.3% 52.4% 47.6%
Grade 11 19.0% 22.8% 39.2% 60.8%
Grade 12 25.4% 39.4% 63.4% 36.6%Marijuana Only
All 5.1% 7.7% 17.3% 82.7%
Grade 7 5.3% 6.2% 11.5% 88.5%
Grade 8 4.4% 7.9% 14.0% 86.0%
Grade 9 6.3% 11.1% 19.0% 81.0%
Grade 10 8.3% 10.7% 23.8% 76.2%
Grade 11 2.5% 3.7% 16.0% 84.0%
Grade 12 4.2% 6.9% 19.4% 80.6%
©Copyright 2010, Texas A&M University
All rights reserved.
Secondary Report-Page 89 of 127

8/7/2019 HIDALGO COUNTY - edcouch-elsa isd _ 2010 Texas School Survey of Drug and Alcohol Use
http://slidepdf.com/reader/full/hidalgo-county-edcouch-elsa-isd-2010-texas-school-survey-of-drug-and-alcohol 90/127
Edcouch-Elsa
SPRING 2010
©Copyright 2010, Texas A&M University
All rights reserved.
Secondary Report-Page 90 of 127

8/7/2019 HIDALGO COUNTY - edcouch-elsa isd _ 2010 Texas School Survey of Drug and Alcohol Use
http://slidepdf.com/reader/full/hidalgo-county-edcouch-elsa-isd-2010-texas-school-survey-of-drug-and-alcohol 91/127
Edcouch-Elsa
SPRING 2010
Table B10: Prevalence and recency of use of selected substances by gradeStudents not living with two parents(Continued)
Past
Month
School
Year
Ever
Used
Never
Used
Cocaine or Crack
All 3.5% 5.7% 10.0% 90.0%
Grade 7 2.7% 3.6% 6.3% 93.8%
Grade 8 1.8% 2.7% 4.5% 95.5%
Grade 9 1.7% 5.1% 8.5% 91.5%
Grade 10 3.7% 3.7% 7.3% 92.7%
Grade 11 5.0% 6.3% 8.8% 91.3%
Grade 12 5.6% 12.5% 23.6% 76.4%
Cocaine
All 3.2% 5.5% 9.6% 90.4%
Grade 7 0.9% 1.8% 4.5% 95.5%
Grade 8 1.8% 2.7% 4.5% 95.5%
Grade 9 1.7% 5.1% 8.5% 91.5%
Grade 10 3.8% 3.8% 7.5% 92.5%
Grade 11 5.1% 6.4% 7.7% 92.3%
Grade 12 5.6% 12.7% 23.9% 76.1%
Crack
All 0.3% 0.3% 1.9% 98.1%
Grade 7 1.8% 1.8% 3.6% 96.4%
Grade 8 0.0% 0.0% 0.9% 99.1%
Grade 9 0.0% 0.0% 1.9% 98.1%
Grade 10 0.0% 0.0% 1.3% 98.7%
Grade 11 0.0% 0.0% 2.7% 97.3%
Grade 12 0.0% 0.0% 1.4% 98.6%
Hallucinogens
All 3.6% 5.0% 8.3% 91.7%
Grade 7 3.6% 4.5% 4.5% 95.5%Grade 8 0.9% 2.7% 5.5% 94.5%
Grade 9 3.5% 5.3% 5.3% 94.7%
Grade 10 3.9% 3.9% 10.4% 89.6%
Grade 11 5.3% 6.7% 8.0% 92.0%
Grade 12 4.3% 7.1% 15.7% 84.3%
Uppers
All 6.1% 8.3% 12.8% 87.2%
Grade 7 0.9% 3.6% 5.5% 94.5%
Grade 8 3.6% 3.6% 3.6% 96.4%
Grade 9 7.0% 12.3% 14.0% 86.0%
Grade 10 7.8% 7.8% 13.0% 87.0%
Grade 11 4.0% 5.3% 14.7% 85.3%
Grade 12 12.7% 16.9% 25.4% 74.6%
Downers
All 6.7% 9.6% 15.5% 84.5%
Grade 7 1.9% 3.7% 6.5% 93.5%
Grade 8 3.6% 4.5% 5.4% 94.6%
Grade 9 8.6% 12.1% 15.5% 84.5%
Grade 10 7.7% 9.0% 19.2% 80.8%
Grade 11 3.9% 6.6% 15.8% 84.2%
Grade 12 14.1% 21.1% 29.6% 70.4%
©Copyright 2010, Texas A&M University
All rights reserved.
Secondary Report-Page 91 of 127
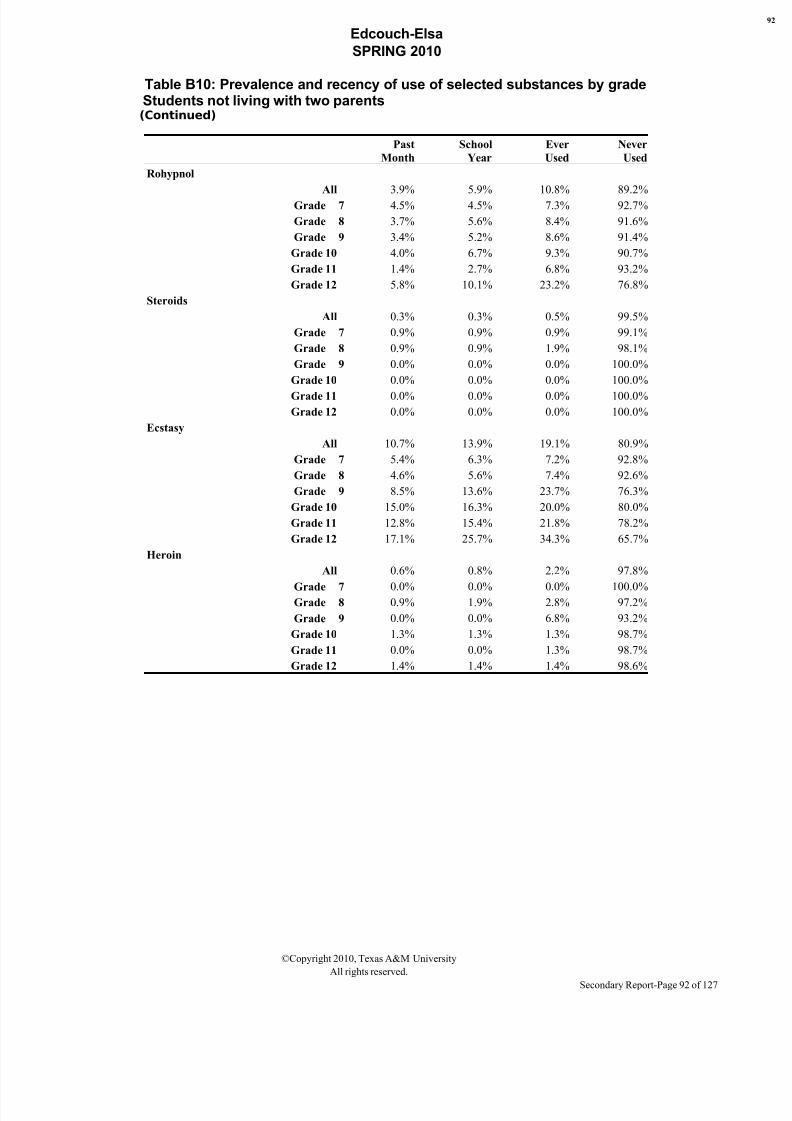
8/7/2019 HIDALGO COUNTY - edcouch-elsa isd _ 2010 Texas School Survey of Drug and Alcohol Use
http://slidepdf.com/reader/full/hidalgo-county-edcouch-elsa-isd-2010-texas-school-survey-of-drug-and-alcohol 92/127
Edcouch-Elsa
SPRING 2010
Table B10: Prevalence and recency of use of selected substances by gradeStudents not living with two parents(Continued)
Past
Month
School
Year
Ever
Used
Never
Used
Rohypnol
All 3.9% 5.9% 10.8% 89.2%
Grade 7 4.5% 4.5% 7.3% 92.7%
Grade 8 3.7% 5.6% 8.4% 91.6%
Grade 9 3.4% 5.2% 8.6% 91.4%
Grade 10 4.0% 6.7% 9.3% 90.7%
Grade 11 1.4% 2.7% 6.8% 93.2%
Grade 12 5.8% 10.1% 23.2% 76.8%
Steroids
All 0.3% 0.3% 0.5% 99.5%
Grade 7 0.9% 0.9% 0.9% 99.1%
Grade 8 0.9% 0.9% 1.9% 98.1%
Grade 9 0.0% 0.0% 0.0% 100.0%
Grade 10 0.0% 0.0% 0.0% 100.0%
Grade 11 0.0% 0.0% 0.0% 100.0%
Grade 12 0.0% 0.0% 0.0% 100.0%
Ecstasy
All 10.7% 13.9% 19.1% 80.9%
Grade 7 5.4% 6.3% 7.2% 92.8%
Grade 8 4.6% 5.6% 7.4% 92.6%
Grade 9 8.5% 13.6% 23.7% 76.3%
Grade 10 15.0% 16.3% 20.0% 80.0%
Grade 11 12.8% 15.4% 21.8% 78.2%
Grade 12 17.1% 25.7% 34.3% 65.7%
Heroin
All 0.6% 0.8% 2.2% 97.8%
Grade 7 0.0% 0.0% 0.0% 100.0%Grade 8 0.9% 1.9% 2.8% 97.2%
Grade 9 0.0% 0.0% 6.8% 93.2%
Grade 10 1.3% 1.3% 1.3% 98.7%
Grade 11 0.0% 0.0% 1.3% 98.7%
Grade 12 1.4% 1.4% 1.4% 98.6%
©Copyright 2010, Texas A&M University
All rights reserved.
Secondary Report-Page 92 of 127
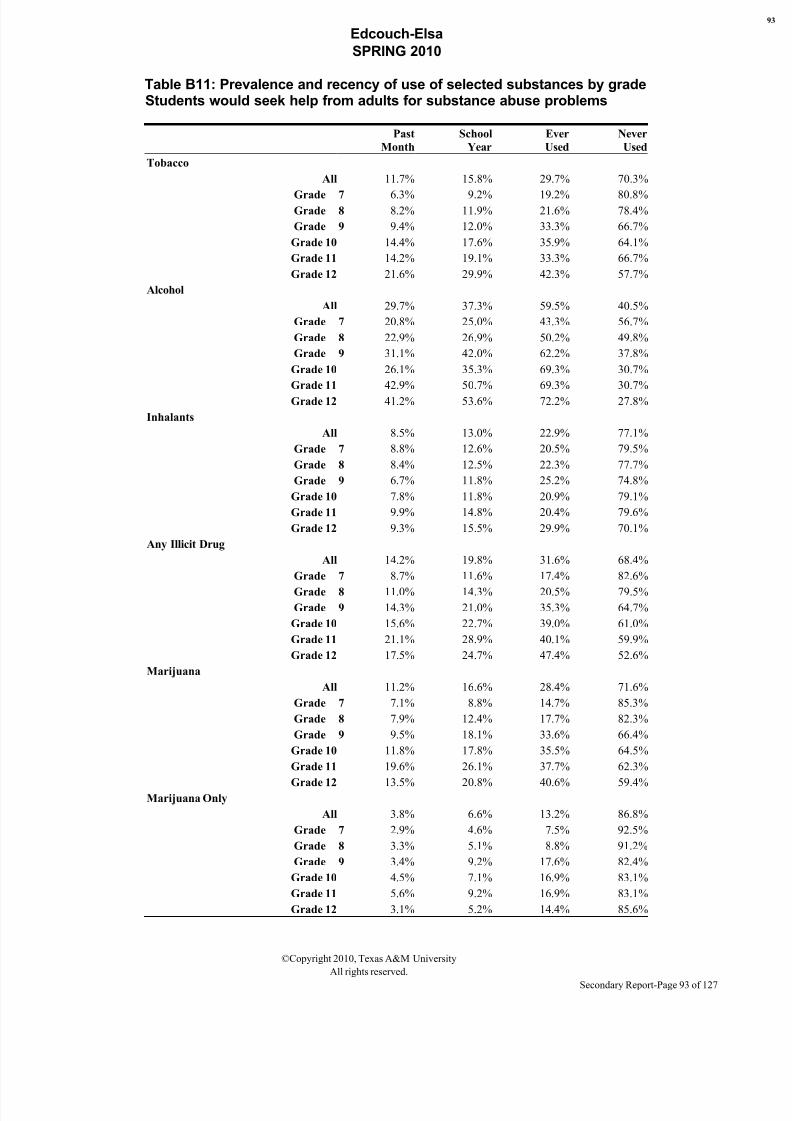
8/7/2019 HIDALGO COUNTY - edcouch-elsa isd _ 2010 Texas School Survey of Drug and Alcohol Use
http://slidepdf.com/reader/full/hidalgo-county-edcouch-elsa-isd-2010-texas-school-survey-of-drug-and-alcohol 93/127
Edcouch-Elsa
SPRING 2010
Table B11: Prevalence and recency of use of selected substances by gradeStudents would seek help from adults for substance abuse problems
Past
Month
School
Year
Ever
Used
Never
Used
Tobacco
All 11.7% 15.8% 29.7% 70.3%
Grade 7 6.3% 9.2% 19.2% 80.8%Grade 8 8.2% 11.9% 21.6% 78.4%
Grade 9 9.4% 12.0% 33.3% 66.7%
Grade 10 14.4% 17.6% 35.9% 64.1%
Grade 11 14.2% 19.1% 33.3% 66.7%
Grade 12 21.6% 29.9% 42.3% 57.7%
Alcohol
All 29.7% 37.3% 59.5% 40.5%
Grade 7 20.8% 25.0% 43.3% 56.7%
Grade 8 22.9% 26.9% 50.2% 49.8%
Grade 9 31.1% 42.0% 62.2% 37.8%
Grade 10 26.1% 35.3% 69.3% 30.7%
Grade 11 42.9% 50.7% 69.3% 30.7%
Grade 12 41.2% 53.6% 72.2% 27.8%
Inhalants
All 8.5% 13.0% 22.9% 77.1%
Grade 7 8.8% 12.6% 20.5% 79.5%
Grade 8 8.4% 12.5% 22.3% 77.7%
Grade 9 6.7% 11.8% 25.2% 74.8%
Grade 10 7.8% 11.8% 20.9% 79.1%
Grade 11 9.9% 14.8% 20.4% 79.6%
Grade 12 9.3% 15.5% 29.9% 70.1%
Any Illicit Drug
All 14.2% 19.8% 31.6% 68.4%
Grade 7 8.7% 11.6% 17.4% 82.6%
Grade 8 11.0% 14.3% 20.5% 79.5%
Grade 9 14.3% 21.0% 35.3% 64.7%
Grade 10 15.6% 22.7% 39.0% 61.0%
Grade 11 21.1% 28.9% 40.1% 59.9%
Grade 12 17.5% 24.7% 47.4% 52.6%
Marijuana
All 11.2% 16.6% 28.4% 71.6%
Grade 7 7.1% 8.8% 14.7% 85.3%
Grade 8 7.9% 12.4% 17.7% 82.3%
Grade 9 9.5% 18.1% 33.6% 66.4%
Grade 10 11.8% 17.8% 35.5% 64.5%
Grade 11 19.6% 26.1% 37.7% 62.3%
Grade 12 13.5% 20.8% 40.6% 59.4%Marijuana Only
All 3.8% 6.6% 13.2% 86.8%
Grade 7 2.9% 4.6% 7.5% 92.5%
Grade 8 3.3% 5.1% 8.8% 91.2%
Grade 9 3.4% 9.2% 17.6% 82.4%
Grade 10 4.5% 7.1% 16.9% 83.1%
Grade 11 5.6% 9.2% 16.9% 83.1%
Grade 12 3.1% 5.2% 14.4% 85.6%
©Copyright 2010, Texas A&M University
All rights reserved.
Secondary Report-Page 93 of 127

8/7/2019 HIDALGO COUNTY - edcouch-elsa isd _ 2010 Texas School Survey of Drug and Alcohol Use
http://slidepdf.com/reader/full/hidalgo-county-edcouch-elsa-isd-2010-texas-school-survey-of-drug-and-alcohol 94/127
Edcouch-Elsa
SPRING 2010
©Copyright 2010, Texas A&M University
All rights reserved.
Secondary Report-Page 94 of 127

8/7/2019 HIDALGO COUNTY - edcouch-elsa isd _ 2010 Texas School Survey of Drug and Alcohol Use
http://slidepdf.com/reader/full/hidalgo-county-edcouch-elsa-isd-2010-texas-school-survey-of-drug-and-alcohol 95/127
Edcouch-Elsa
SPRING 2010
Table B11: Prevalence and recency of use of selected substances by gradeStudents would seek help from adults for substance abuse problems(Continued)
Past
Month
School
Year
Ever
Used
Never
Used
Cocaine or Crack
All 1.8% 3.2% 6.2% 93.8%
Grade 7 0.4% 1.3% 2.5% 97.5%
Grade 8 1.5% 3.7% 4.5% 95.5%
Grade 9 2.6% 2.6% 5.2% 94.8%
Grade 10 0.7% 1.3% 4.0% 96.0%
Grade 11 4.3% 5.8% 8.0% 92.0%
Grade 12 2.1% 5.2% 16.5% 83.5%
Cocaine
All 1.6% 3.0% 6.1% 93.9%
Grade 7 0.0% 0.4% 2.1% 97.9%
Grade 8 1.1% 3.4% 4.1% 95.9%
Grade 9 1.8% 2.7% 5.3% 94.7%
Grade 10 0.7% 1.4% 4.1% 95.9%
Grade 11 4.4% 5.9% 8.1% 91.9%
Grade 12 2.1% 5.2% 16.5% 83.5%
Crack
All 0.4% 0.6% 1.4% 98.6%
Grade 7 0.4% 1.3% 2.1% 97.9%
Grade 8 0.8% 1.1% 1.1% 98.9%
Grade 9 0.9% 0.9% 1.8% 98.2%
Grade 10 0.0% 0.0% 0.0% 100.0%
Grade 11 0.0% 0.0% 1.5% 98.5%
Grade 12 0.0% 0.0% 2.1% 97.9%
Hallucinogens
All 1.3% 1.8% 4.0% 96.0%
Grade 7 1.3% 1.3% 1.7% 98.3%Grade 8 0.8% 1.5% 2.3% 97.7%
Grade 9 2.6% 3.5% 5.3% 94.7%
Grade 10 0.7% 0.7% 4.1% 95.9%
Grade 11 2.3% 3.0% 5.3% 94.7%
Grade 12 0.0% 1.0% 7.3% 92.7%
Uppers
All 2.6% 3.8% 6.8% 93.2%
Grade 7 0.4% 1.7% 2.6% 97.4%
Grade 8 1.9% 2.3% 3.0% 97.0%
Grade 9 5.5% 6.4% 10.0% 90.0%
Grade 10 3.4% 4.7% 6.8% 93.2%
Grade 11 3.0% 4.5% 11.9% 88.1%
Grade 12 2.1% 4.2% 9.4% 90.6%
Downers
All 2.9% 4.0% 7.4% 92.6%
Grade 7 0.9% 1.7% 2.6% 97.4%
Grade 8 2.3% 2.7% 3.8% 96.2%
Grade 9 5.4% 5.4% 8.1% 91.9%
Grade 10 3.4% 5.4% 9.5% 90.5%
Grade 11 3.0% 5.2% 11.9% 88.1%
Grade 12 3.1% 5.2% 11.3% 88.7%
©Copyright 2010, Texas A&M University
All rights reserved.
Secondary Report-Page 95 of 127
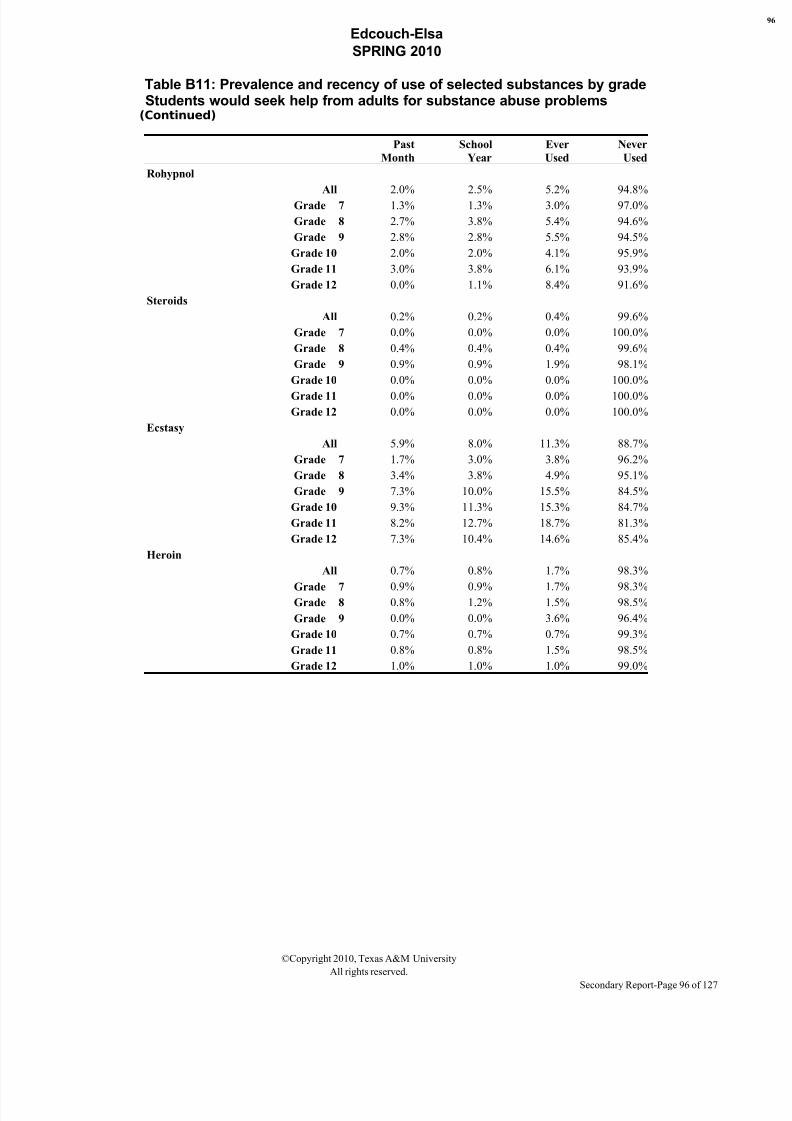
8/7/2019 HIDALGO COUNTY - edcouch-elsa isd _ 2010 Texas School Survey of Drug and Alcohol Use
http://slidepdf.com/reader/full/hidalgo-county-edcouch-elsa-isd-2010-texas-school-survey-of-drug-and-alcohol 96/127
Edcouch-Elsa
SPRING 2010
Table B11: Prevalence and recency of use of selected substances by gradeStudents would seek help from adults for substance abuse problems(Continued)
Past
Month
School
Year
Ever
Used
Never
Used
Rohypnol
All 2.0% 2.5% 5.2% 94.8%
Grade 7 1.3% 1.3% 3.0% 97.0%
Grade 8 2.7% 3.8% 5.4% 94.6%
Grade 9 2.8% 2.8% 5.5% 94.5%
Grade 10 2.0% 2.0% 4.1% 95.9%
Grade 11 3.0% 3.8% 6.1% 93.9%
Grade 12 0.0% 1.1% 8.4% 91.6%
Steroids
All 0.2% 0.2% 0.4% 99.6%
Grade 7 0.0% 0.0% 0.0% 100.0%
Grade 8 0.4% 0.4% 0.4% 99.6%
Grade 9 0.9% 0.9% 1.9% 98.1%
Grade 10 0.0% 0.0% 0.0% 100.0%
Grade 11 0.0% 0.0% 0.0% 100.0%
Grade 12 0.0% 0.0% 0.0% 100.0%
Ecstasy
All 5.9% 8.0% 11.3% 88.7%
Grade 7 1.7% 3.0% 3.8% 96.2%
Grade 8 3.4% 3.8% 4.9% 95.1%
Grade 9 7.3% 10.0% 15.5% 84.5%
Grade 10 9.3% 11.3% 15.3% 84.7%
Grade 11 8.2% 12.7% 18.7% 81.3%
Grade 12 7.3% 10.4% 14.6% 85.4%
Heroin
All 0.7% 0.8% 1.7% 98.3%
Grade 7 0.9% 0.9% 1.7% 98.3%Grade 8 0.8% 1.2% 1.5% 98.5%
Grade 9 0.0% 0.0% 3.6% 96.4%
Grade 10 0.7% 0.7% 0.7% 99.3%
Grade 11 0.8% 0.8% 1.5% 98.5%
Grade 12 1.0% 1.0% 1.0% 99.0%
©Copyright 2010, Texas A&M University
All rights reserved.
Secondary Report-Page 96 of 127
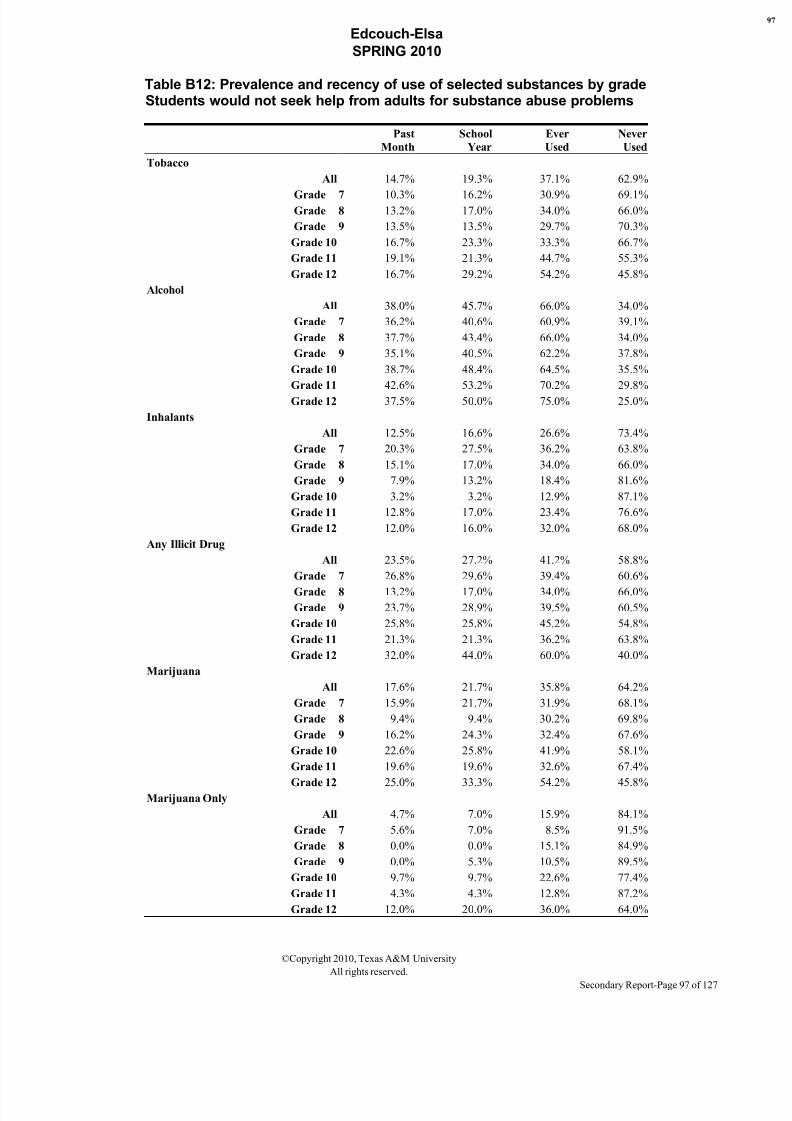
8/7/2019 HIDALGO COUNTY - edcouch-elsa isd _ 2010 Texas School Survey of Drug and Alcohol Use
http://slidepdf.com/reader/full/hidalgo-county-edcouch-elsa-isd-2010-texas-school-survey-of-drug-and-alcohol 97/127
Edcouch-Elsa
SPRING 2010
Table B12: Prevalence and recency of use of selected substances by gradeStudents would not seek help from adults for substance abuse problems
Past
Month
School
Year
Ever
Used
Never
Used
Tobacco
All 14.7% 19.3% 37.1% 62.9%
Grade 7 10.3% 16.2% 30.9% 69.1%Grade 8 13.2% 17.0% 34.0% 66.0%
Grade 9 13.5% 13.5% 29.7% 70.3%
Grade 10 16.7% 23.3% 33.3% 66.7%
Grade 11 19.1% 21.3% 44.7% 55.3%
Grade 12 16.7% 29.2% 54.2% 45.8%
Alcohol
All 38.0% 45.7% 66.0% 34.0%
Grade 7 36.2% 40.6% 60.9% 39.1%
Grade 8 37.7% 43.4% 66.0% 34.0%
Grade 9 35.1% 40.5% 62.2% 37.8%
Grade 10 38.7% 48.4% 64.5% 35.5%
Grade 11 42.6% 53.2% 70.2% 29.8%
Grade 12 37.5% 50.0% 75.0% 25.0%
Inhalants
All 12.5% 16.6% 26.6% 73.4%
Grade 7 20.3% 27.5% 36.2% 63.8%
Grade 8 15.1% 17.0% 34.0% 66.0%
Grade 9 7.9% 13.2% 18.4% 81.6%
Grade 10 3.2% 3.2% 12.9% 87.1%
Grade 11 12.8% 17.0% 23.4% 76.6%
Grade 12 12.0% 16.0% 32.0% 68.0%
Any Illicit Drug
All 23.5% 27.2% 41.2% 58.8%
Grade 7 26.8% 29.6% 39.4% 60.6%
Grade 8 13.2% 17.0% 34.0% 66.0%
Grade 9 23.7% 28.9% 39.5% 60.5%
Grade 10 25.8% 25.8% 45.2% 54.8%
Grade 11 21.3% 21.3% 36.2% 63.8%
Grade 12 32.0% 44.0% 60.0% 40.0%
Marijuana
All 17.6% 21.7% 35.8% 64.2%
Grade 7 15.9% 21.7% 31.9% 68.1%
Grade 8 9.4% 9.4% 30.2% 69.8%
Grade 9 16.2% 24.3% 32.4% 67.6%
Grade 10 22.6% 25.8% 41.9% 58.1%
Grade 11 19.6% 19.6% 32.6% 67.4%
Grade 12 25.0% 33.3% 54.2% 45.8%Marijuana Only
All 4.7% 7.0% 15.9% 84.1%
Grade 7 5.6% 7.0% 8.5% 91.5%
Grade 8 0.0% 0.0% 15.1% 84.9%
Grade 9 0.0% 5.3% 10.5% 89.5%
Grade 10 9.7% 9.7% 22.6% 77.4%
Grade 11 4.3% 4.3% 12.8% 87.2%
Grade 12 12.0% 20.0% 36.0% 64.0%
©Copyright 2010, Texas A&M University
All rights reserved.
Secondary Report-Page 97 of 127

8/7/2019 HIDALGO COUNTY - edcouch-elsa isd _ 2010 Texas School Survey of Drug and Alcohol Use
http://slidepdf.com/reader/full/hidalgo-county-edcouch-elsa-isd-2010-texas-school-survey-of-drug-and-alcohol 98/127
Edcouch-Elsa
SPRING 2010
©Copyright 2010, Texas A&M University
All rights reserved.
Secondary Report-Page 98 of 127
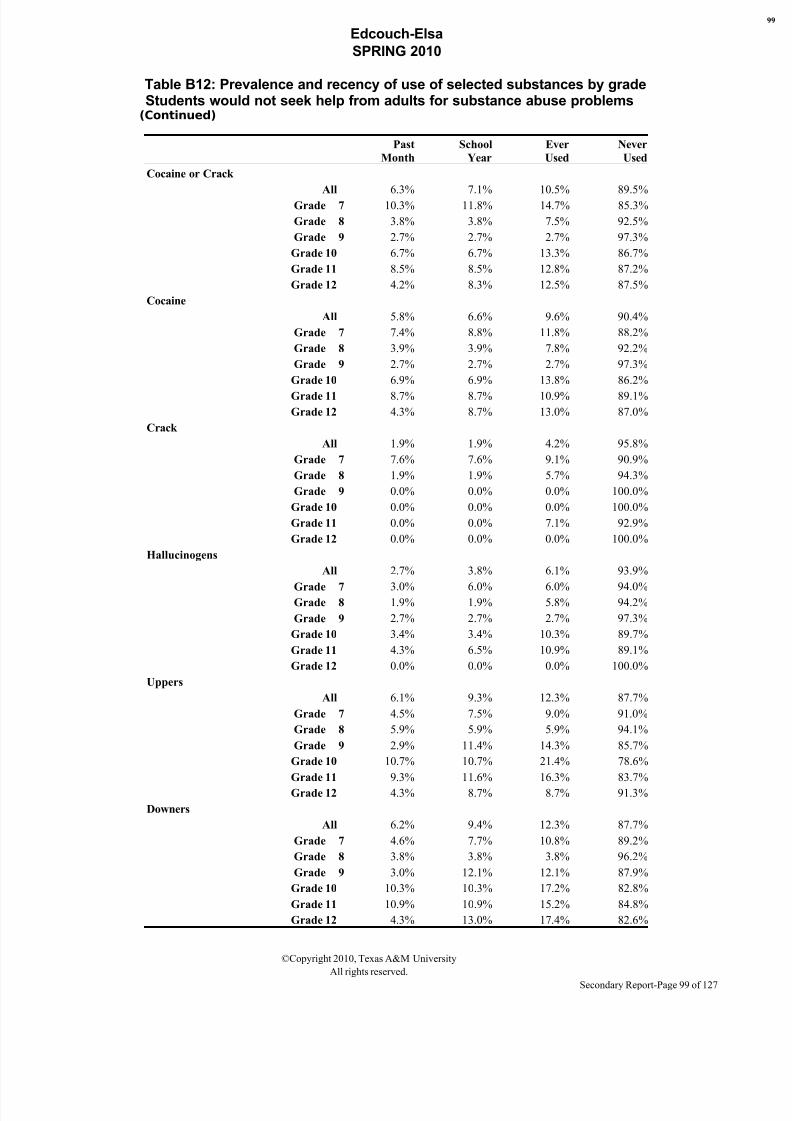
8/7/2019 HIDALGO COUNTY - edcouch-elsa isd _ 2010 Texas School Survey of Drug and Alcohol Use
http://slidepdf.com/reader/full/hidalgo-county-edcouch-elsa-isd-2010-texas-school-survey-of-drug-and-alcohol 99/127
Edcouch-Elsa
SPRING 2010
Table B12: Prevalence and recency of use of selected substances by gradeStudents would not seek help from adults for substance abuse problems(Continued)
Past
Month
School
Year
Ever
Used
Never
Used
Cocaine or Crack
All 6.3% 7.1% 10.5% 89.5%
Grade 7 10.3% 11.8% 14.7% 85.3%
Grade 8 3.8% 3.8% 7.5% 92.5%
Grade 9 2.7% 2.7% 2.7% 97.3%
Grade 10 6.7% 6.7% 13.3% 86.7%
Grade 11 8.5% 8.5% 12.8% 87.2%
Grade 12 4.2% 8.3% 12.5% 87.5%
Cocaine
All 5.8% 6.6% 9.6% 90.4%
Grade 7 7.4% 8.8% 11.8% 88.2%
Grade 8 3.9% 3.9% 7.8% 92.2%
Grade 9 2.7% 2.7% 2.7% 97.3%
Grade 10 6.9% 6.9% 13.8% 86.2%
Grade 11 8.7% 8.7% 10.9% 89.1%
Grade 12 4.3% 8.7% 13.0% 87.0%
Crack
All 1.9% 1.9% 4.2% 95.8%
Grade 7 7.6% 7.6% 9.1% 90.9%
Grade 8 1.9% 1.9% 5.7% 94.3%
Grade 9 0.0% 0.0% 0.0% 100.0%
Grade 10 0.0% 0.0% 0.0% 100.0%
Grade 11 0.0% 0.0% 7.1% 92.9%
Grade 12 0.0% 0.0% 0.0% 100.0%
Hallucinogens
All 2.7% 3.8% 6.1% 93.9%
Grade 7 3.0% 6.0% 6.0% 94.0%Grade 8 1.9% 1.9% 5.8% 94.2%
Grade 9 2.7% 2.7% 2.7% 97.3%
Grade 10 3.4% 3.4% 10.3% 89.7%
Grade 11 4.3% 6.5% 10.9% 89.1%
Grade 12 0.0% 0.0% 0.0% 100.0%
Uppers
All 6.1% 9.3% 12.3% 87.7%
Grade 7 4.5% 7.5% 9.0% 91.0%
Grade 8 5.9% 5.9% 5.9% 94.1%
Grade 9 2.9% 11.4% 14.3% 85.7%
Grade 10 10.7% 10.7% 21.4% 78.6%
Grade 11 9.3% 11.6% 16.3% 83.7%
Grade 12 4.3% 8.7% 8.7% 91.3%
Downers
All 6.2% 9.4% 12.3% 87.7%
Grade 7 4.6% 7.7% 10.8% 89.2%
Grade 8 3.8% 3.8% 3.8% 96.2%
Grade 9 3.0% 12.1% 12.1% 87.9%
Grade 10 10.3% 10.3% 17.2% 82.8%
Grade 11 10.9% 10.9% 15.2% 84.8%
Grade 12 4.3% 13.0% 17.4% 82.6%
©Copyright 2010, Texas A&M University
All rights reserved.
Secondary Report-Page 99 of 127
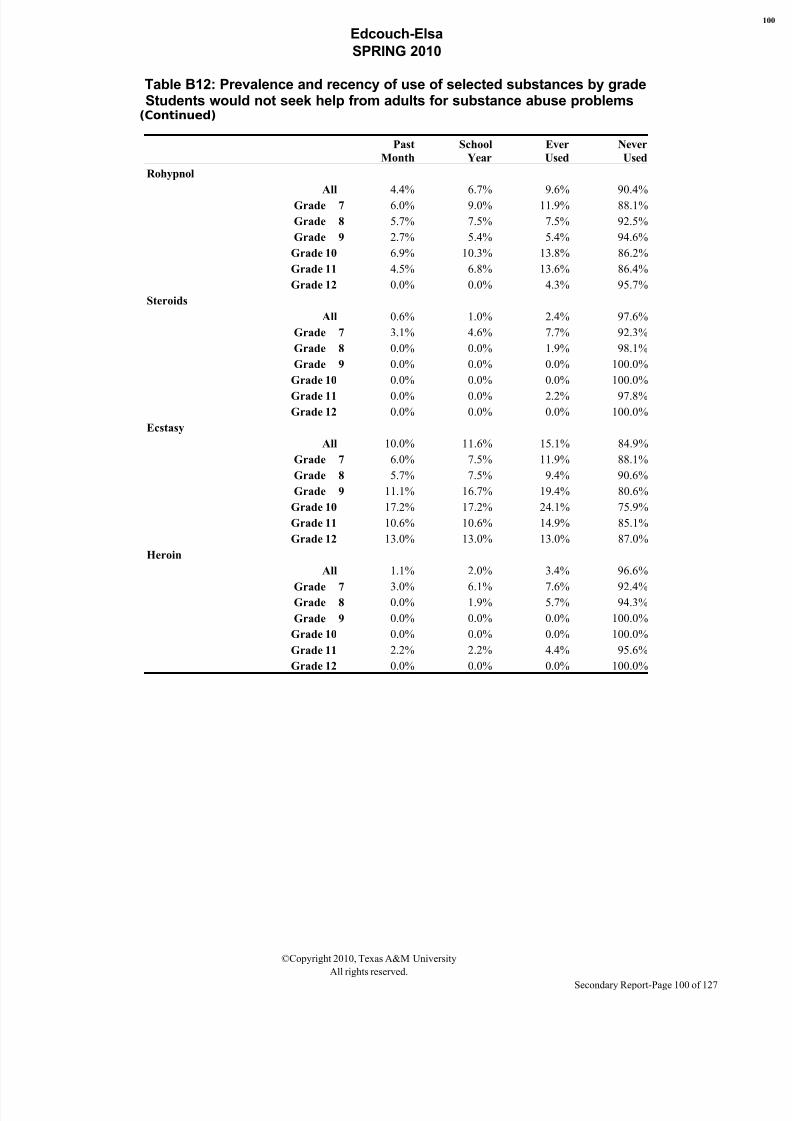
8/7/2019 HIDALGO COUNTY - edcouch-elsa isd _ 2010 Texas School Survey of Drug and Alcohol Use
http://slidepdf.com/reader/full/hidalgo-county-edcouch-elsa-isd-2010-texas-school-survey-of-drug-and-alcohol 100/127
Edcouch-Elsa
SPRING 2010
Table B12: Prevalence and recency of use of selected substances by gradeStudents would not seek help from adults for substance abuse problems(Continued)
Past
Month
School
Year
Ever
Used
Never
Used
Rohypnol
All 4.4% 6.7% 9.6% 90.4%
Grade 7 6.0% 9.0% 11.9% 88.1%
Grade 8 5.7% 7.5% 7.5% 92.5%
Grade 9 2.7% 5.4% 5.4% 94.6%
Grade 10 6.9% 10.3% 13.8% 86.2%
Grade 11 4.5% 6.8% 13.6% 86.4%
Grade 12 0.0% 0.0% 4.3% 95.7%
Steroids
All 0.6% 1.0% 2.4% 97.6%
Grade 7 3.1% 4.6% 7.7% 92.3%
Grade 8 0.0% 0.0% 1.9% 98.1%
Grade 9 0.0% 0.0% 0.0% 100.0%
Grade 10 0.0% 0.0% 0.0% 100.0%
Grade 11 0.0% 0.0% 2.2% 97.8%
Grade 12 0.0% 0.0% 0.0% 100.0%
Ecstasy
All 10.0% 11.6% 15.1% 84.9%
Grade 7 6.0% 7.5% 11.9% 88.1%
Grade 8 5.7% 7.5% 9.4% 90.6%
Grade 9 11.1% 16.7% 19.4% 80.6%
Grade 10 17.2% 17.2% 24.1% 75.9%
Grade 11 10.6% 10.6% 14.9% 85.1%
Grade 12 13.0% 13.0% 13.0% 87.0%
Heroin
All 1.1% 2.0% 3.4% 96.6%
Grade 7 3.0% 6.1% 7.6% 92.4%Grade 8 0.0% 1.9% 5.7% 94.3%
Grade 9 0.0% 0.0% 0.0% 100.0%
Grade 10 0.0% 0.0% 0.0% 100.0%
Grade 11 2.2% 2.2% 4.4% 95.6%
Grade 12 0.0% 0.0% 0.0% 100.0%
©Copyright 2010, Texas A&M University
All rights reserved.
Secondary Report-Page 100 of 127
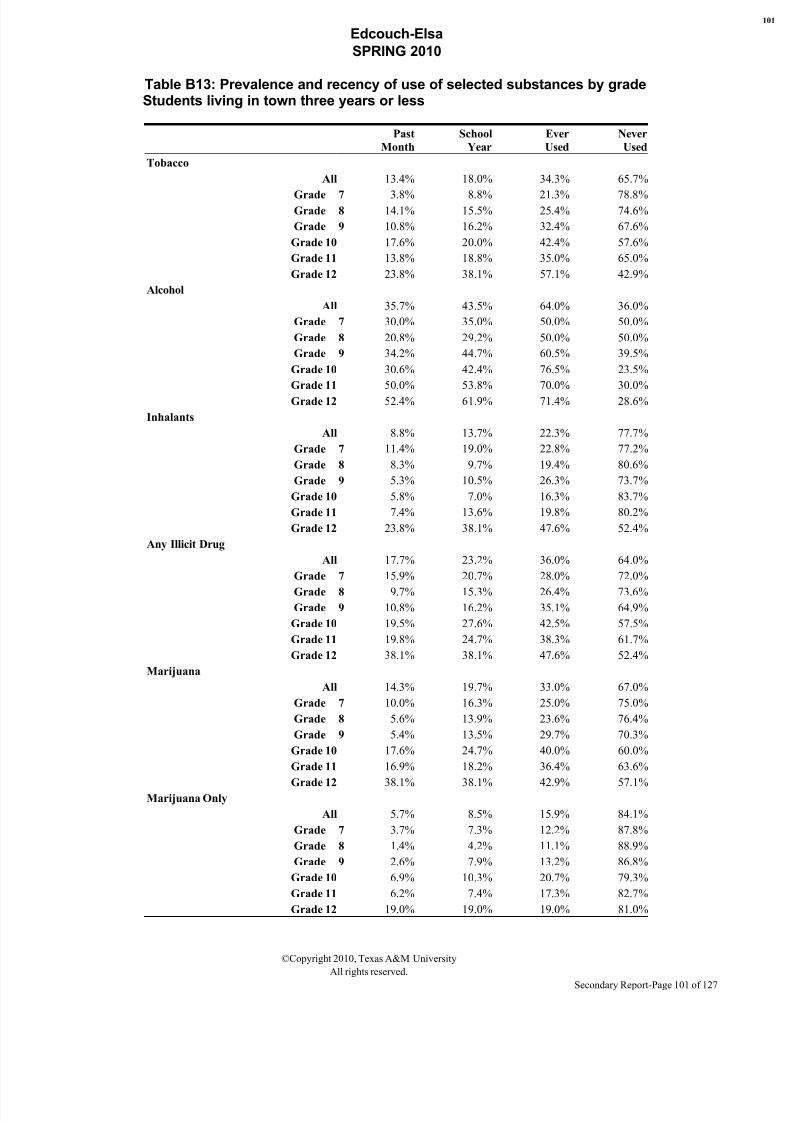
8/7/2019 HIDALGO COUNTY - edcouch-elsa isd _ 2010 Texas School Survey of Drug and Alcohol Use
http://slidepdf.com/reader/full/hidalgo-county-edcouch-elsa-isd-2010-texas-school-survey-of-drug-and-alcohol 101/127
Edcouch-Elsa
SPRING 2010
Table B13: Prevalence and recency of use of selected substances by gradeStudents living in town three years or less
Past
Month
School
Year
Ever
Used
Never
Used
Tobacco
All 13.4% 18.0% 34.3% 65.7%
Grade 7 3.8% 8.8% 21.3% 78.8%Grade 8 14.1% 15.5% 25.4% 74.6%
Grade 9 10.8% 16.2% 32.4% 67.6%
Grade 10 17.6% 20.0% 42.4% 57.6%
Grade 11 13.8% 18.8% 35.0% 65.0%
Grade 12 23.8% 38.1% 57.1% 42.9%
Alcohol
All 35.7% 43.5% 64.0% 36.0%
Grade 7 30.0% 35.0% 50.0% 50.0%
Grade 8 20.8% 29.2% 50.0% 50.0%
Grade 9 34.2% 44.7% 60.5% 39.5%
Grade 10 30.6% 42.4% 76.5% 23.5%
Grade 11 50.0% 53.8% 70.0% 30.0%
Grade 12 52.4% 61.9% 71.4% 28.6%
Inhalants
All 8.8% 13.7% 22.3% 77.7%
Grade 7 11.4% 19.0% 22.8% 77.2%
Grade 8 8.3% 9.7% 19.4% 80.6%
Grade 9 5.3% 10.5% 26.3% 73.7%
Grade 10 5.8% 7.0% 16.3% 83.7%
Grade 11 7.4% 13.6% 19.8% 80.2%
Grade 12 23.8% 38.1% 47.6% 52.4%
Any Illicit Drug
All 17.7% 23.2% 36.0% 64.0%
Grade 7 15.9% 20.7% 28.0% 72.0%
Grade 8 9.7% 15.3% 26.4% 73.6%
Grade 9 10.8% 16.2% 35.1% 64.9%
Grade 10 19.5% 27.6% 42.5% 57.5%
Grade 11 19.8% 24.7% 38.3% 61.7%
Grade 12 38.1% 38.1% 47.6% 52.4%
Marijuana
All 14.3% 19.7% 33.0% 67.0%
Grade 7 10.0% 16.3% 25.0% 75.0%
Grade 8 5.6% 13.9% 23.6% 76.4%
Grade 9 5.4% 13.5% 29.7% 70.3%
Grade 10 17.6% 24.7% 40.0% 60.0%
Grade 11 16.9% 18.2% 36.4% 63.6%
Grade 12 38.1% 38.1% 42.9% 57.1%Marijuana Only
All 5.7% 8.5% 15.9% 84.1%
Grade 7 3.7% 7.3% 12.2% 87.8%
Grade 8 1.4% 4.2% 11.1% 88.9%
Grade 9 2.6% 7.9% 13.2% 86.8%
Grade 10 6.9% 10.3% 20.7% 79.3%
Grade 11 6.2% 7.4% 17.3% 82.7%
Grade 12 19.0% 19.0% 19.0% 81.0%
©Copyright 2010, Texas A&M University
All rights reserved.
Secondary Report-Page 101 of 127

8/7/2019 HIDALGO COUNTY - edcouch-elsa isd _ 2010 Texas School Survey of Drug and Alcohol Use
http://slidepdf.com/reader/full/hidalgo-county-edcouch-elsa-isd-2010-texas-school-survey-of-drug-and-alcohol 102/127
Edcouch-Elsa
SPRING 2010
©Copyright 2010, Texas A&M University
All rights reserved.
Secondary Report-Page 102 of 127
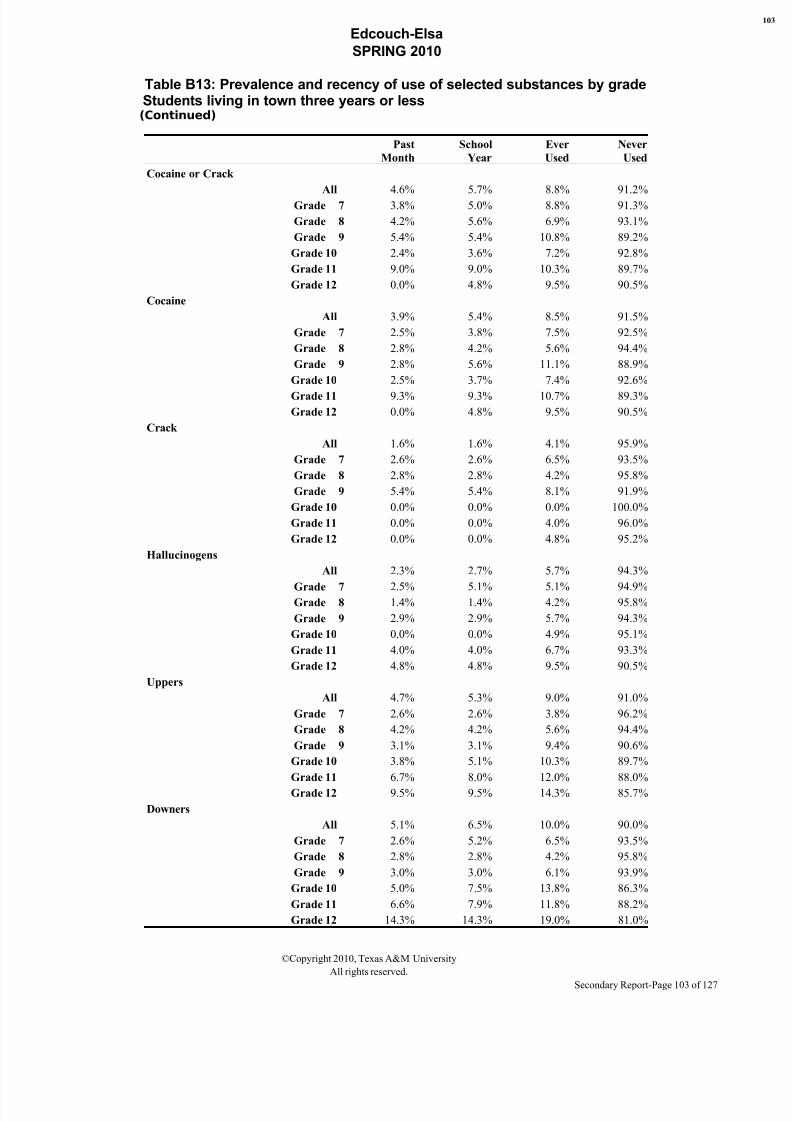
8/7/2019 HIDALGO COUNTY - edcouch-elsa isd _ 2010 Texas School Survey of Drug and Alcohol Use
http://slidepdf.com/reader/full/hidalgo-county-edcouch-elsa-isd-2010-texas-school-survey-of-drug-and-alcohol 103/127
Edcouch-Elsa
SPRING 2010
Table B13: Prevalence and recency of use of selected substances by gradeStudents living in town three years or less(Continued)
Past
Month
School
Year
Ever
Used
Never
Used
Cocaine or Crack
All 4.6% 5.7% 8.8% 91.2%
Grade 7 3.8% 5.0% 8.8% 91.3%
Grade 8 4.2% 5.6% 6.9% 93.1%
Grade 9 5.4% 5.4% 10.8% 89.2%
Grade 10 2.4% 3.6% 7.2% 92.8%
Grade 11 9.0% 9.0% 10.3% 89.7%
Grade 12 0.0% 4.8% 9.5% 90.5%
Cocaine
All 3.9% 5.4% 8.5% 91.5%
Grade 7 2.5% 3.8% 7.5% 92.5%
Grade 8 2.8% 4.2% 5.6% 94.4%
Grade 9 2.8% 5.6% 11.1% 88.9%
Grade 10 2.5% 3.7% 7.4% 92.6%
Grade 11 9.3% 9.3% 10.7% 89.3%
Grade 12 0.0% 4.8% 9.5% 90.5%
Crack
All 1.6% 1.6% 4.1% 95.9%
Grade 7 2.6% 2.6% 6.5% 93.5%
Grade 8 2.8% 2.8% 4.2% 95.8%
Grade 9 5.4% 5.4% 8.1% 91.9%
Grade 10 0.0% 0.0% 0.0% 100.0%
Grade 11 0.0% 0.0% 4.0% 96.0%
Grade 12 0.0% 0.0% 4.8% 95.2%
Hallucinogens
All 2.3% 2.7% 5.7% 94.3%
Grade 7 2.5% 5.1% 5.1% 94.9%Grade 8 1.4% 1.4% 4.2% 95.8%
Grade 9 2.9% 2.9% 5.7% 94.3%
Grade 10 0.0% 0.0% 4.9% 95.1%
Grade 11 4.0% 4.0% 6.7% 93.3%
Grade 12 4.8% 4.8% 9.5% 90.5%
Uppers
All 4.7% 5.3% 9.0% 91.0%
Grade 7 2.6% 2.6% 3.8% 96.2%
Grade 8 4.2% 4.2% 5.6% 94.4%
Grade 9 3.1% 3.1% 9.4% 90.6%
Grade 10 3.8% 5.1% 10.3% 89.7%
Grade 11 6.7% 8.0% 12.0% 88.0%
Grade 12 9.5% 9.5% 14.3% 85.7%
Downers
All 5.1% 6.5% 10.0% 90.0%
Grade 7 2.6% 5.2% 6.5% 93.5%
Grade 8 2.8% 2.8% 4.2% 95.8%
Grade 9 3.0% 3.0% 6.1% 93.9%
Grade 10 5.0% 7.5% 13.8% 86.3%
Grade 11 6.6% 7.9% 11.8% 88.2%
Grade 12 14.3% 14.3% 19.0% 81.0%
©Copyright 2010, Texas A&M University
All rights reserved.
Secondary Report-Page 103 of 127

8/7/2019 HIDALGO COUNTY - edcouch-elsa isd _ 2010 Texas School Survey of Drug and Alcohol Use
http://slidepdf.com/reader/full/hidalgo-county-edcouch-elsa-isd-2010-texas-school-survey-of-drug-and-alcohol 104/127
Edcouch-Elsa
SPRING 2010
Table B13: Prevalence and recency of use of selected substances by gradeStudents living in town three years or less(Continued)
Past
Month
School
Year
Ever
Used
Never
Used
Rohypnol
All 4.5% 5.9% 8.3% 91.7%
Grade 7 3.8% 5.1% 6.4% 93.6%
Grade 8 2.9% 4.3% 5.7% 94.3%
Grade 9 3.0% 6.1% 12.1% 87.9%
Grade 10 2.6% 5.1% 7.7% 92.3%
Grade 11 5.5% 5.5% 8.2% 91.8%
Grade 12 14.3% 14.3% 14.3% 85.7%
Steroids
All 0.4% 0.4% 1.1% 98.9%
Grade 7 0.0% 0.0% 1.3% 98.7%
Grade 8 0.0% 0.0% 1.4% 98.6%
Grade 9 2.9% 2.9% 2.9% 97.1%
Grade 10 0.0% 0.0% 0.0% 100.0%
Grade 11 0.0% 0.0% 1.4% 98.6%
Grade 12 0.0% 0.0% 0.0% 100.0%
Ecstasy
All 6.4% 8.2% 12.4% 87.6%
Grade 7 2.5% 3.8% 5.1% 94.9%
Grade 8 4.3% 4.3% 4.3% 95.7%
Grade 9 3.1% 6.3% 18.8% 81.3%
Grade 10 8.5% 11.0% 15.9% 84.1%
Grade 11 10.5% 13.2% 15.8% 84.2%
Grade 12 4.8% 4.8% 14.3% 85.7%
Heroin
All 1.2% 1.4% 3.0% 97.0%
Grade 7 1.3% 2.5% 2.5% 97.5%Grade 8 0.0% 0.0% 1.4% 98.6%
Grade 9 0.0% 0.0% 8.6% 91.4%
Grade 10 0.0% 0.0% 0.0% 100.0%
Grade 11 2.7% 2.7% 4.0% 96.0%
Grade 12 4.8% 4.8% 4.8% 95.2%
©Copyright 2010, Texas A&M University
All rights reserved.
Secondary Report-Page 104 of 127
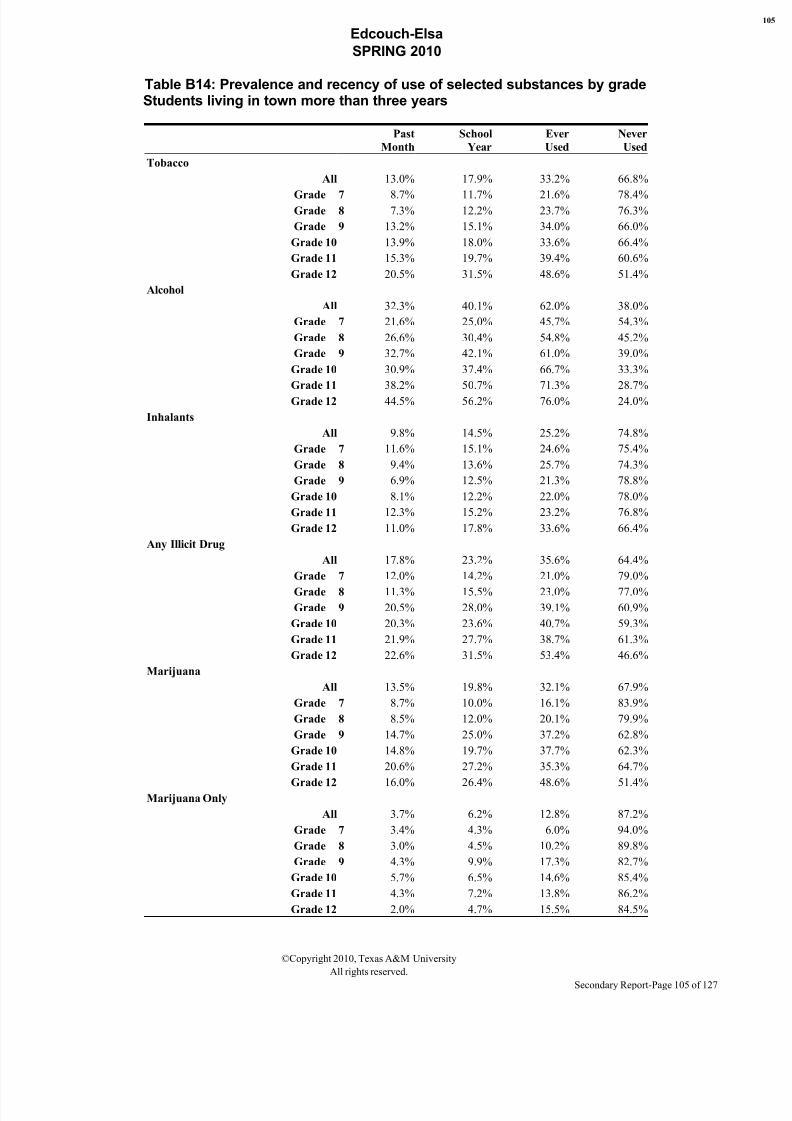
8/7/2019 HIDALGO COUNTY - edcouch-elsa isd _ 2010 Texas School Survey of Drug and Alcohol Use
http://slidepdf.com/reader/full/hidalgo-county-edcouch-elsa-isd-2010-texas-school-survey-of-drug-and-alcohol 105/127
Edcouch-Elsa
SPRING 2010
Table B14: Prevalence and recency of use of selected substances by gradeStudents living in town more than three years
Past
Month
School
Year
Ever
Used
Never
Used
Tobacco
All 13.0% 17.9% 33.2% 66.8%
Grade 7 8.7% 11.7% 21.6% 78.4%Grade 8 7.3% 12.2% 23.7% 76.3%
Grade 9 13.2% 15.1% 34.0% 66.0%
Grade 10 13.9% 18.0% 33.6% 66.4%
Grade 11 15.3% 19.7% 39.4% 60.6%
Grade 12 20.5% 31.5% 48.6% 51.4%
Alcohol
All 32.3% 40.1% 62.0% 38.0%
Grade 7 21.6% 25.0% 45.7% 54.3%
Grade 8 26.6% 30.4% 54.8% 45.2%
Grade 9 32.7% 42.1% 61.0% 39.0%
Grade 10 30.9% 37.4% 66.7% 33.3%
Grade 11 38.2% 50.7% 71.3% 28.7%
Grade 12 44.5% 56.2% 76.0% 24.0%
Inhalants
All 9.8% 14.5% 25.2% 74.8%
Grade 7 11.6% 15.1% 24.6% 75.4%
Grade 8 9.4% 13.6% 25.7% 74.3%
Grade 9 6.9% 12.5% 21.3% 78.8%
Grade 10 8.1% 12.2% 22.0% 78.0%
Grade 11 12.3% 15.2% 23.2% 76.8%
Grade 12 11.0% 17.8% 33.6% 66.4%
Any Illicit Drug
All 17.8% 23.2% 35.6% 64.4%
Grade 7 12.0% 14.2% 21.0% 79.0%
Grade 8 11.3% 15.5% 23.0% 77.0%
Grade 9 20.5% 28.0% 39.1% 60.9%
Grade 10 20.3% 23.6% 40.7% 59.3%
Grade 11 21.9% 27.7% 38.7% 61.3%
Grade 12 22.6% 31.5% 53.4% 46.6%
Marijuana
All 13.5% 19.8% 32.1% 67.9%
Grade 7 8.7% 10.0% 16.1% 83.9%
Grade 8 8.5% 12.0% 20.1% 79.9%
Grade 9 14.7% 25.0% 37.2% 62.8%
Grade 10 14.8% 19.7% 37.7% 62.3%
Grade 11 20.6% 27.2% 35.3% 64.7%
Grade 12 16.0% 26.4% 48.6% 51.4%Marijuana Only
All 3.7% 6.2% 12.8% 87.2%
Grade 7 3.4% 4.3% 6.0% 94.0%
Grade 8 3.0% 4.5% 10.2% 89.8%
Grade 9 4.3% 9.9% 17.3% 82.7%
Grade 10 5.7% 6.5% 14.6% 85.4%
Grade 11 4.3% 7.2% 13.8% 86.2%
Grade 12 2.0% 4.7% 15.5% 84.5%
©Copyright 2010, Texas A&M University
All rights reserved.
Secondary Report-Page 105 of 127

8/7/2019 HIDALGO COUNTY - edcouch-elsa isd _ 2010 Texas School Survey of Drug and Alcohol Use
http://slidepdf.com/reader/full/hidalgo-county-edcouch-elsa-isd-2010-texas-school-survey-of-drug-and-alcohol 106/127
Edcouch-Elsa
SPRING 2010
©Copyright 2010, Texas A&M University
All rights reserved.
Secondary Report-Page 106 of 127

8/7/2019 HIDALGO COUNTY - edcouch-elsa isd _ 2010 Texas School Survey of Drug and Alcohol Use
http://slidepdf.com/reader/full/hidalgo-county-edcouch-elsa-isd-2010-texas-school-survey-of-drug-and-alcohol 107/127
Edcouch-Elsa
SPRING 2010
Table B14: Prevalence and recency of use of selected substances by gradeStudents living in town more than three years(Continued)
Past
Month
School
Year
Ever
Used
Never
Used
Cocaine or Crack
All 2.3% 4.2% 7.6% 92.4%
Grade 7 2.2% 3.1% 3.9% 96.1%
Grade 8 1.2% 3.1% 4.2% 95.8%
Grade 9 2.6% 3.9% 4.6% 95.4%
Grade 10 1.6% 1.6% 4.9% 95.1%
Grade 11 2.9% 4.4% 8.1% 91.9%
Grade 12 3.4% 8.2% 19.2% 80.8%
Cocaine
All 2.2% 4.0% 7.4% 92.6%
Grade 7 1.3% 1.7% 3.1% 96.9%
Grade 8 1.2% 3.1% 4.3% 95.7%
Grade 9 2.6% 3.9% 4.6% 95.4%
Grade 10 1.7% 1.7% 5.0% 95.0%
Grade 11 2.9% 4.4% 7.4% 92.6%
Grade 12 3.5% 8.3% 19.4% 80.6%
Crack
All 0.4% 0.6% 1.4% 98.6%
Grade 7 1.8% 2.6% 2.6% 97.4%
Grade 8 0.4% 0.8% 1.2% 98.8%
Grade 9 0.0% 0.0% 0.7% 99.3%
Grade 10 0.0% 0.0% 0.8% 99.2%
Grade 11 0.0% 0.0% 2.3% 97.7%
Grade 12 0.0% 0.0% 0.7% 99.3%
Hallucinogens
All 1.7% 2.5% 5.0% 95.0%
Grade 7 1.3% 1.3% 2.2% 97.8%Grade 8 0.8% 1.6% 2.7% 97.3%
Grade 9 2.6% 3.9% 4.6% 95.4%
Grade 10 2.5% 2.5% 6.7% 93.3%
Grade 11 1.5% 3.1% 6.1% 93.9%
Grade 12 1.4% 2.8% 8.5% 91.5%
Uppers
All 4.0% 6.3% 9.5% 90.5%
Grade 7 1.3% 3.6% 4.5% 95.5%
Grade 8 1.9% 2.7% 3.5% 96.5%
Grade 9 6.7% 10.0% 12.7% 87.3%
Grade 10 6.7% 7.6% 10.9% 89.1%
Grade 11 3.1% 4.6% 13.1% 86.9%
Grade 12 4.9% 9.1% 14.0% 86.0%
Downers
All 4.5% 6.5% 10.8% 89.2%
Grade 7 1.4% 2.3% 3.6% 96.4%
Grade 8 2.3% 3.1% 4.3% 95.7%
Grade 9 6.6% 9.3% 11.9% 88.1%
Grade 10 6.7% 7.5% 13.3% 86.7%
Grade 11 4.5% 6.0% 14.3% 85.7%
Grade 12 6.3% 11.1% 18.8% 81.3%
©Copyright 2010, Texas A&M University
All rights reserved.
Secondary Report-Page 107 of 127
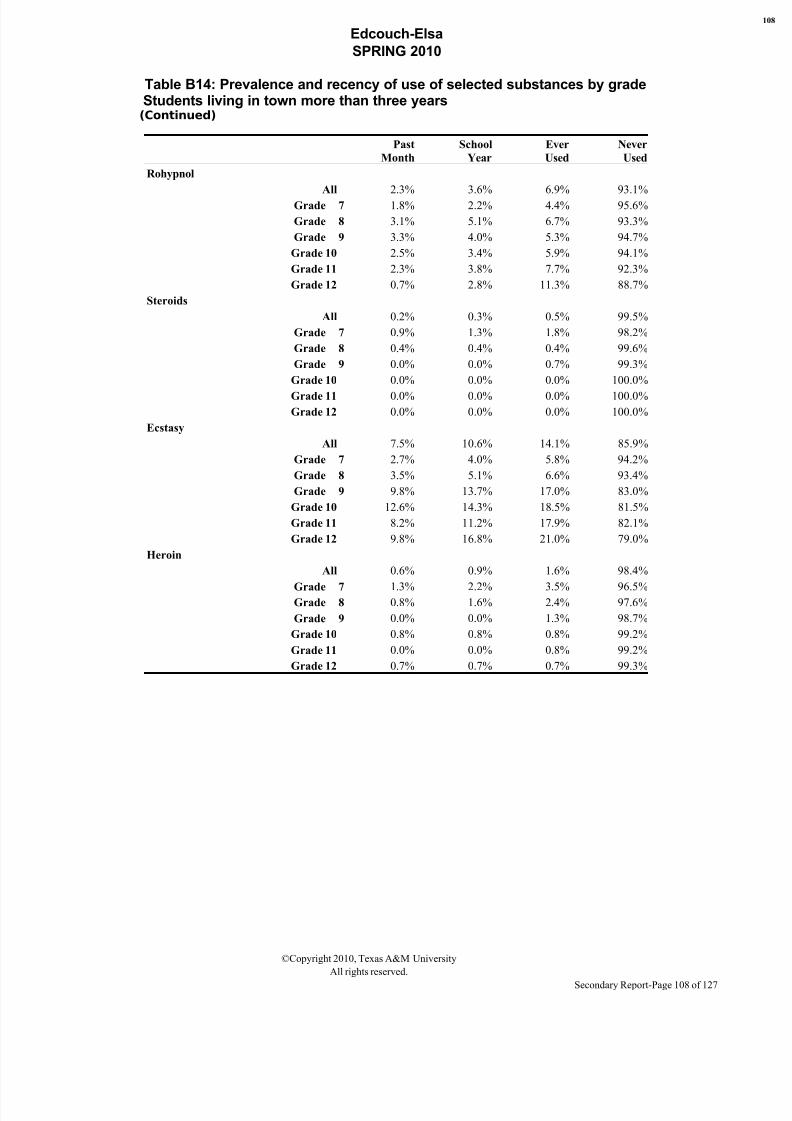
8/7/2019 HIDALGO COUNTY - edcouch-elsa isd _ 2010 Texas School Survey of Drug and Alcohol Use
http://slidepdf.com/reader/full/hidalgo-county-edcouch-elsa-isd-2010-texas-school-survey-of-drug-and-alcohol 108/127
Edcouch-Elsa
SPRING 2010
Table B14: Prevalence and recency of use of selected substances by gradeStudents living in town more than three years(Continued)
Past
Month
School
Year
Ever
Used
Never
Used
Rohypnol
All 2.3% 3.6% 6.9% 93.1%
Grade 7 1.8% 2.2% 4.4% 95.6%
Grade 8 3.1% 5.1% 6.7% 93.3%
Grade 9 3.3% 4.0% 5.3% 94.7%
Grade 10 2.5% 3.4% 5.9% 94.1%
Grade 11 2.3% 3.8% 7.7% 92.3%
Grade 12 0.7% 2.8% 11.3% 88.7%
Steroids
All 0.2% 0.3% 0.5% 99.5%
Grade 7 0.9% 1.3% 1.8% 98.2%
Grade 8 0.4% 0.4% 0.4% 99.6%
Grade 9 0.0% 0.0% 0.7% 99.3%
Grade 10 0.0% 0.0% 0.0% 100.0%
Grade 11 0.0% 0.0% 0.0% 100.0%
Grade 12 0.0% 0.0% 0.0% 100.0%
Ecstasy
All 7.5% 10.6% 14.1% 85.9%
Grade 7 2.7% 4.0% 5.8% 94.2%
Grade 8 3.5% 5.1% 6.6% 93.4%
Grade 9 9.8% 13.7% 17.0% 83.0%
Grade 10 12.6% 14.3% 18.5% 81.5%
Grade 11 8.2% 11.2% 17.9% 82.1%
Grade 12 9.8% 16.8% 21.0% 79.0%
Heroin
All 0.6% 0.9% 1.6% 98.4%
Grade 7 1.3% 2.2% 3.5% 96.5%Grade 8 0.8% 1.6% 2.4% 97.6%
Grade 9 0.0% 0.0% 1.3% 98.7%
Grade 10 0.8% 0.8% 0.8% 99.2%
Grade 11 0.0% 0.0% 0.8% 99.2%
Grade 12 0.7% 0.7% 0.7% 99.3%
©Copyright 2010, Texas A&M University
All rights reserved.
Secondary Report-Page 108 of 127
8/7/2019 HIDALGO COUNTY - edcouch-elsa isd _ 2010 Texas School Survey of Drug and Alcohol Use
http://slidepdf.com/reader/full/hidalgo-county-edcouch-elsa-isd-2010-texas-school-survey-of-drug-and-alcohol 109/127
Edcouch-Elsa
SPRING 2010
3. Margin Tables
©Copyright 2010, Texas A&M University
All rights reserved.
Secondary Report-Page 109 of 127

8/7/2019 HIDALGO COUNTY - edcouch-elsa isd _ 2010 Texas School Survey of Drug and Alcohol Use
http://slidepdf.com/reader/full/hidalgo-county-edcouch-elsa-isd-2010-texas-school-survey-of-drug-and-alcohol 110/127
Edcouch-Elsa
SPRING 2010
©Copyright 2010, Texas A&M University
All rights reserved.
Secondary Report-Page 110 of 127
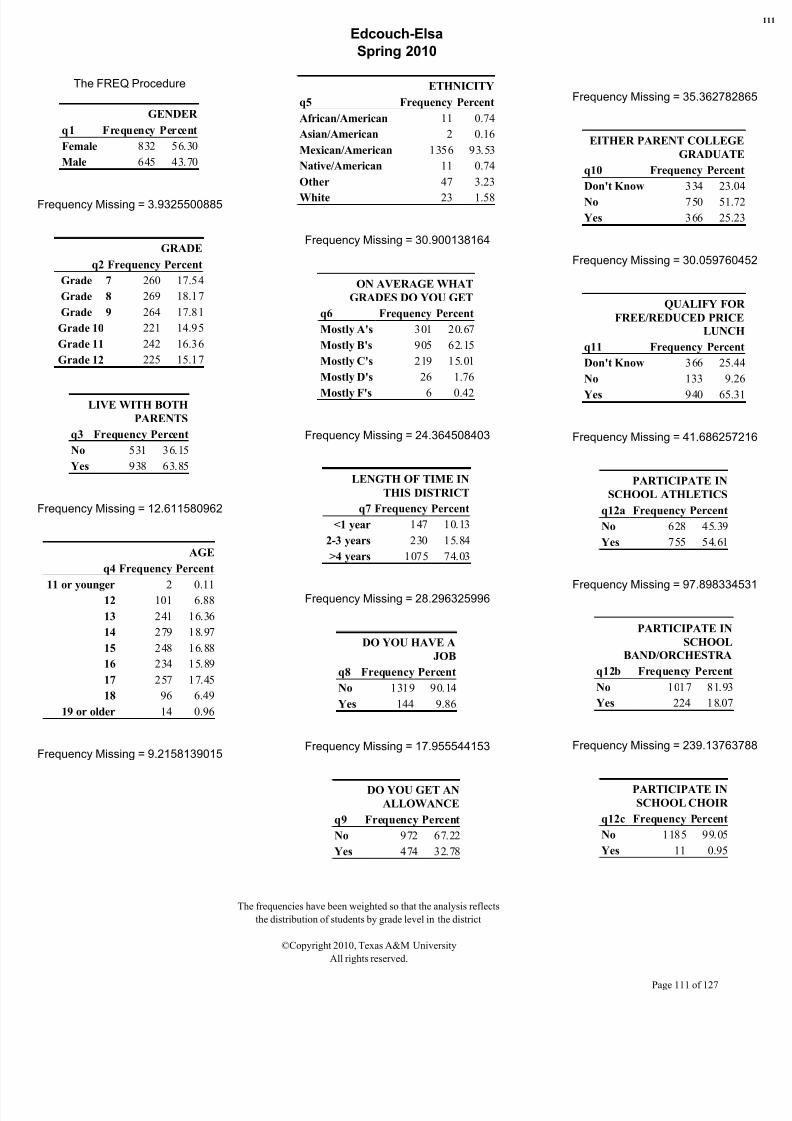
8/7/2019 HIDALGO COUNTY - edcouch-elsa isd _ 2010 Texas School Survey of Drug and Alcohol Use
http://slidepdf.com/reader/full/hidalgo-county-edcouch-elsa-isd-2010-texas-school-survey-of-drug-and-alcohol 111/127
Edcouch-Elsa
Spring 2010
The FREQ Procedure
GENDER
q1 Frequency Percent
Female 832 56.30
Male 645 43.70
Frequency Missing = 3.9325500885
GRADE
q2 Frequency Percent
Grade 7 260 17.54
Grade 8 269 18.17
Grade 9 264 17.81
Grade 10 221 14.95
Grade 11 242 16.36
Grade 12 225 15.17
LIVE WITH BOTH
PARENTS
q3 Frequency Percent
No 531 36.15
Yes 938 63.85
Frequency Missing = 12.611580962
AGE
q4 Frequency Percent
11 or younger 2 0.1112 101 6.88
13 241 16.36
14 279 18.97
15 248 16.88
16 234 15.89
17 257 17.45
18 96 6.49
19 or older 14 0.96
Frequency Missing = 9.2158139015
ETHNICITY
q5 Frequency Percent
African/American 11 0.74
Asian/American 2 0.16
Mexican/American 1356 93.53
Native/American 11 0.74
Other 47 3.23
White 23 1.58
Frequency Missing = 30.900138164
ON AVERAGE WHAT
GRADES DO YOU GET
q6 Frequency Percent
Mostly A's 301 20.67
Mostly B's 905 62.15
Mostly C's 219 15.01
Mostly D's 26 1.76
Mostly F's 6 0.42
Frequency Missing = 24.364508403
LENGTH OF TIME IN
THIS DISTRICT
q7 Frequency Percent
<1 year 147 10.13
2-3 years 230 15.84
>4 years 1075 74.03
Frequency Missing = 28.296325996
DO YOU HAVE A
JOB
q8 Frequency Percent
No 1319 90.14
Yes 144 9.86
Frequency Missing = 17.955544153
DO YOU GET AN
ALLOWANCE
q9 Frequency Percent
No 972 67.22
Yes 474 32.78
Frequency Missing = 35.3627828
EITHER PARENT COLLEGE
GRADUATE
q10 Frequency Percen
Don't Know 334 23.04
No 750 51.72
Yes 366 25.23
Frequency Missing = 30.0597604
QUALIFY FOR
FREE/REDUCED PRICE
LUNCH
q11 Frequency Percen
Don't Know 366 25.44
No 133 9.26
Yes 940 65.3
Frequency Missing = 41.6862572
PARTICIPATE IN
SCHOOL ATHLETICS
q12a Frequency Percent
No 628 45.39
Yes 755 54.61
Frequency Missing = 97.8983345
PARTICIPATE IN
SCHOOL
BAND/ORCHESTRA
q12b Frequency Percent
No 1017 81.93
Yes 224 18.07
Frequency Missing = 239.137637
PARTICIPATE INSCHOOL CHOIR
q12c Frequency Percent
No 1185 99.05
Yes 11 0.95
The frequencies have been weighted so that the analysis reflects
the distribution of students by grade level in the district
©Copyright 2010, Texas A&M University
All rights reserved.
Page 111 of 127
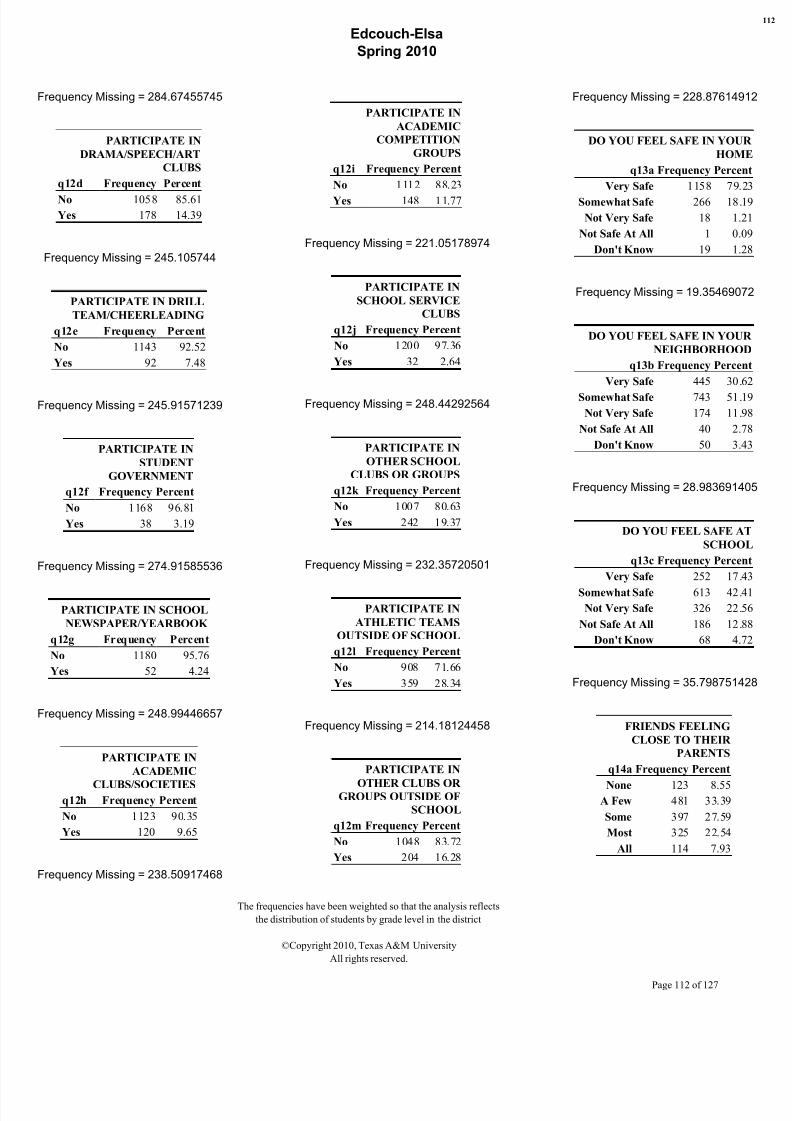
8/7/2019 HIDALGO COUNTY - edcouch-elsa isd _ 2010 Texas School Survey of Drug and Alcohol Use
http://slidepdf.com/reader/full/hidalgo-county-edcouch-elsa-isd-2010-texas-school-survey-of-drug-and-alcohol 112/127
Edcouch-Elsa
Spring 2010
Frequency Missing = 284.67455745
PARTICIPATE IN
DRAMA/SPEECH/ART
CLUBS
q12d Frequency Percent
No 1058 85.61
Yes 178 14.39
Frequency Missing = 245.105744
PARTICIPATE IN DRILL
TEAM/CHEERLEADING
q12e Frequency Percent
No 1143 92.52
Yes 92 7.48
Frequency Missing = 245.91571239
PARTICIPATE IN
STUDENT
GOVERNMENT
q12f Frequency Percent
No 1168 96.81
Yes 38 3.19
Frequency Missing = 274.91585536
PARTICIPATE IN SCHOOL
NEWSPAPER/YEARBOOK
q12g Frequency Percent
No 1180 95.76
Yes 52 4.24
Frequency Missing = 248.99446657
PARTICIPATE IN
ACADEMIC
CLUBS/SOCIETIESq12h Frequency Percent
No 1123 90.35
Yes 120 9.65
Frequency Missing = 238.50917468
PARTICIPATE IN
ACADEMIC
COMPETITION
GROUPS
q12i Frequency Percent
No 1112 88.23
Yes 148 11.77
Frequency Missing = 221.05178974
PARTICIPATE IN
SCHOOL SERVICE
CLUBS
q12j Frequency Percent
No 1200 97.36
Yes 32 2.64
Frequency Missing = 248.44292564
PARTICIPATE IN
OTHER SCHOOL
CLUBS OR GROUPS
q12k Frequency Percent
No 1007 80.63
Yes 242 19.37
Frequency Missing = 232.35720501
PARTICIPATE IN
ATHLETIC TEAMS
OUTSIDE OF SCHOOL
q12l Frequency Percent
No 908 71.66
Yes 359 28.34
Frequency Missing = 214.18124458
PARTICIPATE IN
OTHER CLUBS OR GROUPS OUTSIDE OF
SCHOOL
q12m Frequency Percent
No 1048 83.72
Yes 204 16.28
Frequency Missing = 228.876149
DO YOU FEEL SAFE IN YOU
HOM
q13a Frequency Perce
Very Safe 1158 79.
Somewhat Safe 266 18.
Not Very Safe 18 1.
Not Safe At All 1 0.
Don't Know 19 1.
Frequency Missing = 19.354690
DO YOU FEEL SAFE IN YOU
NEIGHBORHOO
q13b Frequency Perce
Very Safe 445 30.
Somewhat Safe 743 51.
Not Very Safe 174 11.
Not Safe At All 40 2.
Don't Know 50 3.
Frequency Missing = 28.9836914
DO YOU FEEL SAFE A
SCHOO
q13c Frequency Perce
Very Safe 252 17.
Somewhat Safe 613 42.
Not Very Safe 326 22.
Not Safe At All 186 12.
Don't Know 68 4.
Frequency Missing = 35.7987514
FRIENDS FEELING
CLOSE TO THEIR
PARENTS
q14a Frequency Percent
None 123 8.55A Few 481 33.39
Some 397 27.59
Most 325 22.54
All 114 7.93
The frequencies have been weighted so that the analysis reflects
the distribution of students by grade level in the district
©Copyright 2010, Texas A&M University
All rights reserved.
Page 112 of 127
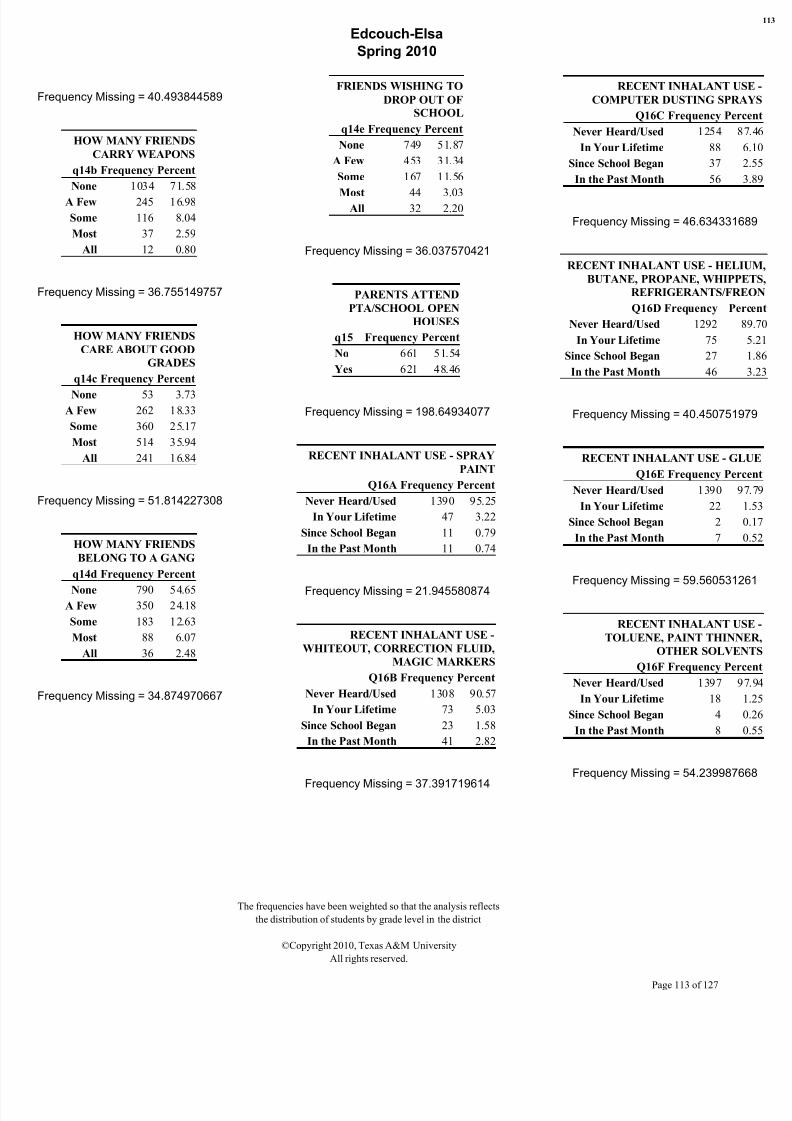
8/7/2019 HIDALGO COUNTY - edcouch-elsa isd _ 2010 Texas School Survey of Drug and Alcohol Use
http://slidepdf.com/reader/full/hidalgo-county-edcouch-elsa-isd-2010-texas-school-survey-of-drug-and-alcohol 113/127
Edcouch-Elsa
Spring 2010
Frequency Missing = 40.493844589
HOW MANY FRIENDS
CARRY WEAPONS
q14b Frequency Percent
None 1034 71.58
A Few 245 16.98
Some 116 8.04
Most 37 2.59
All 12 0.80
Frequency Missing = 36.755149757
HOW MANY FRIENDS
CARE ABOUT GOOD
GRADES
q14c Frequency Percent
None 53 3.73A Few 262 18.33
Some 360 25.17
Most 514 35.94
All 241 16.84
Frequency Missing = 51.814227308
HOW MANY FRIENDS
BELONG TO A GANG
q14d Frequency Percent
None 790 54.65A Few 350 24.18
Some 183 12.63
Most 88 6.07
All 36 2.48
Frequency Missing = 34.874970667
FRIENDS WISHING TO
DROP OUT OF
SCHOOL
q14e Frequency Percent
None 749 51.87
A Few 453 31.34
Some 167 11.56
Most 44 3.03All 32 2.20
Frequency Missing = 36.037570421
PARENTS ATTEND
PTA/SCHOOL OPEN
HOUSES
q15 Frequency Percent
No 661 51.54
Yes 621 48.46
Frequency Missing = 198.64934077
RECENT INHALANT USE - SPRAY
PAINT
Q16A Frequency Percent
Never Heard/Used 1390 95.25
In Your Lifetime 47 3.22
Since School Began 11 0.79
In the Past Month 11 0.74
Frequency Missing = 21.945580874
RECENT INHALANT USE -
WHITEOUT, CORRECTION FLUID,
MAGIC MARKERS
Q16B Frequency Percent
Never Heard/Used 1308 90.57
In Your Lifetime 73 5.03
Since School Began 23 1.58
In the Past Month 41 2.82
Frequency Missing = 37.391719614
RECENT INHALANT U
COMPUTER DUSTING SPRA
Q16C Frequency Per
Never Heard/Used 1254 8
In Your Lifetime 88
Since School Began 37
In the Past Month 56
Frequency Missing = 46.6343316
RECENT INHALANT USE - HEL
BUTANE, PROPANE, WHIPP
REFRIGERANTS/FR
Q16D Frequency Pe
Never Heard/Used 1292
In Your Lifetime 75
Since School Began 27
In the Past Month 46
Frequency Missing = 40.4507519
RECENT INHALANT USE - GL
Q16E Frequency Per
Never Heard/Used 1390 9
In Your Lifetime 22
Since School Began 2
In the Past Month 7
Frequency Missing = 59.5605312
RECENT INHALANT U
TOLUENE, PAINT THINN
OTHER SOLVE
Q16F Frequency Per
Never Heard/Used 1397 9
In Your Lifetime 18
Since School Began 4
In the Past Month 8
Frequency Missing = 54.2399876
The frequencies have been weighted so that the analysis reflects
the distribution of students by grade level in the district
©Copyright 2010, Texas A&M University
All rights reserved.
Page 113 of 127
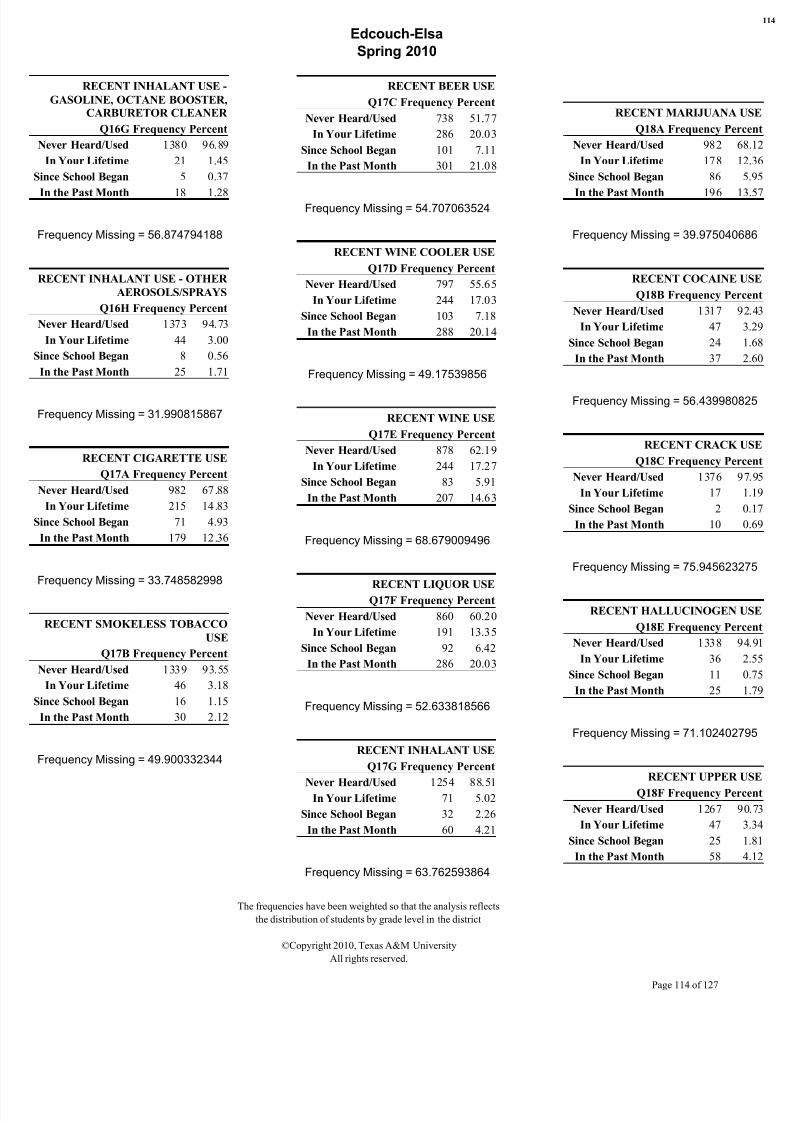
8/7/2019 HIDALGO COUNTY - edcouch-elsa isd _ 2010 Texas School Survey of Drug and Alcohol Use
http://slidepdf.com/reader/full/hidalgo-county-edcouch-elsa-isd-2010-texas-school-survey-of-drug-and-alcohol 114/127
Edcouch-Elsa
Spring 2010
RECENT INHALANT USE -
GASOLINE, OCTANE BOOSTER,
CARBURETOR CLEANER
Q16G Frequency Percent
Never Heard/Used 1380 96.89
In Your Lifetime 21 1.45
Since School Began 5 0.37
In the Past Month 18 1.28
Frequency Missing = 56.874794188
RECENT INHALANT USE - OTHER
AEROSOLS/SPRAYS
Q16H Frequency Percent
Never Heard/Used 1373 94.73
In Your Lifetime 44 3.00
Since School Began 8 0.56
In the Past Month 25 1.71
Frequency Missing = 31.990815867
RECENT CIGARETTE USE
Q17A Frequency Percent
Never Heard/Used 982 67.88
In Your Lifetime 215 14.83
Since School Began 71 4.93
In the Past Month 179 12.36
Frequency Missing = 33.748582998
RECENT SMOKELESS TOBACCO
USE
Q17B Frequency Percent
Never Heard/Used 1339 93.55
In Your Lifetime 46 3.18
Since School Began 16 1.15
In the Past Month 30 2.12
Frequency Missing = 49.900332344
RECENT BEER USE
Q17C Frequency Percent
Never Heard/Used 738 51.77
In Your Lifetime 286 20.03
Since School Began 101 7.11
In the Past Month 301 21.08
Frequency Missing = 54.707063524
RECENT WINE COOLER USE
Q17D Frequency Percent
Never Heard/Used 797 55.65
In Your Lifetime 244 17.03
Since School Began 103 7.18
In the Past Month 288 20.14
Frequency Missing = 49.17539856
RECENT WINE USE
Q17E Frequency Percent
Never Heard/Used 878 62.19
In Your Lifetime 244 17.27
Since School Began 83 5.91
In the Past Month 207 14.63
Frequency Missing = 68.679009496
RECENT LIQUOR USEQ17F Frequency Percent
Never Heard/Used 860 60.20
In Your Lifetime 191 13.35
Since School Began 92 6.42
In the Past Month 286 20.03
Frequency Missing = 52.633818566
RECENT INHALANT USE
Q17G Frequency Percent
Never Heard/Used 1254 88.51In Your Lifetime 71 5.02
Since School Began 32 2.26
In the Past Month 60 4.21
Frequency Missing = 63.762593864
RECENT MARIJUANA
Q18A Frequency Per
Never Heard/Used 982 6
In Your Lifetime 178 1
Since School Began 86
In the Past Month 196 1
Frequency Missing = 39.9750406
RECENT COCAINE
Q18B Frequency Per
Never Heard/Used 1317 9
In Your Lifetime 47
Since School Began 24
In the Past Month 37
Frequency Missing = 56.4399808
RECENT CRACK
Q18C Frequency Per
Never Heard/Used 1376 9
In Your Lifetime 17
Since School Began 2
In the Past Month 10
Frequency Missing = 75.9456232
RECENT HALLUCINOGEN
Q18E Frequency Per
Never Heard/Used 1338 9
In Your Lifetime 36
Since School Began 11
In the Past Month 25
Frequency Missing = 71.1024027
RECENT UPPER
Q18F Frequency Per
Never Heard/Used 1267 9
In Your Lifetime 47
Since School Began 25
In the Past Month 58
The frequencies have been weighted so that the analysis reflects
the distribution of students by grade level in the district
©Copyright 2010, Texas A&M University
All rights reserved.
Page 114 of 127
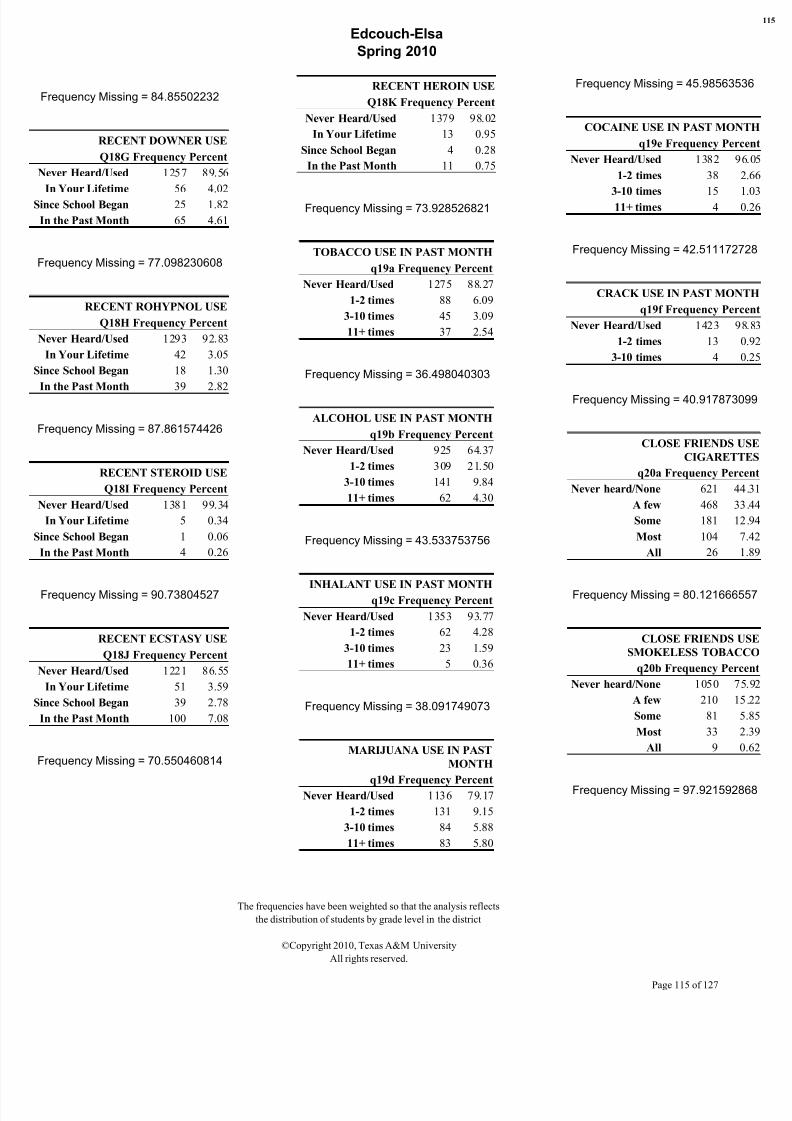
8/7/2019 HIDALGO COUNTY - edcouch-elsa isd _ 2010 Texas School Survey of Drug and Alcohol Use
http://slidepdf.com/reader/full/hidalgo-county-edcouch-elsa-isd-2010-texas-school-survey-of-drug-and-alcohol 115/127
Edcouch-Elsa
Spring 2010
Frequency Missing = 84.85502232
RECENT DOWNER USE
Q18G Frequency Percent
Never Heard/Used 1257 89.56
In Your Lifetime 56 4.02
Since School Began 25 1.82
In the Past Month 65 4.61
Frequency Missing = 77.098230608
RECENT ROHYPNOL USE
Q18H Frequency Percent
Never Heard/Used 1293 92.83
In Your Lifetime 42 3.05
Since School Began 18 1.30
In the Past Month 39 2.82
Frequency Missing = 87.861574426
RECENT STEROID USE
Q18I Frequency Percent
Never Heard/Used 1381 99.34
In Your Lifetime 5 0.34
Since School Began 1 0.06
In the Past Month 4 0.26
Frequency Missing = 90.73804527
RECENT ECSTASY USE
Q18J Frequency Percent
Never Heard/Used 1221 86.55
In Your Lifetime 51 3.59
Since School Began 39 2.78
In the Past Month 100 7.08
Frequency Missing = 70.550460814
RECENT HEROIN USE
Q18K Frequency Percent
Never Heard/Used 1379 98.02
In Your Lifetime 13 0.95
Since School Began 4 0.28
In the Past Month 11 0.75
Frequency Missing = 73.928526821
TOBACCO USE IN PAST MONTH
q19a Frequency Percent
Never Heard/Used 1275 88.27
1-2 times 88 6.09
3-10 times 45 3.09
11+ times 37 2.54
Frequency Missing = 36.498040303
ALCOHOL USE IN PAST MONTH
q19b Frequency Percent
Never Heard/Used 925 64.37
1-2 times 309 21.50
3-10 times 141 9.84
11+ times 62 4.30
Frequency Missing = 43.533753756
INHALANT USE IN PAST MONTHq19c Frequency Percent
Never Heard/Used 1353 93.77
1-2 times 62 4.28
3-10 times 23 1.59
11+ times 5 0.36
Frequency Missing = 38.091749073
MARIJUANA USE IN PAST
MONTH
q19d Frequency PercentNever Heard/Used 1136 79.17
1-2 times 131 9.15
3-10 times 84 5.88
11+ times 83 5.80
Frequency Missing = 45.985635
COCAINE USE IN PAST MON
q19e Frequency Per
Never Heard/Used 1382 9
1-2 times 38
3-10 times 15 11+ times 4
Frequency Missing = 42.5111727
CRACK USE IN PAST MON
q19f Frequency Perc
Never Heard/Used 1423 9
1-2 times 13
3-10 times 4
Frequency Missing = 40.9178730
CLOSE FRIENDS U
CIGARETT
q20a Frequency Perc
Never heard/None 621 44
A few 468 33
Some 181 12
Most 104 7
All 26
Frequency Missing = 80.1216665
CLOSE FRIENDS U
SMOKELESS TOBAC
q20b Frequency Perc
Never heard/None 1050 7
A few 210 1
Some 81
Most 33 2
All 9 0
Frequency Missing = 97.9215928
The frequencies have been weighted so that the analysis reflects
the distribution of students by grade level in the district
©Copyright 2010, Texas A&M University
All rights reserved.
Page 115 of 127

8/7/2019 HIDALGO COUNTY - edcouch-elsa isd _ 2010 Texas School Survey of Drug and Alcohol Use
http://slidepdf.com/reader/full/hidalgo-county-edcouch-elsa-isd-2010-texas-school-survey-of-drug-and-alcohol 116/127
Edcouch-Elsa
Spring 2010
CLOSE FRIENDS USE BEER
q20c Frequency Percent
Never heard/None 440 31.82
A few 347 25.11
Some 270 19.58
Most 235 16.98
All 90 6.51
Frequency Missing = 99.215989812
CLOSE FRIENDS USE WINE
COOLERS
q20d Frequency Percent
Never heard/None 592 43.12
A few 305 22.25
Some 231 16.83
Most 169 12.30
All 75 5.50
Frequency Missing = 108.23150638
CLOSE FRIENDS USE WINE
q20e Frequency Percent
Never heard/None 720 52.77
A few 332 24.33
Some 178 13.04
Most 95 6.92
All 40 2.94
Frequency Missing = 116.22668975
CLOSE FRIENDS USE LIQUOR
q20f Frequency Percent
Never heard/None 600 43.71
A few 282 20.55
Some 220 16.01
Most 190 13.82
All 81 5.92
Frequency Missing = 108.38462084
CLOSE FRIENDS USE INHALANTS
q20g Frequency Percent
Never heard/None 863 63.12
A few 270 19.71
Some 144 10.53
Most 69 5.03
All 22 1.62
Frequency Missing = 113.41716847
CLOSE FRIENDS USE
MARIJUANA
q20h Frequency Percent
Never heard/None 549 39.30
A few 259 18.55
Some 208 14.88
Most 253 18.10
All 128 9.17
Frequency Missing = 85.061684716
DIFFICULT TO GET
CIGARETTES
q21a Frequency Percent
Never heard of 259 19.02
Impossible 223 16.33
Very difficult 63 4.60
Somewhat diff 122 8.93
Somewhat easy 284 20.80
Very easy 414 30.32
Frequency Missing = 117.40028049
DIFFICULT TO GET
SMOKELESS TOBACCO
q21b Frequency Percent
Never heard of 486 36.27
Impossible 263 19.62
Very difficult 100 7.49
Somewhat diff 141 10.52
Somewhat easy 157 11.75Very easy 192 14.35
Frequency Missing = 141.32743537
DIFFICULT TO GET BEE
q21c Frequency Perce
Never heard of 234 17.
Impossible 178 13.
Very difficult 77 5.
Somewhat diff 142 10.
Somewhat easy 257 19.
Very easy 458 34.
Frequency Missing = 135.35575
DIFFICULT TO GET WIN
COOLER
q21d Frequency Perce
Never heard of 285 21.
Impossible 194 14.
Very difficult 71 5.
Somewhat diff 147 10.
Somewhat easy 250 18.Very easy 394 29.
Frequency Missing = 139.449367
DIFFICULT TO GET WIN
q21e Frequency Perce
Never heard of 264 19.
Impossible 224 16.
Very difficult 87 6.
Somewhat diff 174 13.
Somewhat easy 226 17.Very easy 349 26.
Frequency Missing = 156.028240
DIFFICULT TO GET LIQUO
q21f Frequency Perce
Never heard of 271 20.
Impossible 226 16.
Very difficult 95 7.
Somewhat diff 140 10.
Somewhat easy 230 17.
Very easy 387 28.
Frequency Missing = 131.402984
The frequencies have been weighted so that the analysis reflects
the distribution of students by grade level in the district
©Copyright 2010, Texas A&M University
All rights reserved.
Page 116 of 127
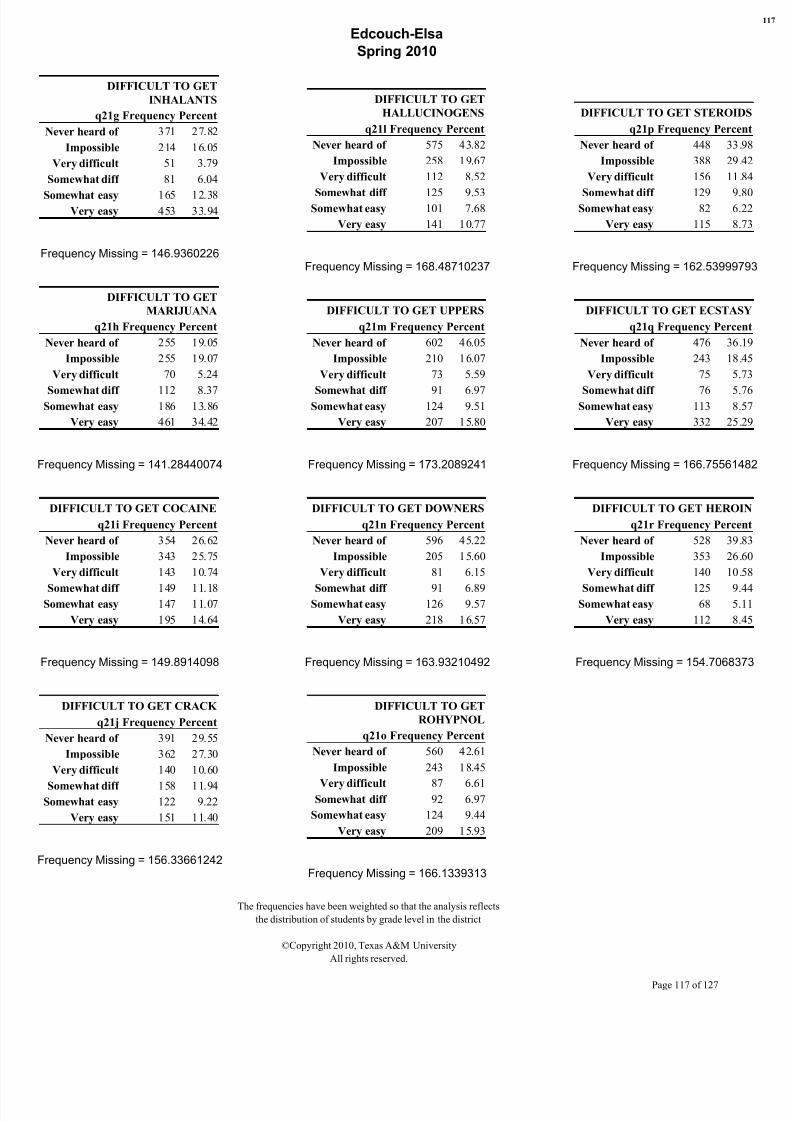
8/7/2019 HIDALGO COUNTY - edcouch-elsa isd _ 2010 Texas School Survey of Drug and Alcohol Use
http://slidepdf.com/reader/full/hidalgo-county-edcouch-elsa-isd-2010-texas-school-survey-of-drug-and-alcohol 117/127
Edcouch-Elsa
Spring 2010
DIFFICULT TO GET
INHALANTS
q21g Frequency Percent
Never heard of 371 27.82
Impossible 214 16.05
Very difficult 51 3.79
Somewhat diff 81 6.04
Somewhat easy 165 12.38Very easy 453 33.94
Frequency Missing = 146.9360226
DIFFICULT TO GET
MARIJUANA
q21h Frequency Percent
Never heard of 255 19.05
Impossible 255 19.07
Very difficult 70 5.24
Somewhat diff 112 8.37Somewhat easy 186 13.86
Very easy 461 34.42
Frequency Missing = 141.28440074
DIFFICULT TO GET COCAINE
q21i Frequency Percent
Never heard of 354 26.62
Impossible 343 25.75
Very difficult 143 10.74
Somewhat diff 149 11.18Somewhat easy 147 11.07
Very easy 195 14.64
Frequency Missing = 149.8914098
DIFFICULT TO GET CRACK
q21j Frequency Percent
Never heard of 391 29.55
Impossible 362 27.30
Very difficult 140 10.60
Somewhat diff 158 11.94Somewhat easy 122 9.22
Very easy 151 11.40
Frequency Missing = 156.33661242
DIFFICULT TO GET
HALLUCINOGENS
q21l Frequency Percent
Never heard of 575 43.82
Impossible 258 19.67
Very difficult 112 8.52
Somewhat diff 125 9.53Somewhat easy 101 7.68
Very easy 141 10.77
Frequency Missing = 168.48710237
DIFFICULT TO GET UPPERS
q21m Frequency Percent
Never heard of 602 46.05
Impossible 210 16.07
Very difficult 73 5.59
Somewhat diff 91 6.97Somewhat easy 124 9.51
Very easy 207 15.80
Frequency Missing = 173.2089241
DIFFICULT TO GET DOWNERS
q21n Frequency Percent
Never heard of 596 45.22
Impossible 205 15.60
Very difficult 81 6.15
Somewhat diff 91 6.89Somewhat easy 126 9.57
Very easy 218 16.57
Frequency Missing = 163.93210492
DIFFICULT TO GET
ROHYPNOL
q21o Frequency Percent
Never heard of 560 42.61
Impossible 243 18.45
Very difficult 87 6.61Somewhat diff 92 6.97
Somewhat easy 124 9.44
Very easy 209 15.93
Frequency Missing = 166.1339313
DIFFICULT TO GET STEROID
q21p Frequency Perce
Never heard of 448 33.
Impossible 388 29.
Very difficult 156 11.
Somewhat diff 129 9.Somewhat easy 82 6.
Very easy 115 8.
Frequency Missing = 162.539997
DIFFICULT TO GET ECSTAS
q21q Frequency Perce
Never heard of 476 36.
Impossible 243 18.
Very difficult 75 5.
Somewhat diff 76 5.Somewhat easy 113 8.
Very easy 332 25.
Frequency Missing = 166.755614
DIFFICULT TO GET HERO
q21r Frequency Perce
Never heard of 528 39.
Impossible 353 26.
Very difficult 140 10.
Somewhat diff 125 9.Somewhat easy 68 5.
Very easy 112 8.
Frequency Missing = 154.70683
The frequencies have been weighted so that the analysis reflects
the distribution of students by grade level in the district
©Copyright 2010, Texas A&M University
All rights reserved.
Page 117 of 127
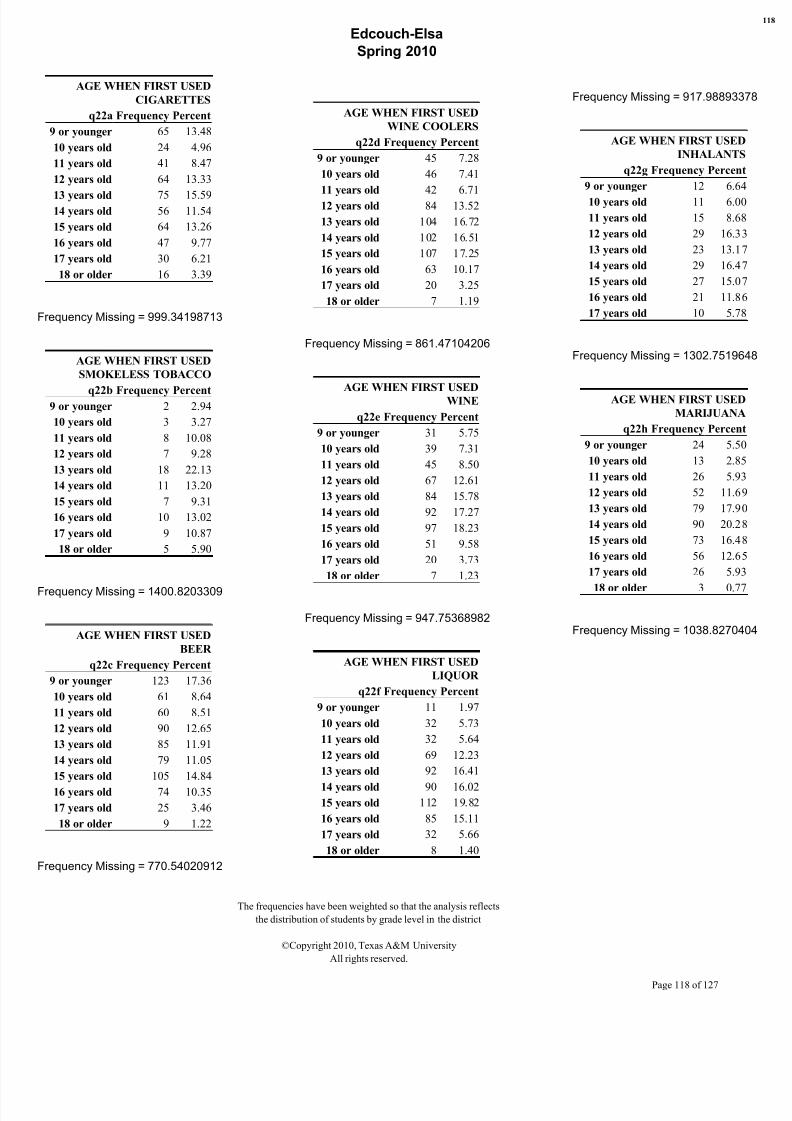
8/7/2019 HIDALGO COUNTY - edcouch-elsa isd _ 2010 Texas School Survey of Drug and Alcohol Use
http://slidepdf.com/reader/full/hidalgo-county-edcouch-elsa-isd-2010-texas-school-survey-of-drug-and-alcohol 118/127
Edcouch-Elsa
Spring 2010
AGE WHEN FIRST USED
CIGARETTES
q22a Frequency Percent
9 or younger 65 13.48
10 years old 24 4.96
11 years old 41 8.47
12 years old 64 13.33
13 years old 75 15.5914 years old 56 11.54
15 years old 64 13.26
16 years old 47 9.77
17 years old 30 6.21
18 or older 16 3.39
Frequency Missing = 999.34198713
AGE WHEN FIRST USED
SMOKELESS TOBACCO
q22b Frequency Percent9 or younger 2 2.94
10 years old 3 3.27
11 years old 8 10.08
12 years old 7 9.28
13 years old 18 22.13
14 years old 11 13.20
15 years old 7 9.31
16 years old 10 13.02
17 years old 9 10.87
18 or older 5 5.90
Frequency Missing = 1400.8203309
AGE WHEN FIRST USED
BEER
q22c Frequency Percent
9 or younger 123 17.36
10 years old 61 8.64
11 years old 60 8.51
12 years old 90 12.65
13 years old 85 11.91
14 years old 79 11.05
15 years old 105 14.84
16 years old 74 10.35
17 years old 25 3.46
18 or older 9 1.22
Frequency Missing = 770.54020912
AGE WHEN FIRST USED
WINE COOLERS
q22d Frequency Percent
9 or younger 45 7.28
10 years old 46 7.41
11 years old 42 6.71
12 years old 84 13.52
13 years old 104 16.72
14 years old 102 16.51
15 years old 107 17.25
16 years old 63 10.17
17 years old 20 3.25
18 or older 7 1.19
Frequency Missing = 861.47104206
AGE WHEN FIRST USEDWINE
q22e Frequency Percent
9 or younger 31 5.75
10 years old 39 7.31
11 years old 45 8.50
12 years old 67 12.61
13 years old 84 15.78
14 years old 92 17.27
15 years old 97 18.23
16 years old 51 9.58
17 years old 20 3.73
18 or older 7 1.23
Frequency Missing = 947.75368982
AGE WHEN FIRST USED
LIQUOR
q22f Frequency Percent
9 or younger 11 1.97
10 years old 32 5.73
11 years old 32 5.64
12 years old 69 12.23
13 years old 92 16.41
14 years old 90 16.0215 years old 112 19.82
16 years old 85 15.11
17 years old 32 5.66
18 or older 8 1.40
Frequency Missing = 917.988933
AGE WHEN FIRST USED
INHALANT
q22g Frequency Percen
9 or younger 12 6.6
10 years old 11 6.0
11 years old 15 8.6
12 years old 29 16.3
13 years old 23 13.1
14 years old 29 16.4
15 years old 27 15.0
16 years old 21 11.8
17 years old 10 5.7
Frequency Missing = 1302.75196
AGE WHEN FIRST USED
MARIJUANA
q22h Frequency Percen
9 or younger 24 5.5
10 years old 13 2.8
11 years old 26 5.9
12 years old 52 11.6
13 years old 79 17.9
14 years old 90 20.2
15 years old 73 16.4
16 years old 56 12.6
17 years old 26 5.9
18 or older 3 0.7
Frequency Missing = 1038.82704
The frequencies have been weighted so that the analysis reflects
the distribution of students by grade level in the district
©Copyright 2010, Texas A&M University
All rights reserved.
Page 118 of 127
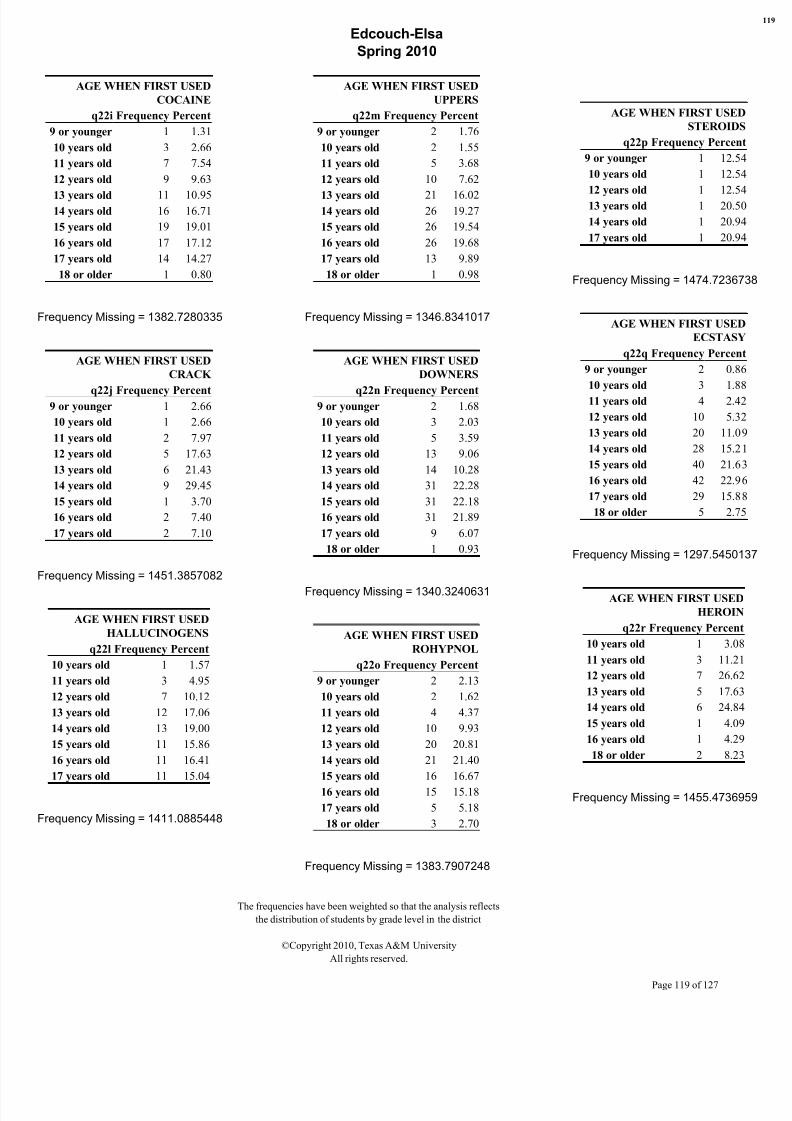
8/7/2019 HIDALGO COUNTY - edcouch-elsa isd _ 2010 Texas School Survey of Drug and Alcohol Use
http://slidepdf.com/reader/full/hidalgo-county-edcouch-elsa-isd-2010-texas-school-survey-of-drug-and-alcohol 119/127
Edcouch-Elsa
Spring 2010
AGE WHEN FIRST USED
COCAINE
q22i Frequency Percent
9 or younger 1 1.31
10 years old 3 2.66
11 years old 7 7.54
12 years old 9 9.63
13 years old 11 10.9514 years old 16 16.71
15 years old 19 19.01
16 years old 17 17.12
17 years old 14 14.27
18 or older 1 0.80
Frequency Missing = 1382.7280335
AGE WHEN FIRST USED
CRACK
q22j Frequency Percent9 or younger 1 2.66
10 years old 1 2.66
11 years old 2 7.97
12 years old 5 17.63
13 years old 6 21.43
14 years old 9 29.45
15 years old 1 3.70
16 years old 2 7.40
17 years old 2 7.10
Frequency Missing = 1451.3857082
AGE WHEN FIRST USED
HALLUCINOGENS
q22l Frequency Percent
10 years old 1 1.57
11 years old 3 4.95
12 years old 7 10.12
13 years old 12 17.06
14 years old 13 19.00
15 years old 11 15.86
16 years old 11 16.41
17 years old 11 15.04
Frequency Missing = 1411.0885448
AGE WHEN FIRST USED
UPPERS
q22m Frequency Percent
9 or younger 2 1.76
10 years old 2 1.55
11 years old 5 3.68
12 years old 10 7.62
13 years old 21 16.0214 years old 26 19.27
15 years old 26 19.54
16 years old 26 19.68
17 years old 13 9.89
18 or older 1 0.98
Frequency Missing = 1346.8341017
AGE WHEN FIRST USED
DOWNERS
q22n Frequency Percent9 or younger 2 1.68
10 years old 3 2.03
11 years old 5 3.59
12 years old 13 9.06
13 years old 14 10.28
14 years old 31 22.28
15 years old 31 22.18
16 years old 31 21.89
17 years old 9 6.07
18 or older 1 0.93
Frequency Missing = 1340.3240631
AGE WHEN FIRST USED
ROHYPNOL
q22o Frequency Percent
9 or younger 2 2.13
10 years old 2 1.62
11 years old 4 4.37
12 years old 10 9.93
13 years old 20 20.81
14 years old 21 21.40
15 years old 16 16.67
16 years old 15 15.18
17 years old 5 5.18
18 or older 3 2.70
Frequency Missing = 1383.7907248
AGE WHEN FIRST USED
STEROIDS
q22p Frequency Percen
9 or younger 1 12.5
10 years old 1 12.5
12 years old 1 12.5
13 years old 1 20.5
14 years old 1 20.9
17 years old 1 20.9
Frequency Missing = 1474.72367
AGE WHEN FIRST USED
ECSTASY
q22q Frequency Percen
9 or younger 2 0.8
10 years old 3 1.8
11 years old 4 2.4
12 years old 10 5.3
13 years old 20 11.0
14 years old 28 15.2
15 years old 40 21.6
16 years old 42 22.9
17 years old 29 15.8
18 or older 5 2.7
Frequency Missing = 1297.54501
AGE WHEN FIRST USED
HEROIN
q22r Frequency Percen
10 years old 1 3.08
11 years old 3 11.21
12 years old 7 26.62
13 years old 5 17.63
14 years old 6 24.84
15 years old 1 4.09
16 years old 1 4.29
18 or older 2 8.23
Frequency Missing = 1455.47369
The frequencies have been weighted so that the analysis reflects
the distribution of students by grade level in the district
©Copyright 2010, Texas A&M University
All rights reserved.
Page 119 of 127
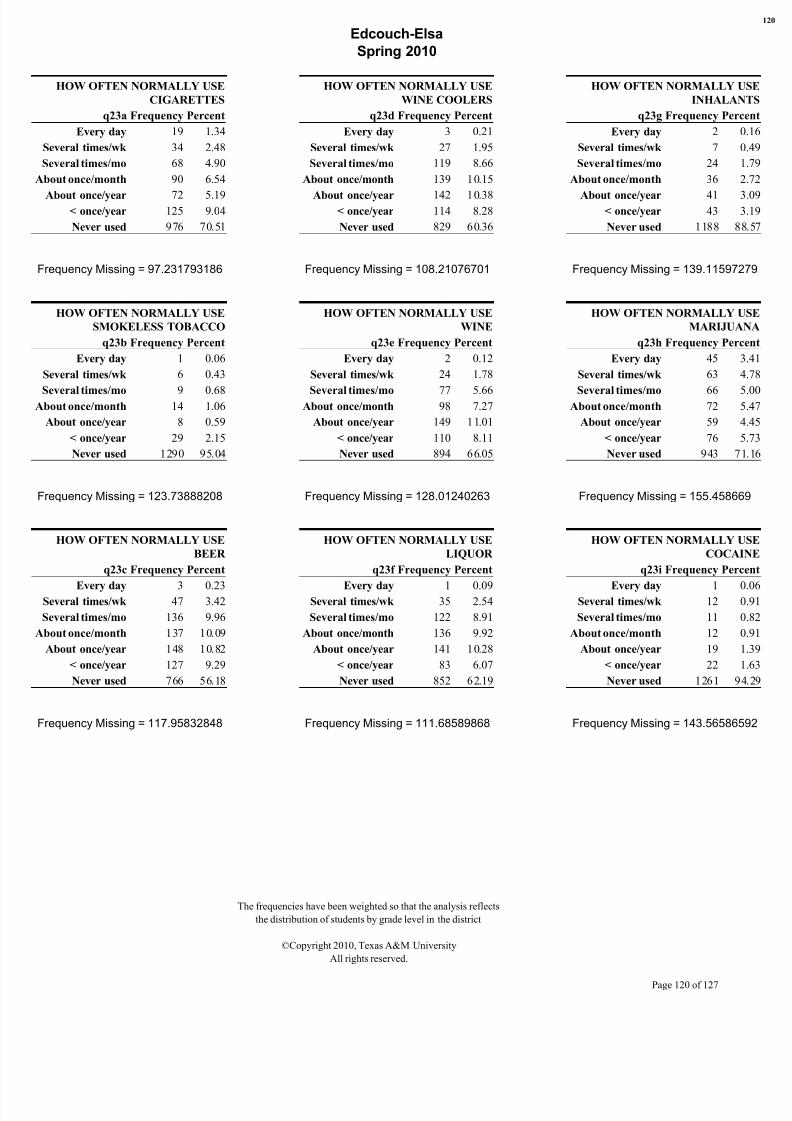
8/7/2019 HIDALGO COUNTY - edcouch-elsa isd _ 2010 Texas School Survey of Drug and Alcohol Use
http://slidepdf.com/reader/full/hidalgo-county-edcouch-elsa-isd-2010-texas-school-survey-of-drug-and-alcohol 120/127
Edcouch-Elsa
Spring 2010
HOW OFTEN NORMALLY USE
CIGARETTES
q23a Frequency Percent
Every day 19 1.34
Several times/wk 34 2.48
Several times/mo 68 4.90
About once/month 90 6.54
About once/year 72 5.19< once/year 125 9.04
Never used 976 70.51
Frequency Missing = 97.231793186
HOW OFTEN NORMALLY USE
SMOKELESS TOBACCO
q23b Frequency Percent
Every day 1 0.06
Several times/wk 6 0.43
Several times/mo 9 0.68About once/month 14 1.06
About once/year 8 0.59
< once/year 29 2.15
Never used 1290 95.04
Frequency Missing = 123.73888208
HOW OFTEN NORMALLY USE
BEER
q23c Frequency Percent
Every day 3 0.23Several times/wk 47 3.42
Several times/mo 136 9.96
About once/month 137 10.09
About once/year 148 10.82
< once/year 127 9.29
Never used 766 56.18
Frequency Missing = 117.95832848
HOW OFTEN NORMALLY USE
WINE COOLERS
q23d Frequency Percent
Every day 3 0.21
Several times/wk 27 1.95
Several times/mo 119 8.66
About once/month 139 10.15
About once/year 142 10.38< once/year 114 8.28
Never used 829 60.36
Frequency Missing = 108.21076701
HOW OFTEN NORMALLY USE
WINE
q23e Frequency Percent
Every day 2 0.12
Several times/wk 24 1.78
Several times/mo 77 5.66About once/month 98 7.27
About once/year 149 11.01
< once/year 110 8.11
Never used 894 66.05
Frequency Missing = 128.01240263
HOW OFTEN NORMALLY USE
LIQUOR
q23f Frequency Percent
Every day 1 0.09Several times/wk 35 2.54
Several times/mo 122 8.91
About once/month 136 9.92
About once/year 141 10.28
< once/year 83 6.07
Never used 852 62.19
Frequency Missing = 111.68589868
HOW OFTEN NORMALLY U
INHALAN
q23g Frequency Perc
Every day 2
Several times/wk 7
Several times/mo 24
About once/month 36
About once/year 41 < once/year 43
Never used 1188 8
Frequency Missing = 139.115972
HOW OFTEN NORMALLY U
MARIJUA
q23h Frequency Perc
Every day 45
Several times/wk 63
Several times/mo 66 About once/month 72
About once/year 59
< once/year 76
Never used 943 7
Frequency Missing = 155.45866
HOW OFTEN NORMALLY U
COCAI
q23i Frequency Perc
Every day 1 Several times/wk 12
Several times/mo 11
About once/month 12
About once/year 19
< once/year 22
Never used 1261 9
Frequency Missing = 143.565865
The frequencies have been weighted so that the analysis reflects
the distribution of students by grade level in the district
©Copyright 2010, Texas A&M University
All rights reserved.
Page 120 of 127
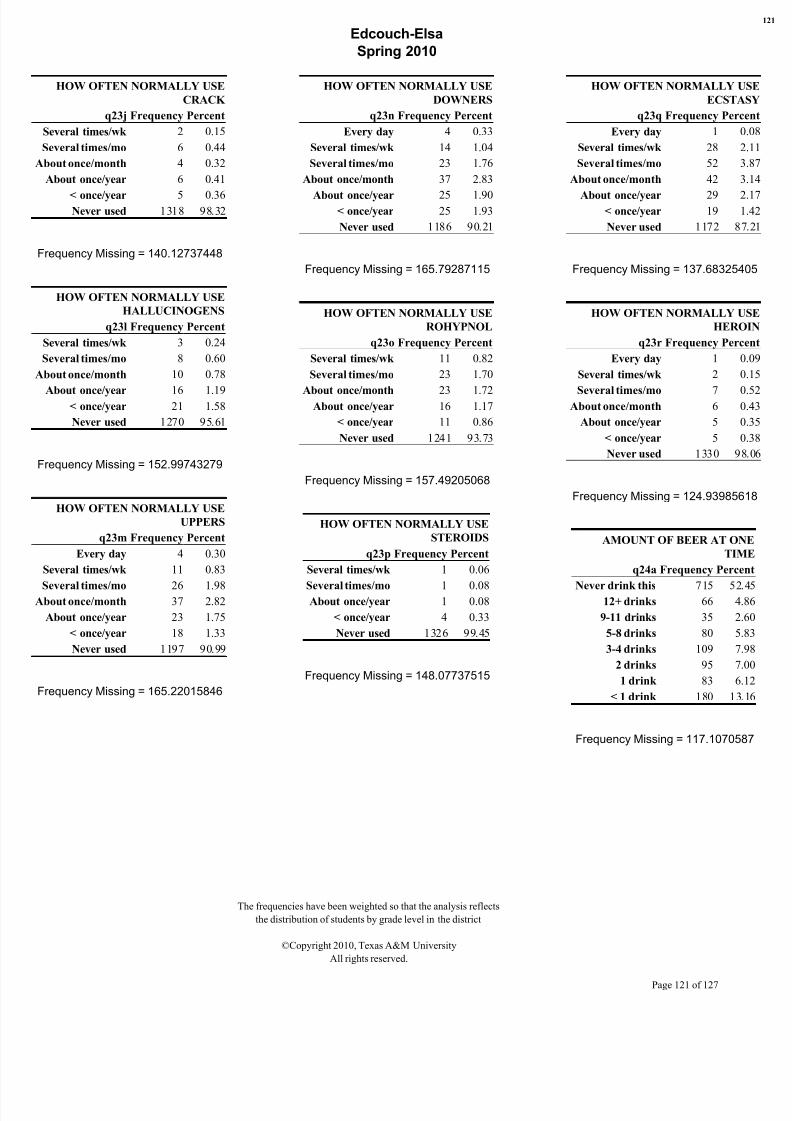
8/7/2019 HIDALGO COUNTY - edcouch-elsa isd _ 2010 Texas School Survey of Drug and Alcohol Use
http://slidepdf.com/reader/full/hidalgo-county-edcouch-elsa-isd-2010-texas-school-survey-of-drug-and-alcohol 121/127
Edcouch-Elsa
Spring 2010
HOW OFTEN NORMALLY USE
CRACK
q23j Frequency Percent
Several times/wk 2 0.15
Several times/mo 6 0.44
About once/month 4 0.32
About once/year 6 0.41
< once/year 5 0.36Never used 1318 98.32
Frequency Missing = 140.12737448
HOW OFTEN NORMALLY USE
HALLUCINOGENS
q23l Frequency Percent
Several times/wk 3 0.24
Several times/mo 8 0.60
About once/month 10 0.78
About once/year 16 1.19< once/year 21 1.58
Never used 1270 95.61
Frequency Missing = 152.99743279
HOW OFTEN NORMALLY USE
UPPERS
q23m Frequency Percent
Every day 4 0.30
Several times/wk 11 0.83
Several times/mo 26 1.98About once/month 37 2.82
About once/year 23 1.75
< once/year 18 1.33
Never used 1197 90.99
Frequency Missing = 165.22015846
HOW OFTEN NORMALLY USE
DOWNERS
q23n Frequency Percent
Every day 4 0.33
Several times/wk 14 1.04
Several times/mo 23 1.76
About once/month 37 2.83
About once/year 25 1.90< once/year 25 1.93
Never used 1186 90.21
Frequency Missing = 165.79287115
HOW OFTEN NORMALLY USE
ROHYPNOL
q23o Frequency Percent
Several times/wk 11 0.82
Several times/mo 23 1.70
About once/month 23 1.72About once/year 16 1.17
< once/year 11 0.86
Never used 1241 93.73
Frequency Missing = 157.49205068
HOW OFTEN NORMALLY USE
STEROIDS
q23p Frequency Percent
Several times/wk 1 0.06
Several times/mo 1 0.08About once/year 1 0.08
< once/year 4 0.33
Never used 1326 99.45
Frequency Missing = 148.07737515
HOW OFTEN NORMALLY U
ECSTA
q23q Frequency Perc
Every day 1
Several times/wk 28
Several times/mo 52
About once/month 42
About once/year 29 < once/year 19
Never used 1172 8
Frequency Missing = 137.683254
HOW OFTEN NORMALLY U
HERO
q23r Frequency Perc
Every day 1
Several times/wk 2
Several times/mo 7 About once/month 6
About once/year 5
< once/year 5
Never used 1330 9
Frequency Missing = 124.939856
AMOUNT OF BEER AT ON
TIM
q24a Frequency Perce
Never drink this 715 5212+ drinks 66 4
9-11 drinks 35 2
5-8 drinks 80 5
3-4 drinks 109 7
2 drinks 95 7
1 drink 83 6
< 1 drink 180 13
Frequency Missing = 117.10705
The frequencies have been weighted so that the analysis reflects
the distribution of students by grade level in the district
©Copyright 2010, Texas A&M University
All rights reserved.
Page 121 of 127
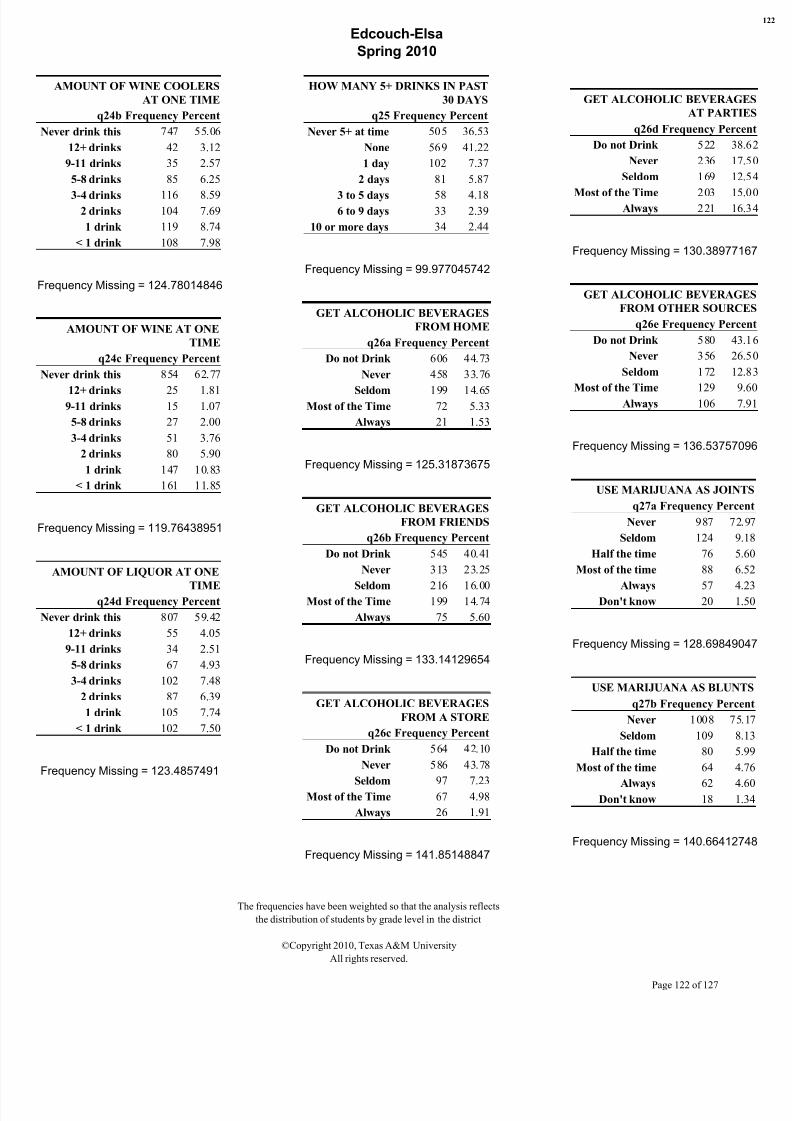
8/7/2019 HIDALGO COUNTY - edcouch-elsa isd _ 2010 Texas School Survey of Drug and Alcohol Use
http://slidepdf.com/reader/full/hidalgo-county-edcouch-elsa-isd-2010-texas-school-survey-of-drug-and-alcohol 122/127
Edcouch-Elsa
Spring 2010
AMOUNT OF WINE COOLERS
AT ONE TIME
q24b Frequency Percent
Never drink this 747 55.06
12+ drinks 42 3.12
9-11 drinks 35 2.57
5-8 drinks 85 6.25
3-4 drinks 116 8.592 drinks 104 7.69
1 drink 119 8.74
< 1 drink 108 7.98
Frequency Missing = 124.78014846
AMOUNT OF WINE AT ONE
TIME
q24c Frequency Percent
Never drink this 854 62.77
12+ drinks 25 1.819-11 drinks 15 1.07
5-8 drinks 27 2.00
3-4 drinks 51 3.76
2 drinks 80 5.90
1 drink 147 10.83
< 1 drink 161 11.85
Frequency Missing = 119.76438951
AMOUNT OF LIQUOR AT ONE
TIMEq24d Frequency Percent
Never drink this 807 59.42
12+ drinks 55 4.05
9-11 drinks 34 2.51
5-8 drinks 67 4.93
3-4 drinks 102 7.48
2 drinks 87 6.39
1 drink 105 7.74
< 1 drink 102 7.50
Frequency Missing = 123.4857491
HOW MANY 5+ DRINKS IN PAST
30 DAYS
q25 Frequency Percent
Never 5+ at time 505 36.53
None 569 41.22
1 day 102 7.37
2 days 81 5.87
3 to 5 days 58 4.186 to 9 days 33 2.39
10 or more days 34 2.44
Frequency Missing = 99.977045742
GET ALCOHOLIC BEVERAGES
FROM HOME
q26a Frequency Percent
Do not Drink 606 44.73
Never 458 33.76
Seldom 199 14.65Most of the Time 72 5.33
Always 21 1.53
Frequency Missing = 125.31873675
GET ALCOHOLIC BEVERAGES
FROM FRIENDS
q26b Frequency Percent
Do not Drink 545 40.41
Never 313 23.25
Seldom 216 16.00Most of the Time 199 14.74
Always 75 5.60
Frequency Missing = 133.14129654
GET ALCOHOLIC BEVERAGES
FROM A STORE
q26c Frequency Percent
Do not Drink 564 42.10
Never 586 43.78
Seldom 97 7.23Most of the Time 67 4.98
Always 26 1.91
Frequency Missing = 141.85148847
GET ALCOHOLIC BEVERAG
AT PARTI
q26d Frequency Perc
Do not Drink 522 38
Never 236 17
Seldom 169 12
Most of the Time 203 15Always 221 16
Frequency Missing = 130.389771
GET ALCOHOLIC BEVERAG
FROM OTHER SOURC
q26e Frequency Perc
Do not Drink 580 43
Never 356 26
Seldom 172 12
Most of the Time 129 9Always 106 7
Frequency Missing = 136.537570
USE MARIJUANA AS JOIN
q27a Frequency Perce
Never 987 72
Seldom 124 9
Half the time 76 5
Most of the time 88 6
Always 57 4Don't know 20 1
Frequency Missing = 128.698490
USE MARIJUANA AS BLUN
q27b Frequency Perce
Never 1008 75
Seldom 109 8
Half the time 80 5
Most of the time 64 4
Always 62 4Don't know 18 1
Frequency Missing = 140.664127
The frequencies have been weighted so that the analysis reflects
the distribution of students by grade level in the district
©Copyright 2010, Texas A&M University
All rights reserved.
Page 122 of 127
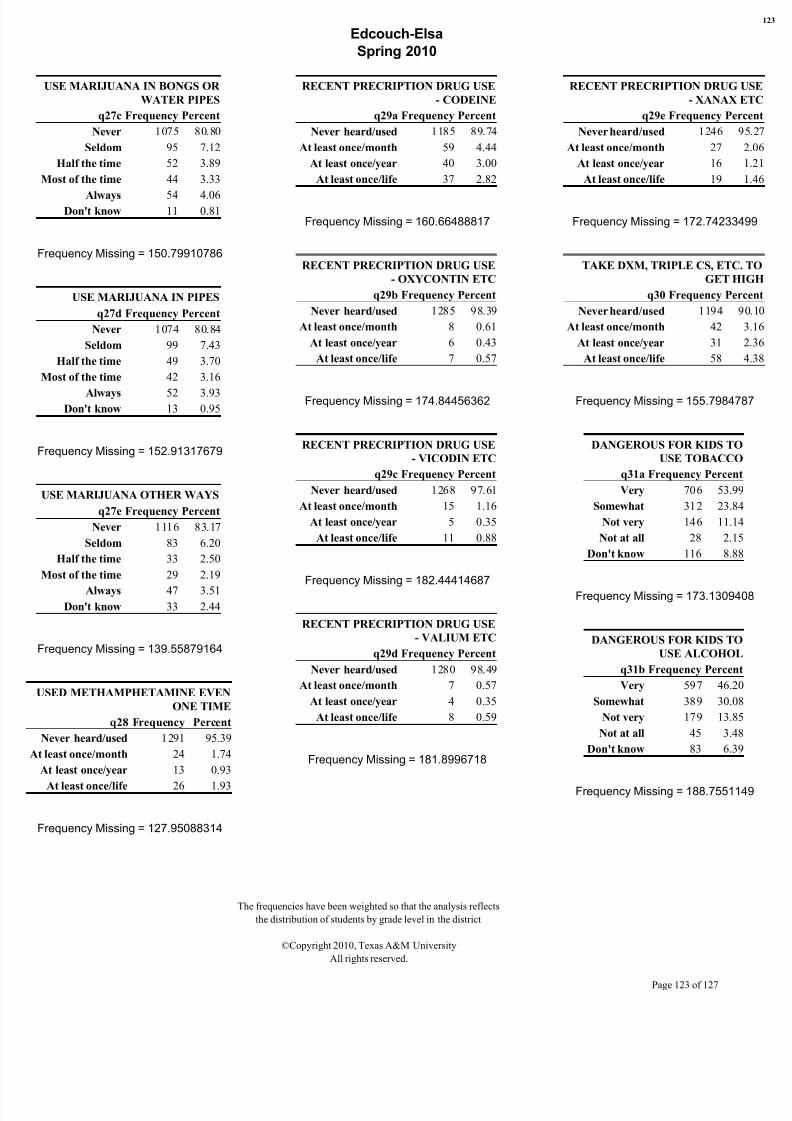
8/7/2019 HIDALGO COUNTY - edcouch-elsa isd _ 2010 Texas School Survey of Drug and Alcohol Use
http://slidepdf.com/reader/full/hidalgo-county-edcouch-elsa-isd-2010-texas-school-survey-of-drug-and-alcohol 123/127
Edcouch-Elsa
Spring 2010
USE MARIJUANA IN BONGS OR
WATER PIPES
q27c Frequency Percent
Never 1075 80.80
Seldom 95 7.12
Half the time 52 3.89
Most of the time 44 3.33
Always 54 4.06Don't know 11 0.81
Frequency Missing = 150.79910786
USE MARIJUANA IN PIPES
q27d Frequency Percent
Never 1074 80.84
Seldom 99 7.43
Half the time 49 3.70
Most of the time 42 3.16
Always 52 3.93Don't know 13 0.95
Frequency Missing = 152.91317679
USE MARIJUANA OTHER WAYS
q27e Frequency Percent
Never 1116 83.17
Seldom 83 6.20
Half the time 33 2.50
Most of the time 29 2.19
Always 47 3.51Don't know 33 2.44
Frequency Missing = 139.55879164
USED METHAMPHETAMINE EVEN
ONE TIME
q28 Frequency Percent
Never heard/used 1291 95.39
At least once/month 24 1.74
At least once/year 13 0.93
At least once/life 26 1.93
Frequency Missing = 127.95088314
RECENT PRECRIPTION DRUG USE
- CODEINE
q29a Frequency Percent
Never heard/used 1185 89.74
At least once/month 59 4.44
At least once/year 40 3.00
At least once/life 37 2.82
Frequency Missing = 160.66488817
RECENT PRECRIPTION DRUG USE
- OXYCONTIN ETC
q29b Frequency Percent
Never heard/used 1285 98.39
At least once/month 8 0.61
At least once/year 6 0.43
At least once/life 7 0.57
Frequency Missing = 174.84456362
RECENT PRECRIPTION DRUG USE
- VICODIN ETC
q29c Frequency Percent
Never heard/used 1268 97.61
At least once/month 15 1.16
At least once/year 5 0.35
At least once/life 11 0.88
Frequency Missing = 182.44414687
RECENT PRECRIPTION DRUG USE
- VALIUM ETC
q29d Frequency Percent
Never heard/used 1280 98.49
At least once/month 7 0.57
At least once/year 4 0.35
At least once/life 8 0.59
Frequency Missing = 181.8996718
RECENT PRECRIPTION DRUG
- XANAX
q29e Frequency Per
Never heard/used 1246 9
At least once/month 27
At least once/year 16
At least once/life 19
Frequency Missing = 172.742334
TAKE DXM, TRIPLE CS, ETC
GET H
q30 Frequency Per
Never heard/used 1194 9
At least once/month 42
At least once/year 31
At least once/life 58
Frequency Missing = 155.79847
DANGEROUS FOR KIDS TO
USE TOBACCO
q31a Frequency Percent
Very 706 53.99
Somewhat 312 23.84
Not very 146 11.14
Not at all 28 2.15
Don't know 116 8.88
Frequency Missing = 173.13094
DANGEROUS FOR KIDS TO
USE ALCOHOL
q31b Frequency Percent
Very 597 46.20
Somewhat 389 30.08
Not very 179 13.85
Not at all 45 3.48
Don't know 83 6.39
Frequency Missing = 188.75511
The frequencies have been weighted so that the analysis reflects
the distribution of students by grade level in the district
©Copyright 2010, Texas A&M University
All rights reserved.
Page 123 of 127
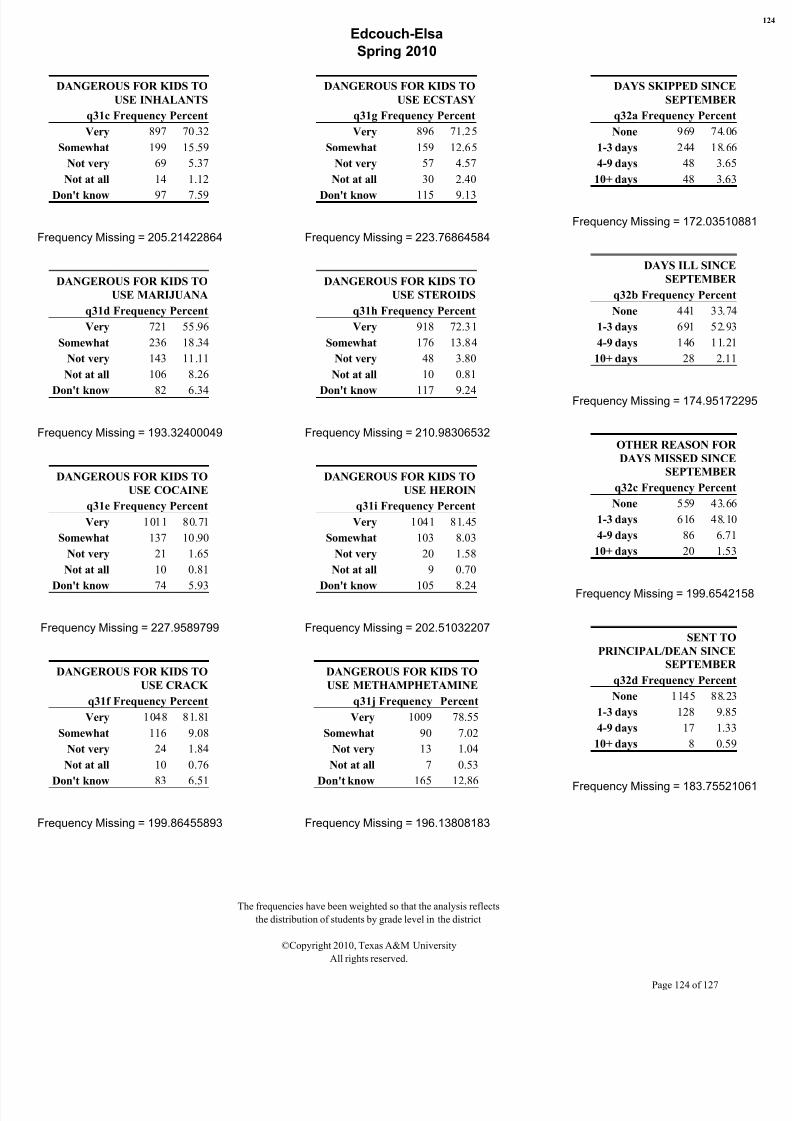
8/7/2019 HIDALGO COUNTY - edcouch-elsa isd _ 2010 Texas School Survey of Drug and Alcohol Use
http://slidepdf.com/reader/full/hidalgo-county-edcouch-elsa-isd-2010-texas-school-survey-of-drug-and-alcohol 124/127
Edcouch-Elsa
Spring 2010
DANGEROUS FOR KIDS TO
USE INHALANTS
q31c Frequency Percent
Very 897 70.32
Somewhat 199 15.59
Not very 69 5.37
Not at all 14 1.12
Don't know 97 7.59
Frequency Missing = 205.21422864
DANGEROUS FOR KIDS TO
USE MARIJUANA
q31d Frequency Percent
Very 721 55.96
Somewhat 236 18.34
Not very 143 11.11
Not at all 106 8.26
Don't know 82 6.34
Frequency Missing = 193.32400049
DANGEROUS FOR KIDS TO
USE COCAINE
q31e Frequency Percent
Very 1011 80.71
Somewhat 137 10.90
Not very 21 1.65
Not at all 10 0.81
Don't know 74 5.93
Frequency Missing = 227.9589799
DANGEROUS FOR KIDS TO
USE CRACK
q31f Frequency Percent
Very 1048 81.81
Somewhat 116 9.08
Not very 24 1.84
Not at all 10 0.76
Don't know 83 6.51
Frequency Missing = 199.86455893
DANGEROUS FOR KIDS TO
USE ECSTASY
q31g Frequency Percent
Very 896 71.25
Somewhat 159 12.65
Not very 57 4.57
Not at all 30 2.40
Don't know 115 9.13
Frequency Missing = 223.76864584
DANGEROUS FOR KIDS TO
USE STEROIDS
q31h Frequency Percent
Very 918 72.31
Somewhat 176 13.84
Not very 48 3.80
Not at all 10 0.81
Don't know 117 9.24
Frequency Missing = 210.98306532
DANGEROUS FOR KIDS TO
USE HEROIN
q31i Frequency Percent
Very 1041 81.45
Somewhat 103 8.03
Not very 20 1.58
Not at all 9 0.70
Don't know 105 8.24
Frequency Missing = 202.51032207
DANGEROUS FOR KIDS TO
USE METHAMPHETAMINE
q31j Frequency Percent
Very 1009 78.55
Somewhat 90 7.02
Not very 13 1.04
Not at all 7 0.53
Don't know 165 12.86
Frequency Missing = 196.13808183
DAYS SKIPPED SINCE
SEPTEMBER
q32a Frequency Percent
None 969 74.06
1-3 days 244 18.66
4-9 days 48 3.65
10+ days 48 3.63
Frequency Missing = 172.035108
DAYS ILL SINCE
SEPTEMBER
q32b Frequency Percent
None 441 33.74
1-3 days 691 52.93
4-9 days 146 11.21
10+ days 28 2.11
Frequency Missing = 174.951722
OTHER REASON FOR
DAYS MISSED SINCE
SEPTEMBER
q32c Frequency Percent
None 559 43.66
1-3 days 616 48.10
4-9 days 86 6.71
10+ days 20 1.53
Frequency Missing = 199.65421
SENT TO
PRINCIPAL/DEAN SINCE
SEPTEMBER
q32d Frequency Percent
None 1145 88.23
1-3 days 128 9.85
4-9 days 17 1.33
10+ days 8 0.59
Frequency Missing = 183.755210
The frequencies have been weighted so that the analysis reflects
the distribution of students by grade level in the district
©Copyright 2010, Texas A&M University
All rights reserved.
Page 124 of 127
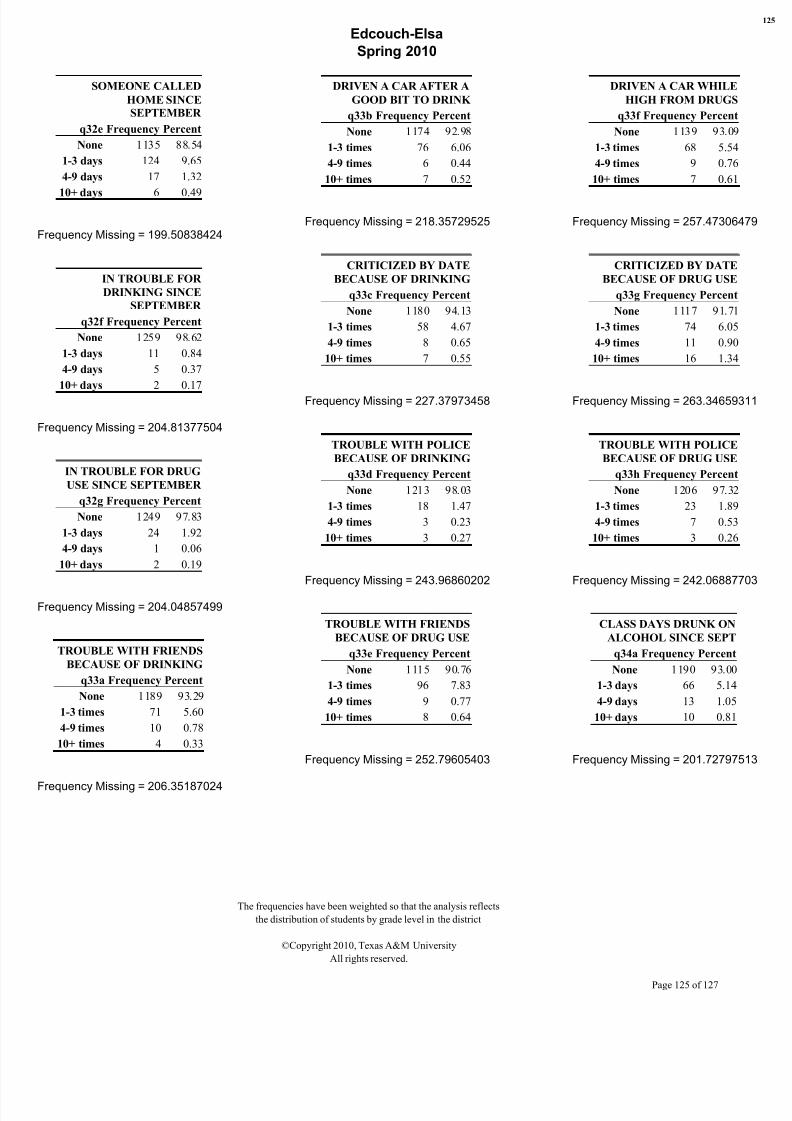
8/7/2019 HIDALGO COUNTY - edcouch-elsa isd _ 2010 Texas School Survey of Drug and Alcohol Use
http://slidepdf.com/reader/full/hidalgo-county-edcouch-elsa-isd-2010-texas-school-survey-of-drug-and-alcohol 125/127
Edcouch-Elsa
Spring 2010
SOMEONE CALLED
HOME SINCE
SEPTEMBER
q32e Frequency Percent
None 1135 88.54
1-3 days 124 9.65
4-9 days 17 1.32
10+ days 6 0.49
Frequency Missing = 199.50838424
IN TROUBLE FOR
DRINKING SINCE
SEPTEMBER
q32f Frequency Percent
None 1259 98.62
1-3 days 11 0.84
4-9 days 5 0.37
10+ days 2 0.17
Frequency Missing = 204.81377504
IN TROUBLE FOR DRUG
USE SINCE SEPTEMBER
q32g Frequency Percent
None 1249 97.83
1-3 days 24 1.92
4-9 days 1 0.06
10+ days 2 0.19
Frequency Missing = 204.04857499
TROUBLE WITH FRIENDS
BECAUSE OF DRINKING
q33a Frequency Percent
None 1189 93.29
1-3 times 71 5.60
4-9 times 10 0.78
10+ times 4 0.33
Frequency Missing = 206.35187024
DRIVEN A CAR AFTER A
GOOD BIT TO DRINK
q33b Frequency Percent
None 1174 92.98
1-3 times 76 6.06
4-9 times 6 0.44
10+ times 7 0.52
Frequency Missing = 218.35729525
CRITICIZED BY DATE
BECAUSE OF DRINKING
q33c Frequency Percent
None 1180 94.13
1-3 times 58 4.67
4-9 times 8 0.65
10+ times 7 0.55
Frequency Missing = 227.37973458
TROUBLE WITH POLICE
BECAUSE OF DRINKING
q33d Frequency Percent
None 1213 98.03
1-3 times 18 1.47
4-9 times 3 0.23
10+ times 3 0.27
Frequency Missing = 243.96860202
TROUBLE WITH FRIENDS
BECAUSE OF DRUG USE
q33e Frequency Percent
None 1115 90.76
1-3 times 96 7.83
4-9 times 9 0.77
10+ times 8 0.64
Frequency Missing = 252.79605403
DRIVEN A CAR WHILE
HIGH FROM DRUGS
q33f Frequency Percent
None 1139 93.09
1-3 times 68 5.54
4-9 times 9 0.76
10+ times 7 0.61
Frequency Missing = 257.473064
CRITICIZED BY DATE
BECAUSE OF DRUG USE
q33g Frequency Percent
None 1117 91.71
1-3 times 74 6.05
4-9 times 11 0.90
10+ times 16 1.34
Frequency Missing = 263.346593
TROUBLE WITH POLICE
BECAUSE OF DRUG USE
q33h Frequency Percent
None 1206 97.32
1-3 times 23 1.89
4-9 times 7 0.53
10+ times 3 0.26
Frequency Missing = 242.068877
CLASS DAYS DRUNK ON
ALCOHOL SINCE SEPT
q34a Frequency Percent
None 1190 93.00
1-3 days 66 5.14
4-9 days 13 1.05
10+ days 10 0.81
Frequency Missing = 201.727975
The frequencies have been weighted so that the analysis reflects
the distribution of students by grade level in the district
©Copyright 2010, Texas A&M University
All rights reserved.
Page 125 of 127
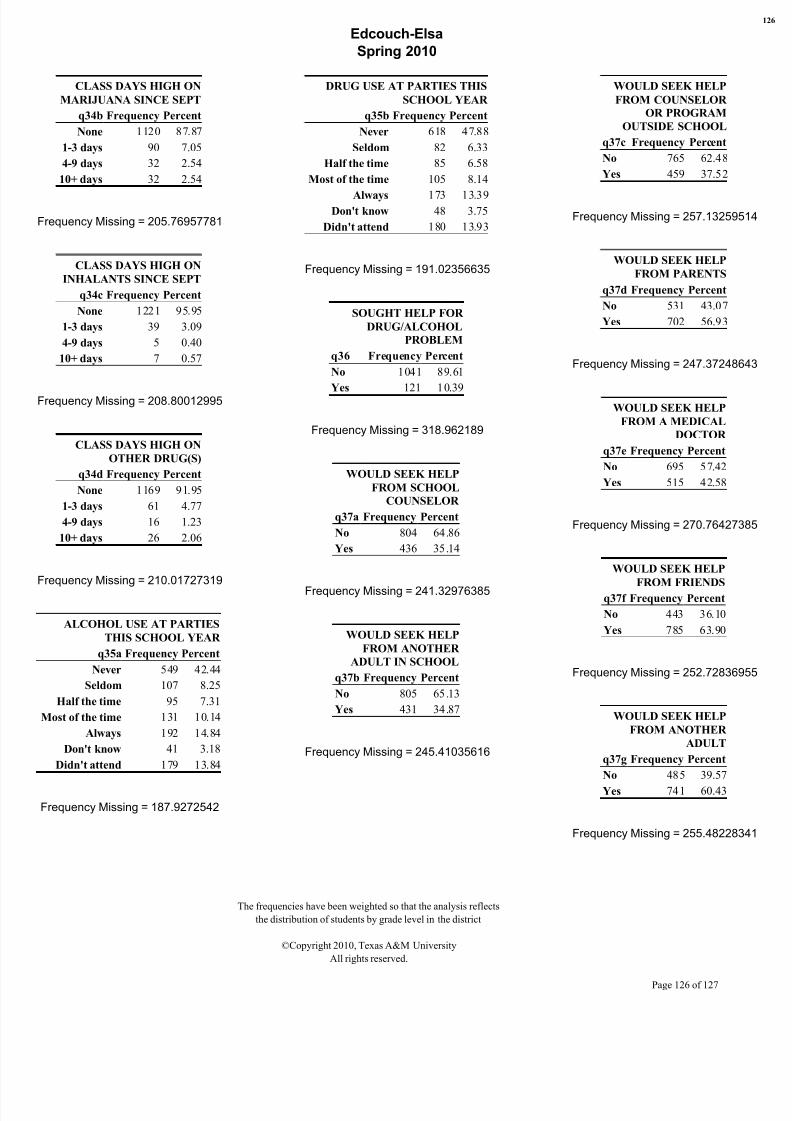
8/7/2019 HIDALGO COUNTY - edcouch-elsa isd _ 2010 Texas School Survey of Drug and Alcohol Use
http://slidepdf.com/reader/full/hidalgo-county-edcouch-elsa-isd-2010-texas-school-survey-of-drug-and-alcohol 126/127
Edcouch-Elsa
Spring 2010
CLASS DAYS HIGH ON
MARIJUANA SINCE SEPT
q34b Frequency Percent
None 1120 87.87
1-3 days 90 7.05
4-9 days 32 2.54
10+ days 32 2.54
Frequency Missing = 205.76957781
CLASS DAYS HIGH ON
INHALANTS SINCE SEPT
q34c Frequency Percent
None 1221 95.95
1-3 days 39 3.09
4-9 days 5 0.40
10+ days 7 0.57
Frequency Missing = 208.80012995
CLASS DAYS HIGH ON
OTHER DRUG(S)
q34d Frequency Percent
None 1169 91.95
1-3 days 61 4.77
4-9 days 16 1.23
10+ days 26 2.06
Frequency Missing = 210.01727319
ALCOHOL USE AT PARTIES
THIS SCHOOL YEAR
q35a Frequency Percent
Never 549 42.44
Seldom 107 8.25
Half the time 95 7.31
Most of the time 131 10.14
Always 192 14.84
Don't know 41 3.18
Didn't attend 179 13.84
Frequency Missing = 187.9272542
DRUG USE AT PARTIES THIS
SCHOOL YEAR
q35b Frequency Percent
Never 618 47.88
Seldom 82 6.33
Half the time 85 6.58
Most of the time 105 8.14
Always 173 13.39Don't know 48 3.75
Didn't attend 180 13.93
Frequency Missing = 191.02356635
SOUGHT HELP FOR
DRUG/ALCOHOL
PROBLEM
q36 Frequency Percent
No 1041 89.61
Yes 121 10.39
Frequency Missing = 318.962189
WOULD SEEK HELP
FROM SCHOOL
COUNSELOR
q37a Frequency Percent
No 804 64.86
Yes 436 35.14
Frequency Missing = 241.32976385
WOULD SEEK HELP
FROM ANOTHER
ADULT IN SCHOOL
q37b Frequency Percent
No 805 65.13
Yes 431 34.87
Frequency Missing = 245.41035616
WOULD SEEK HELP
FROM COUNSELOR
OR PROGRAM
OUTSIDE SCHOOL
q37c Frequency Percent
No 765 62.48
Yes 459 37.52
Frequency Missing = 257.132595
WOULD SEEK HELP
FROM PARENTS
q37d Frequency Percent
No 531 43.07
Yes 702 56.93
Frequency Missing = 247.372486
WOULD SEEK HELP
FROM A MEDICAL
DOCTOR
q37e Frequency Percent
No 695 57.42
Yes 515 42.58
Frequency Missing = 270.764273
WOULD SEEK HELP
FROM FRIENDS
q37f Frequency Percent
No 443 36.10
Yes 785 63.90
Frequency Missing = 252.728369
WOULD SEEK HELP
FROM ANOTHER
ADULT
q37g Frequency Percent
No 485 39.57
Yes 741 60.43
Frequency Missing = 255.482283
The frequencies have been weighted so that the analysis reflects
the distribution of students by grade level in the district
©Copyright 2010, Texas A&M University
All rights reserved.
Page 126 of 127
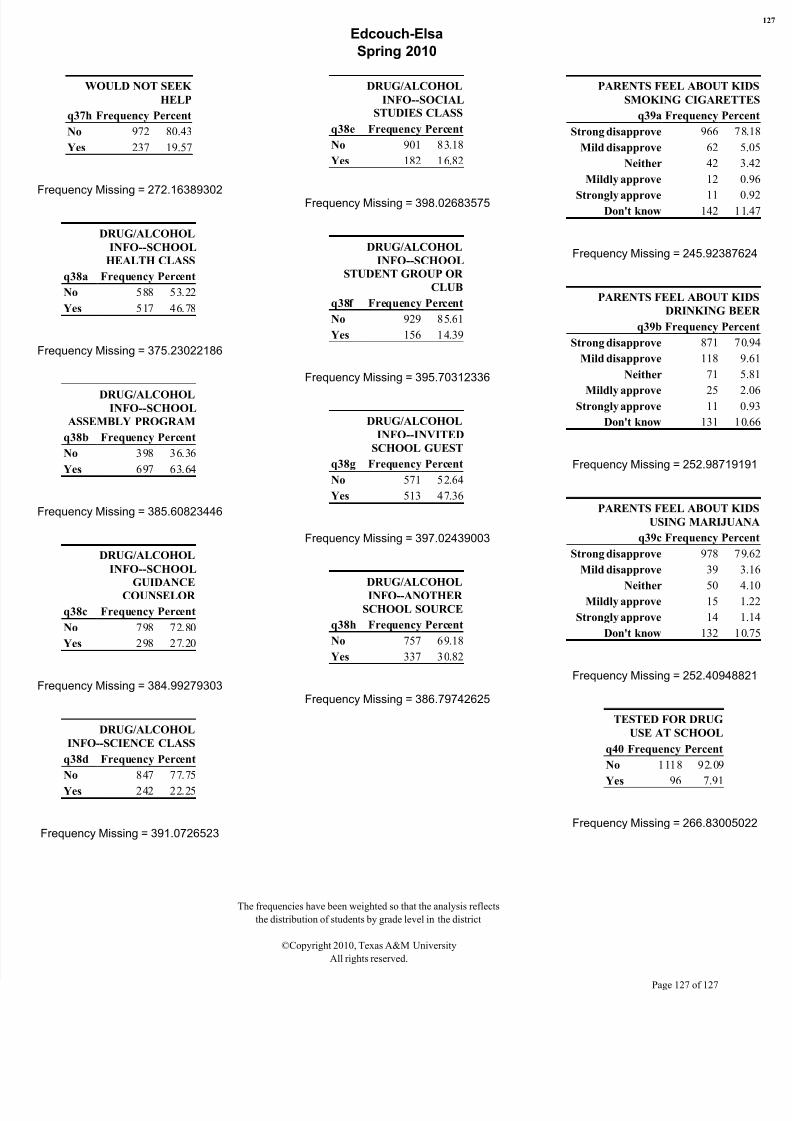
8/7/2019 HIDALGO COUNTY - edcouch-elsa isd _ 2010 Texas School Survey of Drug and Alcohol Use
http://slidepdf.com/reader/full/hidalgo-county-edcouch-elsa-isd-2010-texas-school-survey-of-drug-and-alcohol 127/127
Edcouch-Elsa
Spring 2010
WOULD NOT SEEK
HELP
q37h Frequency Percent
No 972 80.43
Yes 237 19.57
Frequency Missing = 272.16389302
DRUG/ALCOHOL
INFO--SCHOOL
HEALTH CLASS
q38a Frequency Percent
No 588 53.22
Yes 517 46.78
Frequency Missing = 375.23022186
DRUG/ALCOHOLINFO--SCHOOL
ASSEMBLY PROGRAM
q38b Frequency Percent
No 398 36.36
Yes 697 63.64
Frequency Missing = 385.60823446
DRUG/ALCOHOL
INFO--SCHOOL
GUIDANCE
COUNSELOR
q38c Frequency Percent
DRUG/ALCOHOL
INFO--SOCIAL
STUDIES CLASS
q38e Frequency Percent
No 901 83.18
Yes 182 16.82
Frequency Missing = 398.02683575
DRUG/ALCOHOL
INFO--SCHOOL
STUDENT GROUP OR
CLUB
q38f Frequency Percent
No 929 85.61
Yes 156 14.39
Frequency Missing = 395.70312336
DRUG/ALCOHOL
INFO--INVITED
SCHOOL GUEST
q38g Frequency Percent
No 571 52.64
Yes 513 47.36
Frequency Missing = 397.02439003
DRUG/ALCOHOL
INFO--ANOTHER
SCHOOL SOURCE
PARENTS FEEL ABOUT K
SMOKING CIGARETT
q39a Frequency Perc
Strong disapprove 966 7
Mild disapprove 62
Neither 42
Mildly approve 12
Strongly approve 11 Don't know 142 1
Frequency Missing = 245.923876
PARENTS FEEL ABOUT K
DRINKING BE
q39b Frequency Perc
Strong disapprove 871 7
Mild disapprove 118
Neither 71
Mildly approve 25 Strongly approve 11
Don't know 131 1
Frequency Missing = 252.987191
PARENTS FEEL ABOUT K
USING MARIJUA
q39c Frequency Perc
Strong disapprove 978 7
Mild disapprove 39
Neither 50 Mildly approve 15
Strongly approve 14