Embed Size (px)
Citation preview

7/30/2019 2004 _ hidalgo county _ edcouch-elsa isd _ 2004 texas school survey of drug and alcohol use _ elementary report
http://slidepdf.com/reader/full/2004-hidalgo-county-edcouch-elsa-isd-2004-texas-school-survey-of-drug 1/43
7/30/2019 2004 _ hidalgo county _ edcouch-elsa isd _ 2004 texas school survey of drug and alcohol use _ elementary report
http://slidepdf.com/reader/full/2004-hidalgo-county-edcouch-elsa-isd-2004-texas-school-survey-of-drug 2/43
Edcouch-ElsaSpring 2004
________________________________________________________________________________
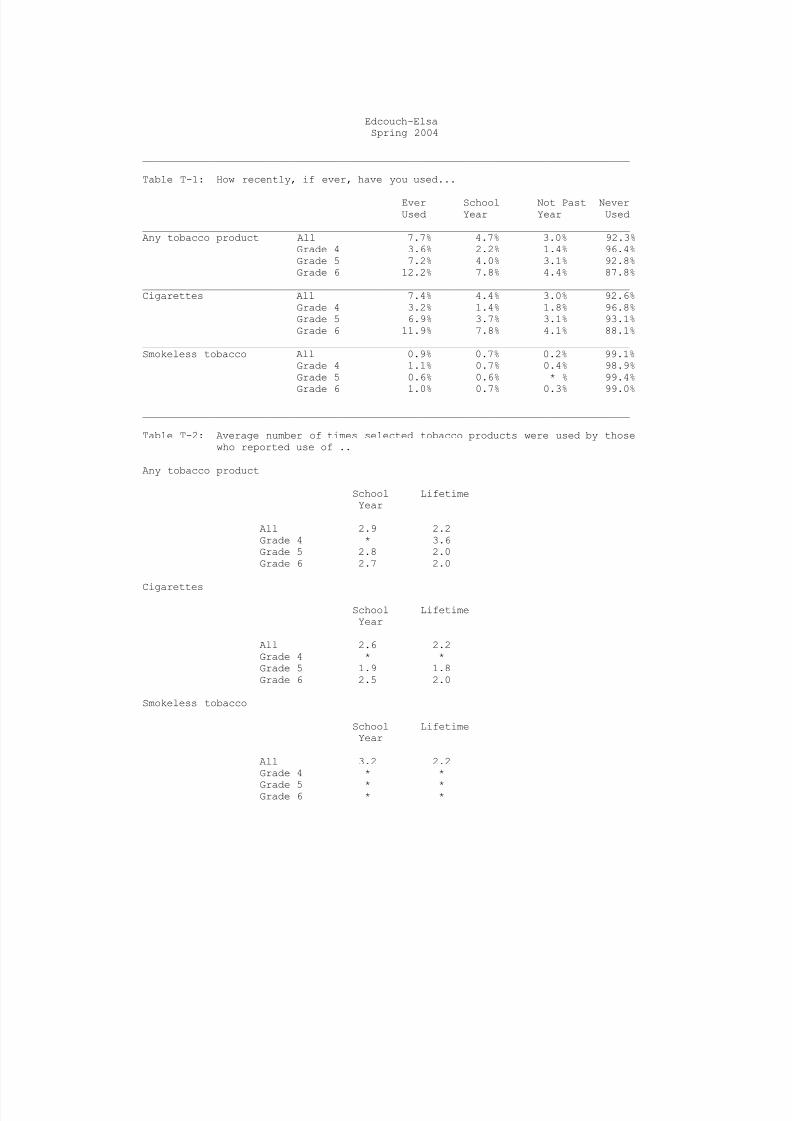
Table T-1: How recently, if ever, have you used...
Ever School Not Past NeverUsed Year Year Used
________________________________________________________________________________Any tobacco product All 7.7% 4.7% 3.0% 92.3%
Grade 4 3.6% 2.2% 1.4% 96.4%Grade 5 7.2% 4.0% 3.1% 92.8%Grade 6 12.2% 7.8% 4.4% 87.8%
________________________________________________________________________________Cigarettes All 7.4% 4.4% 3.0% 92.6%
Grade 4 3.2% 1.4% 1.8% 96.8%Grade 5 6.9% 3.7% 3.1% 93.1%Grade 6 11.9% 7.8% 4.1% 88.1%
________________________________________________________________________________Smokeless tobacco All 0.9% 0.7% 0.2% 99.1%
Grade 4 1.1% 0.7% 0.4% 98.9%Grade 5 0.6% 0.6% * % 99.4%
Grade 6 1.0% 0.7% 0.3% 99.0%
________________________________________________________________________________
Table T-2: Average number of times selected tobacco products were used by thosewho reported use of ..
Any tobacco product
School LifetimeYear
All 2.9 2.2Grade 4 * 3.6Grade 5 2.8 2.0Grade 6 2.7 2.0
Cigarettes
School LifetimeYear
All 2.6 2.2Grade 4 * *Grade 5 1.9 1.8Grade 6 2.5 2.0
Smokeless tobacco
School LifetimeYear
All 3.2 2.2Grade 4 * *
Grade 5 * *Grade 6 * *
7/30/2019 2004 _ hidalgo county _ edcouch-elsa isd _ 2004 texas school survey of drug and alcohol use _ elementary report
http://slidepdf.com/reader/full/2004-hidalgo-county-edcouch-elsa-isd-2004-texas-school-survey-of-drug 3/43
Edcouch-ElsaSpring 2004
________________________________________________________________________________
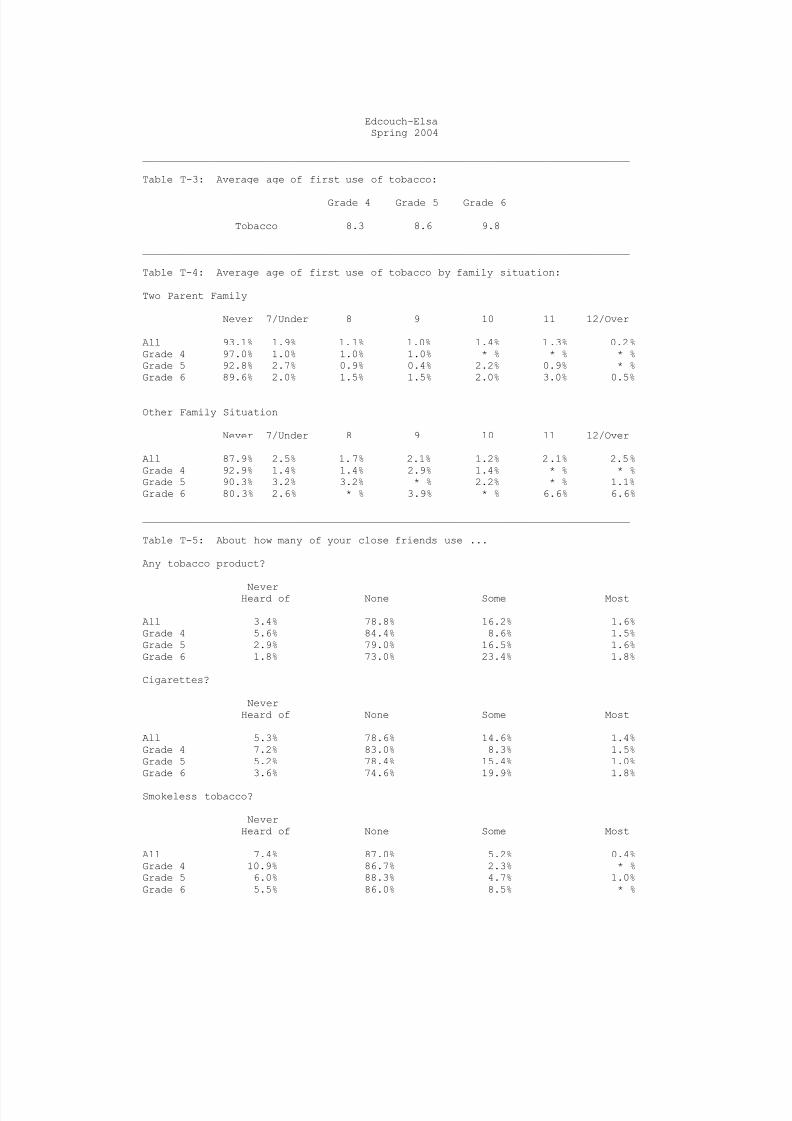
Table T-3: Average age of first use of tobacco:
Grade 4 Grade 5 Grade 6
Tobacco 8.3 8.6 9.8
________________________________________________________________________________
Table T-4: Average age of first use of tobacco by family situation:
Two Parent Family
Never 7/Under 8 9 10 11 12/Over
All 93.1% 1.9% 1.1% 1.0% 1.4% 1.3% 0.2%Grade 4 97.0% 1.0% 1.0% 1.0% * % * % * %Grade 5 92.8% 2.7% 0.9% 0.4% 2.2% 0.9% * %Grade 6 89.6% 2.0% 1.5% 1.5% 2.0% 3.0% 0.5%
Other Family Situation
Never 7/Under 8 9 10 11 12/Over
All 87.9% 2.5% 1.7% 2.1% 1.2% 2.1% 2.5%Grade 4 92.9% 1.4% 1.4% 2.9% 1.4% * % * %Grade 5 90.3% 3.2% 3.2% * % 2.2% * % 1.1%Grade 6 80.3% 2.6% * % 3.9% * % 6.6% 6.6%
________________________________________________________________________________
Table T-5: About how many of your close friends use ...
Any tobacco product?
NeverHeard of None Some Most
All 3.4% 78.8% 16.2% 1.6%Grade 4 5.6% 84.4% 8.6% 1.5%Grade 5 2.9% 79.0% 16.5% 1.6%Grade 6 1.8% 73.0% 23.4% 1.8%
Cigarettes?
NeverHeard of None Some Most
All 5.3% 78.6% 14.6% 1.4%Grade 4 7.2% 83.0% 8.3% 1.5%Grade 5 5.2% 78.4% 15.4% 1.0%Grade 6 3.6% 74.6% 19.9% 1.8%
Smokeless tobacco?
NeverHeard of None Some Most
All 7.4% 87.0% 5.2% 0.4%Grade 4 10.9% 86.7% 2.3% * %Grade 5 6.0% 88.3% 4.7% 1.0%Grade 6 5.5% 86.0% 8.5% * %
7/30/2019 2004 _ hidalgo county _ edcouch-elsa isd _ 2004 texas school survey of drug and alcohol use _ elementary report
http://slidepdf.com/reader/full/2004-hidalgo-county-edcouch-elsa-isd-2004-texas-school-survey-of-drug 4/43
Edcouch-ElsaSpring 2004
________________________________________________________________________________
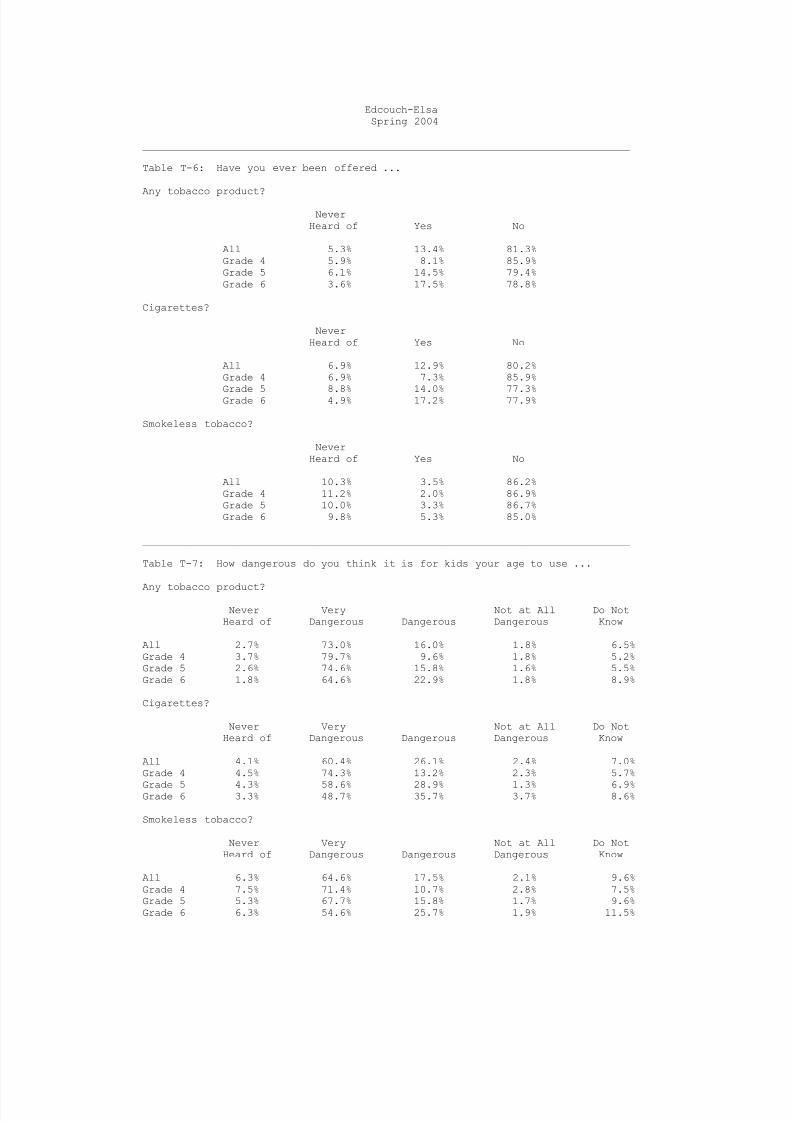
Table T-6: Have you ever been offered ...
Any tobacco product?
NeverHeard of Yes No
All 5.3% 13.4% 81.3%Grade 4 5.9% 8.1% 85.9%Grade 5 6.1% 14.5% 79.4%Grade 6 3.6% 17.5% 78.8%
Cigarettes?
NeverHeard of Yes No
All 6.9% 12.9% 80.2%Grade 4 6.9% 7.3% 85.9%
Grade 5 8.8% 14.0% 77.3%Grade 6 4.9% 17.2% 77.9%
Smokeless tobacco?
NeverHeard of Yes No
All 10.3% 3.5% 86.2%Grade 4 11.2% 2.0% 86.9%Grade 5 10.0% 3.3% 86.7%Grade 6 9.8% 5.3% 85.0%
________________________________________________________________________________
Table T-7: How dangerous do you think it is for kids your age to use ...
Any tobacco product?
Never Very Not at All Do NotHeard of Dangerous Dangerous Dangerous Know
All 2.7% 73.0% 16.0% 1.8% 6.5%Grade 4 3.7% 79.7% 9.6% 1.8% 5.2%Grade 5 2.6% 74.6% 15.8% 1.6% 5.5%Grade 6 1.8% 64.6% 22.9% 1.8% 8.9%
Cigarettes?
Never Very Not at All Do NotHeard of Dangerous Dangerous Dangerous Know
All 4.1% 60.4% 26.1% 2.4% 7.0%Grade 4 4.5% 74.3% 13.2% 2.3% 5.7%
Grade 5 4.3% 58.6% 28.9% 1.3% 6.9%Grade 6 3.3% 48.7% 35.7% 3.7% 8.6%
Smokeless tobacco?
Never Very Not at All Do NotHeard of Dangerous Dangerous Dangerous Know
All 6.3% 64.6% 17.5% 2.1% 9.6%Grade 4 7.5% 71.4% 10.7% 2.8% 7.5%Grade 5 5.3% 67.7% 15.8% 1.7% 9.6%Grade 6 6.3% 54.6% 25.7% 1.9% 11.5%

7/30/2019 2004 _ hidalgo county _ edcouch-elsa isd _ 2004 texas school survey of drug and alcohol use _ elementary report
http://slidepdf.com/reader/full/2004-hidalgo-county-edcouch-elsa-isd-2004-texas-school-survey-of-drug 5/43
7/30/2019 2004 _ hidalgo county _ edcouch-elsa isd _ 2004 texas school survey of drug and alcohol use _ elementary report
http://slidepdf.com/reader/full/2004-hidalgo-county-edcouch-elsa-isd-2004-texas-school-survey-of-drug 6/43
Edcouch-ElsaSpring 2004
________________________________________________________________________________
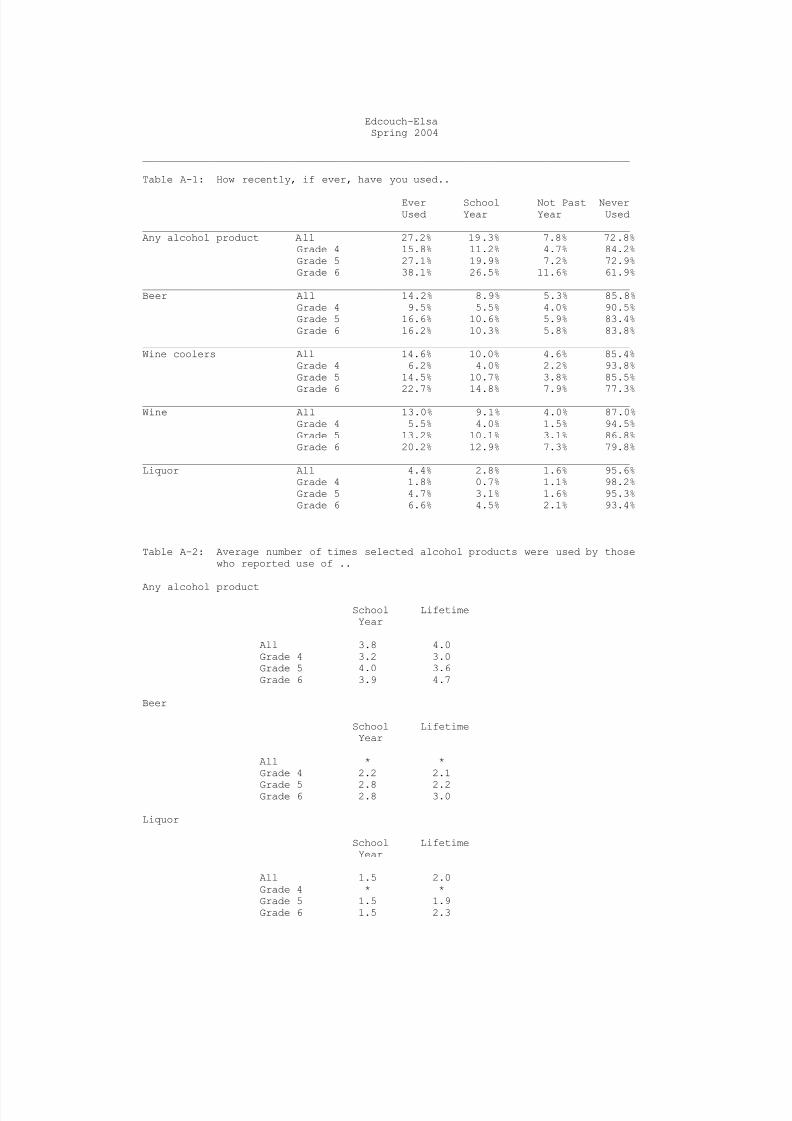
Table A-1: How recently, if ever, have you used..
Ever School Not Past NeverUsed Year Year Used
________________________________________________________________________________Any alcohol product All 27.2% 19.3% 7.8% 72.8%
Grade 4 15.8% 11.2% 4.7% 84.2%Grade 5 27.1% 19.9% 7.2% 72.9%Grade 6 38.1% 26.5% 11.6% 61.9%
________________________________________________________________________________Beer All 14.2% 8.9% 5.3% 85.8%
Grade 4 9.5% 5.5% 4.0% 90.5%Grade 5 16.6% 10.6% 5.9% 83.4%Grade 6 16.2% 10.3% 5.8% 83.8%
________________________________________________________________________________Wine coolers All 14.6% 10.0% 4.6% 85.4%
Grade 4 6.2% 4.0% 2.2% 93.8%Grade 5 14.5% 10.7% 3.8% 85.5%
Grade 6 22.7% 14.8% 7.9% 77.3%________________________________________________________________________________Wine All 13.0% 9.1% 4.0% 87.0%
Grade 4 5.5% 4.0% 1.5% 94.5%Grade 5 13.2% 10.1% 3.1% 86.8%Grade 6 20.2% 12.9% 7.3% 79.8%
________________________________________________________________________________Liquor All 4.4% 2.8% 1.6% 95.6%
Grade 4 1.8% 0.7% 1.1% 98.2%Grade 5 4.7% 3.1% 1.6% 95.3%Grade 6 6.6% 4.5% 2.1% 93.4%
________________________________________________________________________________
Table A-2: Average number of times selected alcohol products were used by thosewho reported use of ..
Any alcohol product
School LifetimeYear
All 3.8 4.0Grade 4 3.2 3.0Grade 5 4.0 3.6Grade 6 3.9 4.7
Beer
School LifetimeYear
All * *Grade 4 2.2 2.1
Grade 5 2.8 2.2Grade 6 2.8 3.0
Liquor
School LifetimeYear
All 1.5 2.0Grade 4 * *Grade 5 1.5 1.9Grade 6 1.5 2.3
7/30/2019 2004 _ hidalgo county _ edcouch-elsa isd _ 2004 texas school survey of drug and alcohol use _ elementary report
http://slidepdf.com/reader/full/2004-hidalgo-county-edcouch-elsa-isd-2004-texas-school-survey-of-drug 7/43
Edcouch-ElsaSpring 2004
________________________________________________________________________________
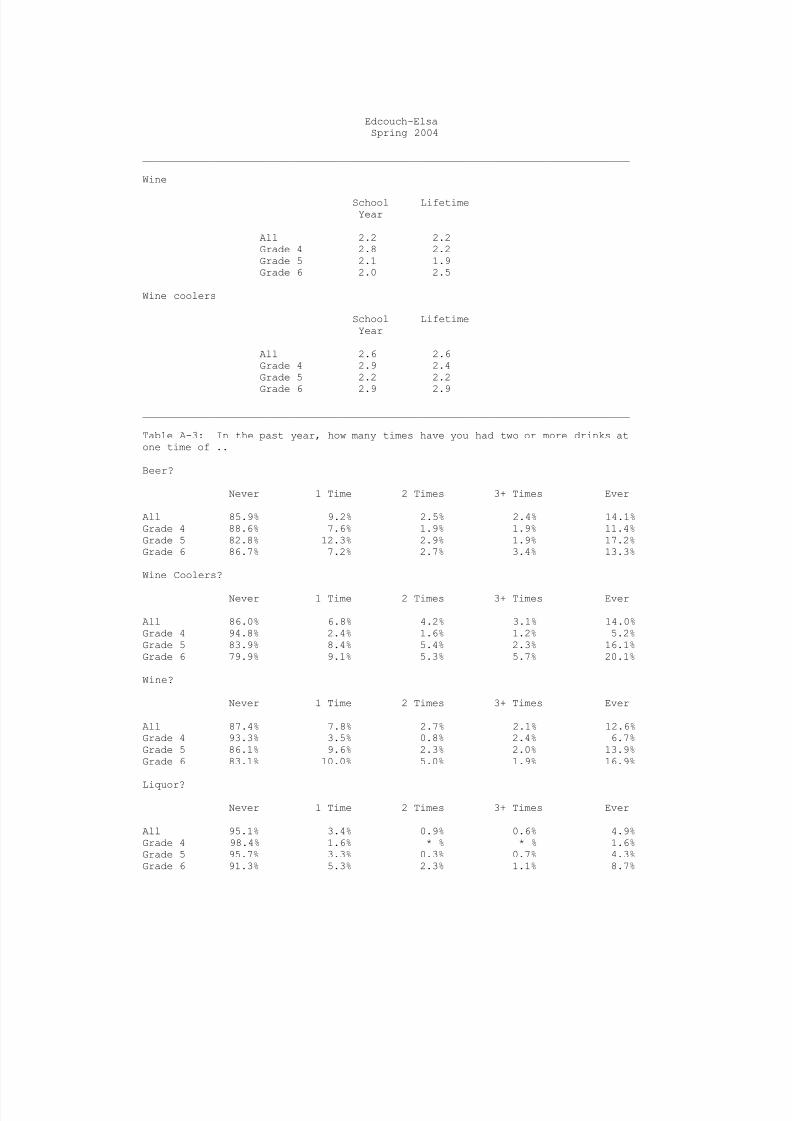
Wine
School LifetimeYear
All 2.2 2.2Grade 4 2.8 2.2Grade 5 2.1 1.9Grade 6 2.0 2.5
Wine coolers
School LifetimeYear
All 2.6 2.6Grade 4 2.9 2.4Grade 5 2.2 2.2
Grade 6 2.9 2.9
________________________________________________________________________________
Table A-3: In the past year, how many times have you had two or more drinks atone time of ..
Beer?
Never 1 Time 2 Times 3+ Times Ever
All 85.9% 9.2% 2.5% 2.4% 14.1%Grade 4 88.6% 7.6% 1.9% 1.9% 11.4%Grade 5 82.8% 12.3% 2.9% 1.9% 17.2%Grade 6 86.7% 7.2% 2.7% 3.4% 13.3%
Wine Coolers?
Never 1 Time 2 Times 3+ Times Ever
All 86.0% 6.8% 4.2% 3.1% 14.0%Grade 4 94.8% 2.4% 1.6% 1.2% 5.2%Grade 5 83.9% 8.4% 5.4% 2.3% 16.1%Grade 6 79.9% 9.1% 5.3% 5.7% 20.1%
Wine?
Never 1 Time 2 Times 3+ Times Ever
All 87.4% 7.8% 2.7% 2.1% 12.6%Grade 4 93.3% 3.5% 0.8% 2.4% 6.7%Grade 5 86.1% 9.6% 2.3% 2.0% 13.9%Grade 6 83.1% 10.0% 5.0% 1.9% 16.9%
Liquor?
Never 1 Time 2 Times 3+ Times Ever
All 95.1% 3.4% 0.9% 0.6% 4.9%Grade 4 98.4% 1.6% * % * % 1.6%Grade 5 95.7% 3.3% 0.3% 0.7% 4.3%Grade 6 91.3% 5.3% 2.3% 1.1% 8.7%
7/30/2019 2004 _ hidalgo county _ edcouch-elsa isd _ 2004 texas school survey of drug and alcohol use _ elementary report
http://slidepdf.com/reader/full/2004-hidalgo-county-edcouch-elsa-isd-2004-texas-school-survey-of-drug 8/43
Edcouch-ElsaSpring 2004
________________________________________________________________________________
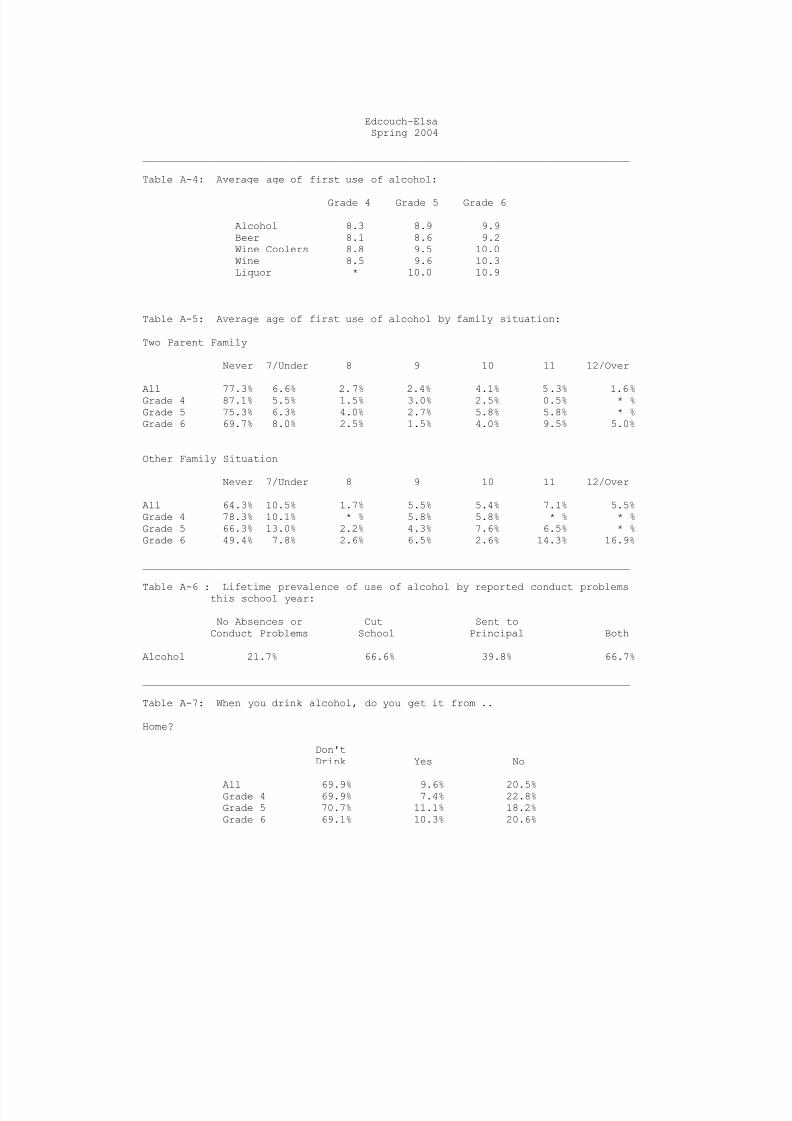
Table A-4: Average age of first use of alcohol:
Grade 4 Grade 5 Grade 6
Alcohol 8.3 8.9 9.9Beer 8.1 8.6 9.2Wine Coolers 8.8 9.5 10.0Wine 8.5 9.6 10.3Liquor * 10.0 10.9
________________________________________________________________________________
Table A-5: Average age of first use of alcohol by family situation:
Two Parent Family
Never 7/Under 8 9 10 11 12/Over
All 77.3% 6.6% 2.7% 2.4% 4.1% 5.3% 1.6%Grade 4 87.1% 5.5% 1.5% 3.0% 2.5% 0.5% * %Grade 5 75.3% 6.3% 4.0% 2.7% 5.8% 5.8% * %Grade 6 69.7% 8.0% 2.5% 1.5% 4.0% 9.5% 5.0%
Other Family Situation
Never 7/Under 8 9 10 11 12/Over
All 64.3% 10.5% 1.7% 5.5% 5.4% 7.1% 5.5%Grade 4 78.3% 10.1% * % 5.8% 5.8% * % * %Grade 5 66.3% 13.0% 2.2% 4.3% 7.6% 6.5% * %Grade 6 49.4% 7.8% 2.6% 6.5% 2.6% 14.3% 16.9%
________________________________________________________________________________
Table A-6 : Lifetime prevalence of use of alcohol by reported conduct problemsthis school year:
No Absences or Cut Sent toConduct Problems School Principal Both
Alcohol 21.7% 66.6% 39.8% 66.7%
________________________________________________________________________________
Table A-7: When you drink alcohol, do you get it from ..
Home?
Don'tDrink Yes No
All 69.9% 9.6% 20.5%Grade 4 69.9% 7.4% 22.8%Grade 5 70.7% 11.1% 18.2%Grade 6 69.1% 10.3% 20.6%
7/30/2019 2004 _ hidalgo county _ edcouch-elsa isd _ 2004 texas school survey of drug and alcohol use _ elementary report
http://slidepdf.com/reader/full/2004-hidalgo-county-edcouch-elsa-isd-2004-texas-school-survey-of-drug 9/43
Edcouch-ElsaSpring 2004
________________________________________________________________________________
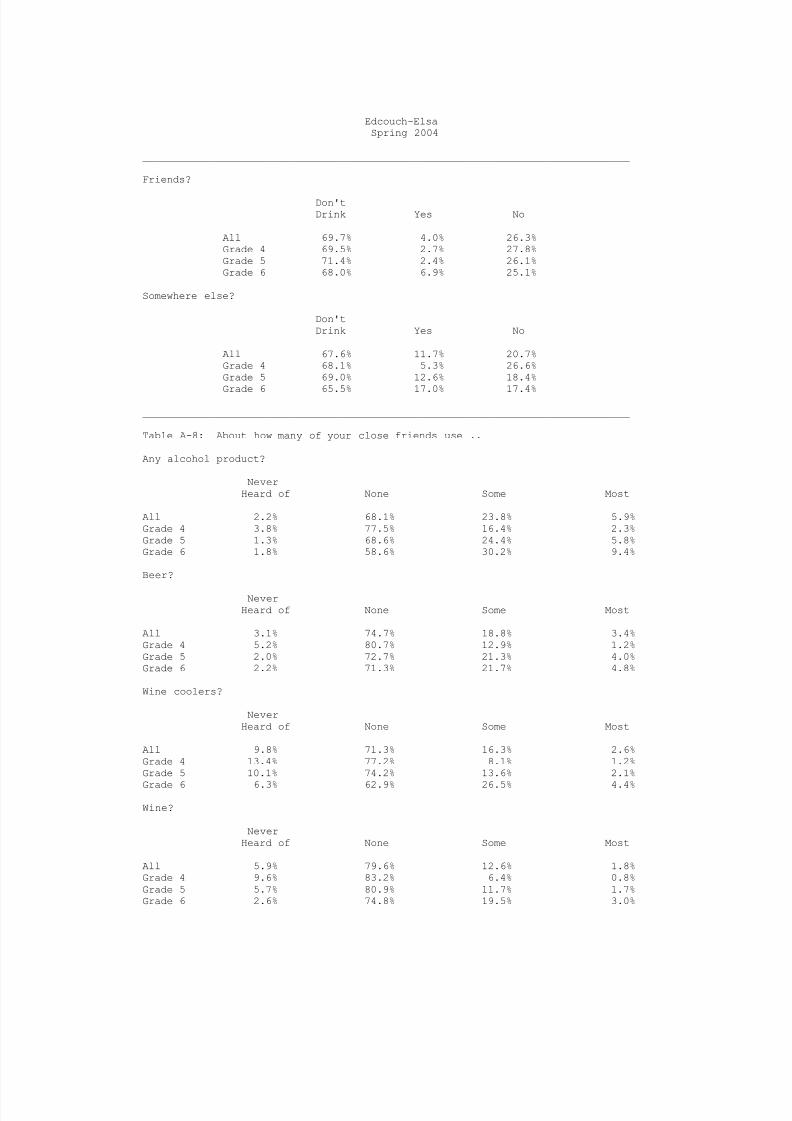
Friends?
Don'tDrink Yes No
All 69.7% 4.0% 26.3%Grade 4 69.5% 2.7% 27.8%Grade 5 71.4% 2.4% 26.1%Grade 6 68.0% 6.9% 25.1%
Somewhere else?
Don'tDrink Yes No
All 67.6% 11.7% 20.7%Grade 4 68.1% 5.3% 26.6%Grade 5 69.0% 12.6% 18.4%
Grade 6 65.5% 17.0% 17.4%
________________________________________________________________________________
Table A-8: About how many of your close friends use ..
Any alcohol product?
NeverHeard of None Some Most
All 2.2% 68.1% 23.8% 5.9%Grade 4 3.8% 77.5% 16.4% 2.3%Grade 5 1.3% 68.6% 24.4% 5.8%Grade 6 1.8% 58.6% 30.2% 9.4%
Beer?
NeverHeard of None Some Most
All 3.1% 74.7% 18.8% 3.4%Grade 4 5.2% 80.7% 12.9% 1.2%Grade 5 2.0% 72.7% 21.3% 4.0%Grade 6 2.2% 71.3% 21.7% 4.8%
Wine coolers?
NeverHeard of None Some Most
All 9.8% 71.3% 16.3% 2.6%Grade 4 13.4% 77.2% 8.1% 1.2%Grade 5 10.1% 74.2% 13.6% 2.1%
Grade 6 6.3% 62.9% 26.5% 4.4%
Wine?
NeverHeard of None Some Most
All 5.9% 79.6% 12.6% 1.8%Grade 4 9.6% 83.2% 6.4% 0.8%Grade 5 5.7% 80.9% 11.7% 1.7%Grade 6 2.6% 74.8% 19.5% 3.0%
7/30/2019 2004 _ hidalgo county _ edcouch-elsa isd _ 2004 texas school survey of drug and alcohol use _ elementary report
http://slidepdf.com/reader/full/2004-hidalgo-county-edcouch-elsa-isd-2004-texas-school-survey-of-drug 10/43
Edcouch-ElsaSpring 2004
________________________________________________________________________________
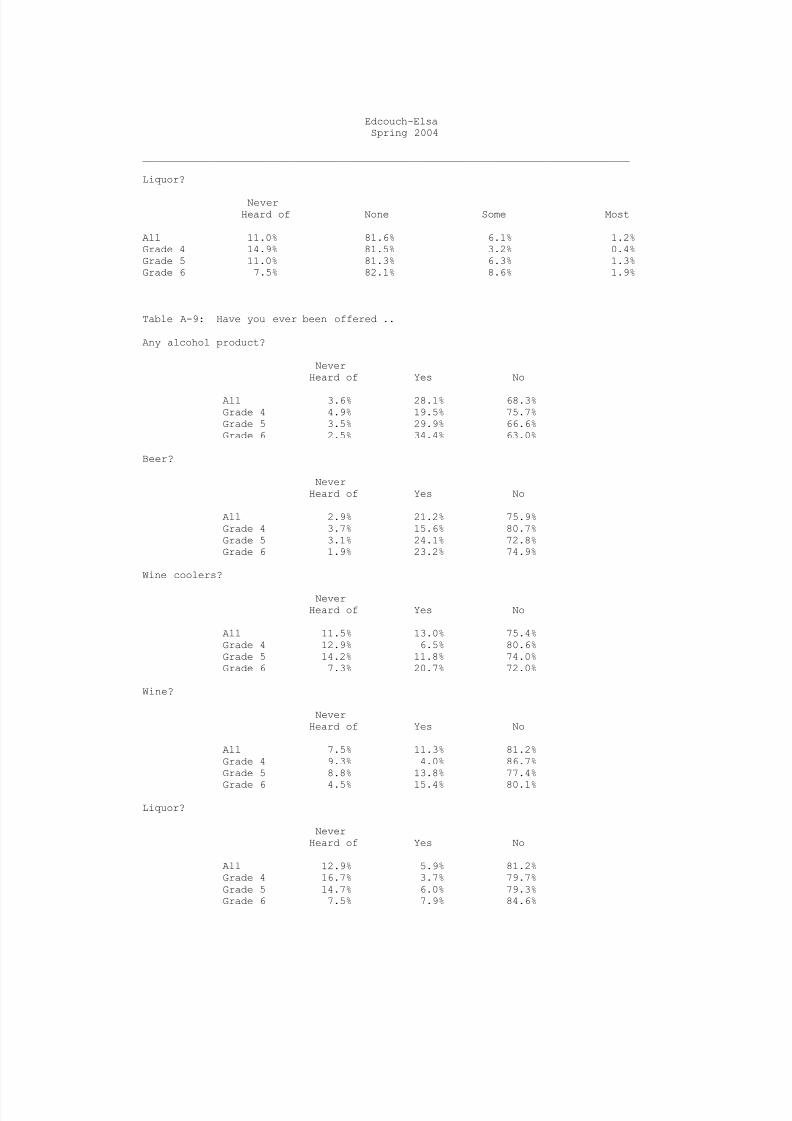
Liquor?
NeverHeard of None Some Most
All 11.0% 81.6% 6.1% 1.2%Grade 4 14.9% 81.5% 3.2% 0.4%Grade 5 11.0% 81.3% 6.3% 1.3%Grade 6 7.5% 82.1% 8.6% 1.9%
________________________________________________________________________________
Table A-9: Have you ever been offered ..
Any alcohol product?
NeverHeard of Yes No
All 3.6% 28.1% 68.3%Grade 4 4.9% 19.5% 75.7%Grade 5 3.5% 29.9% 66.6%Grade 6 2.5% 34.4% 63.0%
Beer?
NeverHeard of Yes No
All 2.9% 21.2% 75.9%Grade 4 3.7% 15.6% 80.7%Grade 5 3.1% 24.1% 72.8%Grade 6 1.9% 23.2% 74.9%
Wine coolers?
NeverHeard of Yes No
All 11.5% 13.0% 75.4%Grade 4 12.9% 6.5% 80.6%Grade 5 14.2% 11.8% 74.0%Grade 6 7.3% 20.7% 72.0%
Wine?
NeverHeard of Yes No
All 7.5% 11.3% 81.2%Grade 4 9.3% 4.0% 86.7%Grade 5 8.8% 13.8% 77.4%
Grade 6 4.5% 15.4% 80.1%
Liquor?
NeverHeard of Yes No
All 12.9% 5.9% 81.2%Grade 4 16.7% 3.7% 79.7%Grade 5 14.7% 6.0% 79.3%Grade 6 7.5% 7.9% 84.6%
7/30/2019 2004 _ hidalgo county _ edcouch-elsa isd _ 2004 texas school survey of drug and alcohol use _ elementary report
http://slidepdf.com/reader/full/2004-hidalgo-county-edcouch-elsa-isd-2004-texas-school-survey-of-drug 11/43
Edcouch-ElsaSpring 2004
________________________________________________________________________________
Table A-10: How do your parents feel about kids your age drinking beer?
Don't Don't Think Don'tLike It Care It's OK Know
All 82.5% 1.4% 0.8% 15.2%Grade 4 84.1% 2.2% 0.4% 13.4%Grade 5 80.3% 1.0% 1.3% 17.5%Grade 6 83.6% 1.1% 0.7% 14.6%
________________________________________________________________________________
Table A-11: How dangerous do you think it is for kids your age to use ..
Any alcohol product?
Never Very Not at All Do NotHeard of Dangerous Dangerous Dangerous Know
All 1.7% 69.0% 18.9% 3.6% 6.8%Grade 4 2.3% 80.1% 10.2% 3.0% 4.5%Grade 5 1.3% 71.3% 17.4% 2.6% 7.4%Grade 6 1.5% 55.6% 29.3% 5.2% 8.5%
Beer?
Never Very Not at All Do NotHeard of Dangerous Dangerous Dangerous Know
All 1.7% 50.2% 32.7% 5.9% 9.6%Grade 4 2.3% 64.5% 21.2% 5.0% 6.9%Grade 5 1.3% 49.8% 35.4% 3.7% 9.8%Grade 6 1.5% 36.2% 41.2% 9.2% 11.9%
Wine coolers?
Never Very Not at All Do NotHeard of Dangerous Dangerous Dangerous Know
All 7.4% 45.8% 23.8% 10.4% 12.5%Grade 4 8.6% 62.6% 14.4% 6.2% 8.2%Grade 5 8.4% 46.0% 23.8% 8.7% 13.1%Grade 6 5.3% 29.3% 33.1% 16.2% 16.2%
Wine?
Never Very Not at All Do NotHeard of Dangerous Dangerous Dangerous Know
All 3.6% 49.9% 24.9% 7.8% 13.8%Grade 4 4.3% 67.2% 14.2% 4.0% 10.3%Grade 5 4.0% 50.8% 23.1% 7.0% 15.1%
Grade 6 2.3% 32.2% 37.1% 12.5% 15.9%
Liquor?
Never Very Not at All Do NotHeard of Dangerous Dangerous Dangerous Know
All 8.8% 60.6% 17.2% 2.9% 10.4%Grade 4 13.1% 68.7% 8.3% 2.0% 7.9%Grade 5 9.1% 62.1% 15.4% 3.0% 10.4%Grade 6 4.5% 51.3% 27.5% 3.8% 12.8%
7/30/2019 2004 _ hidalgo county _ edcouch-elsa isd _ 2004 texas school survey of drug and alcohol use _ elementary report
http://slidepdf.com/reader/full/2004-hidalgo-county-edcouch-elsa-isd-2004-texas-school-survey-of-drug 12/43
Edcouch-ElsaSpring 2004
________________________________________________________________________________
Table D-1: How recently, if ever, have you used..
Ever School Not Past NeverUsed Year Year Used
________________________________________________________________________________Marijuana All 3.3% 2.6% 0.7% 96.7%
Grade 4 0.7% 0.4% 0.4% 99.3%Grade 5 3.2% 2.8% 0.3% 96.8%Grade 6 5.8% 4.5% 1.4% 94.2%
________________________________________________________________________________
Table D-2: Average number of times marijuana was used by those reporting usage:
School LifetimeYear
All 4.4 4.5
Grade 4 * *Grade 5 * *Grade 6 4.8 4.9
________________________________________________________________________________
Table D-3: Average age of first use of marijuana:
Grade 4 Grade 5 Grade 6
Marijuana * 9.5 10.7
________________________________________________________________________________
Table D-4: Average age of first use of marijuana by family situation:
Two Parent Family
Never 7/Under 8 9 10 11 12/Over
All 96.8% 0.7% * % * % 0.5% 1.3% 0.7%Grade 4 99.5% 0.5% * % * % * % * % * %Grade 5 98.1% 0.5% * % * % 0.5% 0.9% * %Grade 6 92.8% 1.0% * % * % 1.0% 3.1% 2.1%
Other Family Situation
Never 7/Under 8 9 10 11 12/Over
All 94.5% 0.9% 0.9% * % 1.7% 0.4% 1.7%Grade 4 97.1% * % 1.4% * % 1.4% * % * %Grade 5 93.3% 1.1% 1.1% * % 3.3% 1.1% * %Grade 6 93.3% 1.3% * % * % * % * % 5.3%
7/30/2019 2004 _ hidalgo county _ edcouch-elsa isd _ 2004 texas school survey of drug and alcohol use _ elementary report
http://slidepdf.com/reader/full/2004-hidalgo-county-edcouch-elsa-isd-2004-texas-school-survey-of-drug 13/43
Edcouch-ElsaSpring 2004
________________________________________________________________________________
Table D-5 : Lifetime prevalence of use of marijuana by reported conduct
problems this school year:
No Absences or Cut Sent toConduct Problems School Principal Both
Marijuana 1.0% 41.2% 8.3% 50.1%
________________________________________________________________________________
Table D-6: About how many of your close friends use marijuana?
NeverHeard of None Some Most
All 7.9% 80.2% 10.1% 1.8%Grade 4 10.0% 85.3% 4.8% * %Grade 5 7.2% 82.4% 9.4% 1.0%
Grade 6 6.9% 73.1% 15.6% 4.4%
________________________________________________________________________________
Table D-7: Have you ever been offered marijuana?
NeverHeard of Yes No
All 9.5% 10.0% 80.5%Grade 4 11.1% 3.6% 85.4%Grade 5 10.4% 10.1% 79.5%Grade 6 6.9% 16.0% 77.1%
________________________________________________________________________________
Table D-8: How do your parents feel about kids your age smoking marijuana?
Don't Don't Think Don'tLike It Care It's OK Know
All 84.2% 1.5% 0.9% 13.4%Grade 4 84.9% 1.4% 1.8% 11.9%Grade 5 82.9% 1.9% 0.6% 14.6%Grade 6 84.8% 1.1% 0.4% 13.7%
________________________________________________________________________________
Table D-9: How dangerous do you think it is for kids your age to use marijuana?
Never Very Not at All Do NotHeard of Dangerous Dangerous Dangerous Know
All 5.2% 76.2% 8.7% 2.4% 7.4%
Grade 4 6.9% 78.4% 6.2% 2.3% 6.2%Grade 5 5.4% 75.5% 9.1% 2.7% 7.4%Grade 6 3.4% 74.8% 10.9% 2.3% 8.6%
7/30/2019 2004 _ hidalgo county _ edcouch-elsa isd _ 2004 texas school survey of drug and alcohol use _ elementary report
http://slidepdf.com/reader/full/2004-hidalgo-county-edcouch-elsa-isd-2004-texas-school-survey-of-drug 14/43
Edcouch-ElsaSpring 2004
________________________________________________________________________________
Table I-1: How recently, if ever, have you used..
Ever School Not Past NeverUsed Year Year Used
________________________________________________________________________________Inhalants All 9.1% 6.9% 2.3% 90.9%
Grade 4 7.0% 4.0% 2.9% 93.0%Grade 5 10.3% 8.4% 1.9% 89.7%Grade 6 9.9% 7.8% 2.0% 90.1%
________________________________________________________________________________
Table I-2: Have you ever sniffed any of the following inhalants to get high?
Correction Fluid/Whiteout
Not Used Used
All 96.2% 3.8%Grade 4 98.5% 1.5%Grade 5 95.5% 4.5%Grade 6 94.7% 5.3%
Gasoline
Not Used Used
All 97.5% 2.5%Grade 4 97.4% 2.6%Grade 5 98.4% 1.6%Grade 6 96.6% 3.4%
Glue
Not Used Used
All 98.1% 1.9%Grade 4 98.9% 1.1%Grade 5 97.4% 2.6%Grade 6 98.3% 1.7%
Paint Thinner
Not Used Used
All 98.7% 1.3%Grade 4 99.2% 0.8%Grade 5 98.4% 1.6%Grade 6 98.6% 1.4%
Spray Paint
Not Used Used
All 96.5% 3.5%Grade 4 96.3% 3.7%Grade 5 96.1% 3.9%Grade 6 97.2% 2.8%
7/30/2019 2004 _ hidalgo county _ edcouch-elsa isd _ 2004 texas school survey of drug and alcohol use _ elementary report
http://slidepdf.com/reader/full/2004-hidalgo-county-edcouch-elsa-isd-2004-texas-school-survey-of-drug 15/43
Edcouch-ElsaSpring 2004
________________________________________________________________________________
Other Inhalants
Not Used Used
All 95.6% 4.4%Grade 4 96.7% 3.3%Grade 5 96.0% 4.0%Grade 6 94.1% 5.9%
________________________________________________________________________________
Table I-3: Average number of times inhalants were used by those reporting usage:
School LifetimeYear
All 3.6 3.9Grade 4 * *
Grade 5 3.7 3.5Grade 6 3.5 3.8
________________________________________________________________________________
Table I-4: Number of different kinds of inhalants used:
0 1 2-3 4+
All 91.1% 4.3% 4.2% 0.4%Grade 4 93.3% 3.2% 3.2% 0.4%Grade 5 89.8% 5.8% 4.0% 0.3%Grade 6 90.2% 3.7% 5.4% 0.7%
________________________________________________________________________________
Table I-5: Average age of first use of inhalants:
Grade 4 Grade 5 Grade 6
Inhalants * 9.3 9.2
________________________________________________________________________________
Table I-6: Average age of first use of inhalants by family situation:
Two Parent Family
Never 7/Under 8 9 10 11 12/Over
All 96.2% 0.8% 0.2% 0.8% 0.8% 1.2% * %Grade 4 97.4% 0.5% 0.5% 1.6% * % * % * %Grade 5 95.3% 1.4% * % * % 1.4% 1.9% * %Grade 6 95.9% 0.5% * % 1.0% 1.0% 1.5% * %
7/30/2019 2004 _ hidalgo county _ edcouch-elsa isd _ 2004 texas school survey of drug and alcohol use _ elementary report
http://slidepdf.com/reader/full/2004-hidalgo-county-edcouch-elsa-isd-2004-texas-school-survey-of-drug 16/43
Edcouch-ElsaSpring 2004
________________________________________________________________________________
Other Family Situation
Never 7/Under 8 9 10 11 12/Over
All 95.3% 1.7% * % 1.3% 1.7% * % * %Grade 4 100.0% * % * % * % * % * % * %Grade 5 93.3% 1.1% * % 3.3% 2.2% * % * %Grade 6 93.2% 4.1% * % * % 2.7% * % * %
________________________________________________________________________________
Table I-7: Lifetime prevalence of use of inhalants by reported conductproblems this school year:
No Absences or Cut Sent toConduct Problems School Principal Both
Inhalants 2.1% 11.8% 7.3% 7.2%
________________________________________________________________________________
Table I-8: About how many of your close friends use inhalants?
NeverHeard of None Some Most
All 8.3% 81.5% 8.0% 2.2%Grade 4 9.8% 86.7% 2.7% 0.8%Grade 5 9.5% 81.4% 7.2% 2.0%Grade 6 5.5% 76.8% 14.0% 3.7%
________________________________________________________________________________
Table I-9: Have you ever been offered inhalants?
NeverHeard of Yes No
All 11.2% 6.2% 82.6%Grade 4 12.4% 2.0% 85.5%Grade 5 13.4% 5.4% 81.2%Grade 6 7.7% 10.9% 81.4%
________________________________________________________________________________
Table I-10: How dangerous do you think it is for kids your age to use inhalants?
Never Very Not at All Do NotHeard of Dangerous Dangerous Dangerous Know
All 7.1% 59.1% 19.3% 3.3% 11.1%
Grade 4 8.6% 68.9% 12.1% 2.3% 8.2%Grade 5 7.8% 59.1% 18.9% 3.7% 10.5%Grade 6 4.9% 49.6% 26.9% 3.8% 14.8%

7/30/2019 2004 _ hidalgo county _ edcouch-elsa isd _ 2004 texas school survey of drug and alcohol use _ elementary report
http://slidepdf.com/reader/full/2004-hidalgo-county-edcouch-elsa-isd-2004-texas-school-survey-of-drug 17/43
7/30/2019 2004 _ hidalgo county _ edcouch-elsa isd _ 2004 texas school survey of drug and alcohol use _ elementary report
http://slidepdf.com/reader/full/2004-hidalgo-county-edcouch-elsa-isd-2004-texas-school-survey-of-drug 18/43
Edcouch-ElsaSpring 2004
________________________________________________________________________________
Table X-1: Since school began in the fall, have you gotten information on drugs
or alcohol from ..
An Assembly Program?
No Yes
All 42.1% 57.9%Grade 4 44.1% 55.9%Grade 5 41.5% 58.5%Grade 6 40.6% 59.4%
Guidance Counselor?
No Yes
All 32.2% 67.8%Grade 4 30.4% 69.6%
Grade 5 22.8% 77.2%Grade 6 44.4% 55.6%
Visitor to Class?
No Yes
All 51.2% 48.8%Grade 4 57.7% 42.3%Grade 5 52.0% 48.0%Grade 6 44.0% 56.0%
Someone Else at School?
No Yes
All 52.2% 47.8%
Grade 4 58.9% 41.1%Grade 5 53.2% 46.8%Grade 6 44.7% 55.3%
Your Teacher?
No Yes
All 26.0% 74.0%Grade 4 30.8% 69.2%Grade 5 31.7% 68.3%Grade 6 15.2% 84.8%
Any School Source?
No Yes
All 14.1% 85.9%Grade 4 19.3% 80.7%Grade 5 12.4% 87.6%Grade 6 10.7% 89.3%

7/30/2019 2004 _ hidalgo county _ edcouch-elsa isd _ 2004 texas school survey of drug and alcohol use _ elementary report
http://slidepdf.com/reader/full/2004-hidalgo-county-edcouch-elsa-isd-2004-texas-school-survey-of-drug 19/43
7/30/2019 2004 _ hidalgo county _ edcouch-elsa isd _ 2004 texas school survey of drug and alcohol use _ elementary report
http://slidepdf.com/reader/full/2004-hidalgo-county-edcouch-elsa-isd-2004-texas-school-survey-of-drug 20/43
Edcouch-ElsaSpring 2004
Table B1: Prevalence and recency of use of selected substances by grade--> All Students
Ever School Not Past Never
Used Year Year Used________________________________________________________________________________Tobacco All 7.7% 4.7% 3.0% 92.3%
Grade 4 3.6% 2.2% 1.4% 96.4%Grade 5 7.2% 4.0% 3.1% 92.8%Grade 6 12.2% 7.8% 4.4% 87.8%
________________________________________________________________________________Alcohol All 27.2% 19.3% 7.8% 72.8%
Grade 4 15.8% 11.2% 4.7% 84.2%Grade 5 27.1% 19.9% 7.2% 72.9%Grade 6 38.1% 26.5% 11.6% 61.9%
________________________________________________________________________________Inhalants All 9.1% 6.9% 2.3% 90.9%
Grade 4 7.0% 4.0% 2.9% 93.0%Grade 5 10.3% 8.4% 1.9% 89.7%Grade 6 9.9% 7.8% 2.0% 90.1%
________________________________________________________________________________
Marijuana All 3.3% 2.6% 0.7% 96.7%Grade 4 0.7% 0.4% 0.4% 99.3%Grade 5 3.2% 2.8% 0.3% 96.8%Grade 6 5.8% 4.5% 1.4% 94.2%
________________________________________________________________________________
Table B2: Prevalence and recency of use of selected substances by grade--> Male Students
Ever School Not Past NeverUsed Year Year Used
________________________________________________________________________________Tobacco All 10.2% 6.1% 4.1% 89.8%
Grade 4 4.6% 2.0% 2.6% 95.4%Grade 5 10.7% 5.3% 5.3% 89.3%Grade 6 16.5% 12.4% 4.1% 83.5%
________________________________________________________________________________Alcohol All 28.6% 20.5% 8.1% 71.4%
Grade 4 15.7% 12.4% 3.3% 84.3%Grade 5 34.7% 22.9% 11.8% 65.3%Grade 6 36.7% 27.5% 9.2% 63.3%
________________________________________________________________________________Inhalants All 11.9% 9.1% 2.7% 88.1%
Grade 4 10.7% 7.4% 3.4% 89.3%Grade 5 12.9% 10.6% 2.4% 87.1%Grade 6 11.8% 9.2% 2.5% 88.2%
________________________________________________________________________________Marijuana All 4.8% 3.9% 0.9% 95.2%
Grade 4 0.7% * % 0.7% 99.3%Grade 5 4.8% 4.2% 0.6% 95.2%Grade 6 10.2% 8.5% 1.7% 89.8%
________________________________________________________________________________
7/30/2019 2004 _ hidalgo county _ edcouch-elsa isd _ 2004 texas school survey of drug and alcohol use _ elementary report
http://slidepdf.com/reader/full/2004-hidalgo-county-edcouch-elsa-isd-2004-texas-school-survey-of-drug 21/43
Edcouch-ElsaSpring 2004
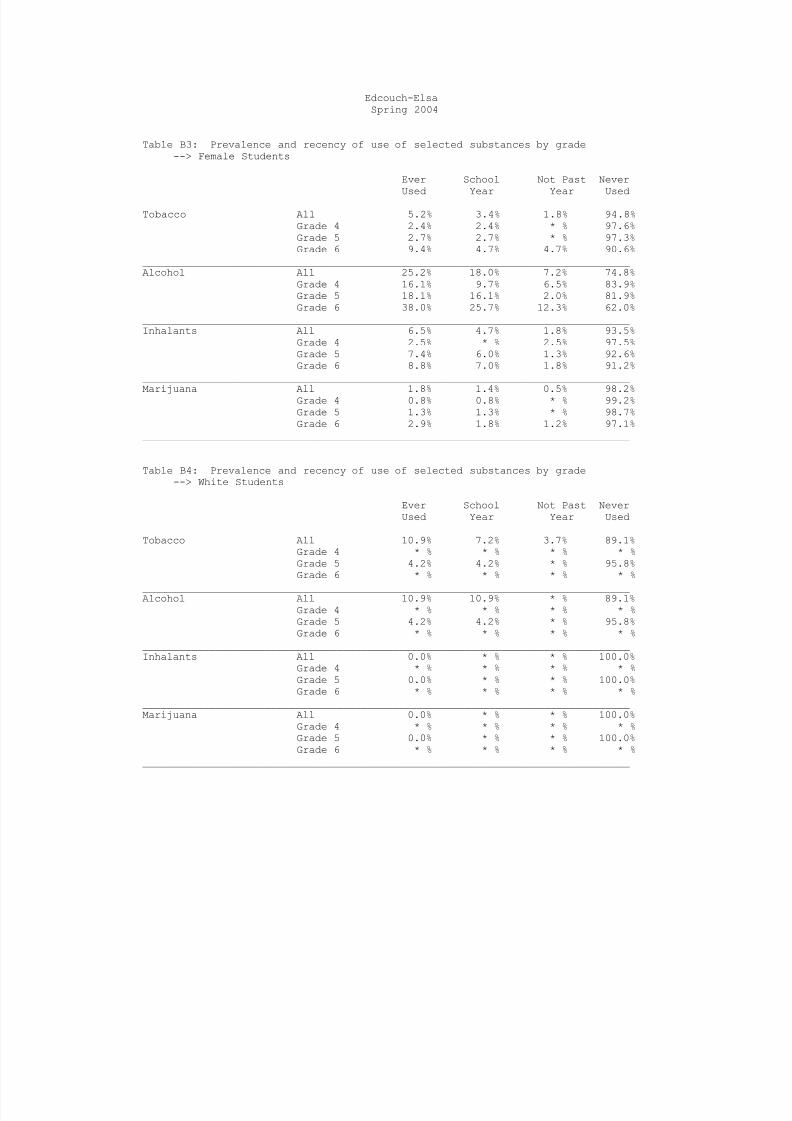
Table B3: Prevalence and recency of use of selected substances by grade--> Female Students
Ever School Not Past Never
Used Year Year Used________________________________________________________________________________Tobacco All 5.2% 3.4% 1.8% 94.8%
Grade 4 2.4% 2.4% * % 97.6%Grade 5 2.7% 2.7% * % 97.3%Grade 6 9.4% 4.7% 4.7% 90.6%
________________________________________________________________________________Alcohol All 25.2% 18.0% 7.2% 74.8%
Grade 4 16.1% 9.7% 6.5% 83.9%Grade 5 18.1% 16.1% 2.0% 81.9%Grade 6 38.0% 25.7% 12.3% 62.0%
________________________________________________________________________________Inhalants All 6.5% 4.7% 1.8% 93.5%
Grade 4 2.5% * % 2.5% 97.5%Grade 5 7.4% 6.0% 1.3% 92.6%Grade 6 8.8% 7.0% 1.8% 91.2%
________________________________________________________________________________
Marijuana All 1.8% 1.4% 0.5% 98.2%Grade 4 0.8% 0.8% * % 99.2%Grade 5 1.3% 1.3% * % 98.7%Grade 6 2.9% 1.8% 1.2% 97.1%
________________________________________________________________________________
Table B4: Prevalence and recency of use of selected substances by grade--> White Students
Ever School Not Past NeverUsed Year Year Used
________________________________________________________________________________Tobacco All 10.9% 7.2% 3.7% 89.1%
Grade 4 * % * % * % * %Grade 5 4.2% 4.2% * % 95.8%Grade 6 * % * % * % * %
________________________________________________________________________________Alcohol All 10.9% 10.9% * % 89.1%
Grade 4 * % * % * % * %Grade 5 4.2% 4.2% * % 95.8%Grade 6 * % * % * % * %
________________________________________________________________________________Inhalants All 0.0% * % * % 100.0%
Grade 4 * % * % * % * %Grade 5 0.0% * % * % 100.0%Grade 6 * % * % * % * %
________________________________________________________________________________Marijuana All 0.0% * % * % 100.0%
Grade 4 * % * % * % * %Grade 5 0.0% * % * % 100.0%Grade 6 * % * % * % * %
________________________________________________________________________________
7/30/2019 2004 _ hidalgo county _ edcouch-elsa isd _ 2004 texas school survey of drug and alcohol use _ elementary report
http://slidepdf.com/reader/full/2004-hidalgo-county-edcouch-elsa-isd-2004-texas-school-survey-of-drug 22/43
Edcouch-ElsaSpring 2004
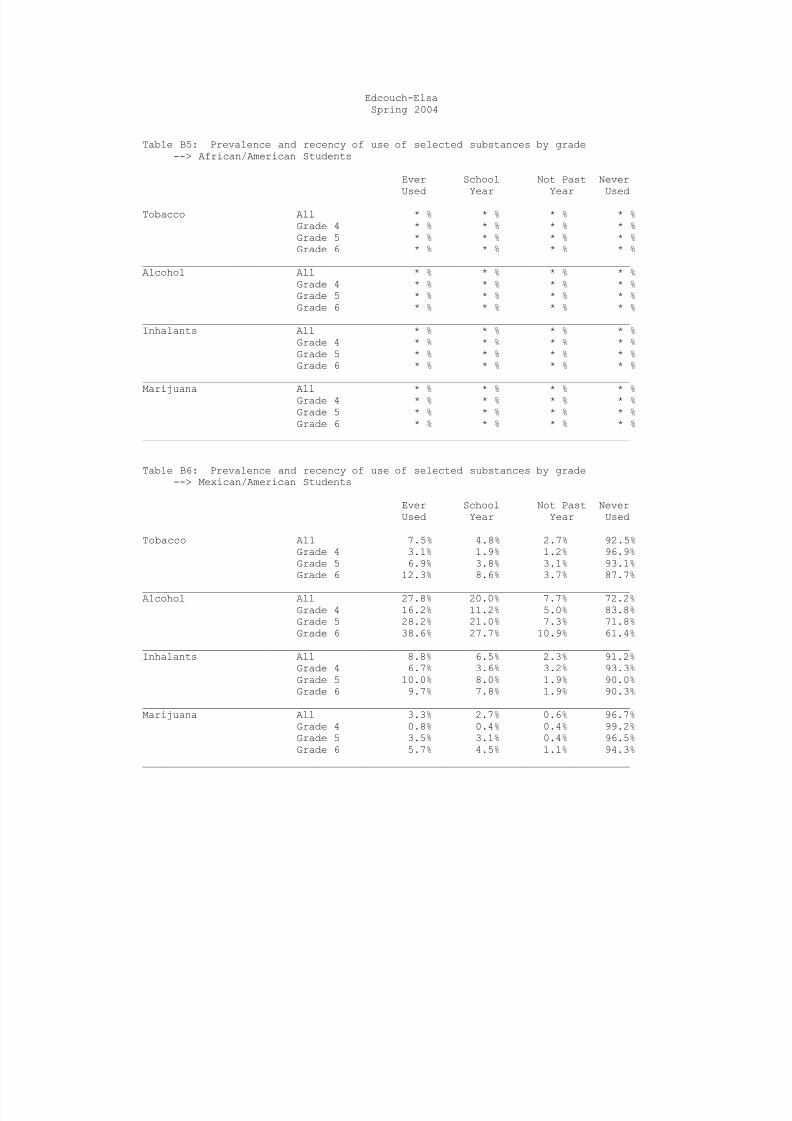
Table B5: Prevalence and recency of use of selected substances by grade--> African/American Students
Ever School Not Past Never
Used Year Year Used________________________________________________________________________________Tobacco All * % * % * % * %
Grade 4 * % * % * % * %Grade 5 * % * % * % * %Grade 6 * % * % * % * %
________________________________________________________________________________Alcohol All * % * % * % * %
Grade 4 * % * % * % * %Grade 5 * % * % * % * %Grade 6 * % * % * % * %
________________________________________________________________________________Inhalants All * % * % * % * %
Grade 4 * % * % * % * %Grade 5 * % * % * % * %Grade 6 * % * % * % * %
________________________________________________________________________________
Marijuana All * % * % * % * %Grade 4 * % * % * % * %Grade 5 * % * % * % * %Grade 6 * % * % * % * %
________________________________________________________________________________
Table B6: Prevalence and recency of use of selected substances by grade--> Mexican/American Students
Ever School Not Past NeverUsed Year Year Used
________________________________________________________________________________Tobacco All 7.5% 4.8% 2.7% 92.5%
Grade 4 3.1% 1.9% 1.2% 96.9%Grade 5 6.9% 3.8% 3.1% 93.1%Grade 6 12.3% 8.6% 3.7% 87.7%
________________________________________________________________________________Alcohol All 27.8% 20.0% 7.7% 72.2%
Grade 4 16.2% 11.2% 5.0% 83.8%Grade 5 28.2% 21.0% 7.3% 71.8%Grade 6 38.6% 27.7% 10.9% 61.4%
________________________________________________________________________________Inhalants All 8.8% 6.5% 2.3% 91.2%
Grade 4 6.7% 3.6% 3.2% 93.3%Grade 5 10.0% 8.0% 1.9% 90.0%Grade 6 9.7% 7.8% 1.9% 90.3%
________________________________________________________________________________Marijuana All 3.3% 2.7% 0.6% 96.7%
Grade 4 0.8% 0.4% 0.4% 99.2%Grade 5 3.5% 3.1% 0.4% 96.5%Grade 6 5.7% 4.5% 1.1% 94.3%
________________________________________________________________________________
7/30/2019 2004 _ hidalgo county _ edcouch-elsa isd _ 2004 texas school survey of drug and alcohol use _ elementary report
http://slidepdf.com/reader/full/2004-hidalgo-county-edcouch-elsa-isd-2004-texas-school-survey-of-drug 23/43
Edcouch-ElsaSpring 2004
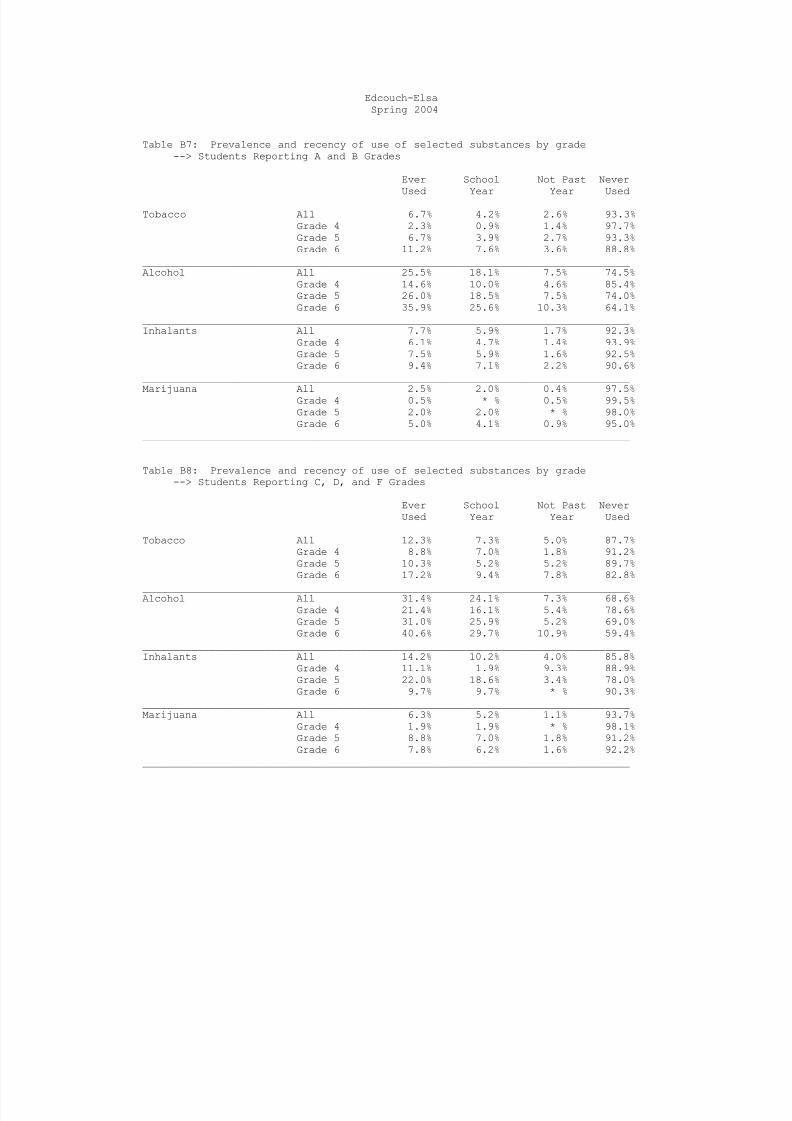
Table B7: Prevalence and recency of use of selected substances by grade--> Students Reporting A and B Grades
Ever School Not Past Never
Used Year Year Used________________________________________________________________________________Tobacco All 6.7% 4.2% 2.6% 93.3%
Grade 4 2.3% 0.9% 1.4% 97.7%Grade 5 6.7% 3.9% 2.7% 93.3%Grade 6 11.2% 7.6% 3.6% 88.8%
________________________________________________________________________________Alcohol All 25.5% 18.1% 7.5% 74.5%
Grade 4 14.6% 10.0% 4.6% 85.4%Grade 5 26.0% 18.5% 7.5% 74.0%Grade 6 35.9% 25.6% 10.3% 64.1%
________________________________________________________________________________Inhalants All 7.7% 5.9% 1.7% 92.3%
Grade 4 6.1% 4.7% 1.4% 93.9%Grade 5 7.5% 5.9% 1.6% 92.5%Grade 6 9.4% 7.1% 2.2% 90.6%
________________________________________________________________________________
Marijuana All 2.5% 2.0% 0.4% 97.5%Grade 4 0.5% * % 0.5% 99.5%Grade 5 2.0% 2.0% * % 98.0%Grade 6 5.0% 4.1% 0.9% 95.0%
________________________________________________________________________________
Table B8: Prevalence and recency of use of selected substances by grade--> Students Reporting C, D, and F Grades
Ever School Not Past NeverUsed Year Year Used
________________________________________________________________________________Tobacco All 12.3% 7.3% 5.0% 87.7%
Grade 4 8.8% 7.0% 1.8% 91.2%Grade 5 10.3% 5.2% 5.2% 89.7%Grade 6 17.2% 9.4% 7.8% 82.8%
________________________________________________________________________________Alcohol All 31.4% 24.1% 7.3% 68.6%
Grade 4 21.4% 16.1% 5.4% 78.6%Grade 5 31.0% 25.9% 5.2% 69.0%Grade 6 40.6% 29.7% 10.9% 59.4%
________________________________________________________________________________Inhalants All 14.2% 10.2% 4.0% 85.8%
Grade 4 11.1% 1.9% 9.3% 88.9%Grade 5 22.0% 18.6% 3.4% 78.0%Grade 6 9.7% 9.7% * % 90.3%
________________________________________________________________________________Marijuana All 6.3% 5.2% 1.1% 93.7%
Grade 4 1.9% 1.9% * % 98.1%Grade 5 8.8% 7.0% 1.8% 91.2%Grade 6 7.8% 6.2% 1.6% 92.2%
________________________________________________________________________________

7/30/2019 2004 _ hidalgo county _ edcouch-elsa isd _ 2004 texas school survey of drug and alcohol use _ elementary report
http://slidepdf.com/reader/full/2004-hidalgo-county-edcouch-elsa-isd-2004-texas-school-survey-of-drug 24/43
Edcouch-ElsaSpring 2004
Table B9: Prevalence and recency of use of selected substances by grade--> Students Living With 2 Parents
Ever School Not Past Never
Used Year Year Used________________________________________________________________________________Tobacco All 6.9% 4.1% 2.8% 93.1%
Grade 4 3.0% 1.5% 1.5% 97.0%Grade 5 6.6% 3.5% 3.1% 93.4%Grade 6 11.0% 7.1% 3.8% 89.0%
________________________________________________________________________________Alcohol All 23.5% 17.1% 6.4% 76.5%
Grade 4 13.8% 10.3% 3.4% 86.2%Grade 5 25.3% 18.2% 7.1% 74.7%Grade 6 31.1% 22.5% 8.6% 68.9%
________________________________________________________________________________Inhalants All 8.2% 6.0% 2.2% 91.8%
Grade 4 7.0% 4.5% 2.5% 93.0%Grade 5 9.8% 7.6% 2.2% 90.2%Grade 6 7.7% 5.7% 1.9% 92.3%
________________________________________________________________________________
Marijuana All 2.7% 2.1% 0.6% 97.3%Grade 4 0.5% * % 0.5% 99.5%Grade 5 1.8% 1.8% * % 98.2%Grade 6 5.8% 4.3% 1.4% 94.2%
________________________________________________________________________________
Table B10: Prevalence and recency of use of selected substances by grade--> Students Not Living With 2 Parents
Ever School Not Past NeverUsed Year Year Used
________________________________________________________________________________Tobacco All 10.2% 6.6% 3.7% 89.8%
Grade 4 5.6% 4.2% 1.4% 94.4%Grade 5 8.6% 5.4% 3.2% 91.4%Grade 6 16.5% 10.1% 6.3% 83.5%
________________________________________________________________________________Alcohol All 36.7% 25.7% 11.0% 63.3%
Grade 4 20.8% 12.5% 8.3% 79.2%Grade 5 31.9% 24.5% 7.4% 68.1%Grade 6 57.0% 39.2% 17.7% 43.0%
________________________________________________________________________________Inhalants All 11.1% 9.1% 2.1% 88.9%
Grade 4 7.1% 2.9% 4.3% 92.9%Grade 5 11.7% 10.6% 1.1% 88.3%Grade 6 14.1% 12.8% 1.3% 85.9%
________________________________________________________________________________Marijuana All 5.0% 4.2% 0.8% 95.0%
Grade 4 1.4% 1.4% * % 98.6%Grade 5 6.6% 5.5% 1.1% 93.4%Grade 6 6.3% 5.1% 1.3% 93.7%
________________________________________________________________________________
7/30/2019 2004 _ hidalgo county _ edcouch-elsa isd _ 2004 texas school survey of drug and alcohol use _ elementary report
http://slidepdf.com/reader/full/2004-hidalgo-county-edcouch-elsa-isd-2004-texas-school-survey-of-drug 25/43
Edcouch-ElsaSpring 2004
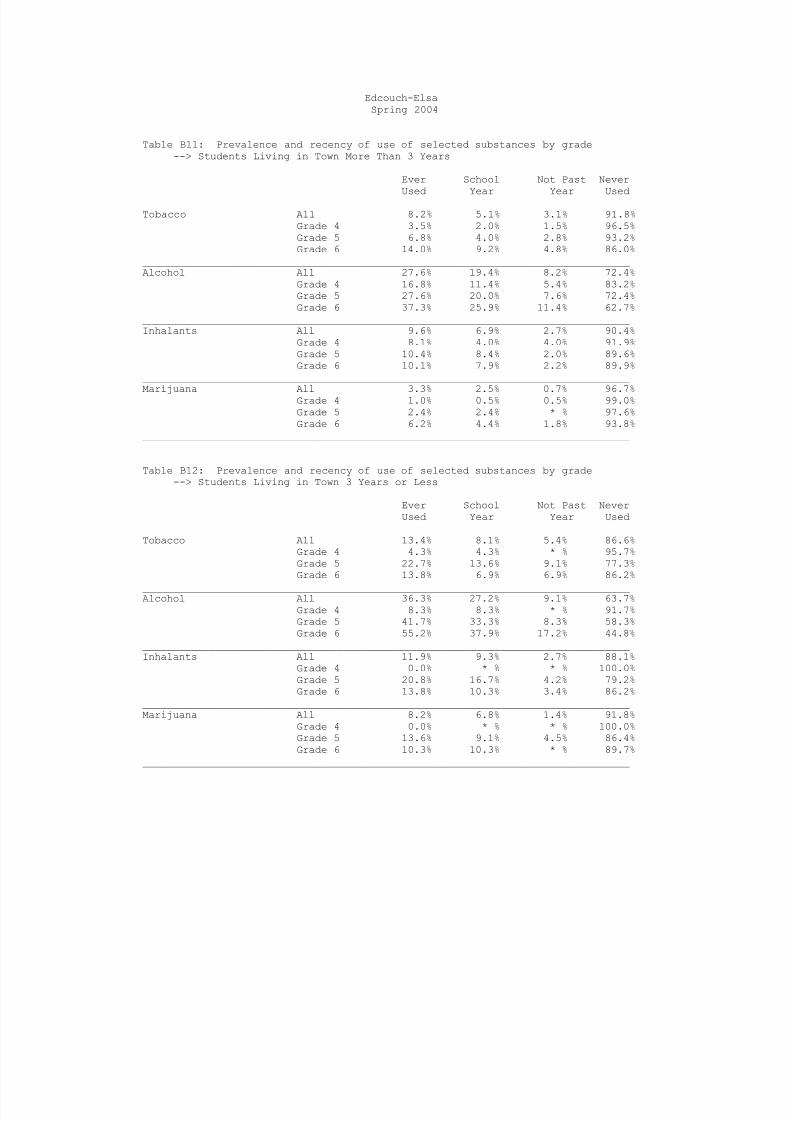
Table B11: Prevalence and recency of use of selected substances by grade--> Students Living in Town More Than 3 Years
Ever School Not Past Never
Used Year Year Used________________________________________________________________________________Tobacco All 8.2% 5.1% 3.1% 91.8%
Grade 4 3.5% 2.0% 1.5% 96.5%Grade 5 6.8% 4.0% 2.8% 93.2%Grade 6 14.0% 9.2% 4.8% 86.0%
________________________________________________________________________________Alcohol All 27.6% 19.4% 8.2% 72.4%
Grade 4 16.8% 11.4% 5.4% 83.2%Grade 5 27.6% 20.0% 7.6% 72.4%Grade 6 37.3% 25.9% 11.4% 62.7%
________________________________________________________________________________Inhalants All 9.6% 6.9% 2.7% 90.4%
Grade 4 8.1% 4.0% 4.0% 91.9%Grade 5 10.4% 8.4% 2.0% 89.6%Grade 6 10.1% 7.9% 2.2% 89.9%
________________________________________________________________________________
Marijuana All 3.3% 2.5% 0.7% 96.7%Grade 4 1.0% 0.5% 0.5% 99.0%Grade 5 2.4% 2.4% * % 97.6%Grade 6 6.2% 4.4% 1.8% 93.8%
________________________________________________________________________________
Table B12: Prevalence and recency of use of selected substances by grade--> Students Living in Town 3 Years or Less
Ever School Not Past NeverUsed Year Year Used
________________________________________________________________________________Tobacco All 13.4% 8.1% 5.4% 86.6%
Grade 4 4.3% 4.3% * % 95.7%Grade 5 22.7% 13.6% 9.1% 77.3%Grade 6 13.8% 6.9% 6.9% 86.2%
________________________________________________________________________________Alcohol All 36.3% 27.2% 9.1% 63.7%
Grade 4 8.3% 8.3% * % 91.7%Grade 5 41.7% 33.3% 8.3% 58.3%Grade 6 55.2% 37.9% 17.2% 44.8%
________________________________________________________________________________Inhalants All 11.9% 9.3% 2.7% 88.1%
Grade 4 0.0% * % * % 100.0%Grade 5 20.8% 16.7% 4.2% 79.2%Grade 6 13.8% 10.3% 3.4% 86.2%
________________________________________________________________________________Marijuana All 8.2% 6.8% 1.4% 91.8%
Grade 4 0.0% * % * % 100.0%Grade 5 13.6% 9.1% 4.5% 86.4%Grade 6 10.3% 10.3% * % 89.7%
________________________________________________________________________________
7/30/2019 2004 _ hidalgo county _ edcouch-elsa isd _ 2004 texas school survey of drug and alcohol use _ elementary report
http://slidepdf.com/reader/full/2004-hidalgo-county-edcouch-elsa-isd-2004-texas-school-survey-of-drug 26/43
Edcouch-ElsaSpring 2004
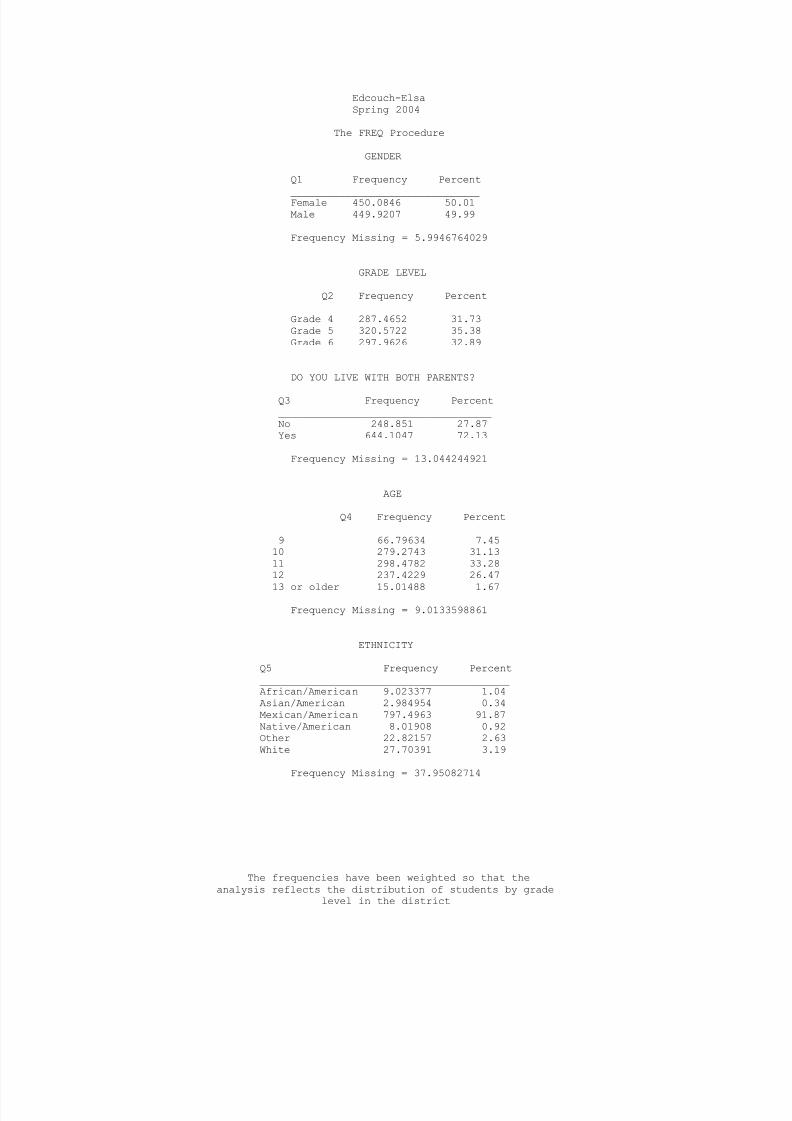
The FREQ Procedure
GENDER
Q1 Frequency Percent
_______________________________Female 450.0846 50.01Male 449.9207 49.99
Frequency Missing = 5.9946764029
GRADE LEVEL
Q2 Frequency Percent________________________________Grade 4 287.4652 31.73Grade 5 320.5722 35.38Grade 6 297.9626 32.89
DO YOU LIVE WITH BOTH PARENTS?
Q3 Frequency Percent___________________________________No 248.851 27.87Yes 644.1047 72.13
Frequency Missing = 13.044244921
AGE
Q4 Frequency Percent______________________________________9 66.79634 7.4510 279.2743 31.1311 298.4782 33.2812 237.4229 26.47
13 or older 15.01488 1.67
Frequency Missing = 9.0133598861
ETHNICITY
Q5 Frequency Percent_________________________________________African/American 9.023377 1.04Asian/American 2.984954 0.34Mexican/American 797.4963 91.87Native/American 8.01908 0.92Other 22.82157 2.63White 27.70391 3.19
Frequency Missing = 37.95082714
The frequencies have been weighted so that theanalysis reflects the distribution of students by grade
level in the district
7/30/2019 2004 _ hidalgo county _ edcouch-elsa isd _ 2004 texas school survey of drug and alcohol use _ elementary report
http://slidepdf.com/reader/full/2004-hidalgo-county-edcouch-elsa-isd-2004-texas-school-survey-of-drug 27/43
Edcouch-ElsaSpring 2004
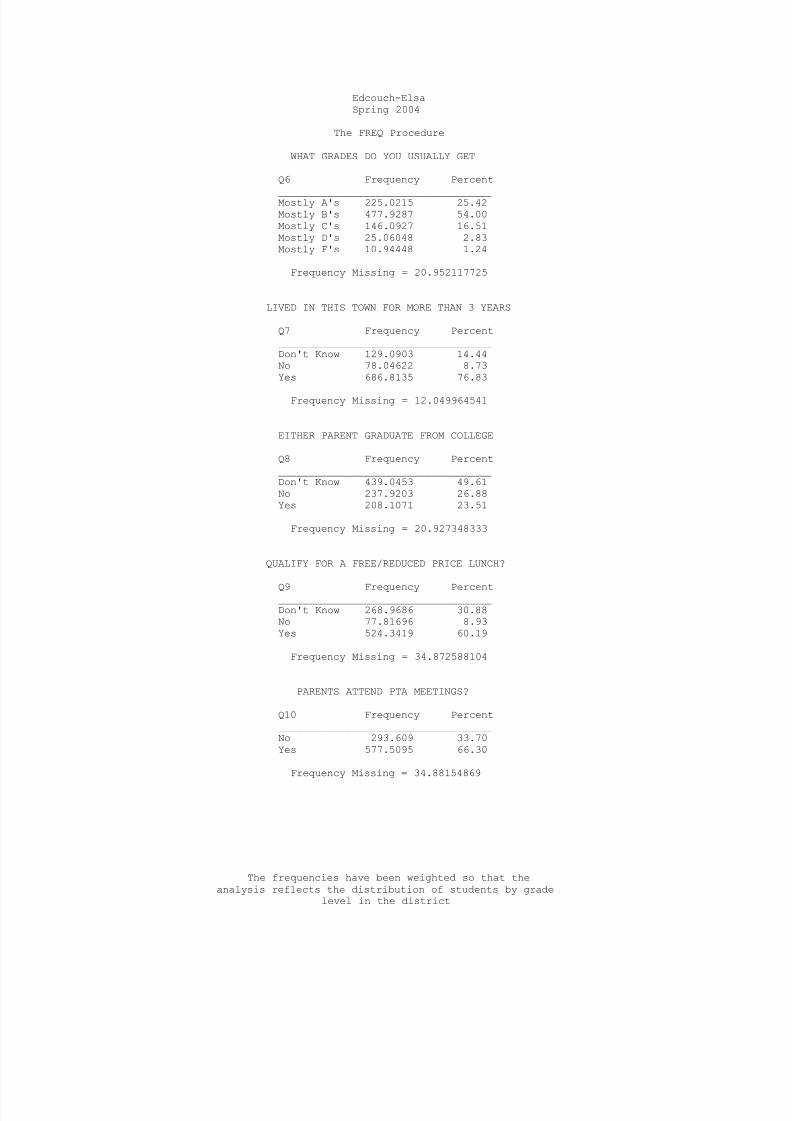
The FREQ Procedure
WHAT GRADES DO YOU USUALLY GET
Q6 Frequency Percent
___________________________________Mostly A's 225.0215 25.42Mostly B's 477.9287 54.00Mostly C's 146.0927 16.51Mostly D's 25.06048 2.83Mostly F's 10.94448 1.24
Frequency Missing = 20.952117725
LIVED IN THIS TOWN FOR MORE THAN 3 YEARS
Q7 Frequency Percent___________________________________Don't Know 129.0903 14.44No 78.04622 8.73Yes 686.8135 76.83
Frequency Missing = 12.049964541
EITHER PARENT GRADUATE FROM COLLEGE
Q8 Frequency Percent___________________________________Don't Know 439.0453 49.61No 237.9203 26.88Yes 208.1071 23.51
Frequency Missing = 20.927348333
QUALIFY FOR A FREE/REDUCED PRICE LUNCH?
Q9 Frequency Percent___________________________________Don't Know 268.9686 30.88No 77.81696 8.93Yes 524.3419 60.19
Frequency Missing = 34.872588104
PARENTS ATTEND PTA MEETINGS?
Q10 Frequency Percent___________________________________No 293.609 33.70Yes 577.5095 66.30
Frequency Missing = 34.88154869
The frequencies have been weighted so that theanalysis reflects the distribution of students by grade
level in the district
7/30/2019 2004 _ hidalgo county _ edcouch-elsa isd _ 2004 texas school survey of drug and alcohol use _ elementary report
http://slidepdf.com/reader/full/2004-hidalgo-county-edcouch-elsa-isd-2004-texas-school-survey-of-drug 28/43
Edcouch-ElsaSpring 2004
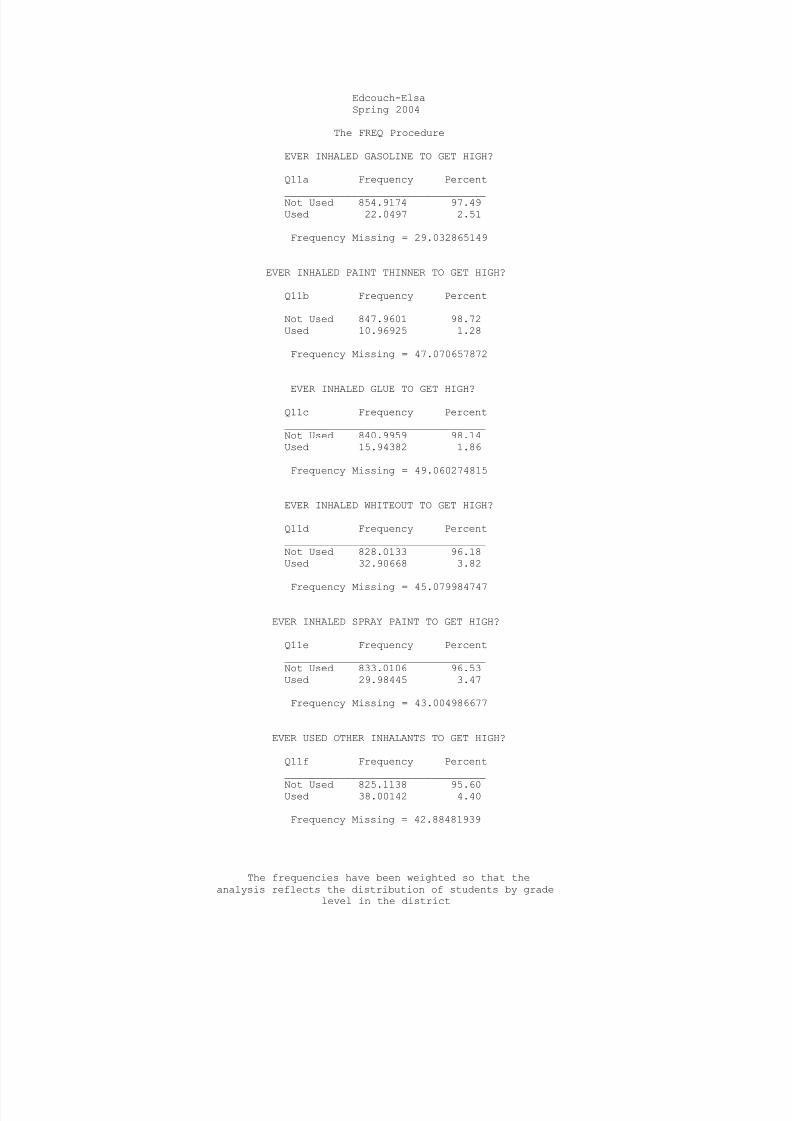
The FREQ Procedure
EVER INHALED GASOLINE TO GET HIGH?
Q11a Frequency Percent
_________________________________Not Used 854.9174 97.49Used 22.0497 2.51
Frequency Missing = 29.032865149
EVER INHALED PAINT THINNER TO GET HIGH?
Q11b Frequency Percent_________________________________Not Used 847.9601 98.72Used 10.96925 1.28
Frequency Missing = 47.070657872
EVER INHALED GLUE TO GET HIGH? Q11c Frequency Percent_________________________________Not Used 840.9959 98.14Used 15.94382 1.86
Frequency Missing = 49.060274815
EVER INHALED WHITEOUT TO GET HIGH?
Q11d Frequency Percent_________________________________Not Used 828.0133 96.18Used 32.90668 3.82
Frequency Missing = 45.079984747
EVER INHALED SPRAY PAINT TO GET HIGH?
Q11e Frequency Percent_________________________________Not Used 833.0106 96.53Used 29.98445 3.47
Frequency Missing = 43.004986677
EVER USED OTHER INHALANTS TO GET HIGH?
Q11f Frequency Percent_________________________________
Not Used 825.1138 95.60Used 38.00142 4.40
Frequency Missing = 42.88481939
The frequencies have been weighted so that theanalysis reflects the distribution of students by grade
level in the district
7/30/2019 2004 _ hidalgo county _ edcouch-elsa isd _ 2004 texas school survey of drug and alcohol use _ elementary report
http://slidepdf.com/reader/full/2004-hidalgo-county-edcouch-elsa-isd-2004-texas-school-survey-of-drug 29/43
Edcouch-ElsaSpring 2004
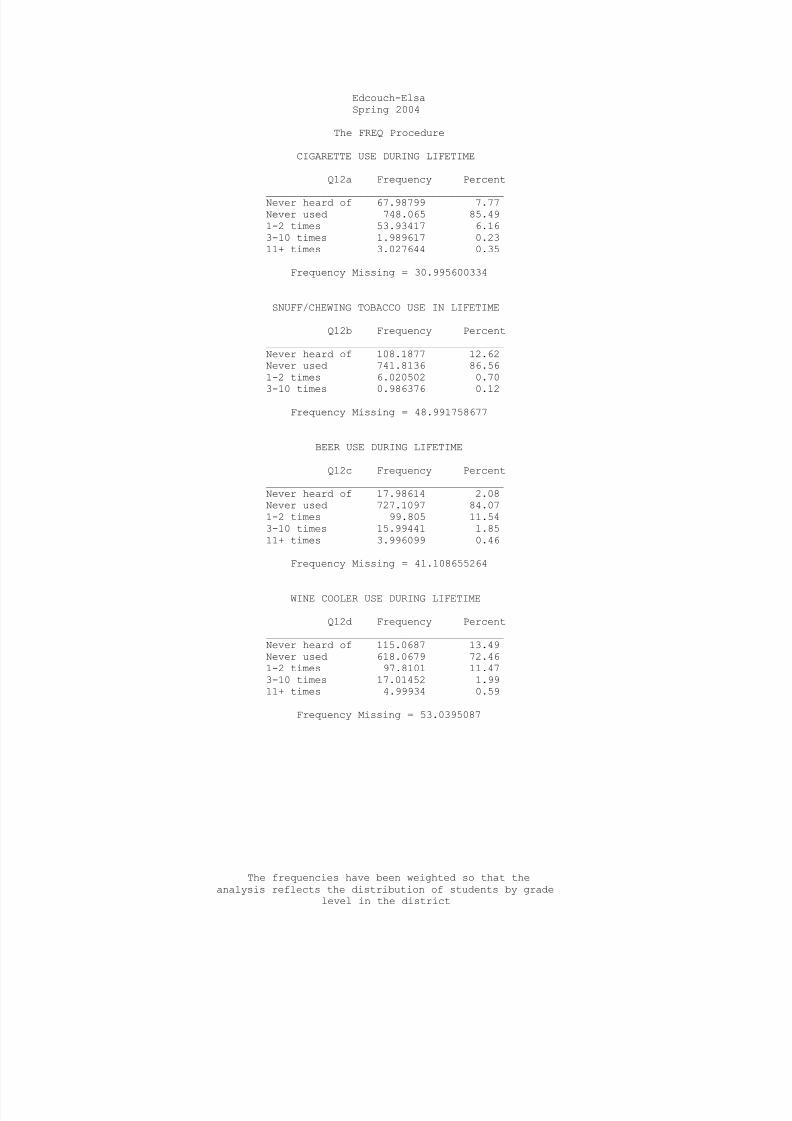
The FREQ Procedure
CIGARETTE USE DURING LIFETIME
Q12a Frequency Percent
_______________________________________Never heard of 67.98799 7.77Never used 748.065 85.491-2 times 53.93417 6.163-10 times 1.989617 0.2311+ times 3.027644 0.35
Frequency Missing = 30.995600334
SNUFF/CHEWING TOBACCO USE IN LIFETIME
Q12b Frequency Percent_______________________________________Never heard of 108.1877 12.62Never used 741.8136 86.561-2 times 6.020502 0.70
3-10 times 0.986376 0.12
Frequency Missing = 48.991758677
BEER USE DURING LIFETIME
Q12c Frequency Percent_______________________________________Never heard of 17.98614 2.08Never used 727.1097 84.071-2 times 99.805 11.543-10 times 15.99441 1.8511+ times 3.996099 0.46
Frequency Missing = 41.108655264
WINE COOLER USE DURING LIFETIME
Q12d Frequency Percent_______________________________________Never heard of 115.0687 13.49Never used 618.0679 72.461-2 times 97.8101 11.473-10 times 17.01452 1.9911+ times 4.99934 0.59
Frequency Missing = 53.0395087
The frequencies have been weighted so that theanalysis reflects the distribution of students by grade
level in the district
7/30/2019 2004 _ hidalgo county _ edcouch-elsa isd _ 2004 texas school survey of drug and alcohol use _ elementary report
http://slidepdf.com/reader/full/2004-hidalgo-county-edcouch-elsa-isd-2004-texas-school-survey-of-drug 30/43
Edcouch-ElsaSpring 2004
The FREQ Procedure
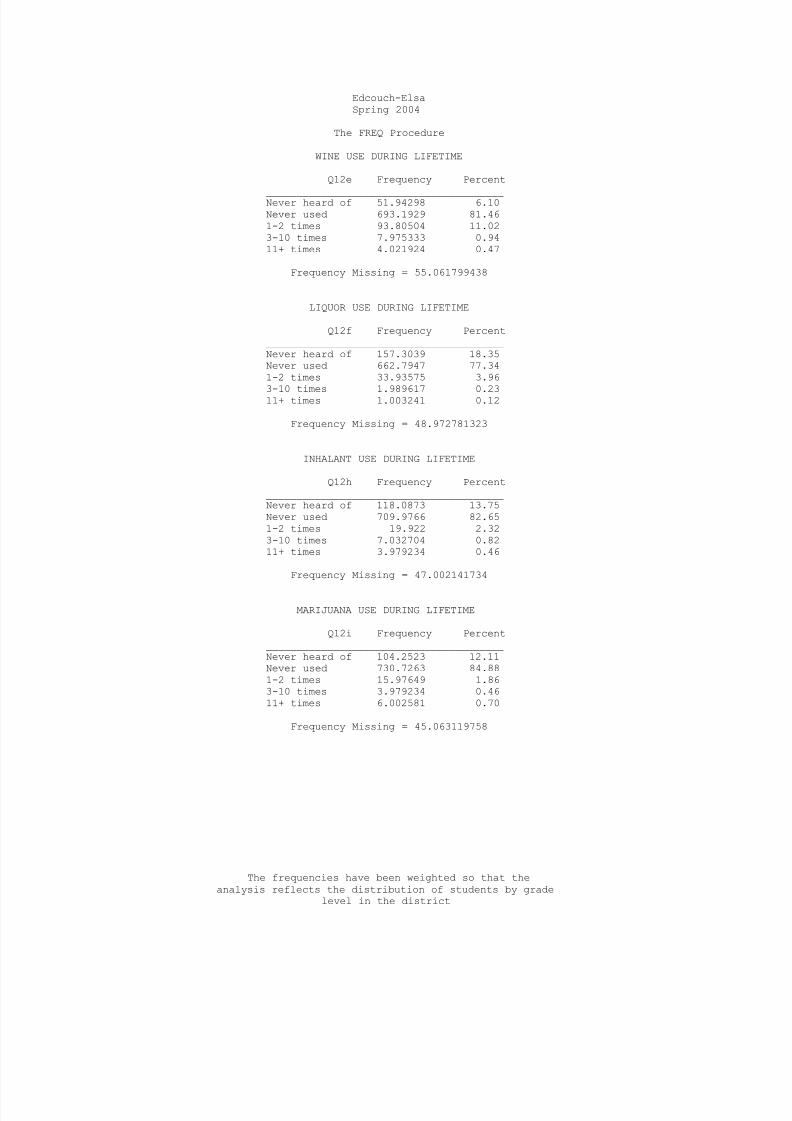
WINE USE DURING LIFETIME
Q12e Frequency Percent
_______________________________________Never heard of 51.94298 6.10Never used 693.1929 81.461-2 times 93.80504 11.023-10 times 7.975333 0.9411+ times 4.021924 0.47
Frequency Missing = 55.061799438
LIQUOR USE DURING LIFETIME
Q12f Frequency Percent_______________________________________Never heard of 157.3039 18.35Never used 662.7947 77.341-2 times 33.93575 3.96
3-10 times 1.989617 0.2311+ times 1.003241 0.12
Frequency Missing = 48.972781323
INHALANT USE DURING LIFETIME
Q12h Frequency Percent_______________________________________Never heard of 118.0873 13.75Never used 709.9766 82.651-2 times 19.922 2.323-10 times 7.032704 0.8211+ times 3.979234 0.46
Frequency Missing = 47.002141734
MARIJUANA USE DURING LIFETIME
Q12i Frequency Percent_______________________________________Never heard of 104.2523 12.11Never used 730.7263 84.881-2 times 15.97649 1.863-10 times 3.979234 0.4611+ times 6.002581 0.70
Frequency Missing = 45.063119758
The frequencies have been weighted so that theanalysis reflects the distribution of students by grade
level in the district
7/30/2019 2004 _ hidalgo county _ edcouch-elsa isd _ 2004 texas school survey of drug and alcohol use _ elementary report
http://slidepdf.com/reader/full/2004-hidalgo-county-edcouch-elsa-isd-2004-texas-school-survey-of-drug 31/43
Edcouch-ElsaSpring 2004
The FREQ Procedure
CIGARETTE USE IN PAST SCHOOL YEAR
Q13a Frequency Percent
_______________________________________Never heard of 65.95674 7.56Never used 767.9601 87.981-2 times 32.93936 3.773-10 times 3.001818 0.3411+ times 3.018683 0.35
Frequency Missing = 33.123305736
SNUFF/CHEWING TOBACCO USE IN PAST YEAR
Q13b Frequency Percent_______________________________________Never heard of 102.202 11.93Never used 748.7272 87.371-2 times 4.030885 0.47
3-10 times 1.972752 0.23
Frequency Missing = 49.067123035
BEER USE IN PAST SCHOOL YEAR
Q13c Frequency Percent_______________________________________Never heard of 27.05221 3.18Never used 745.942 87.571-2 times 63.86855 7.503-10 times 10.96925 1.2911+ times 3.979234 0.47
Frequency Missing = 54.188742528
WINE COOLER USE IN PAST SCHOOL YEAR
Q13d Frequency Percent_______________________________________Never heard of 111.0815 13.12Never used 648.0312 76.521-2 times 70.79584 8.363-10 times 14.02166 1.6611+ times 2.992858 0.35
Frequency Missing = 59.076875667
The frequencies have been weighted so that theanalysis reflects the distribution of students by grade
level in the district
7/30/2019 2004 _ hidalgo county _ edcouch-elsa isd _ 2004 texas school survey of drug and alcohol use _ elementary report
http://slidepdf.com/reader/full/2004-hidalgo-county-edcouch-elsa-isd-2004-texas-school-survey-of-drug 32/43
Edcouch-ElsaSpring 2004
The FREQ Procedure
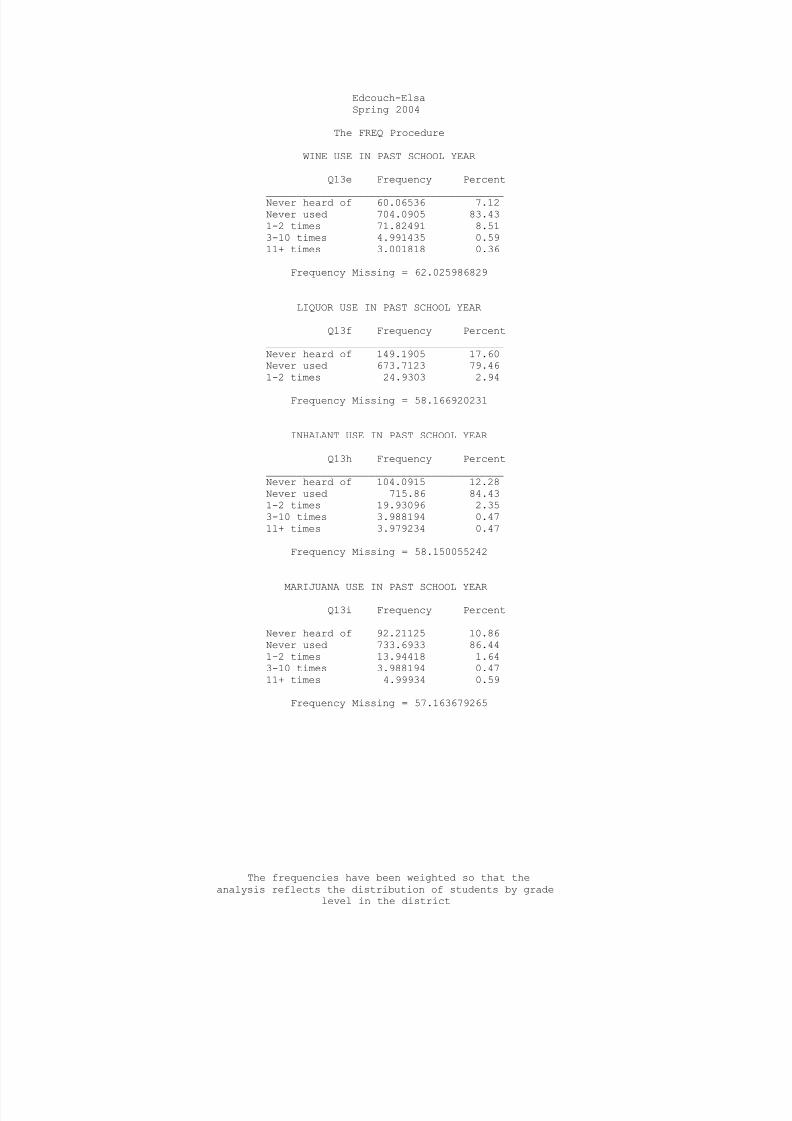
WINE USE IN PAST SCHOOL YEAR
Q13e Frequency Percent
_______________________________________Never heard of 60.06536 7.12Never used 704.0905 83.431-2 times 71.82491 8.513-10 times 4.991435 0.5911+ times 3.001818 0.36
Frequency Missing = 62.025986829
LIQUOR USE IN PAST SCHOOL YEAR
Q13f Frequency Percent_______________________________________Never heard of 149.1905 17.60Never used 673.7123 79.461-2 times 24.9303 2.94
Frequency Missing = 58.166920231
INHALANT USE IN PAST SCHOOL YEAR
Q13h Frequency Percent_______________________________________Never heard of 104.0915 12.28Never used 715.86 84.431-2 times 19.93096 2.353-10 times 3.988194 0.4711+ times 3.979234 0.47
Frequency Missing = 58.150055242
MARIJUANA USE IN PAST SCHOOL YEAR
Q13i Frequency Percent_______________________________________Never heard of 92.21125 10.86Never used 733.6933 86.441-2 times 13.94418 1.643-10 times 3.988194 0.4711+ times 4.99934 0.59
Frequency Missing = 57.163679265
The frequencies have been weighted so that theanalysis reflects the distribution of students by grade
level in the district
7/30/2019 2004 _ hidalgo county _ edcouch-elsa isd _ 2004 texas school survey of drug and alcohol use _ elementary report
http://slidepdf.com/reader/full/2004-hidalgo-county-edcouch-elsa-isd-2004-texas-school-survey-of-drug 33/43
Edcouch-ElsaSpring 2004
The FREQ Procedure
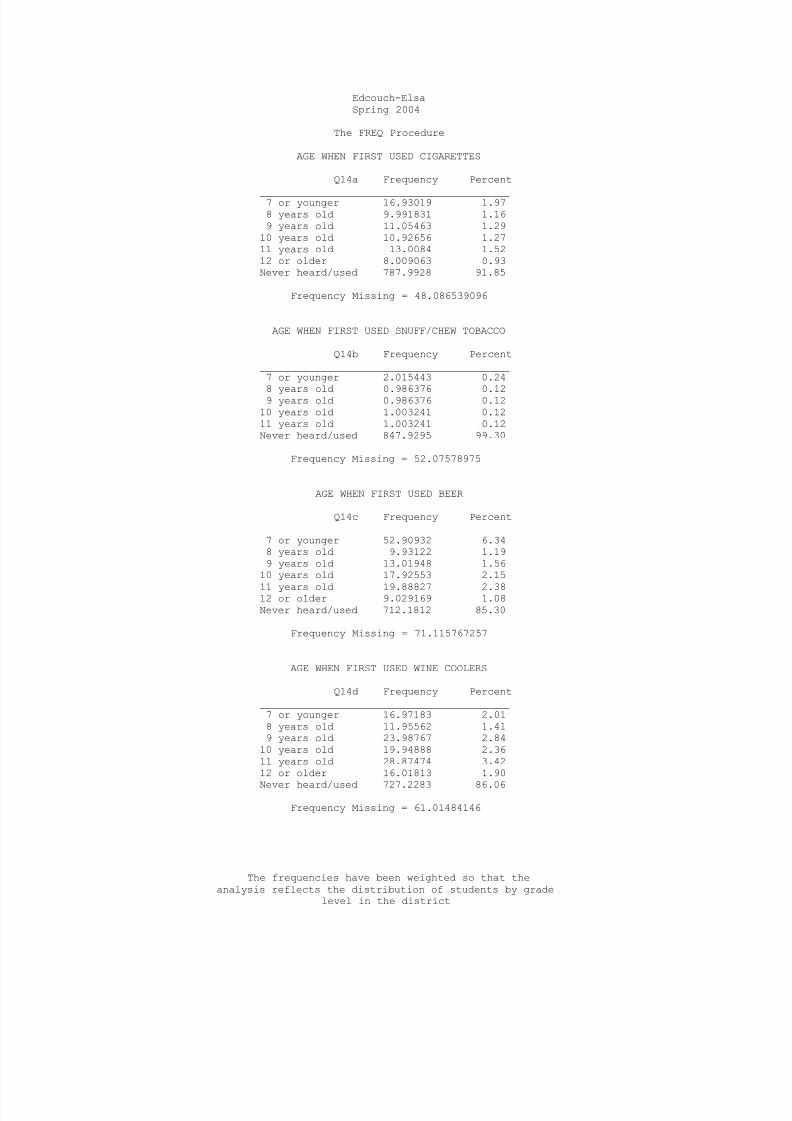
AGE WHEN FIRST USED CIGARETTES
Q14a Frequency Percent
_________________________________________7 or younger 16.93019 1.978 years old 9.991831 1.169 years old 11.05463 1.29
10 years old 10.92656 1.2711 years old 13.0084 1.5212 or older 8.009063 0.93Never heard/used 787.9928 91.85
Frequency Missing = 48.086539096
AGE WHEN FIRST USED SNUFF/CHEW TOBACCO
Q14b Frequency Percent_________________________________________7 or younger 2.015443 0.24
8 years old 0.986376 0.129 years old 0.986376 0.1210 years old 1.003241 0.1211 years old 1.003241 0.12Never heard/used 847.9295 99.30
Frequency Missing = 52.07578975
AGE WHEN FIRST USED BEER
Q14c Frequency Percent_________________________________________7 or younger 52.90932 6.348 years old 9.93122 1.199 years old 13.01948 1.56
10 years old 17.92553 2.15
11 years old 19.88827 2.3812 or older 9.029169 1.08Never heard/used 712.1812 85.30
Frequency Missing = 71.115767257
AGE WHEN FIRST USED WINE COOLERS
Q14d Frequency Percent_________________________________________7 or younger 16.97183 2.018 years old 11.95562 1.419 years old 23.98767 2.84
10 years old 19.94888 2.3611 years old 28.87474 3.4212 or older 16.01813 1.90
Never heard/used 727.2283 86.06
Frequency Missing = 61.01484146
The frequencies have been weighted so that theanalysis reflects the distribution of students by grade
level in the district
7/30/2019 2004 _ hidalgo county _ edcouch-elsa isd _ 2004 texas school survey of drug and alcohol use _ elementary report
http://slidepdf.com/reader/full/2004-hidalgo-county-edcouch-elsa-isd-2004-texas-school-survey-of-drug 34/43
Edcouch-ElsaSpring 2004
The FREQ Procedure
AGE WHEN FIRST USED WINE
Q14e Frequency Percent
_________________________________________7 or younger 11.0209 1.318 years old 12.93409 1.549 years old 16.96392 2.02
10 years old 24.91449 2.9711 years old 29.87798 3.5612 or older 12.02203 1.43Never heard/used 732.167 87.17
Frequency Missing = 66.099562427
AGE WHEN FIRST USED LIQUOR
Q14f Frequency Percent_________________________________________7 or younger 1.998578 0.24
8 years old 3.001818 0.359 years old 6.990013 0.8310 years old 7.950563 0.9411 years old 11.9377 1.4112 or older 8.009063 0.95Never heard/used 805.9826 95.28
Frequency Missing = 60.129655417
AGE WHEN FIRST USED INHALANTS
Q14h Frequency Percent_________________________________________7 or younger 8.970669 1.078 years old 1.012202 0.129 years old 8.002215 0.95
10 years old 8.944844 1.0711 years old 6.955227 0.83Never heard/used 804.9952 95.96
Frequency Missing = 67.119668382
AGE WHEN FIRST USED MARIJUANA
Q14i Frequency Percent_________________________________________7 or younger 5.994676 0.718 years old 1.998578 0.24
10 years old 6.964187 0.8311 years old 8.978574 1.0712 or older 8.025928 0.95Never heard/used 809.9292 96.20
Frequency Missing = 64.108889302
The frequencies have been weighted so that theanalysis reflects the distribution of students by grade
level in the district
7/30/2019 2004 _ hidalgo county _ edcouch-elsa isd _ 2004 texas school survey of drug and alcohol use _ elementary report
http://slidepdf.com/reader/full/2004-hidalgo-county-edcouch-elsa-isd-2004-texas-school-survey-of-drug 35/43
Edcouch-ElsaSpring 2004
The FREQ Procedure
CLOSE FRIENDS USE CIGARETTES
Q15a Frequency Percent
_______________________________________Never heard of 45.04625 5.32None 665.0958 78.62Some 123.8064 14.63Most 12.02414 1.42
Frequency Missing = 60.027409301
CLOSE FRIENDS USE SNUFF/CHEWING TOBACCO
Q15b Frequency Percent_______________________________________Never heard of 61.14503 7.40None 718.884 87.04Some 42.95702 5.20Most 2.959128 0.36
Frequency Missing = 80.054818967
CLOSE FRIENDS USE BEER
Q15c Frequency Percent_______________________________________Never heard of 25.09632 3.06None 613.1112 74.69Some 154.7097 18.85Most 27.91525 3.40
Frequency Missing = 85.167477874
CLOSE FRIENDS USE WINE COOLERS
Q15d Frequency Percent
_______________________________________Never heard of 79.06265 9.82None 573.9706 71.30Some 130.946 16.27Most 20.99375 2.61
Frequency Missing = 101.02697023
CLOSE FRIENDS USE WINE
Q15e Frequency Percent_______________________________________Never heard of 48.08392 5.90None 648.8859 79.63
Some 102.8869 12.63Most 14.98221 1.84
Frequency Missing = 91.161098094
The frequencies have been weighted so that theanalysis reflects the distribution of students by grade
level in the district
7/30/2019 2004 _ hidalgo county _ edcouch-elsa isd _ 2004 texas school survey of drug and alcohol use _ elementary report
http://slidepdf.com/reader/full/2004-hidalgo-county-edcouch-elsa-isd-2004-texas-school-survey-of-drug 36/43
Edcouch-ElsaSpring 2004
The FREQ Procedure
CLOSE FRIENDS USE LIQUOR
Q15f Frequency Percent
_______________________________________Never heard of 90.06668 11.03None 666.8657 81.64Some 49.9133 6.11Most 9.97391 1.22
Frequency Missing = 89.180441737
CLOSE FRIENDS USE INHALANTS
Q15h Frequency Percent_______________________________________Never heard of 68.95856 8.29None 677.9783 81.51Some 66.90884 8.04Most 17.97507 2.16
Frequency Missing = 74.179253668
CLOSE FRIENDS USE MARIJUANA
Q15i Frequency Percent_______________________________________Never heard of 66.06689 7.93None 667.8157 80.19Some 83.89068 10.07Most 14.99802 1.80
Frequency Missing = 73.228720034
EVER BEEN OFFERED CIGARETTES
Q16a Frequency Percent_______________________________________Never heard of 57.89391 6.92No 671.177 80.20Yes 107.7951 12.88
Frequency Missing = 69.134054717
EVER BEEN OFFERED SNUFF/CHEWING TOBACCO
Q16b Frequency Percent_______________________________________Never heard of 84.01719 10.29No 703.8502 86.17Yes 28.97014 3.55
Frequency Missing = 89.162520565
The frequencies have been weighted so that theanalysis reflects the distribution of students by grade
level in the district
7/30/2019 2004 _ hidalgo county _ edcouch-elsa isd _ 2004 texas school survey of drug and alcohol use _ elementary report
http://slidepdf.com/reader/full/2004-hidalgo-county-edcouch-elsa-isd-2004-texas-school-survey-of-drug 37/43
Edcouch-ElsaSpring 2004
The FREQ Procedure
EVER BEEN OFFERED BEER
Q16c Frequency Percent
_______________________________________Never heard of 23.0034 2.86No 611.1364 75.93Yes 170.6973 21.21
Frequency Missing = 101.16294632
EVER BEEN OFFERED WINE COOLERS
Q16d Frequency Percent_______________________________________Never heard of 91.89344 11.53No 601.1477 75.43Yes 103.907 13.04
Frequency Missing = 109.05184177
EVER BEEN OFFERED WINE
Q16e Frequency Percent_______________________________________Never heard of 60.9653 7.52No 658.1801 81.17Yes 91.69631 11.31
Frequency Missing = 95.158253151
EVER BEEN OFFERED LIQUOR
Q16f Frequency Percent_______________________________________
Never heard of 104.9656 12.93No 658.8951 81.17Yes 47.93264 5.90
Frequency Missing = 94.206663334
EVER BEEN OFFERED INHALANTS
Q16h Frequency Percent_______________________________________Never heard of 91.90135 11.20No 678.0247 82.60Yes 50.94025 6.21
Frequency Missing = 85.133747896
The frequencies have been weighted so that theanalysis reflects the distribution of students by grade
level in the district
7/30/2019 2004 _ hidalgo county _ edcouch-elsa isd _ 2004 texas school survey of drug and alcohol use _ elementary report
http://slidepdf.com/reader/full/2004-hidalgo-county-edcouch-elsa-isd-2004-texas-school-survey-of-drug 38/43
Edcouch-ElsaSpring 2004
The FREQ Procedure
EVER BEEN OFFERED MARIJUANA
Q16i Frequency Percent
_______________________________________Never heard of 78.96725 9.46No 671.9984 80.50Yes 83.83007 10.04
Frequency Missing = 71.204316931
IS ALCOHOL OBTAINED FROM HOME
Q17a Frequency Percent_____________________________________Do Not Drink 581.0439 69.91No 170.1958 20.48Yes 79.88194 9.61
Frequency Missing = 74.878379777
IS ALCOHOL OBTAINED FROM FRIENDS
Q17b Frequency Percent_____________________________________Do Not Drink 560.9738 69.68No 212.0674 26.34Yes 32.04838 3.98
Frequency Missing = 100.91048261
IS ALCOHOL OBTAINED SOMEWHERE ELSE
Q17c Frequency Percent_____________________________________
Do Not Drink 554.9791 67.59No 170.2675 20.74Yes 95.81258 11.67
Frequency Missing = 84.94083974
DANGEROUS FOR KIDS TO USE CIGARETTES
Q18a Frequency Percent_______________________________________Very dangerous 506.4032 60.43Dangerous 218.5393 26.08Not at all 20.05112 2.39Don't know 58.97146 7.04Never heard of 33.99848 4.06
Frequency Missing = 68.036472038
The frequencies have been weighted so that theanalysis reflects the distribution of students by grade
level in the district
7/30/2019 2004 _ hidalgo county _ edcouch-elsa isd _ 2004 texas school survey of drug and alcohol use _ elementary report
http://slidepdf.com/reader/full/2004-hidalgo-county-edcouch-elsa-isd-2004-texas-school-survey-of-drug 39/43
Edcouch-ElsaSpring 2004
The FREQ Procedure
DANGEROUS TO USE SNUFF/CHEWING TOBACCO
Q18b Frequency Percent
_______________________________________Very dangerous 531.8798 64.56Dangerous 143.8991 17.47Not at all 17.0335 2.07Don't know 78.9372 9.58Never heard of 52.06894 6.32
Frequency Missing = 82.181468186
DANGEROUS FOR KIDS TO USE BEER
Q18c Frequency Percent_______________________________________Very dangerous 409.326 50.17Dangerous 266.5873 32.67Not at all 48.08654 5.89
Don't know 77.925 9.55Never heard of 14.03168 1.72
Frequency Missing = 90.043481879
DANGEROUS FOR KIDS TO USE WINE COOLERS
Q18d Frequency Percent_______________________________________Very dangerous 376.3508 45.84Dangerous 195.7694 23.85Not at all 84.98036 10.35Don't know 102.8643 12.53Never heard of 60.97321 7.43
Frequency Missing = 85.06206321
DANGEROUS FOR KIDS TO USE WINE
Q18e Frequency Percent_______________________________________Very dangerous 407.2789 49.92Dangerous 202.8168 24.86Not at all 63.94286 7.84Don't know 112.8403 13.83Never heard of 28.99017 3.55
Frequency Missing = 90.130975371
The frequencies have been weighted so that theanalysis reflects the distribution of students by grade
level in the district
7/30/2019 2004 _ hidalgo county _ edcouch-elsa isd _ 2004 texas school survey of drug and alcohol use _ elementary report
http://slidepdf.com/reader/full/2004-hidalgo-county-edcouch-elsa-isd-2004-texas-school-survey-of-drug 40/43
Edcouch-ElsaSpring 2004
The FREQ Procedure
DANGEROUS FOR KIDS TO USE LIQUOR
Q18f Frequency Percent
_______________________________________Very dangerous 494.0312 60.63Dangerous 139.8661 17.16Not at all 23.9708 2.94Don't know 84.93188 10.42Never heard of 72.07369 8.84
Frequency Missing = 91.126311934
DANGEROUS FOR KIDS TO USE INHALANTS
Q18h Frequency Percent_______________________________________Very dangerous 483.2 59.15Dangerous 157.8454 19.32Not at all 26.95575 3.30
Don't know 90.96029 11.13Never heard of 57.99721 7.10
Frequency Missing = 89.041297096
DANGEROUS FOR KIDS TO USE MARIJUANA
Q18i Frequency Percent_______________________________________Very dangerous 627.0565 76.20Dangerous 71.92136 8.74Not at all 19.98366 2.43Don't know 60.97004 7.41Never heard of 43.03081 5.23
Frequency Missing = 83.037660107
DRUG/ALCOHOL INFO FROM TEACHER
Q19a Frequency Percent___________________________________No 214.8542 26.01Yes 611.2381 73.99
Frequency Missing = 79.907769922
DRUG/ALC INFO FROM VISITOR TO CLASS
Q19b Frequency Percent___________________________________No 406.1618 51.21
Yes 386.9363 48.79
Frequency Missing = 112.90194779
The frequencies have been weighted so that theanalysis reflects the distribution of students by grade
level in the district
7/30/2019 2004 _ hidalgo county _ edcouch-elsa isd _ 2004 texas school survey of drug and alcohol use _ elementary report
http://slidepdf.com/reader/full/2004-hidalgo-county-edcouch-elsa-isd-2004-texas-school-survey-of-drug 41/43
Edcouch-ElsaSpring 2004
The FREQ Procedure
DRUG/ALC INFO FROM ASSEMBLY PROGRAM
Q19c Frequency Percent
___________________________________No 337.1147 42.08Yes 463.9856 57.92
Frequency Missing = 104.89973327
DRUG/ALC INFO FROM GUIDE COUNSELOR
Q19d Frequency Percent___________________________________No 256.3976 32.21Yes 539.5484 67.79
Frequency Missing = 110.05402656
DRUG/ALC INF FROM SOMEONE ELSE AT SCHOOL Q19e Frequency Percent___________________________________No 416.1536 52.21Yes 380.9405 47.79
Frequency Missing = 108.90584891
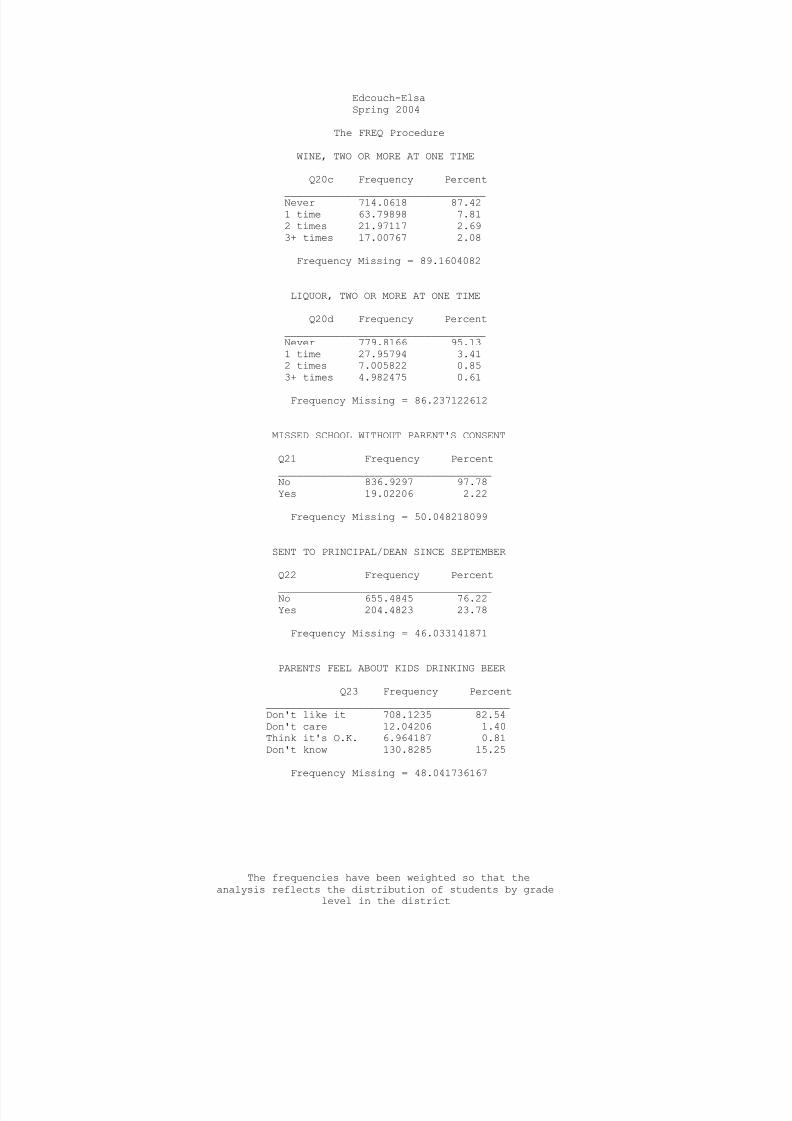
BEER, TWO OR MORE AT ONE TIME
Q20a Frequency Percent_________________________________Never 717.111 85.901 time 76.7879 9.202 times 20.96108 2.51
3+ times 20.00843 2.40
Frequency Missing = 71.131576063
WINE COOLERS, TWO OR MORE AT ONE TIME
Q20b Frequency Percent_________________________________Never 698.1696 86.001 time 54.81039 6.752 times 33.8762 4.173+ times 24.98985 3.08
Frequency Missing = 94.153956003
The frequencies have been weighted so that theanalysis reflects the distribution of students by grade
level in the district
7/30/2019 2004 _ hidalgo county _ edcouch-elsa isd _ 2004 texas school survey of drug and alcohol use _ elementary report
http://slidepdf.com/reader/full/2004-hidalgo-county-edcouch-elsa-isd-2004-texas-school-survey-of-drug 42/43
Edcouch-ElsaSpring 2004
The FREQ Procedure
WINE, TWO OR MORE AT ONE TIME
Q20c Frequency Percent
_________________________________Never 714.0618 87.421 time 63.79898 7.812 times 21.97117 2.693+ times 17.00767 2.08
Frequency Missing = 89.1604082
LIQUOR, TWO OR MORE AT ONE TIME
Q20d Frequency Percent_________________________________Never 779.8166 95.131 time 27.95794 3.412 times 7.005822 0.853+ times 4.982475 0.61
Frequency Missing = 86.237122612
MISSED SCHOOL WITHOUT PARENT'S CONSENT
Q21 Frequency Percent___________________________________No 836.9297 97.78Yes 19.02206 2.22
Frequency Missing = 50.048218099
SENT TO PRINCIPAL/DEAN SINCE SEPTEMBER
Q22 Frequency Percent
___________________________________No 655.4845 76.22Yes 204.4823 23.78
Frequency Missing = 46.033141871
PARENTS FEEL ABOUT KIDS DRINKING BEER
Q23 Frequency Percent________________________________________Don't like it 708.1235 82.54Don't care 12.04206 1.40Think it's O.K. 6.964187 0.81Don't know 130.8285 15.25
Frequency Missing = 48.041736167
The frequencies have been weighted so that theanalysis reflects the distribution of students by grade
level in the district
7/30/2019 2004 _ hidalgo county _ edcouch-elsa isd _ 2004 texas school survey of drug and alcohol use _ elementary report
http://slidepdf.com/reader/full/2004-hidalgo-county-edcouch-elsa-isd-2004-texas-school-survey-of-drug 43/43
Edcouch-ElsaSpring 2004
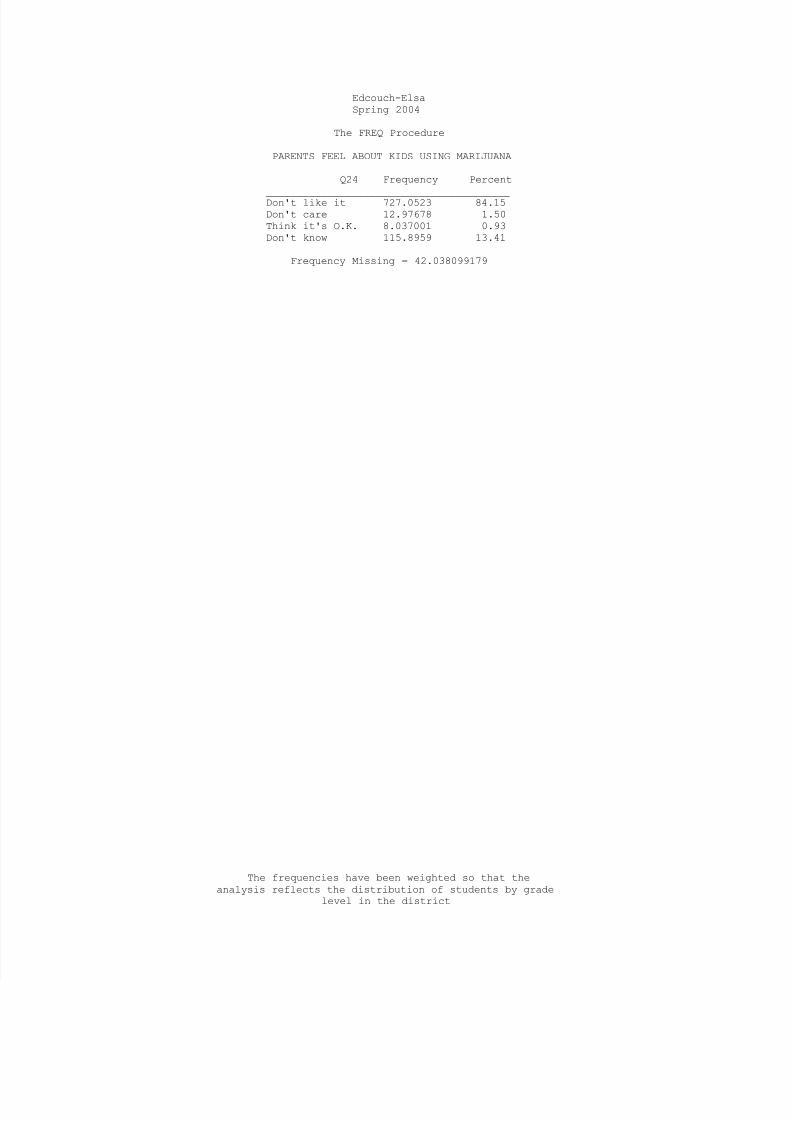
The FREQ Procedure
PARENTS FEEL ABOUT KIDS USING MARIJUANA
Q24 Frequency Percent
________________________________________Don't like it 727.0523 84.15Don't care 12.97678 1.50Think it's O.K. 8.037001 0.93Don't know 115.8959 13.41
Frequency Missing = 42.038099179
The frequencies have been weighted so that the