Embed Size (px)
Citation preview

2006-07
2007-08
2008-09
2009-10
2010-11
2011-12
2012-13
2013-14
2014-15
2015-16
2016-17
2017-18
2018-19
2019-20
0
2,000
4,000
6,000
8,000
10,000
12,000
14,000
16,000
18,000
20,000
Sussex growth plans to 2020Student population (FTEs)
HEU totalO/S totaltotaloriginal total
HEU UG intake in 2013 requires 560 increase on 2012 entry. This will be met by 250
holdovers (very few in 2012) and ABB growth (40% of sector grades & 80% of Sussex 2011 entry). HEU PG intake in 2013 requires 200 increase on 2012 entry. This will be met by scholarships and new courses.
Overseas PG intake suppressed by early closure in 2011 to BMEc (40% of total intake)
and in 2012 to BMEc & MPS (54% of total intake) in April & May respectively (mid point of PG recruitment cycle). 35% intake recovery achievable through PGT.
Growth in total student population
HEU total 0% 1% 1% 4% -2% 6% 5% 9% … 1%
O/S total 11% 21% 25% 32% 11% 27% 8% 6% … 4%
Growth in intake to achieve total
HEU intake -3% -1% 2% 7% -14% 20% 6% 5% … 0%
O/S intake 10% 21% 26% 31% -2% 35% 8% 4% … 4%
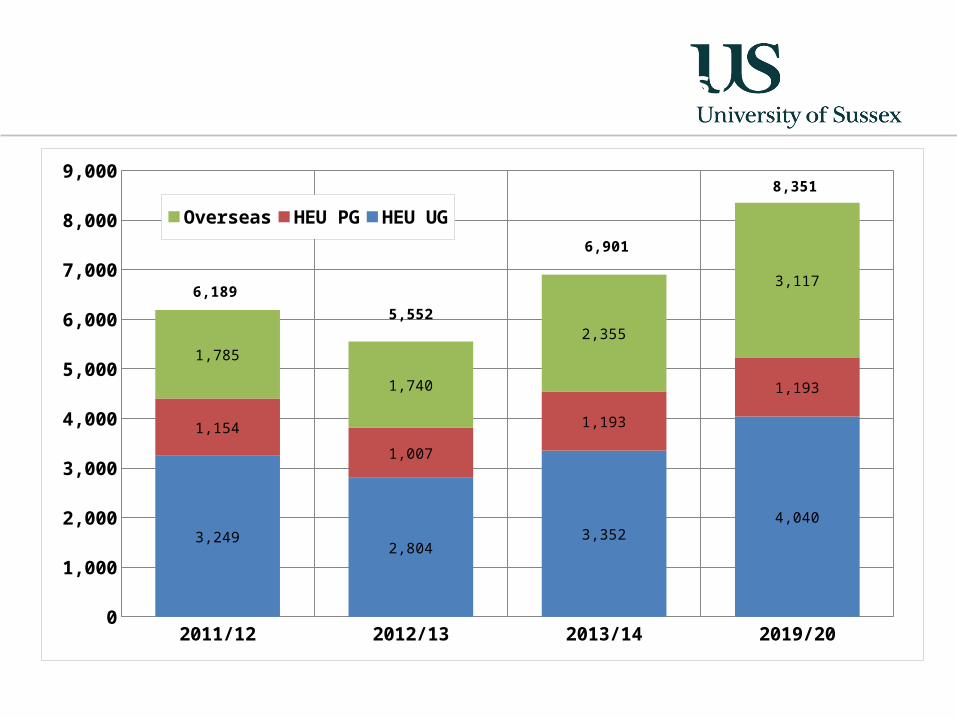
2011/12 2012/13 2013/14 2019/200
1,000
2,000
3,000
4,000
5,000
6,000
7,000
8,000
9,000
3,2492,804
3,3524,040
1,154
1,007
1,193
1,193
1,785
1,740
2,355
3,117
Overseas HEU PG HEU UG
6,189
5,552
6,901
8,351
Intakes by student type (year 0/1 FTEs)
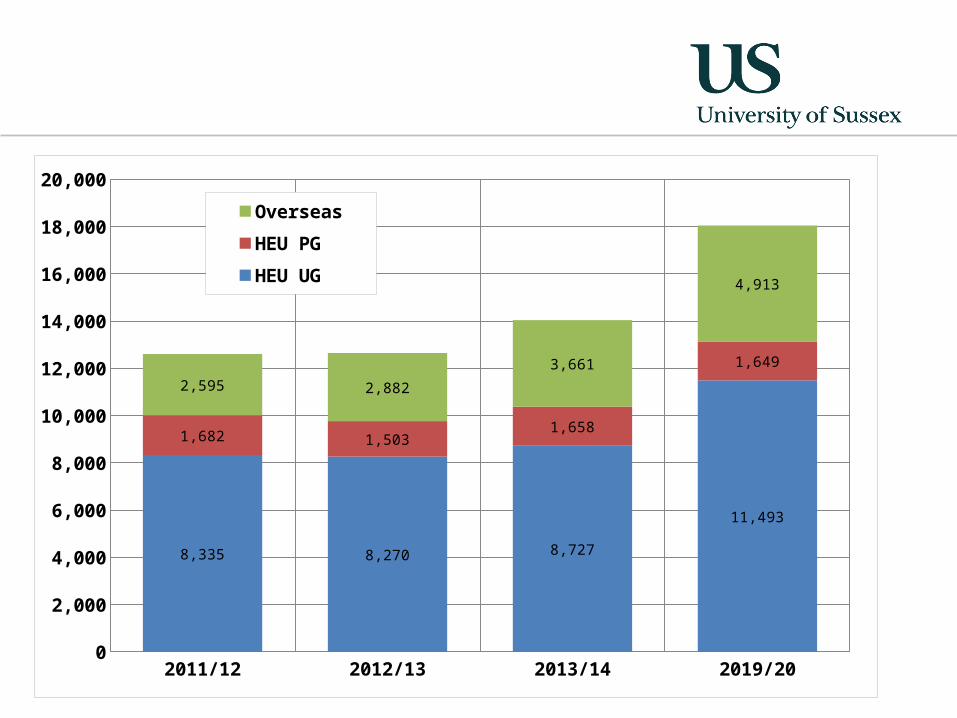
2011/12 2012/13 2013/14 2019/200
2,000
4,000
6,000
8,000
10,000
12,000
14,000
16,000
18,000
20,000
8,335 8,270 8,727
11,493
1,682 1,5031,658
1,649
2,595 2,882
3,661
4,913
Overseas
HEU PG
HEU UG
Total FTEs by student type
12,611 12,655
14,045
18,055
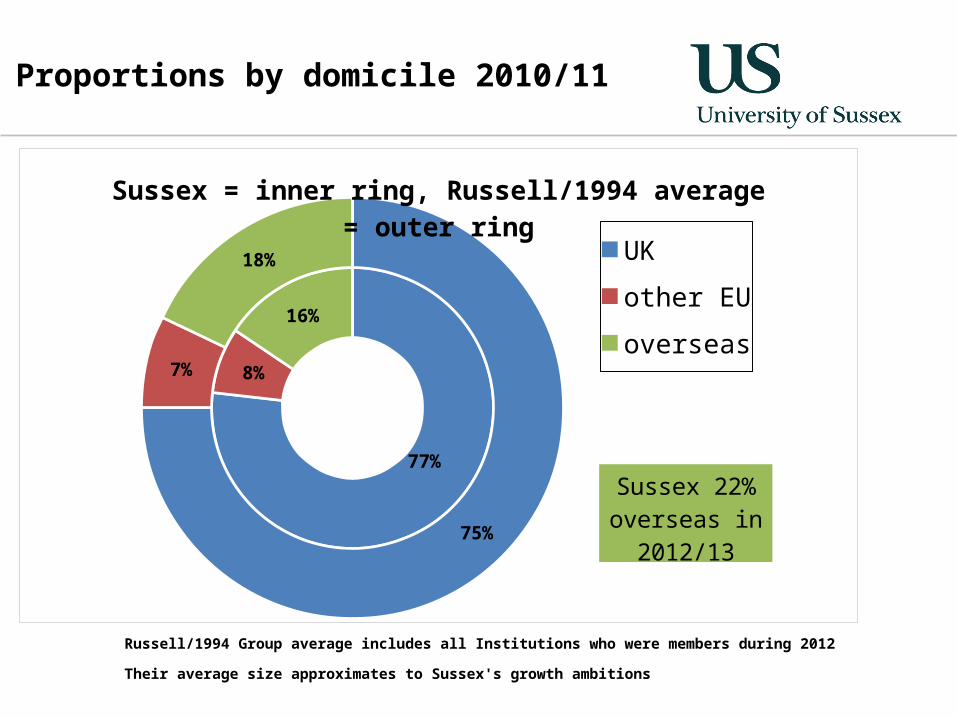
77%
8%
16%
75%
7%
18%
Sussex = inner ring, Russell/1994 average = outer ring
UK
other EU
overseas
Sussex 22% overseas in
2012/13
Russell/1994 Group average includes all Institutions who were members during 2012
Their average size approximates to Sussex's growth ambitions
Proportions by domicile 2010/11
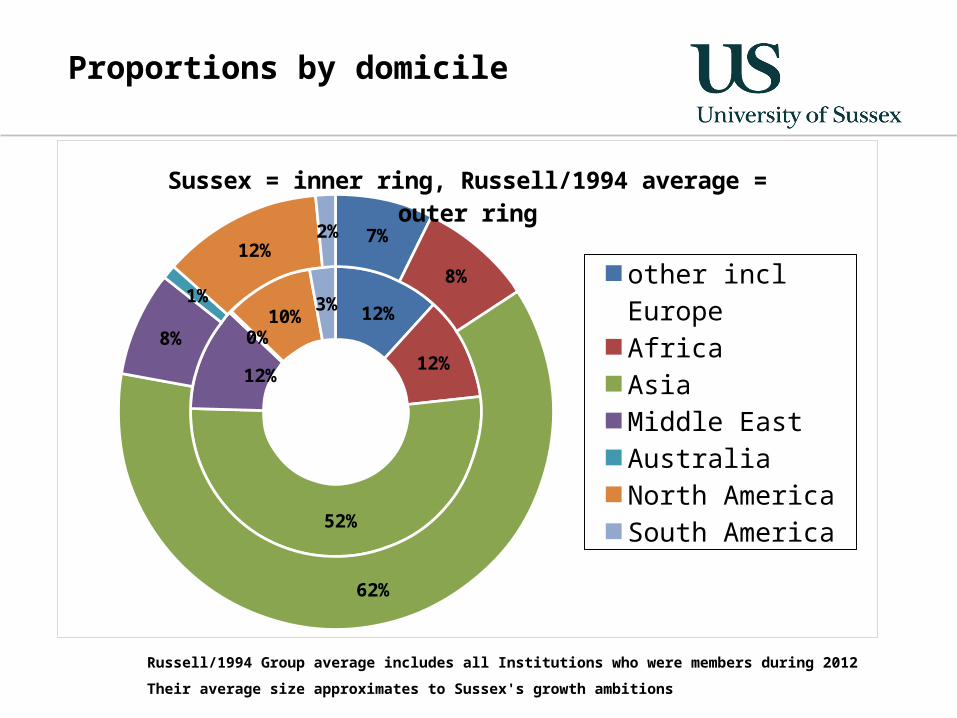
12%
12%
52%
12%
0%10%
3%
7%
8%
62%
8%
1%
12%2%
Sussex = inner ring, Russell/1994 average = outer ring
other incl Europe
Africa
Asia
Middle East
Australia
North America
South America
Russell/1994 Group average includes all Institutions who were members during 2012
Their average size approximates to Sussex's growth ambitions
Proportions by domicile


![[XLS] · Web view560 8/12/1996 188.99 560 3/14/1988 636 560 560 3/14/1988 836 560 9/7/2088 283 560 8/30/1995 190 560 8/30/1995 280 560 8/30/1995 675 560 8/30/1995 600 560 8/30/1995](https://img.pdfslide.us/doc/110x75/5aafbcbe7f8b9a07498db3a8/xls-view560-8121996-18899-560-3141988-636-560-560-3141988-836-560-972088.jpg)