Embed Size (px)
Citation preview

Overview
Goal:Present some tools for evaluating the workload of your FreeBSD system, and identifying the bottleneck(s) that are limiting performance on a workload.
OutlineWhat is the system doing?Tools for investigating your workloadTuning for performanceBenchmarking methodologies
What is performance?
"Performance" is a meaningless concept in isolationIt only makes sense to talk about performance of a particular workload, and according to a particular set of metricsThe first step is to characterize the workload you care about, and what aspects of its operation are most important to you
e.g.
webserver queries/second DNS server response latencyEmail delivery/second
What is your system doing?
How does your workload interact with the system?CPU useDisk I/ONetwork I/OOther device I/OApplication (mis-)configuration Hardware limitations System calls and interaction with the kernelMultithreaded lock contentionNot enough work?
Typically one or more of these elements will be the limiting factor in performance of your workload.
top, your new best friendThe top command shows a realtime overview of what your processes are doing.
paging to/from swapperformance kiss of death!
spending lots of time in the kernel, or processing interruptsWhich processes/threads are using CPUWhat they are doing inside the kernel
e.g. biord/biowr/wdrain: disk I/Osbwait: waiting for socket inputucond/umtx: waiting on an application thread lock Many more
Only documented in the source code :-(Good for orientation, then dig deeper with other tools

last pid: 5372; load averages: 8.11, 9.98, 14.01 up 0+01:22:42 22:31:41125 processes: 10 running, 88 sleeping, 20 waiting, 7 lockCPU: 35.7% user, 0.0% nice, 62.8% system, 0.0% interrupt, 1.5% idleMem: 103M Active, 3366M Inact, 850M Wired, 208K Cache, 682M Buf, 3616M FreeSwap: 16G Total, 16G Free
PID USERNAME PRI NICE SIZE RES STATE C TIME CPU COMMAND 5349 mysql 108 0 637M 89940K *bufob 6 3:02 56.88% {mysqld} 5349 mysql 107 0 637M 89940K *bufob 2 2:51 54.79% {mysqld} 5349 mysql 107 0 637M 89940K *bufob 5 2:52 51.17% {mysqld} 5349 mysql 106 0 637M 89940K RUN 4 2:50 49.66% {mysqld} 5349 mysql 106 0 637M 89940K *bufob 3 2:52 48.78% {mysqld} 11 root 171 ki31 0K 128K CPU6 6 23:39 2.29% {idle: cpu6} 11 root 171 ki31 0K 128K RUN 4 21:47 1.76% {idle: cpu4}
-H shows threads, -SH kernel threads
Process state
Process summary
Memory use
CPU
Resident memory (RAM)
address space use
Disk I/O
For disk-intensive workloads, they may be limited by bandwidth or latency (response time for an I/O operation). Random-access reads/writes require the disk to constantly seek, limiting throughput.
Sequential I/O is limited by the transfer rate of the disk and controller. Also useful: iostat, systat
Many other activity metrics too
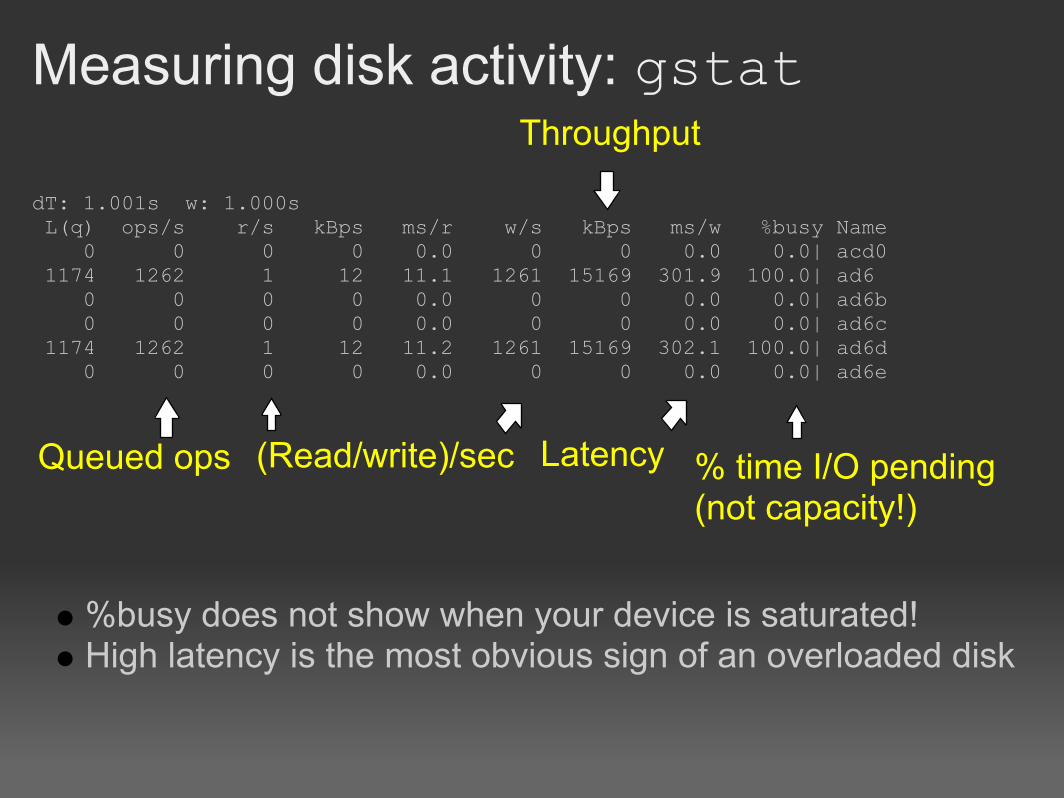
Measuring disk activity: gstat
dT: 1.001s w: 1.000s L(q) ops/s r/s kBps ms/r w/s kBps ms/w %busy Name 0 0 0 0 0.0 0 0 0.0 0.0| acd0 1174 1262 1 12 11.1 1261 15169 301.9 100.0| ad6 0 0 0 0 0.0 0 0 0.0 0.0| ad6b 0 0 0 0 0.0 0 0 0.0 0.0| ad6c 1174 1262 1 12 11.2 1261 15169 302.1 100.0| ad6d 0 0 0 0 0.0 0 0 0.0 0.0| ad6e
%busy does not show when your device is saturated!High latency is the most obvious sign of an overloaded disk
% time I/O pending (not capacity!)
(Read/write)/sec Latency
Throughput
Queued ops
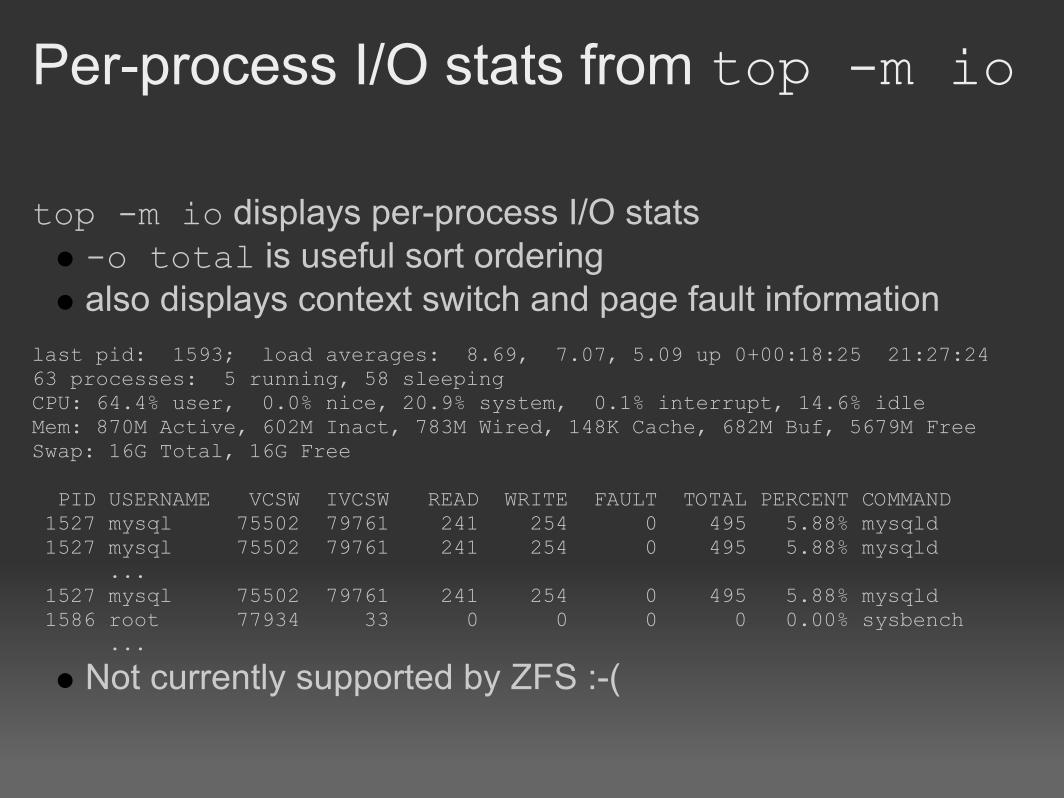
Per-process I/O stats from top -m io
top -m io displays per-process I/O stats-o total is useful sort orderingalso displays context switch and page fault information
last pid: 1593; load averages: 8.69, 7.07, 5.09 up 0+00:18:25 21:27:2463 processes: 5 running, 58 sleepingCPU: 64.4% user, 0.0% nice, 20.9% system, 0.1% interrupt, 14.6% idleMem: 870M Active, 602M Inact, 783M Wired, 148K Cache, 682M Buf, 5679M FreeSwap: 16G Total, 16G Free
PID USERNAME VCSW IVCSW READ WRITE FAULT TOTAL PERCENT COMMAND 1527 mysql 75502 79761 241 254 0 495 5.88% mysqld 1527 mysql 75502 79761 241 254 0 495 5.88% mysqld ... 1527 mysql 75502 79761 241 254 0 495 5.88% mysqld 1586 root 77934 33 0 0 0 0 0.00% sysbench ...
Not currently supported by ZFS :-(

Tuning disk performance
Reduce disk contentionMove competing I/O jobs onto independent disksStripe multiple disks with gstripe
one logical filesystem, multiple physical devices can handle I/O independently
For filesystems striped across multiple disks, make sure that the filesystem boundary is stripe-alignede.g. for 64k stripe sizes, start of filesystem should be 64k-aligned to avoid splitting I/O between multiple stripesAdd more/better hardware

Tuning disk performance (2)
Try to restructure the workload to separate "critical" data and "scratch" data
scratch data can be reconstructed or discarded after a crashcan afford to use fast but less reliable storage options
mount -o async is fast but unsafe after a crashgo one step further: store temporary data in memorymdconfig -a -t swap -s 4g; mount -o async
Creates a "swap-backed" memory deviceSwap only used when memory is low, otherwise stored in RAM
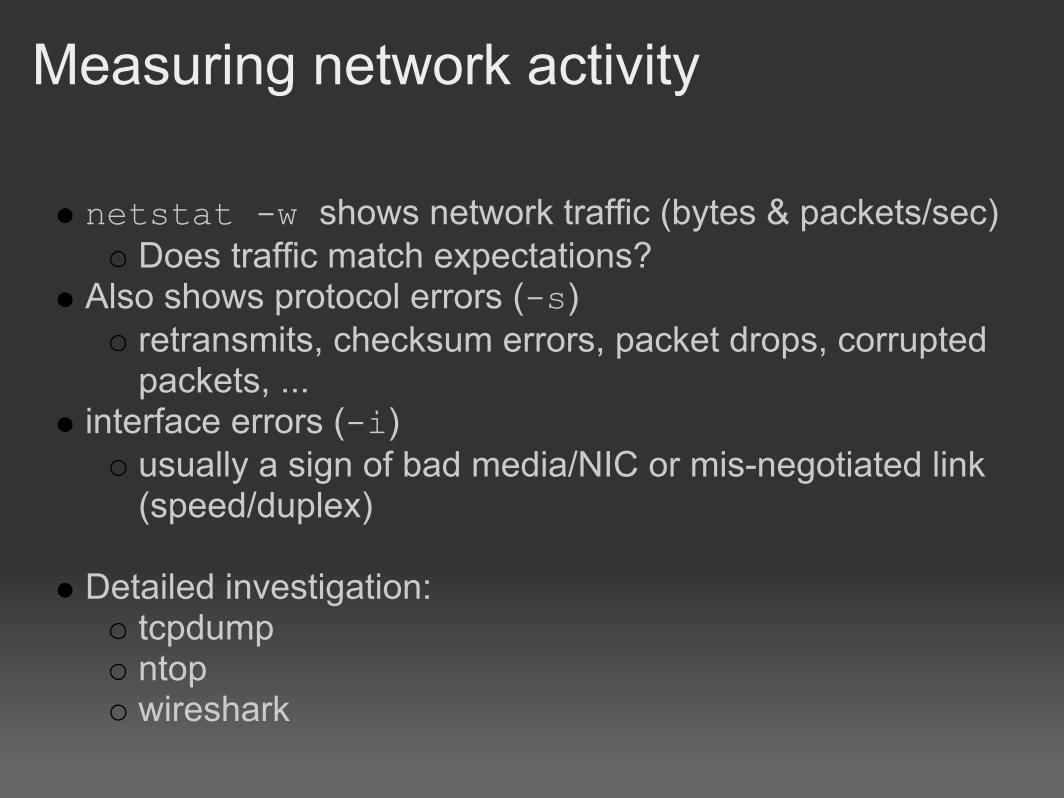
Measuring network activity
netstat -w shows network traffic (bytes & packets/sec)Does traffic match expectations?
Also shows protocol errors (-s)retransmits, checksum errors, packet drops, corrupted packets, ...
interface errors (-i) usually a sign of bad media/NIC or mis-negotiated link (speed/duplex)
Detailed investigation:
tcpdumpntop wireshark
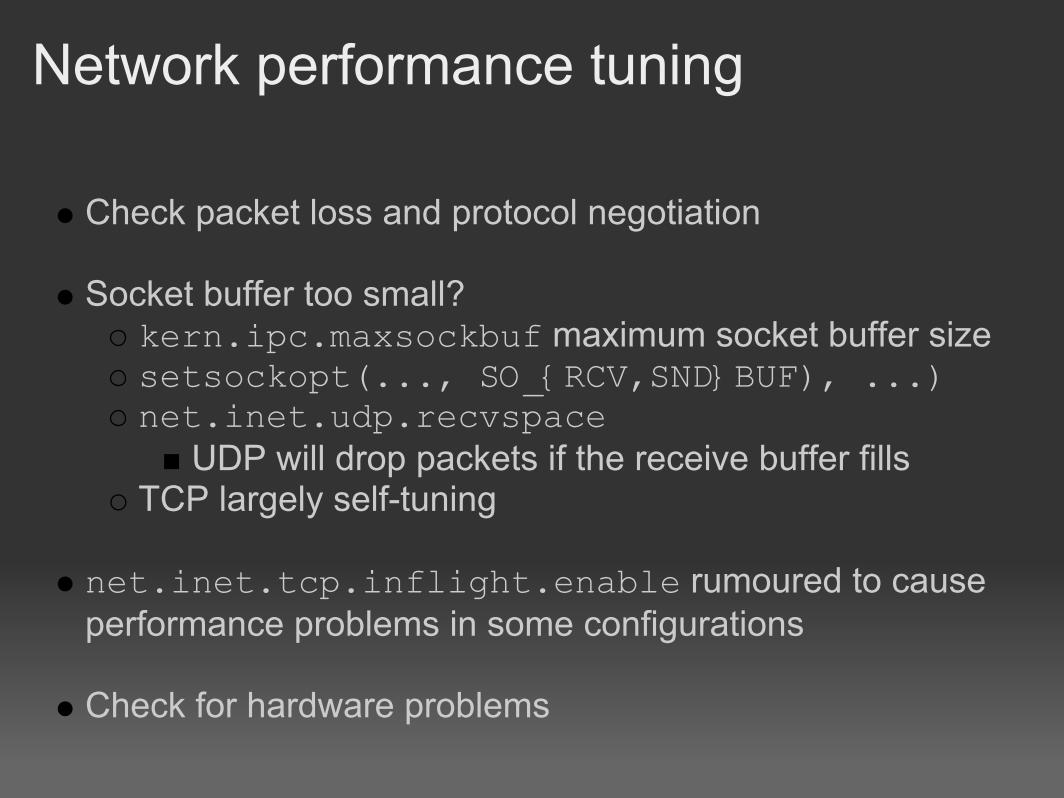
Network performance tuning
Check packet loss and protocol negotiation
Socket buffer too small?kern.ipc.maxsockbuf maximum socket buffer sizesetsockopt(..., SO_{RCV,SND}BUF), ...)net.inet.udp.recvspace
UDP will drop packets if the receive buffer fills TCP largely self-tuning
net.inet.tcp.inflight.enable rumoured to cause performance problems in some configurations
Check for hardware problems

Device I/O
If top shows a significant CPU% spent processing interrupts, vmstat -i breaks down by device:
hydra1# vmstat -iinterrupt total rateirq1: atkbd0 1 0irq4: sio0 4148 0irq6: fdc0 1 0irq14: ata0 69 0irq19: uhci1+ 1712756 1018cpu0: timer 688497400 2000irq256: em0 1692373 1324
'+' shows a shared interrupt; see dmesg boot logsCan limit performance, especially with shared "giant locked" interrupt handlersRemove driver from kernel/(re)move device

Context switches
top -m io shows context switches/second per processvoluntary context switch
process blocks waiting for a resourceinvoluntary context switch
Kernel decides that the process should stop running for now
Can indicateresource contention in the kernel (symptom)application design/configuration problem
e.g. too many threads, too little work per thread
System calls
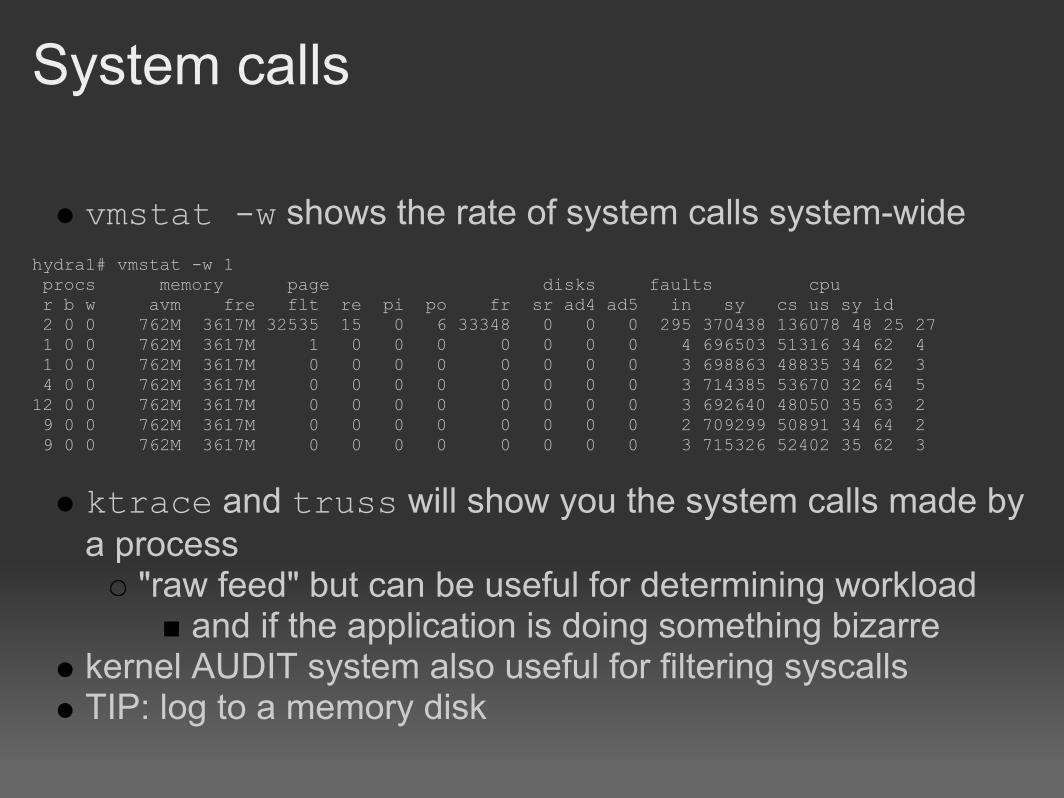
vmstat -w shows the rate of system calls system-wide hydra1# vmstat -w 1 procs memory page disks faults cpu r b w avm fre flt re pi po fr sr ad4 ad5 in sy cs us sy id 2 0 0 762M 3617M 32535 15 0 6 33348 0 0 0 295 370438 136078 48 25 27 1 0 0 762M 3617M 1 0 0 0 0 0 0 0 4 696503 51316 34 62 4 1 0 0 762M 3617M 0 0 0 0 0 0 0 0 3 698863 48835 34 62 3 4 0 0 762M 3617M 0 0 0 0 0 0 0 0 3 714385 53670 32 64 512 0 0 762M 3617M 0 0 0 0 0 0 0 0 3 692640 48050 35 63 2 9 0 0 762M 3617M 0 0 0 0 0 0 0 0 2 709299 50891 34 64 2 9 0 0 762M 3617M 0 0 0 0 0 0 0 0 3 715326 52402 35 62 3
ktrace and truss will show you the system calls made by a process
"raw feed" but can be useful for determining workloadand if the application is doing something bizarre
kernel AUDIT system also useful for filtering syscallsTIP: log to a memory disk
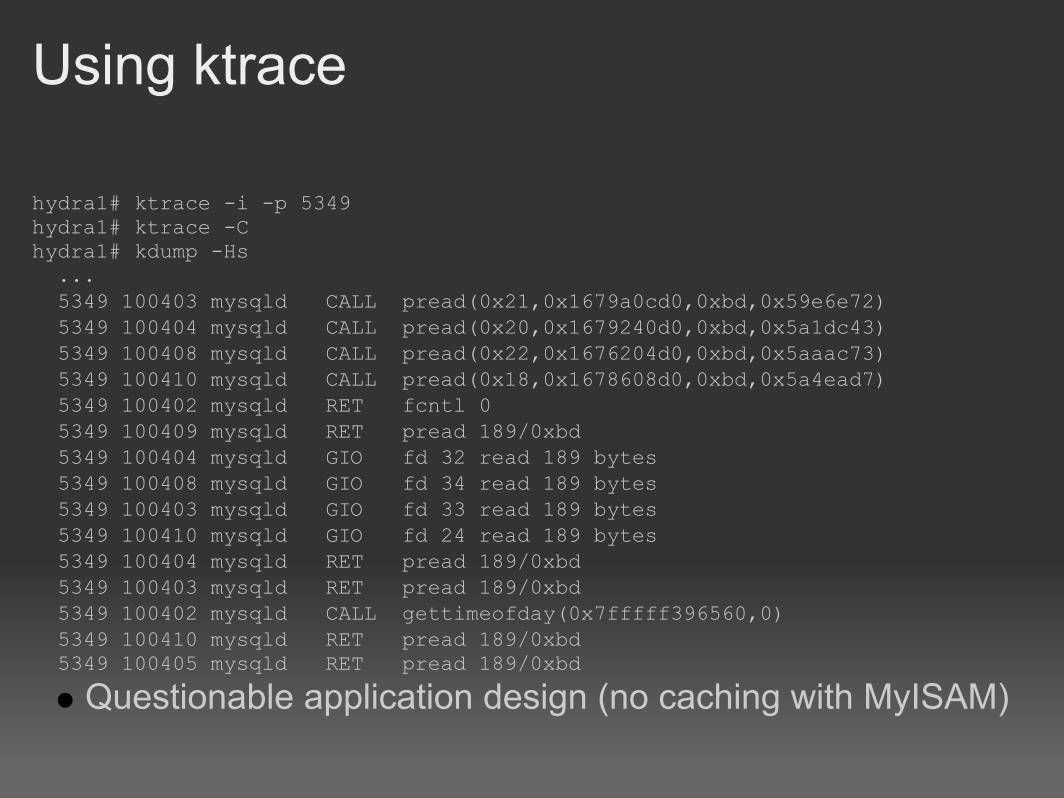
Using ktrace
hydra1# ktrace -i -p 5349 hydra1# ktrace -Chydra1# kdump -Hs ... 5349 100403 mysqld CALL pread(0x21,0x1679a0cd0,0xbd,0x59e6e72) 5349 100404 mysqld CALL pread(0x20,0x1679240d0,0xbd,0x5a1dc43) 5349 100408 mysqld CALL pread(0x22,0x1676204d0,0xbd,0x5aaac73) 5349 100410 mysqld CALL pread(0x18,0x1678608d0,0xbd,0x5a4ead7) 5349 100402 mysqld RET fcntl 0 5349 100409 mysqld RET pread 189/0xbd 5349 100404 mysqld GIO fd 32 read 189 bytes 5349 100408 mysqld GIO fd 34 read 189 bytes 5349 100403 mysqld GIO fd 33 read 189 bytes 5349 100410 mysqld GIO fd 24 read 189 bytes 5349 100404 mysqld RET pread 189/0xbd 5349 100403 mysqld RET pread 189/0xbd 5349 100402 mysqld CALL gettimeofday(0x7fffff396560,0) 5349 100410 mysqld RET pread 189/0xbd 5349 100405 mysqld RET pread 189/0xbd
Questionable application design (no caching with MyISAM)
Activity inside the kernel
High system CPU% is often caused by multiple processes executing in the kernel at the same time
e.g. high syscall ratekernel lock contention
Often indicates a kernel scalability problemBut not always
User application (pthread) mutex contention also shows up in the kernelCan indicate poor application design or configuration

Lock profiling
Kernel lock operations, contention, hold time, ...options LOCK_PROFILING (MUTEX_PROFILING in 6.x) Low overhead when not in use Performance while profiling highly depends on hardware timecounterkern.timecounter.{choice,hardware}TSC fastest, but not usable on older SMP hardware
Not synchronized between CPUsVariable with CPU frequencyUsable on modern Intel CPUskern.timecounter.smp_tsc=1
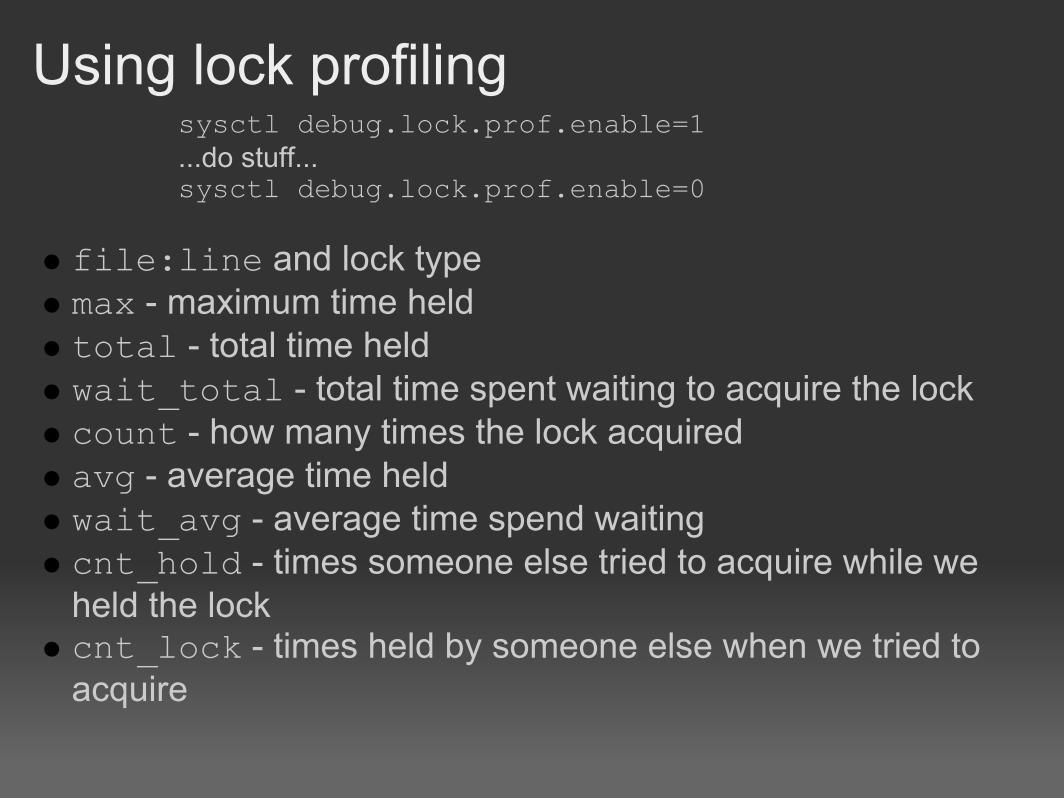
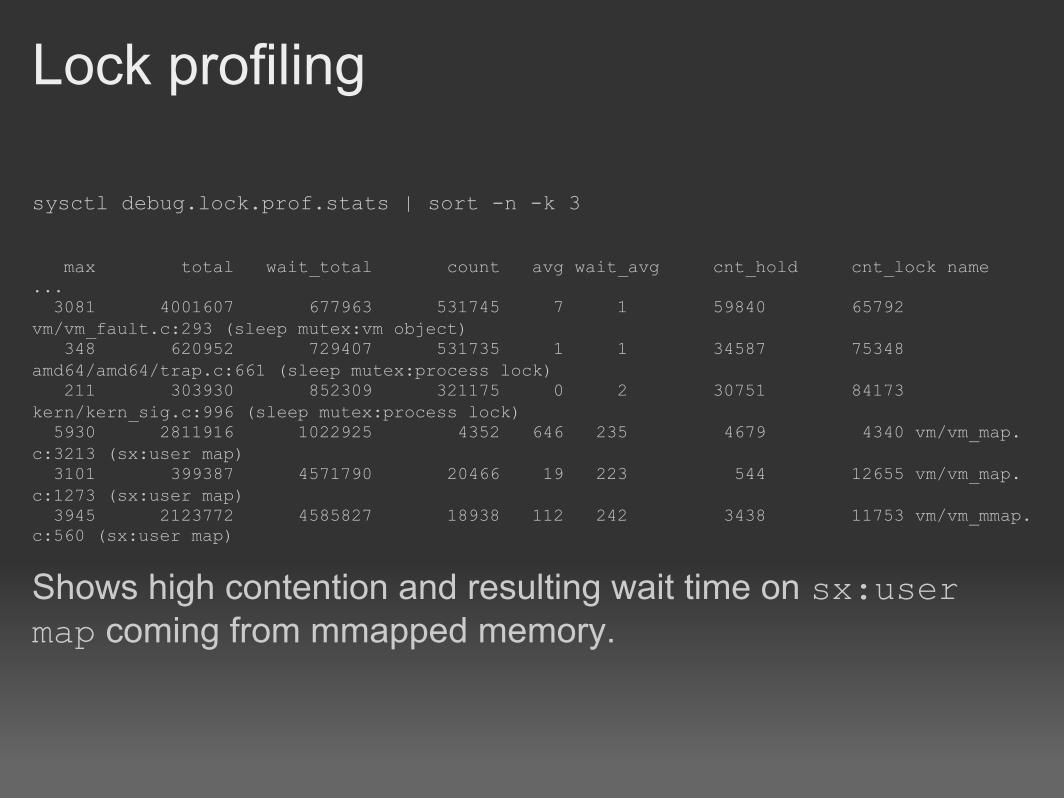
Using lock profilingsysctl debug.lock.prof.enable=1 ...do stuff...sysctl debug.lock.prof.enable=0
file:line and lock typemax - maximum time held total - total time held wait_total - total time spent waiting to acquire the lockcount - how many times the lock acquiredavg - average time heldwait_avg - average time spend waitingcnt_hold - times someone else tried to acquire while we held the lockcnt_lock - times held by someone else when we tried to acquire
Lock profiling
sysctl debug.lock.prof.stats | sort -n -k 3 max total wait_total count avg wait_avg cnt_hold cnt_lock name... 3081 4001607 677963 531745 7 1 59840 65792 vm/vm_fault.c:293 (sleep mutex:vm object) 348 620952 729407 531735 1 1 34587 75348 amd64/amd64/trap.c:661 (sleep mutex:process lock) 211 303930 852309 321175 0 2 30751 84173 kern/kern_sig.c:996 (sleep mutex:process lock) 5930 2811916 1022925 4352 646 235 4679 4340 vm/vm_map.c:3213 (sx:user map) 3101 399387 4571790 20466 19 223 544 12655 vm/vm_map.c:1273 (sx:user map) 3945 2123772 4585827 18938 112 242 3438 11753 vm/vm_mmap.c:560 (sx:user map)
Shows high contention and resulting wait time on sx:user map coming from mmapped memory.
Sleepqueue profiling (8.0)
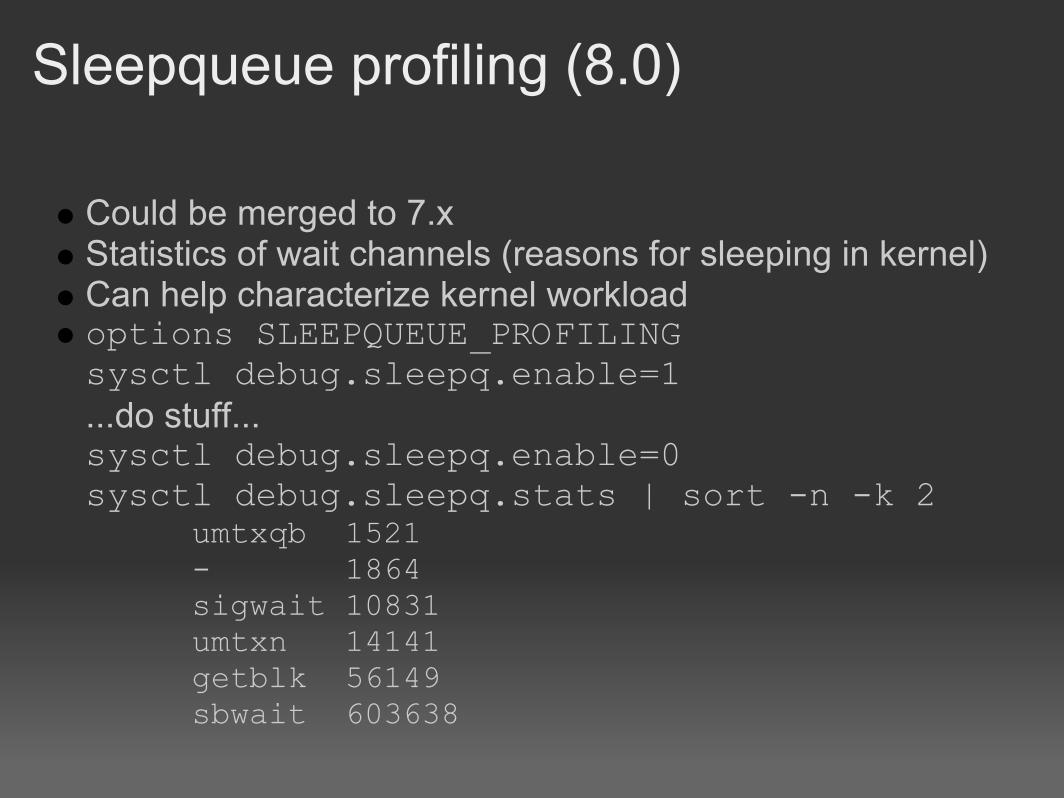
Could be merged to 7.x Statistics of wait channels (reasons for sleeping in kernel) Can help characterize kernel workload options SLEEPQUEUE_PROFILINGsysctl debug.sleepq.enable=1...do stuff... sysctl debug.sleepq.enable=0sysctl debug.sleepq.stats | sort -n -k 2
umtxqb 1521- 1864sigwait 10831umtxn 14141getblk 56149sbwait 603638
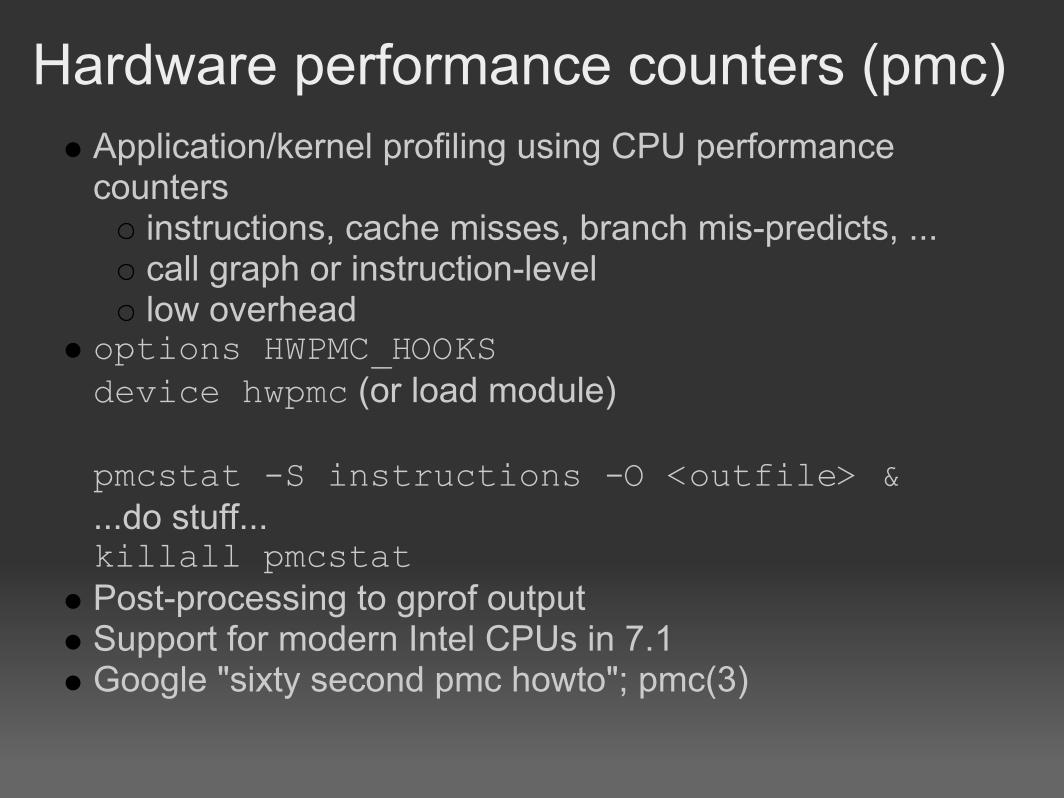
Hardware performance counters (pmc)Application/kernel profiling using CPU performance counters
instructions, cache misses, branch mis-predicts, ...call graph or instruction-levellow overhead
options HWPMC_HOOKSdevice hwpmc (or load module)
pmcstat -S instructions -O <outfile> &...do stuff...killall pmcstatPost-processing to gprof outputSupport for modern Intel CPUs in 7.1 Google "sixty second pmc howto"; pmc(3)

Kernel tuning
FreeBSD is largely auto-tuningRun a modern version (e.g. 7.0 or 7.1)Evaluate the ULE scheduler
default in 7.1better interactive responseCPU affinity helps many workloads...but not all (slightly more overhead than 4BSD)
Turn on superpages (8.0)Turn off debugging (8.0)Use a fast timecounter (TSC) if it matters to your workload (e.g. java 1.5) and your hardware allows it

Benchmarking techniques
1. Identify a self-contained test case Repeatable
e.g. constant size workloadconstant time
Small, clearly demonstrates the problem2. Change one thing at a time3. Measure carefully
Several repeated measurements under identical conditionsOver a suitably long time intervalAvoid confirmation bias
trust the numbers, not your perceptions/usr/src/tools/tools/ministat is your friend
Using ministat
file containing list of data points from repeated runs of the benchmark under identical conditionstwo or more files with datasets from different conditionsUses "Student's t" test to determine likelihood that the datasets differ, and by how much
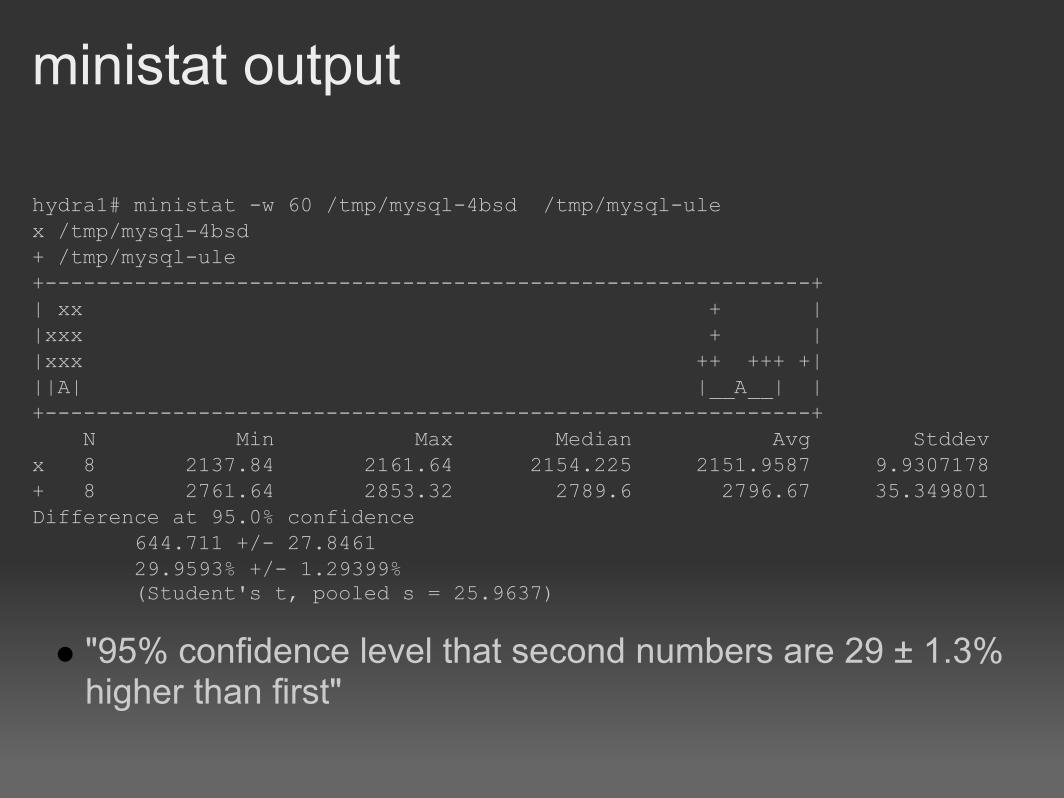
ministat output
hydra1# ministat -w 60 /tmp/mysql-4bsd /tmp/mysql-ulex /tmp/mysql-4bsd+ /tmp/mysql-ule+------------------------------------------------------------+| xx + ||xxx + ||xxx ++ +++ +|||A| |__A__| |+------------------------------------------------------------+ N Min Max Median Avg Stddevx 8 2137.84 2161.64 2154.225 2151.9587 9.9307178+ 8 2761.64 2853.32 2789.6 2796.67 35.349801Difference at 95.0% confidence 644.711 +/- 27.8461 29.9593% +/- 1.29399% (Student's t, pooled s = 25.9637)
"95% confidence level that second numbers are 29 ± 1.3% higher than first"
When to throw hardware at the problem
Only once you have have determined that a particular hardware resource is your limiting factor
More CPU cores will not solve a slow disk
Adding RAM can reduce the need for some disk I/Omore cached data, less paging from disk
Adding more CPU cores is not a magic bullet for CPU limited jobs
some applications do not scale wellhigh CPU can be caused by resource contention
increasing resource contention will make performance worse!
Help, I'm still stuck!
Talk to a developerapplication developer
if you think the problem is related to a particular application
FreeBSD support mailing listif you think it is a FreeBSD performance problem or configuration [email protected] (general support)[email protected] (technical questions)
We may not be able to helpbut armed with the data you have collected you're off to a good start!