Embed Size (px)
DESCRIPTION
Hedge Funds in Strategic Asset Allocation Lyxor White Paper March 2014
Citation preview
WHITE PAPER - ISSUE #11
L Y X O R R E S E A R C H
HEDGE FUNDS IN STRATEGIC ASSET ALLOCATION
ZÉLIA CAZALET
Quantitative ResearchLyxor Asset Management
BAN ZHENG
Quantitative ResearchLyxor Asset Management
M A R C H 2 0 1 4
713967B_221076 White Paper N°11.indd 1 18/03/14 11:56

H E D G E F U N D S I N S T R AT E G I C A S S E T A L L O C AT I O N
I S S U E # 1 1 - M A R C H 2 0 1 4L Y X O R R E S E A R C H
<< 2
713967B_221076 White Paper N°11.indd 2 18/03/14 11:56
H E D G E F U N D S I N S T R AT E G I C A S S E T A L L O C AT I O N
I S S U E # 1 1 - M A R C H 2 0 1 4L Y X O R R E S E A R C H
3 >>
Foreword
Total assets under management for the hedge fund industry reached an all-time highof USD 2.6 trillion in 20131. With lower expectations for traditional assets, many institu-tional investors, including pension funds and corporate, are lending increasing allocation toalternative assets to secure both performance and resilience for their portfolios. As a result,hedge funds are now growing faster than any other type of asset. They are expected to reachUSD 3.3 trillion by 2015 with a compound annual growth rates of around 15%2.
This 11th white paper looks at hedge funds from a new perspective, in the context ofStrategic Asset Allocation (SAA). We see the growth of the assets managed the industry asan implicit consequence of the different approach taken with regard to hedge fund invest-ments.
Numerous studies using pre-2008 data have shown the benefits of adding hedge fundsto SAA. Hedge funds were previously considered to be a stand-alone asset which shouldaccount for a small percentage of overall portfolios. Now, in the aftermath of the financialcrisis, a new paradigm has appeared: hedge funds are becoming mature investmentstyles exhibiting significant and persistent performance divergence both witheach other and when compared to traditional assets.
As such, hedge fund strategies should be disaggregated into sensible sub-categories whichshould naturallymigrate from a stand-alone asset into the broader equity and bondasset-mix. In this context, we propose a reassessment of the relationship between hedgefund strategies and traditional markets to introduce an updated SAA framework withhedge funds.
To highlight the above points, this paper addresses the following structural questions:
• What are the stylized facts of hedge fund performance in the post-2008environment?
• How should we classify hedge funds in order to better reflect their truecharacteristics?
• What is the best way to integrate the new classification process into a SAAapproach?
We hope you will find this article both interesting and useful in practice.
Jean-Marc StengerChief Investment Officer for Alternative Investments
1Hedge Fund Research database, 2013.2The New Challenge for Hedge Funds: Operational Excellence, Boston Consulting Group, 2013.
713967B_221076 White Paper N°11.indd 3 18/03/14 11:56

H E D G E F U N D S I N S T R AT E G I C A S S E T A L L O C AT I O N
I S S U E # 1 1 - M A R C H 2 0 1 4L Y X O R R E S E A R C H
<< 4
713967B_221076 White Paper N°11.indd 4 18/03/14 11:56
H E D G E F U N D S I N S T R AT E G I C A S S E T A L L O C AT I O N
I S S U E # 1 1 - M A R C H 2 0 1 4L Y X O R R E S E A R C H
5 >>
Executive Summary
Introduction
Alternative investments, including hedge funds, have grown faster than non-alternativesand have now surpassed their 2007 levels. For this reason, institutional investors expectto increase allocations to alternative classes, especially hedge funds. It seems that manyinvestors are still following the traditional approach to examining their SAA with hedgefunds because many academic and empirical studies are based on pre-2008 data.
As the performance of hedge funds is becoming less homogeneousthan in the past, it is of the utmost importance to re-examine theSAA with hedge funds.
In our investment philosophy, hedge funds can be regarded as (equity or bond) betaproviders or pure alpha generators. Intelligent use of beta provider hedge funds allows moreefficient risk diversification compared to traditional assets. Moreover, it is worthwhileto introduce some pure alpha generator hedge funds to generate uncorrelated absolutereturn. To take advantage of these benefits, we propose a new process for classifyinghedge funds into two families: equity/bond substitutes and diversifiers. To take intoaccount economic periodicity, we then propose a regime switching mean-variance model fordetermining the hedge fund allocation in strategic asset allocation.
A new vision of hedge funds after the subprime crisis
• Hedge funds are more resilient than traditional assets during crisis peri-ods.
• In the post-2008 environment, it is no longer possible to consider hedgefunds as a single asset class.
Many academic studies show that hedge funds are generally more resilient than equities andbonds in extreme periods, with hedge fund losses being three times lower than the largestfalls suffered by equities. In addition, hedge fund returns are very positive in comparisonwith the biggest losses made by bonds.
Moreover, several studies report homogeneous attractive hedge fund performance foralmost all hedge fund strategies using data from before the subprime crisis in 2008. Thishomogeneity allows investors to consider hedge funds as a single asset class in strategic assetallocation. Nevertheless, many differences between strategies appeared during the subprime
713967B_221076 White Paper N°11.indd 5 18/03/14 11:56
H E D G E F U N D S I N S T R AT E G I C A S S E T A L L O C AT I O N
I S S U E # 1 1 - M A R C H 2 0 1 4L Y X O R R E S E A R C H
<< 6
crisis period. For instance, Equity Hedge suffered from big losses whereas Macro faredbetter. The difference between hedge fund strategies in terms of performance and volatilityhas persisted since 2008.
A new process for classifying heterogeneous hedge funds
We can classify hedge funds in two groups:
• Substitutes, which aim to replace equities and bonds in order to improveportfolios’ risk/return profiles;
• Diversifiers, which aim to generate absolute performance and diversifi-cation.
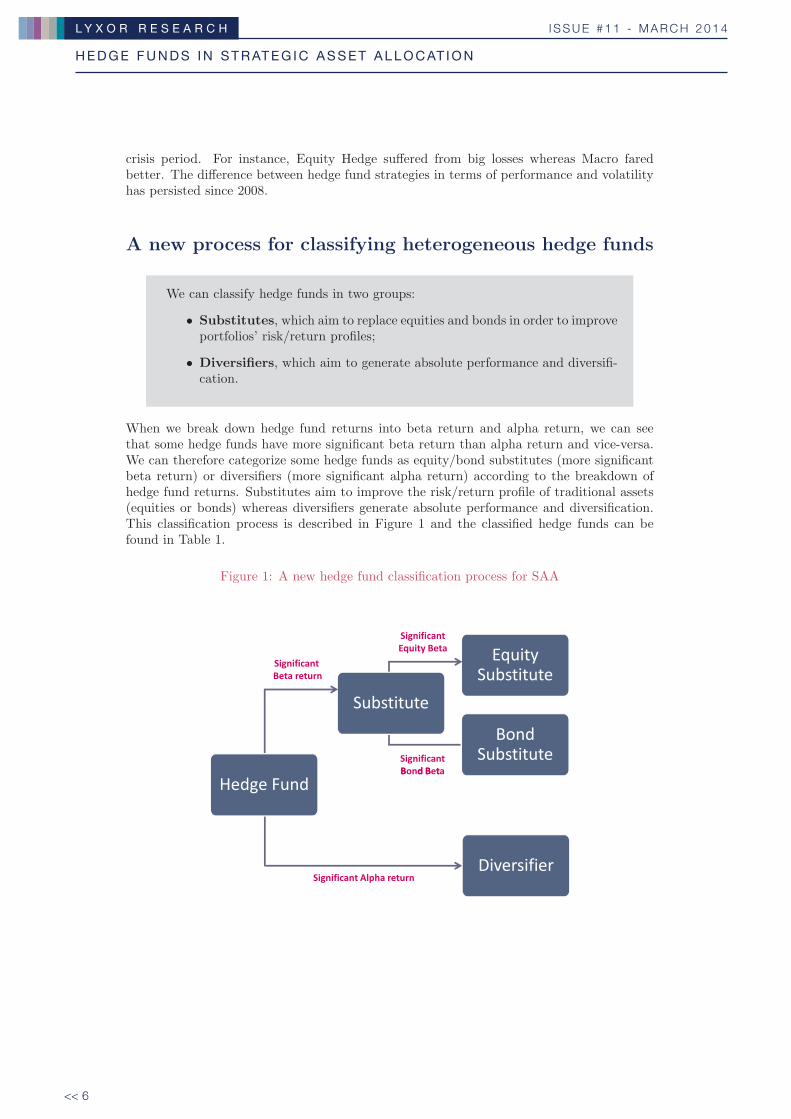
When we break down hedge fund returns into beta return and alpha return, we can seethat some hedge funds have more significant beta return than alpha return and vice-versa.We can therefore categorize some hedge funds as equity/bond substitutes (more significantbeta return) or diversifiers (more significant alpha return) according to the breakdown ofhedge fund returns. Substitutes aim to improve the risk/return profile of traditional assets(equities or bonds) whereas diversifiers generate absolute performance and diversification.This classification process is described in Figure 1 and the classified hedge funds can befound in Table 1.
Figure 1: A new hedge fund classification process for SAA
������������� ���
����������� � �
�������������������
����������
���������������
��������������
��������
���������� �����������
����� ����
�����������
713967B_221076 White Paper N°11.indd 6 18/03/14 11:56
H E D G E F U N D S I N S T R AT E G I C A S S E T A L L O C AT I O N
I S S U E # 1 1 - M A R C H 2 0 1 4L Y X O R R E S E A R C H
7 >>
Table 1: Equity/bond substitutes and diversifiers
Substitutes
Equity substitutes EH: Quantitative Directional
Bond substitutes
ED: DistressedMacro
RV: Fixed Income Asset Convertible ArbitrageRV: Fixed Income Asset Corporate
RV: Multi Strategy
EH: Equity Market NeutralDiversifiers ED: Merger Arbitrage
RV: Fixed Income Asset Backed
ED, EH and RV denote respectively Event-Driven, Equity Hedge and Relative Value.
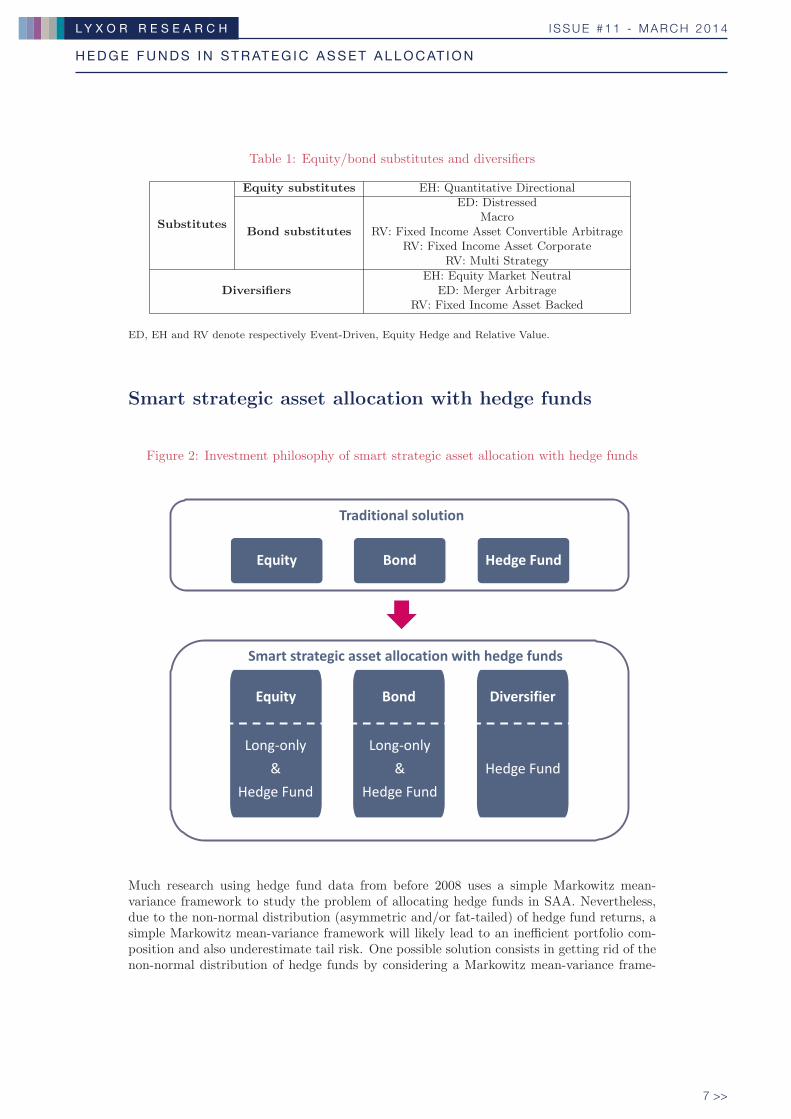
Smart strategic asset allocation with hedge funds
Figure 2: Investment philosophy of smart strategic asset allocation with hedge funds
���������� �������
��� ���� ����� ����
������������ ���� ������������� ����� �����
��� ���� �����������
����������
����� ����
����������
����� ��������� ����
Much research using hedge fund data from before 2008 uses a simple Markowitz mean-variance framework to study the problem of allocating hedge funds in SAA. Nevertheless,due to the non-normal distribution (asymmetric and/or fat-tailed) of hedge fund returns, asimple Markowitz mean-variance framework will likely lead to an inefficient portfolio com-position and also underestimate tail risk. One possible solution consists in getting rid of thenon-normal distribution of hedge funds by considering a Markowitz mean-variance frame-
713967B_221076 White Paper N°11.indd 7 18/03/14 11:56
H E D G E F U N D S I N S T R AT E G I C A S S E T A L L O C AT I O N
I S S U E # 1 1 - M A R C H 2 0 1 4L Y X O R R E S E A R C H
<< 8
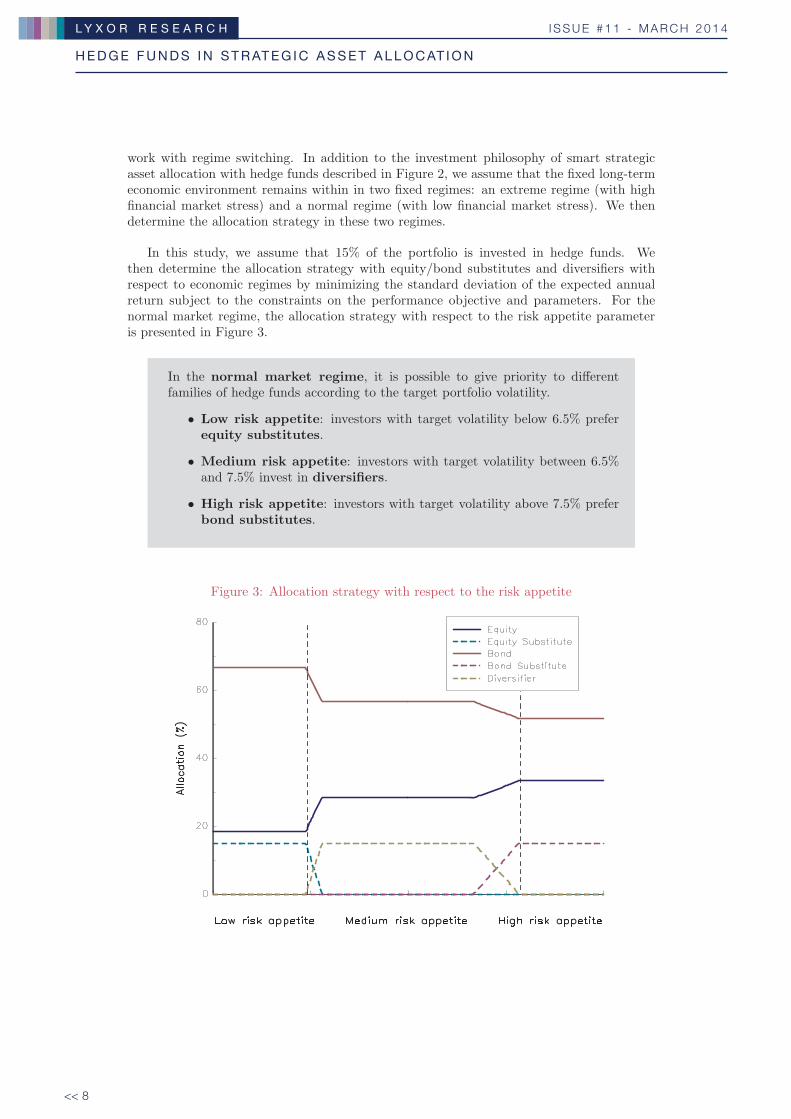
work with regime switching. In addition to the investment philosophy of smart strategicasset allocation with hedge funds described in Figure 2, we assume that the fixed long-termeconomic environment remains within in two fixed regimes: an extreme regime (with highfinancial market stress) and a normal regime (with low financial market stress). We thendetermine the allocation strategy in these two regimes.
In this study, we assume that 15% of the portfolio is invested in hedge funds. Wethen determine the allocation strategy with equity/bond substitutes and diversifiers withrespect to economic regimes by minimizing the standard deviation of the expected annualreturn subject to the constraints on the performance objective and parameters. For thenormal market regime, the allocation strategy with respect to the risk appetite parameteris presented in Figure 3.
In the normal market regime, it is possible to give priority to differentfamilies of hedge funds according to the target portfolio volatility.
• Low risk appetite: investors with target volatility below 6.5% preferequity substitutes.
• Medium risk appetite: investors with target volatility between 6.5%and 7.5% invest in diversifiers.
• High risk appetite: investors with target volatility above 7.5% preferbond substitutes.
Figure 3: Allocation strategy with respect to the risk appetite
713967B_221076 White Paper N°11.indd 8 18/03/14 11:56
H E D G E F U N D S I N S T R AT E G I C A S S E T A L L O C AT I O N
I S S U E # 1 1 - M A R C H 2 0 1 4L Y X O R R E S E A R C H
9 >>
Conclusion
Hedge funds are attractive investment tools, but are more sophisticated than traditionalassets and therefore require more investment expertise. Hedge funds have become noticeablymore mature in recent years, meaning that it is time to reassess hedge fund investments inSAA. The granularity of hedge funds allows us to evaluate and classify them according totheir sensitivity to common risk factors. Hedge funds can be classified into equity/bondsubstitutes and diversifiers. Taking into account the non-normal distribution of hedge fundreturns and economic periodicity, a regime switching Markowitz model is applied to examineportfolio allocation in an extreme market regime and a normal market regime. We show thatinvestors should choose equity substitutes in an extreme market regime, while in a normalmarket regime, it is recommended for investors to use equity substitutes, diversifiers andbond substitutes if they are aiming for low, medium and high volatility respectively.
713967B_221076 White Paper N°11.indd 9 18/03/14 11:56

H E D G E F U N D S I N S T R AT E G I C A S S E T A L L O C AT I O N
I S S U E # 1 1 - M A R C H 2 0 1 4L Y X O R R E S E A R C H
<< 10
713967B_221076 White Paper N°11.indd 10 18/03/14 11:56
H E D G E F U N D S I N S T R AT E G I C A S S E T A L L O C AT I O N
I S S U E # 1 1 - M A R C H 2 0 1 4L Y X O R R E S E A R C H
11 >>
Table of Contents
1 Introduction 13
2 Hedge fund overview 152.1 Hedge fund databases . . . . . . . . . . . . . . . . . . . . . . . . 15
2.1.1 Biases in database construction . . . . . . . . . . . . . . 152.1.2 Private hedge funds databases and indices . . . . . . . . 16
2.2 Stylized facts of hedge funds . . . . . . . . . . . . . . . . . . . . 172.2.1 Basic statistics of hedge fund indices . . . . . . . . . . . 182.2.2 Survivorship bias . . . . . . . . . . . . . . . . . . . . . . 202.2.3 Abnormal distribution and fat tail risk . . . . . . . . . . 212.2.4 Performance persistence . . . . . . . . . . . . . . . . . . 222.2.5 Auto-correlation . . . . . . . . . . . . . . . . . . . . . . 232.2.6 Cross-correlation with traditional assets . . . . . . . . . 24
2.3 Quantitative classification of hedge funds . . . . . . . . . . . . . 26
3 Investment vehicles 283.1 Single hedge funds and managed account platforms . . . . . . . 283.2 Funds of hedge funds and multi-strategy funds . . . . . . . . . . 293.3 Hedge fund indices replicators . . . . . . . . . . . . . . . . . . . 30
4 Benefits and risks of hedge funds investments 314.1 Benefits of hedge funds investments . . . . . . . . . . . . . . . . 31
4.1.1 Significant risk-adjusted return . . . . . . . . . . . . . . 314.1.2 Efficient diversification of risks . . . . . . . . . . . . . . . 324.1.3 Resistance to market environments . . . . . . . . . . . . 37
4.2 Risks of hedge fund investments . . . . . . . . . . . . . . . . . . 38
5 Smart strategic asset allocation with hedge funds 415.1 Equity/bond substitutes or diversifiers . . . . . . . . . . . . . . 435.2 How much should we invest in hedge funds? . . . . . . . . . . . 45
6 Conclusion 50
A Comparison of classification in different databases 52
B Markowitz mean variance model with regime switching 53
Sans titre-2 1 19/03/14 11:50

H E D G E F U N D S I N S T R AT E G I C A S S E T A L L O C AT I O N
I S S U E # 1 1 - M A R C H 2 0 1 4L Y X O R R E S E A R C H
<< 12
713967B_221076 White Paper N°11.indd 12 18/03/14 11:56
H E D G E F U N D S I N S T R AT E G I C A S S E T A L L O C AT I O N
I S S U E # 1 1 - M A R C H 2 0 1 4L Y X O R R E S E A R C H
13 >>
From Niche to Mainstream: A New Approach
to Utilizing Hedge Funds in Strategic Asset
Allocation
Zelia CazaletQuantitative Research
Lyxor Asset Management, [email protected]
Ban ZhengQuantitative Research
Lyxor Asset Management, [email protected]
March 2014
Abstract
Over recent decades, the hedge fund industry has expanded rapidly. Its developmenthas enabled the creation of a new asset class in its own right. Hedge funds have becomemore attractive in recent years, especially for family offices and institutional investors.The objective of this paper is to provide a comprehensive overview of hedge funds in themost detailed way possible and propose an innovative approach to placing hedge fundsin strategic asset allocation (SAA). Using the HFR database, we review the stylizedfacts, benefits and risks of hedge funds. We propose a new method of classifying hedgefunds as equity/bond substitutes and diversifiers. We then examine SAA in extremeand normal regimes using the Markowitz mean-variance model with regime switching.
Keywords: Hedge fund, strategic asset allocation, Markowitz, regime switching.
JEL classification: G11.
1 Introduction
Hedge funds have experienced explosive growth in recent decades and assets under manage-ment in the global hedge fund industry totalled USD 2.6 trillion in 2013 according to HedgeFund Research. Nonetheless, they needed time to emerge from the shadows and to becomea very attractive asset class in recent decades. The key principles of the first single-hedgefund were introduced by the statistician Karsten in his book Scientific Forecasting publishedin 1931. However, the creation of the first large hedge fund by Jones did not occur until1949. His investment process combined long positions in undervalued stocks and short po-sitions in overvalued ones, adding leverage by financing long positions from short sales andintroducing performance-linked fees (20% of realized profits). It was not until 1966 that anewspaper article written by Loomis described this process and introduced the term hedgefund for the first time (Lhabitant, 2006).
After that, the alternative industry experienced strong growth during the huge bullmarket of the 1950s and 1960s. Caldwell (1995) reports that a 1968 SEC survey found that140 out of 215 investment partnerships were probably hedge funds. Many of the futureindustry leaders started their funds during this period such as Warren Buffett’s Omaha-based Buffett Partnership, the first fund of hedge fund Walter J. Schloss’s WJS Partners
713967B_221076 White Paper N°11.indd 13 18/03/14 11:56
H E D G E F U N D S I N S T R AT E G I C A S S E T A L L O C AT I O N
I S S U E # 1 1 - M A R C H 2 0 1 4L Y X O R R E S E A R C H
<< 14
and the George Soros’ Quantum Fund. Nevertheless, hedge funds went through a difficultperiod from the end of 1960s to the beginning of 1980s. Their popularity revived againin 1986 thanks to an article by Rohrer entitled Institutional Investor. He highlighted theoutperformance of Julian Roberton’s Tiger Fund campared with the S&P 500 over the firstsix years of its existence. Julian Roberton’s investment was based on macroeconomic analysis(occasionally without a hedging policy) and on allocation to financial derivatives such asfutures and options. This strategy is referred to as global macro which had great success inthe late 1980s thanks to the weak US dollar, the rise of equity markets, commodity marketsand interest rates and the fall of bond market.
Then, like most other traditional asset classes, hedge funds were severely hurt by finan-cial crises such as the crash of October 1987, the Gulf war in 1990, the European currencycrisis in 1992 and 1993 or the Mexico crisis in 1994. However, hedge funds recover bet-ter and faster than financial markets as a whole. Thus, during this period, many newstrategies emerged including credit arbitrage, distressed debt, fixed income, quantitative,multi-strategy etc. In addition, many institutional investors such as pension and endow-ment funds began to allocate a greater portion of their portfolios to hedge funds achievingvery attractive performance (Swensen, 2000).
In 1998, the collapse of Long Term Capital Management (LTCM) which was founded byMeriwether and run by future Nobel Laureates Scholes and Merton, represents a landmark inthe evolution of the hedge fund industry. It acted as a wake-up call for all markets regardingthe need for greater transparency and better practices. Hedge funds sharply reduced theirleverage, agreed to provide their investors with greater transparency, and improved their riskmanagement. During the subprime mortgage crisis in 2007 and 2008, despite a double-digitloss for the Credit Suisse/Tremont hedge fund index, hedge funds outperformed the globalequity market. Meanwhile, the fraud by Madoff Investment Securities LLC in 2008 droveregulators to impose a tighter and more stringent regulatory framework requiring extendedhedge fund registration and reporting. Increased regulation aimed at protecting investorsin recent years is seen as boosting investor confidence and adding value to the hedge fundindustry.
Due to their eventful history, hedge funds have become a key investment vehicle inmodern finance. They represent an important financial instrument in the growing alternativeinvestment market. Recently, alternative investments have experienced higher growth thannon-alternative investments. Farrell et al. (2008) show that compound annual growth ratesare 14.2% and 1.9% respectively for alternative investments and non-alternative investmentsfrom 2000 to 2007. Erzan et al. (2012) state that alternative investments have grown fasterthan non-alternatives over the last six years and have surpassed peak 2007 levels. Theyreport that assets under management in hedge funds reached USD 2.25 trillion at the end of2012 and are expected to reach USD 3−4.9 trillion in 2013. They also show that institutionalinvestors expect to increase allocations to hedge funds as well as other alternative classessuch as private equity or real estate.
In spite of major growth in investment in hedge funds and academics’ increasing interestin this subject, there is still much to be done in this area of research. Unlike the case oftraditional assets, few investors have a detailed overview of hedge funds in terms of theirstylized facts, benefits, risks and especially their role in SAA. In this paper, we hope toprovide an overview of these subjects and propose a new hedge fund allocation process inSAA using a regime switching mean-variance model.
713967B_221076 White Paper N°11.indd 14 18/03/14 11:56
H E D G E F U N D S I N S T R AT E G I C A S S E T A L L O C AT I O N
I S S U E # 1 1 - M A R C H 2 0 1 4L Y X O R R E S E A R C H
15 >>
Our paper is organized as follows. In Section 2, we provide an overview of the hedgefund industry. We present different hedge fund databases and study the stylized factsand quantitative classification of hedge funds using the HFR database. Then, we examinedifferent hedge fund investment vehicles in Section 3. In Section 4, we present the benefitsand risks of investing in hedge funds. Section 5 is dedicated to proposing an innovativeapproach to classifying hedge funds as equity/bond substitutes and diversifiers. It thenexamines the SAA in extreme regime and normal regimes using Markowitz’s mean-varianceportfolio selection with regime switching.
2 Hedge fund overview
In what follows, we present the main characteristics of hedge funds. In the first paragraph,we introduce different databases used by investors and academics and their respective clas-sification methods. We then present the basic statistics on HFRI indices and their stylizedfacts such as fat-tail risk, performance persistence, auto-correlation and cross-correlationwith traditional assets. We conclude this section with a quantitative classification.
2.1 Hedge fund databases
Studying the statistics and stylized facts of hedge funds requires the gathering of good in-formation about the hedge fund industry. It is necessary as a minimum to have data on thereturns and the qualitative investment styles of hedge funds. Hedge funds do not have apublic organization which officially collects this type of information. Meanwhile, fund man-agers voluntarily release monthly return information to the specialised databases to whichpractitioners and academics must pay a subscription to gain access rights. The databaseproviders also offer other services like hedge fund indices which are widely used in the in-dustry. However, we must be careful because these databases and their respective indicesdo not exactly represent the whole hedge fund universe. All these databases and indices canbe built according to different methodologies. It is important to highlight existing biasesto be taken into account in statistical analysis before choosing the appropriate database tostudy.
2.1.1 Biases in database construction
In this paragraph, we list different biases in database construction that we have to keep inmind before doing any statistical analysis.
First we look at the selection bias. Hedge funds are private investment solutions andhave no obligation to report their performance. They only have to communicate theirperformance to their own investors. There is no public organization which officially collectsthis type of data. Hedge funds decide for themselves what to communicate in prospectusesand voluntarily provide information about their performance if they need more visibility.Thus, while small funds with good performance are eager to report their performance,bad funds do not want to report their performance since they do not wish to suffer fromcompetition. Moreover, famous large funds with exceptional performance are not interestedin this visibility. As a result, the selection bias is linked to the data sources and may beamplified in the proprietary construction of databases. Indeed, some databases follow certainreporting rules such as minimum assets under management and performance records. The
713967B_221076 White Paper N°11.indd 15 18/03/14 11:56
H E D G E F U N D S I N S T R AT E G I C A S S E T A L L O C AT I O N
I S S U E # 1 1 - M A R C H 2 0 1 4L Y X O R R E S E A R C H
<< 16
lack of representativeness and homogeneity of database construction rules and the selectivereporting rules of some hedge funds lead to partial representation of the whole hedge fundindustry by each database.
Another important bias is the survivorship bias which is often mentioned in many re-search papers. The survivorship bias results from the tendency to exclude “dead funds”from statistical study when their performance is no longer reported. A fund is supposed tobe dead when it is liquidated, closed, merged or simply when it stops reporting. Althoughsome researchers only focus on live funds which are surviving funds on the date of the study,it is biased to analyze the behavior of the whole hedge fund world over a long period byusing live funds. Many studies have been carried out on this subject with the database ofmutual funds or hedge funds (Malkiel, 1995, Elton et al., 1996, Brown and Goetzmann, 1997,Ackermann et al., 1999, Brown et al., 1999, Fung and Hsieh, 2000, Liang, 2000, Agarwal etal., 2013, Aiken et al., 2013).
Hedge fund databases also face a backfill bias. When a hedge fund is added to a database,its manager can choose whether or not to report its returns over the incubation periodprior to the date of submission. Hence, there is a bias resulting from the fact that fundswith satisfying performance over the incubation period report their returns whereas fundswith disappointing performance prefer to provide returns only after the submission date.Moreover, for some hedge funds, there is a time lag between the realisation time and thereporting time. Liang (2000) documents the backfill bias by discovering that the same fundin several databases has not reported its return since the same date. Barry (2003) highlightsdifferent backfill durations in each database.
Finally, since hedge funds often invest in illiquid assets for which market prices are notreadily available, we may face liquidity bias in hedge fund databases due to the smoothing ofprices in the valuation process (Cici et al., 2011). To account for liquidity bias, Getmanskyet al. (2004) propose an approach to uncover the unobserved (“true”) returns which aresupposed to be serially uncorrelated contrary to the serially correlated observed returns.However, Ammann et al. (2011, 2013) investigate liquidity bias but find it to be very small.
2.1.2 Private hedge funds databases and indices
In this paragraph, we present different hedge fund databases. We can find details of variousdatabases in Brooks and Kat (2002) and Lhabitant (2006). Here, we only deal with thedatabases most frequently used by investors and academics. We then compare their differentclassification methods and define the usual hedge fund strategies.
The Hedge Fund Research (HFR) database has reported the performance net of fees ofnearly 7, 000 funds and funds of funds since 1990. It has also built 32 HFRI indices which areequally weighted indices. These HFRI indices aim to reflect the hedge fund industry globallyor by strategies and are widely used by practitioners. The HFRI indices are the most popularindices which benchmark the total hedge funds industry with almost 2, 200 funds (providedby Hedge Fund Research, Inc. in August 2013). HFR also proposes HFRX indices which aredaily investable and transparent indices of the hedge fund industry. Recently, they createdHFRU indices which are benchmarks for UCITS hedge funds.
The TASS or Lipper database contains the performance of 7, 500 live funds and fundsof funds plus more than 11, 000 dead funds. The relative indices are the 14 value-weighted
713967B_221076 White Paper N°11.indd 16 18/03/14 11:56
H E D G E F U N D S I N S T R AT E G I C A S S E T A L L O C AT I O N
I S S U E # 1 1 - M A R C H 2 0 1 4L Y X O R R E S E A R C H
17 >>
CSFB/Tremont indices. They result from the joint venture between Credit Suisse FirstBoston, a leading investment bank, and Tremont Advisor Inc., a financial services companyspecialised in hedge fund consulting. There are 13 indices which correspond to 13 hedge fundstrategies reported in the TASS database. They also propose the Credit Suisse/TremontHedge Fund Index which is a benchmark of the hedge fund industry.
The Morningstar Center for International Securities and Derivatives Markets (CISDM)database has reported the performance of more than 5, 000 live hedge funds, funds of fundsand CTAs since 1994. It was formerly Managed Account Reports (MAR) database whichwas highly recognized by academics. Eleven indices are constructed in this database: CISDMFund of Fund index, eight individual CISDM Hedge Fund Strategy Indices representing themedian performance of relative funds, the CISDM Equal Weighted Hedge Fund Index andCISDM CTA Equal Weighted Index reflecting the average performance of all hedge fundsand CTAs.
The EurekaHedge database was created by ABN Amro and Eurekahedge Fund Advi-sor. This database refers to about 6, 700 funds and 2, 800 funds of funds. Like other dataproviders, they offer a benchmark for the hedge fund industry with the Eureka Hedge FundIndex which is an equally-weighted index. They also build geographical indices for NorthAmerica, Europe, Asia, Latin America and Emerging Markets. More recently, they haveproposed indices for UCITS hedge funds, long-only absolute return funds and funds of funds.
As mentioned above, each data provider is in possession of its own database and itspersonalized benchmarks. Qualitative classification methods vary from one database toanother and depends completely on the interpretation of each data provider. In Table 20in Appendix A, we present strategies and sub-strategies classified in the databases of HFR,TASS, CISDM and Eurekahedge and try to match their classifications for a better overview.All hedge funds are classified in four main strategies: Equity Hedge, Event-Driven, Macroand Relative Value. The Equity Hedge strategy corresponds to an investment strategy withlong and short positions in equity or equity derivatives securities. The Event-Driven strategytakes positions on companies concerned by corporate events. The Macro strategy runs CTAsor applies macroeconomic analysis to take bets on the major risk factors such as currencies,interest rates, stock indices and commodities. The Relative Value strategy is characterizedby the fact that the manager simultaneously purchases a security expected to appreciateand short sells a related security expected to depreciate.
Despite all the biases mentioned above, hedge fund databases provide a remarkable sourceof information to understand the behavior of hedge funds. In what follows, we decide to usethe HFR database in our study which is the most frequently referenced by investors andpractitioners (Jagannathan et al., 2010, Cumming et al., 2012, Joenvaara and Kosowski,2013, etc.).
2.2 Stylized facts of hedge funds
In this section, we present a comprehensive study of the stylized facts of hedge funds usingthe HFR database from January 2000 to June 2013. We provide basic statistics of hedgefund indices and we illustrate the characteristics on hedge funds such as survivorship bias,abnormal distribution and fat-tail risk, performance persistence, auto-correlation and cross-correlation with traditional assets. In what follows, we facilitate notation by using theabbreviations of the hedge fund indices referenced in Table 2.
713967B_221076 White Paper N°11.indd 17 18/03/14 11:56
H E D G E F U N D S I N S T R AT E G I C A S S E T A L L O C AT I O N
I S S U E # 1 1 - M A R C H 2 0 1 4L Y X O R R E S E A R C H
<< 18
Table 2: Abbreviation of hedge fund strategies
Strategy AbbreviationHFRI Fund Weighted Composite Index HFRIEquity Hedge EHEvent-Driven EDMacro MacroRelative Value RVEquity Hedge Equity Market Neutral EH: EMNEquity Hedge Quant. Directional EH: QDEquity Hedge Short Bias EH: SBEquity Hedge Sector Energy Basic Mat EH: S-EBEquity Hedge Sector Tech Health EH: S-THEvent Driven Merger Arbitrage ED: MAEvent Driven Private Issue ED: PIEvent Driven Distressed ED: DISMacro Syst. Diversified ED: SDRelative Value Yield Alternative RV: YARelative Value Fixed Income Asset Backed RV: FI-ABRelative Value Fixed Income Asset Convertible Arbitrage RV: FI-CARelative Value Fixed Income Asset Corporate RV: FI-CRelative Value Multi Strategy RV: MS
2.2.1 Basic statistics of hedge fund indices
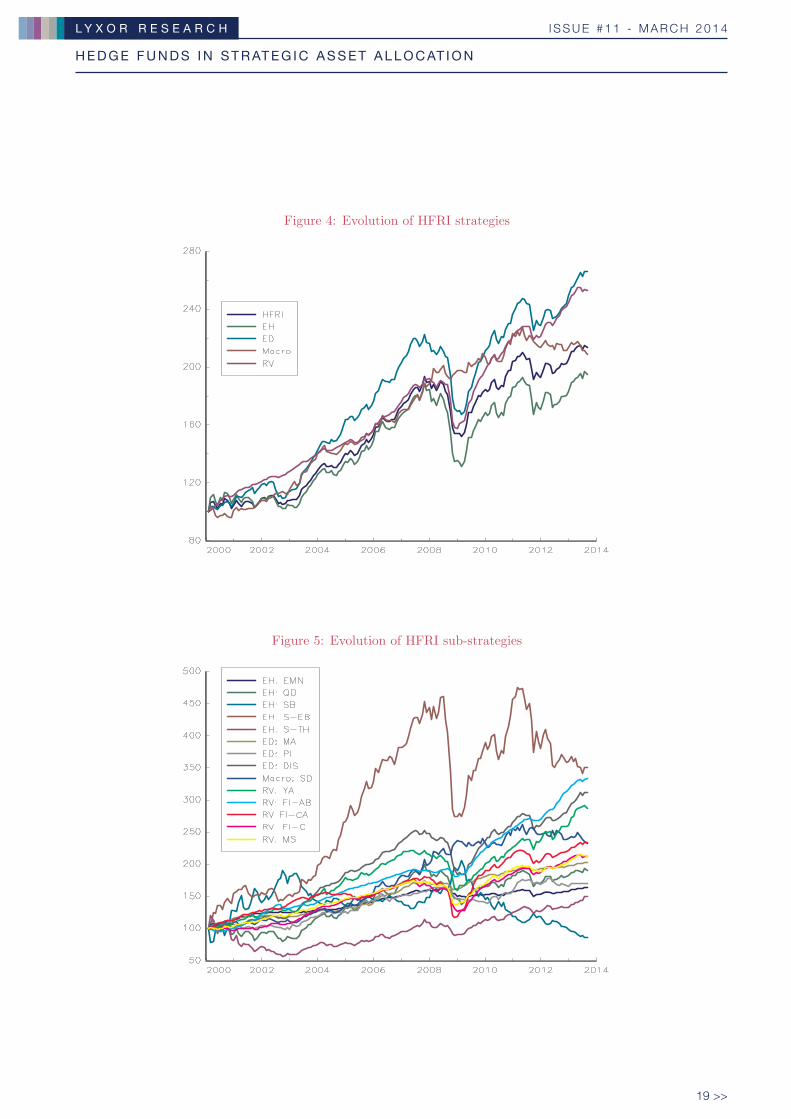
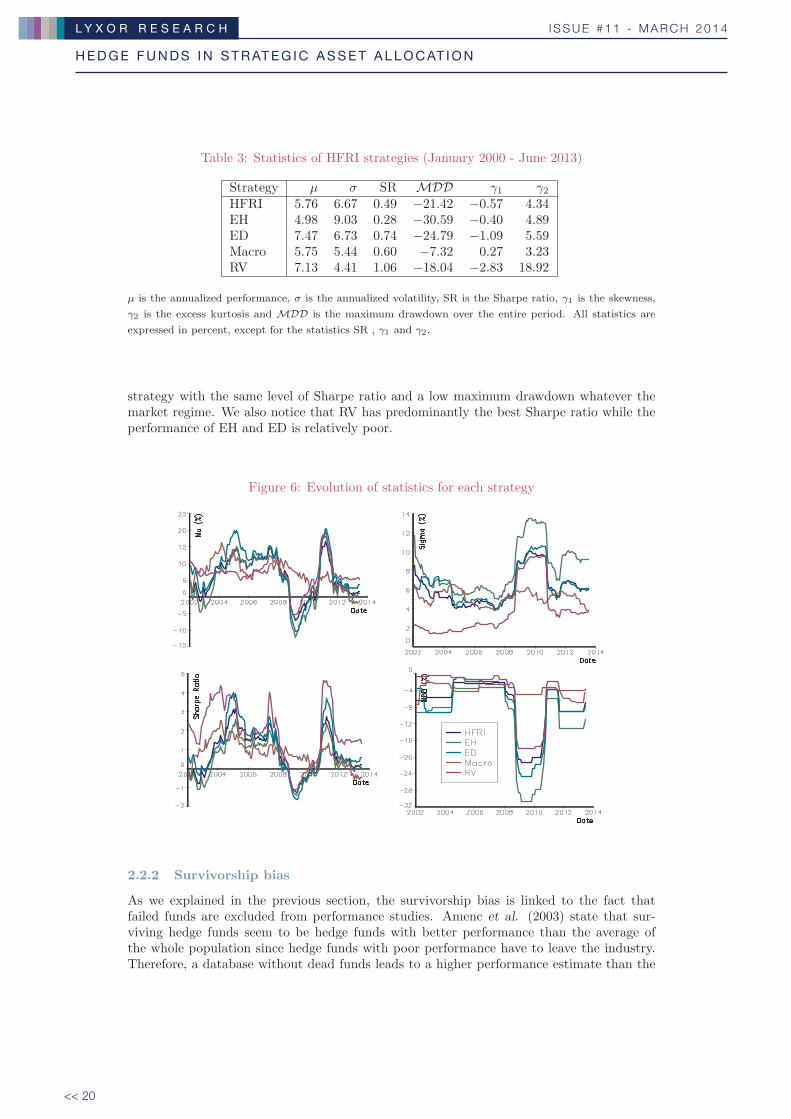
In this paragraph, we give a global view of hedge fund strategies and sub-strategies fromJanuary 2000 to June 2013. In Figure 4, we can see the evolution of the four main strategiesthat we can compare to the HFRI global index. Thus, we notice that the hedge fundstrategies’ good performance continues until the beginning of the subprime crisis. Hedgefunds are then hurt by the crisis like other traditional assets, but they quickly recover from2009 until regaining their highest pre-crisis level at the end of the year 2009. Even if we canhighlight this global hedge fund trend, we also observe some significant differences betweeneach main strategy. This is corroborated by statistics in Table 3 which show that theEH strategy has the highest volatility (9.03%), the most important maximum drawdown(−30.59%) and the lowest Sharpe ratio (0.28) although RV has the lowest volatility (4.41%)and the highest Sharpe ratio (1.06). Macro (including global macro, CTAs etc.) is thestrategy with the lowest maximum drawdown (−7.32%) and low volatility (5.44%). Indeed,we can see in Figure 4 that Macro is the only one which withstands the subprime crisis. Inaddition, ED is the most efficient strategy in our study period with an annual performanceof 7.47%. Heterogeneity between hedge funds is also demonstrated by the evolution ofsub-strategies in Figure 5. It can be explained by the different management styles andthe different underlying assets for different strategies. Indeed, there are lots of differencesbetween EH: S-EB which outperforms all the other sub-strategies and more particularly EH:SB which is the rare underperforming strategy since the subprime crisis. Outperformance bythe EH: S-EB strategy may be driven by exceptional pre-crisis performance and its resistanceto the subprime crisis. The poor performance of the EH: SB strategy may be explained bythe blooming pre-crisis market and the market recovery after 2009.
We also provide an overview of the time dependency of basic statistics in Figure 6 byanalyzing a 24-month rolling window. Thus, we notice that Macro is the most consistent
713967B_221076 White Paper N°11.indd 18 18/03/14 11:56
H E D G E F U N D S I N S T R AT E G I C A S S E T A L L O C AT I O N
I S S U E # 1 1 - M A R C H 2 0 1 4L Y X O R R E S E A R C H
19 >>
Figure 4: Evolution of HFRI strategies
Figure 5: Evolution of HFRI sub-strategies
713967B_221076 White Paper N°11.indd 19 18/03/14 11:56
H E D G E F U N D S I N S T R AT E G I C A S S E T A L L O C AT I O N
I S S U E # 1 1 - M A R C H 2 0 1 4L Y X O R R E S E A R C H
<< 20
Table 3: Statistics of HFRI strategies (January 2000 - June 2013)
Strategy μ σ SR MDD γ1 γ2HFRI 5.76 6.67 0.49 −21.42 −0.57 4.34EH 4.98 9.03 0.28 −30.59 −0.40 4.89ED 7.47 6.73 0.74 −24.79 −1.09 5.59Macro 5.75 5.44 0.60 −7.32 0.27 3.23RV 7.13 4.41 1.06 −18.04 −2.83 18.92
μ is the annualized performance, σ is the annualized volatility, SR is the Sharpe ratio, γ1 is the skewness,
γ2 is the excess kurtosis and MDD is the maximum drawdown over the entire period. All statistics are
expressed in percent, except for the statistics SR , γ1 and γ2.
strategy with the same level of Sharpe ratio and a low maximum drawdown whatever themarket regime. We also notice that RV has predominantly the best Sharpe ratio while theperformance of EH and ED is relatively poor.
Figure 6: Evolution of statistics for each strategy
2.2.2 Survivorship bias
As we explained in the previous section, the survivorship bias is linked to the fact thatfailed funds are excluded from performance studies. Amenc et al. (2003) state that sur-viving hedge funds seem to be hedge funds with better performance than the average ofthe whole population since hedge funds with poor performance have to leave the industry.Therefore, a database without dead funds leads to a higher performance estimate than the
713967B_221076 White Paper N°11.indd 20 18/03/14 11:56
H E D G E F U N D S I N S T R AT E G I C A S S E T A L L O C AT I O N
I S S U E # 1 1 - M A R C H 2 0 1 4L Y X O R R E S E A R C H
21 >>
real performance of the hedge fund industry. It is only recently that a few hedge-funddatabases have maintained historical data on dead funds. It is partly for legal reasons andpartly because the primary users of these databases are investors seeking to evaluate existingmanagers they can invest in. In the case where databases contain dead as well as live funds,studies have concluded that the impact of the survivorship bias can be substantial.
Malkiel (1995) and Elton et al. (1996) estimate the survivorship bias for mutual fundsby comparing the difference between average annual performances of all funds and survivingfunds and discover that the survivorship bias is much higher than estimated by Grinblattand Titman (1989). The survivorship bias in hedge funds is usually higher than in mutualfunds because of the higher turnover rate of hedge funds. Survivorship bias in hedge fundsis studied by Ackermann et al. (1999), Park et al. (1999), Brown et al. (1999) and Fung andHsieh (2000) and is estimated to be around 3% per year. Liang (2000) points out that thedifference in estimated survivorship bias is due to the compositional difference of databasesand different study periods. For example, the TASS database has a higher survivorship biasthan the HFR database because it has a default rate that is higher than HFR’s. Ibbotson etal. (2011) provide a more accurate estimate of survivorship bias of 5.13% per year withoutthe backfill data which confirms the high survivorship observed by Aggarwal and Jorison(2010). Eleanor Xu et al. (2011) study survivorship bias using a database from 1994 to 2009but they do not find survivorship bias to be notably significant during the global financialcrisis.
Survivorship bias makes risk management in hedge funds particularly challenging. Lo(2001) shows that although this ”survivorship bias” may not be too extreme for any givenfund, it affects the entire cross-section of funds and its impact is compounded over time inthe returns of each survivor, hence the end result can be enormous for the unwary investorseeking to construct an optimal portfolio of hedge funds.
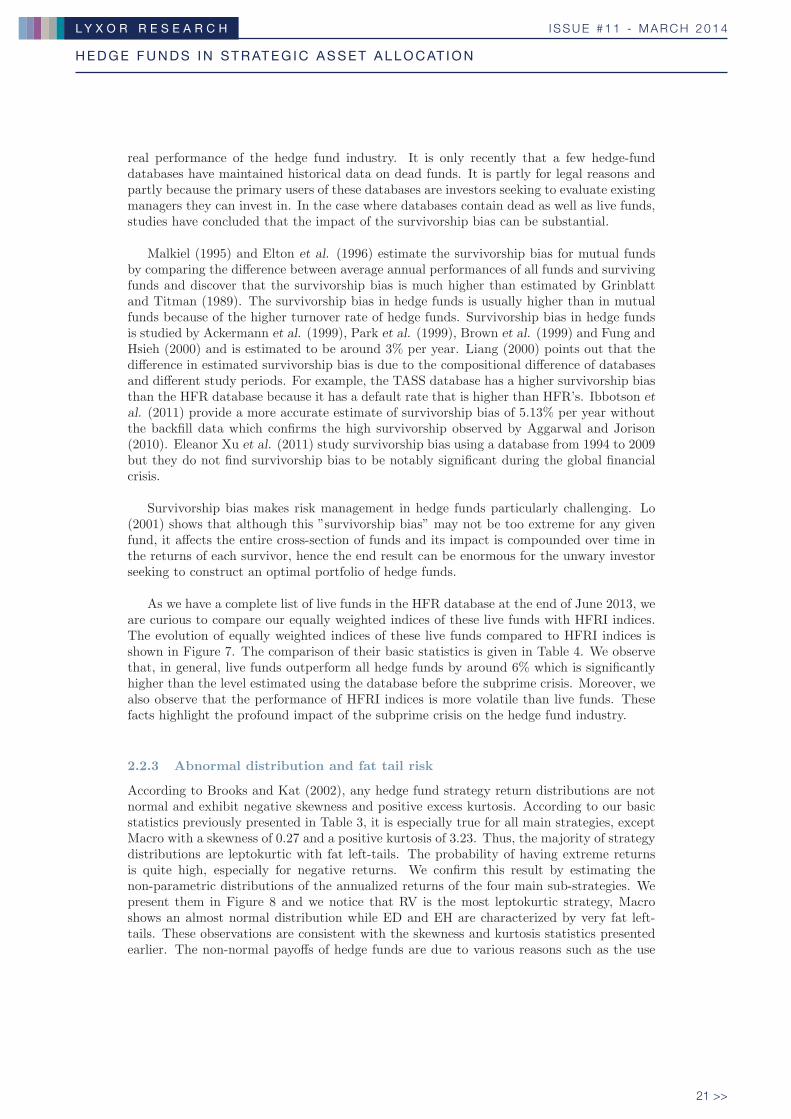
As we have a complete list of live funds in the HFR database at the end of June 2013, weare curious to compare our equally weighted indices of these live funds with HFRI indices.The evolution of equally weighted indices of these live funds compared to HFRI indices isshown in Figure 7. The comparison of their basic statistics is given in Table 4. We observethat, in general, live funds outperform all hedge funds by around 6% which is significantlyhigher than the level estimated using the database before the subprime crisis. Moreover, wealso observe that the performance of HFRI indices is more volatile than live funds. Thesefacts highlight the profound impact of the subprime crisis on the hedge fund industry.
2.2.3 Abnormal distribution and fat tail risk
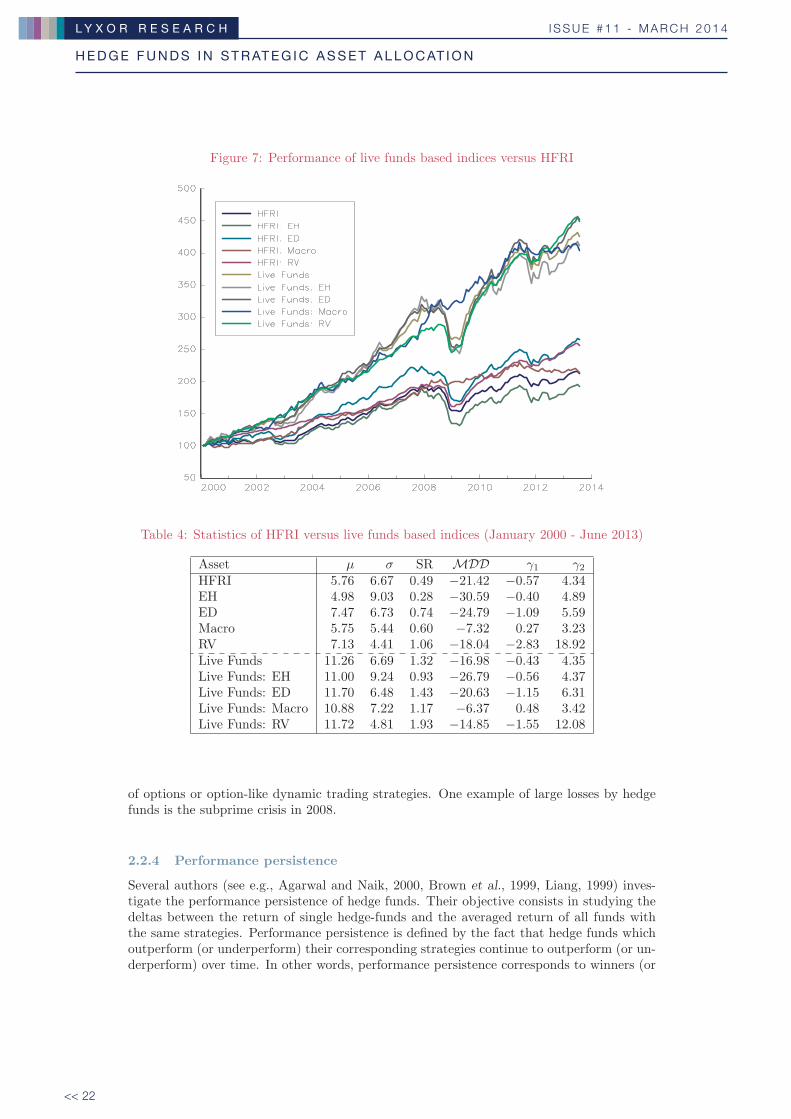
According to Brooks and Kat (2002), any hedge fund strategy return distributions are notnormal and exhibit negative skewness and positive excess kurtosis. According to our basicstatistics previously presented in Table 3, it is especially true for all main strategies, exceptMacro with a skewness of 0.27 and a positive kurtosis of 3.23. Thus, the majority of strategydistributions are leptokurtic with fat left-tails. The probability of having extreme returnsis quite high, especially for negative returns. We confirm this result by estimating thenon-parametric distributions of the annualized returns of the four main sub-strategies. Wepresent them in Figure 8 and we notice that RV is the most leptokurtic strategy, Macroshows an almost normal distribution while ED and EH are characterized by very fat left-tails. These observations are consistent with the skewness and kurtosis statistics presentedearlier. The non-normal payoffs of hedge funds are due to various reasons such as the use
713967B_221076 White Paper N°11.indd 21 18/03/14 11:56
H E D G E F U N D S I N S T R AT E G I C A S S E T A L L O C AT I O N
I S S U E # 1 1 - M A R C H 2 0 1 4L Y X O R R E S E A R C H
<< 22
Figure 7: Performance of live funds based indices versus HFRI
Table 4: Statistics of HFRI versus live funds based indices (January 2000 - June 2013)
Asset μ σ SR MDD γ1 γ2HFRI 5.76 6.67 0.49 −21.42 −0.57 4.34EH 4.98 9.03 0.28 −30.59 −0.40 4.89ED 7.47 6.73 0.74 −24.79 −1.09 5.59Macro 5.75 5.44 0.60 −7.32 0.27 3.23RV 7.13 4.41 1.06 −18.04 −2.83 18.92Live Funds 11.26 6.69 1.32 −16.98 −0.43 4.35Live Funds: EH 11.00 9.24 0.93 −26.79 −0.56 4.37Live Funds: ED 11.70 6.48 1.43 −20.63 −1.15 6.31Live Funds: Macro 10.88 7.22 1.17 −6.37 0.48 3.42Live Funds: RV 11.72 4.81 1.93 −14.85 −1.55 12.08
of options or option-like dynamic trading strategies. One example of large losses by hedgefunds is the subprime crisis in 2008.
2.2.4 Performance persistence
Several authors (see e.g., Agarwal and Naik, 2000, Brown et al., 1999, Liang, 1999) inves-tigate the performance persistence of hedge funds. Their objective consists in studying thedeltas between the return of single hedge-funds and the averaged return of all funds withthe same strategies. Performance persistence is defined by the fact that hedge funds whichoutperform (or underperform) their corresponding strategies continue to outperform (or un-derperform) over time. In other words, performance persistence corresponds to winners (or
713967B_221076 White Paper N°11.indd 22 18/03/14 11:56
H E D G E F U N D S I N S T R AT E G I C A S S E T A L L O C AT I O N
I S S U E # 1 1 - M A R C H 2 0 1 4L Y X O R R E S E A R C H
23 >>
Figure 8: Non-parametric distribution of HFRI strategies
losers) continuing to be winners (resp. losers). According to Agarwal and Naik (2000),performance persistence is higher for losers. Edwards and Caglayan (2001) find evidence ofperformance persistence over one- and two-year horizons among both successful and failedhedge funds by using both non-parametric and parametric tests. This is confirmed by Frenchet al. (2005). Kosowski et al. (2007) and Jagannathan et al. (2010) who also confirm thatthe abnormal performances are not only persistent in the short term but also in the case ofannual horizons.
2.2.5 Auto-correlation
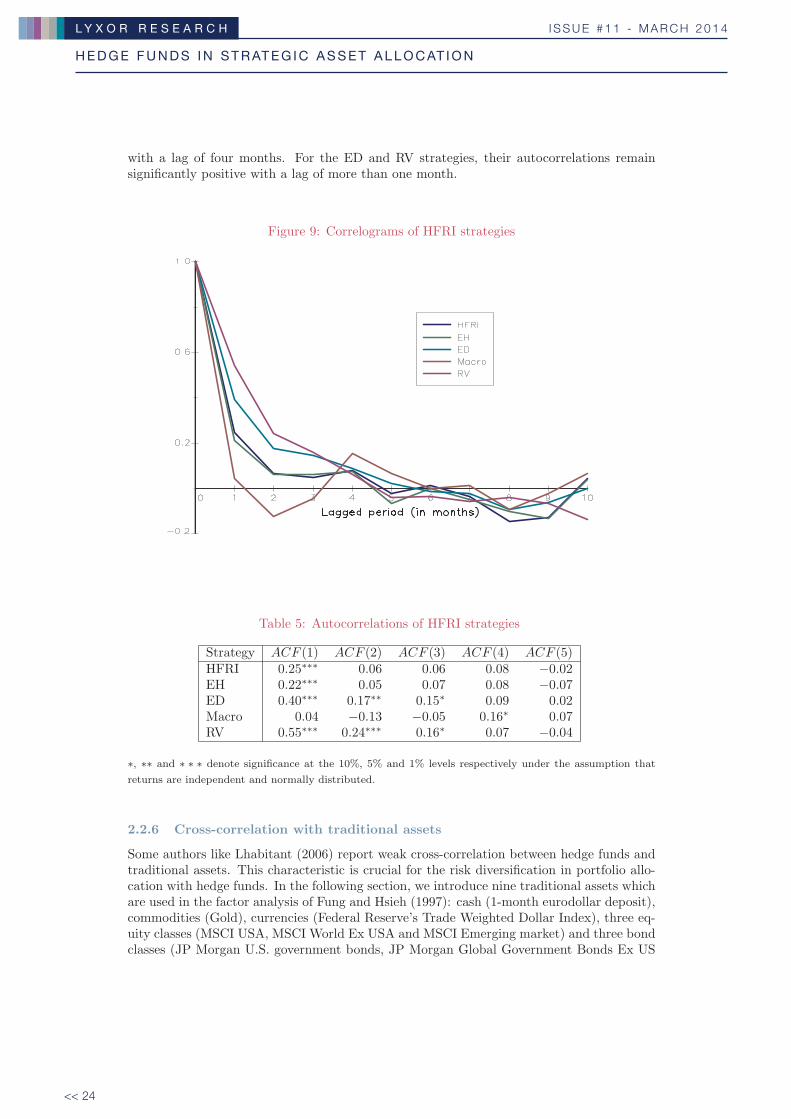
Brooks and Kat (2002) state that the monthly returns of many hedge fund indices exhibithighly significant positive autocorrelation contrary to traditional assets. According to theirstudy, first-order auto-correlation is most apparent for some strategies like Convertible Ar-bitrage and Distressed Securities. They deal with different possible explanations. The firstbut not the most satisfactory one is that hedge fund strategies lead to returns inherently cor-related to those of preceding months. Another more adequate explanation is liquidity bias.As it is difficult to have up-to-date valuations of positions in illiquid securities, hedge fundsmanagers use last reporting valuations or an estimate which lead to lags in the evolution oftheir net asset value.
With our selected HFRI indices, we do the same auto-correlation study. In Figure 9,we present the corresponding correlograms taking into account 1 to 10 months of lag. Tocomplete this figure, we also provide auto-correlation values and their significativeness inTable 5. We observe that autocorrelations with a lag of one month are significantly positiveat the 1% level except for the Macro strategy which exhibits the strongest autocorrelation
713967B_221076 White Paper N°11.indd 23 18/03/14 11:56
H E D G E F U N D S I N S T R AT E G I C A S S E T A L L O C AT I O N
I S S U E # 1 1 - M A R C H 2 0 1 4L Y X O R R E S E A R C H
<< 24
with a lag of four months. For the ED and RV strategies, their autocorrelations remainsignificantly positive with a lag of more than one month.
Figure 9: Correlograms of HFRI strategies
Table 5: Autocorrelations of HFRI strategies
Strategy ACF (1) ACF (2) ACF (3) ACF (4) ACF (5)HFRI 0.25∗∗∗ 0.06 0.06 0.08 −0.02EH 0.22∗∗∗ 0.05 0.07 0.08 −0.07ED 0.40∗∗∗ 0.17∗∗ 0.15∗ 0.09 0.02Macro 0.04 −0.13 −0.05 0.16∗ 0.07RV 0.55∗∗∗ 0.24∗∗∗ 0.16∗ 0.07 −0.04
∗, ∗∗ and ∗ ∗ ∗ denote significance at the 10%, 5% and 1% levels respectively under the assumption that
returns are independent and normally distributed.
2.2.6 Cross-correlation with traditional assets
Some authors like Lhabitant (2006) report weak cross-correlation between hedge funds andtraditional assets. This characteristic is crucial for the risk diversification in portfolio allo-cation with hedge funds. In the following section, we introduce nine traditional assets whichare used in the factor analysis of Fung and Hsieh (1997): cash (1-month eurodollar deposit),commodities (Gold), currencies (Federal Reserve’s Trade Weighted Dollar Index), three eq-uity classes (MSCI USA, MSCI World Ex USA and MSCI Emerging market) and three bondclasses (JP Morgan U.S. government bonds, JP Morgan Global Government Bonds Ex US
713967B_221076 White Paper N°11.indd 24 18/03/14 11:56
H E D G E F U N D S I N S T R AT E G I C A S S E T A L L O C AT I O N
I S S U E # 1 1 - M A R C H 2 0 1 4L Y X O R R E S E A R C H
25 >>
and High Yield US Corporate Bond). To facilitate notation, we use the abbreviations givenin Table 6.
Table 6: Abbreviation of traditional assets
EQ US MSCI USAEQ WLD MSCI WORLD Ex USAEQ EM MSCI EMBD US JPM US GOV BONDBD WLD JPM GLOBAL BOND Ex USHY BOFA US HIGH YIELDUSD US TRADE WEIGHTEDGOLD GSCI GoldEUR 1M US EUROUSD 1M
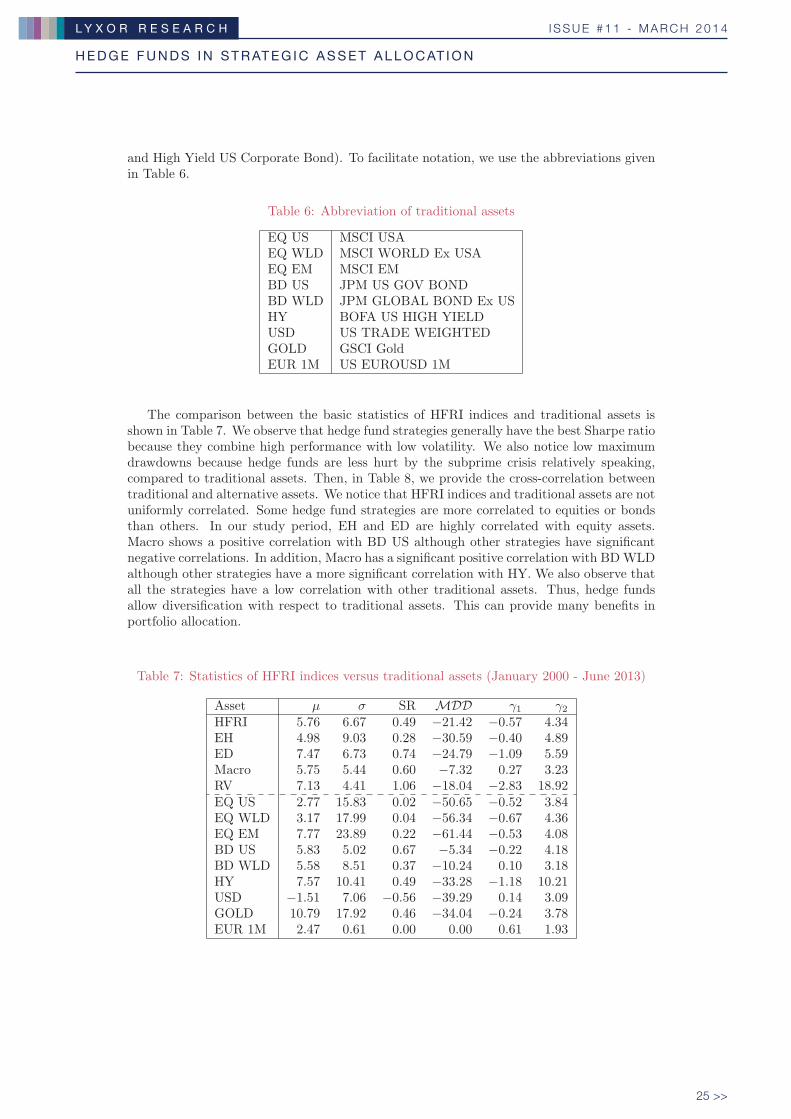
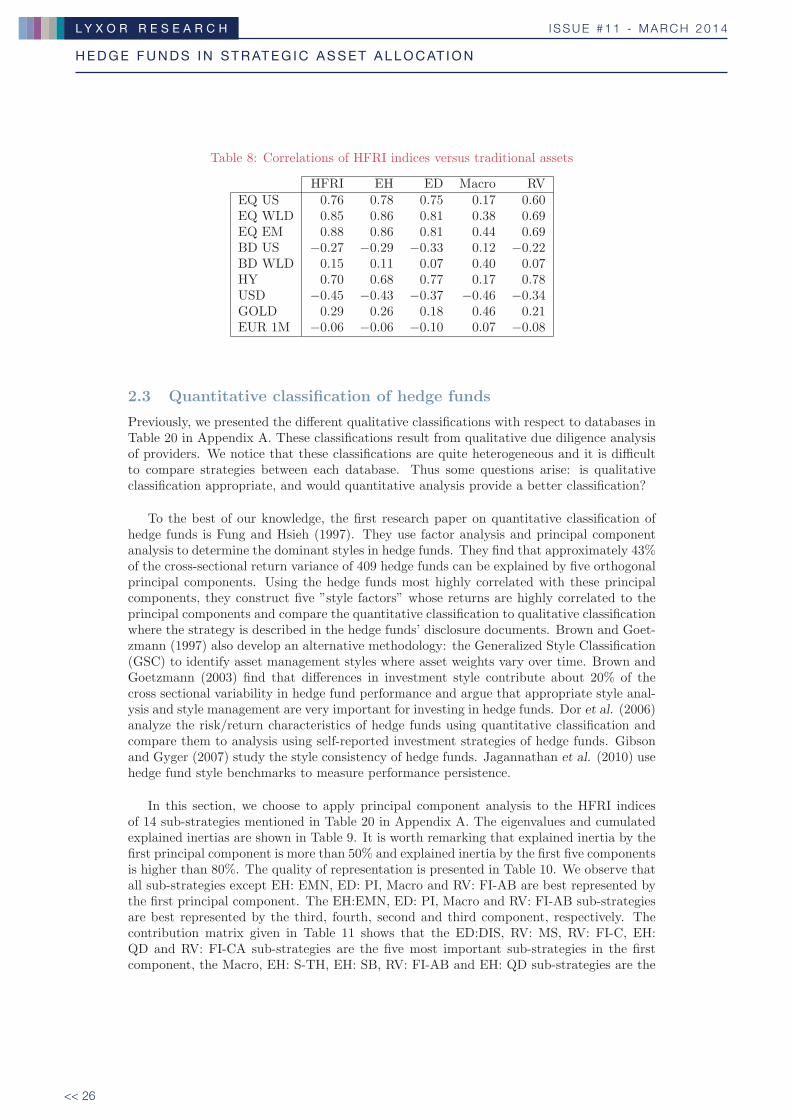
The comparison between the basic statistics of HFRI indices and traditional assets isshown in Table 7. We observe that hedge fund strategies generally have the best Sharpe ratiobecause they combine high performance with low volatility. We also notice low maximumdrawdowns because hedge funds are less hurt by the subprime crisis relatively speaking,compared to traditional assets. Then, in Table 8, we provide the cross-correlation betweentraditional and alternative assets. We notice that HFRI indices and traditional assets are notuniformly correlated. Some hedge fund strategies are more correlated to equities or bondsthan others. In our study period, EH and ED are highly correlated with equity assets.Macro shows a positive correlation with BD US although other strategies have significantnegative correlations. In addition, Macro has a significant positive correlation with BDWLDalthough other strategies have a more significant correlation with HY. We also observe thatall the strategies have a low correlation with other traditional assets. Thus, hedge fundsallow diversification with respect to traditional assets. This can provide many benefits inportfolio allocation.
Table 7: Statistics of HFRI indices versus traditional assets (January 2000 - June 2013)
Asset μ σ SR MDD γ1 γ2HFRI 5.76 6.67 0.49 −21.42 −0.57 4.34EH 4.98 9.03 0.28 −30.59 −0.40 4.89ED 7.47 6.73 0.74 −24.79 −1.09 5.59Macro 5.75 5.44 0.60 −7.32 0.27 3.23RV 7.13 4.41 1.06 −18.04 −2.83 18.92EQ US 2.77 15.83 0.02 −50.65 −0.52 3.84EQ WLD 3.17 17.99 0.04 −56.34 −0.67 4.36EQ EM 7.77 23.89 0.22 −61.44 −0.53 4.08BD US 5.83 5.02 0.67 −5.34 −0.22 4.18BD WLD 5.58 8.51 0.37 −10.24 0.10 3.18HY 7.57 10.41 0.49 −33.28 −1.18 10.21USD −1.51 7.06 −0.56 −39.29 0.14 3.09GOLD 10.79 17.92 0.46 −34.04 −0.24 3.78EUR 1M 2.47 0.61 0.00 0.00 0.61 1.93
713967B_221076 White Paper N°11.indd 25 18/03/14 11:56
H E D G E F U N D S I N S T R AT E G I C A S S E T A L L O C AT I O N
I S S U E # 1 1 - M A R C H 2 0 1 4L Y X O R R E S E A R C H
<< 26
Table 8: Correlations of HFRI indices versus traditional assets
HFRI EH ED Macro RVEQ US 0.76 0.78 0.75 0.17 0.60EQ WLD 0.85 0.86 0.81 0.38 0.69EQ EM 0.88 0.86 0.81 0.44 0.69BD US −0.27 −0.29 −0.33 0.12 −0.22BD WLD 0.15 0.11 0.07 0.40 0.07HY 0.70 0.68 0.77 0.17 0.78USD −0.45 −0.43 −0.37 −0.46 −0.34GOLD 0.29 0.26 0.18 0.46 0.21EUR 1M −0.06 −0.06 −0.10 0.07 −0.08
2.3 Quantitative classification of hedge funds
Previously, we presented the different qualitative classifications with respect to databases inTable 20 in Appendix A. These classifications result from qualitative due diligence analysisof providers. We notice that these classifications are quite heterogeneous and it is difficultto compare strategies between each database. Thus some questions arise: is qualitativeclassification appropriate, and would quantitative analysis provide a better classification?
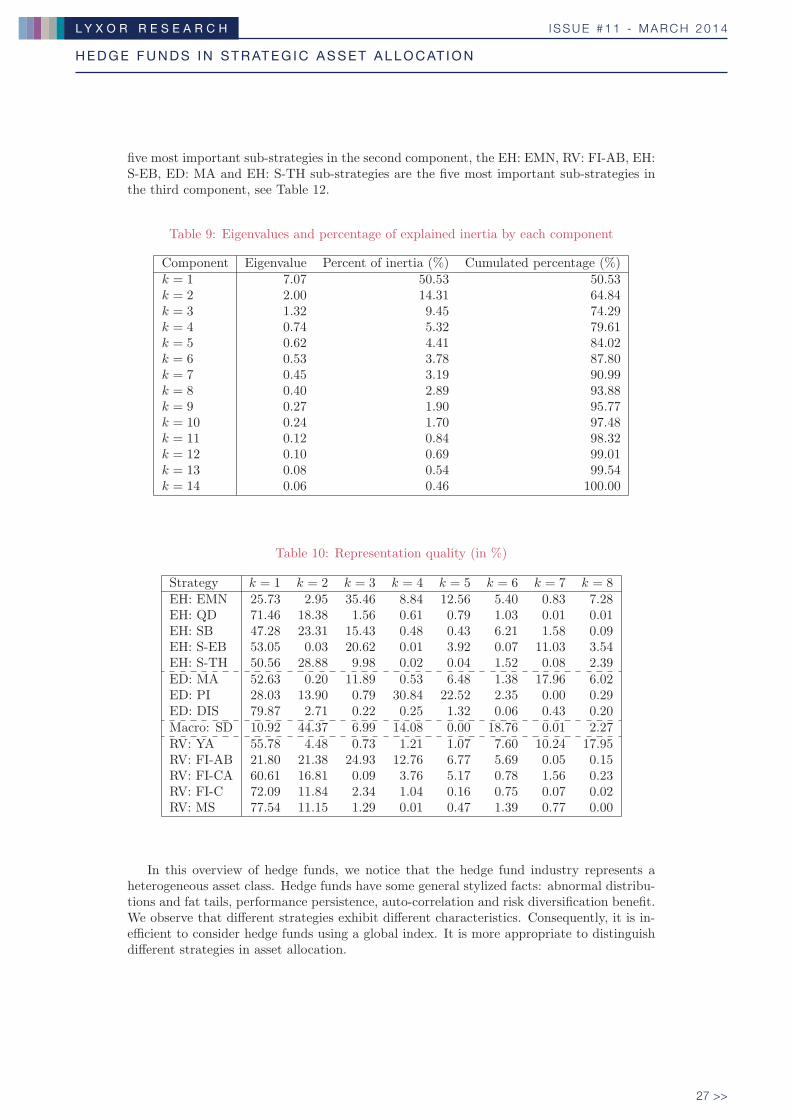
To the best of our knowledge, the first research paper on quantitative classification ofhedge funds is Fung and Hsieh (1997). They use factor analysis and principal componentanalysis to determine the dominant styles in hedge funds. They find that approximately 43%of the cross-sectional return variance of 409 hedge funds can be explained by five orthogonalprincipal components. Using the hedge funds most highly correlated with these principalcomponents, they construct five ”style factors” whose returns are highly correlated to theprincipal components and compare the quantitative classification to qualitative classificationwhere the strategy is described in the hedge funds’ disclosure documents. Brown and Goet-zmann (1997) also develop an alternative methodology: the Generalized Style Classification(GSC) to identify asset management styles where asset weights vary over time. Brown andGoetzmann (2003) find that differences in investment style contribute about 20% of thecross sectional variability in hedge fund performance and argue that appropriate style anal-ysis and style management are very important for investing in hedge funds. Dor et al. (2006)analyze the risk/return characteristics of hedge funds using quantitative classification andcompare them to analysis using self-reported investment strategies of hedge funds. Gibsonand Gyger (2007) study the style consistency of hedge funds. Jagannathan et al. (2010) usehedge fund style benchmarks to measure performance persistence.
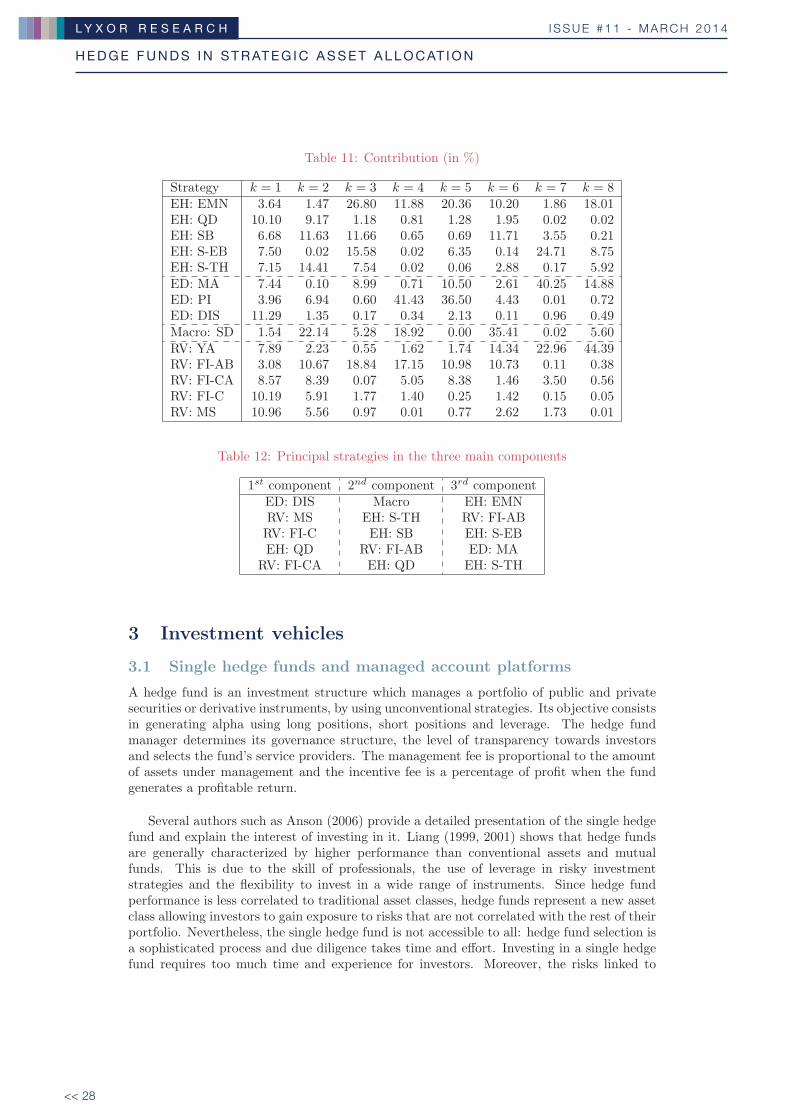
In this section, we choose to apply principal component analysis to the HFRI indicesof 14 sub-strategies mentioned in Table 20 in Appendix A. The eigenvalues and cumulatedexplained inertias are shown in Table 9. It is worth remarking that explained inertia by thefirst principal component is more than 50% and explained inertia by the first five componentsis higher than 80%. The quality of representation is presented in Table 10. We observe thatall sub-strategies except EH: EMN, ED: PI, Macro and RV: FI-AB are best represented bythe first principal component. The EH:EMN, ED: PI, Macro and RV: FI-AB sub-strategiesare best represented by the third, fourth, second and third component, respectively. Thecontribution matrix given in Table 11 shows that the ED:DIS, RV: MS, RV: FI-C, EH:QD and RV: FI-CA sub-strategies are the five most important sub-strategies in the firstcomponent, the Macro, EH: S-TH, EH: SB, RV: FI-AB and EH: QD sub-strategies are the
713967B_221076 White Paper N°11.indd 26 18/03/14 11:56
H E D G E F U N D S I N S T R AT E G I C A S S E T A L L O C AT I O N
I S S U E # 1 1 - M A R C H 2 0 1 4L Y X O R R E S E A R C H
27 >>
five most important sub-strategies in the second component, the EH: EMN, RV: FI-AB, EH:S-EB, ED: MA and EH: S-TH sub-strategies are the five most important sub-strategies inthe third component, see Table 12.
Table 9: Eigenvalues and percentage of explained inertia by each component
Component Eigenvalue Percent of inertia (%) Cumulated percentage (%)k = 1 7.07 50.53 50.53k = 2 2.00 14.31 64.84k = 3 1.32 9.45 74.29k = 4 0.74 5.32 79.61k = 5 0.62 4.41 84.02k = 6 0.53 3.78 87.80k = 7 0.45 3.19 90.99k = 8 0.40 2.89 93.88k = 9 0.27 1.90 95.77k = 10 0.24 1.70 97.48k = 11 0.12 0.84 98.32k = 12 0.10 0.69 99.01k = 13 0.08 0.54 99.54k = 14 0.06 0.46 100.00
Table 10: Representation quality (in %)
Strategy k = 1 k = 2 k = 3 k = 4 k = 5 k = 6 k = 7 k = 8EH: EMN 25.73 2.95 35.46 8.84 12.56 5.40 0.83 7.28EH: QD 71.46 18.38 1.56 0.61 0.79 1.03 0.01 0.01EH: SB 47.28 23.31 15.43 0.48 0.43 6.21 1.58 0.09EH: S-EB 53.05 0.03 20.62 0.01 3.92 0.07 11.03 3.54EH: S-TH 50.56 28.88 9.98 0.02 0.04 1.52 0.08 2.39ED: MA 52.63 0.20 11.89 0.53 6.48 1.38 17.96 6.02ED: PI 28.03 13.90 0.79 30.84 22.52 2.35 0.00 0.29ED: DIS 79.87 2.71 0.22 0.25 1.32 0.06 0.43 0.20Macro: SD 10.92 44.37 6.99 14.08 0.00 18.76 0.01 2.27RV: YA 55.78 4.48 0.73 1.21 1.07 7.60 10.24 17.95RV: FI-AB 21.80 21.38 24.93 12.76 6.77 5.69 0.05 0.15RV: FI-CA 60.61 16.81 0.09 3.76 5.17 0.78 1.56 0.23RV: FI-C 72.09 11.84 2.34 1.04 0.16 0.75 0.07 0.02RV: MS 77.54 11.15 1.29 0.01 0.47 1.39 0.77 0.00
In this overview of hedge funds, we notice that the hedge fund industry represents aheterogeneous asset class. Hedge funds have some general stylized facts: abnormal distribu-tions and fat tails, performance persistence, auto-correlation and risk diversification benefit.We observe that different strategies exhibit different characteristics. Consequently, it is in-efficient to consider hedge funds using a global index. It is more appropriate to distinguishdifferent strategies in asset allocation.
713967B_221076 White Paper N°11.indd 27 18/03/14 11:56
H E D G E F U N D S I N S T R AT E G I C A S S E T A L L O C AT I O N
I S S U E # 1 1 - M A R C H 2 0 1 4L Y X O R R E S E A R C H
<< 28
Table 11: Contribution (in %)
Strategy k = 1 k = 2 k = 3 k = 4 k = 5 k = 6 k = 7 k = 8EH: EMN 3.64 1.47 26.80 11.88 20.36 10.20 1.86 18.01EH: QD 10.10 9.17 1.18 0.81 1.28 1.95 0.02 0.02EH: SB 6.68 11.63 11.66 0.65 0.69 11.71 3.55 0.21EH: S-EB 7.50 0.02 15.58 0.02 6.35 0.14 24.71 8.75EH: S-TH 7.15 14.41 7.54 0.02 0.06 2.88 0.17 5.92ED: MA 7.44 0.10 8.99 0.71 10.50 2.61 40.25 14.88ED: PI 3.96 6.94 0.60 41.43 36.50 4.43 0.01 0.72ED: DIS 11.29 1.35 0.17 0.34 2.13 0.11 0.96 0.49Macro: SD 1.54 22.14 5.28 18.92 0.00 35.41 0.02 5.60RV: YA 7.89 2.23 0.55 1.62 1.74 14.34 22.96 44.39RV: FI-AB 3.08 10.67 18.84 17.15 10.98 10.73 0.11 0.38RV: FI-CA 8.57 8.39 0.07 5.05 8.38 1.46 3.50 0.56RV: FI-C 10.19 5.91 1.77 1.40 0.25 1.42 0.15 0.05RV: MS 10.96 5.56 0.97 0.01 0.77 2.62 1.73 0.01
Table 12: Principal strategies in the three main components
1st component 2nd component 3rd componentED: DIS Macro EH: EMNRV: MS EH: S-TH RV: FI-ABRV: FI-C EH: SB EH: S-EBEH: QD RV: FI-AB ED: MA
RV: FI-CA EH: QD EH: S-TH
3 Investment vehicles
3.1 Single hedge funds and managed account platforms
A hedge fund is an investment structure which manages a portfolio of public and privatesecurities or derivative instruments, by using unconventional strategies. Its objective consistsin generating alpha using long positions, short positions and leverage. The hedge fundmanager determines its governance structure, the level of transparency towards investorsand selects the fund’s service providers. The management fee is proportional to the amountof assets under management and the incentive fee is a percentage of profit when the fundgenerates a profitable return.
Several authors such as Anson (2006) provide a detailed presentation of the single hedgefund and explain the interest of investing in it. Liang (1999, 2001) shows that hedge fundsare generally characterized by higher performance than conventional assets and mutualfunds. This is due to the skill of professionals, the use of leverage in risky investmentstrategies and the flexibility to invest in a wide range of instruments. Since hedge fundperformance is less correlated to traditional asset classes, hedge funds represent a new assetclass allowing investors to gain exposure to risks that are not correlated with the rest of theirportfolio. Nevertheless, the single hedge fund is not accessible to all: hedge fund selection isa sophisticated process and due diligence takes time and effort. Investing in a single hedgefund requires too much time and experience for investors. Moreover, the risks linked to
713967B_221076 White Paper N°11.indd 28 18/03/14 11:56
H E D G E F U N D S I N S T R AT E G I C A S S E T A L L O C AT I O N
I S S U E # 1 1 - M A R C H 2 0 1 4L Y X O R R E S E A R C H
29 >>
hedge funds cover not only traditional risks but also management risk or transparency risk.We can find many studies on these specific risks of hedge funds, for example, Boyson (2003),Foster and Young (2008, 2010).
Remark 1 Investors can invest in exchange quoted hedge fund companies to benefit fromhedge fund performance. Apart from Man Group quoted on the London Stock Exchange since1994, more hedge funds have been quoted on stock exchanges since October 2006, firstly inthe Netherlands, then in the UK and the USA in 2007. The largest funds such as BrevanHoward, Winton Capital, Polygon and Och-Ziff are quoted on stock exchanges based on afraction ranging from 10% to 30% of their capital, see (Teıletche, 2010).
To facilitate the investment in hedge funds, some companies provide investors with amanaged account platform which is an investment structure run by the sponsor (includingthe managed account provider, client and independent board of directors) to manage assetsby using transparent hedge fund exposures. The managed account can be fully customizedto the sponsors’ specific needs and restrictions. All operational aspects are handled by theservice providers chosen by the sponsor of the managed account. The managers are restrictedto managing the investor’s assets with the selected hedge funds. The sponsor chooses in-dependent third-party providers to carry out certain operational tasks such as valuation oraccounting services and is responsible for the operational oversight of the managed account(e.g. risk management, monitoring investment limits, cash management, reporting, legal,compliance, tax, etc.).
Managed accounts have gained great popularity over the last decade or so. The ap-peal of managed accounts lies in easier access to professional managers, a higher degree ofcustomization, better liquidity, greater transparency, more tax efficiencies and stronger anti-fraud ability than single hedge funds. Giraud (2005) argues that, thanks to independentvaluation and risk monitoring, managed account platforms offer a higher level of protec-tion against potential fraudulent activities within a hedge fund structured around a privatepartnership.
3.2 Funds of hedge funds and multi-strategy funds
A fund of hedge funds is an investment vehicle with exposures in several different hedgefunds. Its objective consists in capturing the performance of the hedge fund industry whilehaving better risk diversification than a single hedge fund. To do this, the fund of hedge fundmanager manages the selection of single hedge funds, portfolio construction and portfoliomanagement.
The added value of funds of hedge funds is the selection process used by single hedgefund managers which enables investors to achieve good performance with diversified risks.Due diligence and analysis of risks, correlations and behaviors are essential for the selectionprocess. Liang (1999) argues that funds of hedge funds offer investors greater returns thanmutual funds. Lamm (1999) shows that adding hedge funds to conventional portfoliossignificantly improves a portfolio’s risk-adjusted return performance via diversification andlow correlation with other asset classes. They state that portfolios of hedge funds are inreality a conservative investment and can replace bonds and cash as a defensive vehicle whenequity prices decline. Gregoriou and Rouah (2002) outline the benefits of including hedgefunds and funds of hedge funds in pension fund portfolios.
713967B_221076 White Paper N°11.indd 29 18/03/14 11:56
H E D G E F U N D S I N S T R AT E G I C A S S E T A L L O C AT I O N
I S S U E # 1 1 - M A R C H 2 0 1 4L Y X O R R E S E A R C H
<< 30
A specific fund of hedge funds is the investable hedge fund index fund which selects fundsto deliver the performance of the reference hedge fund index. To construct an investable andliquid index, hedge funds must agree to accept the terms including provisions for redemptionsthat some managers may consider too onerous to be acceptable. Hence, investable hedgefund indices do not represent the total universe of hedge funds.
Recently, some debates has occured on the representability and the eligibility for UCITSIII of investable hedge fund indices. Amenc and Martellini (2003) provide detailed evidenceof strong heterogeneity in the information conveyed by competing indices and attempt toprovide remedies to the problem suggesting a methodology designed to help build a ”purestyle index” or ”index of the indices” for a given style. Martellini et al. (2004) borrowthe concept of factor replicating portfolios from asset pricing literature and apply it to thebenchmarking of hedge fund style returns. Their results suggest that it is actually possibleto construct representative investable indices based on a limited number of funds, exceptperhaps in the case of Equity Market Neutral strategy. Lhabitant (2006) argues that ex-isting investable hedge fund indices are fundamentally different from indices of traditionalassets and they do not fulfil the three basic criteria required to become UCITS III eligible -sufficient diversification, ability to serve as an adequate benchmark and appropriate publi-cation, hence, he suggests excluding existing hedge fund indices from the list of UCITS IIIeligible assets.
In spite of scepticism about their representability, investable hedge fund indices havegrown in numbers over the recent years and are widely available through a number ofproviders, for example, HFR, S&P, FTSE, Dow Jones Credit Suisse (former CS/Tremont),MSCI, etc. Lhabitant (2006) states that assets linked to investable hedge fund indicesexceeded USD 12 billion in 2006. Credit Suisse reports that aggregate assets under man-agement of its investable hedge fund indices totalled to approximately USD 55 billion onAugust 1, 2003.
The fund of hedge funds can be also regarded as a multi-manager fund which mayinvest in a single strategy or multi-strategies. There are also multi-strategy funds whichare special single hedge funds diversifying risks in different strategies and often differentportfolio managers. Normally, multi-strategy funds cost slightly less than funds of hedgefunds but offer less flexibility in portfolio allocation.
3.3 Hedge fund indices replicators
Instead of reflecting the performance of actual hedge fund indices with the most represen-tative exposures, a hedge fund indices replicator uses the statistical approach to replicatehedge fund indices using various investable financial assets. This method makes the indexinvestable and the replicated portfolio can in principle be very representative. A hedgefund indices replicator is built on the research of Hasanhodzic and Lo (2007) who argue thepossibility of creating passive replicating portfolios or clones using liquid exchange-tradedinstruments that provide similar risk exposures at lower cost but greater transparency.
In contrast to traditional investments such as stocks and bonds, hedge-fund returns havemore complex risk exposures that yield additional and complementary sources of risk pre-mium. Amenc et al. (2007) suggest that it is only through the introduction of new adaptedeconometric techniques allowing for a parsimonious statistical estimation of the dynamicand/or non-linear functions relating underlying factors to hedge fund returns that hedge
713967B_221076 White Paper N°11.indd 30 18/03/14 11:56
H E D G E F U N D S I N S T R AT E G I C A S S E T A L L O C AT I O N
I S S U E # 1 1 - M A R C H 2 0 1 4L Y X O R R E S E A R C H
31 >>
fund replication could be turned from an attractive concept into a workable investmentsolution. Amenc et al. (2009) find that going beyond the linear case does not necessarily en-hance replication power and confirm the findings in Hasanhodzic and Lo (2007) who explainthat the performance of the replicating strategies is systematically inferior to that of the ac-tual hedge funds. Giamouridis and Vrontos (2007) find that dynamic covariance/correlationmodels construct portfolios with lower risk and higher out-of-sample risk-adjusted realizedreturn. Roncalli and Teıletche (2007) investigate the implications of substituting standardrolling-window regressions, which appear ad-hoc, with more efficient methodologies such asKalman filter. They show that shortfall risk seems less important than with hedge fundindices and regression-based-trackers and propose a new breakdown of hedge fund perfor-mance into alpha, traditional beta and alternative beta. Cazalet and Roncalli (2011) studythe application of shrinkage methods to improve hedge fund replication.
4 Benefits and risks of hedge funds investments
Hedge funds are entering the mainstream because they introduce a compelling new money-management paradigm which is embraced by many investors. Investors can gain manybenefits from hedge funds that traditional assets cannot offer, for example, significant risk-adjusted return, diversification of risks and better resistance to market environments. Nev-ertheless, we should be aware of the specific risks related to hedge funds investing includingmarket risk or management risk.
4.1 Benefits of hedge funds investments
4.1.1 Significant risk-adjusted return
Investors are always curious about whether hedge funds can offer significant positive returns.In order to answer this question, researchers apply different methods to look into the risk-adjusted return of hedge funds. Ackermann et al. (1999) first use a single-factor modelto estimate the alpha. They study a large data sample from 1988 to 1995 and find thathedge funds consistently outperform mutual funds. Edwards and Caglayan (2001) run amulti-factor model to estimate the risk-adjusted excess returns of hedge funds. By studyinga sample of hedge funds during the 1990-1998 period, they find that hedge funds on averagehave significantly positive excess returns equalling 8.52% annually and these returns have aclose relationship with the type of hedge fund strategies.
Fung and Hsieh (1997) explain that hedge funds often use derivatives and follow dynamictrading strategies. Therefore, the traditional linear method may offer limited help withestimating the performance of hedge funds. In recent studies, researchers begin to includenon-linear exposure to standard asset classes in new models. Fung and Hsieh (2004) use anABS (Asset-Based Style) model similar to the APT (Arbitrage Pricing Theory) risk-factormodel to study the performance of hedge funds. In the ABS model, three trend-followingrisk factors, two equity-oriented risk factors and two bond-oriented risk factors have beenidentified 3. They find that these seven hedge fund risk factors can explain the systematic riskof hedge funds more meaningfully than the traditional linear regression model. In order toinvestigate two major market shocks: the LTCM debacle (September 1998) and the Internet
3According to the recent research of David A. Hsieh, he adds MSCI emerging market index as theemerging market risk factor in the model.
713967B_221076 White Paper N°11.indd 31 18/03/14 11:56
H E D G E F U N D S I N S T R AT E G I C A S S E T A L L O C AT I O N
I S S U E # 1 1 - M A R C H 2 0 1 4L Y X O R R E S E A R C H
<< 32
bubble (March 2000), they split the data period into 3 subperiods: Jan 1994-Sep 1998,Apr 2000-Dec 2002 and Jan 1994-Dec 2002, and find that three hedge fund indices (HFRI,TASSAVG, MSCI) exhibit significant alpha for all sub-periods. Ammann et al. (2011)propose a factor model whose risk factors are selected using a stepwise regression approachand compare it to the factor model proposed by Fung and Hsieh (2004). They estimatethe alpha of hedge funds using a rolling-window regression approach with the Lipper/TASSdatabase over the 1994-2008 period but they do not systematically find the decreasing alphaof hedge funds over time which is reported by Fung et al. (2008) and Zhong (2008) over the1994-2004 period.
In order to solve the difficulties in evaluating the significance and persistence of hedgefund returns, Kosowski et al. (2006) employ a robust bootstrap method and Bayesianapproach which were applied by Busse and Irvine (2006) to mutual funds in order to estimatethe performance of hedge funds. They confirm that the abnormal performance of top hedgefunds cannot be attributed to luck and that abnormal hedge fund performance persists atannual horizons.
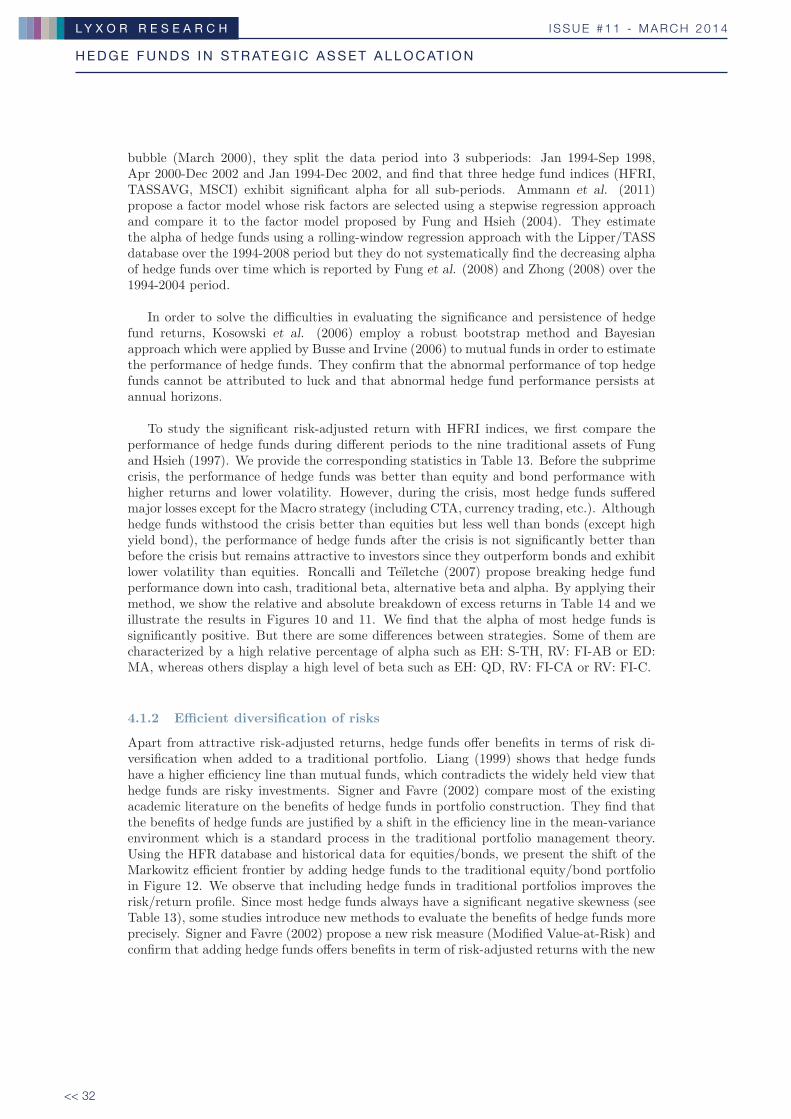
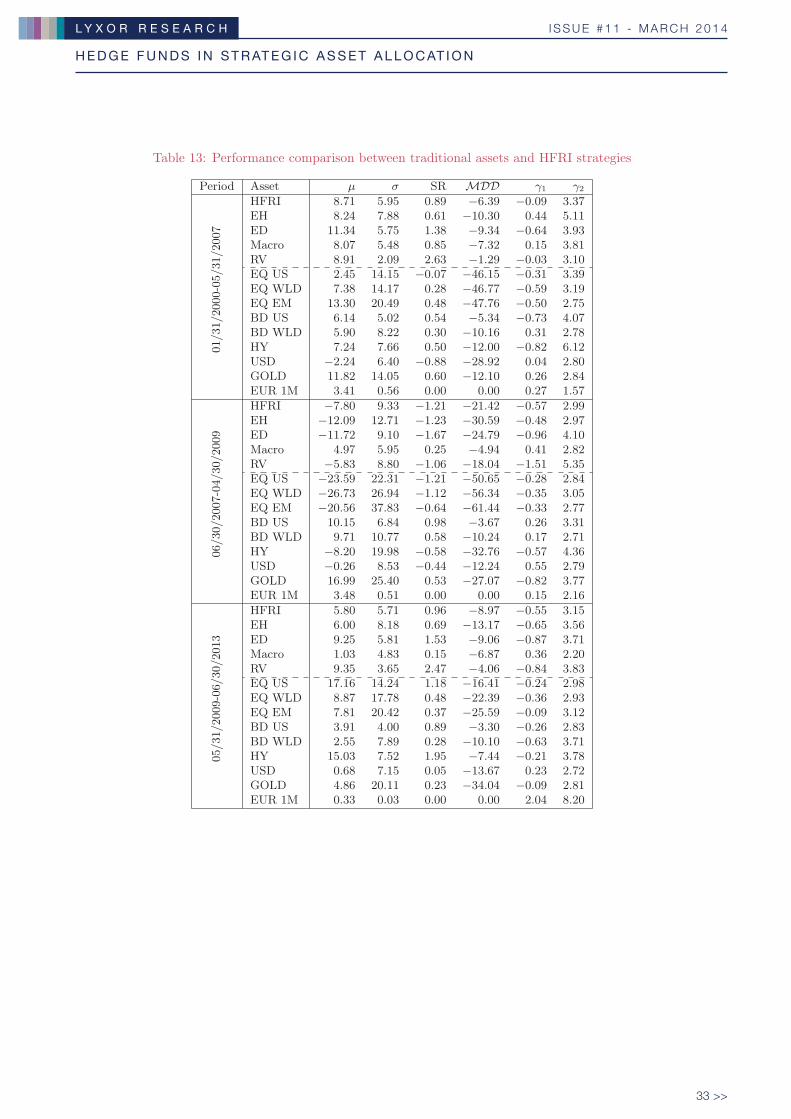
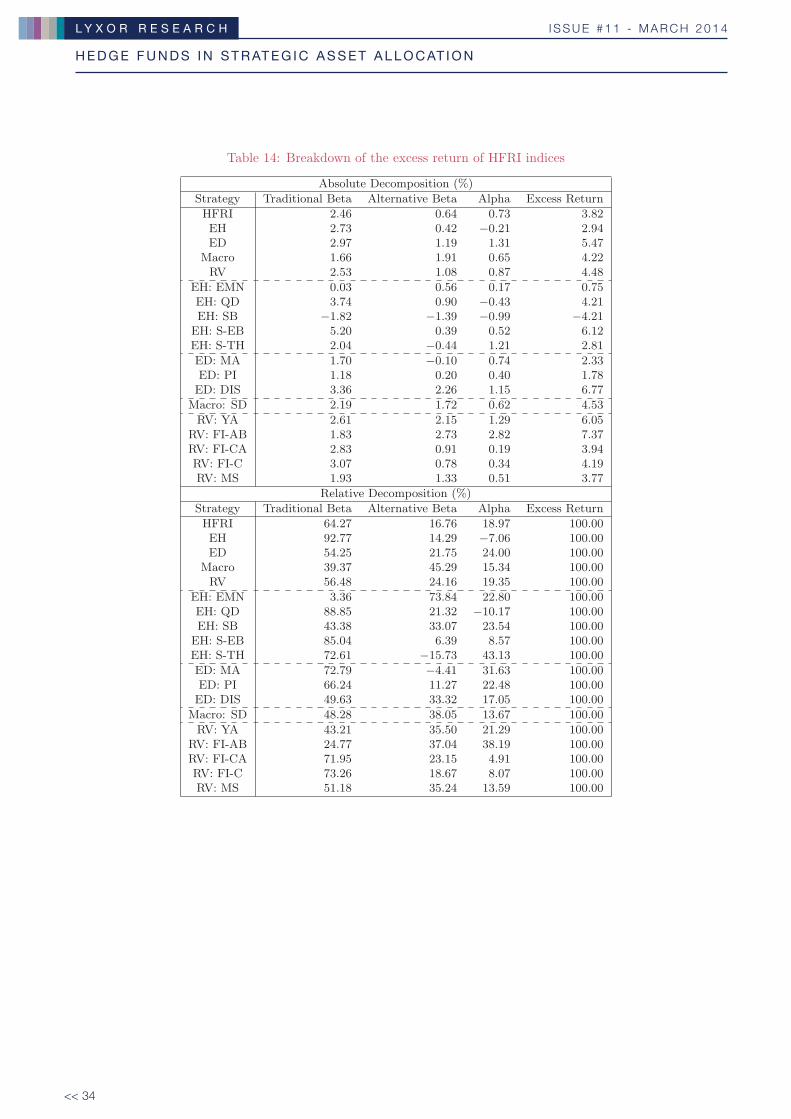
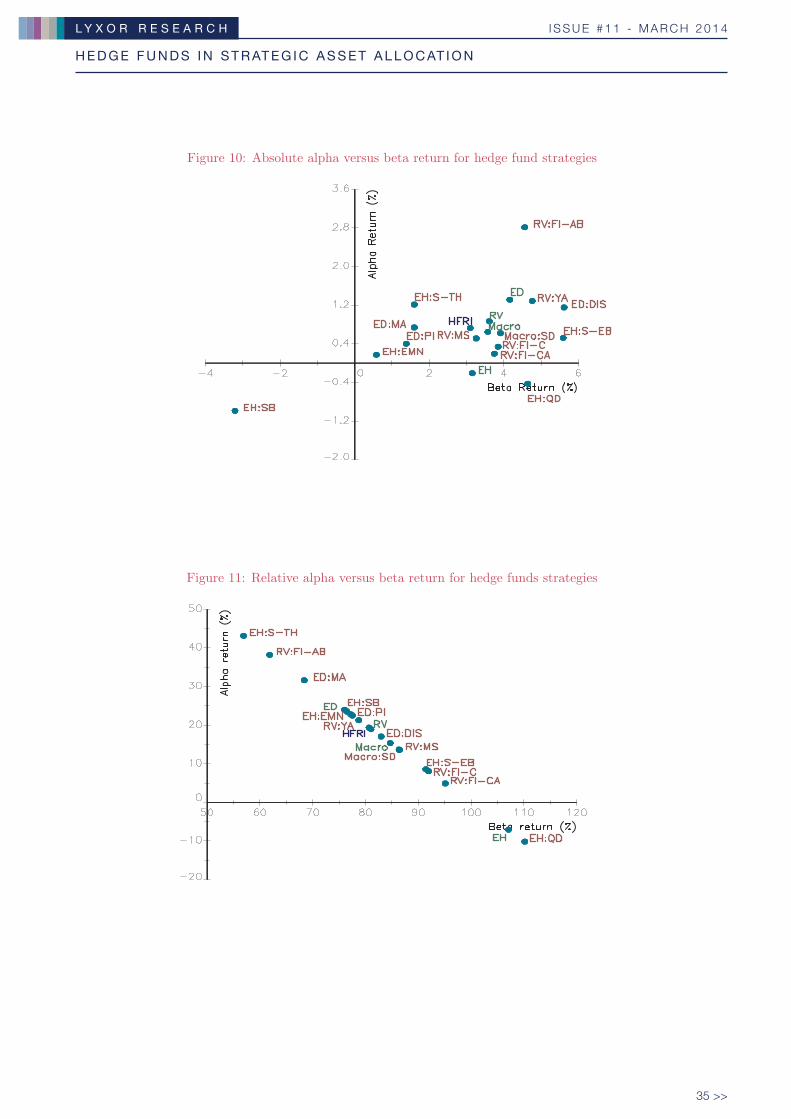
To study the significant risk-adjusted return with HFRI indices, we first compare theperformance of hedge funds during different periods to the nine traditional assets of Fungand Hsieh (1997). We provide the corresponding statistics in Table 13. Before the subprimecrisis, the performance of hedge funds was better than equity and bond performance withhigher returns and lower volatility. However, during the crisis, most hedge funds sufferedmajor losses except for the Macro strategy (including CTA, currency trading, etc.). Althoughhedge funds withstood the crisis better than equities but less well than bonds (except highyield bond), the performance of hedge funds after the crisis is not significantly better thanbefore the crisis but remains attractive to investors since they outperform bonds and exhibitlower volatility than equities. Roncalli and Teıletche (2007) propose breaking hedge fundperformance down into cash, traditional beta, alternative beta and alpha. By applying theirmethod, we show the relative and absolute breakdown of excess returns in Table 14 and weillustrate the results in Figures 10 and 11. We find that the alpha of most hedge funds issignificantly positive. But there are some differences between strategies. Some of them arecharacterized by a high relative percentage of alpha such as EH: S-TH, RV: FI-AB or ED:MA, whereas others display a high level of beta such as EH: QD, RV: FI-CA or RV: FI-C.
4.1.2 Efficient diversification of risks
Apart from attractive risk-adjusted returns, hedge funds offer benefits in terms of risk di-versification when added to a traditional portfolio. Liang (1999) shows that hedge fundshave a higher efficiency line than mutual funds, which contradicts the widely held view thathedge funds are risky investments. Signer and Favre (2002) compare most of the existingacademic literature on the benefits of hedge funds in portfolio construction. They find thatthe benefits of hedge funds are justified by a shift in the efficiency line in the mean-varianceenvironment which is a standard process in the traditional portfolio management theory.Using the HFR database and historical data for equities/bonds, we present the shift of theMarkowitz efficient frontier by adding hedge funds to the traditional equity/bond portfolioin Figure 12. We observe that including hedge funds in traditional portfolios improves therisk/return profile. Since most hedge funds always have a significant negative skewness (seeTable 13), some studies introduce new methods to evaluate the benefits of hedge funds moreprecisely. Signer and Favre (2002) propose a new risk measure (Modified Value-at-Risk) andconfirm that adding hedge funds offers benefits in term of risk-adjusted returns with the new
713967B_221076 White Paper N°11.indd 32 18/03/14 11:56
H E D G E F U N D S I N S T R AT E G I C A S S E T A L L O C AT I O N
I S S U E # 1 1 - M A R C H 2 0 1 4L Y X O R R E S E A R C H
33 >>
Table 13: Performance comparison between traditional assets and HFRI strategies
Period Asset μ σ SR MDD γ1 γ2
01/31/2000-05/31/2007
HFRI 8.71 5.95 0.89 −6.39 −0.09 3.37EH 8.24 7.88 0.61 −10.30 0.44 5.11ED 11.34 5.75 1.38 −9.34 −0.64 3.93Macro 8.07 5.48 0.85 −7.32 0.15 3.81RV 8.91 2.09 2.63 −1.29 −0.03 3.10EQ US 2.45 14.15 −0.07 −46.15 −0.31 3.39EQ WLD 7.38 14.17 0.28 −46.77 −0.59 3.19EQ EM 13.30 20.49 0.48 −47.76 −0.50 2.75BD US 6.14 5.02 0.54 −5.34 −0.73 4.07BD WLD 5.90 8.22 0.30 −10.16 0.31 2.78HY 7.24 7.66 0.50 −12.00 −0.82 6.12USD −2.24 6.40 −0.88 −28.92 0.04 2.80GOLD 11.82 14.05 0.60 −12.10 0.26 2.84EUR 1M 3.41 0.56 0.00 0.00 0.27 1.57
06/30/2007-04/30/2009
HFRI −7.80 9.33 −1.21 −21.42 −0.57 2.99EH −12.09 12.71 −1.23 −30.59 −0.48 2.97ED −11.72 9.10 −1.67 −24.79 −0.96 4.10Macro 4.97 5.95 0.25 −4.94 0.41 2.82RV −5.83 8.80 −1.06 −18.04 −1.51 5.35EQ US −23.59 22.31 −1.21 −50.65 −0.28 2.84EQ WLD −26.73 26.94 −1.12 −56.34 −0.35 3.05EQ EM −20.56 37.83 −0.64 −61.44 −0.33 2.77BD US 10.15 6.84 0.98 −3.67 0.26 3.31BD WLD 9.71 10.77 0.58 −10.24 0.17 2.71HY −8.20 19.98 −0.58 −32.76 −0.57 4.36USD −0.26 8.53 −0.44 −12.24 0.55 2.79GOLD 16.99 25.40 0.53 −27.07 −0.82 3.77EUR 1M 3.48 0.51 0.00 0.00 0.15 2.16
05/31/2009-06/30/2013
HFRI 5.80 5.71 0.96 −8.97 −0.55 3.15EH 6.00 8.18 0.69 −13.17 −0.65 3.56ED 9.25 5.81 1.53 −9.06 −0.87 3.71Macro 1.03 4.83 0.15 −6.87 0.36 2.20RV 9.35 3.65 2.47 −4.06 −0.84 3.83EQ US 17.16 14.24 1.18 −16.41 −0.24 2.98EQ WLD 8.87 17.78 0.48 −22.39 −0.36 2.93EQ EM 7.81 20.42 0.37 −25.59 −0.09 3.12BD US 3.91 4.00 0.89 −3.30 −0.26 2.83BD WLD 2.55 7.89 0.28 −10.10 −0.63 3.71HY 15.03 7.52 1.95 −7.44 −0.21 3.78USD 0.68 7.15 0.05 −13.67 0.23 2.72GOLD 4.86 20.11 0.23 −34.04 −0.09 2.81EUR 1M 0.33 0.03 0.00 0.00 2.04 8.20
713967B_221076 White Paper N°11.indd 33 18/03/14 11:56
H E D G E F U N D S I N S T R AT E G I C A S S E T A L L O C AT I O N
I S S U E # 1 1 - M A R C H 2 0 1 4L Y X O R R E S E A R C H
<< 34
Table 14: Breakdown of the excess return of HFRI indices
Absolute Decomposition (%)
Strategy Traditional Beta Alternative Beta Alpha Excess Return
HFRI 2.46 0.64 0.73 3.82EH 2.73 0.42 −0.21 2.94ED 2.97 1.19 1.31 5.47
Macro 1.66 1.91 0.65 4.22RV 2.53 1.08 0.87 4.48
EH: EMN 0.03 0.56 0.17 0.75EH: QD 3.74 0.90 −0.43 4.21EH: SB −1.82 −1.39 −0.99 −4.21
EH: S-EB 5.20 0.39 0.52 6.12EH: S-TH 2.04 −0.44 1.21 2.81
ED: MA 1.70 −0.10 0.74 2.33ED: PI 1.18 0.20 0.40 1.78ED: DIS 3.36 2.26 1.15 6.77
Macro: SD 2.19 1.72 0.62 4.53
RV: YA 2.61 2.15 1.29 6.05RV: FI-AB 1.83 2.73 2.82 7.37RV: FI-CA 2.83 0.91 0.19 3.94RV: FI-C 3.07 0.78 0.34 4.19RV: MS 1.93 1.33 0.51 3.77
Relative Decomposition (%)
Strategy Traditional Beta Alternative Beta Alpha Excess Return
HFRI 64.27 16.76 18.97 100.00EH 92.77 14.29 −7.06 100.00ED 54.25 21.75 24.00 100.00
Macro 39.37 45.29 15.34 100.00RV 56.48 24.16 19.35 100.00
EH: EMN 3.36 73.84 22.80 100.00EH: QD 88.85 21.32 −10.17 100.00EH: SB 43.38 33.07 23.54 100.00
EH: S-EB 85.04 6.39 8.57 100.00EH: S-TH 72.61 −15.73 43.13 100.00
ED: MA 72.79 −4.41 31.63 100.00ED: PI 66.24 11.27 22.48 100.00ED: DIS 49.63 33.32 17.05 100.00
Macro: SD 48.28 38.05 13.67 100.00
RV: YA 43.21 35.50 21.29 100.00RV: FI-AB 24.77 37.04 38.19 100.00RV: FI-CA 71.95 23.15 4.91 100.00RV: FI-C 73.26 18.67 8.07 100.00RV: MS 51.18 35.24 13.59 100.00
713967B_221076 White Paper N°11.indd 34 18/03/14 11:56
H E D G E F U N D S I N S T R AT E G I C A S S E T A L L O C AT I O N
I S S U E # 1 1 - M A R C H 2 0 1 4L Y X O R R E S E A R C H
35 >>
Figure 10: Absolute alpha versus beta return for hedge fund strategies
Figure 11: Relative alpha versus beta return for hedge funds strategies
713967B_221076 White Paper N°11.indd 35 18/03/14 11:56
H E D G E F U N D S I N S T R AT E G I C A S S E T A L L O C AT I O N
I S S U E # 1 1 - M A R C H 2 0 1 4L Y X O R R E S E A R C H
<< 36
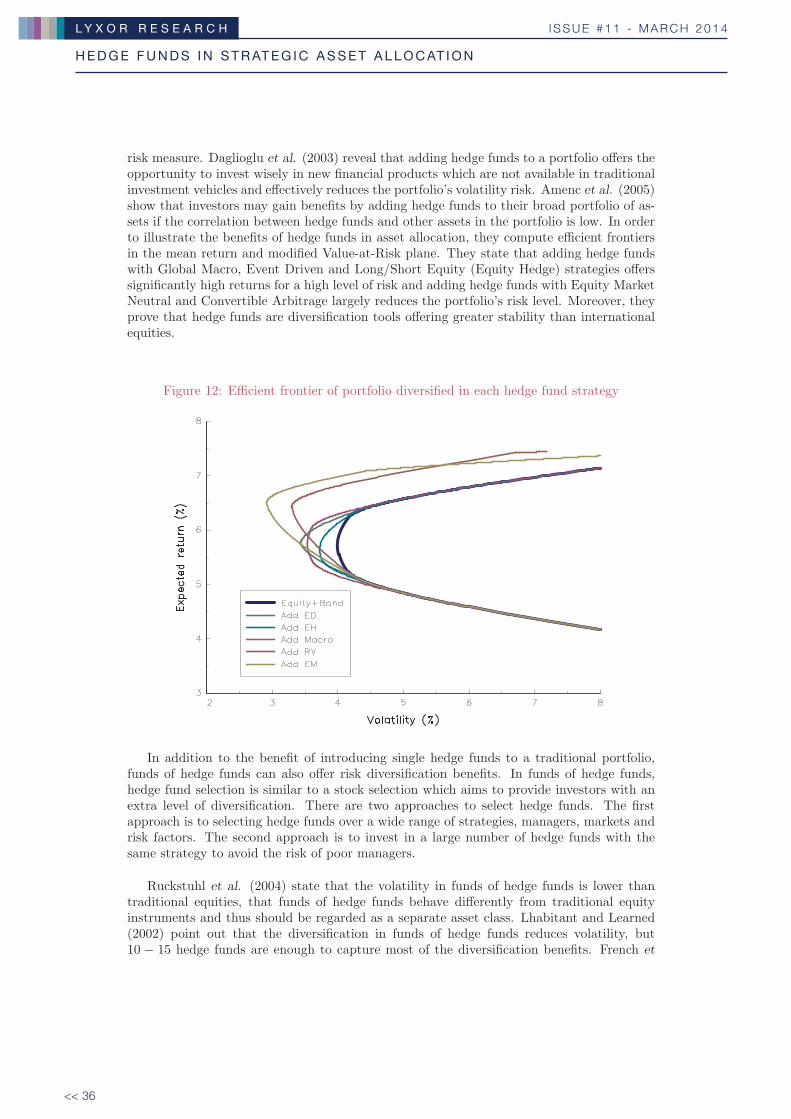
risk measure. Daglioglu et al. (2003) reveal that adding hedge funds to a portfolio offers theopportunity to invest wisely in new financial products which are not available in traditionalinvestment vehicles and effectively reduces the portfolio’s volatility risk. Amenc et al. (2005)show that investors may gain benefits by adding hedge funds to their broad portfolio of as-sets if the correlation between hedge funds and other assets in the portfolio is low. In orderto illustrate the benefits of hedge funds in asset allocation, they compute efficient frontiersin the mean return and modified Value-at-Risk plane. They state that adding hedge fundswith Global Macro, Event Driven and Long/Short Equity (Equity Hedge) strategies offerssignificantly high returns for a high level of risk and adding hedge funds with Equity MarketNeutral and Convertible Arbitrage largely reduces the portfolio’s risk level. Moreover, theyprove that hedge funds are diversification tools offering greater stability than internationalequities.
Figure 12: Efficient frontier of portfolio diversified in each hedge fund strategy
In addition to the benefit of introducing single hedge funds to a traditional portfolio,funds of hedge funds can also offer risk diversification benefits. In funds of hedge funds,hedge fund selection is similar to a stock selection which aims to provide investors with anextra level of diversification. There are two approaches to select hedge funds. The firstapproach is to selecting hedge funds over a wide range of strategies, managers, markets andrisk factors. The second approach is to invest in a large number of hedge funds with thesame strategy to avoid the risk of poor managers.
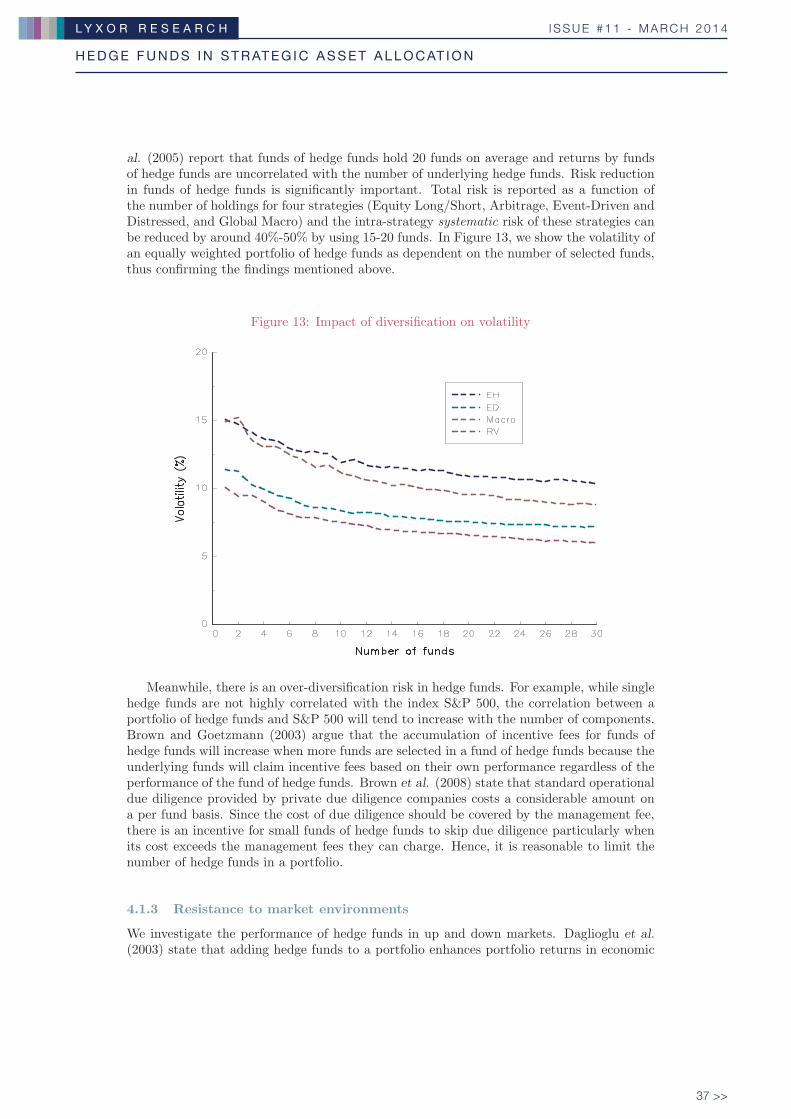
Ruckstuhl et al. (2004) state that the volatility in funds of hedge funds is lower thantraditional equities, that funds of hedge funds behave differently from traditional equityinstruments and thus should be regarded as a separate asset class. Lhabitant and Learned(2002) point out that the diversification in funds of hedge funds reduces volatility, but10 − 15 hedge funds are enough to capture most of the diversification benefits. French et
713967B_221076 White Paper N°11.indd 36 18/03/14 11:56
H E D G E F U N D S I N S T R AT E G I C A S S E T A L L O C AT I O N
I S S U E # 1 1 - M A R C H 2 0 1 4L Y X O R R E S E A R C H
37 >>
al. (2005) report that funds of hedge funds hold 20 funds on average and returns by fundsof hedge funds are uncorrelated with the number of underlying hedge funds. Risk reductionin funds of hedge funds is significantly important. Total risk is reported as a function ofthe number of holdings for four strategies (Equity Long/Short, Arbitrage, Event-Driven andDistressed, and Global Macro) and the intra-strategy systematic risk of these strategies canbe reduced by around 40%-50% by using 15-20 funds. In Figure 13, we show the volatility ofan equally weighted portfolio of hedge funds as dependent on the number of selected funds,thus confirming the findings mentioned above.
Figure 13: Impact of diversification on volatility
Meanwhile, there is an over-diversification risk in hedge funds. For example, while singlehedge funds are not highly correlated with the index S&P 500, the correlation between aportfolio of hedge funds and S&P 500 will tend to increase with the number of components.Brown and Goetzmann (2003) argue that the accumulation of incentive fees for funds ofhedge funds will increase when more funds are selected in a fund of hedge funds because theunderlying funds will claim incentive fees based on their own performance regardless of theperformance of the fund of hedge funds. Brown et al. (2008) state that standard operationaldue diligence provided by private due diligence companies costs a considerable amount ona per fund basis. Since the cost of due diligence should be covered by the management fee,there is an incentive for small funds of hedge funds to skip due diligence particularly whenits cost exceeds the management fees they can charge. Hence, it is reasonable to limit thenumber of hedge funds in a portfolio.
4.1.3 Resistance to market environments
We investigate the performance of hedge funds in up and down markets. Daglioglu et al.(2003) state that adding hedge funds to a portfolio enhances portfolio returns in economic
713967B_221076 White Paper N°11.indd 37 18/03/14 11:56
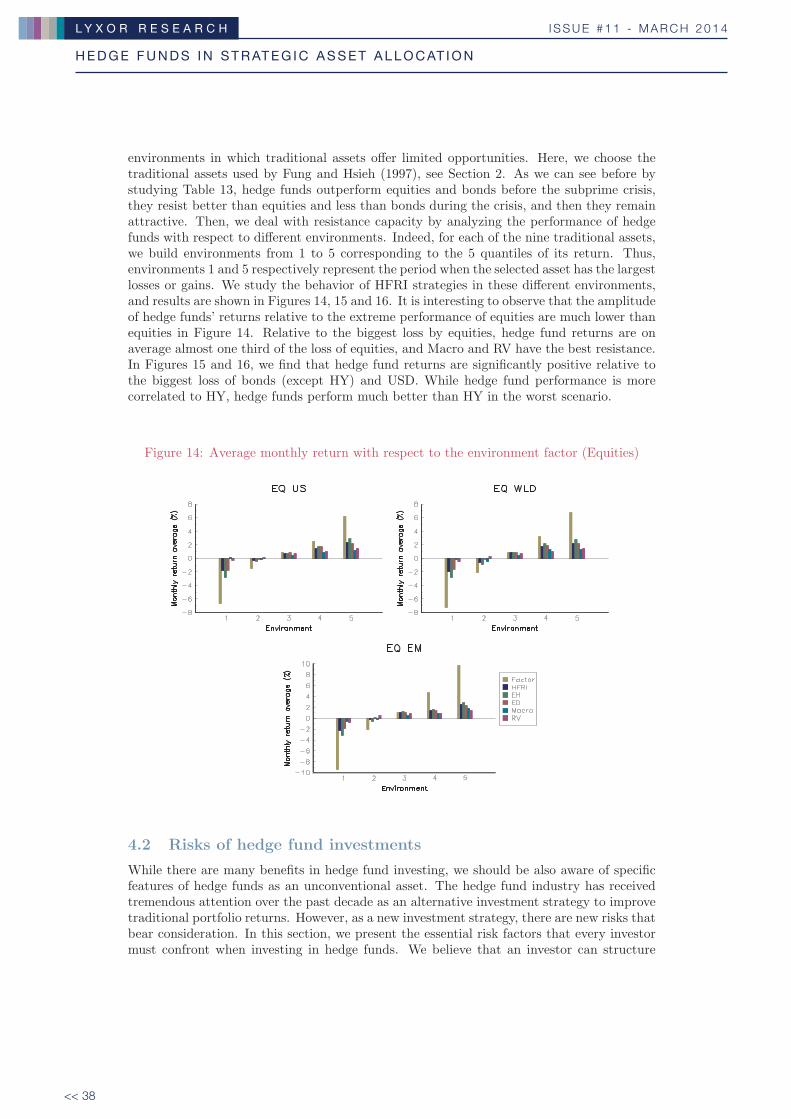
H E D G E F U N D S I N S T R AT E G I C A S S E T A L L O C AT I O N
I S S U E # 1 1 - M A R C H 2 0 1 4L Y X O R R E S E A R C H
<< 38
environments in which traditional assets offer limited opportunities. Here, we choose thetraditional assets used by Fung and Hsieh (1997), see Section 2. As we can see before bystudying Table 13, hedge funds outperform equities and bonds before the subprime crisis,they resist better than equities and less than bonds during the crisis, and then they remainattractive. Then, we deal with resistance capacity by analyzing the performance of hedgefunds with respect to different environments. Indeed, for each of the nine traditional assets,we build environments from 1 to 5 corresponding to the 5 quantiles of its return. Thus,environments 1 and 5 respectively represent the period when the selected asset has the largestlosses or gains. We study the behavior of HFRI strategies in these different environments,and results are shown in Figures 14, 15 and 16. It is interesting to observe that the amplitudeof hedge funds’ returns relative to the extreme performance of equities are much lower thanequities in Figure 14. Relative to the biggest loss by equities, hedge fund returns are onaverage almost one third of the loss of equities, and Macro and RV have the best resistance.In Figures 15 and 16, we find that hedge fund returns are significantly positive relative tothe biggest loss of bonds (except HY) and USD. While hedge fund performance is morecorrelated to HY, hedge funds perform much better than HY in the worst scenario.
Figure 14: Average monthly return with respect to the environment factor (Equities)
4.2 Risks of hedge fund investments
While there are many benefits in hedge fund investing, we should be also aware of specificfeatures of hedge funds as an unconventional asset. The hedge fund industry has receivedtremendous attention over the past decade as an alternative investment strategy to improvetraditional portfolio returns. However, as a new investment strategy, there are new risks thatbear consideration. In this section, we present the essential risk factors that every investormust confront when investing in hedge funds. We believe that an investor can structure
713967B_221076 White Paper N°11.indd 38 18/03/14 11:56
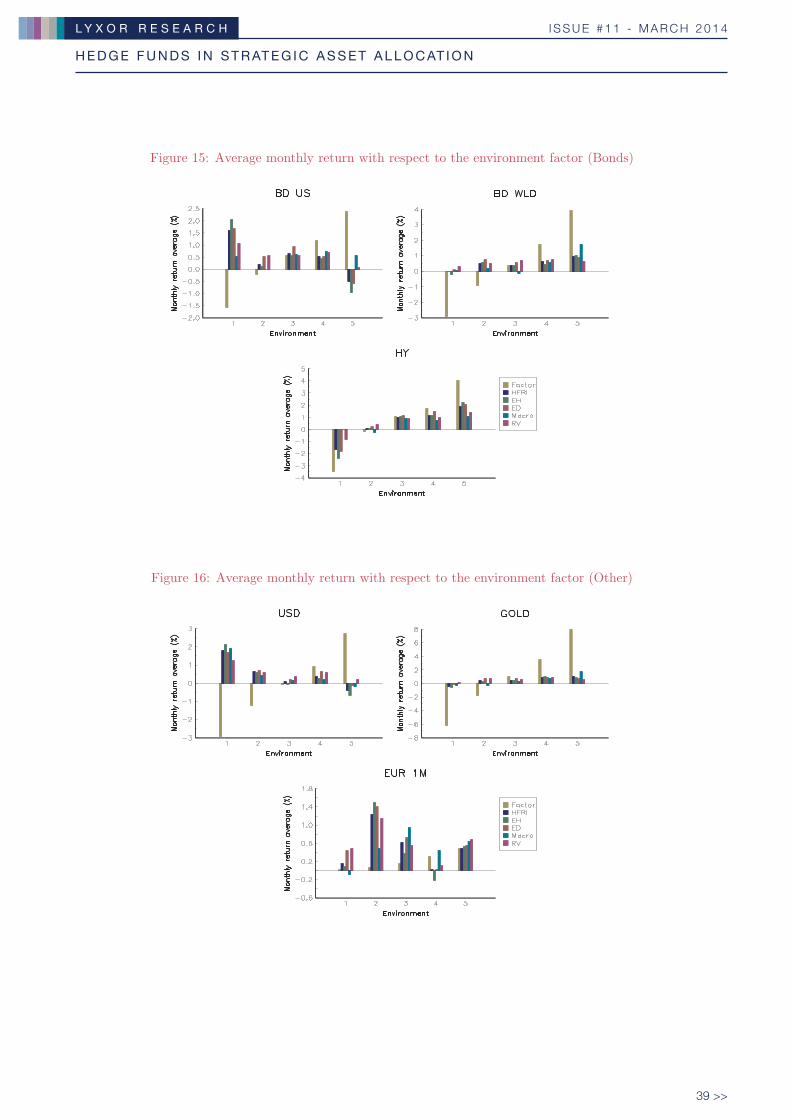
H E D G E F U N D S I N S T R AT E G I C A S S E T A L L O C AT I O N
I S S U E # 1 1 - M A R C H 2 0 1 4L Y X O R R E S E A R C H
39 >>
Figure 15: Average monthly return with respect to the environment factor (Bonds)
Figure 16: Average monthly return with respect to the environment factor (Other)
713967B_221076 White Paper N°11.indd 39 18/03/14 11:56
H E D G E F U N D S I N S T R AT E G I C A S S E T A L L O C AT I O N
I S S U E # 1 1 - M A R C H 2 0 1 4L Y X O R R E S E A R C H
<< 40
a successful hedge fund program if he can successfully manage the risks outlined in thissection.
Stevenson (2007) estimates that around 20 hedge funds collapse every year. The failureof 60% of these hedge funds is due to operational risk (fraud and/or inadequate resourcesand structure), in contrast, 40% of these hedge funds collapse as a result of investment risk(e.g. market and/or investment management).
Feffer and Kundro (2003) propose three basic risk categories of hedge funds: investmentrisk (risks directly related to the market), business risk (risks related to fund management)and operational risk (trade processing, accounting, administration, valuation and reportingetc.). In our point of view, it will be better to classify the risks into two classes because hedgefund failure is generally due to fraud or market risk. Since business risk and operational riskproposed by Feffer and Kundro (2003) are both related to the manner of fund managementbut not directly related to the market, we propose to merge these two risks into an internalrisk category entitled management risk. In this way, we can easily classify the risks into twoclasses: market risk and management risk.
The main risk of hedge fund investments is market risk which covers risks related tomarket movements and includes event risk, credit risk and liquidity risk.
Tail risk Tail risk refers to the fat tail of the distribution of returns. Investors and fundmanagers are more interested in downside tail risk which measures the risk of loss belowcertain level, for example, three times the standard deviation. In the history of hedge funds,the collapse of Long-Term Capital Management (LTCM) in 1998 and the subprime crisisin 2007-2008 contributed greatly to the fat left-tail of the distribution of returns and havedriven investors to be more aware of tail risk.
Credit risk Counterparty credit risk is one of the most important risks for financial in-stitutions. Hedge funds interact with financial institutions and intermediaries in many waysincluding through prime brokerage relationships. These interactions extend counterpartycredit risk to hedge funds and other financial institutions. In order to measure counter-party credit risk under market fluctuations, financial institutions calculate potential futureexposure which is defined as the maximum exposure under a certain degree of statisticalconfidence and a future time period for counterparty credit risk management. Nevertheless,unrestricted trading strategies, liberal use of leverage and lack of transparency make manag-ing counterparty credit risk more difficult. Particularly, in a crisis, risks may be transmittedfrom one institution to another by interlocking credit exposures. For example, the collapseof Long-Term Capital Management (LTCM) in 1998 posed a systemic risk to the globalfinancial system. Fortunately, regulations on hedge funds and counterparty credit risk man-agement have been reinforced since 1998 and hedge funds now provide greater transparencyand more reports on their risk exposure.
Liquidity risk Liquidity is one of the main concerns of hedge funds. It refers to the riskfor hedge fund managers of clearing their positions and the risk for investors of exiting afund at the lowest cost as soon as possible. Sadka (2010) measures liquidity risk by thecovariation of fund returns with unexpected changes in aggregate liquidity and shows thatliquidity risk is an important determinant in the cross-section of hedge-fund returns.
713967B_221076 White Paper N°11.indd 40 18/03/14 11:56
H E D G E F U N D S I N S T R AT E G I C A S S E T A L L O C AT I O N
I S S U E # 1 1 - M A R C H 2 0 1 4L Y X O R R E S E A R C H
41 >>
Remark 2 Besides market risk, we are well aware of management risk which covers therisks related to internal management of hedge funds and includes transparency risk, oper-ational risk and risk management risk. Transparency risk is related to the hedge funds’transparency reports compared to traditional assets. Operational risk includes the risks offailure in internal operational, control and accounting systems, failure of compliance andinternal audit systems and failure of employee fraud and misconduct. Risks related to riskmanagement concentrate on the efficiency of risk measures (e.g. VaR) for hedge funds dueto the specific heterogeneity of risks among various hedge funds.
5 Smart strategic asset allocation with hedge funds
Brennan et al. (1997) first introduce the notion of SAA and Tactical Asset Allocation(TAA) to describe long-term portfolio choice and short-term adjustment respectively. Theyanalyze the portfolio problem of investing in bonds, equities and cash with the presence oftime variation in expected returns on these asset classes. They found a significant differencebetween the optimal portfolio using SAA and the optimal portfolio using TAA models. SAAis formulated later by Campbell and Viceira (2002) and has gained popularity thereafter.This long-term portfolio choice theory is becoming very attractive for long-term investorssuch as pension funds or sovereign funds.
When investors want to build exposure to hedge funds in SAA, they must consider therisk/return characteristics. However, standard mean-variance portfolio selection techniquesmay suffer from non-normally distributed (asymmetric and/or fat-tailed) hedge fund returns,see Brooks and Kat (2002), Sornette et al. (2000), Amin and Kat (2003) and Cremers et al.(2005). For that reason, a simple Markowitz mean-variance framework will probably lead toinefficient portfolio composition and an underestimate of tail risk. Hitaj et al. (2012) providethe first application of improved estimators for higher-order co-moment parameters intro-duced by Martellini and Ziemann (2010) in the context of hedge fund portfolio optimizationand find that the use of these enhanced estimates generates significant improvement forinvestors in hedge funds. Cumming et al. (2012) use normal mixture distribution to capturethe skewness and kurtosis of hedge fund returns. They show that the optimal portfolioallocates nearly 20% to hedge funds in SAA. Eychenne et al. (2011) confirm the place ofhedge funds in SAA by using Markowitz mean-variance approach with a long-term forecastof asset classes. The possible solution presented in this paper consists in getting rid ofthe non-normality of hedge funds using a Markowitz mean-variance framework with regimeswitching.
Moreover, in contrast to the appearance of performance similarity before the subprimecrisis, we should remember that hedge fund strategies can be very different one from another,see Section 2.2. We observe that the hedge fund industry has changed profoundly since thebeginning of the crisis. The hedge fund industry has undergone a difficult period from theend of 2007 to the beginning of 2009 after many glorious years. Since many studies on hedgefunds utilize hedge fund data prior to 2008 including performance similarity, it is no longercredible to rely on these results to guide the future portfolio allocation. Thus, practitionersshould not consider hedge funds in SAA as a single asset class.
In what follows, we aim to propose an alternative allocation method to traditional SAA.We start from the classical 2/3 − 1/3 asset allocation mix rule which is well known in theindustry and we try to improve it by introducing smart strategic asset allocation with hedgefunds. The philosophy behind this new strategy is that the different hedge fund strategies
713967B_221076 White Paper N°11.indd 41 18/03/14 11:56
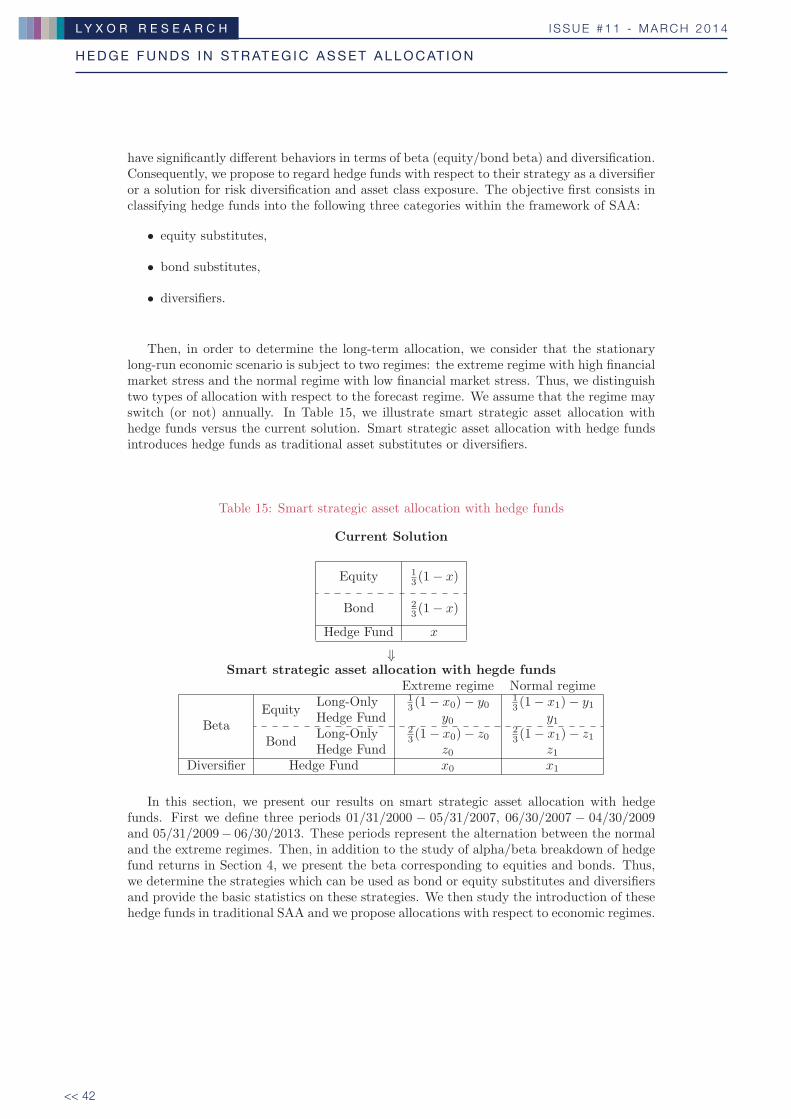
H E D G E F U N D S I N S T R AT E G I C A S S E T A L L O C AT I O N
I S S U E # 1 1 - M A R C H 2 0 1 4L Y X O R R E S E A R C H
<< 42
have significantly different behaviors in terms of beta (equity/bond beta) and diversification.Consequently, we propose to regard hedge funds with respect to their strategy as a diversifieror a solution for risk diversification and asset class exposure. The objective first consists inclassifying hedge funds into the following three categories within the framework of SAA:
• equity substitutes,
• bond substitutes,
• diversifiers.
Then, in order to determine the long-term allocation, we consider that the stationarylong-run economic scenario is subject to two regimes: the extreme regime with high financialmarket stress and the normal regime with low financial market stress. Thus, we distinguishtwo types of allocation with respect to the forecast regime. We assume that the regime mayswitch (or not) annually. In Table 15, we illustrate smart strategic asset allocation withhedge funds versus the current solution. Smart strategic asset allocation with hedge fundsintroduces hedge funds as traditional asset substitutes or diversifiers.
Table 15: Smart strategic asset allocation with hedge funds
Current Solution
Equity 13 (1− x)
Bond 23 (1− x)
Hedge Fund x
⇓Smart strategic asset allocation with hegde funds
Extreme regime Normal regime
BetaEquity
Long-Only 13 (1− x0)− y0
13 (1− x1)− y1
Hedge Fund y0 y1
BondLong-Only 2
3 (1− x0)− z023 (1− x1)− z1
Hedge Fund z0 z1Diversifier Hedge Fund x0 x1
In this section, we present our results on smart strategic asset allocation with hedgefunds. First we define three periods 01/31/2000 − 05/31/2007, 06/30/2007 − 04/30/2009and 05/31/2009− 06/30/2013. These periods represent the alternation between the normaland the extreme regimes. Then, in addition to the study of alpha/beta breakdown of hedgefund returns in Section 4, we present the beta corresponding to equities and bonds. Thus,we determine the strategies which can be used as bond or equity substitutes and diversifiersand provide the basic statistics on these strategies. We then study the introduction of thesehedge funds in traditional SAA and we propose allocations with respect to economic regimes.
713967B_221076 White Paper N°11.indd 42 18/03/14 11:56
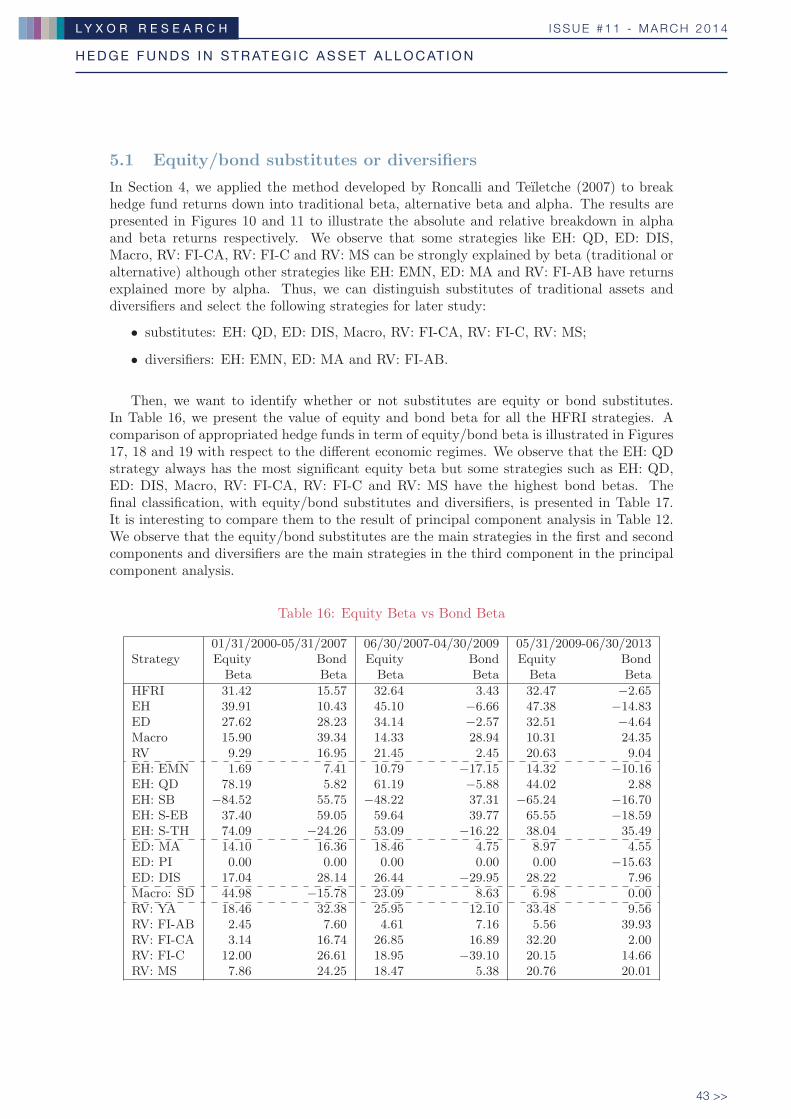
H E D G E F U N D S I N S T R AT E G I C A S S E T A L L O C AT I O N
I S S U E # 1 1 - M A R C H 2 0 1 4L Y X O R R E S E A R C H
43 >>
5.1 Equity/bond substitutes or diversifiers
In Section 4, we applied the method developed by Roncalli and Teıletche (2007) to breakhedge fund returns down into traditional beta, alternative beta and alpha. The results arepresented in Figures 10 and 11 to illustrate the absolute and relative breakdown in alphaand beta returns respectively. We observe that some strategies like EH: QD, ED: DIS,Macro, RV: FI-CA, RV: FI-C and RV: MS can be strongly explained by beta (traditional oralternative) although other strategies like EH: EMN, ED: MA and RV: FI-AB have returnsexplained more by alpha. Thus, we can distinguish substitutes of traditional assets anddiversifiers and select the following strategies for later study:
• substitutes: EH: QD, ED: DIS, Macro, RV: FI-CA, RV: FI-C, RV: MS;
• diversifiers: EH: EMN, ED: MA and RV: FI-AB.
Then, we want to identify whether or not substitutes are equity or bond substitutes.In Table 16, we present the value of equity and bond beta for all the HFRI strategies. Acomparison of appropriated hedge funds in term of equity/bond beta is illustrated in Figures17, 18 and 19 with respect to the different economic regimes. We observe that the EH: QDstrategy always has the most significant equity beta but some strategies such as EH: QD,ED: DIS, Macro, RV: FI-CA, RV: FI-C and RV: MS have the highest bond betas. Thefinal classification, with equity/bond substitutes and diversifiers, is presented in Table 17.It is interesting to compare them to the result of principal component analysis in Table 12.We observe that the equity/bond substitutes are the main strategies in the first and secondcomponents and diversifiers are the main strategies in the third component in the principalcomponent analysis.
Table 16: Equity Beta vs Bond Beta
Strategy01/31/2000-05/31/2007 06/30/2007-04/30/2009 05/31/2009-06/30/2013Equity Bond Equity Bond Equity BondBeta Beta Beta Beta Beta Beta
HFRI 31.42 15.57 32.64 3.43 32.47 −2.65EH 39.91 10.43 45.10 −6.66 47.38 −14.83ED 27.62 28.23 34.14 −2.57 32.51 −4.64Macro 15.90 39.34 14.33 28.94 10.31 24.35RV 9.29 16.95 21.45 2.45 20.63 9.04EH: EMN 1.69 7.41 10.79 −17.15 14.32 −10.16EH: QD 78.19 5.82 61.19 −5.88 44.02 2.88EH: SB −84.52 55.75 −48.22 37.31 −65.24 −16.70EH: S-EB 37.40 59.05 59.64 39.77 65.55 −18.59EH: S-TH 74.09 −24.26 53.09 −16.22 38.04 35.49ED: MA 14.10 16.36 18.46 4.75 8.97 4.55ED: PI 0.00 0.00 0.00 0.00 0.00 −15.63ED: DIS 17.04 28.14 26.44 −29.95 28.22 7.96Macro: SD 44.98 −15.78 23.09 8.63 6.98 0.00RV: YA 18.46 32.38 25.95 12.10 33.48 9.56RV: FI-AB 2.45 7.60 4.61 7.16 5.56 39.93RV: FI-CA 3.14 16.74 26.85 16.89 32.20 2.00RV: FI-C 12.00 26.61 18.95 −39.10 20.15 14.66RV: MS 7.86 24.25 18.47 5.38 20.76 20.01
713967B_221076 White Paper N°11.indd 43 18/03/14 11:56
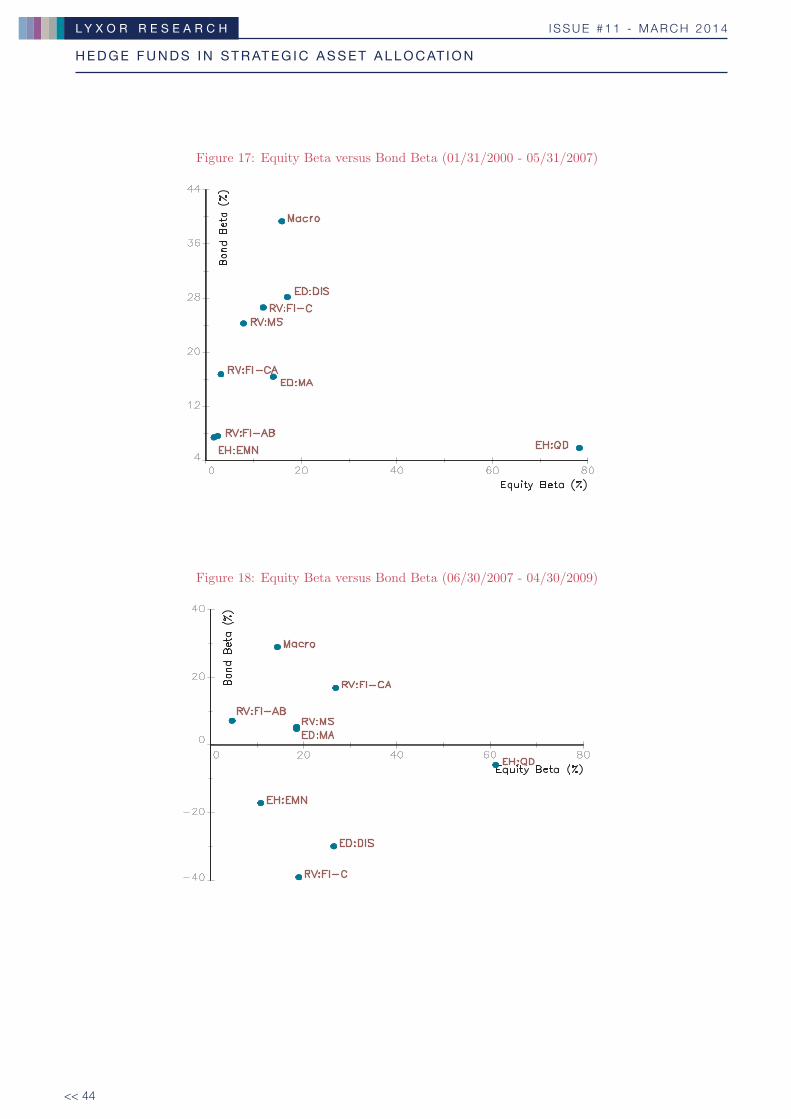
H E D G E F U N D S I N S T R AT E G I C A S S E T A L L O C AT I O N
I S S U E # 1 1 - M A R C H 2 0 1 4L Y X O R R E S E A R C H
<< 44
Figure 17: Equity Beta versus Bond Beta (01/31/2000 - 05/31/2007)
Figure 18: Equity Beta versus Bond Beta (06/30/2007 - 04/30/2009)
713967B_221076 White Paper N°11.indd 44 18/03/14 11:56
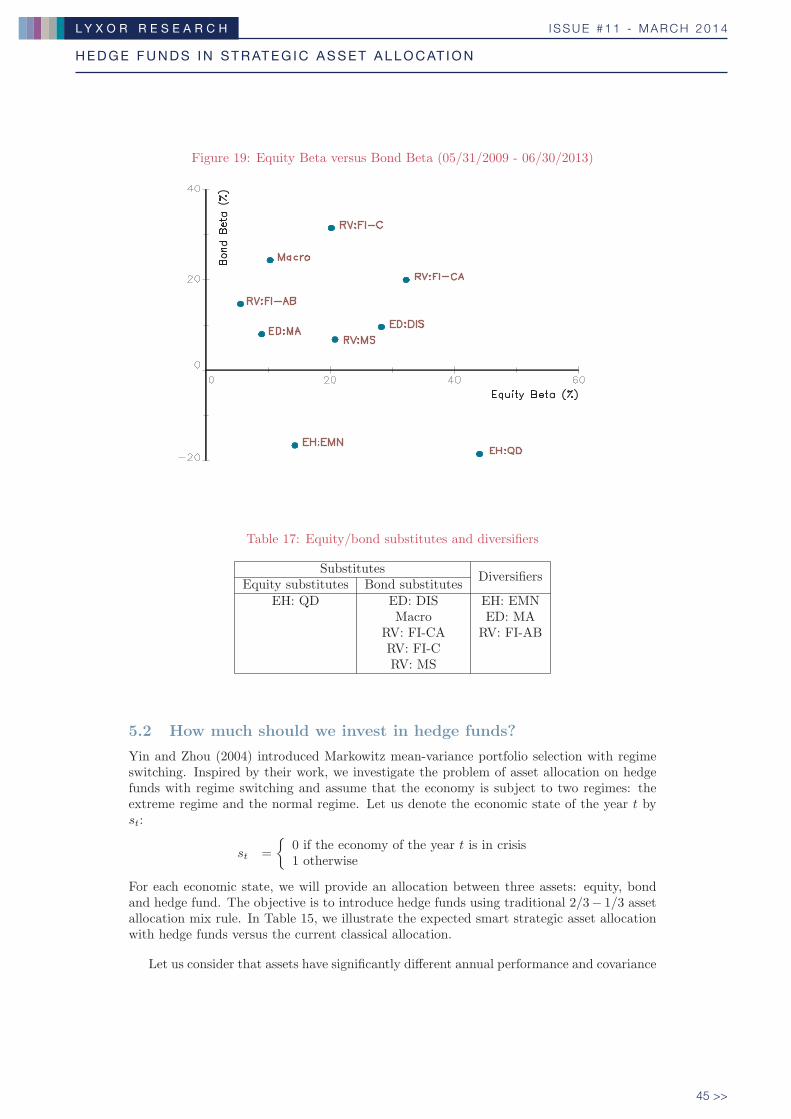
H E D G E F U N D S I N S T R AT E G I C A S S E T A L L O C AT I O N
I S S U E # 1 1 - M A R C H 2 0 1 4L Y X O R R E S E A R C H
45 >>
Figure 19: Equity Beta versus Bond Beta (05/31/2009 - 06/30/2013)
Table 17: Equity/bond substitutes and diversifiers
SubstitutesDiversifiers
Equity substitutes Bond substitutesEH: QD ED: DIS EH: EMN
Macro ED: MARV: FI-CA RV: FI-ABRV: FI-CRV: MS
5.2 How much should we invest in hedge funds?
Yin and Zhou (2004) introduced Markowitz mean-variance portfolio selection with regimeswitching. Inspired by their work, we investigate the problem of asset allocation on hedgefunds with regime switching and assume that the economy is subject to two regimes: theextreme regime and the normal regime. Let us denote the economic state of the year t byst:
st =
{0 if the economy of the year t is in crisis1 otherwise
For each economic state, we will provide an allocation between three assets: equity, bondand hedge fund. The objective is to introduce hedge funds using traditional 2/3− 1/3 assetallocation mix rule. In Table 15, we illustrate the expected smart strategic asset allocationwith hedge funds versus the current classical allocation.
Let us consider that assets have significantly different annual performance and covariance
713967B_221076 White Paper N°11.indd 45 18/03/14 11:56

H E D G E F U N D S I N S T R AT E G I C A S S E T A L L O C AT I O N
I S S U E # 1 1 - M A R C H 2 0 1 4L Y X O R R E S E A R C H
<< 46
matrices in the two economic regimes. We denote the asset performance vector in the regimest by μ(st) and the covariance matrix in the regime st by Σ(st). The transition probabilitymatrix between the extreme and normal regimes is denoted by Q where Qi,j represents theprobability that the economy switches from the regime i to the regime j. Defining Q00 = pand Q11 = q, we can write the transition matrix as follows:
Q =
(p 1− p
1− q q
)
Then, denoting the return of the kth asset in the year t by rkt , we can define a Markovprocess as follows: {
rkt (st) ∼ N (μk(st),Σkk(st))P [st = j|st−1 = i] = Qi,j
In addition, it is not difficult to show that the steady-state probabilities for regime-switchingprocess st are:
Q∞ =
(π0
π1
)=
(1−q
2−p−q1−p
2−p−q
)
Hence, we have:
E [st] =1− p
2− p− q
where p and q can be calibrated by the EM algorithm for the hidden Markov model withregime switching (Kim and Nelson, 1999).
Our objective is to determine the proportions of hedge funds xst , yst and zst denoted inTable 15 in different potential economic states st. Let us consider the allocation vector wst
defined as follows:
wst =
⎛⎜⎜⎜⎜⎝
1/3 (1− xst)− ystyst
2/3 (1− xst)− zstzstxst
⎞⎟⎟⎟⎟⎠
In order to find the optimal w0 and w1 allocations, we introduce a Markowitz-like opti-mization program which consists in maximizing the expected performance of the portfolioμ(w) under a constraint on the variance σ(w):
{w�0 , w
�1} = argmaxμ(w) (1)
u.c.
⎧⎨⎩
σ(w) ≤ σ�
0 ≤ w0, w1 ≤ 1∑i w
i0 = 1 and
∑i w
i1 = 1
The above optimization problem can be resolved using a quadratic optimization programshown in Appendix B. We then deduce the hedge funds proportions xst , yst and zst . Inorder to invest reasonably in hedge funds, we limit the hedge fund allocation by 15%, saying
xst + yst + zst ≤ 15%
713967B_221076 White Paper N°11.indd 46 18/03/14 11:56
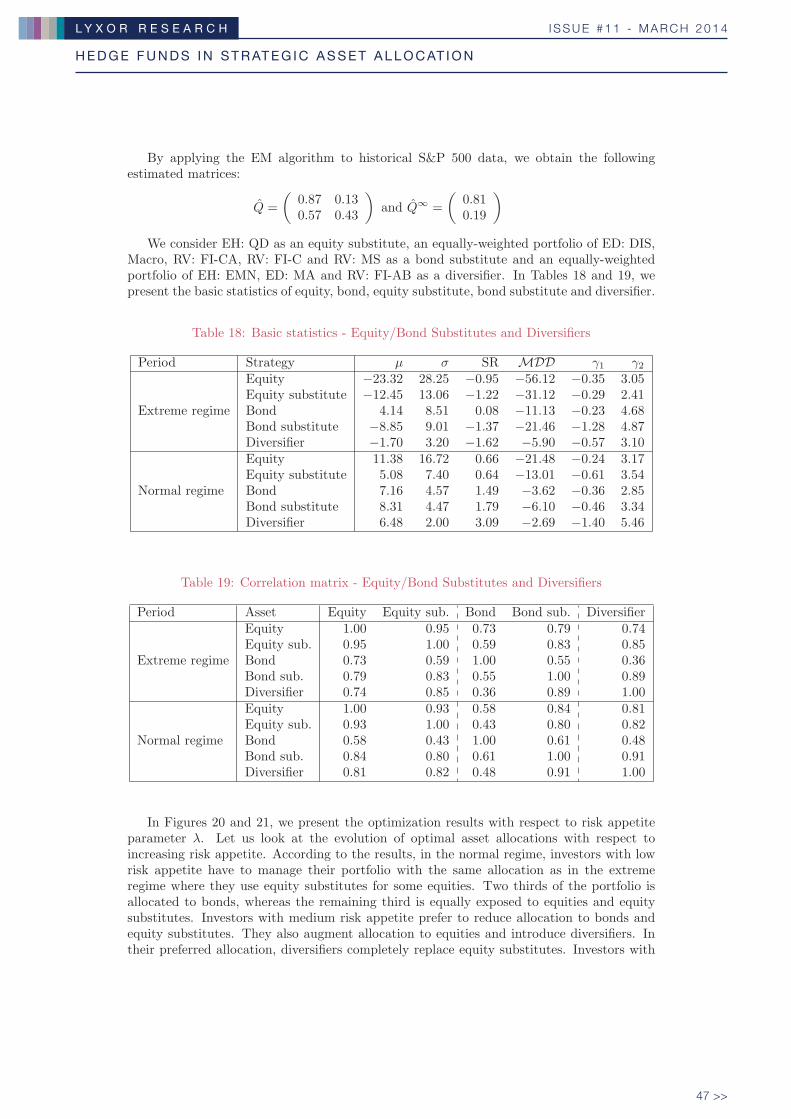
H E D G E F U N D S I N S T R AT E G I C A S S E T A L L O C AT I O N
I S S U E # 1 1 - M A R C H 2 0 1 4L Y X O R R E S E A R C H
47 >>
By applying the EM algorithm to historical S&P 500 data, we obtain the followingestimated matrices:
Q =
(0.87 0.130.57 0.43
)and Q∞ =
(0.810.19
)
We consider EH: QD as an equity substitute, an equally-weighted portfolio of ED: DIS,Macro, RV: FI-CA, RV: FI-C and RV: MS as a bond substitute and an equally-weightedportfolio of EH: EMN, ED: MA and RV: FI-AB as a diversifier. In Tables 18 and 19, wepresent the basic statistics of equity, bond, equity substitute, bond substitute and diversifier.
Table 18: Basic statistics - Equity/Bond Substitutes and Diversifiers
Period Strategy μ σ SR MDD γ1 γ2
Extreme regime
Equity −23.32 28.25 −0.95 −56.12 −0.35 3.05Equity substitute −12.45 13.06 −1.22 −31.12 −0.29 2.41Bond 4.14 8.51 0.08 −11.13 −0.23 4.68Bond substitute −8.85 9.01 −1.37 −21.46 −1.28 4.87Diversifier −1.70 3.20 −1.62 −5.90 −0.57 3.10
Normal regime
Equity 11.38 16.72 0.66 −21.48 −0.24 3.17Equity substitute 5.08 7.40 0.64 −13.01 −0.61 3.54Bond 7.16 4.57 1.49 −3.62 −0.36 2.85Bond substitute 8.31 4.47 1.79 −6.10 −0.46 3.34Diversifier 6.48 2.00 3.09 −2.69 −1.40 5.46
Table 19: Correlation matrix - Equity/Bond Substitutes and Diversifiers
Period Asset Equity Equity sub. Bond Bond sub. Diversifier
Extreme regime
Equity 1.00 0.95 0.73 0.79 0.74Equity sub. 0.95 1.00 0.59 0.83 0.85Bond 0.73 0.59 1.00 0.55 0.36Bond sub. 0.79 0.83 0.55 1.00 0.89Diversifier 0.74 0.85 0.36 0.89 1.00
Normal regime
Equity 1.00 0.93 0.58 0.84 0.81Equity sub. 0.93 1.00 0.43 0.80 0.82Bond 0.58 0.43 1.00 0.61 0.48Bond sub. 0.84 0.80 0.61 1.00 0.91Diversifier 0.81 0.82 0.48 0.91 1.00
In Figures 20 and 21, we present the optimization results with respect to risk appetiteparameter λ. Let us look at the evolution of optimal asset allocations with respect toincreasing risk appetite. According to the results, in the normal regime, investors with lowrisk appetite have to manage their portfolio with the same allocation as in the extremeregime where they use equity substitutes for some equities. Two thirds of the portfolio isallocated to bonds, whereas the remaining third is equally exposed to equities and equitysubstitutes. Investors with medium risk appetite prefer to reduce allocation to bonds andequity substitutes. They also augment allocation to equities and introduce diversifiers. Intheir preferred allocation, diversifiers completely replace equity substitutes. Investors with
713967B_221076 White Paper N°11.indd 47 18/03/14 11:56
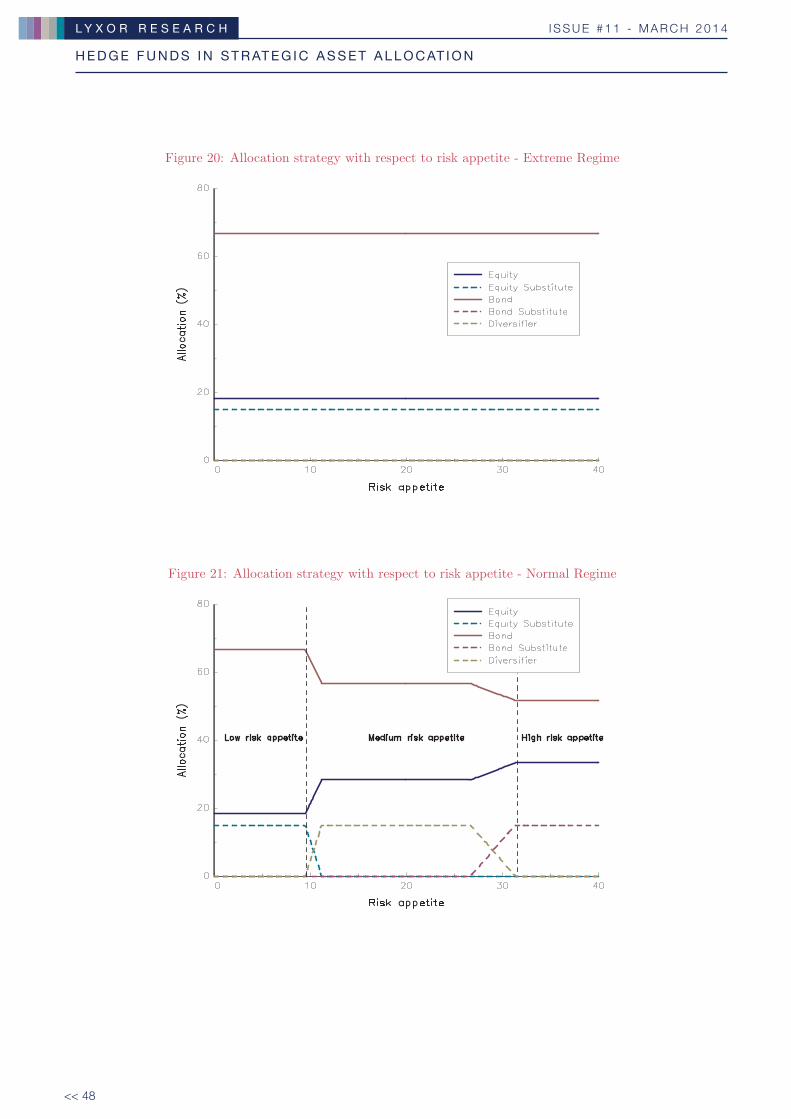
H E D G E F U N D S I N S T R AT E G I C A S S E T A L L O C AT I O N
I S S U E # 1 1 - M A R C H 2 0 1 4L Y X O R R E S E A R C H
<< 48
Figure 20: Allocation strategy with respect to risk appetite - Extreme Regime
Figure 21: Allocation strategy with respect to risk appetite - Normal Regime
713967B_221076 White Paper N°11.indd 48 18/03/14 11:56
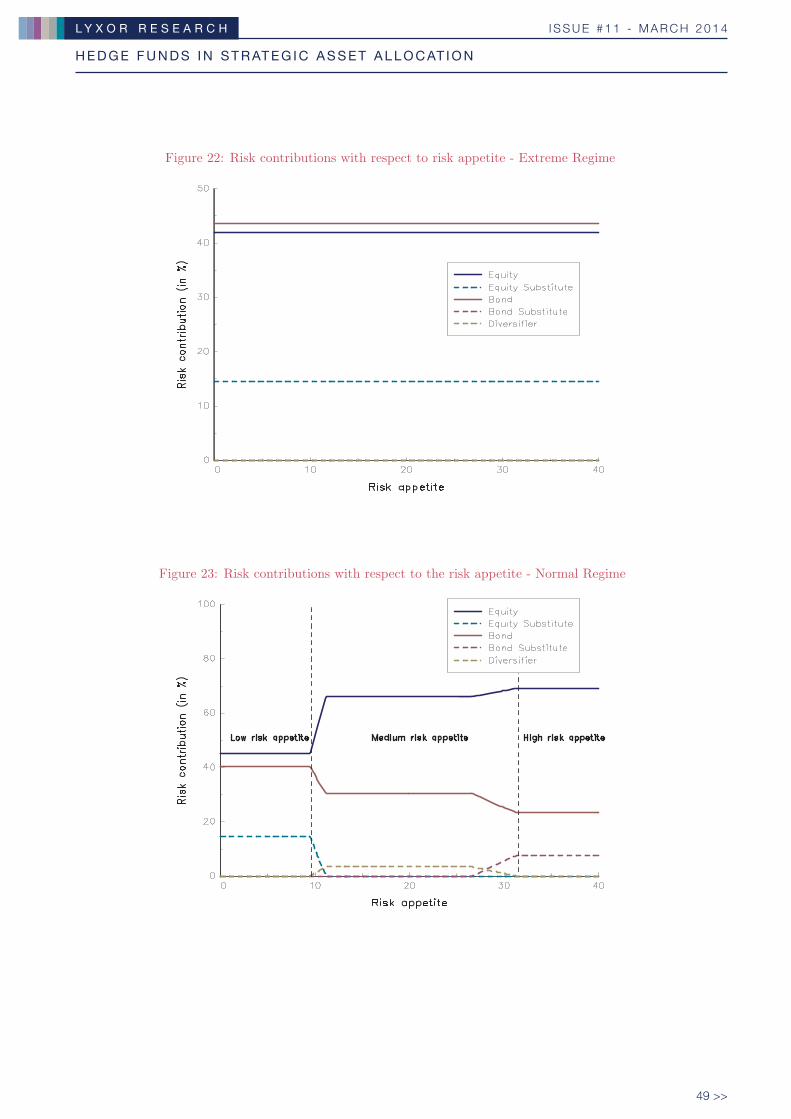
H E D G E F U N D S I N S T R AT E G I C A S S E T A L L O C AT I O N
I S S U E # 1 1 - M A R C H 2 0 1 4L Y X O R R E S E A R C H
49 >>
Figure 22: Risk contributions with respect to risk appetite - Extreme Regime
Figure 23: Risk contributions with respect to the risk appetite - Normal Regime
713967B_221076 White Paper N°11.indd 49 18/03/14 11:56
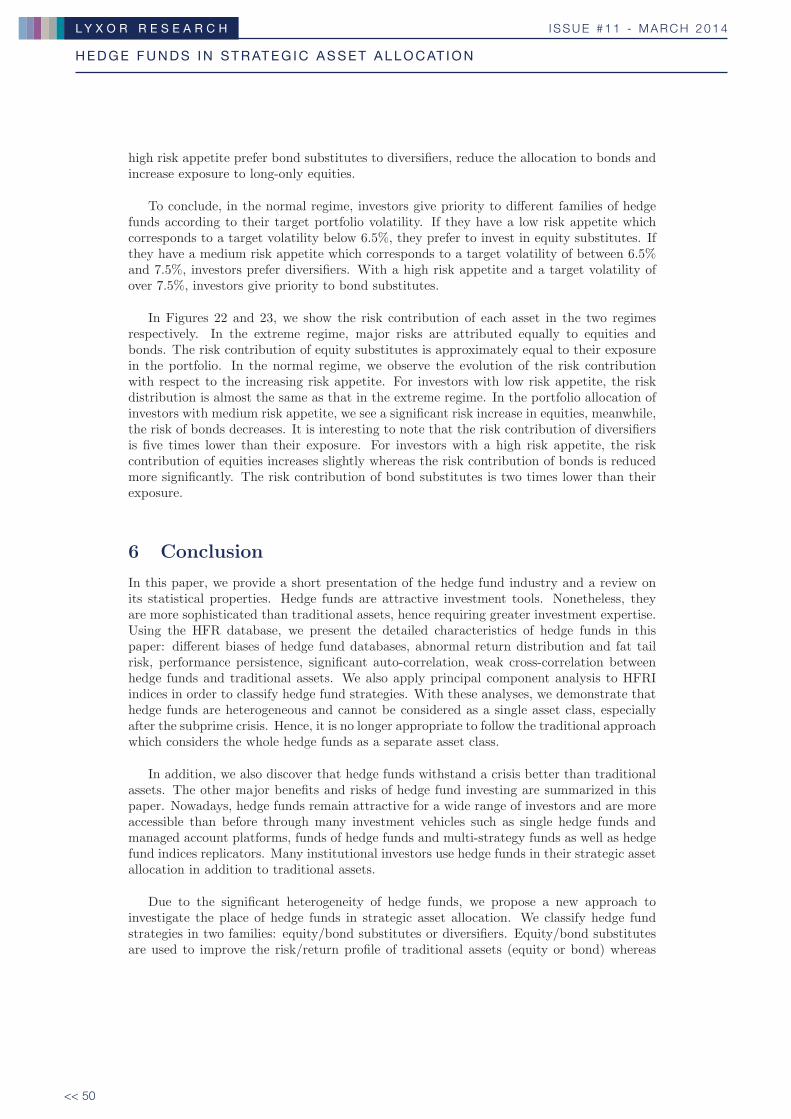
H E D G E F U N D S I N S T R AT E G I C A S S E T A L L O C AT I O N
I S S U E # 1 1 - M A R C H 2 0 1 4L Y X O R R E S E A R C H
<< 50
high risk appetite prefer bond substitutes to diversifiers, reduce the allocation to bonds andincrease exposure to long-only equities.
To conclude, in the normal regime, investors give priority to different families of hedgefunds according to their target portfolio volatility. If they have a low risk appetite whichcorresponds to a target volatility below 6.5%, they prefer to invest in equity substitutes. Ifthey have a medium risk appetite which corresponds to a target volatility of between 6.5%and 7.5%, investors prefer diversifiers. With a high risk appetite and a target volatility ofover 7.5%, investors give priority to bond substitutes.
In Figures 22 and 23, we show the risk contribution of each asset in the two regimesrespectively. In the extreme regime, major risks are attributed equally to equities andbonds. The risk contribution of equity substitutes is approximately equal to their exposurein the portfolio. In the normal regime, we observe the evolution of the risk contributionwith respect to the increasing risk appetite. For investors with low risk appetite, the riskdistribution is almost the same as that in the extreme regime. In the portfolio allocation ofinvestors with medium risk appetite, we see a significant risk increase in equities, meanwhile,the risk of bonds decreases. It is interesting to note that the risk contribution of diversifiersis five times lower than their exposure. For investors with a high risk appetite, the riskcontribution of equities increases slightly whereas the risk contribution of bonds is reducedmore significantly. The risk contribution of bond substitutes is two times lower than theirexposure.
6 Conclusion
In this paper, we provide a short presentation of the hedge fund industry and a review onits statistical properties. Hedge funds are attractive investment tools. Nonetheless, theyare more sophisticated than traditional assets, hence requiring greater investment expertise.Using the HFR database, we present the detailed characteristics of hedge funds in thispaper: different biases of hedge fund databases, abnormal return distribution and fat tailrisk, performance persistence, significant auto-correlation, weak cross-correlation betweenhedge funds and traditional assets. We also apply principal component analysis to HFRIindices in order to classify hedge fund strategies. With these analyses, we demonstrate thathedge funds are heterogeneous and cannot be considered as a single asset class, especiallyafter the subprime crisis. Hence, it is no longer appropriate to follow the traditional approachwhich considers the whole hedge funds as a separate asset class.
In addition, we also discover that hedge funds withstand a crisis better than traditionalassets. The other major benefits and risks of hedge fund investing are summarized in thispaper. Nowadays, hedge funds remain attractive for a wide range of investors and are moreaccessible than before through many investment vehicles such as single hedge funds andmanaged account platforms, funds of hedge funds and multi-strategy funds as well as hedgefund indices replicators. Many institutional investors use hedge funds in their strategic assetallocation in addition to traditional assets.
Due to the significant heterogeneity of hedge funds, we propose a new approach toinvestigate the place of hedge funds in strategic asset allocation. We classify hedge fundstrategies in two families: equity/bond substitutes or diversifiers. Equity/bond substitutesare used to improve the risk/return profile of traditional assets (equity or bond) whereas
713967B_221076 White Paper N°11.indd 50 18/03/14 11:56

H E D G E F U N D S I N S T R AT E G I C A S S E T A L L O C AT I O N
I S S U E # 1 1 - M A R C H 2 0 1 4L Y X O R R E S E A R C H
51 >>
diversifiers are expected to provide absolute performance and diversification for traditionalassets. Moreover, to get rid of the non-normality of hedge funds, we apply a regime switchingMarkowitz model to determine the optimal strategic asset allocation with hedge funds inextreme and normal regimes. We find that the optimal allocation in the extreme regimeincludes equity substitutes, whereas, optimal allocation in the normal regime depends ontarget volatility. Investors with a low risk appetite (target volatility below 6.5%) preferequity substitutes. Investors with a medium risk appetite (target volatility of between 6.5%and 7.5%) are more interested in diversifiers. If investors have a high risk appetite (targetvolatility above 7.5%), they give priority to bond substitutes.
713967B_221076 White Paper N°11.indd 51 18/03/14 11:56
H E D G E F U N D S I N S T R AT E G I C A S S E T A L L O C AT I O N
I S S U E # 1 1 - M A R C H 2 0 1 4L Y X O R R E S E A R C H
<< 52
A Comparison of classification in different databases
Table 20: Database classifications
Main
strategy
HFR
TASS
CISDM
Eureka
Hed
ge
Equity
Hedge
EquityMarket
Neu
tral
LongShort
Equity
LongShort
Equity
LongShort
Equity
Fundamen
tal
EquityMarket
Neu
tral
LongOnly
Equity
Bottom-up
QuantitativeDirectional
Ded
icatedShort
Bias
Top-D
own
Sector
Short
Bias
Multi-strategy
Event-Driven
Activist
Event-Driven
DistressedSecurities
Even
t-Driven
Credit
Arbitrage
Even
t-Driven
DistressedDeb
tDistressedRestructuring
Merger
Arbitrage
Private
IssueR
egulationD
SpecialSituations
Multi-strategy
Macro
ActiveTrading
GlobalMacro
GlobalMacro
CTAManaged
Futures
Commodity
Managed
Futures
Macro
Curren
cyDiscretionary
Them
atic
Energy
System
aticDiversified
Multi-strategy
RelativeValue
Fixed
Income
Convertible
Arbitrage
Convertible
Arbitrage
Fixed
Income
Volatility
Fixed
IncomeArbitrage
Deb
tArbitrage&
Arbitrage
Value
Yield
Alternatives
Multi-strategy
Fixed
Income
RelativeValue
Multi-strategy
Multi-strategy
Oth
er
EmergingMarket
EmergingMarket
EmergingMarket
EmergingMarket
Other
DualApproach
Other
713967B_221076 White Paper N°11.indd 52 18/03/14 11:56
H E D G E F U N D S I N S T R AT E G I C A S S E T A L L O C AT I O N
I S S U E # 1 1 - M A R C H 2 0 1 4L Y X O R R E S E A R C H
53 >>
B Markowitz mean variance model with regime switch-ing
The first step of the optimization (1) consists in finding simple expressions of μ(w) andσ(w). It is easy to express the portfolio return rt(w) with the allocation vectors w0 and w1:
rt(w) = w�0 rt(0)(1− st) + w�
1 rt(1)st
=(w�
1 rt(1)− w�0 rt(0)
)st + w�
0 rt(0)
where rt(0) and rt(1) are vectors of asset returns. We deduce that, under the long termstationary distribution, the expected return of the portfolio is:
μ(w) =(w�
1 μ1 − w�0 μ0
)E(st) + w�
0 μ0 (2)
Then, we deduce the standard deviation of the portfolio σ(w):
σ2(w) = var[(w�
1 rt(1)− w�0 rt(0)
)st]+ var
[w�
0 rt(0)]
+2cov[(w�
1 rt(1)− w�0 rt(0)
)st, w
�0 rt(0)
](3)
Besides, we have:
var[(w�
1 rt(1)− w�0 rt(0)
)st]
=
[(w�
1 μ1 − w�0 μ0
)2+
1∑i=0
w�i Σ(i)wi
]E(st)
var[w�
0 rt(0)]
= w�0 Σ(0)w0
cov((w�
1 rt(1)− w�0 rt(0)
)st, w
�0 rt(0)
)= −2E(st)w
�0 Σ(0)w0
Hence, from Equation (3), we get:
σ2(w) =
[(w�
1 μ1 − w�0 μ0
)2+
1∑i=0
w�i Σ(i)wi
]E(st) + [1− 2E(st)]w
�0 Σ(0)w0 (4)
We can simplify Equation (2) and Equation (4) by using a matricial notation. By consider-ing:
w =
(w0
w1
), A =
(−μ0
μ1
), B =
(μ0
0
),
C =
(Σ(0) 00 Σ(1)
), D =
(Σ(0) 00 0
)and E =
(1 00 1
)
the equations (2) and (4) become:
μ(w) = w� (E(st)A+B)
σ2(w) = w� [E(st)
(A�A+ C
)− (2E(st)− 1)D]w
Then, we transform the optimization program in Equation (1) as follows:
w = argminw� [E(st)(AA� + C)− (2E(st)− 1)D
]w − λw�(E(st)A+B) (5)
u.c.
{0 ≤ w ≤ 1w�E = 1
where λ is a risk appetite parameter of the investor. The above optimization problem is asimple quadratic program and can be easily resolved.
713967B_221076 White Paper N°11.indd 53 18/03/14 11:56
H E D G E F U N D S I N S T R AT E G I C A S S E T A L L O C AT I O N
I S S U E # 1 1 - M A R C H 2 0 1 4L Y X O R R E S E A R C H
<< 54
References
[1] Ackermann C., McEnally R., Ravenscraft D. (1999), The performance of hedgefunds: risk, return and incentives, The Journal of Finance, 54(3), pp. 833-874.
[2] Aiken A. L., Clifford C. P., Ellis J. (2013), Out of the dark: Hedge fund reportingbiases and commercial databases, Review of Financial Studies, 26(1), pp. 208-243.
[3] Agarwal V., Fos V. and Jiang W. (2013), Inferring reporting-related biases in hedgefund databases from hedge fund equity holdings, Management Science, 59(6), pp. 1271-1289.
[4] Agarwal V. and Naik N. Y. (2000), Multi-period performance persistence analysis ofhedge funds, Journal of Financial and Quantitative Analysis, 35(03), pp. 327-342.
[5] Aggarwal R. K. and Jorion P. (2010), Hidden Survivorship in Hedge Fund Returns,Financial Analysts Journal, 66(2), pp. 69-74.
[6] Amenc N. and Martellini L. (2003), The Brave New World of Hedge Funds Indices,Working paper, EDHEC Risk and Asset Management Research Centre.
[7] Amenc N., Gehin W., Martellini L. and Meyfredi J. C. (2007), The myths andlimits of passive hedge fund replication, Working paper, EDHEC Risk and Asset Man-agement Research Centre.
[8] Amenc N., Goltz F. and Martellini L. (2005), Hedge funds from the institutionalinvestor’s perspective, Hedge Funds, Insights in Performance Measurement, Risk Anal-ysis, and Portfolio Allocation, Edited by Gregoriou, GN, G. Hubner, N. Papageorgiou,and F. Rouah, Wiley.
[9] Amenc N., Martellini L. and Vaissie M. (2003), Benefits and risks of alternativeinvestment strategies. Journal of Asset Management, 4(2), pp. 96-118.
[10] Amenc N., Martellini L., Meyfredi J. C. and Ziemann V. (2009), Performanceof passive hedge fund replication strategies, Working paper, EDHEC Risk and AssetManagement Research Centre.
[11] Amin G. S. andKat H. M. (2003), Hedge Fund Performance 1990-2000: Do the ‘MoneyMachines’ Really Add Value?, Journal of Financial and Quantitative Analysis, 38(2),pp. 251-274.
[12] Ammann M., Huber O. and Schmid M. (2011), Has hedge fund alpha disappeared?,Journal of Investment Management, 9(1), pp. 50-71.
[13] Ammann M., Huber O. and Schmid M. (2013), Hedge fund characteristics and per-formance persistence, European Financial Management, 19(2), pp. 209-250.
[14] Anson M. J. (2006), Handbook of Alternate Assets, Wiley.
[15] Barry R. (2003), Hedge Funds: A Walk in the Graveyard, Working paper, MacquarieUniversity Applied Finance Centre.
[16] Bartletta S. and Lord H. (2013), The New Challenge for Hedge Funds: OperationalExcellence, Boston Consulting Group.
[17] Boyson N. M. (2003), Why do experienced hedge fund managers have lower returns,Working paper, Purdue University.
713967B_221076 White Paper N°11.indd 54 18/03/14 11:56
H E D G E F U N D S I N S T R AT E G I C A S S E T A L L O C AT I O N
I S S U E # 1 1 - M A R C H 2 0 1 4L Y X O R R E S E A R C H
55 >>
[18] Brennan M. J., Schwartz E. S. and Lagnado R. (1997), Strategic asset allocation,Journal of Economic Dynamics and Control, 21(8), pp. 1377-1403.
[19] Brooks C. and Kat H. M. (2002), The statistical properties of hedge funds indexreturns and their implications for investors, The Journal of Alternative Investments,5(2), pp. 26-44.
[20] Brown S. J. and Goetzmann W. N. (1997). Mutual fund styles. Journal of financialEconomics, 43(3), pp. 373-399.
[21] Brown S. J. and Goetzmann W. N. (2003), Hedge funds with style, Journal ofPortfolio Management, 29(Winter), pp. 101-112.
[22] Brown S. J., Goetzmann W. N. and Ibbotson R. G. (1999), Offshore hedge funds:survival and performance, 1989-1995, Journal of Business, 72(1), pp. 91-118.
[23] Brown S., Goetzmann W., Liang B. and Schwarz C. (2008), Estimating opera-tional risk for hedge funds: The ω-score, Working paper, www.ssrn.com/abstract=1086341.
[24] Busse J.A. and Irvine P.J. (2006), Bayesian alphas and mutual fund persistence, TheJournal of Finance, 61(5), pp. 2251-2288.
[25] Caldwell T. (1995), Introduction: The model for superior performance, Hedge Funds,pp. 1-17.
[26] Campbell J. Y. and Viceira L. M. (2002), Strategic asset allocation: portfolio choicefor long-term investors, Clarendon Lecture un Economics, Oxford University Press.
[27] Cazalet Z. and Roncalli T. (2011), Hedge Fund Replication, Factors Selection andthe Lasso Method: The Static Case, Working paper, Lyxor Asset Management.
[28] Cici G., Kempf A. and Putz A. (2011), The valuation of hedge funds’ equity positions,CFR Working Paper.
[29] Cremers J. H., Kritzman M. and Page S. (2005), Optimal hedge fund allocations,The Journal of Portfolio Management, 31(3), pp.70-81.
[30] Cumming D., Helge Haß L. and Schweizer D. (2012), Strategic Asset Allocationand the Role of Alternative Investments, European Financial Management.
[31] Daglioglu A., Georgiev G. and Gupta B. (2003), The benefits of hedge funds,Working Paper, Center for International Securities and Derivatives.
[32] Dor A. B., Dynkin L. and Gould A. (2006), Style analysis and classification of hedgefunds, The Journal of Alternative Investments, 9(2), pp. 10-29.
[33] Edwards F.R. and Caglayan M.O. (2001), Hedge fund performance and managerskill, Journal of Futures Markets, 21(11), pp. 1003-1028.
[34] Eleanor Xu X., Liu J. and Loviscek A. L. (2011), An Examination of Hedge FundSurvivorship Bias and Attrition Before and During the Global Financial Crisis, TheJournal of Alternative Investments, 13(4), pp. 40-52.
[35] Elton E. J., Gruber M. J. and Blake C. R. (1996), Survivor bias and mutual fundperformance, Review of Financial Studies, 9(4), pp. 1097-1120.
713967B_221076 White Paper N°11.indd 55 18/03/14 11:56
H E D G E F U N D S I N S T R AT E G I C A S S E T A L L O C AT I O N
I S S U E # 1 1 - M A R C H 2 0 1 4L Y X O R R E S E A R C H
<< 56
[36] Erzan O., MacAlpine K. and Szmolyan N. (2012), The Mainstreaming of Alterna-tive Investments Fueling the Next Wave of Growth in Asset Management , McKinseyGlobal Institute.
[37] Eychenne K., Martinetti S. and Roncalli T. (2011), Strategic Asset Allocation,Lyxor White Paper Series, 6, www.lyxor.com.
[38] Farrell D., Lund S. and Sadan K. (2008), The New Power Brokers: Gaining Cloutin Turbulent Markets, McKinsey Global Institute.
[39] Feffer S. and Kundro C. and Lynch D. (2003), Understanding and mitigating op-erational risk in hedge fund investments, A Capco White Paper.
[40] Foster D. P. and Young H. P. (2008), The Hedge Fund Game: Incentives, ExcessReturns, and Piggy-Backing, Economics Repository.
[41] Foster D. P. and Young H. P. (2010), Gaming performance fees by portfolio man-agers, The Quarterly Journal of Economics, 125(4), pp. 1435-1458.
[42] French C., Ko D.B. and Abuaf D. (2005), Diversification and Persistence in HedgeFunds, Available at SSRN 850304.
[43] Fung W. and Hsieh D.A. (1997), Empirical characteristics of dynamic trading strate-gies: The case of hedge funds, Review of Financial Studies, 10(2), pp. 275-302.
[44] Fung W. and Hsieh D.A. (2000), Performance characteristics of hedge funds andcommodity funds: Natural vs. spurious biases, Journal of Financial and QuantitativeAnalysis, 35(3), pp. 291-307.
[45] Fung W. and Hsieh D.A. (2004), Hedge fund benchmarks: A risk-based approach,Financial Analysts Journal, 60(5), pp. 65-80.
[46] Fung W., Hsieh D.A., Naik N.Y. and Ramadorai T. (2008), Hedge funds: Perfor-mance, risk, and capital formation, The Journal of Finance, 63(4), pp. 1777-1803.
[47] Getmansky M., Lo A.W. and Makarov I. (2004), An econometric model of serialcorrelation and illiquidity in hedge fund returns, Journal of Financial Economics, 74(3),pp. 529-609.
[48] Giamouridis D. and Vrontos I. D. (2007), Hedge fund portfolio construction: Acomparison of static and dynamic approaches, Journal of Banking & Finance, 31(1),pp. 199-217.
[49] Gibson R. and Gyger S. (2007), The style consistency of hedge funds, EuropeanFinancial Management, 13(2), pp. 287-308.
[50] Giraud J. R. (2005), Mitigating hedge funds’ operational risks: Benefits and limitationsof managed account platforms, Working paper, EDHEC Risk and Asset ManagementResearch Centre.
[51] Gregoriou G. N. and Rouah F. (2002), The role of hedge funds in pension fundportfolios: Buying protection in bear markets, Pensions: An International Journal,7(3), pp. 237-245.
[52] Grinblatt M. and Titman S. (1989), Mutual Fund Performance: An Analysis ofQuarterly Portfolio Holdings, The Journal of Business, 62(3), pp. 393-416.
713967B_221076 White Paper N°11.indd 56 18/03/14 11:56
H E D G E F U N D S I N S T R AT E G I C A S S E T A L L O C AT I O N
I S S U E # 1 1 - M A R C H 2 0 1 4L Y X O R R E S E A R C H
57 >>
[53] Hasanhodzic J. and Lo A. W. (2007), Can Hedge-Fund Returns Be Replicated?: TheLinear Case, Journal of Investment Management, 5(2), pp. 5-45.
[54] Hitaj A., Martellini L. and Zambruno G.(2012), Optimal hedge fund allocationwith improved estimates for coskewness and cokurtosis parameters, The Journal ofAlternative Investments, 14(3), pp. 6-16.
[55] Ibbotson R.G., Chen P. and Zhu K. X. (2011), The ABCs of hedge funds: alphas,betas, and costs, Financial Analysts Journal, 67(1), pp. 15-25.
[56] Jagannathan R., Malakhov A. and Novikov D. (2010), Do hot hands exist amonghedge fund managers? An empirical evaluation, The Journal of Finance, 65(1), pp.217-255.
[57] Joenvaara J. and Kosowski R. (2012), An Analysis of the Convergence betweenMainstream and Alternative Asset Management, EDHEC Risk and Asset ManagementResearch Center.
[58] Kim C. J. and Nelson C. R. (1999), State-Space Models with Regime Switching, MITPress.
[59] Kosowski R., Naik N. Y. and Teo M. (2007), Do hedge funds deliver alpha? ABayesian and bootstrap analysis, Journal of Financial Economics, 84(1), pp. 229-264.
[60] Kosowski R., Timmermann A., Wermers R. and White H. (2006), Can mutualfund ”stars” really pick stocks? New evidence from a bootstrap analysis, The Journalof finance, 61(6), pp. 2551-2595.
[61] Lamm R. M. (1999), Portfolios of alternative assets: why not 100% hedge funds?, TheJournal of Investing, 8(4), pp. 87-97.
[62] Lhabitant F. and Learned M. (2002), Hedge fund diversification: How much isenough?, Working paper, www.ssrn.com/abstract=322400.
[63] Lhabitant F. S. (2006), Handbook of hedge funds (Vol. 579), Wiley.
[64] Liang B. (1999), On the performance of hedge funds, Financial Analysts Journal,55(4), pp. 72-85.
[65] Liang B. (2000), Hedge funds: The living and the dead, Journal of Financial andQuantitative Analysis, 35(3), pp. 309-326.
[66] Liang B. (2001), Hedge fund performance: 1990-1999, Financial Analysts Journal,57(1), pp. 11-18.
[67] Lo A. (2001), Risk management for hedge funds: Introduction and overview, FinancialAnalysts Journal, 57(6), pp. 16-33.
[68] Malkiel B.G. (1995), Returns from Investing in Equity Mutual Funds 1971 to 1991,Journal of Finance, 50(2), pp. 549-570.
[69] Martellini L. and Ziemann V.(2010), Improved estimates of higher-order comomentsand implications for portfolio selection, Review of Financial Studies, 23(4), pp. 1467-1502.
713967B_221076 White Paper N°11.indd 57 18/03/14 11:56
H E D G E F U N D S I N S T R AT E G I C A S S E T A L L O C AT I O N
I S S U E # 1 1 - M A R C H 2 0 1 4L Y X O R R E S E A R C H
<< 58
[70] Martellini L., VaissieM. andGoltz F. (2004), Hedge fund indices from an academicperspective: Reconciling investability and representativity, Working paper, EDHECRisk and Asset Management Research Center.
[71] Park J., Brown S.J. and Goetzmann W.N. (1999), Performance Benchmarks andSurvivorship Bias for Hedge Funds and Commodity Trading Advisors, Hedge FundNews.
[72] Roncalli T. and Teıletche, J. (2007), An Alternative Approach to Alternative Beta,Working paper, www.ssrn.com/abstract=1035521.
[73] Ruckstuhl A., Meier P., Lodeiro S. and Kundig O. (2004), Funds of hedge fundsindices: properties, purposes and representativeness, Working paper, EDHEC Risk andAsset Management Research Centre.
[74] Sadka R. (2010), Liquidity risk and the cross-section of hedge-fund returns, Journalof Financial Economics, 98(1), pp. 54-71.
[75] Signer A. and Favre L. (2002), The difficulties of measuring the benefits of hedgefunds, The Journal of Alternative Investments, 5(1), pp. 31-41.
[76] Sornette D., Andersen J. V. and Simonetti (2000), Portfolio Theory for ”‘FatTails”’, International Journal of Theoretical and Applied Finance, 3(3), pp. 523-535.
[77] Stevenson S. (2007), Fund of hedge funds: origins, role and future, Financial StabilityReview, 10(1), pp. 151-160.
[78] Swensen D. F. (2000), Pioneering Portfolio Management: An Unconventional Ap-proach to Institutional Investment, Fully Revised and Updated, Free press.
[79] Teıletche J. (2010), Les hedge funds, la Decouverte.
[80] Teo M. (2011), The liquidity risk of liquid hedge funds, Journal of Financial Eco-nomics, 100(1), pp. 24-44.
[81] Yin G. and Zhou X.Y.(2004), Markowitz’s mean-variance portfolio selection withregime switching: from discrete-time models to their continuous-time limits, IEEETransactions on Automatic Control, 49(3), pp. 349-360.
[82] Zhong Z. (2008), Why does hedge fund alpha decrease over time? Evidence fromindividual hedge funds, Working Paper, www.ssrn.com/abstract=1108817.
713967B_221076 White Paper N°11.indd 58 18/03/14 11:56

H E D G E F U N D S I N S T R AT E G I C A S S E T A L L O C AT I O N
I S S U E # 1 1 - M A R C H 2 0 1 4L Y X O R R E S E A R C H
59 >>
713967B_221076 White Paper N°11.indd 59 18/03/14 11:56
H E D G E F U N D S I N S T R AT E G I C A S S E T A L L O C AT I O N
I S S U E # 1 1 - M A R C H 2 0 1 4L Y X O R R E S E A R C H
<< 60
Lyxor White Paper Series
List of Issues
• Issue #1 – Risk-Based Indexation.
Paul Demey, Sebastien Maillard and Thierry Roncalli, March 2010.
• Issue #2 – Beyond Liability-Driven Investment: New Perspectives onDefined Benefit Pension Fund Management.
Benjamin Bruder, Guillaume Jamet and Guillaume Lasserre, March 2010.
• Issue #3 – Mutual Fund Ratings and Performance Persistence.
Pierre Hereil, Philippe Mitaine, Nicolas Moussavi and Thierry Roncalli, June 2010.
• Issue #4 – Time Varying Risk Premiums & Business Cycles: A Survey.
Serge Darolles, Karl Eychenne and Stephane Martinetti, September 2010.
• Issue #5 – Portfolio Allocation of Hedge Funds.
Benjamin Bruder, Serge Darolles, Abdul Koudiraty and Thierry Roncalli, January2011.
• Issue #6 – Strategic Asset Allocation.
Karl Eychenne, Stephane Martinetti and Thierry Roncalli, March 2011.
• Issue #7 – Risk-Return Analysis of Dynamic Investment Strategies.
Benjamin Bruder and Nicolas Gaussel, June 2011.
• Issue #8 – Trend Filtering Methods for Momentum Strategies.
Benjamin Bruder, Tung-Lam Dao, Jean-Charles Richard and Thierry Roncalli, De-cember 2011.
• Issue #9 – How to Design Target Date Funds?
Benjamin Bruder, Leo Culerier and Thierry Roncalli, September 2012.
• Issue #10 – Regularization of Portfolio Allocation
Benjamin Bruder, Nicolas Gaussel, Jean-Charles Richard and Thierry Roncalli, June2013.
713967B_221076 White Paper N°11.indd 60 18/03/14 11:56
H E D G E F U N D S I N S T R AT E G I C A S S E T A L L O C AT I O N
I S S U E # 1 1 - M A R C H 2 0 1 4L Y X O R R E S E A R C H
61 >>
Disclaimer
Each of this material and its content is confidential and may not be reproduced or providedto others without the express written permission of Lyxor Asset Management (“Lyxor AM”).This material has been prepared solely for informational purposes only and it is not intendedto be and should not be considered as an offer, or a solicitation of an offer, or an invitationor a personal recommendation to buy or sell participating shares in any Lyxor Fund, orany security or financial instrument, or to participate in any investment strategy, directlyor indirectly.
It is intended for use only by those recipients to whom it is made directly available by LyxorAM. Lyxor AM will not treat recipients of this material as its clients by virtue of theirreceiving this material.
This material reflects the views and opinions of the individual authors at this date and inno way the official position or advices of any kind of these authors or of Lyxor AM and thusdoes not engage the responsibility of Lyxor AM nor of any of its officers or employees. Allperformance information set forth herein is based on historical data and, in some cases, hy-pothetical data, and may reflect certain assumptions with respect to fees, expenses, taxes,capital charges, allocations and other factors that affect the computation of the returns.Past performance is not necessarily a guide to future performance. While the information(including any historical or hypothetical returns) in this material has been obtained fromexternal sources deemed reliable, neither Societe Generale (“SG”), Lyxor AM, nor their af-filiates, officers employees guarantee its accuracy, timeliness or completeness. Any opinionsexpressed herein are statements of our judgment on this date and are subject to change with-out notice. SG, Lyxor AM and their affiliates assume no fiduciary responsibility or liabilityfor any consequences, financial or otherwise, arising from, an investment in any security orfinancial instrument described herein or in any other security, or from the implementationof any investment strategy.
Lyxor AM and its affiliates may from time to time deal in, profit from the trading of, hold,have positions in, or act as market makers, advisers, brokers or otherwise in relation to thesecurities and financial instruments described herein.
Service marks appearing herein are the exclusive property of SG and its affiliates, as thecase may be.
This material is communicated by Lyxor Asset Management, which is authorized and reg-ulated in France by the “Autorite des Marches Financiers” (French Financial Markets Au-thority).
c©2014 LYXOR ASSET MANAGEMENT ALL RIGHTS RESERVED
713967B_221076 White Paper N°11.indd 61 18/03/14 11:56

713967B_221076 White Paper N°11.indd 62 18/03/14 11:56

713967B_221076 White Paper N°11.indd 63 18/03/14 11:56

Lyxor Asset ManagementTours Société Générale - 17 Cours Valmy�92987 Paris La Défense Cedex - France
Lyxor Asset ManagementTours Société Générale - 17 Cours Valmy�92987 Paris La Défense Cedex - France
RÉ
F. (B
)713967 -
03/2
014
713967B_221076 White Paper N°11.indd 64 18/03/14 11:56