Embed Size (px)
Citation preview

OCOTOBER 2013
LYXORLYXOR EDHEC 2013 PRESENTATION
ACCESS OUR EXPERTISE IN HEDGE FUND INVESTING
EDHEC 2013 PRESENTATION

CONTENTS 2
EXECUTIVE SUMMARY 3
IMPROVE HEDGE FUND ALLOCATION PROCESS
IMPROVE TRADITIONAL PORTFOLIO
8
18IMPROVE TRADITIONAL PORTFOLIO
CONCLUSION
18
29
EDHEC RISK DAYS NORTH AMERICA 2013 OCTOBER 2013EDHEC-RISK DAYS NORTH AMERICA 2013 OCTOBER 2013
EXECUTIVEEXECUTIVE SUMMARYSUMMARY
EDHEC RISK DAYS NORTH AMERICA 2013 OCTOBER 2013EDHEC-RISK DAYS NORTH AMERICA 2013 OCTOBER 2013

4UNIQUE POSITIONING, DYNAMIC GROWTHLyxor Asset Management was established in 1998 to offer innovativefinancial products to institutional investors globally» Headquartered in Paris and regulated by the French Financial Authority
(AMF)» Wholly-owned subsidiary of Societe Generale» Societe Generale’s ratings for long term debt: Moody’s A2 (*) Standard &
A Unique Positioning» Focused on the most dynamic sectors of the AM spectrum:
Beta and Alternative Alpha solutions» A pioneer in selected areas of expertise» Consistently recognized by the industry and peers for quality and
innovation
EUROPE, MIDDLE EAST, AFRICAParis | Amsterdam | Luxembourg | Dublin | Frankfurt | London | MadridLyxor Asset Management S.A. | Lyxor International Asset Management S.A.
Lyxor Asset Management Ireland Ltd. | Lyxor Asset Management Luxembourg S.A | $97.9 billion
» Societe Generale’s ratings for long-term debt: Moody’s A2 (*), Standard &Poor’s A (**), Fitch A (***)
innovation*As of June 10, 2013: ** As of June 20, 2013; *** As of July 17, 2013
Lyxor Asset Management UK LLP AMERICASNew York
Lyxor Asset Management Inc.*
ASIA PACIFICTokyo | Shanghai | Hong Kong
Lyxor AM Japan Co. Ltd.Fortune SG Fund Management Co.
of AUM (1)
ETF39%
Structured Investments
28%
$27.5 Bn39%
$38.7 Bn
$7.8 Bn
600
Multi -Asset Investments
8%
Alt tiChinese JV*
$20.4 Bn$3.5 Bn
EDHEC RISK DAYS NORTH AMERICA 2013 OCTOBER 2013
(1) Figures as of August 31, 2013 - Equivalent to € 73.9 Bn*Lyxor AM Inc. is a US registered advisory subsidiary** These assets correspond to Lyxor’s participation in 49% of the capital of Fortune SG Fund Management Co., Ltd. (“Fortune SG”). Fortune SG is a joint venture with Baosteel Group, and Lyxor Fortune SG manages portfolios mainly invested in China equity, bond and money markets for Chinese investors.
Investment & Research Team | Business & Sales PresenceBusiness & Sales Presence
600Professionals
Covering all Major Markets
Alternative Investments
21%
Chinese JV4%
EDHEC-RISK DAYS NORTH AMERICA 2013 OCTOBER 2013
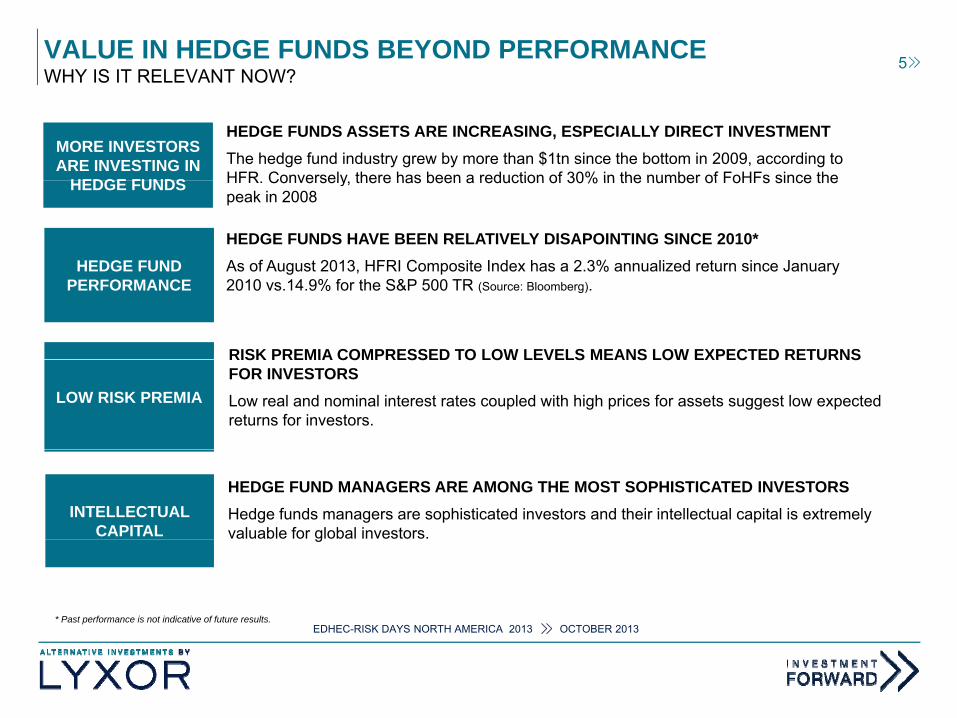
VALUE IN HEDGE FUNDS BEYOND PERFORMANCE 5WHY IS IT RELEVANT NOW?
MORE INVESTORS ARE INVESTING IN
HEDGE FUNDS
HEDGE FUNDS ASSETS ARE INCREASING, ESPECIALLY DIRECT INVESTMENTThe hedge fund industry grew by more than $1tn since the bottom in 2009, according to HFR Conversely there has been a reduction of 30% in the number of FoHFs since theHEDGE FUNDS HFR. Conversely, there has been a reduction of 30% in the number of FoHFs since the peak in 2008
HEDGE FUNDHEDGE FUNDS HAVE BEEN RELATIVELY DISAPOINTING SINCE 2010*As of August 2013, HFRI Composite Index has a 2.3% annualized return since January
RISK PREMIA COMPRESSED TO LOW LEVELS MEANS LOW EXPECTED RETURNS
HEDGE FUND PERFORMANCE
As of August 2013, HFRI Composite Index has a 2.3% annualized return since January 2010 vs.14.9% for the S&P 500 TR (Source: Bloomberg).
LOW RISK PREMIA
RISK PREMIA COMPRESSED TO LOW LEVELS MEANS LOW EXPECTED RETURNS FOR INVESTORSLow real and nominal interest rates coupled with high prices for assets suggest low expected returns for investors.
INTELLECTUAL CAPITAL
HEDGE FUND MANAGERS ARE AMONG THE MOST SOPHISTICATED INVESTORSHedge funds managers are sophisticated investors and their intellectual capital is extremely valuable for global investors.
EDHEC RISK DAYS NORTH AMERICA 2013 OCTOBER 2013
g
* Past performance is not indicative of future results.EDHEC-RISK DAYS NORTH AMERICA 2013 OCTOBER 2013

VALUE IN HEDGE FUNDS BEYOND PERFORMANCE 6ALONG THE DECISION CHAIN
(II) Sourcing new hedge funds• Leveraging on the manager’s
network to source new talent
(I) Investors decide how much they want to invest in hedge funds• Views and projections on how global network to source new talent• Views and projections on how global
assets are likely to perform
• Key risks ahead
• Key opportunities ahead
SOURCINGSOURCING
• Best Trade Ideas (III) HF due diligence• Referencing managers
• Cross-referencing trades or investment
DUE DILLIGENCE
DUE DILLIGENCE
HOW MUCH IN HEDGE FUNDS?
HOW MUCH IN HEDGE FUNDS?
processes
(V) Investment Monitoring• Position cross-referencing
• “Insider” stories ALLOCATIONALLOCATIONMONITORINGMONITORING
(IV) Allocating in a portfolio of hedge funds• Understand the expected
returns and correlation of the managers
EDHEC RISK DAYS NORTH AMERICA 2013 OCTOBER 2013
• Crowdingmanagers
• Forward top-down scenario building
EDHEC-RISK DAYS NORTH AMERICA 2013 OCTOBER 2013
HEDGE FUNDS:HEDGE FUNDS: HELP IMPROVEHELP IMPROVE
THE ALLOCATIONTHE ALLOCATION PROCESSPROCESS
EDHEC RISK DAYS NORTH AMERICA 2013 OCTOBER 2013EDHEC-RISK DAYS NORTH AMERICA 2013 OCTOBER 2013

IMPROVE HEDGE FUND ALLOCATION PROCESS USING HFs 8WHAT DO WE NEED?
A hedge fund allocation process will combine:A hedge fund allocation process will combine:
Views on expected return and correlation across the different hedge p gfunds and strategies in different top-down scenarios
Views on expected risks attached to the performance of the underlyingViews on expected risks attached to the performance of the underlying hedge funds or strategies
EDHEC RISK DAYS NORTH AMERICA 2013 OCTOBER 2013EDHEC-RISK DAYS NORTH AMERICA 2013 OCTOBER 2013

IMPROVE HEDGE FUND ALLOCATION PROCESS USING HFs 9A PROPOSED FRAMEWORK
Quarterly scenario based, bottom-up process:
Use hedge fund managers to :Use hedge fund managers to :
Establish likelyhood of 3 key forward scenarios
Survey the managers to:
Establish what peformance they expect to produce in each of the scenarioEstablish what peformance they expect to produce in each of the scenario
Keep a database of the results of the survey over time to analyze:Keep a database of the results of the survey over time to analyze:
Which hedge funds are good at predicting the environement and their own
performance and could be emphasized in the process.
EDHEC RISK DAYS NORTH AMERICA 2013 OCTOBER 2013
Any potential signals to help better forecast risk, return or scenario
likelyhood.EDHEC-RISK DAYS NORTH AMERICA 2013 OCTOBER 2013
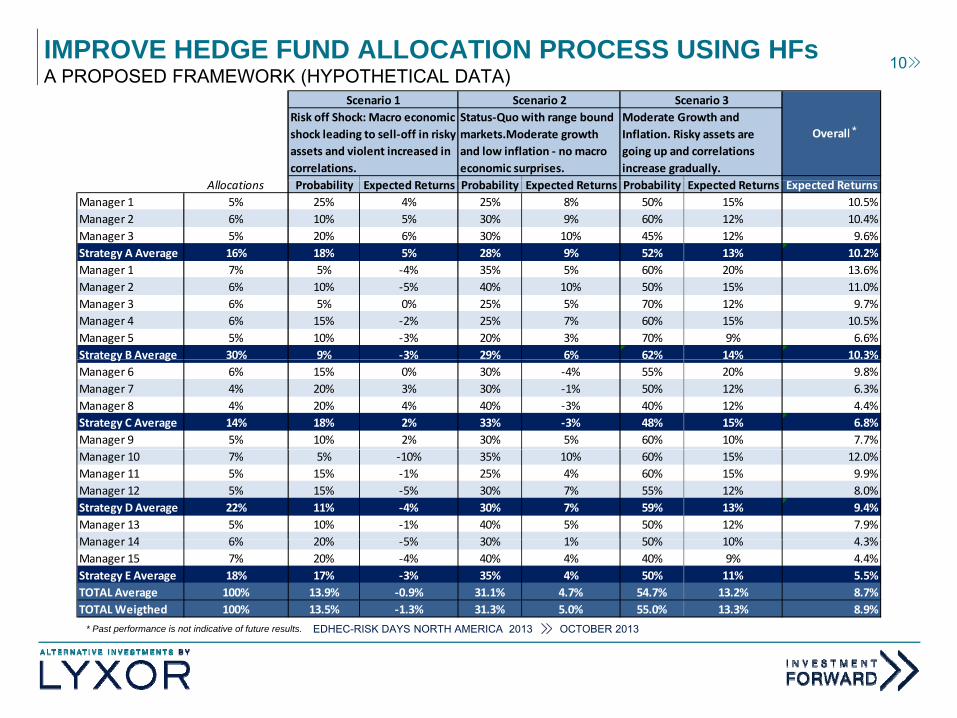
IMPROVE HEDGE FUND ALLOCATION PROCESS USING HFs 10A PROPOSED FRAMEWORK (HYPOTHETICAL DATA)
Overall
Scenario 2Status‐Quo with range bound markets.Moderate growth and low inflation ‐ no macro economic surprises.
Scenario 1Risk off Shock: Macro economic shock leading to sell‐off in risky assets and violent increased in correlations.
Scenario 3Moderate Growth and Inflation. Risky assets are going up and correlations increase gradually.
*
Allocations Probability Expected Returns Probability Expected Returns Probability Expected Returns Expected ReturnsManager 1 5% 25% 4% 25% 8% 50% 15% 10.5%Manager 2 6% 10% 5% 30% 9% 60% 12% 10.4%Manager 3 5% 20% 6% 30% 10% 45% 12% 9.6%Strategy A Average 16% 18% 5% 28% 9% 52% 13% 10.2%Manager 1 7% 5% 4% 35% 5% 60% 20% 13 6%Manager 1 7% 5% ‐4% 35% 5% 60% 20% 13.6%Manager 2 6% 10% ‐5% 40% 10% 50% 15% 11.0%Manager 3 6% 5% 0% 25% 5% 70% 12% 9.7%Manager 4 6% 15% ‐2% 25% 7% 60% 15% 10.5%Manager 5 5% 10% ‐3% 20% 3% 70% 9% 6.6%Strategy B Average 30% 9% ‐3% 29% 6% 62% 14% 10.3%gy gManager 6 6% 15% 0% 30% ‐4% 55% 20% 9.8%Manager 7 4% 20% 3% 30% ‐1% 50% 12% 6.3%Manager 8 4% 20% 4% 40% ‐3% 40% 12% 4.4%Strategy C Average 14% 18% 2% 33% ‐3% 48% 15% 6.8%Manager 9 5% 10% 2% 30% 5% 60% 10% 7.7%Manager 10 7% 5% ‐10% 35% 10% 60% 15% 12.0%Manager 11 5% 15% ‐1% 25% 4% 60% 15% 9.9%Manager 12 5% 15% ‐5% 30% 7% 55% 12% 8.0%Strategy D Average 22% 11% ‐4% 30% 7% 59% 13% 9.4%Manager 13 5% 10% ‐1% 40% 5% 50% 12% 7.9%M 14 6% 20% 5% 30% 1% 50% 10% 4 3%
EDHEC RISK DAYS NORTH AMERICA 2013 OCTOBER 2013
Manager 14 6% 20% ‐5% 30% 1% 50% 10% 4.3%Manager 15 7% 20% ‐4% 40% 4% 40% 9% 4.4%Strategy E Average 18% 17% ‐3% 35% 4% 50% 11% 5.5%TOTAL Average 100% 13.9% ‐0.9% 31.1% 4.7% 54.7% 13.2% 8.7%TOTAL Weigthed 100% 13.5% ‐1.3% 31.3% 5.0% 55.0% 13.3% 8.9%
* Past performance is not indicative of future results EDHEC-RISK DAYS NORTH AMERICA 2013 OCTOBER 2013 Past performance is not indicative of future results.
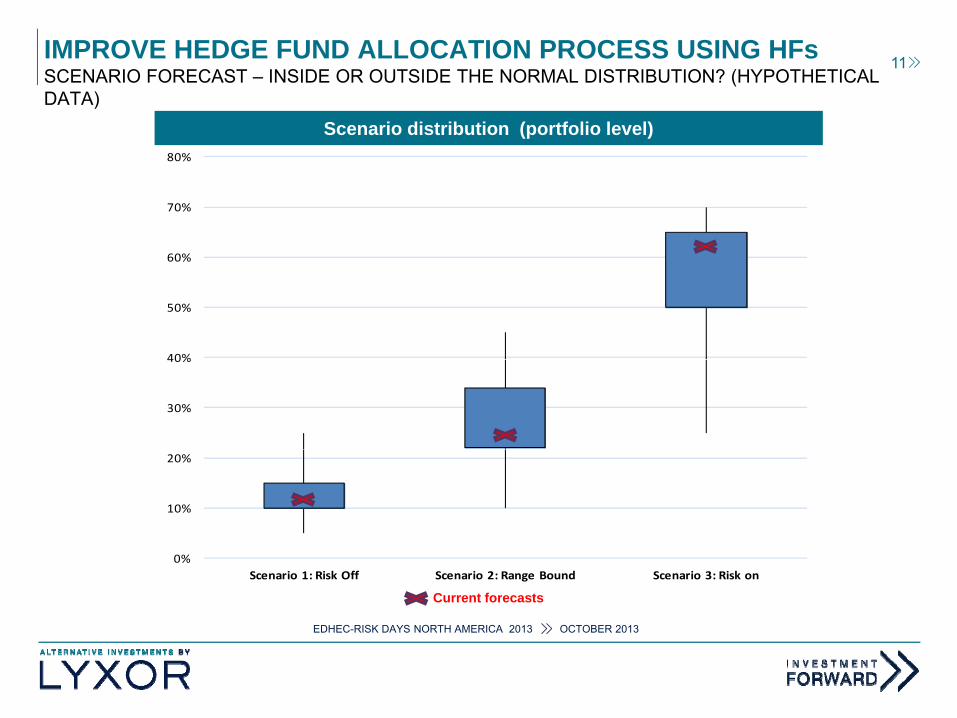
IMPROVE HEDGE FUND ALLOCATION PROCESS USING HFs 11SCENARIO FORECAST – INSIDE OR OUTSIDE THE NORMAL DISTRIBUTION? (HYPOTHETICAL
80%
DATA)Scenario distribution (portfolio level)
60%
70%
40%
50%
30%
40%
10%
20%
EDHEC RISK DAYS NORTH AMERICA 2013 OCTOBER 2013
0%Scenario 1: Risk Off Scenario 2: Range Bound Scenario 3: Risk on
Current forecasts
EDHEC-RISK DAYS NORTH AMERICA 2013 OCTOBER 2013
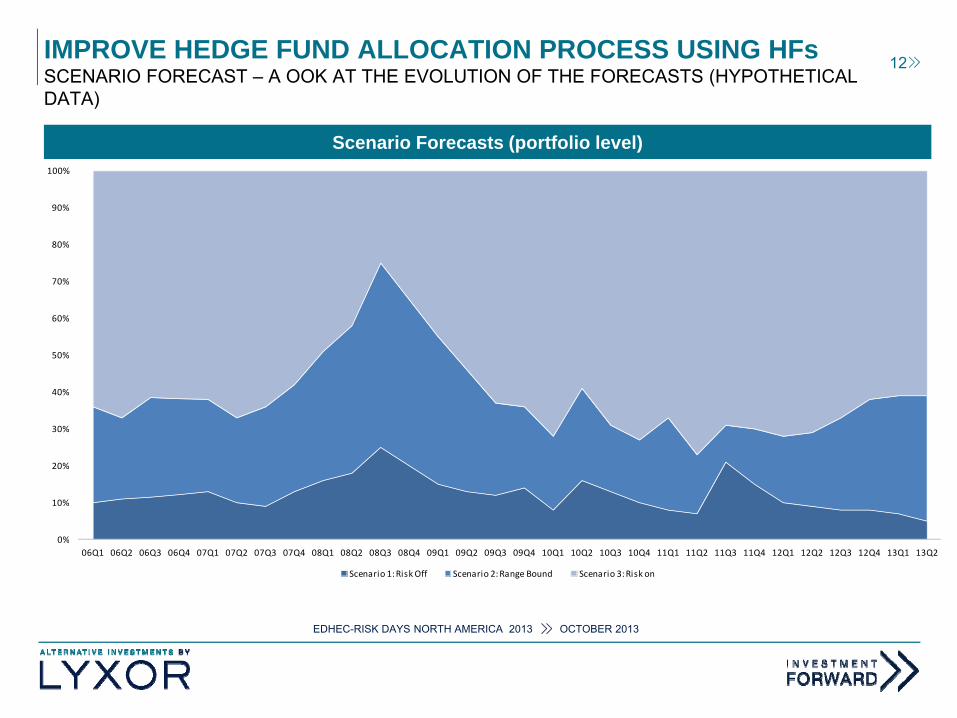
IMPROVE HEDGE FUND ALLOCATION PROCESS USING HFs 12SCENARIO FORECAST – A OOK AT THE EVOLUTION OF THE FORECASTS (HYPOTHETICAL DATA)
100%
Scenario Forecasts (portfolio level)
80%
90%
50%
60%
70%
30%
40%
0%
10%
20%
EDHEC RISK DAYS NORTH AMERICA 2013 OCTOBER 2013
0%06Q1 06Q2 06Q3 06Q4 07Q1 07Q2 07Q3 07Q4 08Q1 08Q2 08Q3 08Q4 09Q1 09Q2 09Q3 09Q4 10Q1 10Q2 10Q3 10Q4 11Q1 11Q2 11Q3 11Q4 12Q1 12Q2 12Q3 12Q4 13Q1 13Q2
Scenario 1: Risk Off Scenario 2: Range Bound Scenario 3: Risk on
EDHEC-RISK DAYS NORTH AMERICA 2013 OCTOBER 2013

IMPROVE HEDGE FUND ALLOCATION PROCESS USING HFs 13SCENARIO X TOOK PLACE WHAT PROBABILITY DID MANAGERS ASCRIBE TO SCENARIO X? (HYPOTHETICAL DATA)
Realized Scenario vs. Forecasts
80%
70%
80%
50%
60%
30%
40%
10%
20%
EDHEC RISK DAYS NORTH AMERICA 2013 OCTOBER 2013
0%1 2 3
Average ProbabilitiesEDHEC-RISK DAYS NORTH AMERICA 2013 OCTOBER 2013
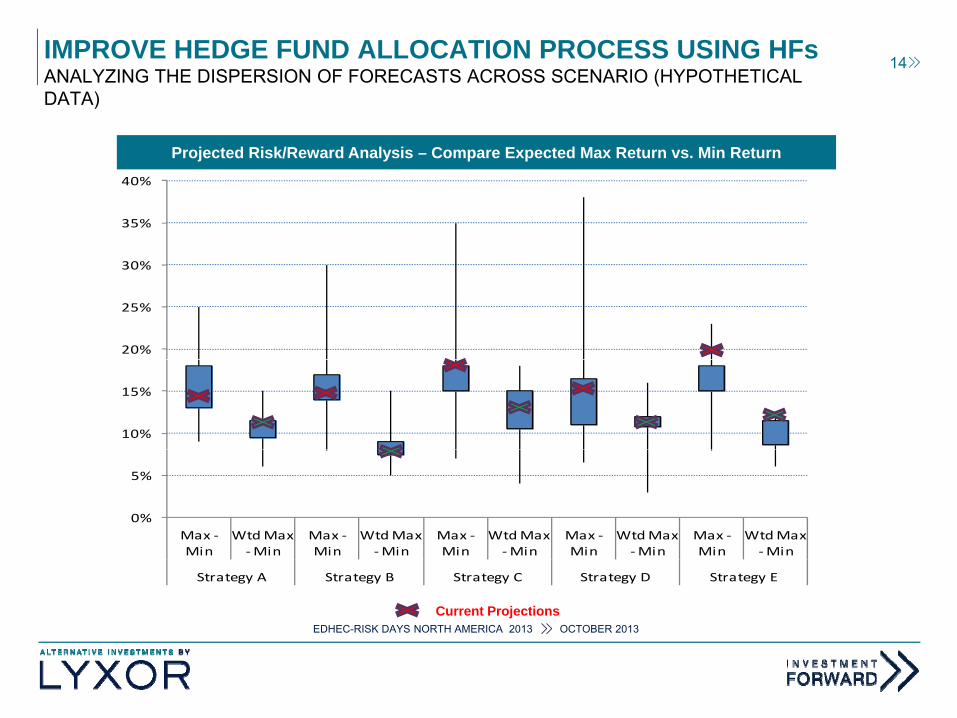
IMPROVE HEDGE FUND ALLOCATION PROCESS USING HFs 14ANALYZING THE DISPERSION OF FORECASTS ACROSS SCENARIO (HYPOTHETICAL
40%
DATA)
Projected Risk/Reward Analysis – Compare Expected Max Return vs. Min Return
30%
35%
40%
20%
25%
10%
15%
0%
5%
Max ‐ WtdMax Max ‐ WtdMax Max ‐ WtdMax Max ‐ WtdMax Max ‐ WtdMax
EDHEC RISK DAYS NORTH AMERICA 2013 OCTOBER 2013
Max Min
Wtd Max ‐Min
Max Min
Wtd Max ‐Min
Max Min
Wtd Max ‐Min
Max Min
Wtd Max ‐Min
Max Min
Wtd Max ‐Min
Strategy A Strategy B Strategy C Strategy D Strategy E
Current ProjectionsEDHEC-RISK DAYS NORTH AMERICA 2013 OCTOBER 2013

IMPROVE HEDGE FUND ALLOCATION PROCESS USING HFs 15CONCLUSION
There’s a lot of information one can extract from simply asking managers what environment they expect to see and how they expect to perform
This set of information can be used to :This set of information can be used to : Better manage the hedge fund allocation
Contribute to the formation of a broader macro or top down viewContribute to the formation of a broader macro or top down view
EDHEC RISK DAYS NORTH AMERICA 2013 OCTOBER 2013EDHEC-RISK DAYS NORTH AMERICA 2013 OCTOBER 2013

IMPROVE HEDGE FUND ALLOCATION PROCESS USING HFs 16CONCLUSION
However, this is not an easy task and here are a set of key issues :
Managers are not always willing to give you the info – they may feel
you are trying to police them or abitrage them
The longer the dataset the more reliable the conclusions are: It is
critical to use historical distributions to properly highlight unusual
behaviors
Th d t t h ti lti i f thThe data set may change over time resulting in some of the
distribution analysis becoming obsolete
Timely result will be key if action needs to be taken liquidity of the
EDHEC RISK DAYS NORTH AMERICA 2013 OCTOBER 2013
Timely result will be key if action needs to be taken – liquidity of the
underlying hedge funds will also be critical.
EDHEC-RISK DAYS NORTH AMERICA 2013 OCTOBER 2013
HEDGE FUNDS:HEDGE FUNDS: HELP IMPROVE AHELP IMPROVE A
TRADITIONALTRADITIONAL PORTFOLIOPORTFOLIO
EDHEC RISK DAYS NORTH AMERICA 2013 OCTOBER 2013EDHEC-RISK DAYS NORTH AMERICA 2013 OCTOBER 2013

IMPROVE A TRADITIONAL PORTFOLIO USING HEDGE FUNDS 18WHAT DO WE NEED?
To improve a traditional portfolio we need:
Medium-term to long term views on asset class expected returns , risks
and correlations and/or
Provide the managers of the portfolio with trading opportunities such as
best ideas or co-invesmtnent opportunities
We can use hedge funds to:
P id ith th i t l f tProvide us with their own asset class forecasts
Exploit position transparency to derive potential predictive indicators for
EDHEC RISK DAYS NORTH AMERICA 2013 OCTOBER 2013
different asset classes.
Share trade ideas and co-investment opporunitiesEDHEC-RISK DAYS NORTH AMERICA 2013 OCTOBER 2013

EXPLOIT POSITION TRANSPARENCYAN EXAMPLE: CAN WE FORECAST S&P 500 USING EXPOSURE INFORMATION FROM L/S
19
EQUITY MANAGERS?
One would think that the overall exposure data of long short equity
managers should give the investors an indication of where the equity
market is heading.
We will show that the level of net exposure alone and the change in the
level of net exposure alone have absolutely no forecasting power.
We will then propose a different metric derived from common sense and
show how forecasting can be greatly improved.
EDHEC RISK DAYS NORTH AMERICA 2013 OCTOBER 2013EDHEC-RISK DAYS NORTH AMERICA 2013 OCTOBER 2013

EXPLOIT POSITION TRANSPARENCY 20AN EXAMPLE WITH L/S EQUITY MANAGERS
DATA SETWEEKLY NET EXPOSURE IN US EQUITIES FOR A DIVERSIFIED GROUP OF L/S MANAGERSAverage of about 32 managers with data from March 2009 to September 2013Average of about 32 managers, with data from March 2009 to September 2013
NAIVE ANALYSISMULTI-TIME FRAME FORECASTING REGRESSION
WHAT ABOUT THE DISPERSION OF NET EXPOSURES?
NAIVE ANALYSIS Can the change or level in net exposure of the last 3 weeks predict what the S&P 500 is going to do for the next three weeks?
A NEW METRIC
WHAT ABOUT THE DISPERSION OF NET EXPOSURES?Intuitively, there should be some value in exploring the dispersion of views rather than the absolute level or change of level in exposure
EDHEC RISK DAYS NORTH AMERICA 2013 OCTOBER 2013EDHEC-RISK DAYS NORTH AMERICA 2013 OCTOBER 2013

EXPLOIT POSITION TRANSPARENCYA LOOK AT THE DATA SET
21
601,800
S&P 500 and Average Net Exposure of a Basket of L/S Managers
50
1,400
1,600
30
40
1,000
1,200
20600
800
10
200
400
EDHEC RISK DAYS NORTH AMERICA 2013 OCTOBER 2013
00
S&P 500 Average Net Exposure
EDHEC-RISK DAYS NORTH AMERICA 2013 OCTOBER 2013
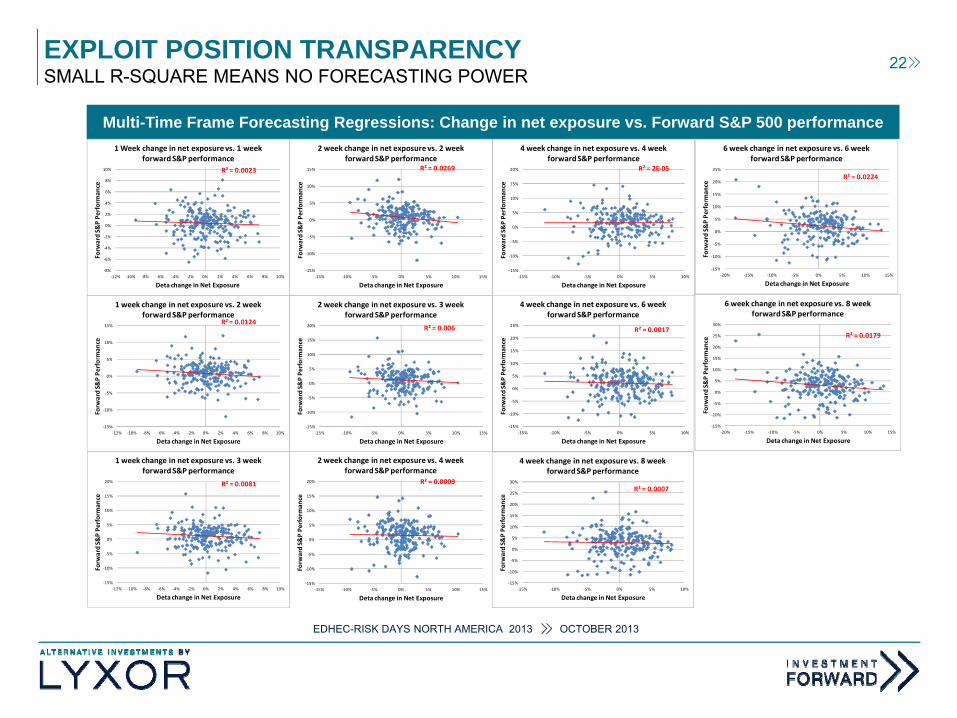
EXPLOIT POSITION TRANSPARENCYSMALL R-SQUARE MEANS NO FORECASTING POWER
22
R² = 0.00238%
10%
1 Week change in net exposure vs. 1 week forward S&P performance
R² = 0.026915%
2 week change in net exposure vs. 2 week forward S&P performance
R² = 2E‐0520%
4 week change in net exposure vs. 4 week forward S&P performance
R² = 0.022425%
6 week change in net exposure vs. 6 week forward S&P performance
Multi-Time Frame Forecasting Regressions: Change in net exposure vs. Forward S&P 500 performance
8%
‐6%
‐4%
‐2%
0%
2%
4%
6%
8%
Forw
ard S&
P Pe
rforman
ce
15%
‐10%
‐5%
0%
5%
10%
Forw
ard S&
P Pe
rforman
ce
15%
‐10%
‐5%
0%
5%
10%
15%
Forw
ard S&
P Pe
rforman
ce
‐15%
‐10%
‐5%
0%
5%
10%
15%
20%
Forw
ard S&
P Pe
rforman
ce
‐8%‐12% ‐10% ‐8% ‐6% ‐4% ‐2% 0% 2% 4% 6% 8% 10%
Deta change in Net Exposure
R² = 0.0124
5%
10%
15%
rman
ce
1 week change in net exposure vs. 2 week forward S&P performance
‐15%‐15% ‐10% ‐5% 0% 5% 10% 15%
Deta change in Net Exposure
R² = 0.006
10%
15%
20%
rman
ce2 week change in net exposure vs. 3 week
forward S&P performance
‐15%‐15% ‐10% ‐5% 0% 5% 10%
Deta change in Net Exposure
R² = 0.0017
15%
20%
25%
rman
ce
4 week change in net exposure vs. 6 week forward S&P performance
15%‐20% ‐15% ‐10% ‐5% 0% 5% 10% 15%
Deta change in Net Exposure
R² = 0.0179
15%
20%
25%
30%
orman
ce
6 week change in net exposure vs. 8 week forward S&P performance
‐15%
‐10%
‐5%
0%
5%
‐12% ‐10% ‐8% ‐6% ‐4% ‐2% 0% 2% 4% 6% 8% 10%
Forw
ard S&
P Pe
rfo
Deta change in Net Exposure
‐15%
‐10%
‐5%
0%
5%
‐15% ‐10% ‐5% 0% 5% 10% 15%
Forw
ard S&
P Pe
rfo
Deta change in Net Exposure
‐15%
‐10%
‐5%
0%
5%
10%
‐15% ‐10% ‐5% 0% 5% 10%
Forw
ard S&
P Pe
rfo
Deta change in Net Exposure
‐15%
‐10%
‐5%
0%
5%
10%
15%
‐20% ‐15% ‐10% ‐5% 0% 5% 10% 15%
Forw
ard S&
P Pe
rfo
Deta change in Net Exposure
R² = 0.0081
0%
5%
10%
15%
20%
&P Pe
rforman
ce
1 week change in net exposure vs. 3 week forward S&P performance
R² = 0.0009
0%
5%
10%
15%
20%
&P Pe
rforman
ce
2 week change in net exposure vs. 4 week forward S&P performance
R² = 0.0007
5%
10%
15%
20%
25%
30%
&P Pe
rforman
ce
4 week change in net exposure vs. 8 week forward S&P performance
EDHEC RISK DAYS NORTH AMERICA 2013 OCTOBER 2013
‐15%
‐10%
‐5%
0%
‐12% ‐10% ‐8% ‐6% ‐4% ‐2% 0% 2% 4% 6% 8% 10%
Forw
ard S&
Deta change in Net Exposure
‐15%
‐10%
‐5%
0%
‐15% ‐10% ‐5% 0% 5% 10% 15%
Forw
ard S&
Deta change in Net Exposure
‐15%
‐10%
‐5%
0%
5%
‐15% ‐10% ‐5% 0% 5% 10%
Forw
ard S&
Deta change in Net Exposure
EDHEC-RISK DAYS NORTH AMERICA 2013 OCTOBER 2013

EXPLOIT POSITION TRANSPARENCYSMALL R-SQUARE MEANS NO FORECASTING POWER
23
Multi-Time Frame Forecasting Regressions: Average net exposure vs. Forward S&P 500 performance
R²= 0 017820%
4 week average net exposure vs. 4 week forward S&P returns
30%
6 week average net exposure vs. 6 week forward S&P returns
R = 0.0178
10%
‐5%
0%
5%
10%
15%
&P forw
ard returns R² = 0.0303
‐5%0%5%10%15%20%25%30%
P forw
ard returns
‐20%
‐15%
‐10%
10 15 20 25 30 35 40 45 50
S&
Average net exposure in the past x weeks
‐20%‐15%‐10%
10 15 20 25 30 35 40 45 50
S&P
Average net exposure in the past x weeks
8 k 8 k f d S&P 8 k 8 k f d S&P
R² = 0.05
0%
10%
20%
30%
ard returns
8 week average net exposure vs. 8 week forward S&P returns
R² = 0.1051
10%
20%
30%
40%
rd returns
8 week average net exposure vs. 8 week forward S&P returns
‐30%
‐20%
‐10%
10 15 20 25 30 35 40 45 50
S&P forw
Average net exposure in the past x weeks
‐20%
‐10%
0%
10%
10 15 20 25 30 35 40 45 50S&
P forw
ar
A t i th t k
EDHEC RISK DAYS NORTH AMERICA 2013 OCTOBER 2013
Average net exposure in the past x weeks Average net exposure in the past x weeks
EDHEC-RISK DAYS NORTH AMERICA 2013 OCTOBER 2013
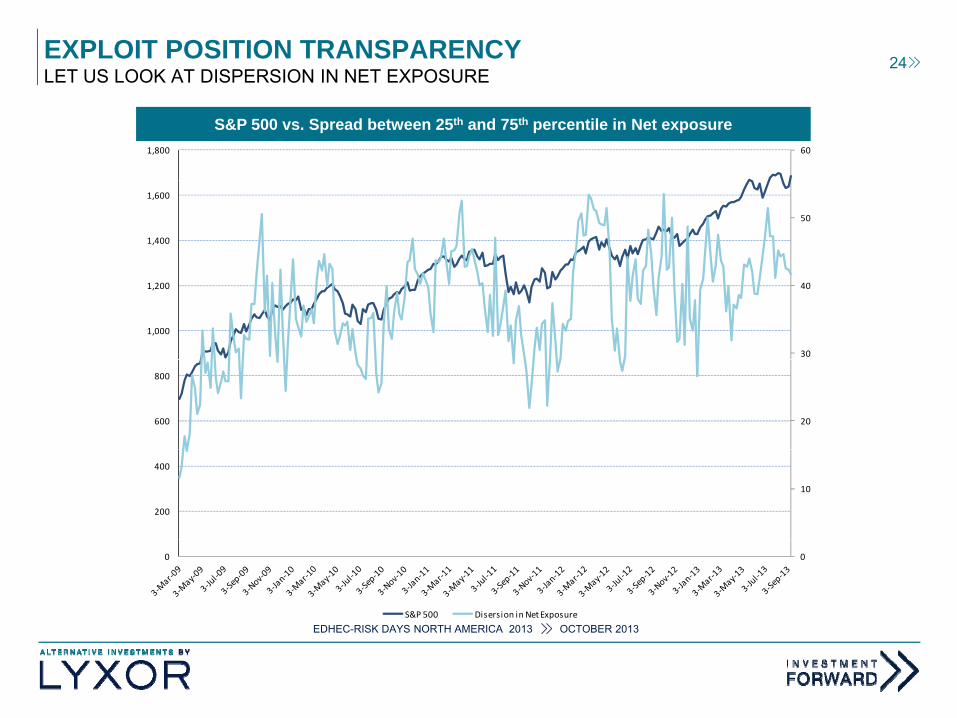
EXPLOIT POSITION TRANSPARENCY 24LET US LOOK AT DISPERSION IN NET EXPOSURE
S&P 500 vs. Spread between 25th and 75th percentile in Net exposure601,800
50
1,400
1,600
30
40
1,000
1,200
20600
800
10
200
400
EDHEC RISK DAYS NORTH AMERICA 2013 OCTOBER 2013
00
S&P 500 Disersion in Net Exposure
EDHEC-RISK DAYS NORTH AMERICA 2013 OCTOBER 2013
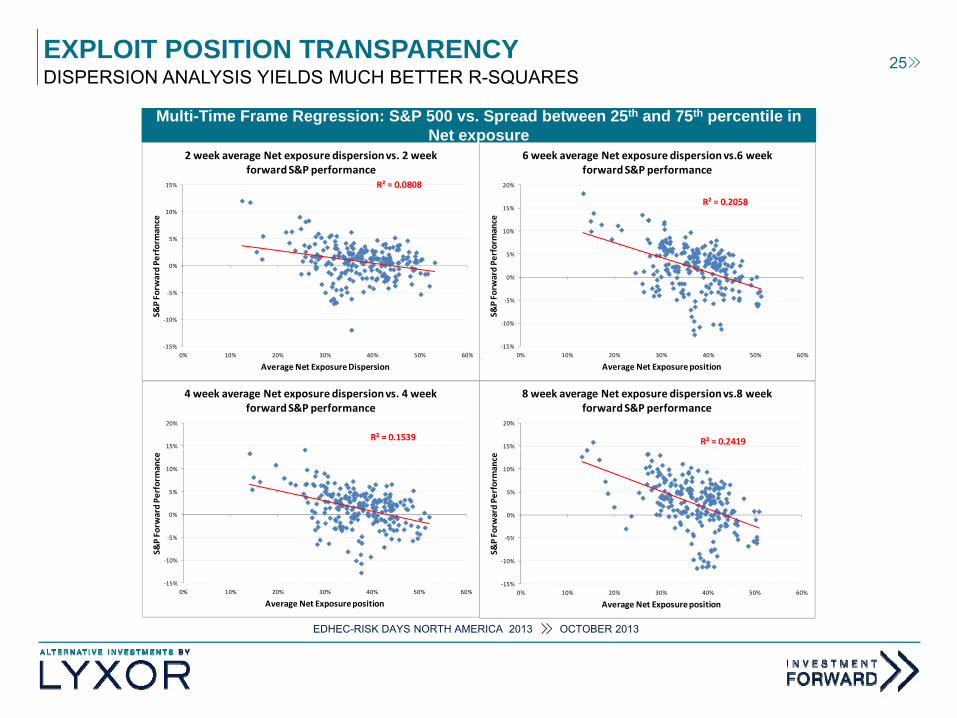
EXPLOIT POSITION TRANSPARENCYDISPERSION ANALYSIS YIELDS MUCH BETTER R-SQUARES
25
2 week average Net exposure dispersion vs. 2 week forward S&P performance
6 week average Net exposure dispersion vs.6 week forward S&P performance
Multi-Time Frame Regression: S&P 500 vs. Spread between 25th and 75th percentile in Net exposure
R² = 0.0808
0%
5%
10%
15%
d Pe
rformance
R² = 0.2058
5%
10%
15%
20%
d Pe
rformance
‐15%
‐10%
‐5%
0% 10% 20% 30% 40% 50% 60%
S&P Forw
ard
‐15%
‐10%
‐5%
0%
0% 10% 20% 30% 40% 50% 60%
S&P Forw
ard
Average Net Exposure Dispersion
R² = 0.153915%
20%
4 week average Net exposure dispersion vs. 4 week forward S&P performance
Average Net Exposure position
R² = 0.241915%
20%
8 week average Net exposure dispersion vs.8 week forward S&P performance
‐5%
0%
5%
10%
P Forw
ard Pe
rformance
‐5%
0%
5%
10%
P Forw
ard Pe
rformance
EDHEC RISK DAYS NORTH AMERICA 2013 OCTOBER 2013
‐15%
‐10%
5%
0% 10% 20% 30% 40% 50% 60%
S&P
Average Net Exposure position
‐15%
‐10%
5%
0% 10% 20% 30% 40% 50% 60%
S&P
Average Net Exposure position
EDHEC-RISK DAYS NORTH AMERICA 2013 OCTOBER 2013

EXPLOIT POSITION TRANSPARENCY 26CONCLUSION
There’s some predictive power in hedge fund positions but extracting it is not straightforward.
Our experience is that focusing on deviations away from average behavior by analyzing distributions yields muchaverage behavior by analyzing distributions yields much better results.
EDHEC RISK DAYS NORTH AMERICA 2013 OCTOBER 2013EDHEC-RISK DAYS NORTH AMERICA 2013 OCTOBER 2013

EXPLOIT POSITION TRANSPARENCY 27PROPOSED FRAMEWORK
The framework we rely on to analyze transparency leverages on the understanding of sentiment driven analyses and can g ygenerally be summarized in the below chart :
T rno er of positions• Turnover of positions• Conditional changes of exposure – e.g.
Large moves at historically large level of exposure
• Level of index/synthetic hedging
CAPITULATION PREDICTIVE SIGNALS
Level of index/synthetic hedging
• Dispersion of exposure• Overlap of positions across managers• Sector & Geographical exposure
CROWDING PREDICTIVE SIGNALS
EDHEC RISK DAYS NORTH AMERICA 2013 OCTOBER 2013EDHEC-RISK DAYS NORTH AMERICA 2013 OCTOBER 2013
CONCLUSION
EDHEC RISK DAYS NORTH AMERICA 2013 OCTOBER 2013EDHEC-RISK DAYS NORTH AMERICA 2013 OCTOBER 2013

CONCLUSION 29
Poor Hedge Fund performance and more sophisticated and demanding investors are forcing us to extract more than performance from our hedge fund investments.
We established that value can be extracted from hedge fundsWe established that value can be extracted from hedge funds to help investors on several levels :
To improve the HF allocation framework using a scenario and p g
performance survey of the managers
Contribute to top-down and/or asset class views using HF position
EDHEC RISK DAYS NORTH AMERICA 2013 OCTOBER 2013
p g p
transparency
EDHEC-RISK DAYS NORTH AMERICA 2013 OCTOBER 2013
CONCLUSION 30
Additional value that can be extracted from Hedge Funds
Best Ideas/Co-Investment
Reverse Inquiries
Networking
EDHEC RISK DAYS NORTH AMERICA 2013 OCTOBER 2013EDHEC-RISK DAYS NORTH AMERICA 2013 OCTOBER 2013
31IMPORTANT INFORMATION (1/2)
Prior to investing in the product, investors should seek independent financial, tax, accounting and legal advice. It is each investor’s responsibility to ascertain that it is authorised to subscribe, or invest into this product. THIS DOCUMENT DOES NOT CONSTITUTE AN OFFER FOR SALE OF SECURITIES IN THE UNITED STATES OF AMERICA. THE PRODUCT HEREIN DESCRIBED WILL NOT BE REGISTERED UNDER THE U.S. SECURITIES ACT OF 1933, AS AMENDED (THE “U.S. SECURITIES ACT”) AND MAY NOT BE OFFERED OR SOLD IN THE UNITED STATES OF AMERICA WITHOUT BEING REGISTERED OR BEING EXEMPTED FROM REGISTRATION UNDER THE U.S. SECURITIES ACT. This document does not constitute an offer, or an invitation to make an offer, from Société Générale or Lyxor AM or any of their respective subsidiaries to purchase or sell the product referred to herein.
Société Générale and Lyxor AM recommend that investors read carefully the “risk factors” section of the product’s documentation (offering memorandum and supplemental memorandum). The product’sSociété Générale and Lyxor AM recommend that investors read carefully the risk factors section of the product s documentation (offering memorandum and supplemental memorandum). The product s documentation can be obtained free of charge upon request to [email protected].
This product includes a risk of capital loss. The redemption value of this product may be less than the amount initially invested. In a worst case scenario, investors could sustain the loss of their entire investment. This document is confidential and may be neither communicated to any third party (with the exception of external advisors on the condition that they themselves respect this confidentiality undertaking) nor copied in whole or in part, without the prior written consent of Lyxor AM or Société Générale.
All information about a Benchmark Fund and Trading Advisor contained in this document (including historical or hypothetical returns) was provided by the Trading Advisor. Such Trading Advisor is not affiliated with SG or Lyxor AM, and none of SG, Lyxor AM or any of their affiliates guarantees the accuracy, timeliness or completeness of such information. None of SG, Lyxor AM or any of their affiliates has checked the y y y g y p y yaccuracy of any data herein provided by such Trading Advisor or the sources thereof nor the methods or underlying data used to prepare this information.
Under normal market conditions, Lyxor intends to offer weekly or monthly liquidity for its managed accounts. However, weekly or monthly liquidity is not guaranteed and there are circumstances under which such liquidity may not be possible, including, but not limited to: 1. Periods during which there are a large number of redemption requests, or where there are one or more large redemption requests; 2. Where Lyxor’srisk management guidelines would prohibit additional liquidity (for example, in the case of managed accounts that are heavily leveraged); 3. Where the underlying investments of a managed account impose additional restrictions on liquidity (for example, the use of “gates”).
The attention of the investor is drawn to the fact that the NAV stated in this document cannot be used as a basis for subscriptions and/or redemptions.
The obtaining of the tax advantages or treatments defined in this document depends on each investor’s particular tax status, the jurisdiction from which it invests as well as applicable laws. This tax treatment can be modified at any time. We recommend to investors who wish to obtain further information on their tax status that they seek assistance from their tax advisor.
The accuracy, completeness or relevance of the information which has been drawn from external sources is not guaranteed although it is drawn from sources reasonably believed to be reliable. Subject to any applicable law, Société Générale and Lyxor AM and their respective subsidiaries shall not assume any liability in this respect.
The market information displayed in this document is based on data at a given moment and may change from time to time.
The Assets Under Management presented herein reflect total assets in all investment vehicles and accounts (“Lyxor Funds”) for which Lyxor provides continuous and regular supervisory or management services for a fee (i.e. administrative, management and/or performance fees as well as other fee sharing arrangements, as applicable), including amounts from certain Lyxor Funds that invest into other Lyxor Funds.
Authorisations: Société Générale is a French credit institution (bank) authorised by the Autorité de contrôle prudentiel (the French Prudential Control Authority).
Lyxor Asset Management (Lyxor AM) is a French investment management company authorized by the Autorité des marchés financiers and placed under the regulations of the UCITS Directive (2009/65/CE). Lyxor AM is a registered Commodity Pool Operator and a Commodity Trading Advisor under the U.S. Commodity Futures and Trade Commission. Lyxor AM is also a member of the National Futures Association.
The fund is the holder of a certificate under the Collective Investment Funds (Jersey) Law 1988 (as amended) SG Hambros Fund Managers (Jersey) Limited and the SG Hambros Trust Company (Channel
EDHEC RISK DAYS NORTH AMERICA 2013 OCTOBER 2013
The fund is the holder of a certificate under the Collective Investment Funds (Jersey) Law, 1988 (as amended). SG Hambros Fund Managers (Jersey) Limited and the SG Hambros Trust Company (Channel Islands) Limited are registered to conduct "fund services business" under the Financial Services (Jersey) Law 1998 (as amended). The Jersey Financial Services Commission is protected by these Laws against liability arising from the discharge of its functions under them. The Commission does not take any responsibility for the financial soundness of the fund or for the correctness of any statements made or expressed herein or in the Offering Memorandum or the Supplemental Memorandum of the Fund.
COPYRIGHT, LYXOR AM, 2013
EDHEC-RISK DAYS NORTH AMERICA 2013 OCTOBER 2013

32IMPORTANT INFORMATION (2/2)
Notice to investors in the European Union and Switzerland: This document is of a commercial and not of a regulatory nature. No prospectus has been approved by, or notified to, a local regulator (except inJersey) and the product may not be distributed by way of an offer, or an invitation to make an offer, of securities to the public.
Notice to UK Investors: The products described within this document are suitable for professional investors only and are not directed at retail clients. The document is issued by Lyxor AM. Lyxor AM isrepresented in the UK by Lyxor Asset Management UK LLP, which is authorized and regulated by the Financial Conduct Authority in the UK.
Notice to Swiss Investors: The product presented herein has not been and will not be registered with, or approved by, the Swiss Financial Market Supervisory Authority FINMA (FINMA) under the Swiss FederalNotice to Swiss Investors: The product presented herein has not been and will not be registered with, or approved by, the Swiss Financial Market Supervisory Authority FINMA (FINMA) under the Swiss FederalAct on Collective Investment Schemes (CISA). Therefore, the information presented herein or in the fund’s legal documentation does not necessarily comply with the information standards required by FINMA inthe case of distribution of collective investment schemes to non-qualified investors, and investors do not benefit from protection under the CISA or supervision by FINMA. The product must not be distributed tonon-qualified investors in or from Switzerland, and may be distributed exclusively on a private placement basis to Qualified Investors as defined in article 10 of the CISA and related provisions in the Swiss FederalOrdinance on Collective Investment Schemes (CISO) in strict compliance with applicable Swiss law and regulations. This document is personal and does not constitute an offer to any person. This document mustbe distributed or otherwise made available in Switzerland on a private placement basis only and exclusively to Qualified Investors, without distribution or marketing to non-qualified investors in or from Switzerland.This document may be used only by those Qualified Investors to whom it has been handed out in connection with the offering described therein, and it may neither be distributed nor made available to otherpersons without the express consent of Lyxor AM or Société Générale. It may not be used in connection with any other distribution and shall in particular not be copied and/or distributed to non-qualified investorsi S it l d i th t Thi d t th i f ti t i d th i d t tit t t h t i d t d t t ti l 652 ti l 1156 f th S i C din Switzerland or in any other country. This document, or the information contained therein, does not constitute a prospectus as such term is understood pursuant to article 652a or article 1156 of the Swiss Codeof Obligations or a listing prospectus pursuant to the listing rules of the SIX Swiss Exchange or any other exchange or regulated trading facility in Switzerland or a simplified prospectus, a key information forinvestors document, or a prospectus, as such terms are defined in the CISA.
Notice to U.S. Investors: Any potential investment in any securities or financial instruments described herein may not be suitable for all investors. Any prospective investment will require you to represent thatyou are an “accredited investor,” as defined in Regulation D under the Securities Act of 1933, as amended, and a “qualified purchaser,” as defined in Section 2(a)(51) of the Investment Company Act of 1940, asamended (the “’40 Act”) The securities and financial instruments described herein may not Act ) be available in all jurisdictions. Investments in or linked to hedge funds are highly speculative and may beadversely affected by the unregulated nature of hedge funds and the use of trading strategies and techniques that are typically prohibited for funds registered under the ’40 Act. Also, hedge funds are typically lesstransparent in terms of information and pricing and have much higher fees than registered funds. Investors in hedge funds may not be afforded the same protections as investors in funds registered under the ’40Act including limitations on fees, controls over investment policies and reporting requirements.
Notice to Canadian Investors: Any potential investment in any securities or financial instruments described herein may not be suitable for all investors. Any prospective investment will require you to representthat you are a “permitted client“, as defined in National Instrument 31-103 and an “accredited investor,” as defined in National Instrument 45-106. The securities and financial instruments described herein may notbe available in all jurisdictions of Canada. Investment vehicles described herein will not be offered by prospectus in Canada and will not be subject to National Instrument 81-102 and National Instrument 81-106.In addition, investments in or linked to hedge funds are highly speculative and may be adversely affected by the unregulated nature of hedge funds and the use of trading strategies and techniques that aretypically prohibited for prospectus offered funds. Also, hedge funds are typically less transparent in terms of information and pricing and have much higher fees than prospectus offered funds. Investors in hedgetypically prohibited for prospectus offered funds. Also, hedge funds are typically less transparent in terms of information and pricing and have much higher fees than prospectus offered funds. Investors in hedgefunds may not be afforded the same protections as investors in offered funds, including limitations on fees, controls over investment policies and reporting requirements.
Notice to Hong Kong Investors: This document is distributed in Hong Kong by SG Securities (HK) Limited and Société Générale Hong Kong Branch, which is regulated by the Securities and FuturesCommission and Hong Kong Monetary Authority respectively. The information contained in this document is only directed to recipients who are professional investors as defined under the Securities and FuturesOrdinance, Part III.
Notice to Japanese Investors: This document is distributed in Japan by Société Générale Securities (North Pacific) Ltd., Tokyo Branch, which is regulated by the Financial Services Agency of Japan. Thisdocument is intended only for the Professional Investors as defined by the Financial Instruments and Exchange Law in Japan and only for those people to whom it is sent directly by Société Générale Securities
EDHEC RISK DAYS NORTH AMERICA 2013 OCTOBER 2013
document is intended only for the Professional Investors as defined by the Financial Instruments and Exchange Law in Japan and only for those people to whom it is sent directly by Société Générale Securities(North Pacific) Ltd., Tokyo Branch, and under no circumstances should it be forwarded to any third party.
Notice to Singapore Investors: This document is distributed in Singapore by Société Générale Singapore Branch, which is regulated by the Monetary Authority of Singapore. This document may only bedistributed to institutional, accredited and expert investors.
Notice to Taiwan Investors: This document is to present you with our all capital markets activities across Asia-Pacific region and may only be distributed to the institutional investors. The product mentioned inthis document may not be eligible or available for sale in Taiwan and may not be suitable for all types of investors.
EDHEC-RISK DAYS NORTH AMERICA 2013 OCTOBER 2013
33GENERAL RISK DISCLOSURES
Hedge Funds and hedge fund investment strategies (collectively, the “Investment Strategies”) » Investment Strategies fees and expenses − which may be substantial regardless of any positive
There are substantial risks in investing in Hedge Funds and in the investment strategies utilized by Lyxor managed accounts. Potential investors should carefully note the following:
represent speculative investments and involve a high degree of risk. An investor could lose all or
a substantial portion of his/her investment. Investors must have the financial ability,
sophistication/experience to bear the risks of an investment in the Investment Strategies
An investment in the Investment Strategies should be discretionary capital set aside strictly for
speculative purposes.
return − may offset its trading profits.
» Investment Strategies are not required to provide periodic pricing or valuation information to
investors.
» Investment Strategies and their managers/advisors may be subject to various conflicts of interest.
» The above summary is not a complete list of the risks and other important disclosures involved in An investment in the Investment Strategies is not suitable or desirable for all investors. Only
qualified eligible investors may invest.
Offering documents are not reviewed or approved by federal, state or provincial regulators
Investment Strategies may be leveraged (including highly leveraged) and performance may be
volatile
An investment in the Investment Strategies may be illiquid and there may be significant
investing in the Investment Strategies and is subject to the more complete disclosures contained in
the offering documents for the relevant managed account, which must be reviewed carefully.
An investment in the Investment Strategies may be illiquid and there may be significant
restrictions on transferring interests. There is no secondary market for an investor's investment
in the Investment Strategies and none is expected to develop.
Investment Strategies may have little or no operating history or performance and may use
hypothetical or pro forma performance which may not reflect actual trading done by the
manager or advisor and should be reviewed carefully. Investors should not place undue reliancemanager or advisor and should be reviewed carefully. Investors should not place undue reliance
on hypothetical or pro forma performance.
Investment Strategies' manager or advisor has total trading authority over the relevant
Investment Strategy.
Each Investment Strategy uses a single advisor or employ a single strategy, which could mean
a lack of diversification and higher risk.
EDHEC RISK DAYS NORTH AMERICA 2013 OCTOBER 2013
Investment Strategies may provide no transparency regarding its underlying investments to
investors
Investment Strategies may execute a substantial portion of trades on foreign exchanges, which
could mean higher risk.
EDHEC-RISK DAYS NORTH AMERICA 2013 OCTOBER 2013