Embed Size (px)
Citation preview
Healthy Youth Survey 2002 Survey Results
Pierce County
Grade 6
RMC Research Corporation 522 SW Fifth Avenue, Suite 1407
Portland, OR 97204
February 2003
Contents
Introduction and Overview.......................................................................................................................................... 1 Graphical Summary of Selected Results ..................................................................................................................... 2 Selected Results Disaggregated by Gender ................................................................................................................. 4 General Information (Items 1–11) ............................................................................................................................... 5 Alcohol, Tobacco, and Other Drug (ATOD) Use........................................................................................................ 6
Lifetime Use (Items 12–23) ................................................................................................................................... 6 30-Day Use (Items 24–38) ..................................................................................................................................... 7 Other Tobacco-Related Questions (Items 39–70) .................................................................................................. 8 Other Alcohol- and Drug-Related Questions (Items 71–73).................................................................................. 9
Other Health Concerns .............................................................................................................................................. 10
Nutrition and Fitness (Items 74–90)..................................................................................................................... 10 Health Conditions and Health Care (Items 91–98) .............................................................................................. 11 Safety (Items 99–110) .......................................................................................................................................... 11 Behaviors Related to Intentional Injuries (Items 111–125).................................................................................. 13 Depression (Items 126–135) ................................................................................................................................ 13
School Climate (Items 136–144) .............................................................................................................................. 14 Quality of Life (Items 145–156)................................................................................................................................ 14 Risk and Protective Factors: Scale Results................................................................................................................ 15
Risk Factors.......................................................................................................................................................... 15 Protective Factors................................................................................................................................................. 16 Number of Risk or Protective Factors .................................................................................................................. 16
Risk and Protective Factors: Individual Item Results................................................................................................ 17
Community Domain (Items 157–178).................................................................................................................. 17 School Domain (Items 179–196) ......................................................................................................................... 19 Peer and Individual Domain (Items 197–239) ..................................................................................................... 21 Family Domain (Items 240–262) ......................................................................................................................... 23
Healthy Youth Survey 2002 Survey Results
Pierce County, Grade 6
Number of students surveyed: 1616 Number of valid responses: 1583 The impact of adolescent health risk behaviors remains a primary concern of citizens throughout the country. Many health problems experienced by adolescents are caused by a very few preventable behaviors. Patterns of alcohol, tobacco, and other drug (ATOD) use and related risk behaviors are often formed during adolescence. These patterns play an important role in health throughout adulthood. This report presents results from the fall 2002 Healthy Youth Survey in Washington State. For each item, local results appear in the first two columns and statewide results appear in the second two columns. The number of valid responses (“n”) appears in parentheses for each item. Survey items covering the same topics are grouped together (the item numbering is specific to this report and does not necessarily reflect the item order on the actual survey). The bulleted points and graphs included at the beginning of this report highlight selected findings from the report. Additional information may be found in the Interpretive Guide that accompanied this report.
Key to the Notes The survey was administered in 3 versions. Forms A and B were administered to students in Grades 8, 10, and 12. These two forms contained a core set of common items and additional items unique to each form. Form C was administered to students in Grade 6. This form consisted primarily of questions drawn from Forms A and B but also included some unique items. Several items on each form were optional at the discretion of the school; schools that did not administer the optional questions tore off the last page of the survey booklet. The following notes are used throughout this report to document the differences between the items on different versions and note the optional items: A = wording on Form A B = wording on Form B C = wording on Form C ° = answer choices presented in a different order on one or more versions of the survey † = optional item
Highlights of the Local Results Your students and students statewide reported the following behaviors and attitudes:
Your students Statewide Smoking cigarettes in the past 30 days (see item 25) 2.3% (± 0.8%) 2.2% (± 0.4%)
Drinking alcohol in the past 30 days (see item 31) 3.6 (± 1.0) 3.8 (± 0.7)
Using marijuana or hashish in the past 30 days (see item 32) 1.5 (± 0.6) 1.3 (± 0.4)
Being bullied in the past 30 days (see item 136) 30.4 (± 4.0) 31.0 (± 1.4)
Enjoyed being in school over the past year (see item 182) 57.6 (± 3.6) 57.2 (± 1.9)
Feeling safe at school (see item 193) 91.9 (± 2.5) 90.0 (± 1.0)
Healthy Youth Survey 2002 Survey Results 1 RMC Research Corporation Portland, OR See page 1 for a key to the notes (A, B, C, °, †)
Pierce County Grade 6
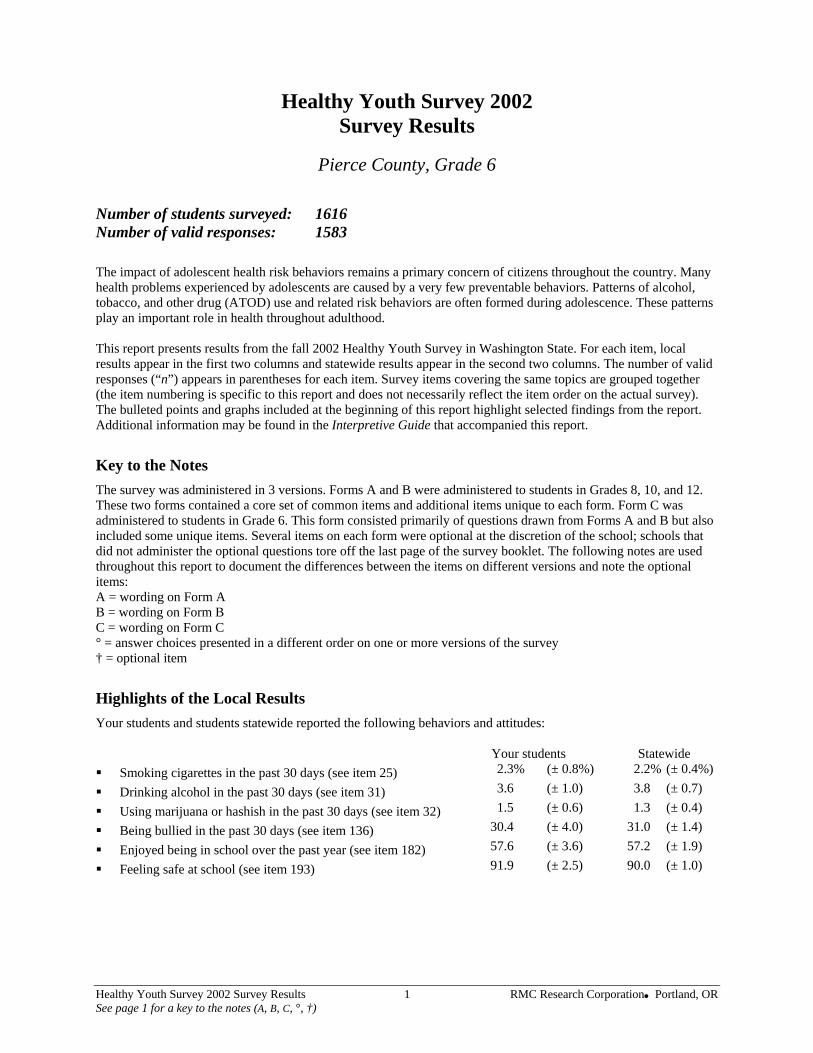
Risk and Protective Factors
0 10 20 30 40 50 60 70 80 90 100
COMMUNITY RISK FACTORS
Low neighborhood attachment*
Laws and norms favorable to drug use
Perceived availability of drugs
Perceived availability of handguns*
SCHOOL RISK FACTORS
Academic failure
Low commitment to school
PEER-INDIVIDUAL RISK FACTORS
Early initiation of drugs*
Early initiation of problem behavior*
Favorable attitudes towards antisocial behavior*
Favorable attitudes toward drug use
Perceived risks of use
Friends’ use of drugs*
Rewards for antisocial involvement*
Intentions to use*
FAMILY RISK FACTORS
Poor family management*
Antisocial behavior among familiar adults*
COMMUNITY PROTECTIVE FACTORS
Opportunities for prosocial involvement
Rewards for prosocial involvement
SCHOOL PROTECTIVE FACTORS
Opportunities for prosocial involvement*
Rewards for prosocial involvement
PEER-INDIVIDUAL PROTECTIVE FACTORS
Social skills*
Belief in the moral order*
FAMILY PROTECTIVE FACTORS
Opportunities for prosocial involvement
Rewards for prosocial involvement
* Secondary version only
Percent of students at risk or protected
Local State
Healthy Youth Survey 2002 Survey Results 2 RMC Research Corporation Portland, OR See page 1 for a key to the notes (A, B, C, °, †)
Pierce County Grade 6
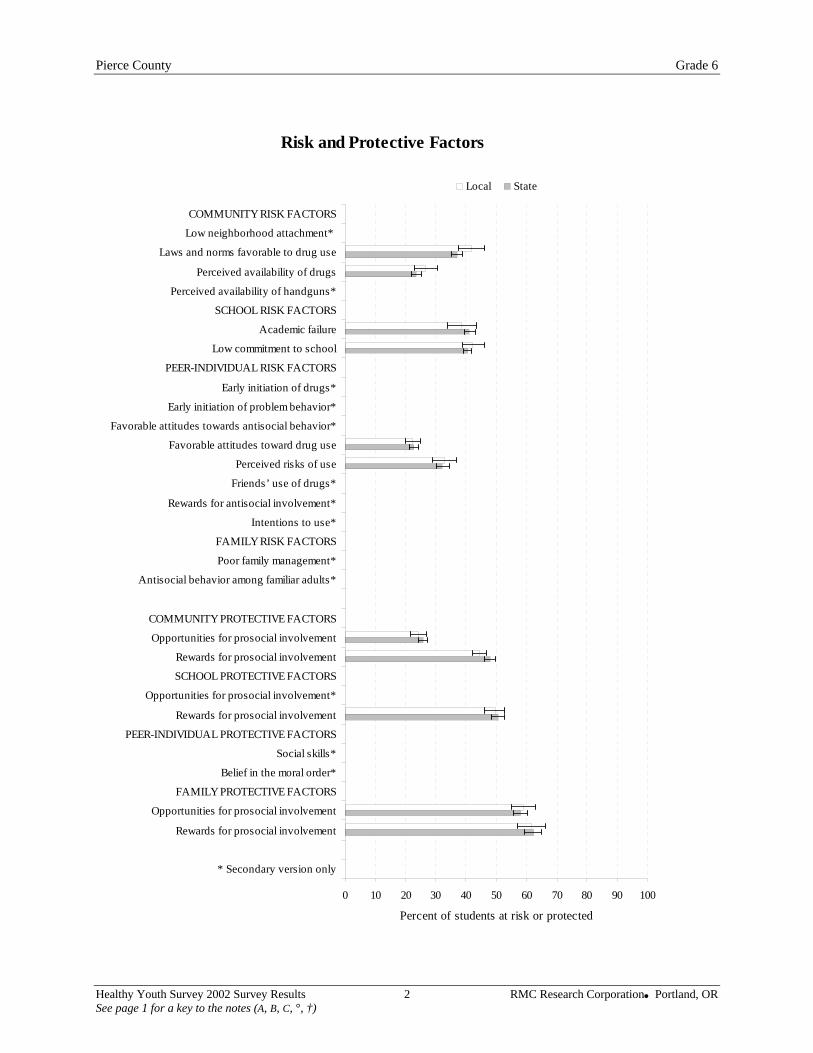
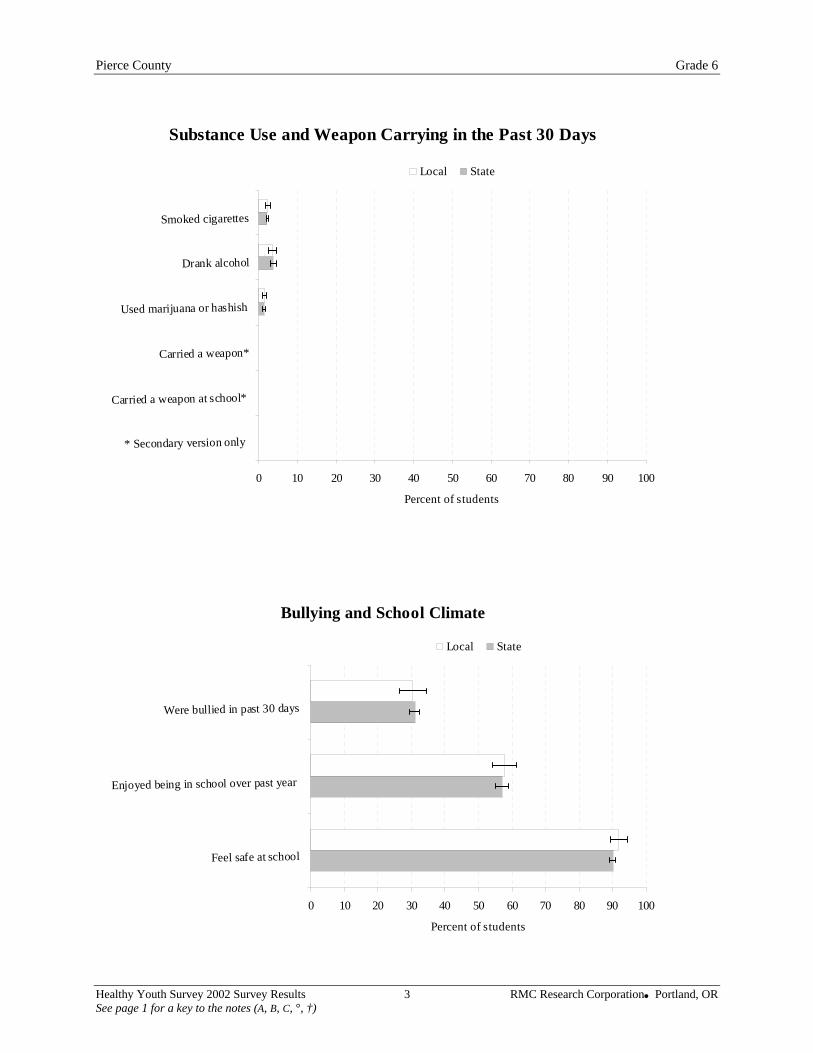
Substance Use and Weapon Carrying in the Past 30 Days
0 10 20 30 40 50 60 70 80 90 100
Smoked cigarettes
Drank alcohol
Used marijuana or hashish
Carried a weapon*
Carried a weapon at school*
* Secondary version only
Percent of students
Local State
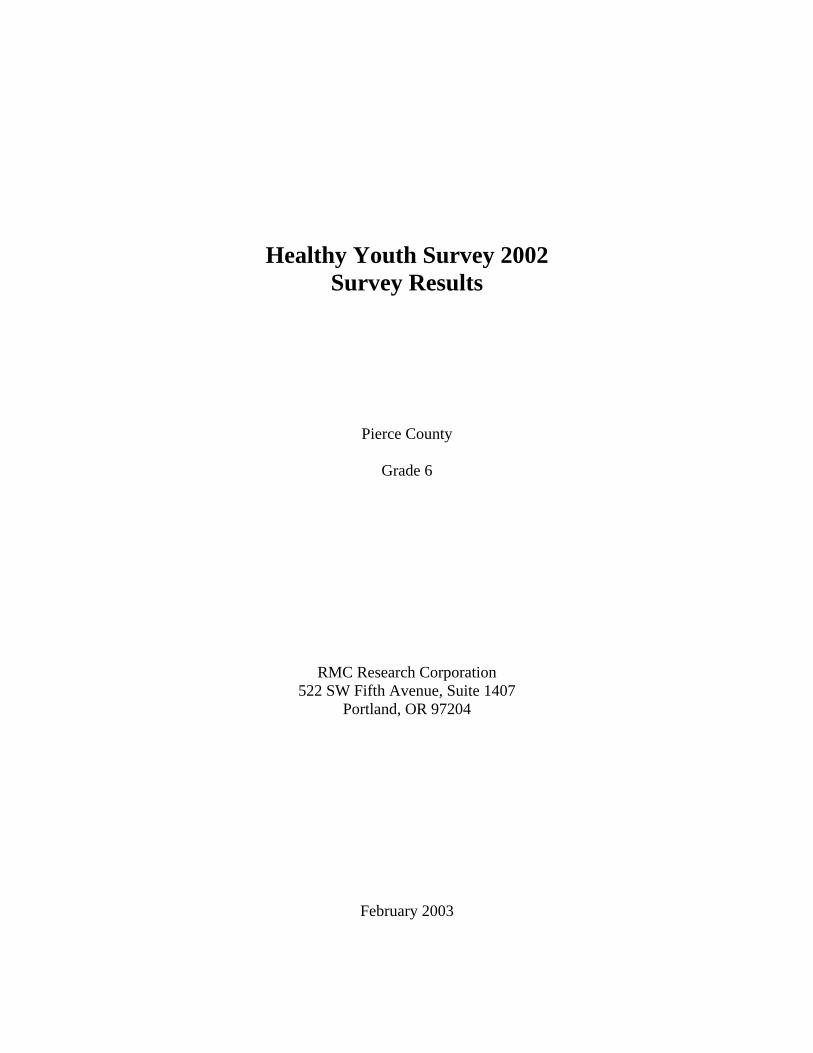
Bullying and School Climate
0 10 20 30 40 50 60 70 80 90 100
Were bullied in past 30 days
Enjoyed being in school over past year
Feel safe at school
Percent of students
Local State
Healthy Youth Survey 2002 Survey Results 3 RMC Research Corporation Portland, OR See page 1 for a key to the notes (A, B, C, °, †)
Pierce County Grade 6
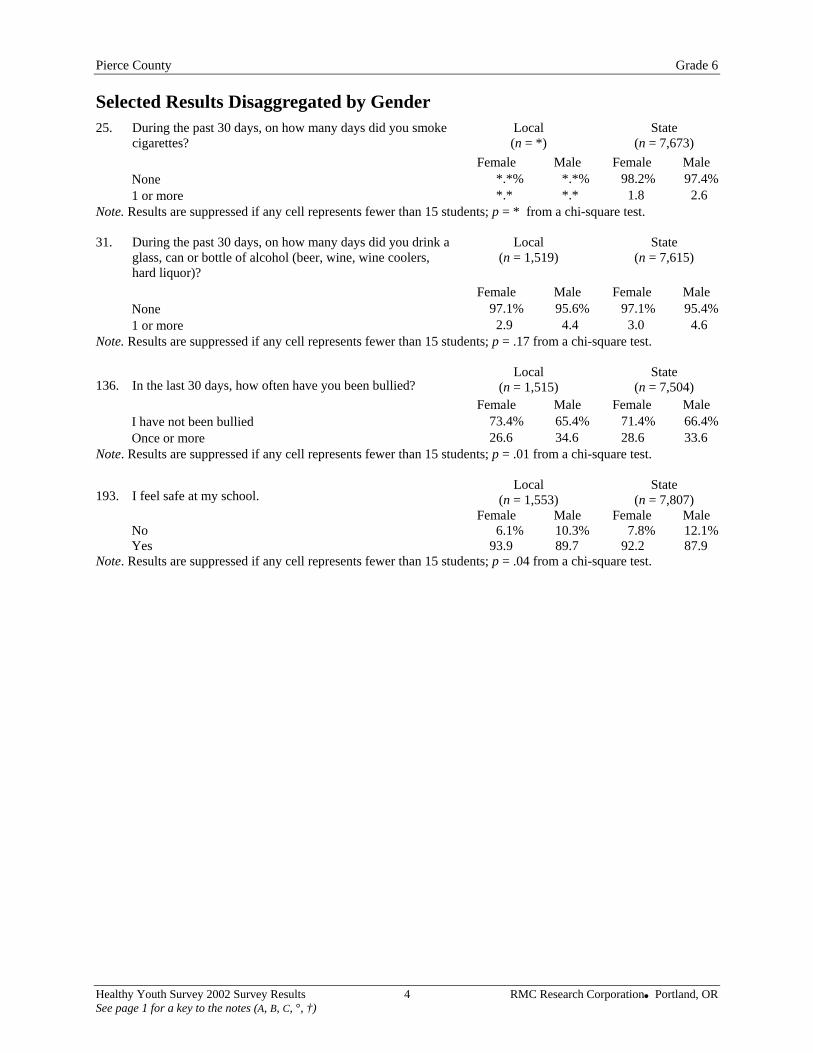
Selected Results Disaggregated by Gender 25. During the past 30 days, on how many days did you smoke
cigarettes? Local (n = *)
State (n = 7,673)
Female Male Female Male None *.*% *.*% 98.2% 97.4% 1 or more *.* *.* 1.8 2.6
Note. Results are suppressed if any cell represents fewer than 15 students; p = * from a chi-square test. 31. During the past 30 days, on how many days did you drink a
glass, can or bottle of alcohol (beer, wine, wine coolers, hard liquor)?
Local (n = 1,519)
State (n = 7,615)
Female Male Female Male None 97.1% 95.6% 97.1% 95.4% 1 or more 2.9 4.4 3.0 4.6
Note. Results are suppressed if any cell represents fewer than 15 students; p = .17 from a chi-square test.
136. In the last 30 days, how often have you been bullied? Local
(n = 1,515) State
(n = 7,504) Female Male Female Male I have not been bullied 73.4% 65.4% 71.4% 66.4% Once or more 26.6 34.6 28.6 33.6
Note. Results are suppressed if any cell represents fewer than 15 students; p = .01 from a chi-square test.
193. I feel safe at my school. Local
(n = 1,553) State
(n = 7,807) Female Male Female Male No 6.1% 10.3% 7.8% 12.1% Yes 93.9 89.7 92.2 87.9
Note. Results are suppressed if any cell represents fewer than 15 students; p = .04 from a chi-square test.
Healthy Youth Survey 2002 Survey Results 4 RMC Research Corporation Portland, OR See page 1 for a key to the notes (A, B, C, °, †)
Pierce County Grade 6
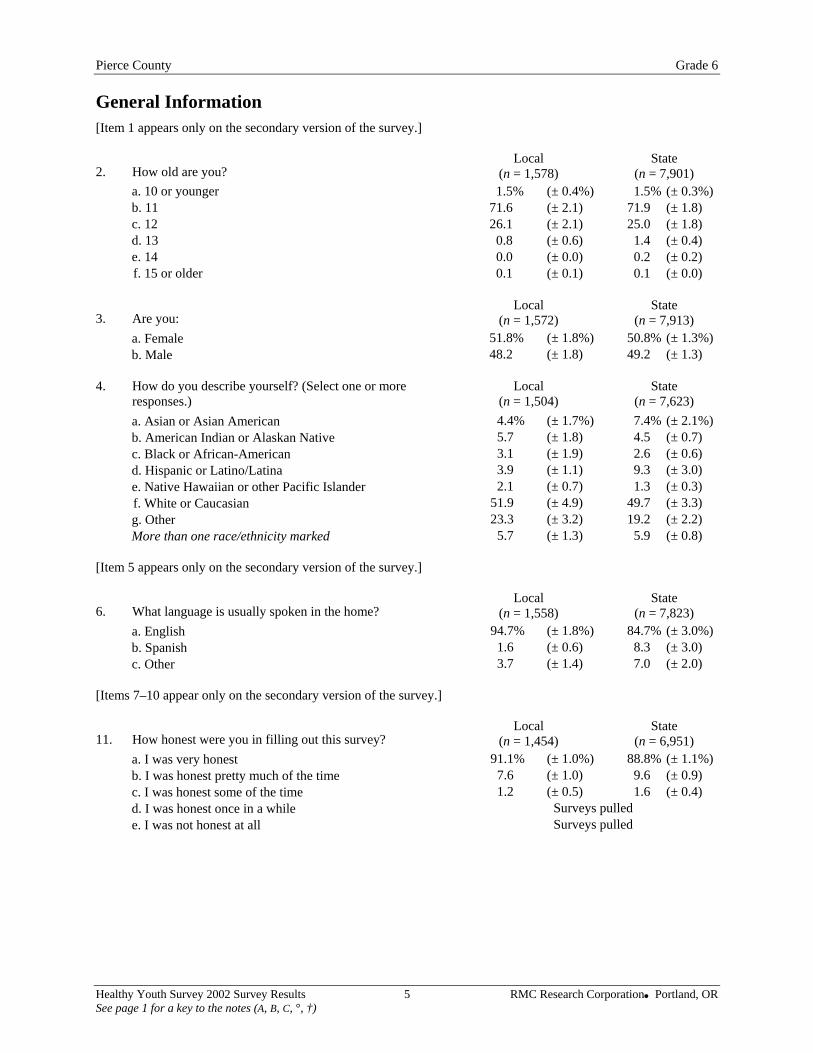
General Information [Item 1 appears only on the secondary version of the survey.]
2. How old are you? Local
(n = 1,578) State
(n = 7,901) a. 10 or younger 1.5% (± 0.4%) 1.5% (± 0.3%) b. 11 71.6 (± 2.1) 71.9 (± 1.8) c. 12 26.1 (± 2.1) 25.0 (± 1.8) d. 13 0.8 (± 0.6) 1.4 (± 0.4) e. 14 0.0 (± 0.0) 0.2 (± 0.2) f. 15 or older 0.1 (± 0.1) 0.1 (± 0.0)
3. Are you: Local
(n = 1,572) State
(n = 7,913) a. Female 51.8% (± 1.8%) 50.8% (± 1.3%) b. Male 48.2 (± 1.8) 49.2 (± 1.3)
4. How do you describe yourself? (Select one or more
responses.) Local
(n = 1,504) State
(n = 7,623) a. Asian or Asian American 4.4% (± 1.7%) 7.4% (± 2.1%) b. American Indian or Alaskan Native 5.7 (± 1.8) 4.5 (± 0.7) c. Black or African-American 3.1 (± 1.9) 2.6 (± 0.6) d. Hispanic or Latino/Latina 3.9 (± 1.1) 9.3 (± 3.0) e. Native Hawaiian or other Pacific Islander 2.1 (± 0.7) 1.3 (± 0.3) f. White or Caucasian 51.9 (± 4.9) 49.7 (± 3.3) g. Other 23.3 (± 3.2) 19.2 (± 2.2) More than one race/ethnicity marked 5.7 (± 1.3) 5.9 (± 0.8)
[Item 5 appears only on the secondary version of the survey.]
6. What language is usually spoken in the home? Local
(n = 1,558) State
(n = 7,823) a. English 94.7% (± 1.8%) 84.7% (± 3.0%) b. Spanish 1.6 (± 0.6) 8.3 (± 3.0) c. Other 3.7 (± 1.4) 7.0 (± 2.0)
[Items 7–10 appear only on the secondary version of the survey.]
11. How honest were you in filling out this survey? Local
(n = 1,454) State
(n = 6,951) a. I was very honest 91.1% (± 1.0%) 88.8% (± 1.1%) b. I was honest pretty much of the time 7.6 (± 1.0) 9.6 (± 0.9) c. I was honest some of the time 1.2 (± 0.5) 1.6 (± 0.4) d. I was honest once in a while Surveys pulled e. I was not honest at all Surveys pulled
Healthy Youth Survey 2002 Survey Results 5 RMC Research Corporation Portland, OR See page 1 for a key to the notes (A, B, C, °, †)
Pierce County Grade 6
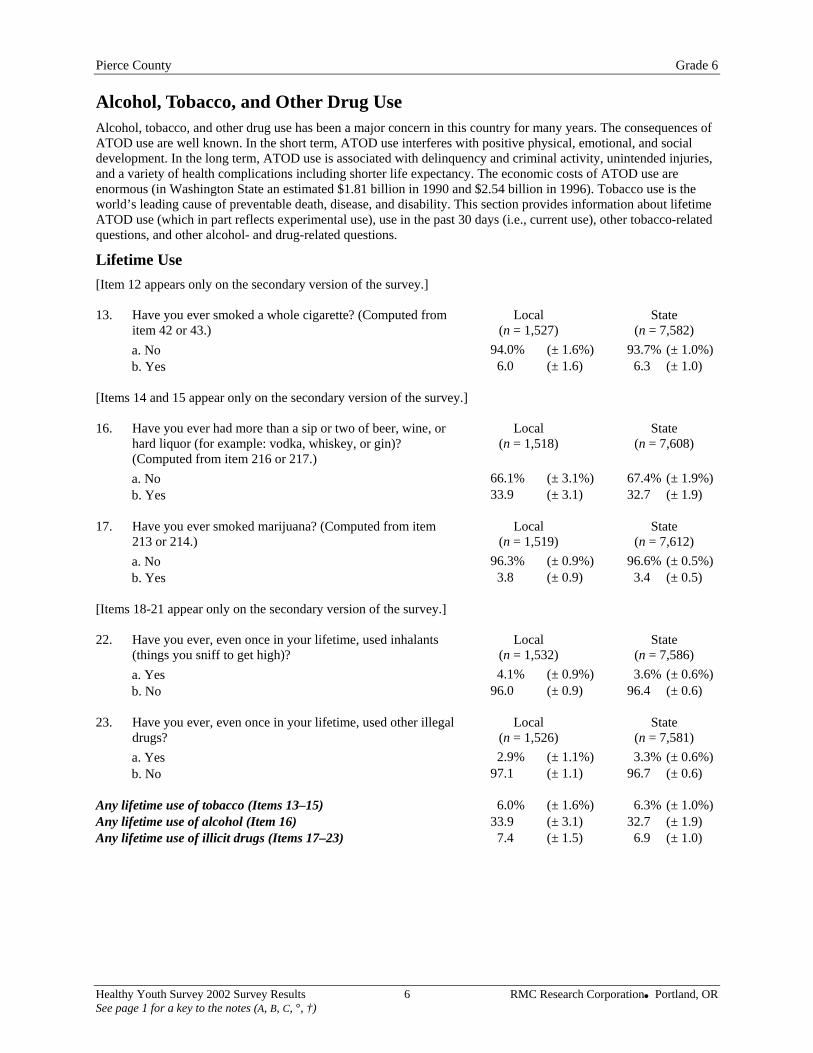
Alcohol, Tobacco, and Other Drug Use Alcohol, tobacco, and other drug use has been a major concern in this country for many years. The consequences of ATOD use are well known. In the short term, ATOD use interferes with positive physical, emotional, and social development. In the long term, ATOD use is associated with delinquency and criminal activity, unintended injuries, and a variety of health complications including shorter life expectancy. The economic costs of ATOD use are enormous (in Washington State an estimated $1.81 billion in 1990 and $2.54 billion in 1996). Tobacco use is the world’s leading cause of preventable death, disease, and disability. This section provides information about lifetime ATOD use (which in part reflects experimental use), use in the past 30 days (i.e., current use), other tobacco-related questions, and other alcohol- and drug-related questions.
Lifetime Use [Item 12 appears only on the secondary version of the survey.] 13. Have you ever smoked a whole cigarette? (Computed from
item 42 or 43.) Local
(n = 1,527) State
(n = 7,582) a. No 94.0% (± 1.6%) 93.7% (± 1.0%) b. Yes 6.0 (± 1.6) 6.3 (± 1.0)
[Items 14 and 15 appear only on the secondary version of the survey.] 16. Have you ever had more than a sip or two of beer, wine, or
hard liquor (for example: vodka, whiskey, or gin)? (Computed from item 216 or 217.)
Local (n = 1,518)
State (n = 7,608)
a. No 66.1% (± 3.1%) 67.4% (± 1.9%) b. Yes 33.9 (± 3.1) 32.7 (± 1.9)
17. Have you ever smoked marijuana? (Computed from item
213 or 214.) Local
(n = 1,519) State
(n = 7,612) a. No 96.3% (± 0.9%) 96.6% (± 0.5%) b. Yes 3.8 (± 0.9) 3.4 (± 0.5)
[Items 18-21 appear only on the secondary version of the survey.] 22. Have you ever, even once in your lifetime, used inhalants
(things you sniff to get high)? Local
(n = 1,532) State
(n = 7,586) a. Yes 4.1% (± 0.9%) 3.6% (± 0.6%) b. No 96.0 (± 0.9) 96.4 (± 0.6)
23. Have you ever, even once in your lifetime, used other illegal
drugs? Local
(n = 1,526) State
(n = 7,581) a. Yes 2.9% (± 1.1%) 3.3% (± 0.6%) b. No 97.1 (± 1.1) 96.7 (± 0.6)
Any lifetime use of tobacco (Items 13–15) 6.0% (± 1.6%) 6.3% (± 1.0%) Any lifetime use of alcohol (Item 16) 33.9 (± 3.1) 32.7 (± 1.9) Any lifetime use of illicit drugs (Items 17–23) 7.4 (± 1.5) 6.9 (± 1.0)
Healthy Youth Survey 2002 Survey Results 6 RMC Research Corporation Portland, OR See page 1 for a key to the notes (A, B, C, °, †)
Pierce County Grade 6
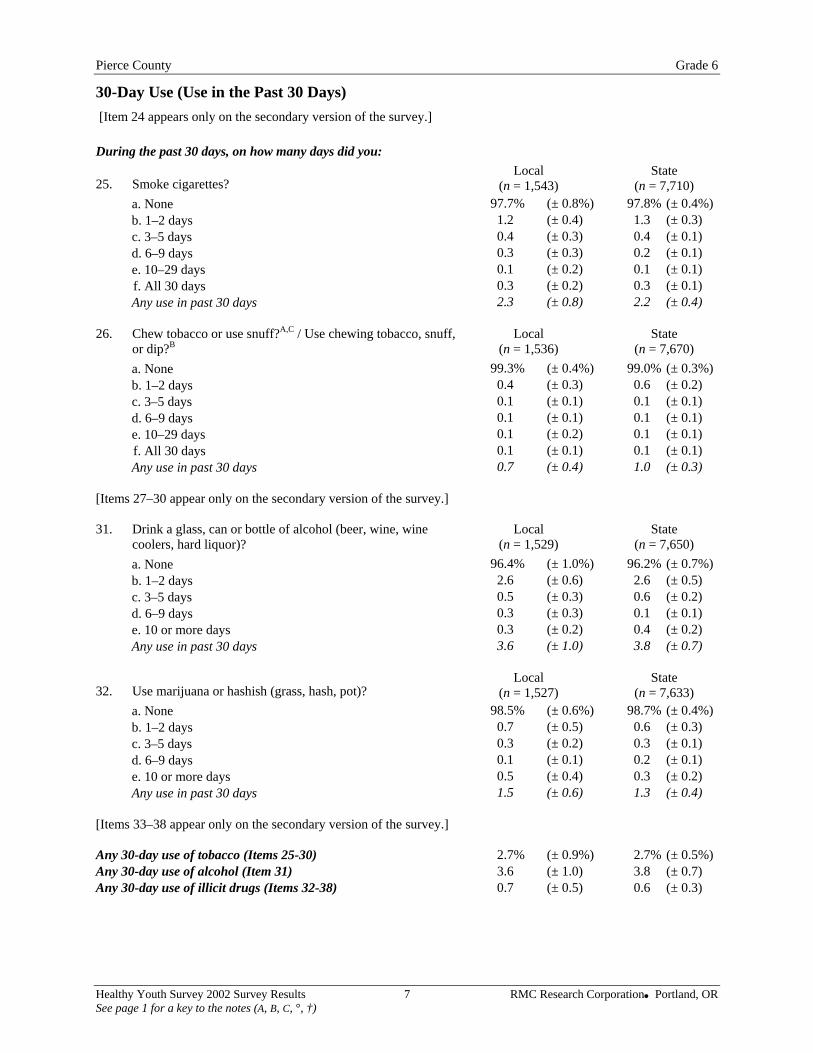
30-Day Use (Use in the Past 30 Days) [Item 24 appears only on the secondary version of the survey.] During the past 30 days, on how many days did you:
25. Smoke cigarettes? Local
(n = 1,543) State
(n = 7,710) a. None 97.7% (± 0.8%) 97.8% (± 0.4%) b. 1–2 days 1.2 (± 0.4) 1.3 (± 0.3) c. 3–5 days 0.4 (± 0.3) 0.4 (± 0.1) d. 6–9 days 0.3 (± 0.3) 0.2 (± 0.1) e. 10–29 days 0.1 (± 0.2) 0.1 (± 0.1) f. All 30 days 0.3 (± 0.2) 0.3 (± 0.1) Any use in past 30 days 2.3 (± 0.8) 2.2 (± 0.4)
26. Chew tobacco or use snuff?A,C / Use chewing tobacco, snuff,
or dip?BLocal
(n = 1,536) State
(n = 7,670) a. None 99.3% (± 0.4%) 99.0% (± 0.3%) b. 1–2 days 0.4 (± 0.3) 0.6 (± 0.2) c. 3–5 days 0.1 (± 0.1) 0.1 (± 0.1) d. 6–9 days 0.1 (± 0.1) 0.1 (± 0.1) e. 10–29 days 0.1 (± 0.2) 0.1 (± 0.1) f. All 30 days 0.1 (± 0.1) 0.1 (± 0.1) Any use in past 30 days 0.7 (± 0.4) 1.0 (± 0.3)
[Items 27–30 appear only on the secondary version of the survey.] 31. Drink a glass, can or bottle of alcohol (beer, wine, wine
coolers, hard liquor)? Local
(n = 1,529) State
(n = 7,650) a. None 96.4% (± 1.0%) 96.2% (± 0.7%) b. 1–2 days 2.6 (± 0.6) 2.6 (± 0.5) c. 3–5 days 0.5 (± 0.3) 0.6 (± 0.2) d. 6–9 days 0.3 (± 0.3) 0.1 (± 0.1) e. 10 or more days 0.3 (± 0.2) 0.4 (± 0.2) Any use in past 30 days 3.6 (± 1.0) 3.8 (± 0.7)
32. Use marijuana or hashish (grass, hash, pot)? Local
(n = 1,527) State
(n = 7,633) a. None 98.5% (± 0.6%) 98.7% (± 0.4%) b. 1–2 days 0.7 (± 0.5) 0.6 (± 0.3) c. 3–5 days 0.3 (± 0.2) 0.3 (± 0.1) d. 6–9 days 0.1 (± 0.1) 0.2 (± 0.1) e. 10 or more days 0.5 (± 0.4) 0.3 (± 0.2) Any use in past 30 days 1.5 (± 0.6) 1.3 (± 0.4)
[Items 33–38 appear only on the secondary version of the survey.] Any 30-day use of tobacco (Items 25-30) 2.7% (± 0.9%) 2.7% (± 0.5%) Any 30-day use of alcohol (Item 31) 3.6 (± 1.0) 3.8 (± 0.7) Any 30-day use of illicit drugs (Items 32-38) 0.7 (± 0.5) 0.6 (± 0.3)
Healthy Youth Survey 2002 Survey Results 7 RMC Research Corporation Portland, OR See page 1 for a key to the notes (A, B, C, °, †)
Pierce County Grade 6
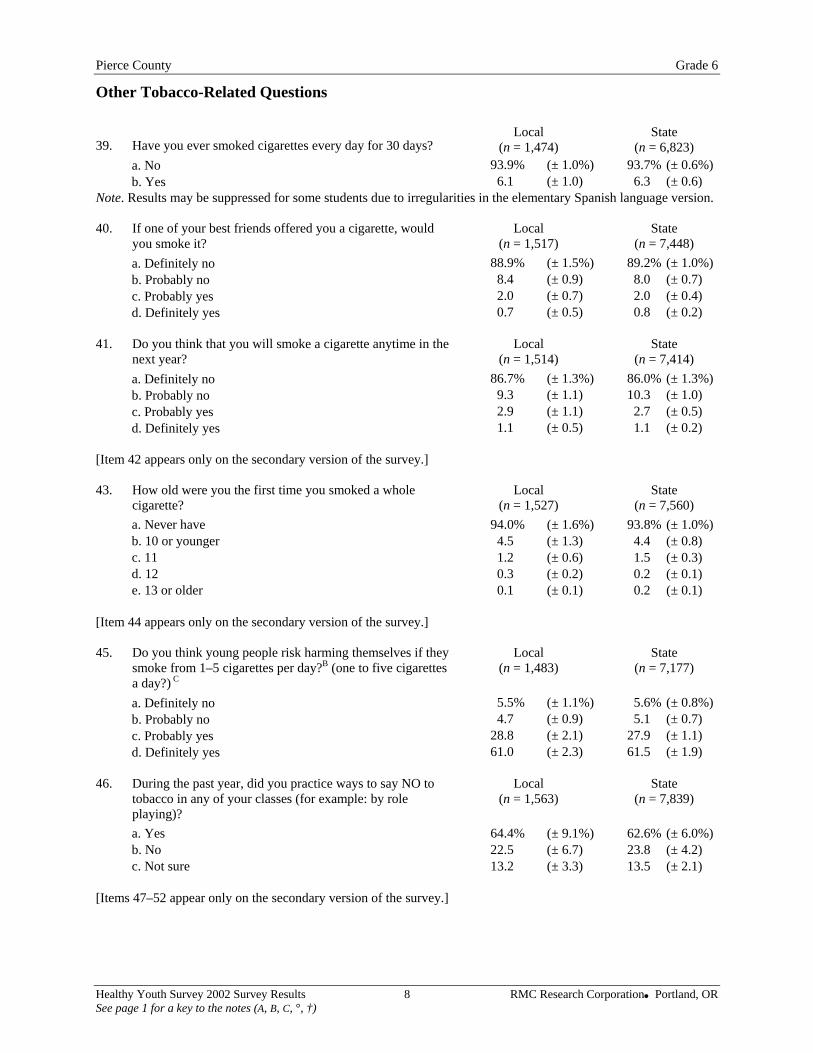
Other Tobacco-Related Questions
39. Have you ever smoked cigarettes every day for 30 days? Local
(n = 1,474) State
(n = 6,823) a. No 93.9% (± 1.0%) 93.7% (± 0.6%) b. Yes 6.1 (± 1.0) 6.3 (± 0.6)
Note. Results may be suppressed for some students due to irregularities in the elementary Spanish language version. 40. If one of your best friends offered you a cigarette, would
you smoke it? Local
(n = 1,517) State
(n = 7,448) a. Definitely no 88.9% (± 1.5%) 89.2% (± 1.0%) b. Probably no 8.4 (± 0.9) 8.0 (± 0.7) c. Probably yes 2.0 (± 0.7) 2.0 (± 0.4) d. Definitely yes 0.7 (± 0.5) 0.8 (± 0.2)
41. Do you think that you will smoke a cigarette anytime in the
next year? Local
(n = 1,514) State
(n = 7,414) a. Definitely no 86.7% (± 1.3%) 86.0% (± 1.3%) b. Probably no 9.3 (± 1.1) 10.3 (± 1.0) c. Probably yes 2.9 (± 1.1) 2.7 (± 0.5) d. Definitely yes 1.1 (± 0.5) 1.1 (± 0.2)
[Item 42 appears only on the secondary version of the survey.] 43. How old were you the first time you smoked a whole
cigarette? Local
(n = 1,527) State
(n = 7,560) a. Never have 94.0% (± 1.6%) 93.8% (± 1.0%) b. 10 or younger 4.5 (± 1.3) 4.4 (± 0.8) c. 11 1.2 (± 0.6) 1.5 (± 0.3) d. 12 0.3 (± 0.2) 0.2 (± 0.1) e. 13 or older 0.1 (± 0.1) 0.2 (± 0.1)
[Item 44 appears only on the secondary version of the survey.] 45. Do you think young people risk harming themselves if they
smoke from 1–5 cigarettes per day?B (one to five cigarettes a day?) C
Local (n = 1,483)
State (n = 7,177)
a. Definitely no 5.5% (± 1.1%) 5.6% (± 0.8%) b. Probably no 4.7 (± 0.9) 5.1 (± 0.7) c. Probably yes 28.8 (± 2.1) 27.9 (± 1.1) d. Definitely yes 61.0 (± 2.3) 61.5 (± 1.9)
46. During the past year, did you practice ways to say NO to
tobacco in any of your classes (for example: by role playing)?
Local (n = 1,563)
State (n = 7,839)
a. Yes 64.4% (± 9.1%) 62.6% (± 6.0%) b. No 22.5 (± 6.7) 23.8 (± 4.2) c. Not sure 13.2 (± 3.3) 13.5 (± 2.1)
[Items 47–52 appear only on the secondary version of the survey.]
Healthy Youth Survey 2002 Survey Results 8 RMC Research Corporation Portland, OR See page 1 for a key to the notes (A, B, C, °, †)
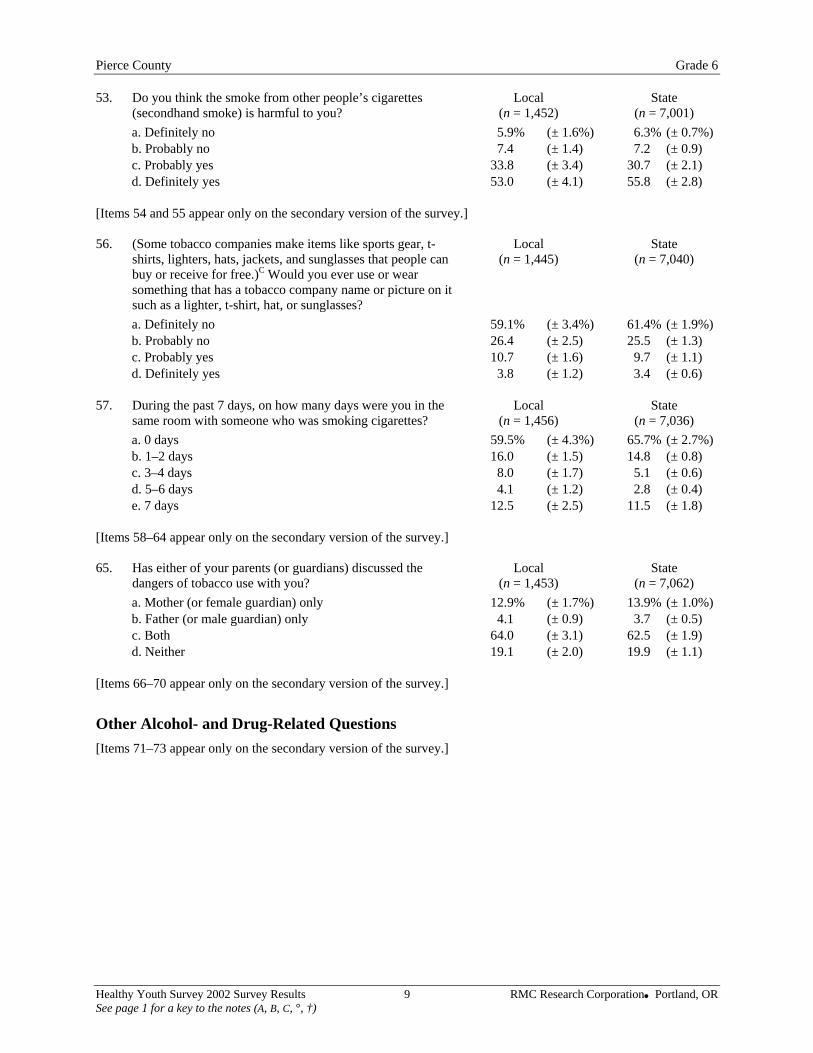
Pierce County Grade 6 53. Do you think the smoke from other people’s cigarettes
(secondhand smoke) is harmful to you? Local
(n = 1,452) State
(n = 7,001) a. Definitely no 5.9% (± 1.6%) 6.3% (± 0.7%) b. Probably no 7.4 (± 1.4) 7.2 (± 0.9) c. Probably yes 33.8 (± 3.4) 30.7 (± 2.1) d. Definitely yes 53.0 (± 4.1) 55.8 (± 2.8)
[Items 54 and 55 appear only on the secondary version of the survey.] 56. (Some tobacco companies make items like sports gear, t-
shirts, lighters, hats, jackets, and sunglasses that people can buy or receive for free.)C Would you ever use or wear something that has a tobacco company name or picture on it such as a lighter, t-shirt, hat, or sunglasses?
Local (n = 1,445)
State (n = 7,040)
a. Definitely no 59.1% (± 3.4%) 61.4% (± 1.9%) b. Probably no 26.4 (± 2.5) 25.5 (± 1.3) c. Probably yes 10.7 (± 1.6) 9.7 (± 1.1) d. Definitely yes 3.8 (± 1.2) 3.4 (± 0.6)
57. During the past 7 days, on how many days were you in the
same room with someone who was smoking cigarettes? Local
(n = 1,456) State
(n = 7,036) a. 0 days 59.5% (± 4.3%) 65.7% (± 2.7%) b. 1–2 days 16.0 (± 1.5) 14.8 (± 0.8) c. 3–4 days 8.0 (± 1.7) 5.1 (± 0.6) d. 5–6 days 4.1 (± 1.2) 2.8 (± 0.4) e. 7 days 12.5 (± 2.5) 11.5 (± 1.8)
[Items 58–64 appear only on the secondary version of the survey.] 65. Has either of your parents (or guardians) discussed the
dangers of tobacco use with you? Local
(n = 1,453) State
(n = 7,062) a. Mother (or female guardian) only 12.9% (± 1.7%) 13.9% (± 1.0%) b. Father (or male guardian) only 4.1 (± 0.9) 3.7 (± 0.5) c. Both 64.0 (± 3.1) 62.5 (± 1.9) d. Neither 19.1 (± 2.0) 19.9 (± 1.1)
[Items 66–70 appear only on the secondary version of the survey.]
Other Alcohol- and Drug-Related Questions [Items 71–73 appear only on the secondary version of the survey.]
Healthy Youth Survey 2002 Survey Results 9 RMC Research Corporation Portland, OR See page 1 for a key to the notes (A, B, C, °, †)
Pierce County Grade 6
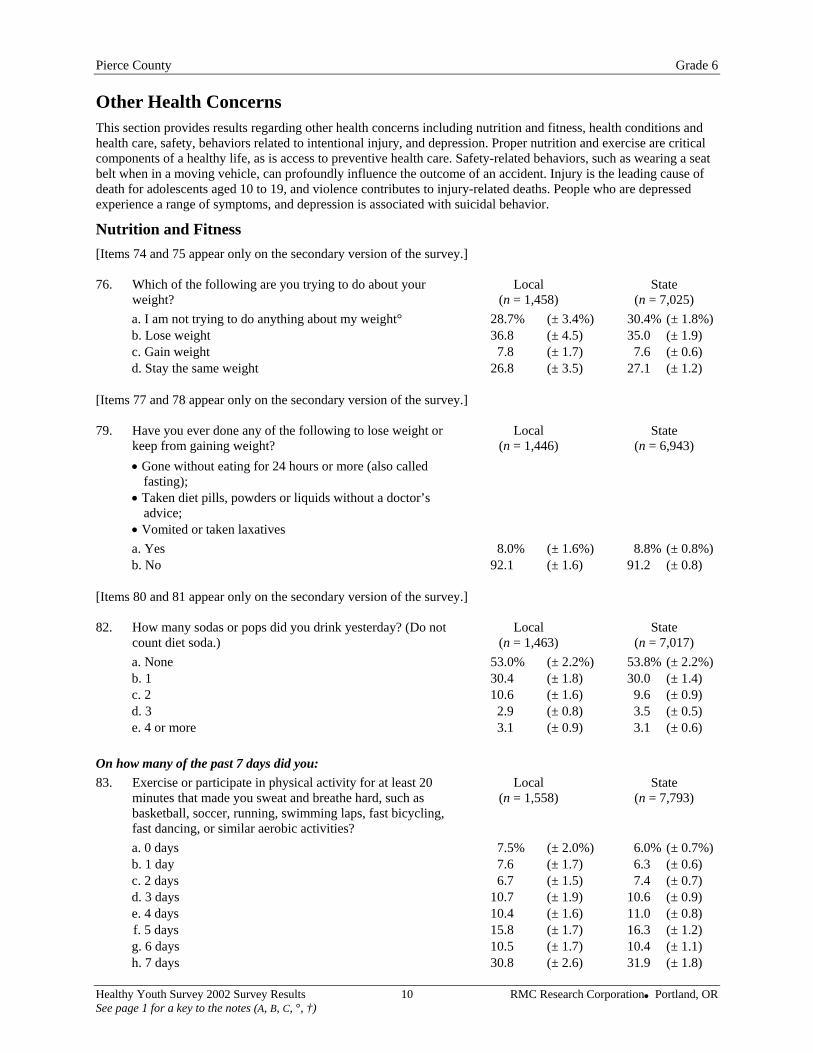
Other Health Concerns This section provides results regarding other health concerns including nutrition and fitness, health conditions and health care, safety, behaviors related to intentional injury, and depression. Proper nutrition and exercise are critical components of a healthy life, as is access to preventive health care. Safety-related behaviors, such as wearing a seat belt when in a moving vehicle, can profoundly influence the outcome of an accident. Injury is the leading cause of death for adolescents aged 10 to 19, and violence contributes to injury-related deaths. People who are depressed experience a range of symptoms, and depression is associated with suicidal behavior.
Nutrition and Fitness [Items 74 and 75 appear only on the secondary version of the survey.] 76. Which of the following are you trying to do about your
weight? Local
(n = 1,458) State
(n = 7,025) a. I am not trying to do anything about my weight° 28.7% (± 3.4%) 30.4% (± 1.8%) b. Lose weight 36.8 (± 4.5) 35.0 (± 1.9) c. Gain weight 7.8 (± 1.7) 7.6 (± 0.6) d. Stay the same weight 26.8 (± 3.5) 27.1 (± 1.2)
[Items 77 and 78 appear only on the secondary version of the survey.] 79. Have you ever done any of the following to lose weight or
keep from gaining weight? • Gone without eating for 24 hours or more (also called
fasting); • Taken diet pills, powders or liquids without a doctor’s advice; • Vomited or taken laxatives
Local (n = 1,446)
State (n = 6,943)
a. Yes 8.0% (± 1.6%) 8.8% (± 0.8%) b. No 92.1 (± 1.6) 91.2 (± 0.8)
[Items 80 and 81 appear only on the secondary version of the survey.] 82. How many sodas or pops did you drink yesterday? (Do not
count diet soda.) Local
(n = 1,463) State
(n = 7,017) a. None 53.0% (± 2.2%) 53.8% (± 2.2%) b. 1 30.4 (± 1.8) 30.0 (± 1.4) c. 2 10.6 (± 1.6) 9.6 (± 0.9) d. 3 2.9 (± 0.8) 3.5 (± 0.5) e. 4 or more 3.1 (± 0.9) 3.1 (± 0.6)
On how many of the past 7 days did you: 83. Exercise or participate in physical activity for at least 20
minutes that made you sweat and breathe hard, such as basketball, soccer, running, swimming laps, fast bicycling, fast dancing, or similar aerobic activities?
Local (n = 1,558)
State (n = 7,793)
a. 0 days 7.5% (± 2.0%) 6.0% (± 0.7%) b. 1 day 7.6 (± 1.7) 6.3 (± 0.6) c. 2 days 6.7 (± 1.5) 7.4 (± 0.7) d. 3 days 10.7 (± 1.9) 10.6 (± 0.9) e. 4 days 10.4 (± 1.6) 11.0 (± 0.8) f. 5 days 15.8 (± 1.7) 16.3 (± 1.2) g. 6 days 10.5 (± 1.7) 10.4 (± 1.1) h. 7 days 30.8 (± 2.6) 31.9 (± 1.8)
Healthy Youth Survey 2002 Survey Results 10 RMC Research Corporation Portland, OR See page 1 for a key to the notes (A, B, C, °, †)
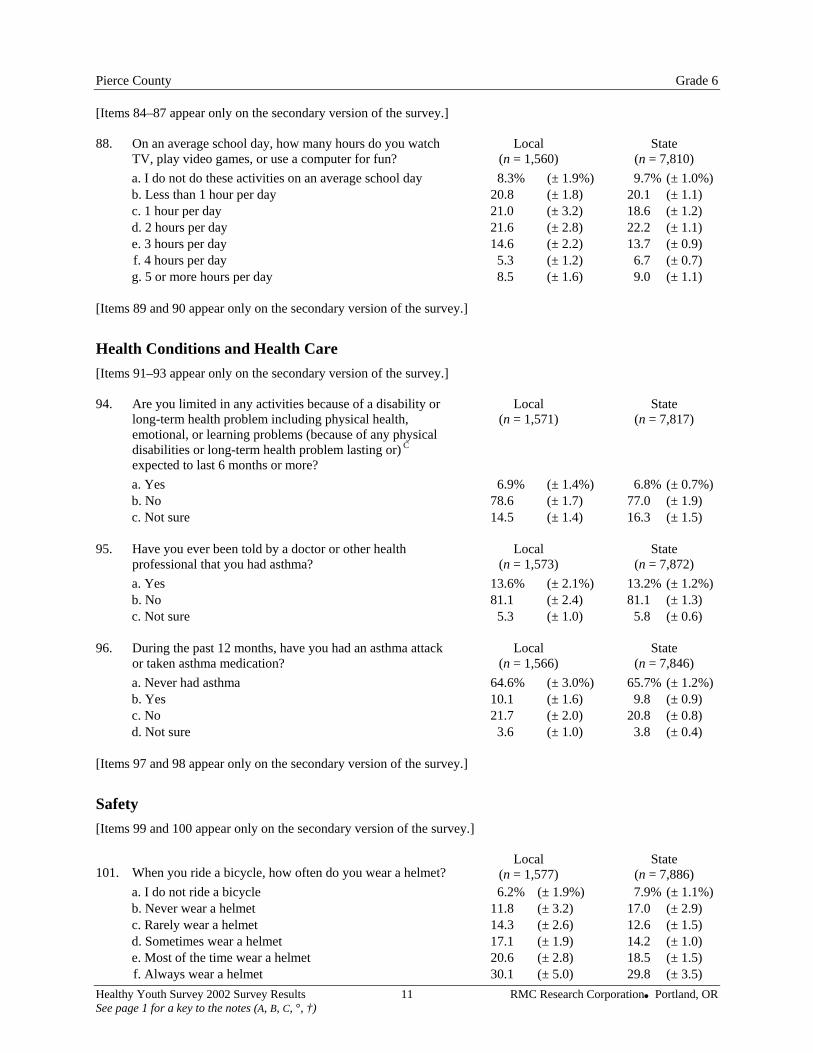
Pierce County Grade 6 [Items 84–87 appear only on the secondary version of the survey.] 88. On an average school day, how many hours do you watch
TV, play video games, or use a computer for fun? Local
(n = 1,560) State
(n = 7,810) a. I do not do these activities on an average school day 8.3% (± 1.9%) 9.7% (± 1.0%) b. Less than 1 hour per day 20.8 (± 1.8) 20.1 (± 1.1) c. 1 hour per day 21.0 (± 3.2) 18.6 (± 1.2) d. 2 hours per day 21.6 (± 2.8) 22.2 (± 1.1) e. 3 hours per day 14.6 (± 2.2) 13.7 (± 0.9) f. 4 hours per day 5.3 (± 1.2) 6.7 (± 0.7) g. 5 or more hours per day 8.5 (± 1.6) 9.0 (± 1.1)
[Items 89 and 90 appear only on the secondary version of the survey.]
Health Conditions and Health Care [Items 91–93 appear only on the secondary version of the survey.] 94. Are you limited in any activities because of a disability or
long-term health problem including physical health, emotional, or learning problems (because of any physical disabilities or long-term health problem lasting or) C
expected to last 6 months or more?
Local (n = 1,571)
State (n = 7,817)
a. Yes 6.9% (± 1.4%) 6.8% (± 0.7%) b. No 78.6 (± 1.7) 77.0 (± 1.9) c. Not sure 14.5 (± 1.4) 16.3 (± 1.5)
95. Have you ever been told by a doctor or other health
professional that you had asthma? Local
(n = 1,573) State
(n = 7,872) a. Yes 13.6% (± 2.1%) 13.2% (± 1.2%) b. No 81.1 (± 2.4) 81.1 (± 1.3) c. Not sure 5.3 (± 1.0) 5.8 (± 0.6)
96. During the past 12 months, have you had an asthma attack
or taken asthma medication? Local
(n = 1,566) State
(n = 7,846) a. Never had asthma 64.6% (± 3.0%) 65.7% (± 1.2%) b. Yes 10.1 (± 1.6) 9.8 (± 0.9) c. No 21.7 (± 2.0) 20.8 (± 0.8) d. Not sure 3.6 (± 1.0) 3.8 (± 0.4)
[Items 97 and 98 appear only on the secondary version of the survey.]
Safety [Items 99 and 100 appear only on the secondary version of the survey.]
101. When you ride a bicycle, how often do you wear a helmet? Local
(n = 1,577) State
(n = 7,886) a. I do not ride a bicycle 6.2% (± 1.9%) 7.9% (± 1.1%) b. Never wear a helmet 11.8 (± 3.2) 17.0 (± 2.9) c. Rarely wear a helmet 14.3 (± 2.6) 12.6 (± 1.5) d. Sometimes wear a helmet 17.1 (± 1.9) 14.2 (± 1.0) e. Most of the time wear a helmet 20.6 (± 2.8) 18.5 (± 1.5) f. Always wear a helmet 30.1 (± 5.0) 29.8 (± 3.5)
Healthy Youth Survey 2002 Survey Results 11 RMC Research Corporation Portland, OR See page 1 for a key to the notes (A, B, C, °, †)
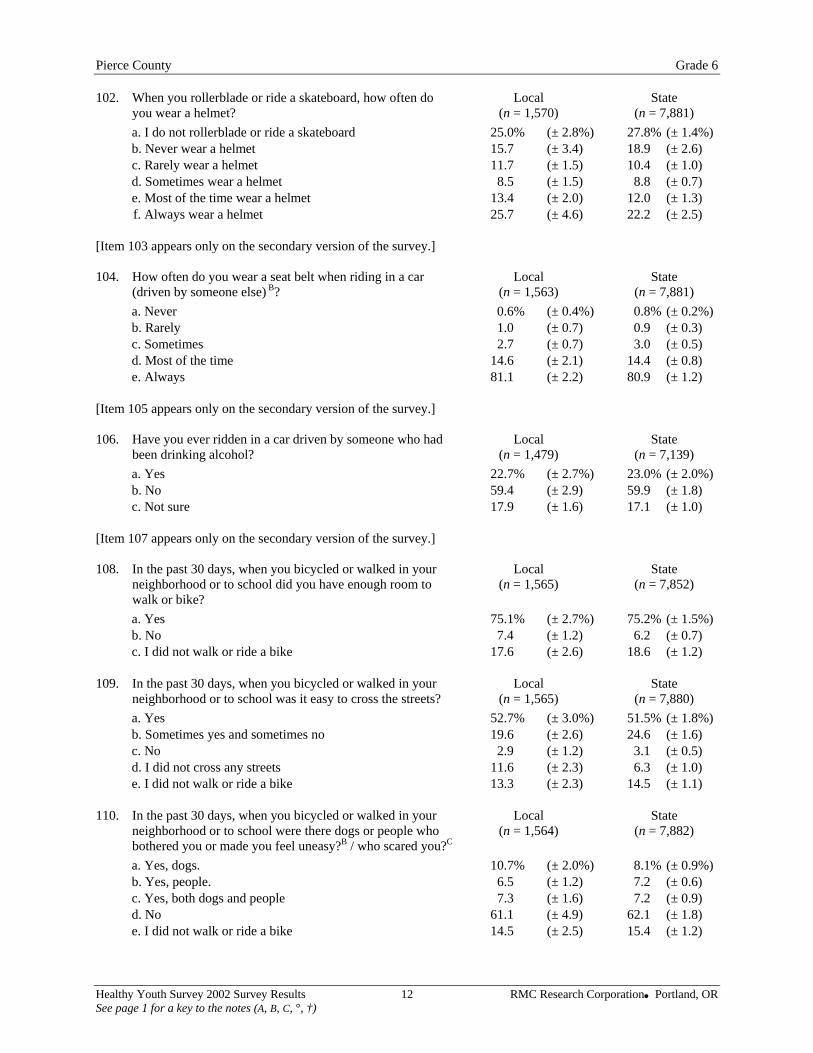
Pierce County Grade 6 102. When you rollerblade or ride a skateboard, how often do
you wear a helmet? Local
(n = 1,570) State
(n = 7,881) a. I do not rollerblade or ride a skateboard 25.0% (± 2.8%) 27.8% (± 1.4%) b. Never wear a helmet 15.7 (± 3.4) 18.9 (± 2.6) c. Rarely wear a helmet 11.7 (± 1.5) 10.4 (± 1.0) d. Sometimes wear a helmet 8.5 (± 1.5) 8.8 (± 0.7) e. Most of the time wear a helmet 13.4 (± 2.0) 12.0 (± 1.3) f. Always wear a helmet 25.7 (± 4.6) 22.2 (± 2.5)
[Item 103 appears only on the secondary version of the survey.] 104. How often do you wear a seat belt when riding in a car
(driven by someone else) B? Local
(n = 1,563) State
(n = 7,881) a. Never 0.6% (± 0.4%) 0.8% (± 0.2%) b. Rarely 1.0 (± 0.7) 0.9 (± 0.3) c. Sometimes 2.7 (± 0.7) 3.0 (± 0.5) d. Most of the time 14.6 (± 2.1) 14.4 (± 0.8) e. Always 81.1 (± 2.2) 80.9 (± 1.2)
[Item 105 appears only on the secondary version of the survey.] 106. Have you ever ridden in a car driven by someone who had
been drinking alcohol? Local
(n = 1,479) State
(n = 7,139) a. Yes 22.7% (± 2.7%) 23.0% (± 2.0%) b. No 59.4 (± 2.9) 59.9 (± 1.8) c. Not sure 17.9 (± 1.6) 17.1 (± 1.0)
[Item 107 appears only on the secondary version of the survey.] 108. In the past 30 days, when you bicycled or walked in your
neighborhood or to school did you have enough room to walk or bike?
Local (n = 1,565)
State (n = 7,852)
a. Yes 75.1% (± 2.7%) 75.2% (± 1.5%) b. No 7.4 (± 1.2) 6.2 (± 0.7) c. I did not walk or ride a bike 17.6 (± 2.6) 18.6 (± 1.2)
109. In the past 30 days, when you bicycled or walked in your
neighborhood or to school was it easy to cross the streets? Local
(n = 1,565) State
(n = 7,880) a. Yes 52.7% (± 3.0%) 51.5% (± 1.8%) b. Sometimes yes and sometimes no 19.6 (± 2.6) 24.6 (± 1.6) c. No 2.9 (± 1.2) 3.1 (± 0.5) d. I did not cross any streets 11.6 (± 2.3) 6.3 (± 1.0) e. I did not walk or ride a bike 13.3 (± 2.3) 14.5 (± 1.1)
110. In the past 30 days, when you bicycled or walked in your
neighborhood or to school were there dogs or people who bothered you or made you feel uneasy?B / who scared you?C
Local (n = 1,564)
State (n = 7,882)
a. Yes, dogs. 10.7% (± 2.0%) 8.1% (± 0.9%) b. Yes, people. 6.5 (± 1.2) 7.2 (± 0.6) c. Yes, both dogs and people 7.3 (± 1.6) 7.2 (± 0.9) d. No 61.1 (± 4.9) 62.1 (± 1.8) e. I did not walk or ride a bike 14.5 (± 2.5) 15.4 (± 1.2)
Healthy Youth Survey 2002 Survey Results 12 RMC Research Corporation Portland, OR See page 1 for a key to the notes (A, B, C, °, †)
Pierce County Grade 6
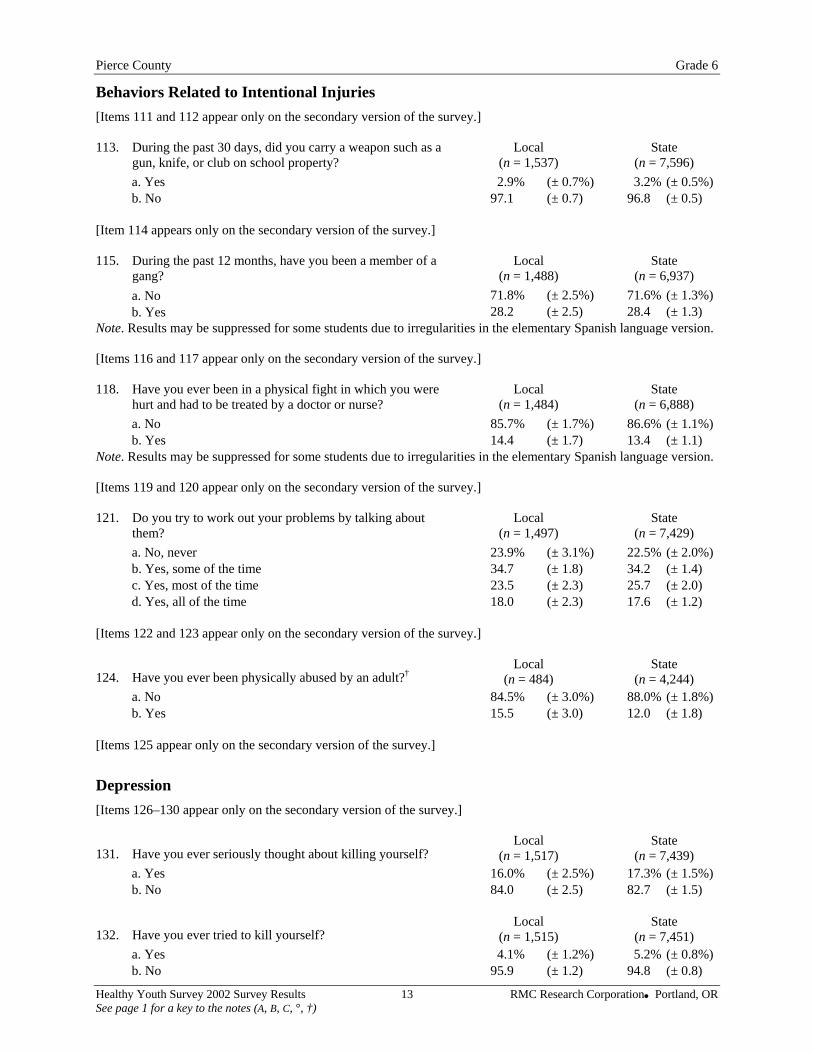
Behaviors Related to Intentional Injuries [Items 111 and 112 appear only on the secondary version of the survey.] 113. During the past 30 days, did you carry a weapon such as a
gun, knife, or club on school property? Local
(n = 1,537) State
(n = 7,596) a. Yes 2.9% (± 0.7%) 3.2% (± 0.5%) b. No 97.1 (± 0.7) 96.8 (± 0.5)
[Item 114 appears only on the secondary version of the survey.] 115. During the past 12 months, have you been a member of a
gang? Local
(n = 1,488) State
(n = 6,937) a. No 71.8% (± 2.5%) 71.6% (± 1.3%) b. Yes 28.2 (± 2.5) 28.4 (± 1.3)
Note. Results may be suppressed for some students due to irregularities in the elementary Spanish language version. [Items 116 and 117 appear only on the secondary version of the survey.] 118. Have you ever been in a physical fight in which you were
hurt and had to be treated by a doctor or nurse? Local
(n = 1,484) State
(n = 6,888) a. No 85.7% (± 1.7%) 86.6% (± 1.1%) b. Yes 14.4 (± 1.7) 13.4 (± 1.1)
Note. Results may be suppressed for some students due to irregularities in the elementary Spanish language version. [Items 119 and 120 appear only on the secondary version of the survey.] 121. Do you try to work out your problems by talking about
them? Local
(n = 1,497) State
(n = 7,429) a. No, never 23.9% (± 3.1%) 22.5% (± 2.0%) b. Yes, some of the time 34.7 (± 1.8) 34.2 (± 1.4) c. Yes, most of the time 23.5 (± 2.3) 25.7 (± 2.0) d. Yes, all of the time 18.0 (± 2.3) 17.6 (± 1.2)
[Items 122 and 123 appear only on the secondary version of the survey.]
124. Have you ever been physically abused by an adult?†Local
(n = 484) State
(n = 4,244) a. No 84.5% (± 3.0%) 88.0% (± 1.8%) b. Yes 15.5 (± 3.0) 12.0 (± 1.8)
[Items 125 appear only on the secondary version of the survey.]
Depression [Items 126–130 appear only on the secondary version of the survey.]
131. Have you ever seriously thought about killing yourself? Local
(n = 1,517) State
(n = 7,439) a. Yes 16.0% (± 2.5%) 17.3% (± 1.5%) b. No 84.0 (± 2.5) 82.7 (± 1.5)
132. Have you ever tried to kill yourself? Local
(n = 1,515) State
(n = 7,451) a. Yes 4.1% (± 1.2%) 5.2% (± 0.8%) b. No 95.9 (± 1.2) 94.8 (± 0.8)
Healthy Youth Survey 2002 Survey Results 13 RMC Research Corporation Portland, OR See page 1 for a key to the notes (A, B, C, °, †)
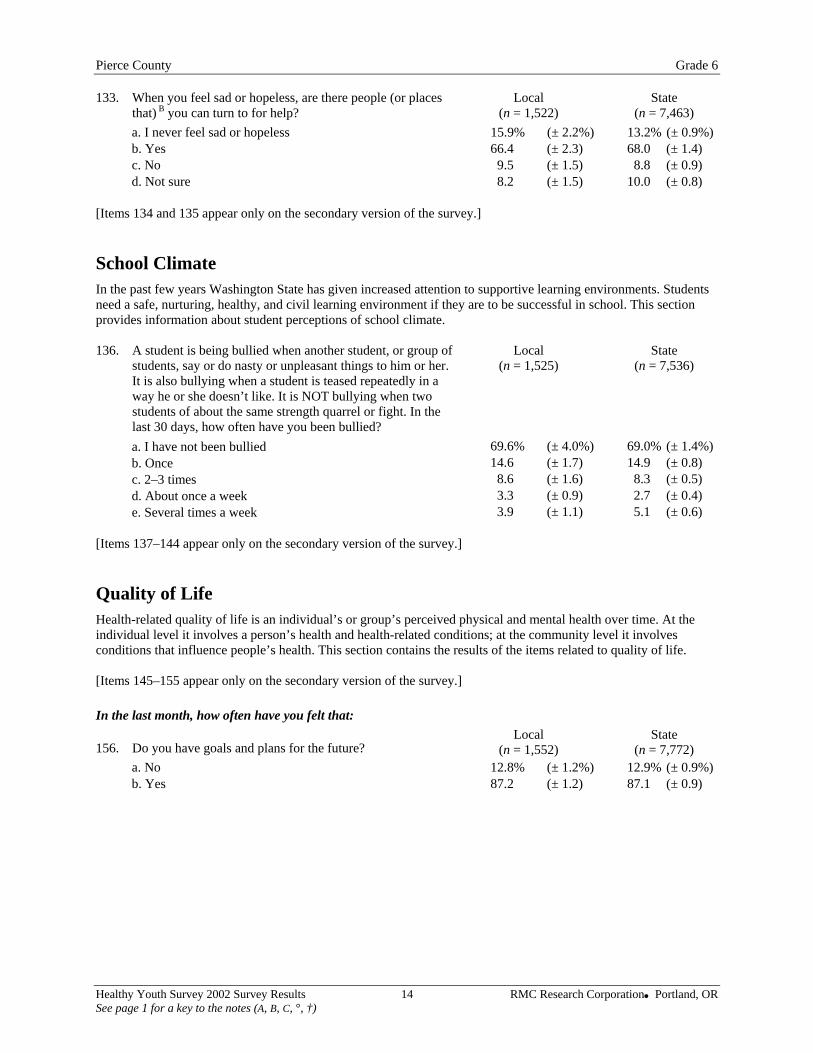
Pierce County Grade 6 133. When you feel sad or hopeless, are there people (or places
that) B you can turn to for help? Local
(n = 1,522) State
(n = 7,463) a. I never feel sad or hopeless 15.9% (± 2.2%) 13.2% (± 0.9%) b. Yes 66.4 (± 2.3) 68.0 (± 1.4) c. No 9.5 (± 1.5) 8.8 (± 0.9) d. Not sure 8.2 (± 1.5) 10.0 (± 0.8)
[Items 134 and 135 appear only on the secondary version of the survey.]
School Climate In the past few years Washington State has given increased attention to supportive learning environments. Students need a safe, nurturing, healthy, and civil learning environment if they are to be successful in school. This section provides information about student perceptions of school climate. 136. A student is being bullied when another student, or group of
students, say or do nasty or unpleasant things to him or her. It is also bullying when a student is teased repeatedly in a way he or she doesn’t like. It is NOT bullying when two students of about the same strength quarrel or fight. In the last 30 days, how often have you been bullied?
Local (n = 1,525)
State (n = 7,536)
a. I have not been bullied 69.6% (± 4.0%) 69.0% (± 1.4%) b. Once 14.6 (± 1.7) 14.9 (± 0.8) c. 2–3 times 8.6 (± 1.6) 8.3 (± 0.5) d. About once a week 3.3 (± 0.9) 2.7 (± 0.4) e. Several times a week 3.9 (± 1.1) 5.1 (± 0.6)
[Items 137–144 appear only on the secondary version of the survey.]
Quality of Life Health-related quality of life is an individual’s or group’s perceived physical and mental health over time. At the individual level it involves a person’s health and health-related conditions; at the community level it involves conditions that influence people’s health. This section contains the results of the items related to quality of life. [Items 145–155 appear only on the secondary version of the survey.] In the last month, how often have you felt that:
156. Do you have goals and plans for the future? Local
(n = 1,552) State
(n = 7,772) a. No 12.8% (± 1.2%) 12.9% (± 0.9%) b. Yes 87.2 (± 1.2) 87.1 (± 0.9)
Healthy Youth Survey 2002 Survey Results 14 RMC Research Corporation Portland, OR See page 1 for a key to the notes (A, B, C, °, †)
Pierce County Grade 6
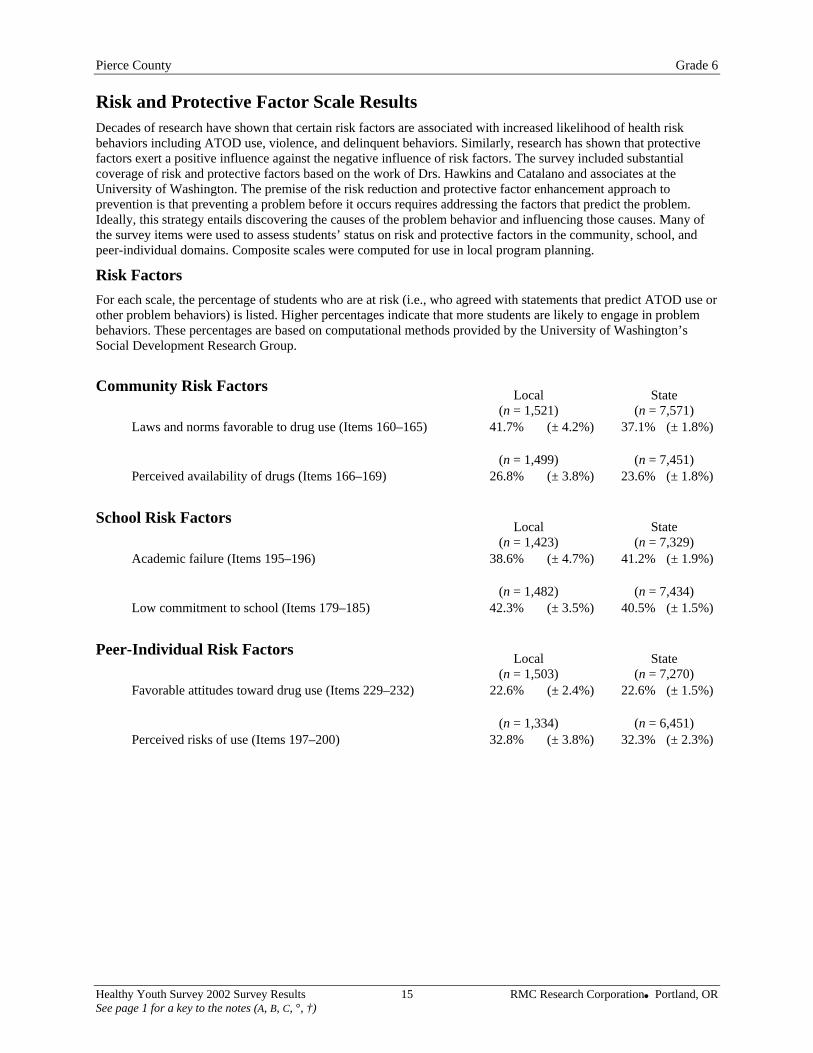
Risk and Protective Factor Scale Results Decades of research have shown that certain risk factors are associated with increased likelihood of health risk behaviors including ATOD use, violence, and delinquent behaviors. Similarly, research has shown that protective factors exert a positive influence against the negative influence of risk factors. The survey included substantial coverage of risk and protective factors based on the work of Drs. Hawkins and Catalano and associates at the University of Washington. The premise of the risk reduction and protective factor enhancement approach to prevention is that preventing a problem before it occurs requires addressing the factors that predict the problem. Ideally, this strategy entails discovering the causes of the problem behavior and influencing those causes. Many of the survey items were used to assess students’ status on risk and protective factors in the community, school, and peer-individual domains. Composite scales were computed for use in local program planning.
Risk Factors For each scale, the percentage of students who are at risk (i.e., who agreed with statements that predict ATOD use or other problem behaviors) is listed. Higher percentages indicate that more students are likely to engage in problem behaviors. These percentages are based on computational methods provided by the University of Washington’s Social Development Research Group.
Community Risk Factors Local State (n = 1,521) (n = 7,571) Laws and norms favorable to drug use (Items 160–165) 41.7% (± 4.2%) 37.1% (± 1.8%) (n = 1,499) (n = 7,451) Perceived availability of drugs (Items 166–169) 26.8% (± 3.8%) 23.6% (± 1.8%)
School Risk Factors Local State (n = 1,423) (n = 7,329) Academic failure (Items 195–196) 38.6% (± 4.7%) 41.2% (± 1.9%) (n = 1,482) (n = 7,434) Low commitment to school (Items 179–185) 42.3% (± 3.5%) 40.5% (± 1.5%)
Peer-Individual Risk Factors Local State (n = 1,503) (n = 7,270) Favorable attitudes toward drug use (Items 229–232) 22.6% (± 2.4%) 22.6% (± 1.5%) (n = 1,334) (n = 6,451) Perceived risks of use (Items 197–200) 32.8% (± 3.8%) 32.3% (± 2.3%)
Healthy Youth Survey 2002 Survey Results 15 RMC Research Corporation Portland, OR See page 1 for a key to the notes (A, B, C, °, †)
Pierce County Grade 6
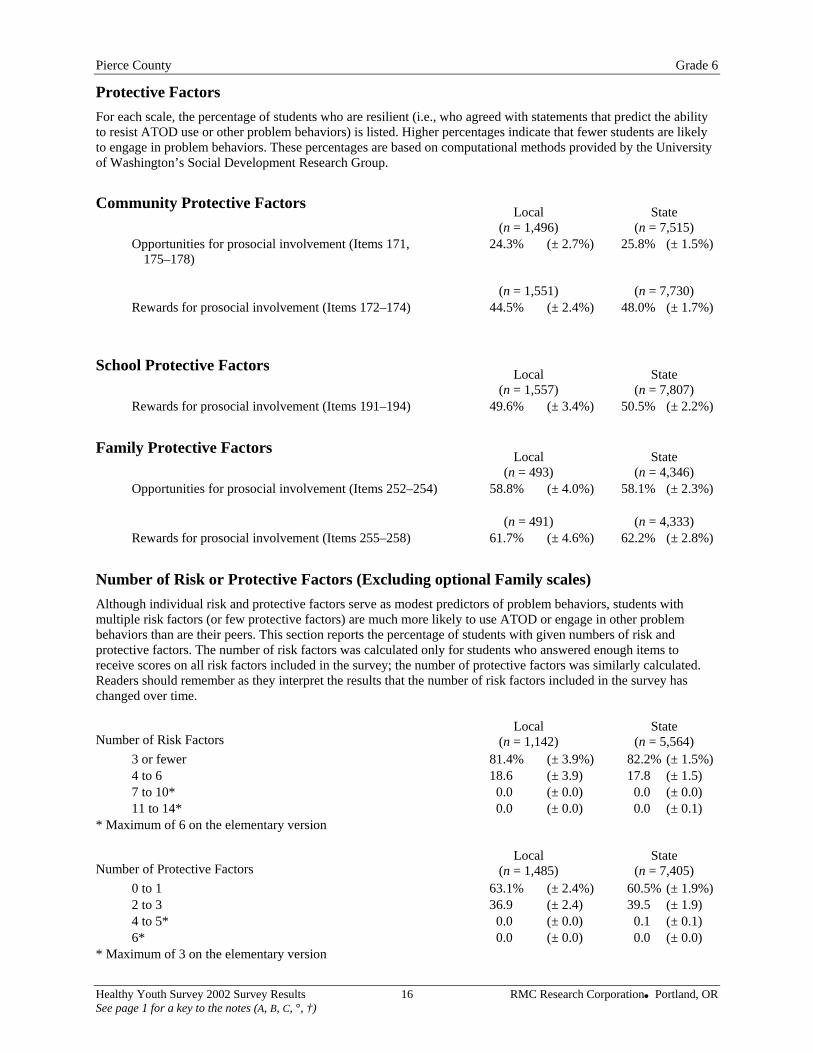
Protective Factors For each scale, the percentage of students who are resilient (i.e., who agreed with statements that predict the ability to resist ATOD use or other problem behaviors) is listed. Higher percentages indicate that fewer students are likely to engage in problem behaviors. These percentages are based on computational methods provided by the University of Washington’s Social Development Research Group.
Community Protective Factors Local State (n = 1,496) (n = 7,515) Opportunities for prosocial involvement (Items 171,
175–178) 24.3% (± 2.7%) 25.8% (± 1.5%)
(n = 1,551) (n = 7,730) Rewards for prosocial involvement (Items 172–174) 44.5% (± 2.4%) 48.0% (± 1.7%)
School Protective Factors Local State (n = 1,557) (n = 7,807) Rewards for prosocial involvement (Items 191–194) 49.6% (± 3.4%) 50.5% (± 2.2%)
Family Protective Factors Local State (n = 493) (n = 4,346) Opportunities for prosocial involvement (Items 252–254) 58.8% (± 4.0%) 58.1% (± 2.3%) (n = 491) (n = 4,333) Rewards for prosocial involvement (Items 255–258) 61.7% (± 4.6%) 62.2% (± 2.8%)
Number of Risk or Protective Factors (Excluding optional Family scales) Although individual risk and protective factors serve as modest predictors of problem behaviors, students with multiple risk factors (or few protective factors) are much more likely to use ATOD or engage in other problem behaviors than are their peers. This section reports the percentage of students with given numbers of risk and protective factors. The number of risk factors was calculated only for students who answered enough items to receive scores on all risk factors included in the survey; the number of protective factors was similarly calculated. Readers should remember as they interpret the results that the number of risk factors included in the survey has changed over time.
Number of Risk Factors Local
(n = 1,142) State
(n = 5,564) 3 or fewer 81.4% (± 3.9%) 82.2% (± 1.5%) 4 to 6 18.6 (± 3.9) 17.8 (± 1.5) 7 to 10* 0.0 (± 0.0) 0.0 (± 0.0) 11 to 14* 0.0 (± 0.0) 0.0 (± 0.1)
* Maximum of 6 on the elementary version
Number of Protective Factors Local
(n = 1,485) State
(n = 7,405) 0 to 1 63.1% (± 2.4%) 60.5% (± 1.9%) 2 to 3 36.9 (± 2.4) 39.5 (± 1.9) 4 to 5* 0.0 (± 0.0) 0.1 (± 0.1) 6* 0.0 (± 0.0) 0.0 (± 0.0)
* Maximum of 3 on the elementary version
Healthy Youth Survey 2002 Survey Results 16 RMC Research Corporation Portland, OR See page 1 for a key to the notes (A, B, C, °, †)
Pierce County Grade 6
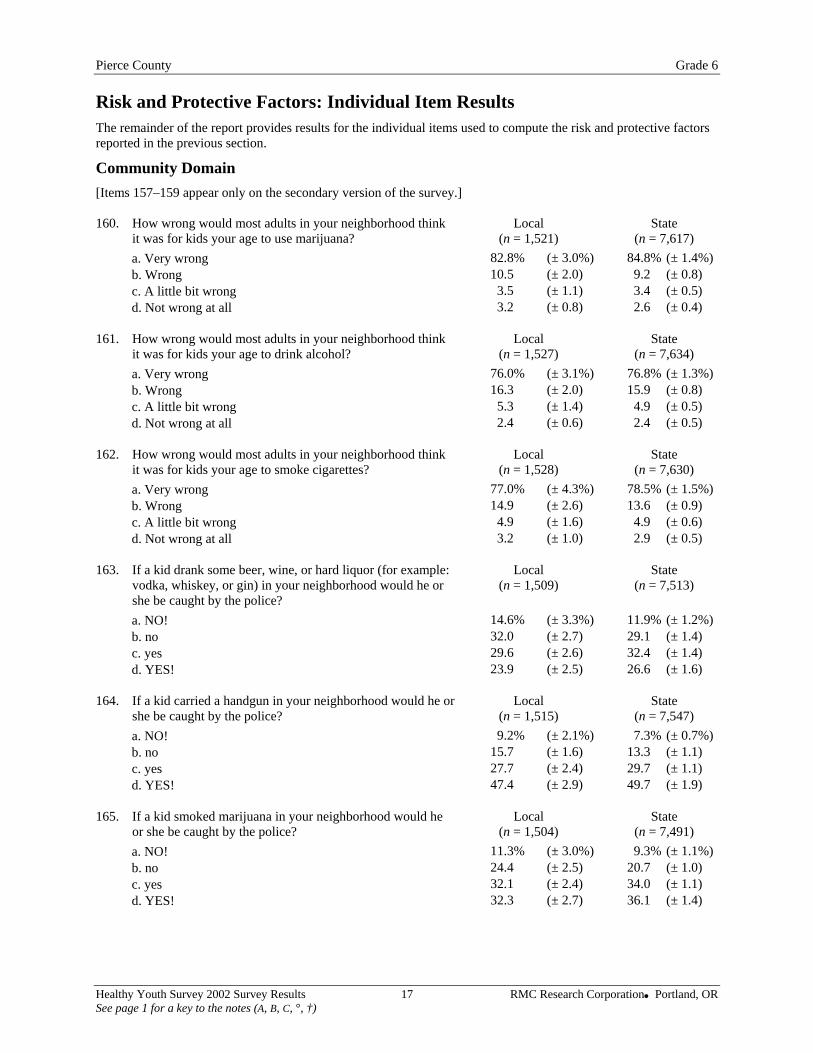
Risk and Protective Factors: Individual Item Results The remainder of the report provides results for the individual items used to compute the risk and protective factors reported in the previous section.
Community Domain [Items 157–159 appear only on the secondary version of the survey.] 160. How wrong would most adults in your neighborhood think
it was for kids your age to use marijuana? Local
(n = 1,521) State
(n = 7,617) a. Very wrong 82.8% (± 3.0%) 84.8% (± 1.4%) b. Wrong 10.5 (± 2.0) 9.2 (± 0.8) c. A little bit wrong 3.5 (± 1.1) 3.4 (± 0.5) d. Not wrong at all 3.2 (± 0.8) 2.6 (± 0.4)
161. How wrong would most adults in your neighborhood think
it was for kids your age to drink alcohol? Local
(n = 1,527) State
(n = 7,634) a. Very wrong 76.0% (± 3.1%) 76.8% (± 1.3%) b. Wrong 16.3 (± 2.0) 15.9 (± 0.8) c. A little bit wrong 5.3 (± 1.4) 4.9 (± 0.5) d. Not wrong at all 2.4 (± 0.6) 2.4 (± 0.5)
162. How wrong would most adults in your neighborhood think
it was for kids your age to smoke cigarettes? Local
(n = 1,528) State
(n = 7,630) a. Very wrong 77.0% (± 4.3%) 78.5% (± 1.5%) b. Wrong 14.9 (± 2.6) 13.6 (± 0.9) c. A little bit wrong 4.9 (± 1.6) 4.9 (± 0.6) d. Not wrong at all 3.2 (± 1.0) 2.9 (± 0.5)
163. If a kid drank some beer, wine, or hard liquor (for example:
vodka, whiskey, or gin) in your neighborhood would he or she be caught by the police?
Local (n = 1,509)
State (n = 7,513)
a. NO! 14.6% (± 3.3%) 11.9% (± 1.2%) b. no 32.0 (± 2.7) 29.1 (± 1.4) c. yes 29.6 (± 2.6) 32.4 (± 1.4) d. YES! 23.9 (± 2.5) 26.6 (± 1.6)
164. If a kid carried a handgun in your neighborhood would he or
she be caught by the police? Local
(n = 1,515) State
(n = 7,547) a. NO! 9.2% (± 2.1%) 7.3% (± 0.7%) b. no 15.7 (± 1.6) 13.3 (± 1.1) c. yes 27.7 (± 2.4) 29.7 (± 1.1) d. YES! 47.4 (± 2.9) 49.7 (± 1.9)
165. If a kid smoked marijuana in your neighborhood would he
or she be caught by the police? Local
(n = 1,504) State
(n = 7,491) a. NO! 11.3% (± 3.0%) 9.3% (± 1.1%) b. no 24.4 (± 2.5) 20.7 (± 1.0) c. yes 32.1 (± 2.4) 34.0 (± 1.1) d. YES! 32.3 (± 2.7) 36.1 (± 1.4)
Healthy Youth Survey 2002 Survey Results 17 RMC Research Corporation Portland, OR See page 1 for a key to the notes (A, B, C, °, †)
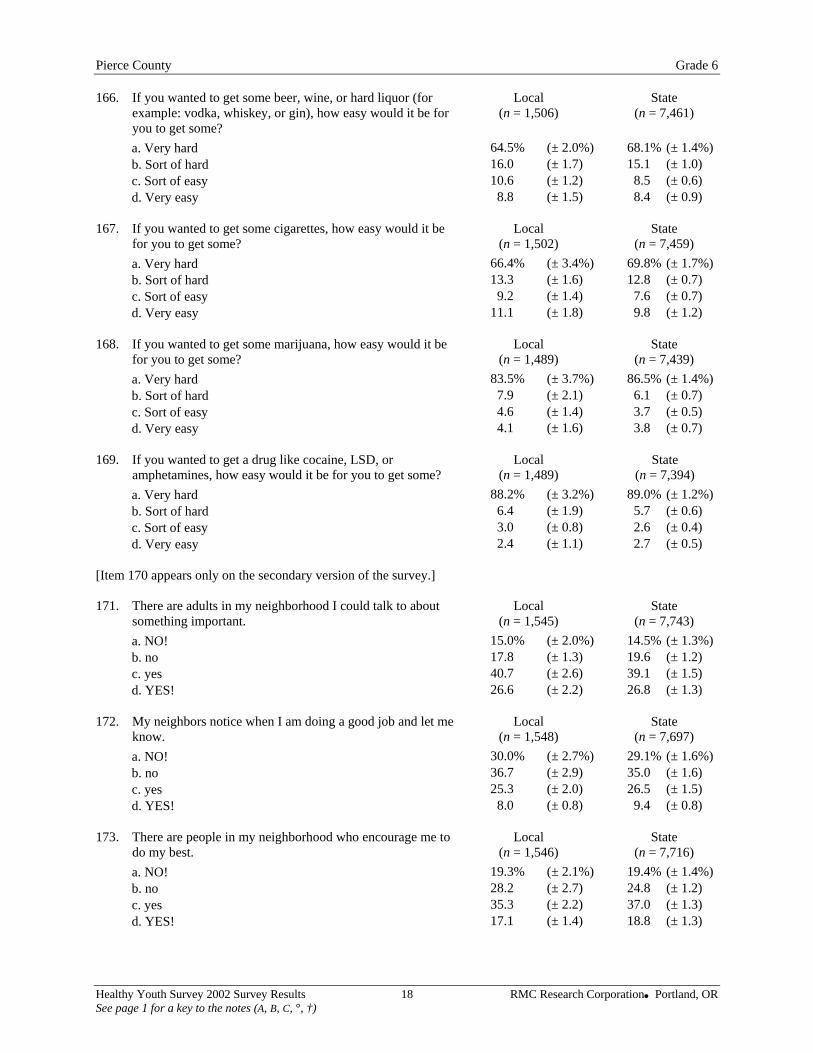
Pierce County Grade 6 166. If you wanted to get some beer, wine, or hard liquor (for
example: vodka, whiskey, or gin), how easy would it be for you to get some?
Local (n = 1,506)
State (n = 7,461)
a. Very hard 64.5% (± 2.0%) 68.1% (± 1.4%) b. Sort of hard 16.0 (± 1.7) 15.1 (± 1.0) c. Sort of easy 10.6 (± 1.2) 8.5 (± 0.6) d. Very easy 8.8 (± 1.5) 8.4 (± 0.9)
167. If you wanted to get some cigarettes, how easy would it be
for you to get some? Local
(n = 1,502) State
(n = 7,459) a. Very hard 66.4% (± 3.4%) 69.8% (± 1.7%) b. Sort of hard 13.3 (± 1.6) 12.8 (± 0.7) c. Sort of easy 9.2 (± 1.4) 7.6 (± 0.7) d. Very easy 11.1 (± 1.8) 9.8 (± 1.2)
168. If you wanted to get some marijuana, how easy would it be
for you to get some? Local
(n = 1,489) State
(n = 7,439) a. Very hard 83.5% (± 3.7%) 86.5% (± 1.4%) b. Sort of hard 7.9 (± 2.1) 6.1 (± 0.7) c. Sort of easy 4.6 (± 1.4) 3.7 (± 0.5) d. Very easy 4.1 (± 1.6) 3.8 (± 0.7)
169. If you wanted to get a drug like cocaine, LSD, or
amphetamines, how easy would it be for you to get some? Local
(n = 1,489) State
(n = 7,394) a. Very hard 88.2% (± 3.2%) 89.0% (± 1.2%) b. Sort of hard 6.4 (± 1.9) 5.7 (± 0.6) c. Sort of easy 3.0 (± 0.8) 2.6 (± 0.4) d. Very easy 2.4 (± 1.1) 2.7 (± 0.5)
[Item 170 appears only on the secondary version of the survey.] 171. There are adults in my neighborhood I could talk to about
something important. Local
(n = 1,545) State
(n = 7,743) a. NO! 15.0% (± 2.0%) 14.5% (± 1.3%) b. no 17.8 (± 1.3) 19.6 (± 1.2) c. yes 40.7 (± 2.6) 39.1 (± 1.5) d. YES! 26.6 (± 2.2) 26.8 (± 1.3)
172. My neighbors notice when I am doing a good job and let me
know. Local
(n = 1,548) State
(n = 7,697) a. NO! 30.0% (± 2.7%) 29.1% (± 1.6%) b. no 36.7 (± 2.9) 35.0 (± 1.6) c. yes 25.3 (± 2.0) 26.5 (± 1.5) d. YES! 8.0 (± 0.8) 9.4 (± 0.8)
173. There are people in my neighborhood who encourage me to
do my best. Local
(n = 1,546) State
(n = 7,716) a. NO! 19.3% (± 2.1%) 19.4% (± 1.4%) b. no 28.2 (± 2.7) 24.8 (± 1.2) c. yes 35.3 (± 2.2) 37.0 (± 1.3) d. YES! 17.1 (± 1.4) 18.8 (± 1.3)
Healthy Youth Survey 2002 Survey Results 18 RMC Research Corporation Portland, OR See page 1 for a key to the notes (A, B, C, °, †)
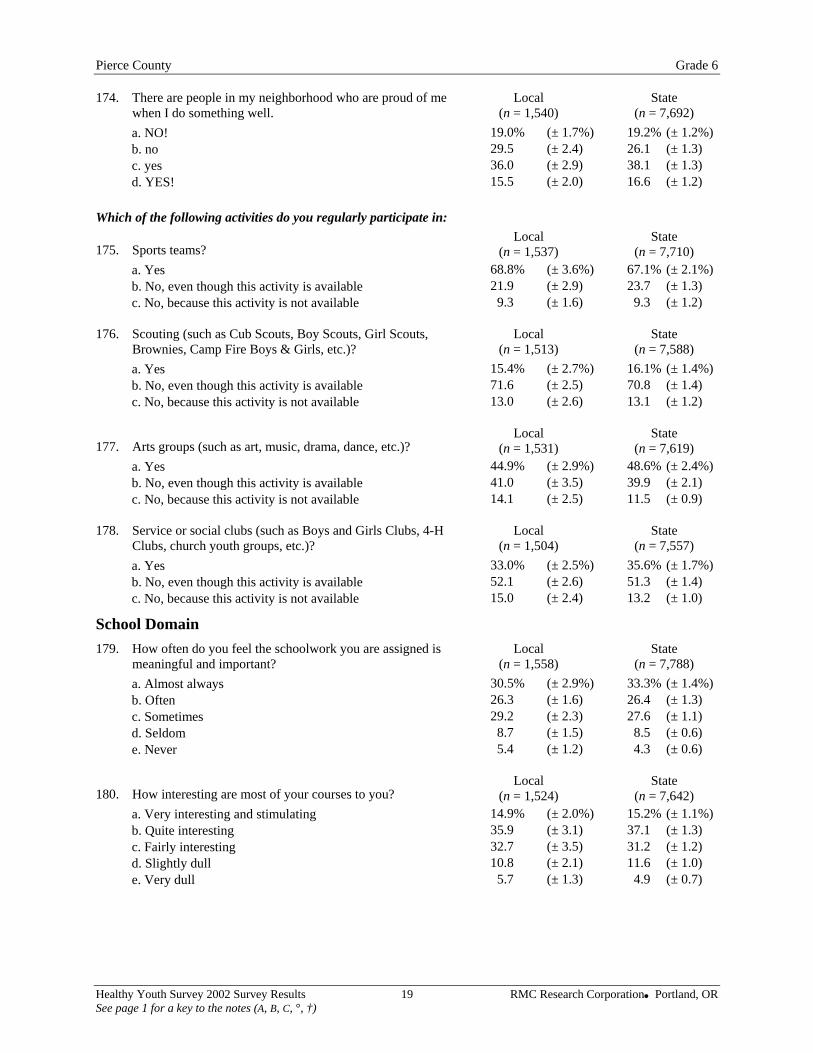
Pierce County Grade 6 174. There are people in my neighborhood who are proud of me
when I do something well. Local
(n = 1,540) State
(n = 7,692) a. NO! 19.0% (± 1.7%) 19.2% (± 1.2%) b. no 29.5 (± 2.4) 26.1 (± 1.3) c. yes 36.0 (± 2.9) 38.1 (± 1.3) d. YES! 15.5 (± 2.0) 16.6 (± 1.2)
Which of the following activities do you regularly participate in:
175. Sports teams? Local
(n = 1,537) State
(n = 7,710) a. Yes 68.8% (± 3.6%) 67.1% (± 2.1%) b. No, even though this activity is available 21.9 (± 2.9) 23.7 (± 1.3) c. No, because this activity is not available 9.3 (± 1.6) 9.3 (± 1.2)
176. Scouting (such as Cub Scouts, Boy Scouts, Girl Scouts,
Brownies, Camp Fire Boys & Girls, etc.)? Local
(n = 1,513) State
(n = 7,588) a. Yes 15.4% (± 2.7%) 16.1% (± 1.4%) b. No, even though this activity is available 71.6 (± 2.5) 70.8 (± 1.4) c. No, because this activity is not available 13.0 (± 2.6) 13.1 (± 1.2)
177. Arts groups (such as art, music, drama, dance, etc.)? Local
(n = 1,531) State
(n = 7,619) a. Yes 44.9% (± 2.9%) 48.6% (± 2.4%) b. No, even though this activity is available 41.0 (± 3.5) 39.9 (± 2.1) c. No, because this activity is not available 14.1 (± 2.5) 11.5 (± 0.9)
178. Service or social clubs (such as Boys and Girls Clubs, 4-H
Clubs, church youth groups, etc.)? Local
(n = 1,504) State
(n = 7,557) a. Yes 33.0% (± 2.5%) 35.6% (± 1.7%) b. No, even though this activity is available 52.1 (± 2.6) 51.3 (± 1.4) c. No, because this activity is not available 15.0 (± 2.4) 13.2 (± 1.0)
School Domain 179. How often do you feel the schoolwork you are assigned is
meaningful and important? Local
(n = 1,558) State
(n = 7,788) a. Almost always 30.5% (± 2.9%) 33.3% (± 1.4%) b. Often 26.3 (± 1.6) 26.4 (± 1.3) c. Sometimes 29.2 (± 2.3) 27.6 (± 1.1) d. Seldom 8.7 (± 1.5) 8.5 (± 0.6) e. Never 5.4 (± 1.2) 4.3 (± 0.6)
180. How interesting are most of your courses to you? Local
(n = 1,524) State
(n = 7,642) a. Very interesting and stimulating 14.9% (± 2.0%) 15.2% (± 1.1%) b. Quite interesting 35.9 (± 3.1) 37.1 (± 1.3) c. Fairly interesting 32.7 (± 3.5) 31.2 (± 1.2) d. Slightly dull 10.8 (± 2.1) 11.6 (± 1.0) e. Very dull 5.7 (± 1.3) 4.9 (± 0.7)
Healthy Youth Survey 2002 Survey Results 19 RMC Research Corporation Portland, OR See page 1 for a key to the notes (A, B, C, °, †)
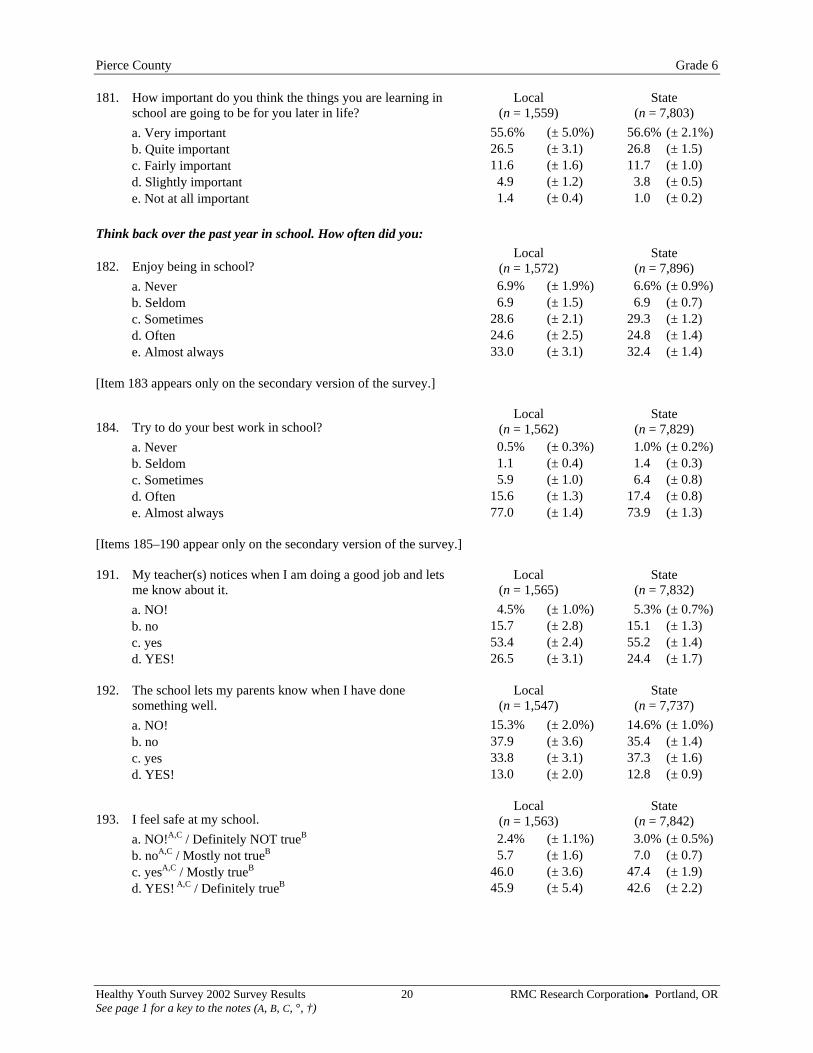
Pierce County Grade 6 181. How important do you think the things you are learning in
school are going to be for you later in life? Local
(n = 1,559) State
(n = 7,803) a. Very important 55.6% (± 5.0%) 56.6% (± 2.1%) b. Quite important 26.5 (± 3.1) 26.8 (± 1.5) c. Fairly important 11.6 (± 1.6) 11.7 (± 1.0) d. Slightly important 4.9 (± 1.2) 3.8 (± 0.5) e. Not at all important 1.4 (± 0.4) 1.0 (± 0.2)
Think back over the past year in school. How often did you:
182. Enjoy being in school? Local
(n = 1,572) State
(n = 7,896) a. Never 6.9% (± 1.9%) 6.6% (± 0.9%) b. Seldom 6.9 (± 1.5) 6.9 (± 0.7) c. Sometimes 28.6 (± 2.1) 29.3 (± 1.2) d. Often 24.6 (± 2.5) 24.8 (± 1.4) e. Almost always 33.0 (± 3.1) 32.4 (± 1.4)
[Item 183 appears only on the secondary version of the survey.]
184. Try to do your best work in school? Local
(n = 1,562) State
(n = 7,829) a. Never 0.5% (± 0.3%) 1.0% (± 0.2%) b. Seldom 1.1 (± 0.4) 1.4 (± 0.3) c. Sometimes 5.9 (± 1.0) 6.4 (± 0.8) d. Often 15.6 (± 1.3) 17.4 (± 0.8) e. Almost always 77.0 (± 1.4) 73.9 (± 1.3)
[Items 185–190 appear only on the secondary version of the survey.] 191. My teacher(s) notices when I am doing a good job and lets
me know about it. Local
(n = 1,565) State
(n = 7,832) a. NO! 4.5% (± 1.0%) 5.3% (± 0.7%) b. no 15.7 (± 2.8) 15.1 (± 1.3) c. yes 53.4 (± 2.4) 55.2 (± 1.4) d. YES! 26.5 (± 3.1) 24.4 (± 1.7)
192. The school lets my parents know when I have done
something well. Local
(n = 1,547) State
(n = 7,737) a. NO! 15.3% (± 2.0%) 14.6% (± 1.0%) b. no 37.9 (± 3.6) 35.4 (± 1.4) c. yes 33.8 (± 3.1) 37.3 (± 1.6) d. YES! 13.0 (± 2.0) 12.8 (± 0.9)
193. I feel safe at my school. Local
(n = 1,563) State
(n = 7,842) a. NO!A,C / Definitely NOT trueB 2.4% (± 1.1%) 3.0% (± 0.5%) b. noA,C / Mostly not trueB 5.7 (± 1.6) 7.0 (± 0.7) c. yesA,C / Mostly trueB 46.0 (± 3.6) 47.4 (± 1.9) d. YES! A,C / Definitely trueB 45.9 (± 5.4) 42.6 (± 2.2)
Healthy Youth Survey 2002 Survey Results 20 RMC Research Corporation Portland, OR See page 1 for a key to the notes (A, B, C, °, †)
Pierce County Grade 6
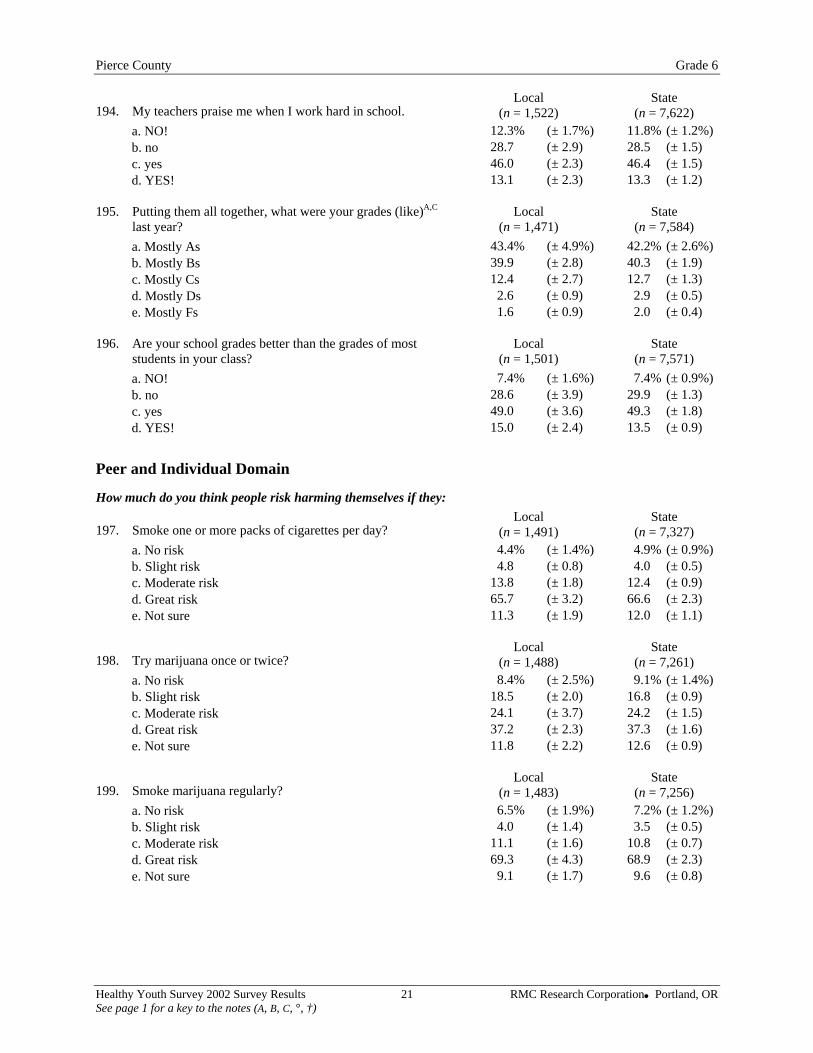
194. My teachers praise me when I work hard in school. Local
(n = 1,522) State
(n = 7,622) a. NO! 12.3% (± 1.7%) 11.8% (± 1.2%) b. no 28.7 (± 2.9) 28.5 (± 1.5) c. yes 46.0 (± 2.3) 46.4 (± 1.5) d. YES! 13.1 (± 2.3) 13.3 (± 1.2)
195. Putting them all together, what were your grades (like)A,C
last year? Local
(n = 1,471) State
(n = 7,584) a. Mostly As 43.4% (± 4.9%) 42.2% (± 2.6%) b. Mostly Bs 39.9 (± 2.8) 40.3 (± 1.9) c. Mostly Cs 12.4 (± 2.7) 12.7 (± 1.3) d. Mostly Ds 2.6 (± 0.9) 2.9 (± 0.5) e. Mostly Fs 1.6 (± 0.9) 2.0 (± 0.4)
196. Are your school grades better than the grades of most
students in your class? Local
(n = 1,501) State
(n = 7,571) a. NO! 7.4% (± 1.6%) 7.4% (± 0.9%) b. no 28.6 (± 3.9) 29.9 (± 1.3) c. yes 49.0 (± 3.6) 49.3 (± 1.8) d. YES! 15.0 (± 2.4) 13.5 (± 0.9)
Peer and Individual Domain
How much do you think people risk harming themselves if they:
197. Smoke one or more packs of cigarettes per day? Local
(n = 1,491) State
(n = 7,327) a. No risk 4.4% (± 1.4%) 4.9% (± 0.9%) b. Slight risk 4.8 (± 0.8) 4.0 (± 0.5) c. Moderate risk 13.8 (± 1.8) 12.4 (± 0.9) d. Great risk 65.7 (± 3.2) 66.6 (± 2.3) e. Not sure 11.3 (± 1.9) 12.0 (± 1.1)
198. Try marijuana once or twice? Local
(n = 1,488) State
(n = 7,261) a. No risk 8.4% (± 2.5%) 9.1% (± 1.4%) b. Slight risk 18.5 (± 2.0) 16.8 (± 0.9) c. Moderate risk 24.1 (± 3.7) 24.2 (± 1.5) d. Great risk 37.2 (± 2.3) 37.3 (± 1.6) e. Not sure 11.8 (± 2.2) 12.6 (± 0.9)
199. Smoke marijuana regularly? Local
(n = 1,483) State
(n = 7,256) a. No risk 6.5% (± 1.9%) 7.2% (± 1.2%) b. Slight risk 4.0 (± 1.4) 3.5 (± 0.5) c. Moderate risk 11.1 (± 1.6) 10.8 (± 0.7) d. Great risk 69.3 (± 4.3) 68.9 (± 2.3) e. Not sure 9.1 (± 1.7) 9.6 (± 0.8)
Healthy Youth Survey 2002 Survey Results 21 RMC Research Corporation Portland, OR See page 1 for a key to the notes (A, B, C, °, †)
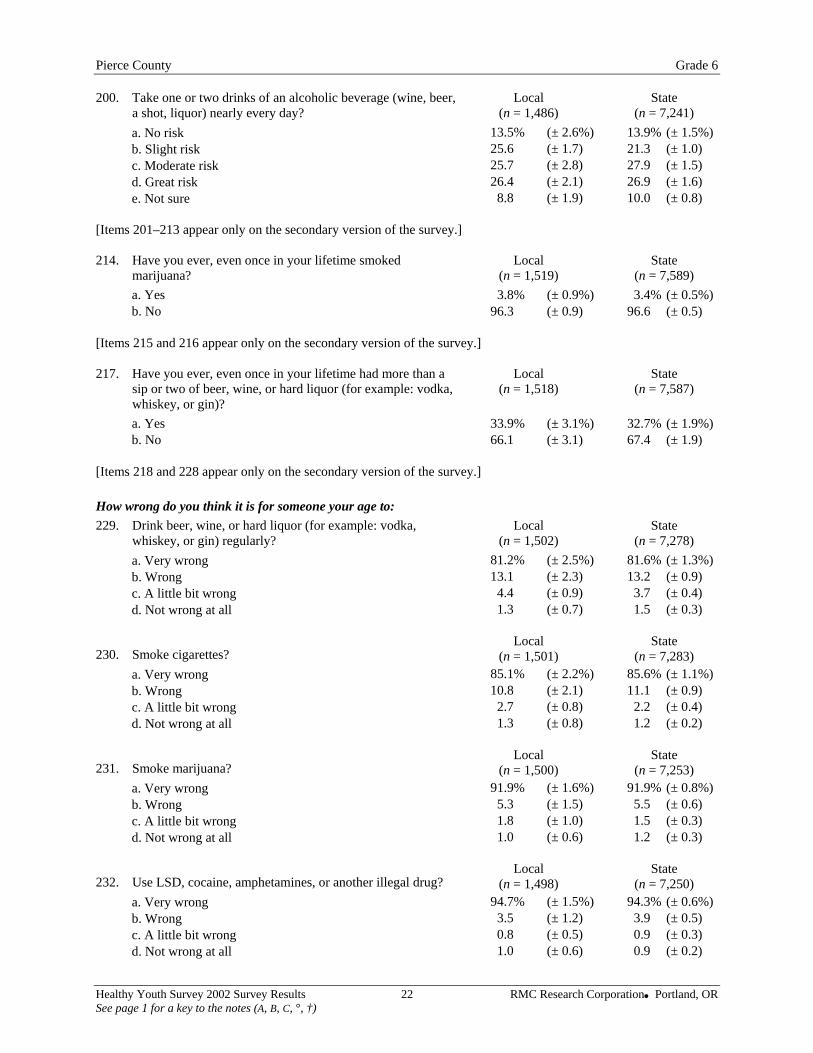
Pierce County Grade 6 200. Take one or two drinks of an alcoholic beverage (wine, beer,
a shot, liquor) nearly every day? Local
(n = 1,486) State
(n = 7,241) a. No risk 13.5% (± 2.6%) 13.9% (± 1.5%) b. Slight risk 25.6 (± 1.7) 21.3 (± 1.0) c. Moderate risk 25.7 (± 2.8) 27.9 (± 1.5) d. Great risk 26.4 (± 2.1) 26.9 (± 1.6) e. Not sure 8.8 (± 1.9) 10.0 (± 0.8)
[Items 201–213 appear only on the secondary version of the survey.] 214. Have you ever, even once in your lifetime smoked
marijuana? Local
(n = 1,519) State
(n = 7,589) a. Yes 3.8% (± 0.9%) 3.4% (± 0.5%) b. No 96.3 (± 0.9) 96.6 (± 0.5)
[Items 215 and 216 appear only on the secondary version of the survey.] 217. Have you ever, even once in your lifetime had more than a
sip or two of beer, wine, or hard liquor (for example: vodka, whiskey, or gin)?
Local (n = 1,518)
State (n = 7,587)
a. Yes 33.9% (± 3.1%) 32.7% (± 1.9%) b. No 66.1 (± 3.1) 67.4 (± 1.9)
[Items 218 and 228 appear only on the secondary version of the survey.] How wrong do you think it is for someone your age to: 229. Drink beer, wine, or hard liquor (for example: vodka,
whiskey, or gin) regularly? Local
(n = 1,502) State
(n = 7,278) a. Very wrong 81.2% (± 2.5%) 81.6% (± 1.3%) b. Wrong 13.1 (± 2.3) 13.2 (± 0.9) c. A little bit wrong 4.4 (± 0.9) 3.7 (± 0.4) d. Not wrong at all 1.3 (± 0.7) 1.5 (± 0.3)
230. Smoke cigarettes? Local
(n = 1,501) State
(n = 7,283) a. Very wrong 85.1% (± 2.2%) 85.6% (± 1.1%) b. Wrong 10.8 (± 2.1) 11.1 (± 0.9) c. A little bit wrong 2.7 (± 0.8) 2.2 (± 0.4) d. Not wrong at all 1.3 (± 0.8) 1.2 (± 0.2)
231. Smoke marijuana? Local
(n = 1,500) State
(n = 7,253) a. Very wrong 91.9% (± 1.6%) 91.9% (± 0.8%) b. Wrong 5.3 (± 1.5) 5.5 (± 0.6) c. A little bit wrong 1.8 (± 1.0) 1.5 (± 0.3) d. Not wrong at all 1.0 (± 0.6) 1.2 (± 0.3)
232. Use LSD, cocaine, amphetamines, or another illegal drug? Local
(n = 1,498) State
(n = 7,250) a. Very wrong 94.7% (± 1.5%) 94.3% (± 0.6%) b. Wrong 3.5 (± 1.2) 3.9 (± 0.5) c. A little bit wrong 0.8 (± 0.5) 0.9 (± 0.3) d. Not wrong at all 1.0 (± 0.6) 0.9 (± 0.2)
Healthy Youth Survey 2002 Survey Results 22 RMC Research Corporation Portland, OR See page 1 for a key to the notes (A, B, C, °, †)
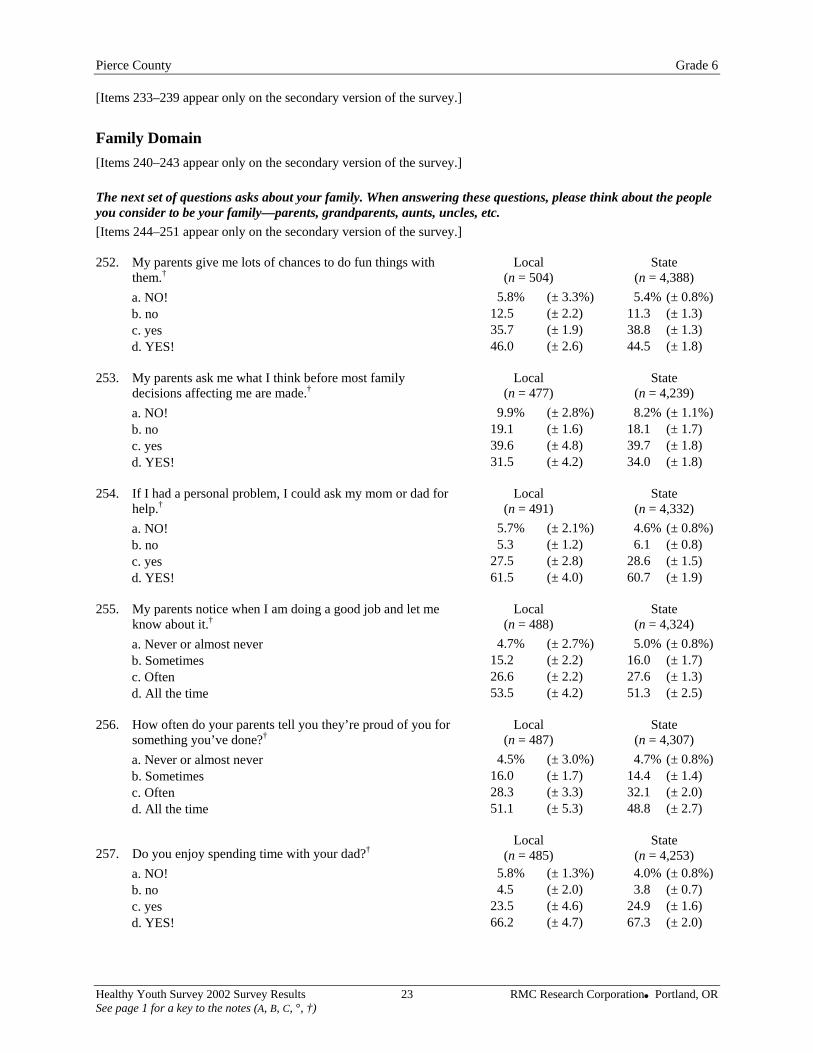
Pierce County Grade 6 [Items 233–239 appear only on the secondary version of the survey.]
Family Domain [Items 240–243 appear only on the secondary version of the survey.] The next set of questions asks about your family. When answering these questions, please think about the people you consider to be your family—parents, grandparents, aunts, uncles, etc. [Items 244–251 appear only on the secondary version of the survey.] 252. My parents give me lots of chances to do fun things with
them.†Local
(n = 504) State
(n = 4,388) a. NO! 5.8% (± 3.3%) 5.4% (± 0.8%) b. no 12.5 (± 2.2) 11.3 (± 1.3) c. yes 35.7 (± 1.9) 38.8 (± 1.3) d. YES! 46.0 (± 2.6) 44.5 (± 1.8)
253. My parents ask me what I think before most family
decisions affecting me are made.†Local
(n = 477) State
(n = 4,239) a. NO! 9.9% (± 2.8%) 8.2% (± 1.1%) b. no 19.1 (± 1.6) 18.1 (± 1.7) c. yes 39.6 (± 4.8) 39.7 (± 1.8) d. YES! 31.5 (± 4.2) 34.0 (± 1.8)
254. If I had a personal problem, I could ask my mom or dad for
help.†Local
(n = 491) State
(n = 4,332) a. NO! 5.7% (± 2.1%) 4.6% (± 0.8%) b. no 5.3 (± 1.2) 6.1 (± 0.8) c. yes 27.5 (± 2.8) 28.6 (± 1.5) d. YES! 61.5 (± 4.0) 60.7 (± 1.9)
255. My parents notice when I am doing a good job and let me
know about it.†Local
(n = 488) State
(n = 4,324) a. Never or almost never 4.7% (± 2.7%) 5.0% (± 0.8%) b. Sometimes 15.2 (± 2.2) 16.0 (± 1.7) c. Often 26.6 (± 2.2) 27.6 (± 1.3) d. All the time 53.5 (± 4.2) 51.3 (± 2.5)
256. How often do your parents tell you they’re proud of you for
something you’ve done?†Local
(n = 487) State
(n = 4,307) a. Never or almost never 4.5% (± 3.0%) 4.7% (± 0.8%) b. Sometimes 16.0 (± 1.7) 14.4 (± 1.4) c. Often 28.3 (± 3.3) 32.1 (± 2.0) d. All the time 51.1 (± 5.3) 48.8 (± 2.7)
257. Do you enjoy spending time with your dad?†Local
(n = 485) State
(n = 4,253) a. NO! 5.8% (± 1.3%) 4.0% (± 0.8%) b. no 4.5 (± 2.0) 3.8 (± 0.7) c. yes 23.5 (± 4.6) 24.9 (± 1.6) d. YES! 66.2 (± 4.7) 67.3 (± 2.0)
Healthy Youth Survey 2002 Survey Results 23 RMC Research Corporation Portland, OR See page 1 for a key to the notes (A, B, C, °, †)
Pierce County Grade 6
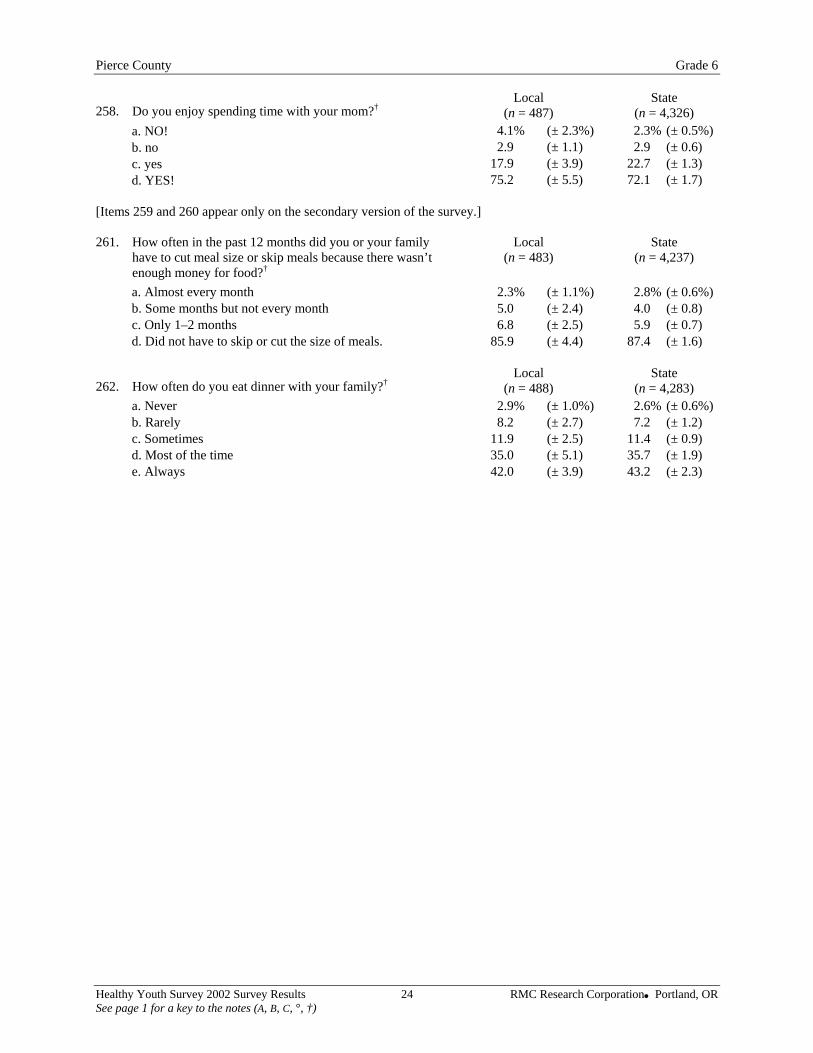
258. Do you enjoy spending time with your mom?†Local
(n = 487) State
(n = 4,326) a. NO! 4.1% (± 2.3%) 2.3% (± 0.5%) b. no 2.9 (± 1.1) 2.9 (± 0.6) c. yes 17.9 (± 3.9) 22.7 (± 1.3) d. YES! 75.2 (± 5.5) 72.1 (± 1.7)
[Items 259 and 260 appear only on the secondary version of the survey.] 261. How often in the past 12 months did you or your family
have to cut meal size or skip meals because there wasn’t enough money for food?†
Local (n = 483)
State (n = 4,237)
a. Almost every month 2.3% (± 1.1%) 2.8% (± 0.6%) b. Some months but not every month 5.0 (± 2.4) 4.0 (± 0.8) c. Only 1–2 months 6.8 (± 2.5) 5.9 (± 0.7) d. Did not have to skip or cut the size of meals. 85.9 (± 4.4) 87.4 (± 1.6)
262. How often do you eat dinner with your family?†Local
(n = 488) State
(n = 4,283) a. Never 2.9% (± 1.0%) 2.6% (± 0.6%) b. Rarely 8.2 (± 2.7) 7.2 (± 1.2) c. Sometimes 11.9 (± 2.5) 11.4 (± 0.9) d. Most of the time 35.0 (± 5.1) 35.7 (± 1.9) e. Always 42.0 (± 3.9) 43.2 (± 2.3)
Healthy Youth Survey 2002 Survey Results 24 RMC Research Corporation Portland, OR See page 1 for a key to the notes (A, B, C, °, †)