Embed Size (px)
Citation preview
Healthy Youth Survey 2004 Report of Participating Schools
Pierce County
Grade 8
RMC Research Corporation 522 SW Fifth Avenue, Suite 1407
Portland, OR 97204
March 2005
Contents
Introduction and Overview.......................................................................................................................................... 1 Key to the Notes..................................................................................................................................................... 1 Highlights of the Local Results .............................................................................................................................. 2 Selected Results by Gender.................................................................................................................................... 3
General Information (Items 1–11) ............................................................................................................................... 4 Alcohol, Tobacco, and Other Drug (ATOD) Use........................................................................................................ 5
Lifetime Use (Items 12–22) ................................................................................................................................... 5 30-Day Use (Items 23–36) ..................................................................................................................................... 6 Other Tobacco-Related Questions (Items 37–59) .................................................................................................. 9 Other Alcohol- and Drug-Related Questions (Items 60–63)................................................................................ 12
Other Health Concerns .............................................................................................................................................. 13
Nutrition and Fitness (Items 64–84)..................................................................................................................... 13 Health Conditions and Health Care (Items 85–102) ............................................................................................ 16 Safety (Items 103–113) ........................................................................................................................................ 19 Behaviors Related to Intentional Injuries (Items 114–124).................................................................................. 21 Depression (Items 125–134) ................................................................................................................................ 22
School Climate (Items 135–141) ............................................................................................................................... 23 Quality of Life (Items 142–149)................................................................................................................................ 24 Risk and Protective Factors ....................................................................................................................................... 26
Risk and Protective Factor Framework and Reporting Schedule ......................................................................... 27 Risk and Protective Factor Scale Results ............................................................................................................. 28 Graph of Scale Results ......................................................................................................................................... 30
Risk and Protective Factors: Individual Item Results................................................................................................ 31
Community Domain (Items 150–173).................................................................................................................. 31 Family Domain (Items 174–196) ......................................................................................................................... 34 School Domain (Items 197–212) ......................................................................................................................... 36 Peer and Individual Domain (Items 213–272) ..................................................................................................... 38
List of Core Items ...................................................................................................................................................... 49 Item Index.................................................................................................................................................................. 49
Healthy Youth Survey 2004 Survey Results
Pierce County, Grade 8
Number of students surveyed: 3220 Number of valid responses: 3075
Introduction and Overview The impact of adolescent health risk behaviors remains a primary concern of citizens throughout the country. Many health problems experienced by adolescents are caused by a very few preventable behaviors. Patterns of alcohol, tobacco, and other drug (ATOD) use and related risk behaviors are often formed during adolescence. These patterns play an important role in health throughout adulthood. This report presents results from the fall 2004 Healthy Youth Survey in Washington State. This survey was sponsored by the Office of Superintendent of Public Instruction; the Department of Health; the Department of Social and Health Services; the Department of Community, Trade and Economic Development; and the Family Policy Council, in cooperation with schools throughout the state of Washington. For each item, local results appear in the first two columns and statewide results appear in the second two columns. The number of valid responses (“n”) appears in parentheses for each item. Survey items covering the same topics are grouped together (the item numbering is specific to this report and does not necessarily reflect the item order on the actual survey). The bulleted points and graphs included at the beginning of this report highlight selected findings. Additional information may be found in the Interpretive Guide that accompanied this report.
Key to the Notes The survey was administered in 3 versions. Forms A and B were administered to students in Grades 8, 10, and 12. These two forms contained a core set of common items (see “List of Core Items” on the last page of this report) and additional items unique to each form. Form C was administered to students in Grade 6. This form consisted primarily of items drawn from Forms A and B but also included some unique items. Several items on each form were optional at the discretion of the school; schools that did not administer the optional items tore off the last page of the survey booklet. The following notes are used throughout this report to document the differences between the items on different versions and indicate the optional items:
A = wording on Form A B = wording on Form B C = wording on Form C † = optional item
Healthy Youth Survey 2004 Survey Results 1 RMC Research Corporation Portland, OR See page 1 for a key to the notes (A, B, C, †)
Pierce County Grade 8
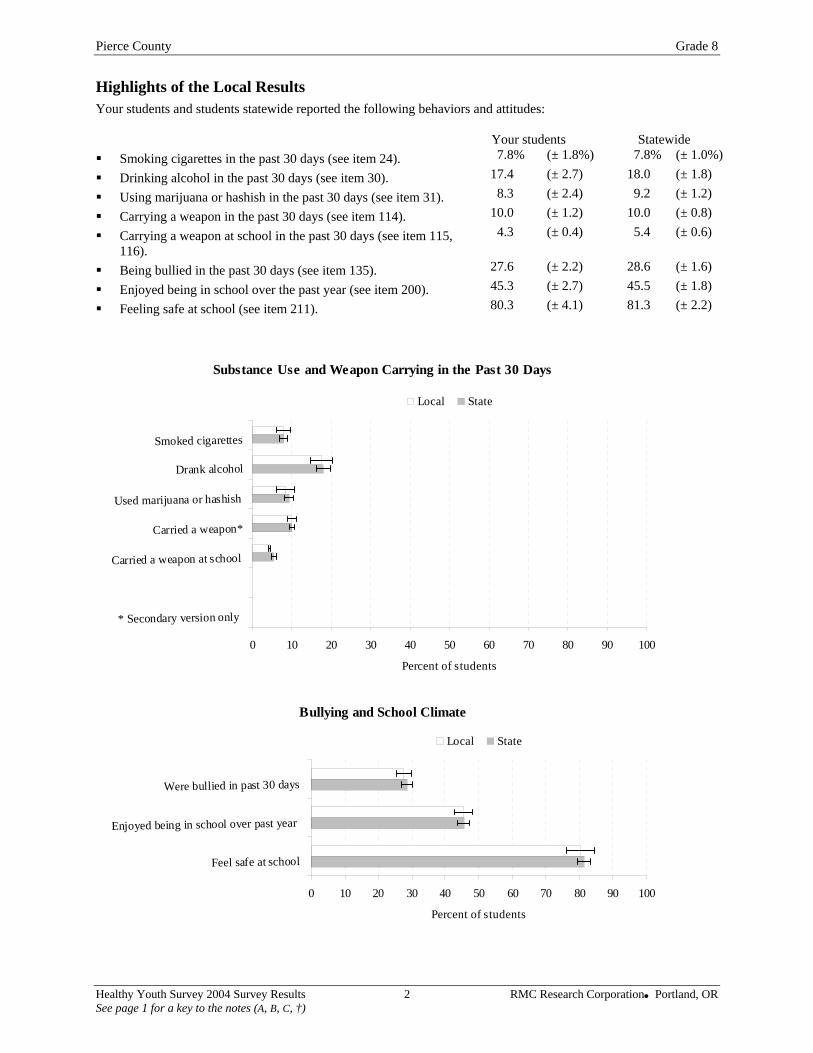
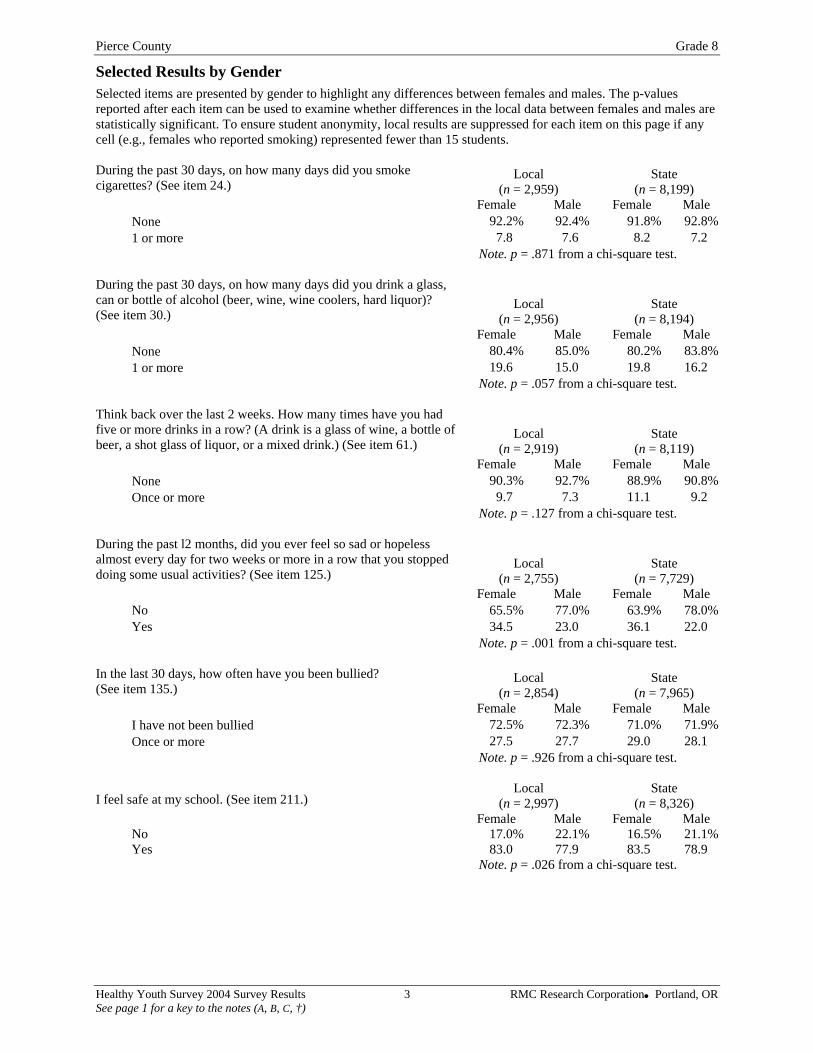
Highlights of the Local Results Your students and students statewide reported the following behaviors and attitudes:
Your students Statewide Smoking cigarettes in the past 30 days (see item 24). 7.8% (± 1.8%) 7.8% (± 1.0%)
Drinking alcohol in the past 30 days (see item 30). 17.4 (± 2.7) 18.0 (± 1.8)
Using marijuana or hashish in the past 30 days (see item 31). 8.3 (± 2.4) 9.2 (± 1.2)
Carrying a weapon in the past 30 days (see item 114). 10.0 (± 1.2) 10.0 (± 0.8)
Carrying a weapon at school in the past 30 days (see item 115, 116).
4.3 (± 0.4) 5.4 (± 0.6)
Being bullied in the past 30 days (see item 135). 27.6 (± 2.2) 28.6 (± 1.6)
Enjoyed being in school over the past year (see item 200). 45.3 (± 2.7) 45.5 (± 1.8)
Feeling safe at school (see item 211). 80.3 (± 4.1) 81.3 (± 2.2)
Substance Use and Weapon Carrying in the Past 30 Days
0 10 20 30 40 50 60 70 80 90 100
Smoked cigarettes
Drank alcohol
Used marijuana or hashish
Carried a weapon*
Carried a weapon at school
* Secondary version only
Percent of students
Local State
Bullying and School Climate
0 10 20 30 40 50 60 70 80 90 100
Were bullied in past 30 days
Enjoyed being in school over past year
Feel safe at school
Percent of students
Local State
Healthy Youth Survey 2004 Survey Results 2 RMC Research Corporation Portland, OR See page 1 for a key to the notes (A, B, C, †)
Pierce County Grade 8
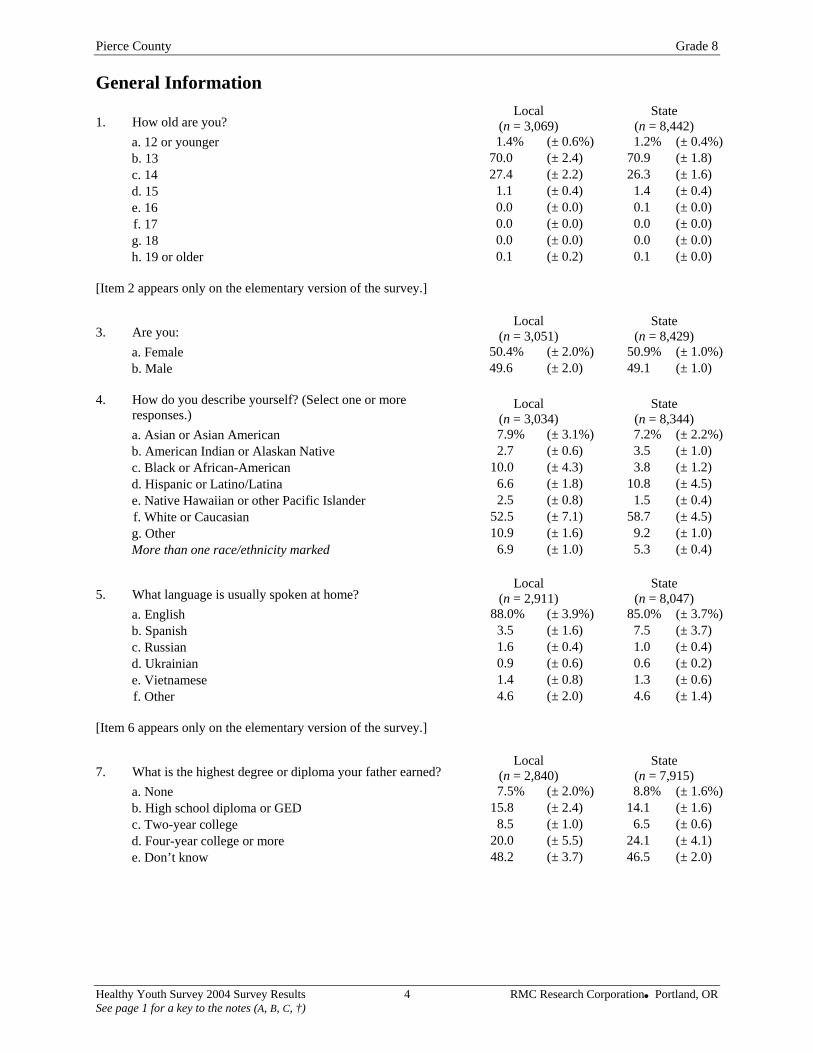
Selected Results by Gender Selected items are presented by gender to highlight any differences between females and males. The p-values reported after each item can be used to examine whether differences in the local data between females and males are statistically significant. To ensure student anonymity, local results are suppressed for each item on this page if any cell (e.g., females who reported smoking) represented fewer than 15 students. During the past 30 days, on how many days did you smoke cigarettes? (See item 24.)
Local (n = 2,959)
State (n = 8,199)
Female Male Female Male None 92.2% 92.4% 91.8% 92.8% 1 or more 7.8 7.6 8.2 7.2
Note. p = .871 from a chi-square test. During the past 30 days, on how many days did you drink a glass, can or bottle of alcohol (beer, wine, wine coolers, hard liquor)? (See item 30.)
Local (n = 2,956)
State (n = 8,194)
Female Male Female Male None 80.4% 85.0% 80.2% 83.8% 1 or more 19.6 15.0 19.8 16.2
Note. p = .057 from a chi-square test. Think back over the last 2 weeks. How many times have you had five or more drinks in a row? (A drink is a glass of wine, a bottle of beer, a shot glass of liquor, or a mixed drink.) (See item 61.)
Local (n = 2,919)
State (n = 8,119)
Female Male Female Male None 90.3% 92.7% 88.9% 90.8% Once or more 9.7 7.3 11.1 9.2
Note. p = .127 from a chi-square test. During the past l2 months, did you ever feel so sad or hopeless almost every day for two weeks or more in a row that you stopped doing some usual activities? (See item 125.)
Local (n = 2,755)
State (n = 7,729)
Female Male Female Male No 65.5% 77.0% 63.9% 78.0% Yes 34.5 23.0 36.1 22.0
Note. p = .001 from a chi-square test. In the last 30 days, how often have you been bullied? (See item 135.)
Local (n = 2,854)
State (n = 7,965)
Female Male Female Male I have not been bullied 72.5% 72.3% 71.0% 71.9% Once or more 27.5 27.7 29.0 28.1
Note. p = .926 from a chi-square test.
I feel safe at my school. (See item 211.) Local
(n = 2,997) State
(n = 8,326) Female Male Female Male No 17.0% 22.1% 16.5% 21.1% Yes 83.0 77.9 83.5 78.9
Note. p = .026 from a chi-square test.
Healthy Youth Survey 2004 Survey Results 3 RMC Research Corporation Portland, OR See page 1 for a key to the notes (A, B, C, †)
Pierce County Grade 8
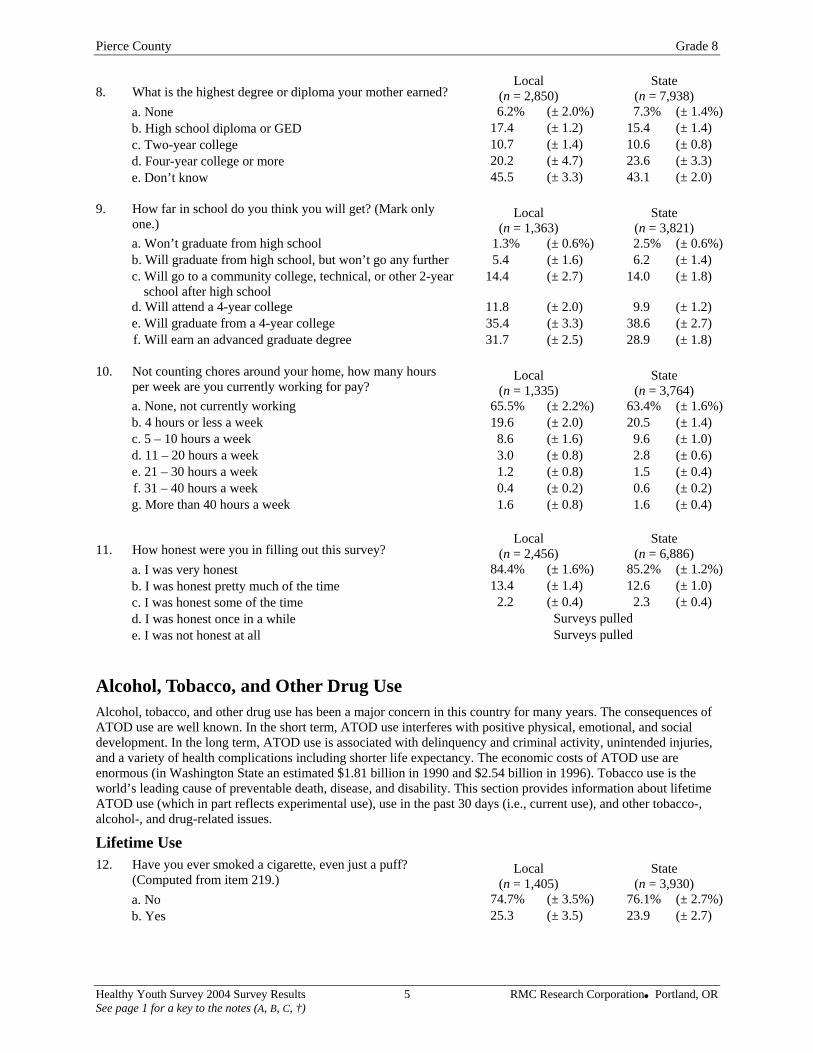
General Information
1. How old are you? Local
(n = 3,069) State
(n = 8,442) a. 12 or younger 1.4% (± 0.6%) 1.2% (± 0.4%)b. 13 70.0 (± 2.4) 70.9 (± 1.8) c. 14 27.4 (± 2.2) 26.3 (± 1.6) d. 15 1.1 (± 0.4) 1.4 (± 0.4) e. 16 0.0 (± 0.0) 0.1 (± 0.0) f. 17 0.0 (± 0.0) 0.0 (± 0.0) g. 18 0.0 (± 0.0) 0.0 (± 0.0) h. 19 or older 0.1 (± 0.2) 0.1 (± 0.0)
[Item 2 appears only on the elementary version of the survey.]
3. Are you: Local
(n = 3,051) State
(n = 8,429) a. Female 50.4% (± 2.0%) 50.9% (± 1.0%)b. Male 49.6 (± 2.0) 49.1 (± 1.0)
4. How do you describe yourself? (Select one or more
responses.) Local
(n = 3,034) State
(n = 8,344) a. Asian or Asian American 7.9% (± 3.1%) 7.2% (± 2.2%)b. American Indian or Alaskan Native 2.7 (± 0.6) 3.5 (± 1.0) c. Black or African-American 10.0 (± 4.3) 3.8 (± 1.2) d. Hispanic or Latino/Latina 6.6 (± 1.8) 10.8 (± 4.5) e. Native Hawaiian or other Pacific Islander 2.5 (± 0.8) 1.5 (± 0.4) f. White or Caucasian 52.5 (± 7.1) 58.7 (± 4.5) g. Other 10.9 (± 1.6) 9.2 (± 1.0) More than one race/ethnicity marked 6.9 (± 1.0) 5.3 (± 0.4)
5. What language is usually spoken at home? Local
(n = 2,911) State
(n = 8,047) a. English 88.0% (± 3.9%) 85.0% (± 3.7%)b. Spanish 3.5 (± 1.6) 7.5 (± 3.7) c. Russian 1.6 (± 0.4) 1.0 (± 0.4) d. Ukrainian 0.9 (± 0.6) 0.6 (± 0.2) e. Vietnamese 1.4 (± 0.8) 1.3 (± 0.6) f. Other 4.6 (± 2.0) 4.6 (± 1.4)
[Item 6 appears only on the elementary version of the survey.]
7. What is the highest degree or diploma your father earned? Local
(n = 2,840) State
(n = 7,915) a. None 7.5% (± 2.0%) 8.8% (± 1.6%)b. High school diploma or GED 15.8 (± 2.4) 14.1 (± 1.6) c. Two-year college 8.5 (± 1.0) 6.5 (± 0.6) d. Four-year college or more 20.0 (± 5.5) 24.1 (± 4.1) e. Don’t know 48.2 (± 3.7) 46.5 (± 2.0)
Healthy Youth Survey 2004 Survey Results 4 RMC Research Corporation Portland, OR See page 1 for a key to the notes (A, B, C, †)
Pierce County Grade 8
8. What is the highest degree or diploma your mother earned? Local
(n = 2,850) State
(n = 7,938) a. None 6.2% (± 2.0%) 7.3% (± 1.4%)b. High school diploma or GED 17.4 (± 1.2) 15.4 (± 1.4) c. Two-year college 10.7 (± 1.4) 10.6 (± 0.8) d. Four-year college or more 20.2 (± 4.7) 23.6 (± 3.3) e. Don’t know 45.5 (± 3.3) 43.1 (± 2.0)
9. How far in school do you think you will get? (Mark only
one.) Local
(n = 1,363) State
(n = 3,821) a. Won’t graduate from high school 1.3% (± 0.6%) 2.5% (± 0.6%)b. Will graduate from high school, but won’t go any further 5.4 (± 1.6) 6.2 (± 1.4) c. Will go to a community college, technical, or other 2-year
school after high school 14.4 (± 2.7) 14.0 (± 1.8)
d. Will attend a 4-year college 11.8 (± 2.0) 9.9 (± 1.2) e. Will graduate from a 4-year college 35.4 (± 3.3) 38.6 (± 2.7) f. Will earn an advanced graduate degree 31.7 (± 2.5) 28.9 (± 1.8)
10. Not counting chores around your home, how many hours
per week are you currently working for pay? Local
(n = 1,335) State
(n = 3,764) a. None, not currently working 65.5% (± 2.2%) 63.4% (± 1.6%)b. 4 hours or less a week 19.6 (± 2.0) 20.5 (± 1.4) c. 5 – 10 hours a week 8.6 (± 1.6) 9.6 (± 1.0) d. 11 – 20 hours a week 3.0 (± 0.8) 2.8 (± 0.6) e. 21 – 30 hours a week 1.2 (± 0.8) 1.5 (± 0.4) f. 31 – 40 hours a week 0.4 (± 0.2) 0.6 (± 0.2) g. More than 40 hours a week 1.6 (± 0.8) 1.6 (± 0.4)
11. How honest were you in filling out this survey? Local
(n = 2,456) State
(n = 6,886) a. I was very honest 84.4% (± 1.6%) 85.2% (± 1.2%)b. I was honest pretty much of the time 13.4 (± 1.4) 12.6 (± 1.0) c. I was honest some of the time 2.2 (± 0.4) 2.3 (± 0.4) d. I was honest once in a while Surveys pulled e. I was not honest at all Surveys pulled
Alcohol, Tobacco, and Other Drug Use Alcohol, tobacco, and other drug use has been a major concern in this country for many years. The consequences of ATOD use are well known. In the short term, ATOD use interferes with positive physical, emotional, and social development. In the long term, ATOD use is associated with delinquency and criminal activity, unintended injuries, and a variety of health complications including shorter life expectancy. The economic costs of ATOD use are enormous (in Washington State an estimated $1.81 billion in 1990 and $2.54 billion in 1996). Tobacco use is the world’s leading cause of preventable death, disease, and disability. This section provides information about lifetime ATOD use (which in part reflects experimental use), use in the past 30 days (i.e., current use), and other tobacco-, alcohol-, and drug-related issues.
Lifetime Use 12. Have you ever smoked a cigarette, even just a puff?
(Computed from item 219.) Local
(n = 1,405) State
(n = 3,930) a. No 74.7% (± 3.5%) 76.1% (± 2.7%)b. Yes 25.3 (± 3.5) 23.9 (± 2.7)
Healthy Youth Survey 2004 Survey Results 5 RMC Research Corporation Portland, OR See page 1 for a key to the notes (A, B, C, †)
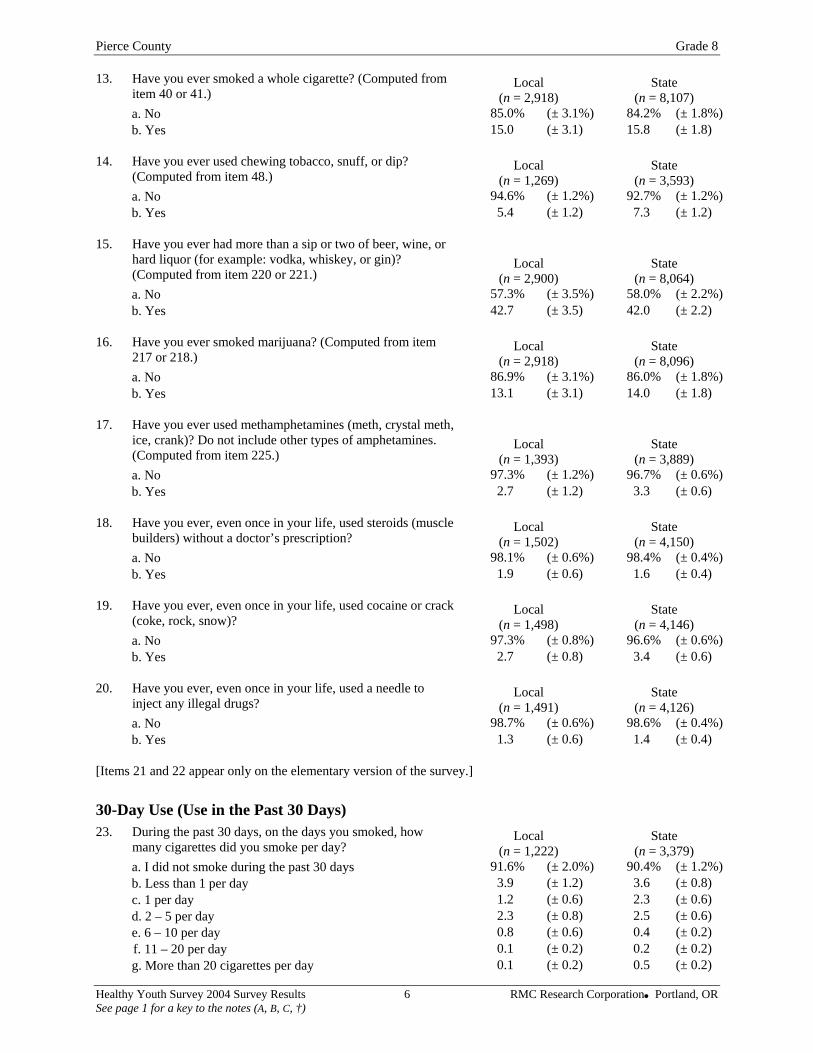
Pierce County Grade 8 13. Have you ever smoked a whole cigarette? (Computed from
item 40 or 41.) Local
(n = 2,918) State
(n = 8,107) a. No 85.0% (± 3.1%) 84.2% (± 1.8%)b. Yes 15.0 (± 3.1) 15.8 (± 1.8)
14. Have you ever used chewing tobacco, snuff, or dip?
(Computed from item 48.) Local
(n = 1,269) State
(n = 3,593) a. No 94.6% (± 1.2%) 92.7% (± 1.2%)b. Yes 5.4 (± 1.2) 7.3 (± 1.2)
15. Have you ever had more than a sip or two of beer, wine, or
hard liquor (for example: vodka, whiskey, or gin)? (Computed from item 220 or 221.)
Local (n = 2,900)
State (n = 8,064)
a. No 57.3% (± 3.5%) 58.0% (± 2.2%)b. Yes 42.7 (± 3.5) 42.0 (± 2.2)
16. Have you ever smoked marijuana? (Computed from item
217 or 218.) Local
(n = 2,918) State
(n = 8,096) a. No 86.9% (± 3.1%) 86.0% (± 1.8%)b. Yes 13.1 (± 3.1) 14.0 (± 1.8)
17. Have you ever used methamphetamines (meth, crystal meth,
ice, crank)? Do not include other types of amphetamines. (Computed from item 225.)
Local (n = 1,393)
State (n = 3,889)
a. No 97.3% (± 1.2%) 96.7% (± 0.6%)b. Yes 2.7 (± 1.2) 3.3 (± 0.6)
18. Have you ever, even once in your life, used steroids (muscle
builders) without a doctor’s prescription? Local
(n = 1,502) State
(n = 4,150) a. No 98.1% (± 0.6%) 98.4% (± 0.4%)b. Yes 1.9 (± 0.6) 1.6 (± 0.4)
19. Have you ever, even once in your life, used cocaine or crack
(coke, rock, snow)? Local
(n = 1,498) State
(n = 4,146) a. No 97.3% (± 0.8%) 96.6% (± 0.6%)b. Yes 2.7 (± 0.8) 3.4 (± 0.6)
20. Have you ever, even once in your life, used a needle to
inject any illegal drugs? Local
(n = 1,491) State
(n = 4,126) a. No 98.7% (± 0.6%) 98.6% (± 0.4%)b. Yes 1.3 (± 0.6) 1.4 (± 0.4)
[Items 21 and 22 appear only on the elementary version of the survey.]
30-Day Use (Use in the Past 30 Days) 23. During the past 30 days, on the days you smoked, how
many cigarettes did you smoke per day? Local
(n = 1,222) State
(n = 3,379) a. I did not smoke during the past 30 days 91.6% (± 2.0%) 90.4% (± 1.2%)b. Less than 1 per day 3.9 (± 1.2) 3.6 (± 0.8) c. 1 per day 1.2 (± 0.6) 2.3 (± 0.6) d. 2 – 5 per day 2.3 (± 0.8) 2.5 (± 0.6) e. 6 – 10 per day 0.8 (± 0.6) 0.4 (± 0.2) f. 11 – 20 per day 0.1 (± 0.2) 0.2 (± 0.2) g. More than 20 cigarettes per day 0.1 (± 0.2) 0.5 (± 0.2)
Healthy Youth Survey 2004 Survey Results 6 RMC Research Corporation Portland, OR See page 1 for a key to the notes (A, B, C, †)
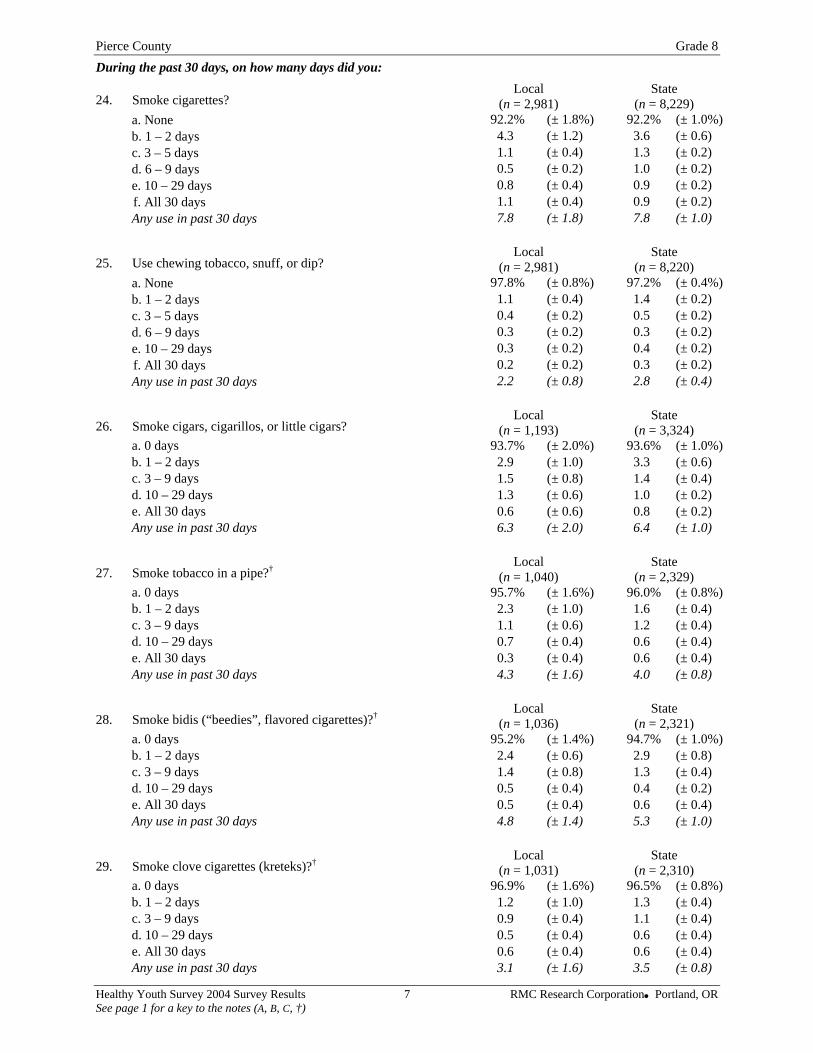
Pierce County Grade 8 During the past 30 days, on how many days did you:
24. Smoke cigarettes? Local
(n = 2,981) State
(n = 8,229) a. None 92.2% (± 1.8%) 92.2% (± 1.0%)b. 1 – 2 days 4.3 (± 1.2) 3.6 (± 0.6) c. 3 – 5 days 1.1 (± 0.4) 1.3 (± 0.2) d. 6 – 9 days 0.5 (± 0.2) 1.0 (± 0.2) e. 10 – 29 days 0.8 (± 0.4) 0.9 (± 0.2) f. All 30 days 1.1 (± 0.4) 0.9 (± 0.2) Any use in past 30 days 7.8 (± 1.8) 7.8 (± 1.0)
25. Use chewing tobacco, snuff, or dip? Local
(n = 2,981) State
(n = 8,220) a. None 97.8% (± 0.8%) 97.2% (± 0.4%)b. 1 – 2 days 1.1 (± 0.4) 1.4 (± 0.2) c. 3 – 5 days 0.4 (± 0.2) 0.5 (± 0.2) d. 6 – 9 days 0.3 (± 0.2) 0.3 (± 0.2) e. 10 – 29 days 0.3 (± 0.2) 0.4 (± 0.2) f. All 30 days 0.2 (± 0.2) 0.3 (± 0.2) Any use in past 30 days 2.2 (± 0.8) 2.8 (± 0.4)
26. Smoke cigars, cigarillos, or little cigars? Local
(n = 1,193) State
(n = 3,324) a. 0 days 93.7% (± 2.0%) 93.6% (± 1.0%)b. 1 – 2 days 2.9 (± 1.0) 3.3 (± 0.6) c. 3 – 9 days 1.5 (± 0.8) 1.4 (± 0.4) d. 10 – 29 days 1.3 (± 0.6) 1.0 (± 0.2) e. All 30 days 0.6 (± 0.6) 0.8 (± 0.2) Any use in past 30 days 6.3 (± 2.0) 6.4 (± 1.0)
27. Smoke tobacco in a pipe?† Local (n = 1,040)
State (n = 2,329)
a. 0 days 95.7% (± 1.6%) 96.0% (± 0.8%)b. 1 – 2 days 2.3 (± 1.0) 1.6 (± 0.4) c. 3 – 9 days 1.1 (± 0.6) 1.2 (± 0.4) d. 10 – 29 days 0.7 (± 0.4) 0.6 (± 0.4) e. All 30 days 0.3 (± 0.4) 0.6 (± 0.4) Any use in past 30 days 4.3 (± 1.6) 4.0 (± 0.8)
28. Smoke bidis (“beedies”, flavored cigarettes)?† Local (n = 1,036)
State (n = 2,321)
a. 0 days 95.2% (± 1.4%) 94.7% (± 1.0%)b. 1 – 2 days 2.4 (± 0.6) 2.9 (± 0.8) c. 3 – 9 days 1.4 (± 0.8) 1.3 (± 0.4) d. 10 – 29 days 0.5 (± 0.4) 0.4 (± 0.2) e. All 30 days 0.5 (± 0.4) 0.6 (± 0.4) Any use in past 30 days 4.8 (± 1.4) 5.3 (± 1.0)
29. Smoke clove cigarettes (kreteks)?† Local (n = 1,031)
State (n = 2,310)
a. 0 days 96.9% (± 1.6%) 96.5% (± 0.8%)b. 1 – 2 days 1.2 (± 1.0) 1.3 (± 0.4) c. 3 – 9 days 0.9 (± 0.4) 1.1 (± 0.4) d. 10 – 29 days 0.5 (± 0.4) 0.6 (± 0.4) e. All 30 days 0.6 (± 0.4) 0.6 (± 0.4) Any use in past 30 days 3.1 (± 1.6) 3.5 (± 0.8)
Healthy Youth Survey 2004 Survey Results 7 RMC Research Corporation Portland, OR See page 1 for a key to the notes (A, B, C, †)
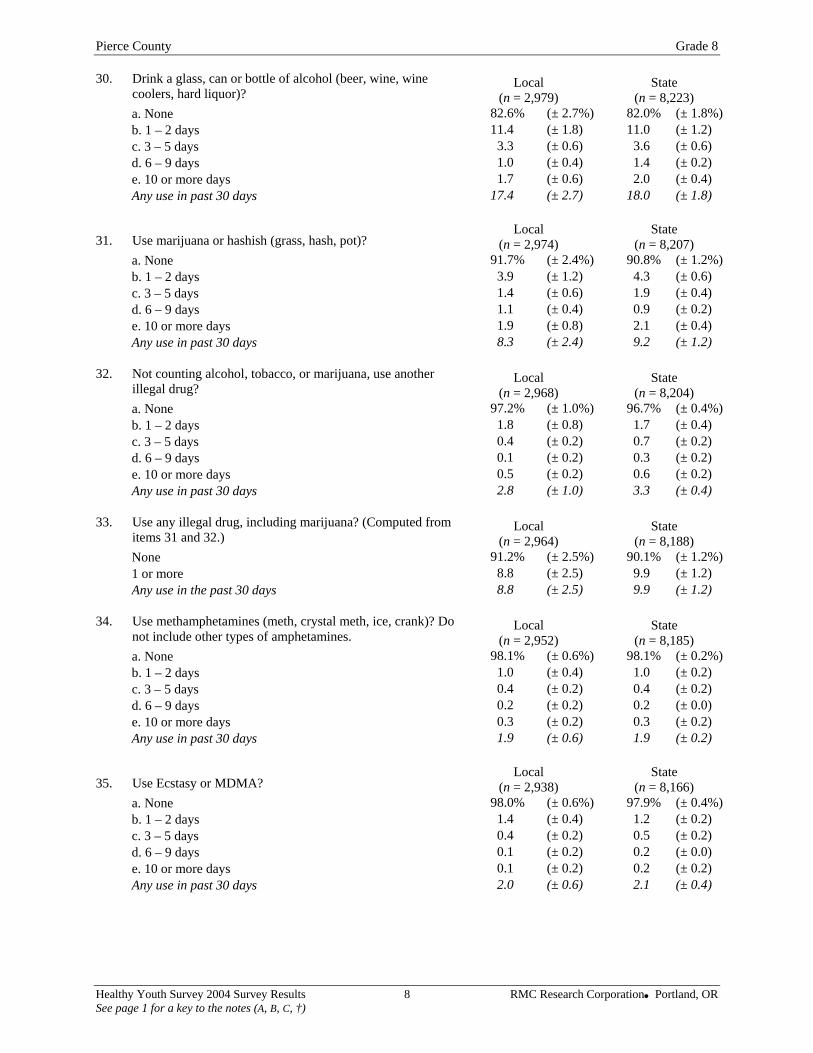
Pierce County Grade 8 30. Drink a glass, can or bottle of alcohol (beer, wine, wine
coolers, hard liquor)? Local
(n = 2,979) State
(n = 8,223) a. None 82.6% (± 2.7%) 82.0% (± 1.8%)b. 1 – 2 days 11.4 (± 1.8) 11.0 (± 1.2) c. 3 – 5 days 3.3 (± 0.6) 3.6 (± 0.6) d. 6 – 9 days 1.0 (± 0.4) 1.4 (± 0.2) e. 10 or more days 1.7 (± 0.6) 2.0 (± 0.4) Any use in past 30 days 17.4 (± 2.7) 18.0 (± 1.8)
31. Use marijuana or hashish (grass, hash, pot)? Local
(n = 2,974) State
(n = 8,207) a. None 91.7% (± 2.4%) 90.8% (± 1.2%)b. 1 – 2 days 3.9 (± 1.2) 4.3 (± 0.6) c. 3 – 5 days 1.4 (± 0.6) 1.9 (± 0.4) d. 6 – 9 days 1.1 (± 0.4) 0.9 (± 0.2) e. 10 or more days 1.9 (± 0.8) 2.1 (± 0.4) Any use in past 30 days 8.3 (± 2.4) 9.2 (± 1.2)
32. Not counting alcohol, tobacco, or marijuana, use another
illegal drug? Local
(n = 2,968) State
(n = 8,204) a. None 97.2% (± 1.0%) 96.7% (± 0.4%)b. 1 – 2 days 1.8 (± 0.8) 1.7 (± 0.4) c. 3 – 5 days 0.4 (± 0.2) 0.7 (± 0.2) d. 6 – 9 days 0.1 (± 0.2) 0.3 (± 0.2) e. 10 or more days 0.5 (± 0.2) 0.6 (± 0.2) Any use in past 30 days 2.8 (± 1.0) 3.3 (± 0.4)
33. Use any illegal drug, including marijuana? (Computed from
items 31 and 32.) Local
(n = 2,964) State
(n = 8,188) None 91.2% (± 2.5%) 90.1% (± 1.2%)1 or more 8.8 (± 2.5) 9.9 (± 1.2) Any use in the past 30 days 8.8 (± 2.5) 9.9 (± 1.2)
34. Use methamphetamines (meth, crystal meth, ice, crank)? Do
not include other types of amphetamines. Local
(n = 2,952) State
(n = 8,185) a. None 98.1% (± 0.6%) 98.1% (± 0.2%)b. 1 – 2 days 1.0 (± 0.4) 1.0 (± 0.2) c. 3 – 5 days 0.4 (± 0.2) 0.4 (± 0.2) d. 6 – 9 days 0.2 (± 0.2) 0.2 (± 0.0) e. 10 or more days 0.3 (± 0.2) 0.3 (± 0.2) Any use in past 30 days 1.9 (± 0.6) 1.9 (± 0.2)
35. Use Ecstasy or MDMA? Local
(n = 2,938) State
(n = 8,166) a. None 98.0% (± 0.6%) 97.9% (± 0.4%)b. 1 – 2 days 1.4 (± 0.4) 1.2 (± 0.2) c. 3 – 5 days 0.4 (± 0.2) 0.5 (± 0.2) d. 6 – 9 days 0.1 (± 0.2) 0.2 (± 0.0) e. 10 or more days 0.1 (± 0.2) 0.2 (± 0.2) Any use in past 30 days 2.0 (± 0.6) 2.1 (± 0.4)
Healthy Youth Survey 2004 Survey Results 8 RMC Research Corporation Portland, OR See page 1 for a key to the notes (A, B, C, †)
Pierce County Grade 8
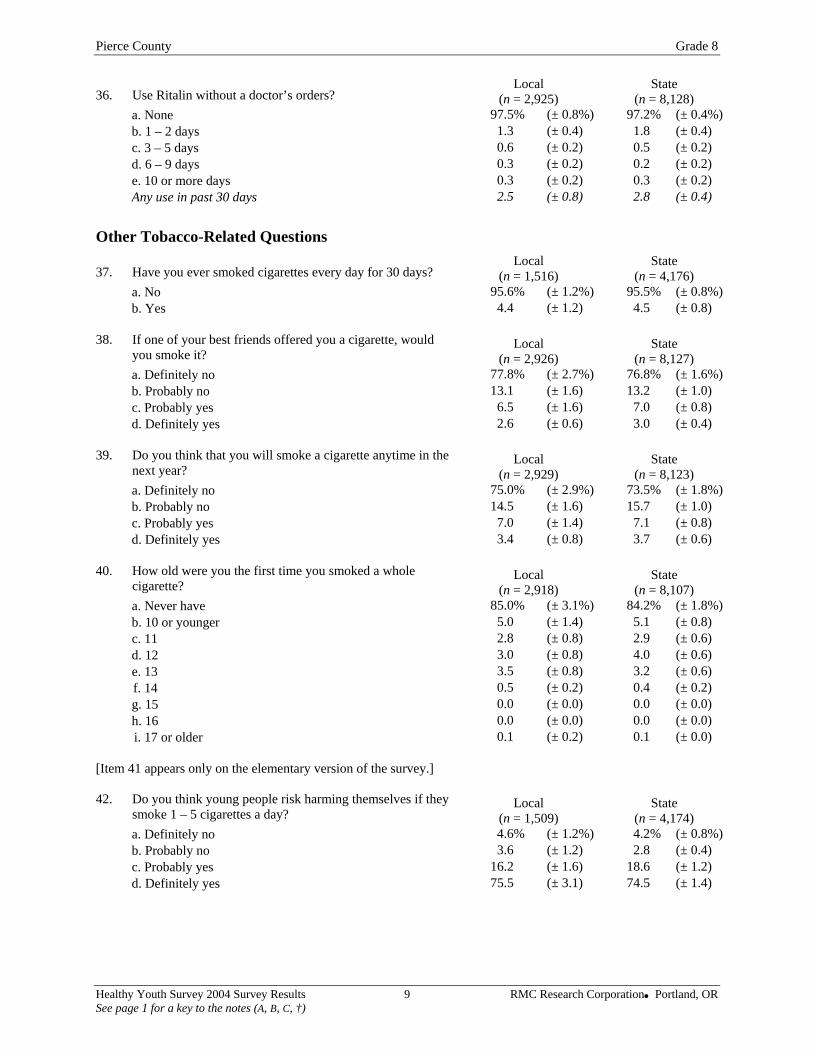
36. Use Ritalin without a doctor’s orders? Local
(n = 2,925) State
(n = 8,128) a. None 97.5% (± 0.8%) 97.2% (± 0.4%)b. 1 – 2 days 1.3 (± 0.4) 1.8 (± 0.4) c. 3 – 5 days 0.6 (± 0.2) 0.5 (± 0.2) d. 6 – 9 days 0.3 (± 0.2) 0.2 (± 0.2) e. 10 or more days 0.3 (± 0.2) 0.3 (± 0.2) Any use in past 30 days 2.5 (± 0.8) 2.8 (± 0.4)
Other Tobacco-Related Questions
37. Have you ever smoked cigarettes every day for 30 days? Local
(n = 1,516) State
(n = 4,176) a. No 95.6% (± 1.2%) 95.5% (± 0.8%)b. Yes 4.4 (± 1.2) 4.5 (± 0.8)
38. If one of your best friends offered you a cigarette, would
you smoke it? Local
(n = 2,926) State
(n = 8,127) a. Definitely no 77.8% (± 2.7%) 76.8% (± 1.6%)b. Probably no 13.1 (± 1.6) 13.2 (± 1.0) c. Probably yes 6.5 (± 1.6) 7.0 (± 0.8) d. Definitely yes 2.6 (± 0.6) 3.0 (± 0.4)
39. Do you think that you will smoke a cigarette anytime in the
next year? Local
(n = 2,929) State
(n = 8,123) a. Definitely no 75.0% (± 2.9%) 73.5% (± 1.8%)b. Probably no 14.5 (± 1.6) 15.7 (± 1.0) c. Probably yes 7.0 (± 1.4) 7.1 (± 0.8) d. Definitely yes 3.4 (± 0.8) 3.7 (± 0.6)
40. How old were you the first time you smoked a whole
cigarette? Local
(n = 2,918) State
(n = 8,107) a. Never have 85.0% (± 3.1%) 84.2% (± 1.8%)b. 10 or younger 5.0 (± 1.4) 5.1 (± 0.8) c. 11 2.8 (± 0.8) 2.9 (± 0.6) d. 12 3.0 (± 0.8) 4.0 (± 0.6) e. 13 3.5 (± 0.8) 3.2 (± 0.6) f. 14 0.5 (± 0.2) 0.4 (± 0.2) g. 15 0.0 (± 0.0) 0.0 (± 0.0) h. 16 0.0 (± 0.0) 0.0 (± 0.0) i. 17 or older 0.1 (± 0.2) 0.1 (± 0.0)
[Item 41 appears only on the elementary version of the survey.] 42. Do you think young people risk harming themselves if they
smoke 1 – 5 cigarettes a day? Local
(n = 1,509) State
(n = 4,174) a. Definitely no 4.6% (± 1.2%) 4.2% (± 0.8%)b. Probably no 3.6 (± 1.2) 2.8 (± 0.4) c. Probably yes 16.2 (± 1.6) 18.6 (± 1.2) d. Definitely yes 75.5 (± 3.1) 74.5 (± 1.4)
Healthy Youth Survey 2004 Survey Results 9 RMC Research Corporation Portland, OR See page 1 for a key to the notes (A, B, C, †)
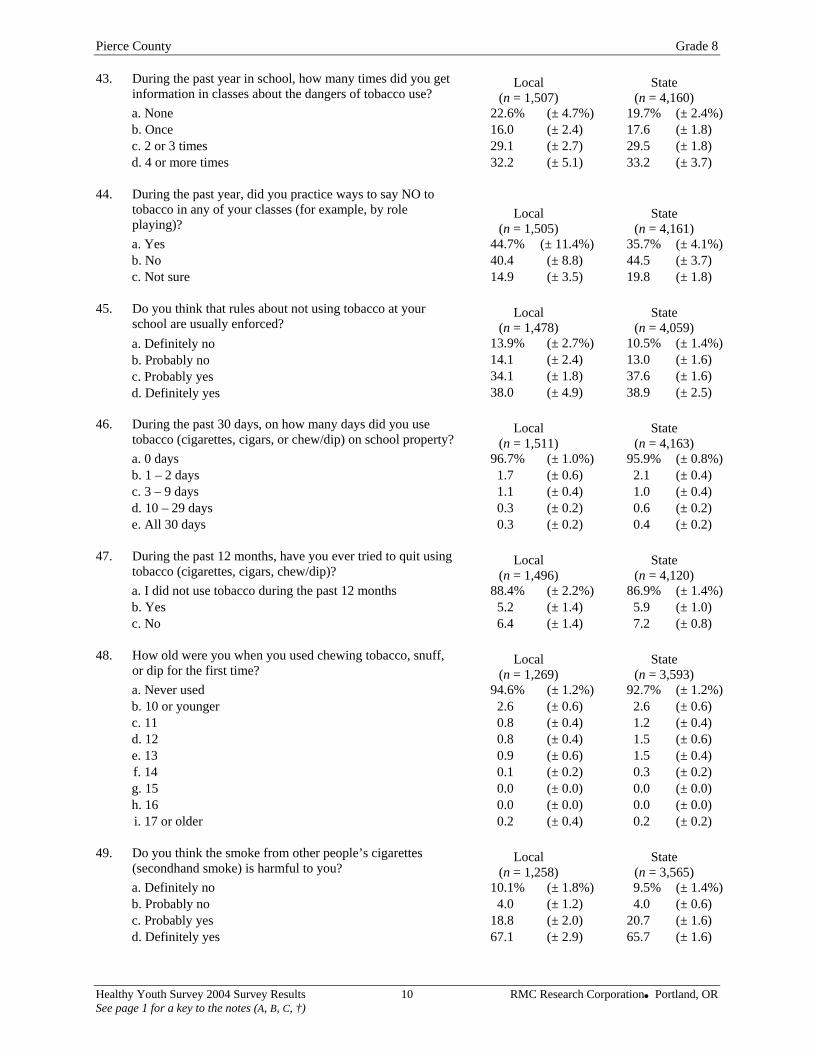
Pierce County Grade 8 43. During the past year in school, how many times did you get
information in classes about the dangers of tobacco use? Local
(n = 1,507) State
(n = 4,160) a. None 22.6% (± 4.7%) 19.7% (± 2.4%)b. Once 16.0 (± 2.4) 17.6 (± 1.8) c. 2 or 3 times 29.1 (± 2.7) 29.5 (± 1.8) d. 4 or more times 32.2 (± 5.1) 33.2 (± 3.7)
44. During the past year, did you practice ways to say NO to
tobacco in any of your classes (for example, by role playing)?
Local (n = 1,505)
State (n = 4,161)
a. Yes 44.7% (± 11.4%) 35.7% (± 4.1%)b. No 40.4 (± 8.8) 44.5 (± 3.7) c. Not sure 14.9 (± 3.5) 19.8 (± 1.8)
45. Do you think that rules about not using tobacco at your
school are usually enforced? Local
(n = 1,478) State
(n = 4,059) a. Definitely no 13.9% (± 2.7%) 10.5% (± 1.4%)b. Probably no 14.1 (± 2.4) 13.0 (± 1.6) c. Probably yes 34.1 (± 1.8) 37.6 (± 1.6) d. Definitely yes 38.0 (± 4.9) 38.9 (± 2.5)
46. During the past 30 days, on how many days did you use
tobacco (cigarettes, cigars, or chew/dip) on school property?Local
(n = 1,511) State
(n = 4,163) a. 0 days 96.7% (± 1.0%) 95.9% (± 0.8%)b. 1 – 2 days 1.7 (± 0.6) 2.1 (± 0.4) c. 3 – 9 days 1.1 (± 0.4) 1.0 (± 0.4) d. 10 – 29 days 0.3 (± 0.2) 0.6 (± 0.2) e. All 30 days 0.3 (± 0.2) 0.4 (± 0.2)
47. During the past 12 months, have you ever tried to quit using
tobacco (cigarettes, cigars, chew/dip)? Local
(n = 1,496) State
(n = 4,120) a. I did not use tobacco during the past 12 months 88.4% (± 2.2%) 86.9% (± 1.4%)b. Yes 5.2 (± 1.4) 5.9 (± 1.0) c. No 6.4 (± 1.4) 7.2 (± 0.8)
48. How old were you when you used chewing tobacco, snuff,
or dip for the first time? Local
(n = 1,269) State
(n = 3,593) a. Never used 94.6% (± 1.2%) 92.7% (± 1.2%)b. 10 or younger 2.6 (± 0.6) 2.6 (± 0.6) c. 11 0.8 (± 0.4) 1.2 (± 0.4) d. 12 0.8 (± 0.4) 1.5 (± 0.6) e. 13 0.9 (± 0.6) 1.5 (± 0.4) f. 14 0.1 (± 0.2) 0.3 (± 0.2) g. 15 0.0 (± 0.0) 0.0 (± 0.0) h. 16 0.0 (± 0.0) 0.0 (± 0.0) i. 17 or older 0.2 (± 0.4) 0.2 (± 0.2)
49. Do you think the smoke from other people’s cigarettes
(secondhand smoke) is harmful to you? Local
(n = 1,258) State
(n = 3,565) a. Definitely no 10.1% (± 1.8%) 9.5% (± 1.4%)b. Probably no 4.0 (± 1.2) 4.0 (± 0.6) c. Probably yes 18.8 (± 2.0) 20.7 (± 1.6) d. Definitely yes 67.1 (± 2.9) 65.7 (± 1.6)
Healthy Youth Survey 2004 Survey Results 10 RMC Research Corporation Portland, OR See page 1 for a key to the notes (A, B, C, †)
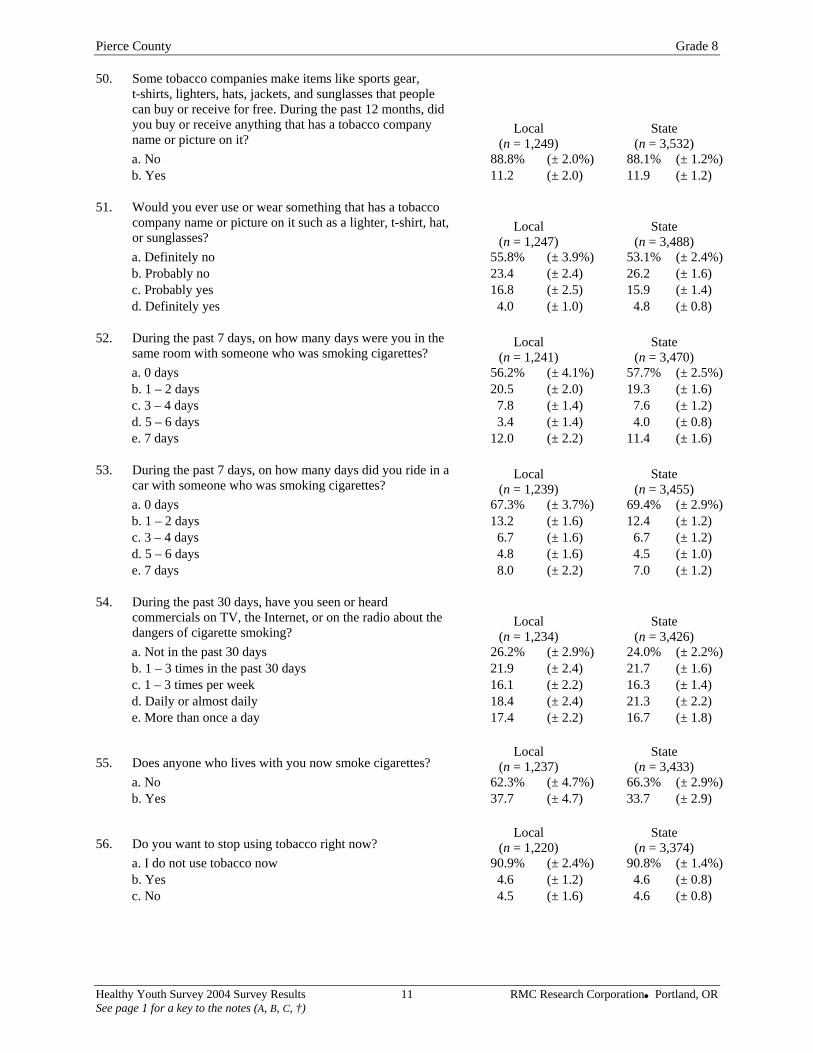
Pierce County Grade 8 50. Some tobacco companies make items like sports gear,
t-shirts, lighters, hats, jackets, and sunglasses that people can buy or receive for free. During the past 12 months, did you buy or receive anything that has a tobacco company name or picture on it?
Local (n = 1,249)
State (n = 3,532)
a. No 88.8% (± 2.0%) 88.1% (± 1.2%)b. Yes 11.2 (± 2.0) 11.9 (± 1.2)
51. Would you ever use or wear something that has a tobacco
company name or picture on it such as a lighter, t-shirt, hat, or sunglasses?
Local (n = 1,247)
State (n = 3,488)
a. Definitely no 55.8% (± 3.9%) 53.1% (± 2.4%)b. Probably no 23.4 (± 2.4) 26.2 (± 1.6) c. Probably yes 16.8 (± 2.5) 15.9 (± 1.4) d. Definitely yes 4.0 (± 1.0) 4.8 (± 0.8)
52. During the past 7 days, on how many days were you in the
same room with someone who was smoking cigarettes? Local
(n = 1,241) State
(n = 3,470) a. 0 days 56.2% (± 4.1%) 57.7% (± 2.5%)b. 1 – 2 days 20.5 (± 2.0) 19.3 (± 1.6) c. 3 – 4 days 7.8 (± 1.4) 7.6 (± 1.2) d. 5 – 6 days 3.4 (± 1.4) 4.0 (± 0.8) e. 7 days 12.0 (± 2.2) 11.4 (± 1.6)
53. During the past 7 days, on how many days did you ride in a
car with someone who was smoking cigarettes? Local
(n = 1,239) State
(n = 3,455) a. 0 days 67.3% (± 3.7%) 69.4% (± 2.9%)b. 1 – 2 days 13.2 (± 1.6) 12.4 (± 1.2) c. 3 – 4 days 6.7 (± 1.6) 6.7 (± 1.2) d. 5 – 6 days 4.8 (± 1.6) 4.5 (± 1.0) e. 7 days 8.0 (± 2.2) 7.0 (± 1.2)
54. During the past 30 days, have you seen or heard
commercials on TV, the Internet, or on the radio about the dangers of cigarette smoking?
Local (n = 1,234)
State (n = 3,426)
a. Not in the past 30 days 26.2% (± 2.9%) 24.0% (± 2.2%)b. 1 – 3 times in the past 30 days 21.9 (± 2.4) 21.7 (± 1.6) c. 1 – 3 times per week 16.1 (± 2.2) 16.3 (± 1.4) d. Daily or almost daily 18.4 (± 2.4) 21.3 (± 2.2) e. More than once a day 17.4 (± 2.2) 16.7 (± 1.8)
55. Does anyone who lives with you now smoke cigarettes? Local
(n = 1,237) State
(n = 3,433) a. No 62.3% (± 4.7%) 66.3% (± 2.9%)b. Yes 37.7 (± 4.7) 33.7 (± 2.9)
56. Do you want to stop using tobacco right now? Local
(n = 1,220) State
(n = 3,374) a. I do not use tobacco now 90.9% (± 2.4%) 90.8% (± 1.4%)b. Yes 4.6 (± 1.2) 4.6 (± 0.8) c. No 4.5 (± 1.6) 4.6 (± 0.8)
Healthy Youth Survey 2004 Survey Results 11 RMC Research Corporation Portland, OR See page 1 for a key to the notes (A, B, C, †)
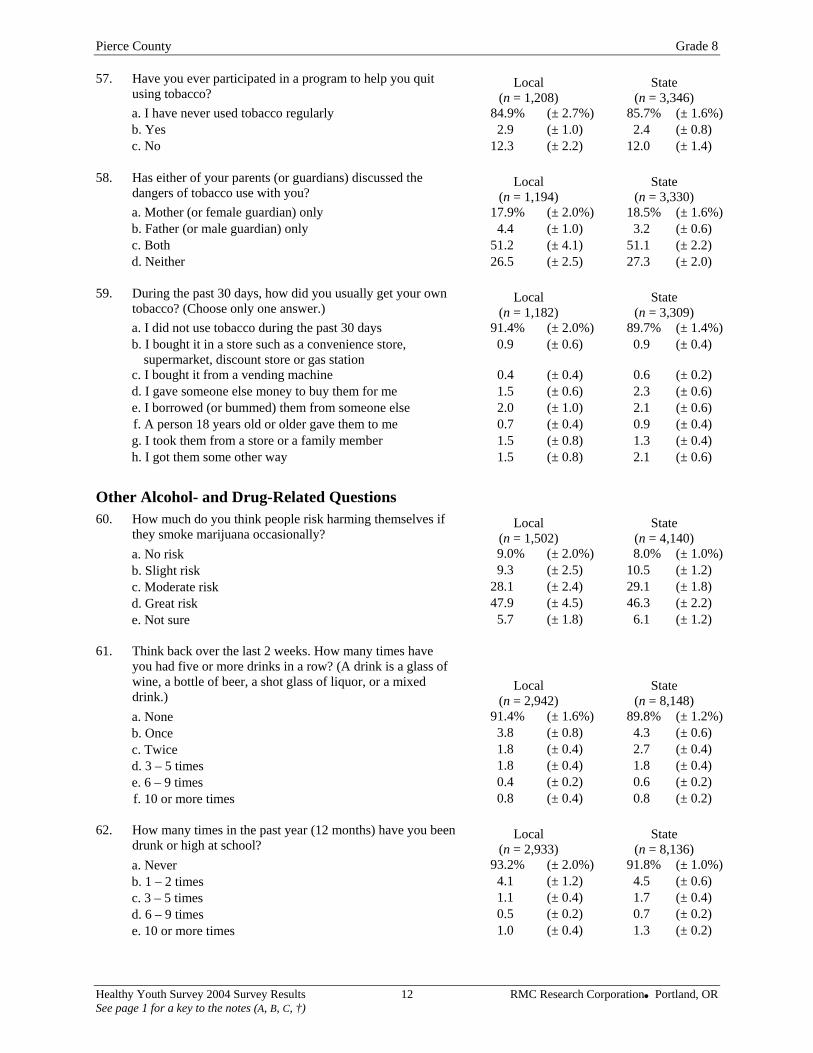
Pierce County Grade 8 57. Have you ever participated in a program to help you quit
using tobacco? Local
(n = 1,208) State
(n = 3,346) a. I have never used tobacco regularly 84.9% (± 2.7%) 85.7% (± 1.6%)b. Yes 2.9 (± 1.0) 2.4 (± 0.8) c. No 12.3 (± 2.2) 12.0 (± 1.4)
58. Has either of your parents (or guardians) discussed the
dangers of tobacco use with you? Local
(n = 1,194) State
(n = 3,330) a. Mother (or female guardian) only 17.9% (± 2.0%) 18.5% (± 1.6%)b. Father (or male guardian) only 4.4 (± 1.0) 3.2 (± 0.6) c. Both 51.2 (± 4.1) 51.1 (± 2.2) d. Neither 26.5 (± 2.5) 27.3 (± 2.0)
59. During the past 30 days, how did you usually get your own
tobacco? (Choose only one answer.) Local
(n = 1,182) State
(n = 3,309) a. I did not use tobacco during the past 30 days 91.4% (± 2.0%) 89.7% (± 1.4%)b. I bought it in a store such as a convenience store,
supermarket, discount store or gas station 0.9 (± 0.6) 0.9 (± 0.4)
c. I bought it from a vending machine 0.4 (± 0.4) 0.6 (± 0.2) d. I gave someone else money to buy them for me 1.5 (± 0.6) 2.3 (± 0.6) e. I borrowed (or bummed) them from someone else 2.0 (± 1.0) 2.1 (± 0.6) f. A person 18 years old or older gave them to me 0.7 (± 0.4) 0.9 (± 0.4) g. I took them from a store or a family member 1.5 (± 0.8) 1.3 (± 0.4) h. I got them some other way 1.5 (± 0.8) 2.1 (± 0.6)
Other Alcohol- and Drug-Related Questions 60. How much do you think people risk harming themselves if
they smoke marijuana occasionally? Local
(n = 1,502) State
(n = 4,140) a. No risk 9.0% (± 2.0%) 8.0% (± 1.0%)b. Slight risk 9.3 (± 2.5) 10.5 (± 1.2) c. Moderate risk 28.1 (± 2.4) 29.1 (± 1.8) d. Great risk 47.9 (± 4.5) 46.3 (± 2.2) e. Not sure 5.7 (± 1.8) 6.1 (± 1.2)
61. Think back over the last 2 weeks. How many times have
you had five or more drinks in a row? (A drink is a glass of wine, a bottle of beer, a shot glass of liquor, or a mixed drink.)
Local (n = 2,942)
State (n = 8,148)
a. None 91.4% (± 1.6%) 89.8% (± 1.2%)b. Once 3.8 (± 0.8) 4.3 (± 0.6) c. Twice 1.8 (± 0.4) 2.7 (± 0.4) d. 3 – 5 times 1.8 (± 0.4) 1.8 (± 0.4) e. 6 – 9 times 0.4 (± 0.2) 0.6 (± 0.2) f. 10 or more times 0.8 (± 0.4) 0.8 (± 0.2)
62. How many times in the past year (12 months) have you been
drunk or high at school? Local
(n = 2,933) State
(n = 8,136) a. Never 93.2% (± 2.0%) 91.8% (± 1.0%)b. 1 – 2 times 4.1 (± 1.2) 4.5 (± 0.6) c. 3 – 5 times 1.1 (± 0.4) 1.7 (± 0.4) d. 6 – 9 times 0.5 (± 0.2) 0.7 (± 0.2) e. 10 or more times 1.0 (± 0.4) 1.3 (± 0.2)
Healthy Youth Survey 2004 Survey Results 12 RMC Research Corporation Portland, OR See page 1 for a key to the notes (A, B, C, †)
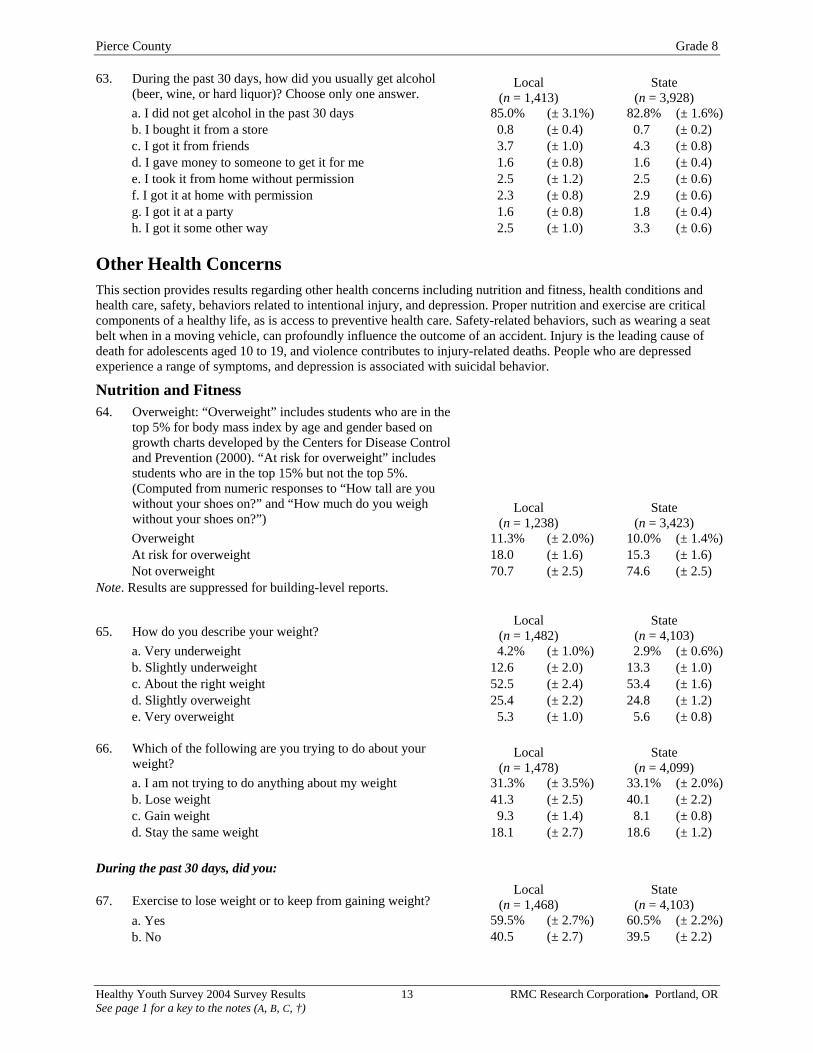
Pierce County Grade 8 63. During the past 30 days, how did you usually get alcohol
(beer, wine, or hard liquor)? Choose only one answer. Local
(n = 1,413) State
(n = 3,928) a. I did not get alcohol in the past 30 days 85.0% (± 3.1%) 82.8% (± 1.6%)b. I bought it from a store 0.8 (± 0.4) 0.7 (± 0.2) c. I got it from friends 3.7 (± 1.0) 4.3 (± 0.8) d. I gave money to someone to get it for me 1.6 (± 0.8) 1.6 (± 0.4) e. I took it from home without permission 2.5 (± 1.2) 2.5 (± 0.6) f. I got it at home with permission 2.3 (± 0.8) 2.9 (± 0.6) g. I got it at a party 1.6 (± 0.8) 1.8 (± 0.4) h. I got it some other way 2.5 (± 1.0) 3.3 (± 0.6)
Other Health Concerns This section provides results regarding other health concerns including nutrition and fitness, health conditions and health care, safety, behaviors related to intentional injury, and depression. Proper nutrition and exercise are critical components of a healthy life, as is access to preventive health care. Safety-related behaviors, such as wearing a seat belt when in a moving vehicle, can profoundly influence the outcome of an accident. Injury is the leading cause of death for adolescents aged 10 to 19, and violence contributes to injury-related deaths. People who are depressed experience a range of symptoms, and depression is associated with suicidal behavior.
Nutrition and Fitness 64. Overweight: “Overweight” includes students who are in the
top 5% for body mass index by age and gender based on growth charts developed by the Centers for Disease Control and Prevention (2000). “At risk for overweight” includes students who are in the top 15% but not the top 5%. (Computed from numeric responses to “How tall are you without your shoes on?” and “How much do you weigh without your shoes on?”)
Local (n = 1,238)
State (n = 3,423)
Overweight 11.3% (± 2.0%) 10.0% (± 1.4%)At risk for overweight 18.0 (± 1.6) 15.3 (± 1.6) Not overweight 70.7 (± 2.5) 74.6 (± 2.5)
Note. Results are suppressed for building-level reports.
65. How do you describe your weight? Local
(n = 1,482) State
(n = 4,103) a. Very underweight 4.2% (± 1.0%) 2.9% (± 0.6%)b. Slightly underweight 12.6 (± 2.0) 13.3 (± 1.0) c. About the right weight 52.5 (± 2.4) 53.4 (± 1.6) d. Slightly overweight 25.4 (± 2.2) 24.8 (± 1.2) e. Very overweight 5.3 (± 1.0) 5.6 (± 0.8)
66. Which of the following are you trying to do about your
weight? Local
(n = 1,478) State
(n = 4,099) a. I am not trying to do anything about my weight 31.3% (± 3.5%) 33.1% (± 2.0%)b. Lose weight 41.3 (± 2.5) 40.1 (± 2.2) c. Gain weight 9.3 (± 1.4) 8.1 (± 0.8) d. Stay the same weight 18.1 (± 2.7) 18.6 (± 1.2)
During the past 30 days, did you:
67. Exercise to lose weight or to keep from gaining weight? Local
(n = 1,468) State
(n = 4,103) a. Yes 59.5% (± 2.7%) 60.5% (± 2.2%)b. No 40.5 (± 2.7) 39.5 (± 2.2)
Healthy Youth Survey 2004 Survey Results 13 RMC Research Corporation Portland, OR See page 1 for a key to the notes (A, B, C, †)
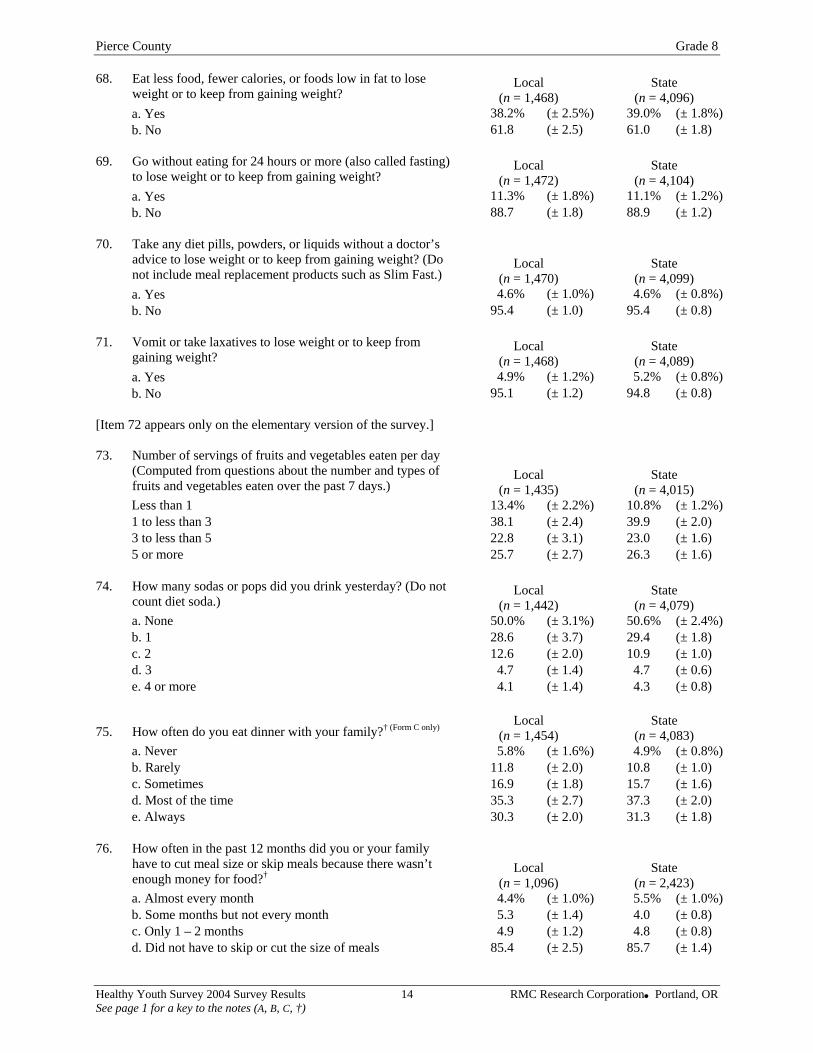
Pierce County Grade 8 68. Eat less food, fewer calories, or foods low in fat to lose
weight or to keep from gaining weight? Local
(n = 1,468) State
(n = 4,096) a. Yes 38.2% (± 2.5%) 39.0% (± 1.8%)b. No 61.8 (± 2.5) 61.0 (± 1.8)
69. Go without eating for 24 hours or more (also called fasting)
to lose weight or to keep from gaining weight? Local
(n = 1,472) State
(n = 4,104) 11.3% (± 1.8%) 11.1% (± 1.2%)a. Yes
b. No 88.7 (± 1.8) 88.9 (± 1.2) 70. Take any diet pills, powders, or liquids without a doctor’s
advice to lose weight or to keep from gaining weight? (Do not include meal replacement products such as Slim Fast.)
Local (n = 1,470)
State (n = 4,099)
a. Yes 4.6% (± 1.0%) 4.6% (± 0.8%)b. No 95.4 (± 1.0) 95.4 (± 0.8)
71. Vomit or take laxatives to lose weight or to keep from
gaining weight? Local
(n = 1,468) State
(n = 4,089) 4.9% (± 1.2%) 5.2% (± 0.8%)a. Yes
95.1 (± 1.2) 94.8 (± 0.8) b. No [Item 72 appears only on the elementary version of the survey.] 73. Number of servings of fruits and vegetables eaten per day
(Computed from questions about the number and types of fruits and vegetables eaten over the past 7 days.)
Local (n = 1,435)
State (n = 4,015)
Less than 1 13.4% (± 2.2%) 10.8% (± 1.2%)1 to less than 3 38.1 (± 2.4) 39.9 (± 2.0) 3 to less than 5 22.8 (± 3.1) 23.0 (± 1.6) 5 or more 25.7 (± 2.7) 26.3 (± 1.6)
74. How many sodas or pops did you drink yesterday? (Do not
count diet soda.) Local
(n = 1,442) State
(n = 4,079) a. None 50.0% (± 3.1%) 50.6% (± 2.4%)b. 1 28.6 (± 3.7) 29.4 (± 1.8) c. 2 12.6 (± 2.0) 10.9 (± 1.0) d. 3 4.7 (± 1.4) 4.7 (± 0.6) e. 4 or more 4.1 (± 1.4) 4.3 (± 0.8)
75. How often do you eat dinner with your family?† (Form C only) Local (n = 1,454)
State (n = 4,083)
a. Never 5.8% (± 1.6%) 4.9% (± 0.8%)b. Rarely 11.8 (± 2.0) 10.8 (± 1.0) c. Sometimes 16.9 (± 1.8) 15.7 (± 1.6) d. Most of the time 35.3 (± 2.7) 37.3 (± 2.0) e. Always 30.3 (± 2.0) 31.3 (± 1.8)
76. How often in the past 12 months did you or your family
have to cut meal size or skip meals because there wasn’t enough money for food?† Local
(n = 1,096) State
(n = 2,423) a. Almost every month 4.4% (± 1.0%) 5.5% (± 1.0%)b. Some months but not every month 5.3 (± 1.4) 4.0 (± 0.8) c. Only 1 – 2 months 4.9 (± 1.2) 4.8 (± 0.8) d. Did not have to skip or cut the size of meals 85.4 (± 2.5) 85.7 (± 1.4)
Healthy Youth Survey 2004 Survey Results 14 RMC Research Corporation Portland, OR See page 1 for a key to the notes (A, B, C, †)
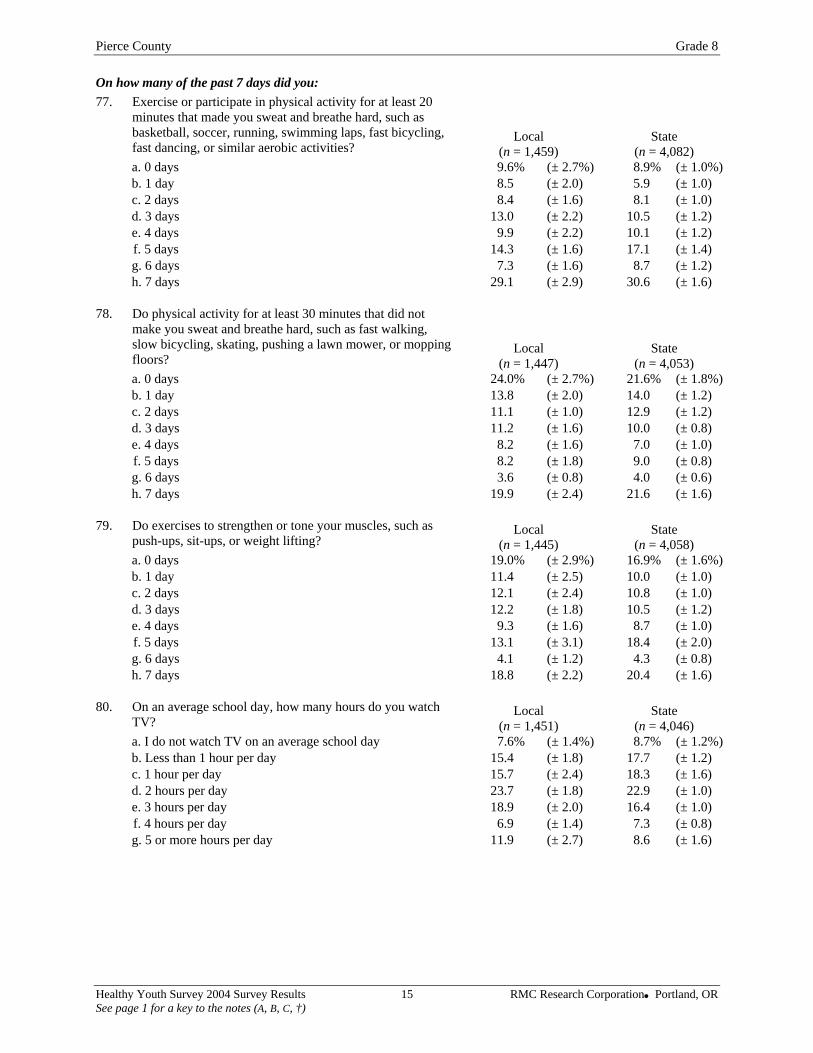
Pierce County Grade 8 On how many of the past 7 days did you: 77. Exercise or participate in physical activity for at least 20
minutes that made you sweat and breathe hard, such as basketball, soccer, running, swimming laps, fast bicycling, fast dancing, or similar aerobic activities?
Local (n = 1,459)
State (n = 4,082)
a. 0 days 9.6% (± 2.7%) 8.9% (± 1.0%)b. 1 day 8.5 (± 2.0) 5.9 (± 1.0) c. 2 days 8.4 (± 1.6) 8.1 (± 1.0) d. 3 days 13.0 (± 2.2) 10.5 (± 1.2) e. 4 days 9.9 (± 2.2) 10.1 (± 1.2) f. 5 days 14.3 (± 1.6) 17.1 (± 1.4) g. 6 days 7.3 (± 1.6) 8.7 (± 1.2) h. 7 days 29.1 (± 2.9) 30.6 (± 1.6)
78. Do physical activity for at least 30 minutes that did not
make you sweat and breathe hard, such as fast walking, slow bicycling, skating, pushing a lawn mower, or mopping floors?
Local (n = 1,447)
State (n = 4,053)
a. 0 days 24.0% (± 2.7%) 21.6% (± 1.8%)b. 1 day 13.8 (± 2.0) 14.0 (± 1.2) c. 2 days 11.1 (± 1.0) 12.9 (± 1.2) d. 3 days 11.2 (± 1.6) 10.0 (± 0.8) e. 4 days 8.2 (± 1.6) 7.0 (± 1.0) f. 5 days 8.2 (± 1.8) 9.0 (± 0.8) g. 6 days 3.6 (± 0.8) 4.0 (± 0.6) h. 7 days 19.9 (± 2.4) 21.6 (± 1.6)
79. Do exercises to strengthen or tone your muscles, such as
push-ups, sit-ups, or weight lifting? Local
(n = 1,445) State
(n = 4,058) a. 0 days 19.0% (± 2.9%) 16.9% (± 1.6%)b. 1 day 11.4 (± 2.5) 10.0 (± 1.0) c. 2 days 12.1 (± 2.4) 10.8 (± 1.0) d. 3 days 12.2 (± 1.8) 10.5 (± 1.2) e. 4 days 9.3 (± 1.6) 8.7 (± 1.0) f. 5 days 13.1 (± 3.1) 18.4 (± 2.0) g. 6 days 4.1 (± 1.2) 4.3 (± 0.8) h. 7 days 18.8 (± 2.2) 20.4 (± 1.6)
80. On an average school day, how many hours do you watch
TV? Local
(n = 1,451) State
(n = 4,046) a. I do not watch TV on an average school day 7.6% (± 1.4%) 8.7% (± 1.2%)b. Less than 1 hour per day 15.4 (± 1.8) 17.7 (± 1.2) c. 1 hour per day 15.7 (± 2.4) 18.3 (± 1.6) d. 2 hours per day 23.7 (± 1.8) 22.9 (± 1.0) e. 3 hours per day 18.9 (± 2.0) 16.4 (± 1.0) f. 4 hours per day 6.9 (± 1.4) 7.3 (± 0.8) g. 5 or more hours per day 11.9 (± 2.7) 8.6 (± 1.6)
Healthy Youth Survey 2004 Survey Results 15 RMC Research Corporation Portland, OR See page 1 for a key to the notes (A, B, C, †)
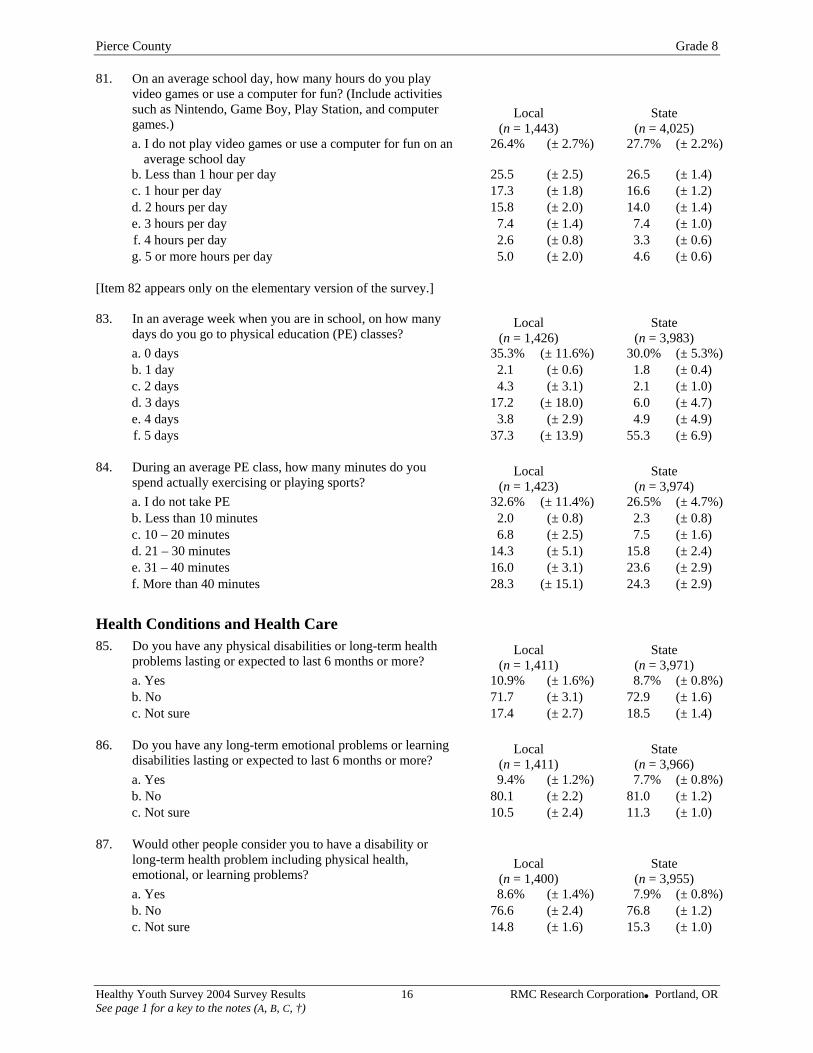
Pierce County Grade 8 81. On an average school day, how many hours do you play
video games or use a computer for fun? (Include activities such as Nintendo, Game Boy, Play Station, and computer games.)
Local (n = 1,443)
State (n = 4,025)
a. I do not play video games or use a computer for fun on an average school day
26.4% (± 2.7%) 27.7% (± 2.2%)
b. Less than 1 hour per day 25.5 (± 2.5) 26.5 (± 1.4) c. 1 hour per day 17.3 (± 1.8) 16.6 (± 1.2) d. 2 hours per day 15.8 (± 2.0) 14.0 (± 1.4) e. 3 hours per day 7.4 (± 1.4) 7.4 (± 1.0) f. 4 hours per day 2.6 (± 0.8) 3.3 (± 0.6) g. 5 or more hours per day 5.0 (± 2.0) 4.6 (± 0.6)
[Item 82 appears only on the elementary version of the survey.] 83. In an average week when you are in school, on how many
days do you go to physical education (PE) classes? Local
(n = 1,426) State
(n = 3,983) a. 0 days 35.3% (± 11.6%) 30.0% (± 5.3%)b. 1 day 2.1 (± 0.6) 1.8 (± 0.4) c. 2 days 4.3 (± 3.1) 2.1 (± 1.0) d. 3 days 17.2 (± 18.0) 6.0 (± 4.7) e. 4 days 3.8 (± 2.9) 4.9 (± 4.9) f. 5 days 37.3 (± 13.9) 55.3 (± 6.9)
84. During an average PE class, how many minutes do you
spend actually exercising or playing sports? Local
(n = 1,423) State
(n = 3,974) a. I do not take PE 32.6% (± 11.4%) 26.5% (± 4.7%)b. Less than 10 minutes 2.0 (± 0.8) 2.3 (± 0.8) c. 10 – 20 minutes 6.8 (± 2.5) 7.5 (± 1.6) d. 21 – 30 minutes 14.3 (± 5.1) 15.8 (± 2.4) e. 31 – 40 minutes 16.0 (± 3.1) 23.6 (± 2.9) f. More than 40 minutes 28.3 (± 15.1) 24.3 (± 2.9)
Health Conditions and Health Care 85. Do you have any physical disabilities or long-term health
problems lasting or expected to last 6 months or more? Local
(n = 1,411) State
(n = 3,971) a. Yes 10.9% (± 1.6%) 8.7% (± 0.8%)b. No 71.7 (± 3.1) 72.9 (± 1.6) c. Not sure 17.4 (± 2.7) 18.5 (± 1.4)
86. Do you have any long-term emotional problems or learning
disabilities lasting or expected to last 6 months or more? Local
(n = 1,411) State
(n = 3,966) a. Yes 9.4% (± 1.2%) 7.7% (± 0.8%)b. No 80.1 (± 2.2) 81.0 (± 1.2) c. Not sure 10.5 (± 2.4) 11.3 (± 1.0)
87. Would other people consider you to have a disability or
long-term health problem including physical health, emotional, or learning problems?
Local (n = 1,400)
State (n = 3,955)
a. Yes 8.6% (± 1.4%) 7.9% (± 0.8%)b. No 76.6 (± 2.4) 76.8 (± 1.2) c. Not sure 14.8 (± 1.6) 15.3 (± 1.0)
Healthy Youth Survey 2004 Survey Results 16 RMC Research Corporation Portland, OR See page 1 for a key to the notes (A, B, C, †)
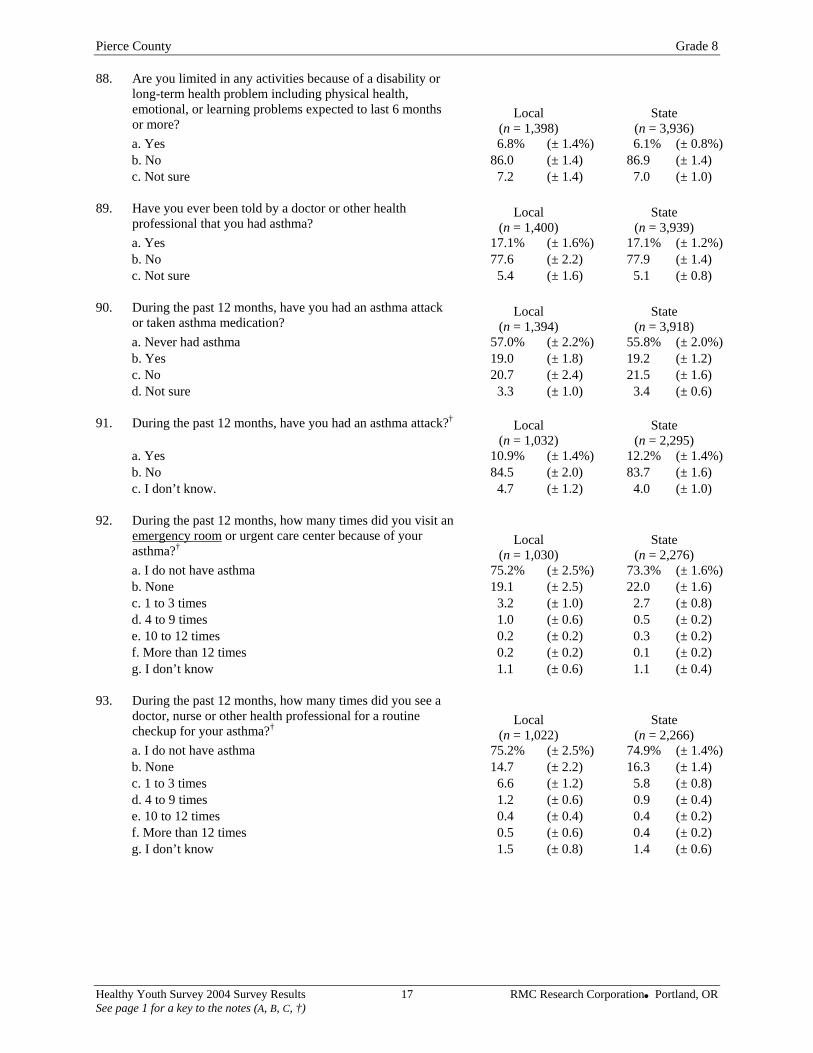
Pierce County Grade 8 88. Are you limited in any activities because of a disability or
long-term health problem including physical health, emotional, or learning problems expected to last 6 months or more?
Local (n = 1,398)
State (n = 3,936)
a. Yes 6.8% (± 1.4%) 6.1% (± 0.8%)b. No 86.0 (± 1.4) 86.9 (± 1.4) c. Not sure 7.2 (± 1.4) 7.0 (± 1.0)
89. Have you ever been told by a doctor or other health
professional that you had asthma? Local
(n = 1,400) State
(n = 3,939) a. Yes 17.1% (± 1.6%) 17.1% (± 1.2%)b. No 77.6 (± 2.2) 77.9 (± 1.4) c. Not sure 5.4 (± 1.6) 5.1 (± 0.8)
90. During the past 12 months, have you had an asthma attack
or taken asthma medication? Local
(n = 1,394) State
(n = 3,918) a. Never had asthma 57.0% (± 2.2%) 55.8% (± 2.0%)b. Yes 19.0 (± 1.8) 19.2 (± 1.2) c. No 20.7 (± 2.4) 21.5 (± 1.6) d. Not sure 3.3 (± 1.0) 3.4 (± 0.6)
91. During the past 12 months, have you had an asthma attack?† Local
(n = 1,032) State
(n = 2,295) a. Yes 10.9% (± 1.4%) 12.2% (± 1.4%)b. No 84.5 (± 2.0) 83.7 (± 1.6) c. I don’t know. 4.7 (± 1.2) 4.0 (± 1.0)
92. During the past 12 months, how many times did you visit an
emergency room or urgent care center because of your asthma?† Local
(n = 1,030) State
(n = 2,276) a. I do not have asthma 75.2% (± 2.5%) 73.3% (± 1.6%)b. None 19.1 (± 2.5) 22.0 (± 1.6) c. 1 to 3 times 3.2 (± 1.0) 2.7 (± 0.8) d. 4 to 9 times 1.0 (± 0.6) 0.5 (± 0.2) e. 10 to 12 times 0.2 (± 0.2) 0.3 (± 0.2) f. More than 12 times 0.2 (± 0.2) 0.1 (± 0.2) g. I don’t know 1.1 (± 0.6) 1.1 (± 0.4)
93. During the past 12 months, how many times did you see a
doctor, nurse or other health professional for a routine checkup for your asthma?† Local
(n = 1,022) State
(n = 2,266) a. I do not have asthma 75.2% (± 2.5%) 74.9% (± 1.4%)b. None 14.7 (± 2.2) 16.3 (± 1.4) c. 1 to 3 times 6.6 (± 1.2) 5.8 (± 0.8) d. 4 to 9 times 1.2 (± 0.6) 0.9 (± 0.4) e. 10 to 12 times 0.4 (± 0.4) 0.4 (± 0.2) f. More than 12 times 0.5 (± 0.6) 0.4 (± 0.2) g. I don’t know 1.5 (± 0.8) 1.4 (± 0.6)
Healthy Youth Survey 2004 Survey Results 17 RMC Research Corporation Portland, OR See page 1 for a key to the notes (A, B, C, †)
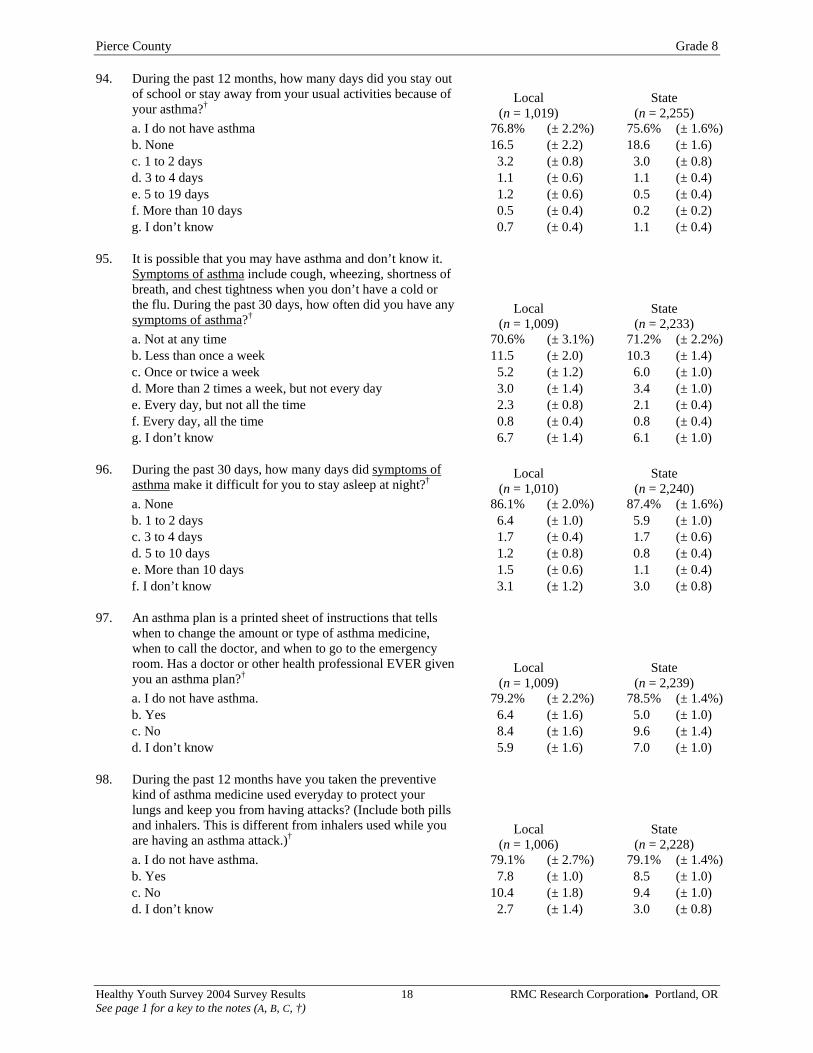
Pierce County Grade 8 94. During the past 12 months, how many days did you stay out
of school or stay away from your usual activities because of your asthma?† Local
(n = 1,019) State
(n = 2,255) a. I do not have asthma 76.8% (± 2.2%) 75.6% (± 1.6%)b. None 16.5 (± 2.2) 18.6 (± 1.6) c. 1 to 2 days 3.2 (± 0.8) 3.0 (± 0.8) d. 3 to 4 days 1.1 (± 0.6) 1.1 (± 0.4) e. 5 to 19 days 1.2 (± 0.6) 0.5 (± 0.4) f. More than 10 days 0.5 (± 0.4) 0.2 (± 0.2) g. I don’t know 0.7 (± 0.4) 1.1 (± 0.4)
95. It is possible that you may have asthma and don’t know it.
Symptoms of asthma include cough, wheezing, shortness of breath, and chest tightness when you don’t have a cold or the flu. During the past 30 days, how often did you have any symptoms of asthma?† Local
(n = 1,009) State
(n = 2,233) a. Not at any time 70.6% (± 3.1%) 71.2% (± 2.2%)b. Less than once a week 11.5 (± 2.0) 10.3 (± 1.4) c. Once or twice a week 5.2 (± 1.2) 6.0 (± 1.0) d. More than 2 times a week, but not every day 3.0 (± 1.4) 3.4 (± 1.0) e. Every day, but not all the time 2.3 (± 0.8) 2.1 (± 0.4) f. Every day, all the time 0.8 (± 0.4) 0.8 (± 0.4) g. I don’t know 6.7 (± 1.4) 6.1 (± 1.0)
96. During the past 30 days, how many days did symptoms of
asthma make it difficult for you to stay asleep at night?† Local (n = 1,010)
State (n = 2,240)
a. None 86.1% (± 2.0%) 87.4% (± 1.6%)b. 1 to 2 days 6.4 (± 1.0) 5.9 (± 1.0) c. 3 to 4 days 1.7 (± 0.4) 1.7 (± 0.6) d. 5 to 10 days 1.2 (± 0.8) 0.8 (± 0.4) e. More than 10 days 1.5 (± 0.6) 1.1 (± 0.4) f. I don’t know 3.1 (± 1.2) 3.0 (± 0.8)
97. An asthma plan is a printed sheet of instructions that tells
when to change the amount or type of asthma medicine, when to call the doctor, and when to go to the emergency room. Has a doctor or other health professional EVER given you an asthma plan?† Local
(n = 1,009) State
(n = 2,239) a. I do not have asthma. 79.2% (± 2.2%) 78.5% (± 1.4%)b. Yes 6.4 (± 1.6) 5.0 (± 1.0) c. No 8.4 (± 1.6) 9.6 (± 1.4) d. I don’t know 5.9 (± 1.6) 7.0 (± 1.0)
98. During the past 12 months have you taken the preventive
kind of asthma medicine used everyday to protect your lungs and keep you from having attacks? (Include both pills and inhalers. This is different from inhalers used while you are having an asthma attack.)† Local
(n = 1,006) State
(n = 2,228) a. I do not have asthma. 79.1% (± 2.7%) 79.1% (± 1.4%)b. Yes 7.8 (± 1.0) 8.5 (± 1.0) c. No 10.4 (± 1.8) 9.4 (± 1.0) d. I don’t know 2.7 (± 1.4) 3.0 (± 0.8)
Healthy Youth Survey 2004 Survey Results 18 RMC Research Corporation Portland, OR See page 1 for a key to the notes (A, B, C, †)
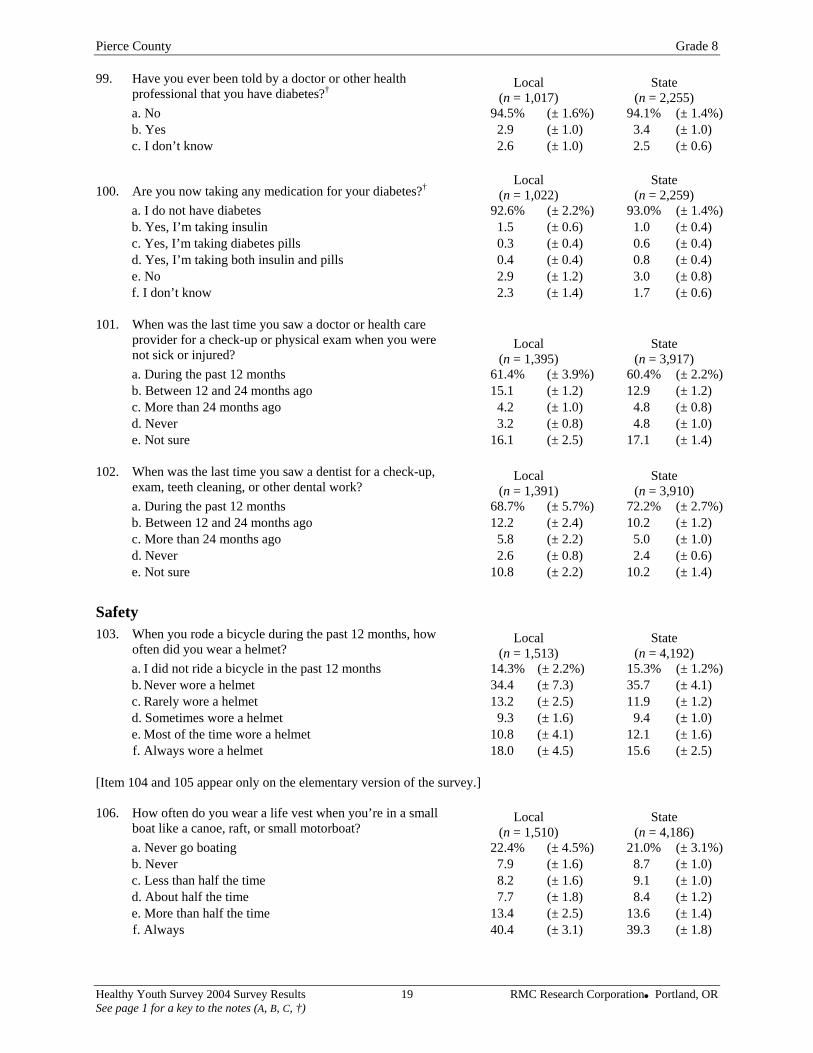
Pierce County Grade 8 99. Have you ever been told by a doctor or other health
professional that you have diabetes?† Local (n = 1,017)
State (n = 2,255)
a. No 94.5% (± 1.6%) 94.1% (± 1.4%)b. Yes 2.9 (± 1.0) 3.4 (± 1.0) c. I don’t know 2.6 (± 1.0) 2.5 (± 0.6)
100. Are you now taking any medication for your diabetes?† Local (n = 1,022)
State (n = 2,259)
a. I do not have diabetes 92.6% (± 2.2%) 93.0% (± 1.4%)b. Yes, I’m taking insulin 1.5 (± 0.6) 1.0 (± 0.4) c. Yes, I’m taking diabetes pills 0.3 (± 0.4) 0.6 (± 0.4) d. Yes, I’m taking both insulin and pills 0.4 (± 0.4) 0.8 (± 0.4) e. No 2.9 (± 1.2) 3.0 (± 0.8) f. I don’t know 2.3 (± 1.4) 1.7 (± 0.6)
101. When was the last time you saw a doctor or health care
provider for a check-up or physical exam when you were not sick or injured?
Local (n = 1,395)
State (n = 3,917)
a. During the past 12 months 61.4% (± 3.9%) 60.4% (± 2.2%)b. Between 12 and 24 months ago 15.1 (± 1.2) 12.9 (± 1.2) c. More than 24 months ago 4.2 (± 1.0) 4.8 (± 0.8) d. Never 3.2 (± 0.8) 4.8 (± 1.0) e. Not sure 16.1 (± 2.5) 17.1 (± 1.4)
102. When was the last time you saw a dentist for a check-up,
exam, teeth cleaning, or other dental work? Local
(n = 1,391) State
(n = 3,910) a. During the past 12 months 68.7% (± 5.7%) 72.2% (± 2.7%)b. Between 12 and 24 months ago 12.2 (± 2.4) 10.2 (± 1.2) c. More than 24 months ago 5.8 (± 2.2) 5.0 (± 1.0) d. Never 2.6 (± 0.8) 2.4 (± 0.6) e. Not sure 10.8 (± 2.2) 10.2 (± 1.4)
Safety 103. When you rode a bicycle during the past 12 months, how
often did you wear a helmet? Local
(n = 1,513) State
(n = 4,192) a. I did not ride a bicycle in the past 12 months 14.3% (± 2.2%) 15.3% (± 1.2%)b. Never wore a helmet 34.4 (± 7.3) 35.7 (± 4.1) c. Rarely wore a helmet 13.2 (± 2.5) 11.9 (± 1.2) d. Sometimes wore a helmet 9.3 (± 1.6) 9.4 (± 1.0) e. Most of the time wore a helmet 10.8 (± 4.1) 12.1 (± 1.6) f. Always wore a helmet 18.0 (± 4.5) 15.6 (± 2.5)
[Item 104 and 105 appear only on the elementary version of the survey.] 106. How often do you wear a life vest when you’re in a small
boat like a canoe, raft, or small motorboat? Local
(n = 1,510) State
(n = 4,186) a. Never go boating 22.4% (± 4.5%) 21.0% (± 3.1%)b. Never 7.9 (± 1.6) 8.7 (± 1.0) c. Less than half the time 8.2 (± 1.6) 9.1 (± 1.0) d. About half the time 7.7 (± 1.8) 8.4 (± 1.2) e. More than half the time 13.4 (± 2.5) 13.6 (± 1.4) f. Always 40.4 (± 3.1) 39.3 (± 1.8)
Healthy Youth Survey 2004 Survey Results 19 RMC Research Corporation Portland, OR See page 1 for a key to the notes (A, B, C, †)
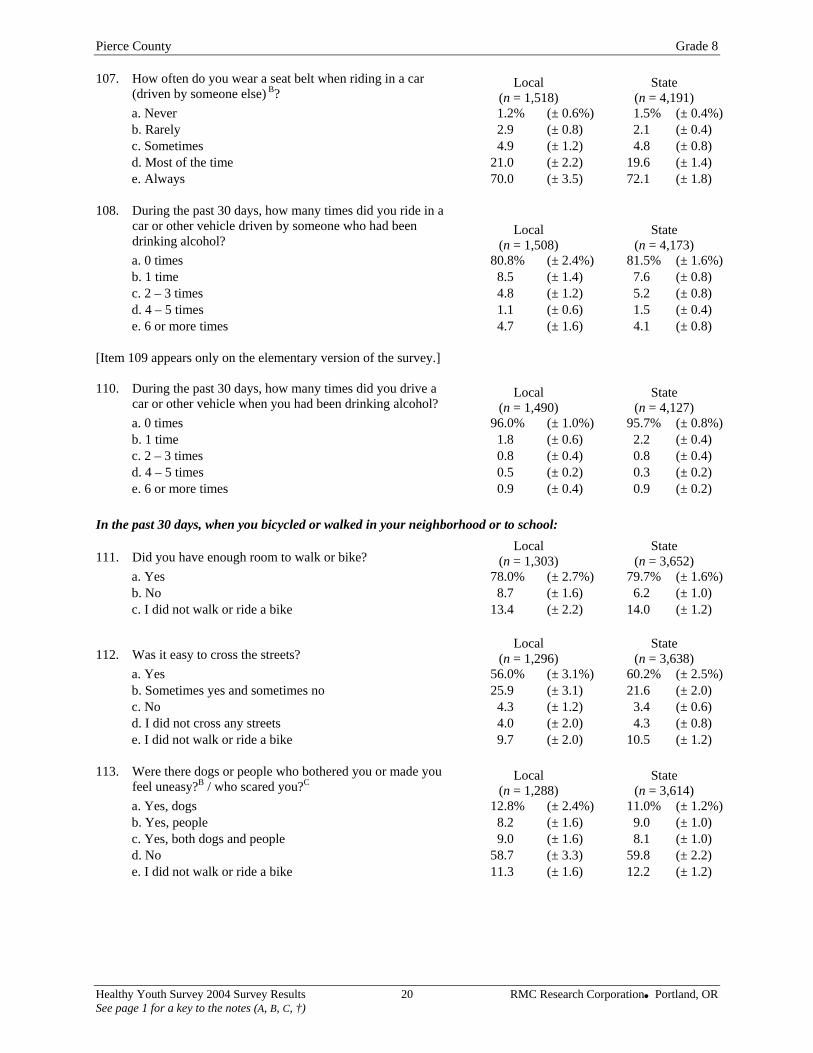
Pierce County Grade 8 107. How often do you wear a seat belt when riding in a car
(driven by someone else) B? Local
(n = 1,518) State
(n = 4,191) a. Never 1.2% (± 0.6%) 1.5% (± 0.4%)b. Rarely 2.9 (± 0.8) 2.1 (± 0.4) c. Sometimes 4.9 (± 1.2) 4.8 (± 0.8) d. Most of the time 21.0 (± 2.2) 19.6 (± 1.4) e. Always 70.0 (± 3.5) 72.1 (± 1.8)
108. During the past 30 days, how many times did you ride in a
car or other vehicle driven by someone who had been drinking alcohol?
Local (n = 1,508)
State (n = 4,173)
a. 0 times 80.8% (± 2.4%) 81.5% (± 1.6%)b. 1 time 8.5 (± 1.4) 7.6 (± 0.8) c. 2 – 3 times 4.8 (± 1.2) 5.2 (± 0.8) d. 4 – 5 times 1.1 (± 0.6) 1.5 (± 0.4) e. 6 or more times 4.7 (± 1.6) 4.1 (± 0.8)
[Item 109 appears only on the elementary version of the survey.] 110. During the past 30 days, how many times did you drive a
car or other vehicle when you had been drinking alcohol? Local
(n = 1,490) State
(n = 4,127) a. 0 times 96.0% (± 1.0%) 95.7% (± 0.8%)b. 1 time 1.8 (± 0.6) 2.2 (± 0.4) c. 2 – 3 times 0.8 (± 0.4) 0.8 (± 0.4) d. 4 – 5 times 0.5 (± 0.2) 0.3 (± 0.2) e. 6 or more times 0.9 (± 0.4) 0.9 (± 0.2)
In the past 30 days, when you bicycled or walked in your neighborhood or to school:
111. Did you have enough room to walk or bike? Local
(n = 1,303) State
(n = 3,652) a. Yes 78.0% (± 2.7%) 79.7% (± 1.6%)b. No 8.7 (± 1.6) 6.2 (± 1.0) c. I did not walk or ride a bike 13.4 (± 2.2) 14.0 (± 1.2)
112. Was it easy to cross the streets? Local
(n = 1,296) State
(n = 3,638) a. Yes 56.0% (± 3.1%) 60.2% (± 2.5%)b. Sometimes yes and sometimes no 25.9 (± 3.1) 21.6 (± 2.0) c. No 4.3 (± 1.2) 3.4 (± 0.6) d. I did not cross any streets 4.0 (± 2.0) 4.3 (± 0.8) e. I did not walk or ride a bike 9.7 (± 2.0) 10.5 (± 1.2)
113. Were there dogs or people who bothered you or made you
feel uneasy?B / who scared you?C Local (n = 1,288)
State (n = 3,614)
a. Yes, dogs 12.8% (± 2.4%) 11.0% (± 1.2%)b. Yes, people 8.2 (± 1.6) 9.0 (± 1.0) c. Yes, both dogs and people 9.0 (± 1.6) 8.1 (± 1.0) d. No 58.7 (± 3.3) 59.8 (± 2.2) e. I did not walk or ride a bike 11.3 (± 1.6) 12.2 (± 1.2)
Healthy Youth Survey 2004 Survey Results 20 RMC Research Corporation Portland, OR See page 1 for a key to the notes (A, B, C, †)
Pierce County Grade 8
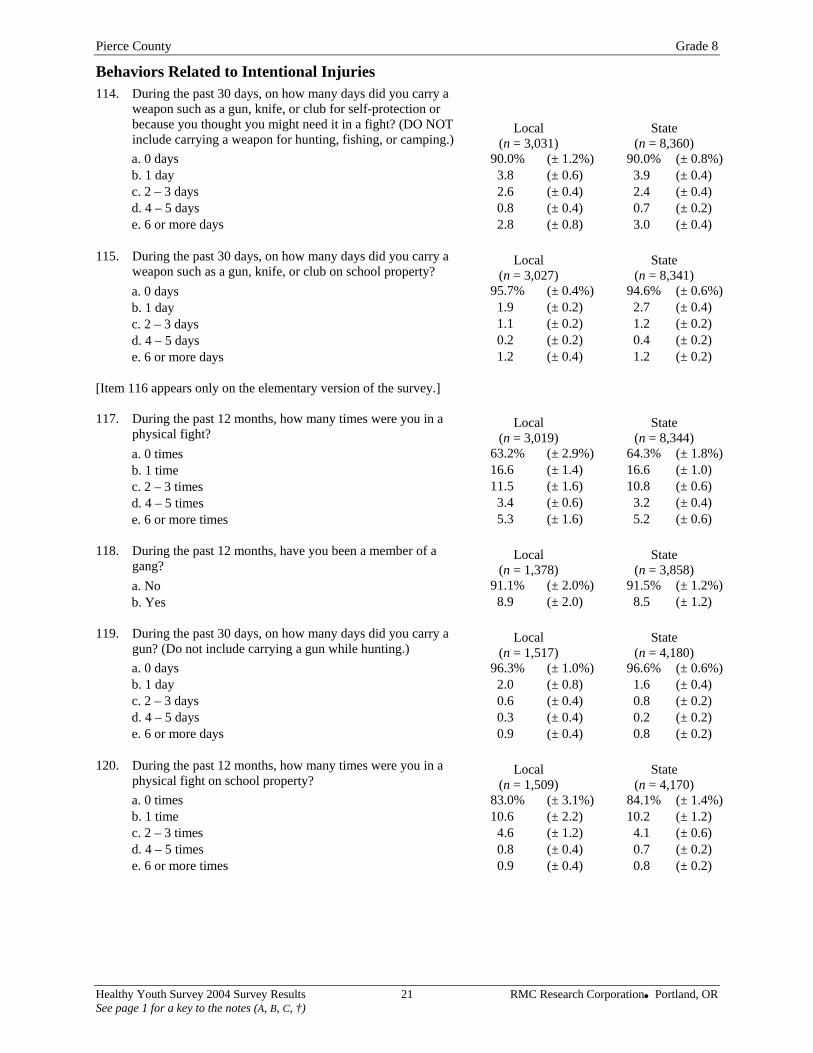
Behaviors Related to Intentional Injuries 114. During the past 30 days, on how many days did you carry a
weapon such as a gun, knife, or club for self-protection or because you thought you might need it in a fight? (DO NOT include carrying a weapon for hunting, fishing, or camping.)
Local (n = 3,031)
State (n = 8,360)
a. 0 days 90.0% (± 1.2%) 90.0% (± 0.8%)b. 1 day 3.8 (± 0.6) 3.9 (± 0.4) c. 2 – 3 days 2.6 (± 0.4) 2.4 (± 0.4) d. 4 – 5 days 0.8 (± 0.4) 0.7 (± 0.2) e. 6 or more days 2.8 (± 0.8) 3.0 (± 0.4)
115. During the past 30 days, on how many days did you carry a
weapon such as a gun, knife, or club on school property? Local
(n = 3,027) State
(n = 8,341) a. 0 days 95.7% (± 0.4%) 94.6% (± 0.6%)b. 1 day 1.9 (± 0.2) 2.7 (± 0.4) c. 2 – 3 days 1.1 (± 0.2) 1.2 (± 0.2) d. 4 – 5 days 0.2 (± 0.2) 0.4 (± 0.2) e. 6 or more days 1.2 (± 0.4) 1.2 (± 0.2)
[Item 116 appears only on the elementary version of the survey.] 117. During the past 12 months, how many times were you in a
physical fight? Local
(n = 3,019) State
(n = 8,344) a. 0 times 63.2% (± 2.9%) 64.3% (± 1.8%)b. 1 time 16.6 (± 1.4) 16.6 (± 1.0) c. 2 – 3 times 11.5 (± 1.6) 10.8 (± 0.6) d. 4 – 5 times 3.4 (± 0.6) 3.2 (± 0.4) e. 6 or more times 5.3 (± 1.6) 5.2 (± 0.6)
118. During the past 12 months, have you been a member of a
gang? Local
(n = 1,378) State
(n = 3,858) a. No 91.1% (± 2.0%) 91.5% (± 1.2%)b. Yes 8.9 (± 2.0) 8.5 (± 1.2)
119. During the past 30 days, on how many days did you carry a
gun? (Do not include carrying a gun while hunting.) Local
(n = 1,517) State
(n = 4,180) a. 0 days 96.3% (± 1.0%) 96.6% (± 0.6%)b. 1 day 2.0 (± 0.8) 1.6 (± 0.4) c. 2 – 3 days 0.6 (± 0.4) 0.8 (± 0.2) d. 4 – 5 days 0.3 (± 0.4) 0.2 (± 0.2) e. 6 or more days 0.9 (± 0.4) 0.8 (± 0.2)
120. During the past 12 months, how many times were you in a
physical fight on school property? Local
(n = 1,509) State
(n = 4,170) a. 0 times 83.0% (± 3.1%) 84.1% (± 1.4%)b. 1 time 10.6 (± 2.2) 10.2 (± 1.2) c. 2 – 3 times 4.6 (± 1.2) 4.1 (± 0.6) d. 4 – 5 times 0.8 (± 0.4) 0.7 (± 0.2) e. 6 or more times 0.9 (± 0.4) 0.8 (± 0.2)
Healthy Youth Survey 2004 Survey Results 21 RMC Research Corporation Portland, OR See page 1 for a key to the notes (A, B, C, †)
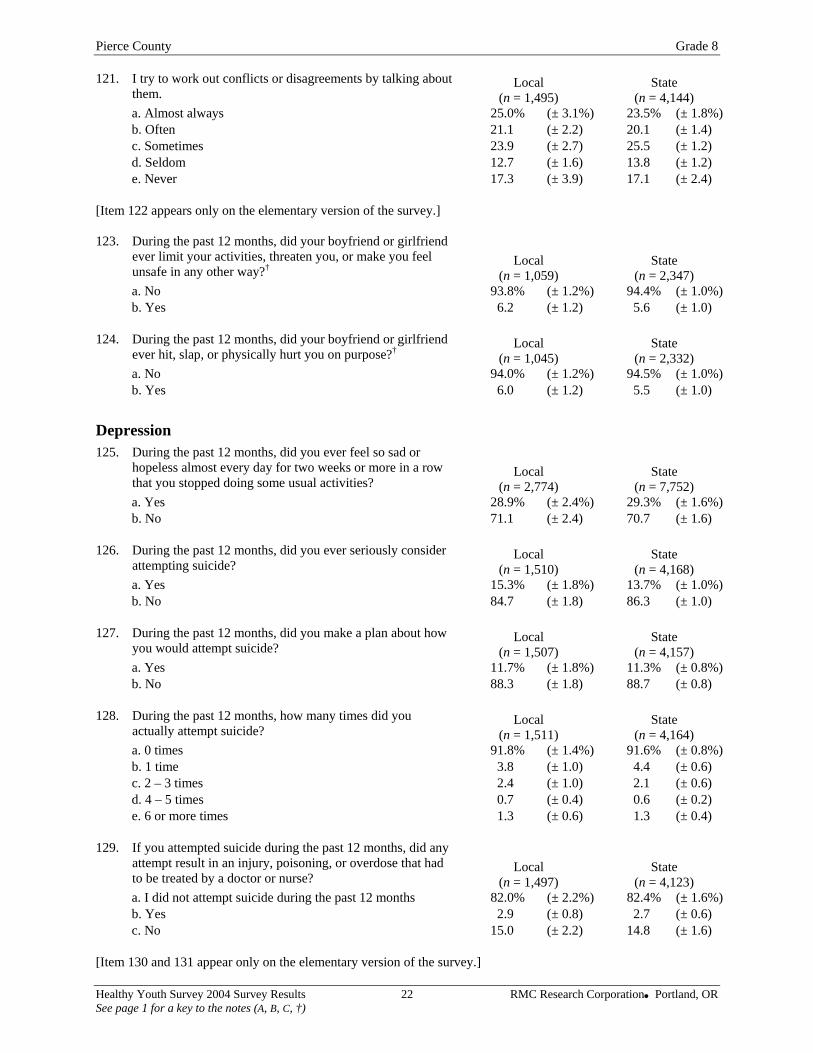
Pierce County Grade 8 121. I try to work out conflicts or disagreements by talking about
them. Local
(n = 1,495) State
(n = 4,144) a. Almost always 25.0% (± 3.1%) 23.5% (± 1.8%)b. Often 21.1 (± 2.2) 20.1 (± 1.4) c. Sometimes 23.9 (± 2.7) 25.5 (± 1.2) d. Seldom 12.7 (± 1.6) 13.8 (± 1.2) e. Never 17.3 (± 3.9) 17.1 (± 2.4)
[Item 122 appears only on the elementary version of the survey.] 123. During the past 12 months, did your boyfriend or girlfriend
ever limit your activities, threaten you, or make you feel unsafe in any other way?† Local
(n = 1,059) State
(n = 2,347) a. No 93.8% (± 1.2%) 94.4% (± 1.0%)b. Yes 6.2 (± 1.2) 5.6 (± 1.0)
124. During the past 12 months, did your boyfriend or girlfriend
ever hit, slap, or physically hurt you on purpose?† Local (n = 1,045)
State (n = 2,332)
a. No 94.0% (± 1.2%) 94.5% (± 1.0%)b. Yes 6.0 (± 1.2) 5.5 (± 1.0)
Depression 125. During the past 12 months, did you ever feel so sad or
hopeless almost every day for two weeks or more in a row that you stopped doing some usual activities?
Local (n = 2,774)
State (n = 7,752)
a. Yes 28.9% (± 2.4%) 29.3% (± 1.6%)b. No 71.1 (± 2.4) 70.7 (± 1.6)
126. During the past 12 months, did you ever seriously consider
attempting suicide? Local
(n = 1,510) State
(n = 4,168) a. Yes 15.3% (± 1.8%) 13.7% (± 1.0%)b. No 84.7 (± 1.8) 86.3 (± 1.0)
127. During the past 12 months, did you make a plan about how
you would attempt suicide? Local
(n = 1,507) State
(n = 4,157) a. Yes 11.7% (± 1.8%) 11.3% (± 0.8%)b. No 88.3 (± 1.8) 88.7 (± 0.8)
128. During the past 12 months, how many times did you
actually attempt suicide? Local
(n = 1,511) State
(n = 4,164) a. 0 times 91.8% (± 1.4%) 91.6% (± 0.8%)b. 1 time 3.8 (± 1.0) 4.4 (± 0.6) c. 2 – 3 times 2.4 (± 1.0) 2.1 (± 0.6) d. 4 – 5 times 0.7 (± 0.4) 0.6 (± 0.2) e. 6 or more times 1.3 (± 0.6) 1.3 (± 0.4)
129. If you attempted suicide during the past 12 months, did any
attempt result in an injury, poisoning, or overdose that had to be treated by a doctor or nurse?
Local (n = 1,497)
State (n = 4,123)
a. I did not attempt suicide during the past 12 months 82.0% (± 2.2%) 82.4% (± 1.6%)b. Yes 2.9 (± 0.8) 2.7 (± 0.6) c. No 15.0 (± 2.2) 14.8 (± 1.6)
[Item 130 and 131 appear only on the elementary version of the survey.]
Healthy Youth Survey 2004 Survey Results 22 RMC Research Corporation Portland, OR See page 1 for a key to the notes (A, B, C, †)
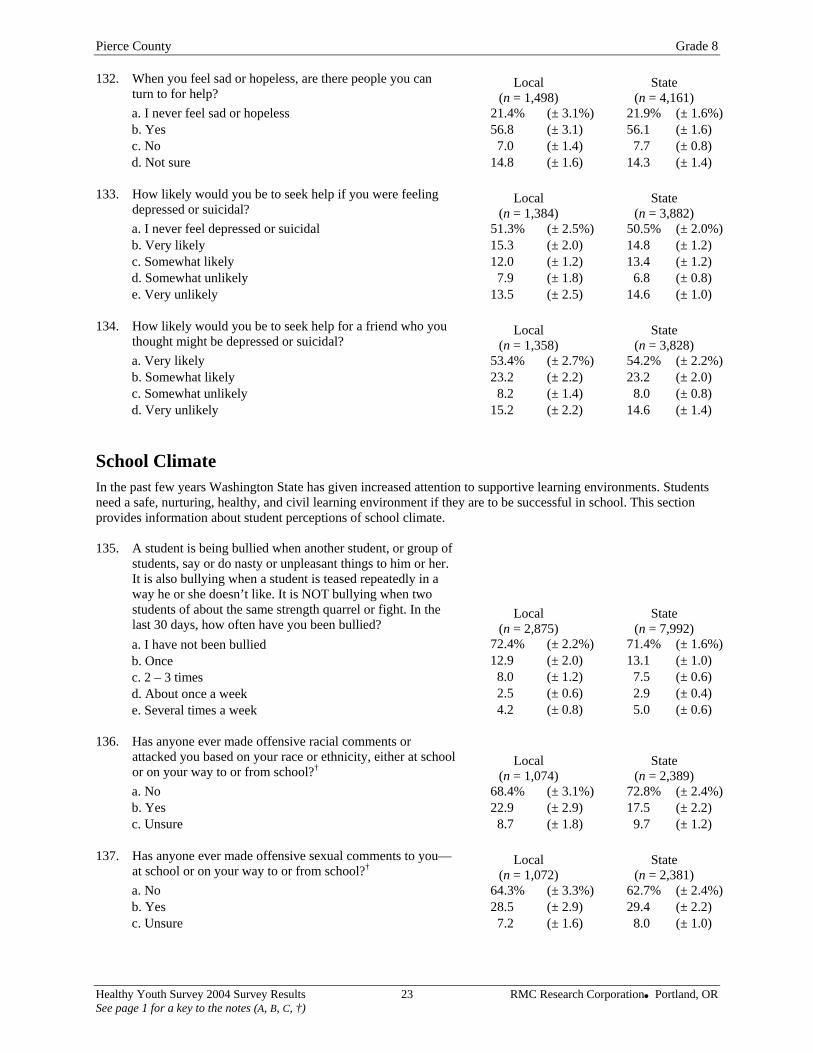
Pierce County Grade 8 132. When you feel sad or hopeless, are there people you can
turn to for help? Local
(n = 1,498) State
(n = 4,161) a. I never feel sad or hopeless 21.4% (± 3.1%) 21.9% (± 1.6%)b. Yes 56.8 (± 3.1) 56.1 (± 1.6) c. No 7.0 (± 1.4) 7.7 (± 0.8) d. Not sure 14.8 (± 1.6) 14.3 (± 1.4)
133. How likely would you be to seek help if you were feeling
depressed or suicidal? Local
(n = 1,384) State
(n = 3,882) a. I never feel depressed or suicidal 51.3% (± 2.5%) 50.5% (± 2.0%)b. Very likely 15.3 (± 2.0) 14.8 (± 1.2) c. Somewhat likely 12.0 (± 1.2) 13.4 (± 1.2) d. Somewhat unlikely 7.9 (± 1.8) 6.8 (± 0.8) e. Very unlikely 13.5 (± 2.5) 14.6 (± 1.0)
134. How likely would you be to seek help for a friend who you
thought might be depressed or suicidal? Local
(n = 1,358) State
(n = 3,828) a. Very likely 53.4% (± 2.7%) 54.2% (± 2.2%)b. Somewhat likely 23.2 (± 2.2) 23.2 (± 2.0) c. Somewhat unlikely 8.2 (± 1.4) 8.0 (± 0.8) d. Very unlikely 15.2 (± 2.2) 14.6 (± 1.4)
School Climate In the past few years Washington State has given increased attention to supportive learning environments. Students need a safe, nurturing, healthy, and civil learning environment if they are to be successful in school. This section provides information about student perceptions of school climate. 135. A student is being bullied when another student, or group of
students, say or do nasty or unpleasant things to him or her. It is also bullying when a student is teased repeatedly in a way he or she doesn’t like. It is NOT bullying when two students of about the same strength quarrel or fight. In the last 30 days, how often have you been bullied?
Local (n = 2,875)
State (n = 7,992)
a. I have not been bullied 72.4% (± 2.2%) 71.4% (± 1.6%)b. Once 12.9 (± 2.0) 13.1 (± 1.0) c. 2 – 3 times 8.0 (± 1.2) 7.5 (± 0.6) d. About once a week 2.5 (± 0.6) 2.9 (± 0.4) e. Several times a week 4.2 (± 0.8) 5.0 (± 0.6)
136. Has anyone ever made offensive racial comments or
attacked you based on your race or ethnicity, either at school or on your way to or from school?† Local
(n = 1,074) State
(n = 2,389) a. No 68.4% (± 3.1%) 72.8% (± 2.4%)b. Yes 22.9 (± 2.9) 17.5 (± 2.2) c. Unsure 8.7 (± 1.8) 9.7 (± 1.2)
137. Has anyone ever made offensive sexual comments to you—
at school or on your way to or from school?† Local (n = 1,072)
State (n = 2,381)
a. No 64.3% (± 3.3%) 62.7% (± 2.4%)b. Yes 28.5 (± 2.9) 29.4 (± 2.2) c. Unsure 7.2 (± 1.6) 8.0 (± 1.0)
Healthy Youth Survey 2004 Survey Results 23 RMC Research Corporation Portland, OR See page 1 for a key to the notes (A, B, C, †)
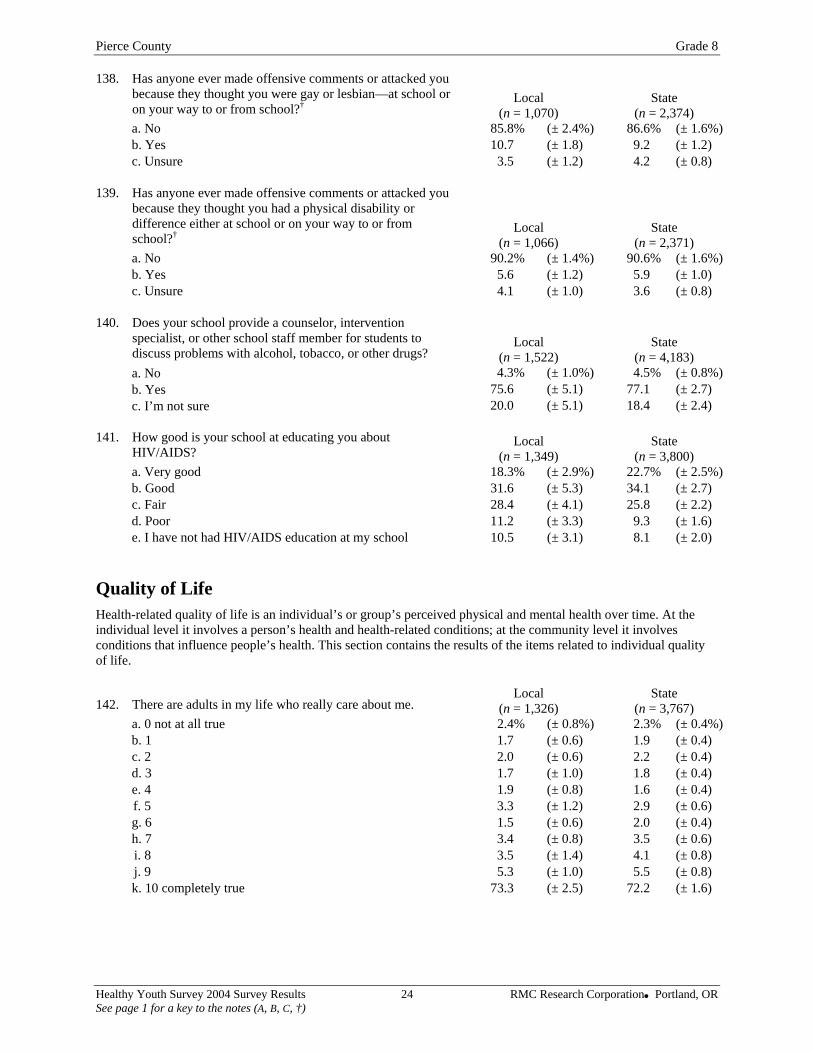
Pierce County Grade 8 138. Has anyone ever made offensive comments or attacked you
because they thought you were gay or lesbian—at school or on your way to or from school?† Local
(n = 1,070) State
(n = 2,374) a. No 85.8% (± 2.4%) 86.6% (± 1.6%)b. Yes 10.7 (± 1.8) 9.2 (± 1.2) c. Unsure 3.5 (± 1.2) 4.2 (± 0.8)
139. Has anyone ever made offensive comments or attacked you
because they thought you had a physical disability or difference either at school or on your way to or from school?† Local
(n = 1,066) State
(n = 2,371) a. No 90.2% (± 1.4%) 90.6% (± 1.6%)b. Yes 5.6 (± 1.2) 5.9 (± 1.0) c. Unsure 4.1 (± 1.0) 3.6 (± 0.8)
140. Does your school provide a counselor, intervention
specialist, or other school staff member for students to discuss problems with alcohol, tobacco, or other drugs?
Local (n = 1,522)
State (n = 4,183)
a. No 4.3% (± 1.0%) 4.5% (± 0.8%)b. Yes 75.6 (± 5.1) 77.1 (± 2.7) c. I’m not sure 20.0 (± 5.1) 18.4 (± 2.4)
141. How good is your school at educating you about
HIV/AIDS? Local
(n = 1,349) State
(n = 3,800) a. Very good 18.3% (± 2.9%) 22.7% (± 2.5%)b. Good 31.6 (± 5.3) 34.1 (± 2.7) c. Fair 28.4 (± 4.1) 25.8 (± 2.2) d. Poor 11.2 (± 3.3) 9.3 (± 1.6) e. I have not had HIV/AIDS education at my school 10.5 (± 3.1) 8.1 (± 2.0)
Quality of Life Health-related quality of life is an individual’s or group’s perceived physical and mental health over time. At the individual level it involves a person’s health and health-related conditions; at the community level it involves conditions that influence people’s health. This section contains the results of the items related to individual quality of life.
142. There are adults in my life who really care about me. Local
(n = 1,326) State
(n = 3,767) a. 0 not at all true 2.4% (± 0.8%) 2.3% (± 0.4%)b. 1 1.7 (± 0.6) 1.9 (± 0.4) c. 2 2.0 (± 0.6) 2.2 (± 0.4) d. 3 1.7 (± 1.0) 1.8 (± 0.4) e. 4 1.9 (± 0.8) 1.6 (± 0.4) f. 5 3.3 (± 1.2) 2.9 (± 0.6) g. 6 1.5 (± 0.6) 2.0 (± 0.4) h. 7 3.4 (± 0.8) 3.5 (± 0.6) i. 8 3.5 (± 1.4) 4.1 (± 0.8) j. 9 5.3 (± 1.0) 5.5 (± 0.8) k. 10 completely true 73.3 (± 2.5) 72.2 (± 1.6)
Healthy Youth Survey 2004 Survey Results 24 RMC Research Corporation Portland, OR See page 1 for a key to the notes (A, B, C, †)
Pierce County Grade 8
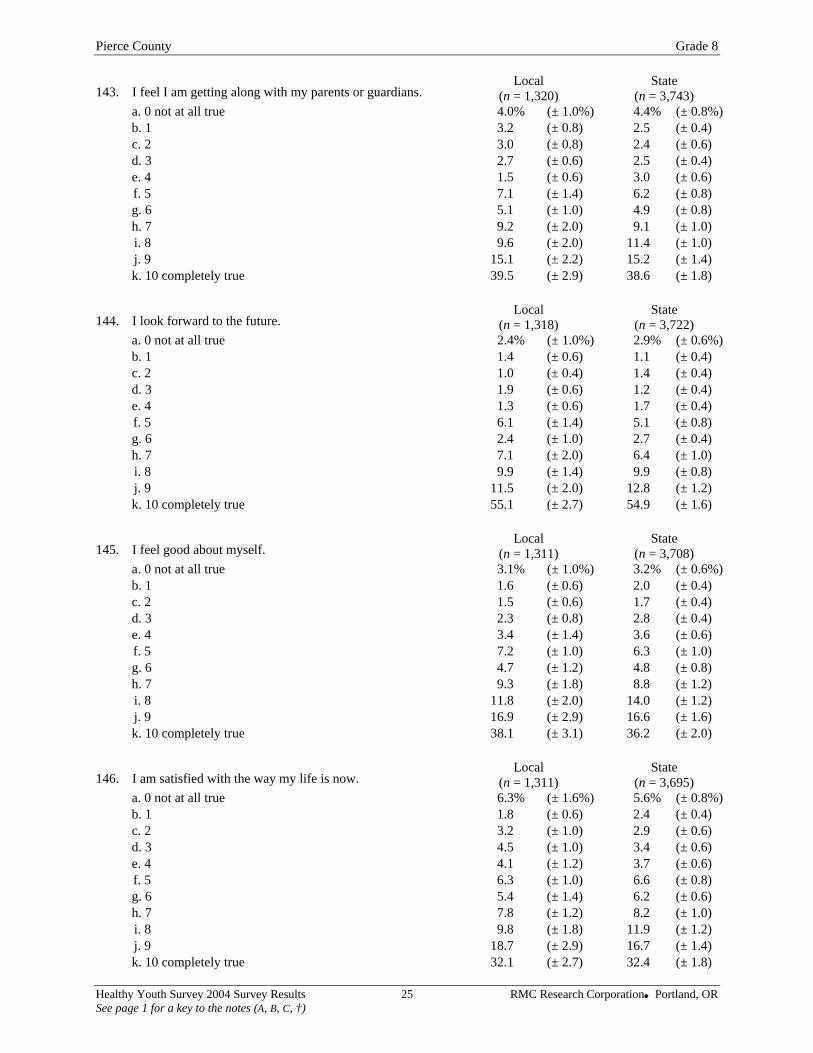
143. I feel I am getting along with my parents or guardians. Local
(n = 1,320) State
(n = 3,743) a. 0 not at all true 4.0% (± 1.0%) 4.4% (± 0.8%)b. 1 3.2 (± 0.8) 2.5 (± 0.4) c. 2 3.0 (± 0.8) 2.4 (± 0.6) d. 3 2.7 (± 0.6) 2.5 (± 0.4) e. 4 1.5 (± 0.6) 3.0 (± 0.6) f. 5 7.1 (± 1.4) 6.2 (± 0.8) g. 6 5.1 (± 1.0) 4.9 (± 0.8) h. 7 9.2 (± 2.0) 9.1 (± 1.0) i. 8 9.6 (± 2.0) 11.4 (± 1.0) j. 9 15.1 (± 2.2) 15.2 (± 1.4) k. 10 completely true 39.5 (± 2.9) 38.6 (± 1.8)
144. I look forward to the future. Local
(n = 1,318) State
(n = 3,722) a. 0 not at all true 2.4% (± 1.0%) 2.9% (± 0.6%)b. 1 1.4 (± 0.6) 1.1 (± 0.4) c. 2 1.0 (± 0.4) 1.4 (± 0.4) d. 3 1.9 (± 0.6) 1.2 (± 0.4) e. 4 1.3 (± 0.6) 1.7 (± 0.4) f. 5 6.1 (± 1.4) 5.1 (± 0.8) g. 6 2.4 (± 1.0) 2.7 (± 0.4) h. 7 7.1 (± 2.0) 6.4 (± 1.0) i. 8 9.9 (± 1.4) 9.9 (± 0.8) j. 9 11.5 (± 2.0) 12.8 (± 1.2) k. 10 completely true 55.1 (± 2.7) 54.9 (± 1.6)
145. I feel good about myself. Local
(n = 1,311) State
(n = 3,708) a. 0 not at all true 3.1% (± 1.0%) 3.2% (± 0.6%)b. 1 1.6 (± 0.6) 2.0 (± 0.4) c. 2 1.5 (± 0.6) 1.7 (± 0.4) d. 3 2.3 (± 0.8) 2.8 (± 0.4) e. 4 3.4 (± 1.4) 3.6 (± 0.6) f. 5 7.2 (± 1.0) 6.3 (± 1.0) g. 6 4.7 (± 1.2) 4.8 (± 0.8) h. 7 9.3 (± 1.8) 8.8 (± 1.2) i. 8 11.8 (± 2.0) 14.0 (± 1.2) j. 9 16.9 (± 2.9) 16.6 (± 1.6) k. 10 completely true 38.1 (± 3.1) 36.2 (± 2.0)
146. I am satisfied with the way my life is now. Local
(n = 1,311) State
(n = 3,695) a. 0 not at all true 6.3% (± 1.6%) 5.6% (± 0.8%)b. 1 1.8 (± 0.6) 2.4 (± 0.4) c. 2 3.2 (± 1.0) 2.9 (± 0.6) d. 3 4.5 (± 1.0) 3.4 (± 0.6) e. 4 4.1 (± 1.2) 3.7 (± 0.6) f. 5 6.3 (± 1.0) 6.6 (± 0.8) g. 6 5.4 (± 1.4) 6.2 (± 0.6) h. 7 7.8 (± 1.2) 8.2 (± 1.0) i. 8 9.8 (± 1.8) 11.9 (± 1.2) j. 9 18.7 (± 2.9) 16.7 (± 1.4) k. 10 completely true 32.1 (± 2.7) 32.4 (± 1.8)
Healthy Youth Survey 2004 Survey Results 25 RMC Research Corporation Portland, OR See page 1 for a key to the notes (A, B, C, †)
Pierce County Grade 8
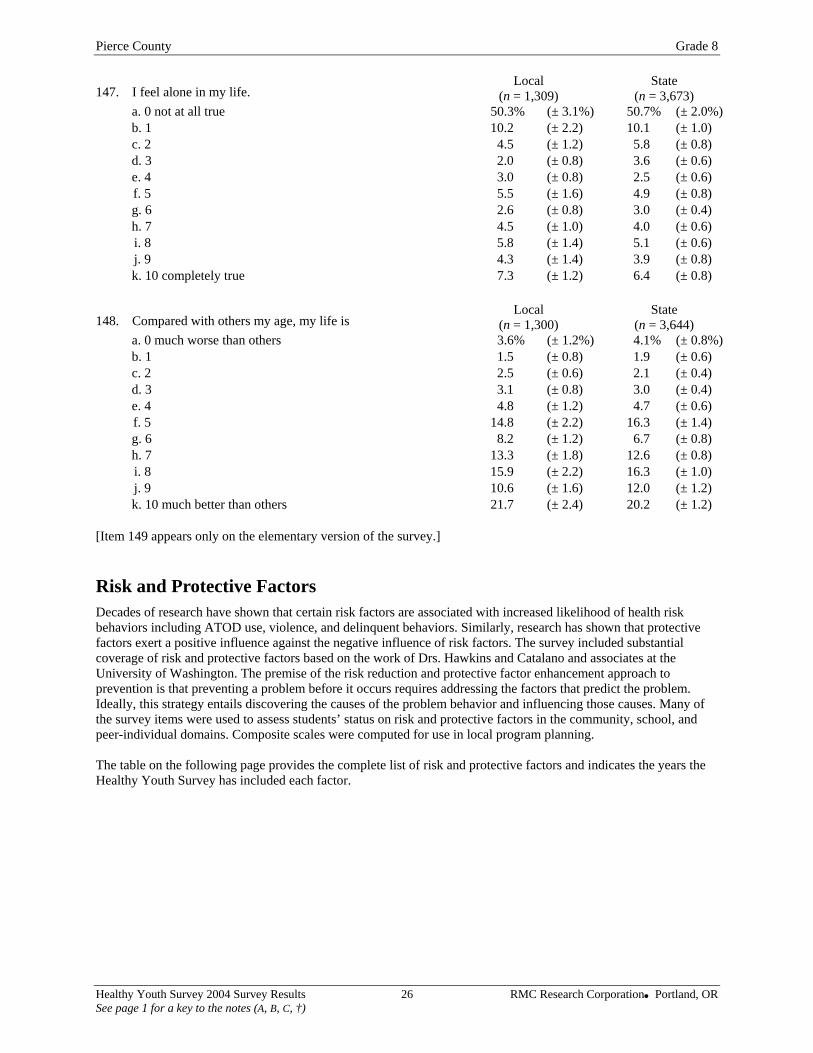
147. I feel alone in my life. Local
(n = 1,309) State
(n = 3,673) a. 0 not at all true 50.3% (± 3.1%) 50.7% (± 2.0%)b. 1 10.2 (± 2.2) 10.1 (± 1.0) c. 2 4.5 (± 1.2) 5.8 (± 0.8) d. 3 2.0 (± 0.8) 3.6 (± 0.6) e. 4 3.0 (± 0.8) 2.5 (± 0.6) f. 5 5.5 (± 1.6) 4.9 (± 0.8) g. 6 2.6 (± 0.8) 3.0 (± 0.4) h. 7 4.5 (± 1.0) 4.0 (± 0.6) i. 8 5.8 (± 1.4) 5.1 (± 0.6) j. 9 4.3 (± 1.4) 3.9 (± 0.8) k. 10 completely true 7.3 (± 1.2) 6.4 (± 0.8)
148. Compared with others my age, my life is Local
(n = 1,300) State
(n = 3,644) a. 0 much worse than others 3.6% (± 1.2%) 4.1% (± 0.8%)b. 1 1.5 (± 0.8) 1.9 (± 0.6) c. 2 2.5 (± 0.6) 2.1 (± 0.4) d. 3 3.1 (± 0.8) 3.0 (± 0.4) e. 4 4.8 (± 1.2) 4.7 (± 0.6) f. 5 14.8 (± 2.2) 16.3 (± 1.4) g. 6 8.2 (± 1.2) 6.7 (± 0.8) h. 7 13.3 (± 1.8) 12.6 (± 0.8) i. 8 15.9 (± 2.2) 16.3 (± 1.0) j. 9 10.6 (± 1.6) 12.0 (± 1.2) k. 10 much better than others 21.7 (± 2.4) 20.2 (± 1.2)
[Item 149 appears only on the elementary version of the survey.]
Risk and Protective Factors Decades of research have shown that certain risk factors are associated with increased likelihood of health risk behaviors including ATOD use, violence, and delinquent behaviors. Similarly, research has shown that protective factors exert a positive influence against the negative influence of risk factors. The survey included substantial coverage of risk and protective factors based on the work of Drs. Hawkins and Catalano and associates at the University of Washington. The premise of the risk reduction and protective factor enhancement approach to prevention is that preventing a problem before it occurs requires addressing the factors that predict the problem. Ideally, this strategy entails discovering the causes of the problem behavior and influencing those causes. Many of the survey items were used to assess students’ status on risk and protective factors in the community, school, and peer-individual domains. Composite scales were computed for use in local program planning. The table on the following page provides the complete list of risk and protective factors and indicates the years the Healthy Youth Survey has included each factor.
Healthy Youth Survey 2004 Survey Results 26 RMC Research Corporation Portland, OR See page 1 for a key to the notes (A, B, C, †)
Pierce County Grade 8
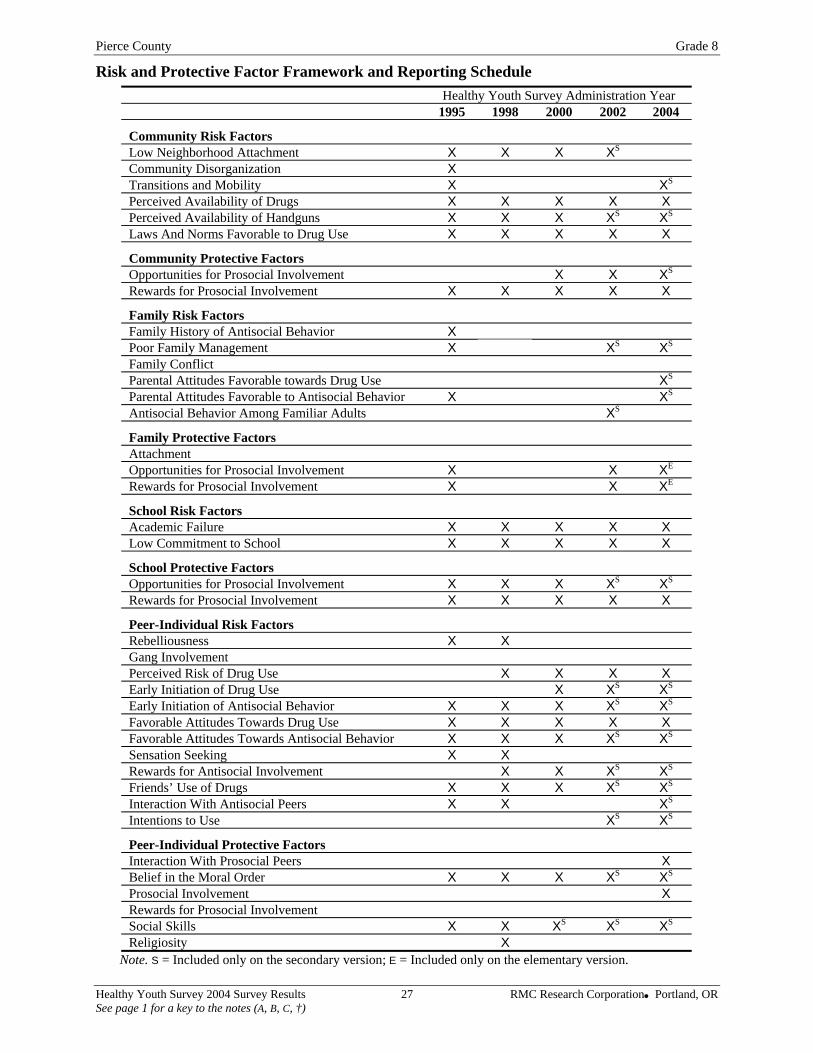
Risk and Protective Factor Framework and Reporting Schedule Healthy Youth Survey Administration Year 1995 1998 2000 2002 2004
Community Risk Factors
Low Neighborhood Attachment X X X XS Community Disorganization X Transitions and Mobility X XS
Perceived Availability of Drugs X X X X X Perceived Availability of Handguns X X X XS XS
Laws And Norms Favorable to Drug Use X X X X X
Community Protective Factors
Opportunities for Prosocial Involvement X X XS
Rewards for Prosocial Involvement X X X X X
Family Risk Factors
Family History of Antisocial Behavior X Poor Family Management X XS XS
Family Conflict Parental Attitudes Favorable towards Drug Use XS
Parental Attitudes Favorable to Antisocial Behavior X XS
Antisocial Behavior Among Familiar Adults XS
Family Protective Factors
Attachment Opportunities for Prosocial Involvement X X XE
Rewards for Prosocial Involvement X X XE
School Risk Factors
Academic Failure X X X X X Low Commitment to School X X X X X
School Protective Factors
Opportunities for Prosocial Involvement X X X XS XS
Rewards for Prosocial Involvement X X X X X
Peer-Individual Risk Factors
Rebelliousness X X Gang Involvement Perceived Risk of Drug Use X X X X Early Initiation of Drug Use X XS XS
Early Initiation of Antisocial Behavior X X X XS XS
Favorable Attitudes Towards Drug Use X X X X X Favorable Attitudes Towards Antisocial Behavior X X X XS XS
Sensation Seeking X X Rewards for Antisocial Involvement X X XS XS
Friends’ Use of Drugs X X X XS XS
Interaction With Antisocial Peers X X XS
Intentions to Use XS XS
Peer-Individual Protective Factors
Interaction With Prosocial Peers X Belief in the Moral Order X X X XS XS
Prosocial Involvement X Rewards for Prosocial Involvement Social Skills X X XS XS XS
Religiosity X Note. S = Included only on the secondary version; E = Included only on the elementary version.
Healthy Youth Survey 2004 Survey Results 27 RMC Research Corporation Portland, OR See page 1 for a key to the notes (A, B, C, †)
Pierce County Grade 8
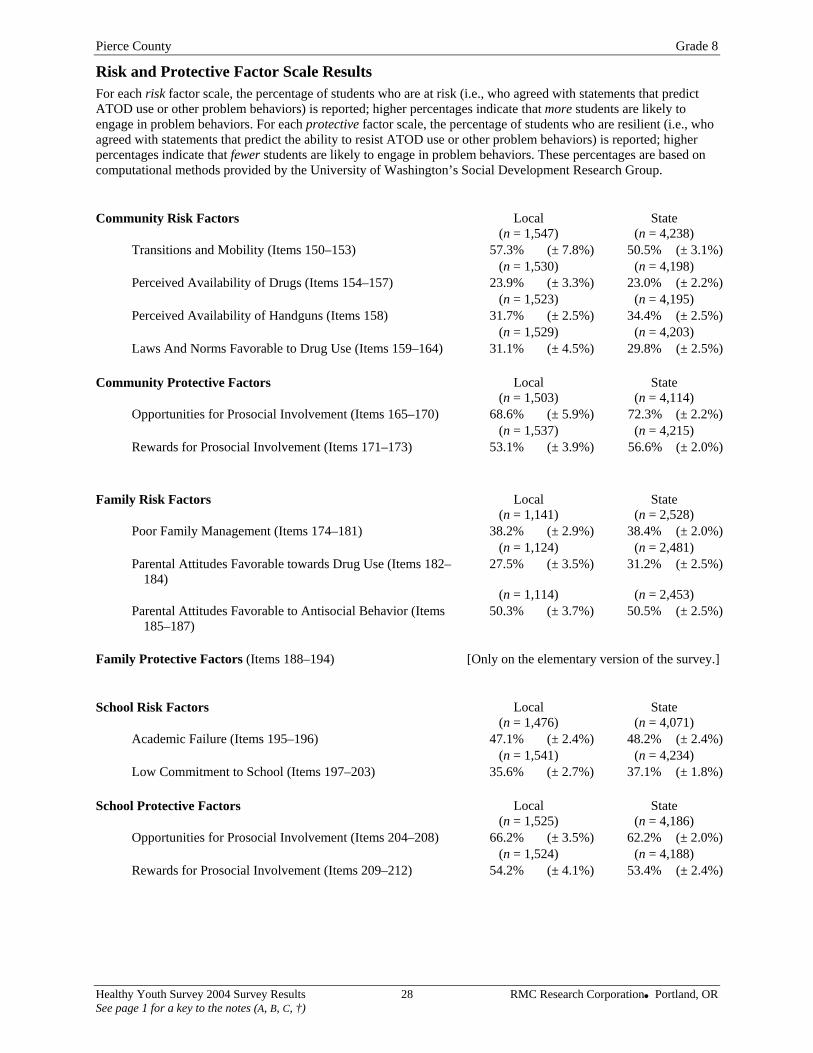
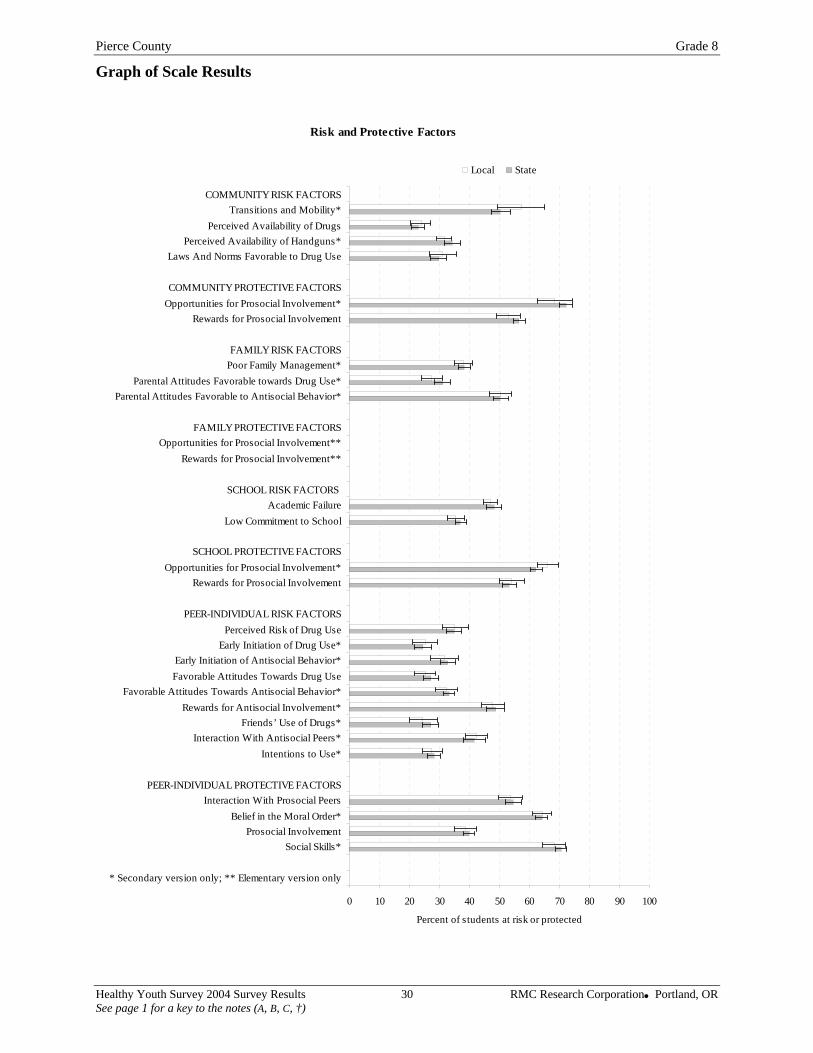
Risk and Protective Factor Scale Results For each risk factor scale, the percentage of students who are at risk (i.e., who agreed with statements that predict ATOD use or other problem behaviors) is reported; higher percentages indicate that more students are likely to engage in problem behaviors. For each protective factor scale, the percentage of students who are resilient (i.e., who agreed with statements that predict the ability to resist ATOD use or other problem behaviors) is reported; higher percentages indicate that fewer students are likely to engage in problem behaviors. These percentages are based on computational methods provided by the University of Washington’s Social Development Research Group.
Community Risk Factors Local State (n = 1,547) (n = 4,238) Transitions and Mobility (Items 150–153) 57.3% (± 7.8%) 50.5% (± 3.1%) (n = 1,530) (n = 4,198) Perceived Availability of Drugs (Items 154–157) 23.9% (± 3.3%) 23.0% (± 2.2%) (n = 1,523) (n = 4,195) Perceived Availability of Handguns (Items 158) 31.7% (± 2.5%) 34.4% (± 2.5%) (n = 1,529) (n = 4,203) Laws And Norms Favorable to Drug Use (Items 159–164) 31.1% (± 4.5%) 29.8% (± 2.5%)
Community Protective Factors Local State (n = 1,503) (n = 4,114) Opportunities for Prosocial Involvement (Items 165–170) 68.6% (± 5.9%) 72.3% (± 2.2%) (n = 1,537) (n = 4,215) Rewards for Prosocial Involvement (Items 171–173) 53.1% (± 3.9%) 56.6% (± 2.0%)
Family Risk Factors Local State (n = 1,141) (n = 2,528) Poor Family Management (Items 174–181) 38.2% (± 2.9%) 38.4% (± 2.0%) (n = 1,124) (n = 2,481) Parental Attitudes Favorable towards Drug Use (Items 182–
184) 27.5% (± 3.5%) 31.2% (± 2.5%)
(n = 1,114) (n = 2,453) Parental Attitudes Favorable to Antisocial Behavior (Items
185–187) 50.3% (± 3.7%) 50.5% (± 2.5%)
Family Protective Factors (Items 188–194) [Only on the elementary version of the survey.]
School Risk Factors Local State (n = 1,476) (n = 4,071) Academic Failure (Items 195–196) 47.1% (± 2.4%) 48.2% (± 2.4%) (n = 1,541) (n = 4,234) Low Commitment to School (Items 197–203) 35.6% (± 2.7%) 37.1% (± 1.8%)
School Protective Factors Local State (n = 1,525) (n = 4,186) Opportunities for Prosocial Involvement (Items 204–208) 66.2% (± 3.5%) 62.2% (± 2.0%) (n = 1,524) (n = 4,188) Rewards for Prosocial Involvement (Items 209–212) 54.2% (± 4.1%) 53.4% (± 2.4%)
Healthy Youth Survey 2004 Survey Results 28 RMC Research Corporation Portland, OR See page 1 for a key to the notes (A, B, C, †)
Pierce County Grade 8
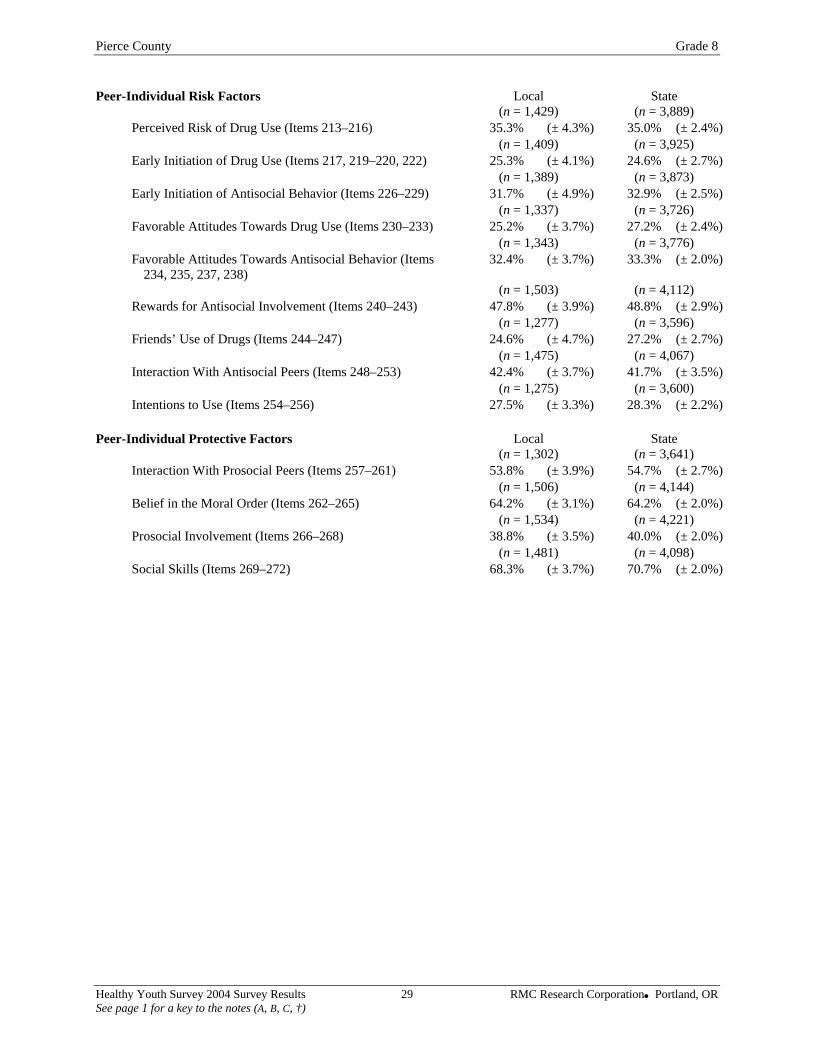
Peer-Individual Risk Factors Local State (n = 1,429) (n = 3,889) Perceived Risk of Drug Use (Items 213–216) 35.3% (± 4.3%) 35.0% (± 2.4%) (n = 1,409) (n = 3,925) Early Initiation of Drug Use (Items 217, 219–220, 222) 25.3% (± 4.1%) 24.6% (± 2.7%) (n = 1,389) (n = 3,873) Early Initiation of Antisocial Behavior (Items 226–229) 31.7% (± 4.9%) 32.9% (± 2.5%) (n = 1,337) (n = 3,726) Favorable Attitudes Towards Drug Use (Items 230–233) 25.2% (± 3.7%) 27.2% (± 2.4%) (n = 1,343) (n = 3,776) Favorable Attitudes Towards Antisocial Behavior (Items
234, 235, 237, 238) 32.4% (± 3.7%) 33.3% (± 2.0%)
(n = 1,503) (n = 4,112) Rewards for Antisocial Involvement (Items 240–243) 47.8% (± 3.9%) 48.8% (± 2.9%) (n = 1,277) (n = 3,596) Friends’ Use of Drugs (Items 244–247) 24.6% (± 4.7%) 27.2% (± 2.7%) (n = 1,475) (n = 4,067) Interaction With Antisocial Peers (Items 248–253) 42.4% (± 3.7%) 41.7% (± 3.5%) (n = 1,275) (n = 3,600) Intentions to Use (Items 254–256) 27.5% (± 3.3%) 28.3% (± 2.2%)
Peer-Individual Protective Factors Local State (n = 1,302) (n = 3,641) Interaction With Prosocial Peers (Items 257–261) 53.8% (± 3.9%) 54.7% (± 2.7%) (n = 1,506) (n = 4,144) Belief in the Moral Order (Items 262–265) 64.2% (± 3.1%) 64.2% (± 2.0%) (n = 1,534) (n = 4,221) Prosocial Involvement (Items 266–268) 38.8% (± 3.5%) 40.0% (± 2.0%) (n = 1,481) (n = 4,098) Social Skills (Items 269–272) 68.3% (± 3.7%) 70.7% (± 2.0%)
Healthy Youth Survey 2004 Survey Results 29 RMC Research Corporation Portland, OR See page 1 for a key to the notes (A, B, C, †)
Pierce County Grade 8
Graph of Scale Results
Risk and Protective Factors
0 10 20 30 40 50 60 70 80 90 100
COMMUNITY RISK FACTORSTransitions and Mobility*
Perceived Availability of DrugsPerceived Availability of Handguns*
Laws And Norms Favorable to Drug Use
COMMUNITY PROTECTIVE FACTORSOpportunities for Prosocial Involvement*
Rewards for Prosocial Involvement
FAMILY RISK FACTORSPoor Family Management*
Parental Attitudes Favorable towards Drug Use*Parental Attitudes Favorable to Antisocial Behavior*
FAMILY PROTECTIVE FACTORSOpportunities for Prosocial Involvement**
Rewards for Prosocial Involvement**
SCHOOL RISK FACTORS Academic Failure
Low Commitment to School
SCHOOL PROTECTIVE FACTORSOpportunities for Prosocial Involvement*
Rewards for Prosocial Involvement
PEER-INDIVIDUAL RISK FACTORSPerceived Risk of Drug Use
Early Initiation of Drug Use*Early Initiation of Antisocial Behavior*Favorable Attitudes Towards Drug Use
Favorable Attitudes Towards Antisocial Behavior*Rewards for Antisocial Involvement*
Friends’ Use of Drugs*Interaction With Antisocial Peers*
Intentions to Use*
PEER-INDIVIDUAL PROTECTIVE FACTORSInteraction With Prosocial Peers
Belief in the Moral Order*Prosocial Involvement
Social Skills*
* Secondary version only; ** Elementary version only
Percent of students at risk or protected
Local State
Healthy Youth Survey 2004 Survey Results 30 RMC Research Corporation Portland, OR See page 1 for a key to the notes (A, B, C, †)
Pierce County Grade 8
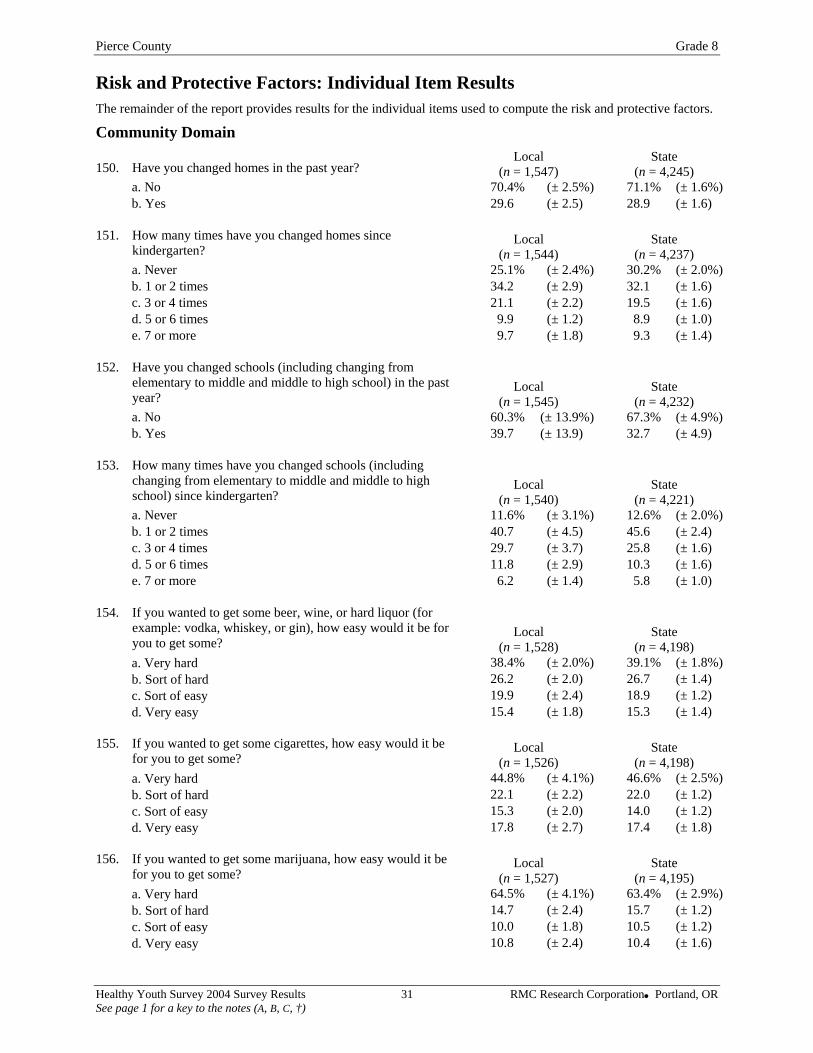
Risk and Protective Factors: Individual Item Results The remainder of the report provides results for the individual items used to compute the risk and protective factors.
Community Domain
150. Have you changed homes in the past year? Local
(n = 1,547) State
(n = 4,245) a. No 70.4% (± 2.5%) 71.1% (± 1.6%)b. Yes 29.6 (± 2.5) 28.9 (± 1.6)
151. How many times have you changed homes since
kindergarten? Local
(n = 1,544) State
(n = 4,237) a. Never 25.1% (± 2.4%) 30.2% (± 2.0%)b. 1 or 2 times 34.2 (± 2.9) 32.1 (± 1.6) c. 3 or 4 times 21.1 (± 2.2) 19.5 (± 1.6) d. 5 or 6 times 9.9 (± 1.2) 8.9 (± 1.0) e. 7 or more 9.7 (± 1.8) 9.3 (± 1.4)
152. Have you changed schools (including changing from
elementary to middle and middle to high school) in the past year?
Local (n = 1,545)
State (n = 4,232)
a. No 60.3% (± 13.9%) 67.3% (± 4.9%)b. Yes 39.7 (± 13.9) 32.7 (± 4.9)
153. How many times have you changed schools (including
changing from elementary to middle and middle to high school) since kindergarten?
Local (n = 1,540)
State (n = 4,221)
a. Never 11.6% (± 3.1%) 12.6% (± 2.0%)b. 1 or 2 times 40.7 (± 4.5) 45.6 (± 2.4) c. 3 or 4 times 29.7 (± 3.7) 25.8 (± 1.6) d. 5 or 6 times 11.8 (± 2.9) 10.3 (± 1.6) e. 7 or more 6.2 (± 1.4) 5.8 (± 1.0)
154. If you wanted to get some beer, wine, or hard liquor (for
example: vodka, whiskey, or gin), how easy would it be for you to get some?
Local (n = 1,528)
State (n = 4,198)
a. Very hard 38.4% (± 2.0%) 39.1% (± 1.8%)b. Sort of hard 26.2 (± 2.0) 26.7 (± 1.4) c. Sort of easy 19.9 (± 2.4) 18.9 (± 1.2) d. Very easy 15.4 (± 1.8) 15.3 (± 1.4)
155. If you wanted to get some cigarettes, how easy would it be
for you to get some? Local
(n = 1,526) State
(n = 4,198) a. Very hard 44.8% (± 4.1%) 46.6% (± 2.5%)b. Sort of hard 22.1 (± 2.2) 22.0 (± 1.2) c. Sort of easy 15.3 (± 2.0) 14.0
(± 2.4)
(± 1.2) d. Very easy 17.8 (± 2.7) 17.4 (± 1.8)
156. If you wanted to get some marijuana, how easy would it be
for you to get some? Local
(n = 1,527) State
(n = 4,195) a. Very hard 64.5% (± 4.1%) 63.4% (± 2.9%)b. Sort of hard 14.7 (± 2.4) 15.7 (± 1.2) c. Sort of easy 10.0 (± 1.8) 10.5 (± 1.2) d. Very easy 10.8 10.4 (± 1.6)
Healthy Youth Survey 2004 Survey Results 31 RMC Research Corporation Portland, OR See page 1 for a key to the notes (A, B, C, †)
Pierce County Grade 8
State (n = 4,224)
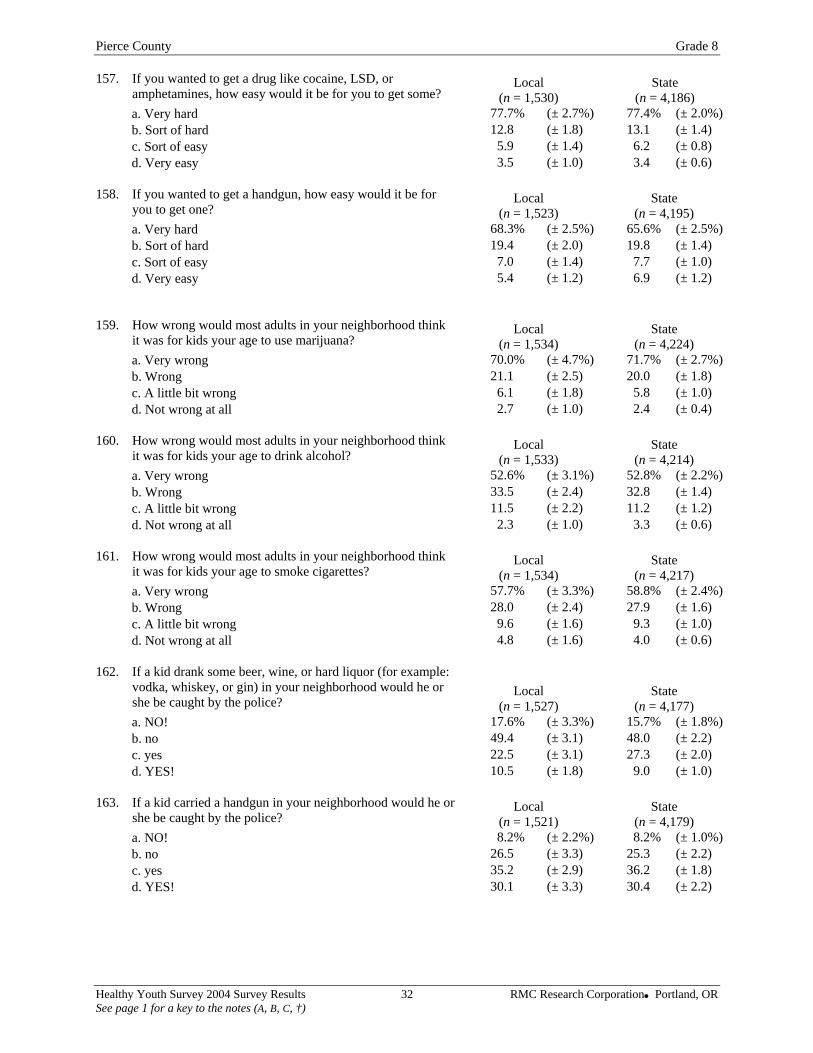
157. If you wanted to get a drug like cocaine, LSD, or amphetamines, how easy would it be for you to get some?
Local (n = 1,530)
State (n = 4,186)
a. Very hard 77.7% (± 2.7%) 77.4% (± 2.0%) b. Sort of hard 12.8 (± 1.8) 13.1 (± 1.4) c. Sort of easy 5.9 (± 1.4) 6.2 (± 0.8) d. Very easy 3.5 (± 1.0) 3.4 (± 0.6)
158. If you wanted to get a handgun, how easy would it be for
you to get one? Local
(n = 1,523) State
(n = 4,195) a. Very hard 68.3% (± 2.5%) 65.6% (± 2.5%)b. Sort of hard 19.4 (± 2.0) 19.8 (± 1.4) c. Sort of easy 7.0 (± 1.4) 7.7 (± 1.0) d. Very easy 5.4 (± 1.2) 6.9 (± 1.2)
159. How wrong would most adults in your neighborhood think
it was for kids your age to use marijuana? Local
(n = 1,534) a. Very wrong 70.0% (± 4.7%) 71.7% (± 2.7%)b. Wrong 21.1 (± 2.5) 20.0 (± 1.8) c. A little bit wrong 6.1 (± 1.8) 5.8 (± 1.0) d. Not wrong at all 2.7 (± 1.0) 2.4 (± 0.4)
160. How wrong would most adults in your neighborhood think
it was for kids your age to drink alcohol? Local
(n = 1,533) State
(n = 4,214) a. Very wrong 52.6% (± 3.1%) 52.8% (± 2.2%)b. Wrong 33.5 (± 2.4) 32.8 (± 1.4) c. A little bit wrong 11.5 (± 2.2) 11.2 (± 1.2) d. Not wrong at all 2.3 (± 1.0) 3.3 (± 0.6)
161. How wrong would most adults in your neighborhood think
it was for kids your age to smoke cigarettes? Local
(n = 1,534) State
(n = 4,217) a. Very wrong 57.7% (± 3.3%) 58.8% (± 2.4%)b. Wrong 28.0 (± 2.4) 27.9 (± 1.6) c. A little bit wrong 9.6 (± 1.6) 9.3 (± 1.0) d. Not wrong at all 4.8 (± 1.6) 4.0 (± 0.6)
162. If a kid drank some beer, wine, or hard liquor (for example:
vodka, whiskey, or gin) in your neighborhood would he or she be caught by the police?
Local (n = 1,527)
State (n = 4,177)
a. NO! 17.6% (± 3.3%) 15.7% (± 1.8%)b. no 49.4 (± 3.1) 48.0 (± 2.2) c. yes 22.5 (± 3.1) 27.3 (± 2.0) d. YES! 10.5 (± 1.8) 9.0 (± 1.0)
163. If a kid carried a handgun in your neighborhood would he or
she be caught by the police? Local
(n = 1,521) State
(n = 4,179) a. NO! 8.2% (± 2.2%) 8.2% (± 1.0%)b. no 26.5 (± 3.3) 25.3 (± 2.2) c. yes 35.2 (± 2.9) 36.2 (± 1.8) d. YES! 30.1 (± 3.3) 30.4 (± 2.2)
Healthy Youth Survey 2004 Survey Results 32 RMC Research Corporation Portland, OR See page 1 for a key to the notes (A, B, C, †)
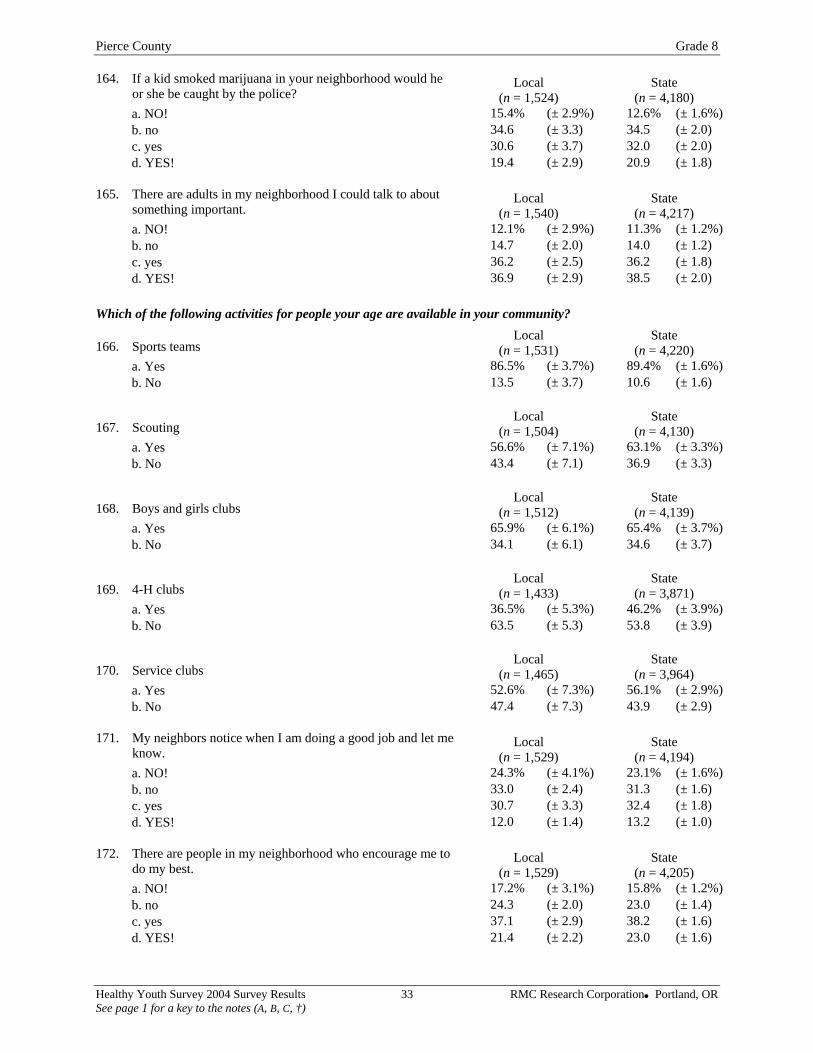
Pierce County Grade 8 164. If a kid smoked marijuana in your neighborhood would he
or she be caught by the police? Local
(n = 1,524) State
(n = 4,180) a. NO! 15.4% (± 2.9%) 12.6% (± 1.6%)b. no 34.6 (± 3.3) 34.5 (± 2.0) c. yes 30.6 (± 3.7) 32.0 (± 2.0) d. YES! 19.4 (± 2.9) 20.9 (± 1.8)
165. There are adults in my neighborhood I could talk to about
something important. Local
(n = 1,540) State
(n = 4,217) (± 1.2%)(± 1.2) (± 1.8) (± 2.0)
State (n = 4,220)
(± 1.6%)
169. 4-H clubs
a. NO! 12.1% (± 2.9%) 11.3% b. no 14.7 (± 2.0) 14.0 c. yes 36.2 (± 2.5) 36.2 d. YES! 36.9 (± 2.9) 38.5
Which of the following activities for people your age are available in your community?
166. Sports teams Local
(n = 1,531) a. Yes 86.5% (± 3.7%) 89.4% b. No 13.5 (± 3.7) 10.6 (± 1.6)
167. Scouting Local
(n = 1,504) State
(n = 4,130) a. Yes 56.6% (± 7.1%) 63.1% (± 3.3%)b. No 43.4 (± 7.1) 36.9 (± 3.3)
168. Boys and girls clubs Local
(n = 1,512) State
(n = 4,139) a. Yes 65.9% (± 6.1%) 65.4% (± 3.7%)b. No 34.1 (± 6.1) 34.6 (± 3.7)
Local
(n = 1,433) State
(n = 3,871) a. Yes 36.5% (± 5.3%) 46.2% (± 3.9%)b. No 63.5 (± 5.3) 53.8 (± 3.9)
170. Service clubs Local
(n = 1,465) State
(n = 3,964) a. Yes 52.6% (± 7.3%) 56.1% (± 2.9%)b. No 47.4 (± 7.3) 43.9 (± 2.9)
171. My neighbors notice when I am doing a good job and let me
know. Local
(n = 1,529) State
(n = 4,194) a. NO! 24.3% (± 4.1%) 23.1% (± 1.6%)b. no 33.0 (± 2.4) 31.3 (± 1.6) c. yes 30.7 (± 3.3) 32.4 (± 1.8) d. YES! 12.0 (± 1.4) 13.2 (± 1.0)
172. There are people in my neighborhood who encourage me to
do my best. Local
(n = 1,529) State
(n = 4,205) a. NO! 17.2% (± 3.1%) 15.8% (± 1.2%)b. no 24.3 (± 2.0) 23.0 (± 1.4) c. yes 37.1 (± 2.9) 38.2 (± 1.6) d. YES! 21.4 (± 2.2) 23.0 (± 1.6)
Healthy Youth Survey 2004 Survey Results 33 RMC Research Corporation Portland, OR See page 1 for a key to the notes (A, B, C, †)
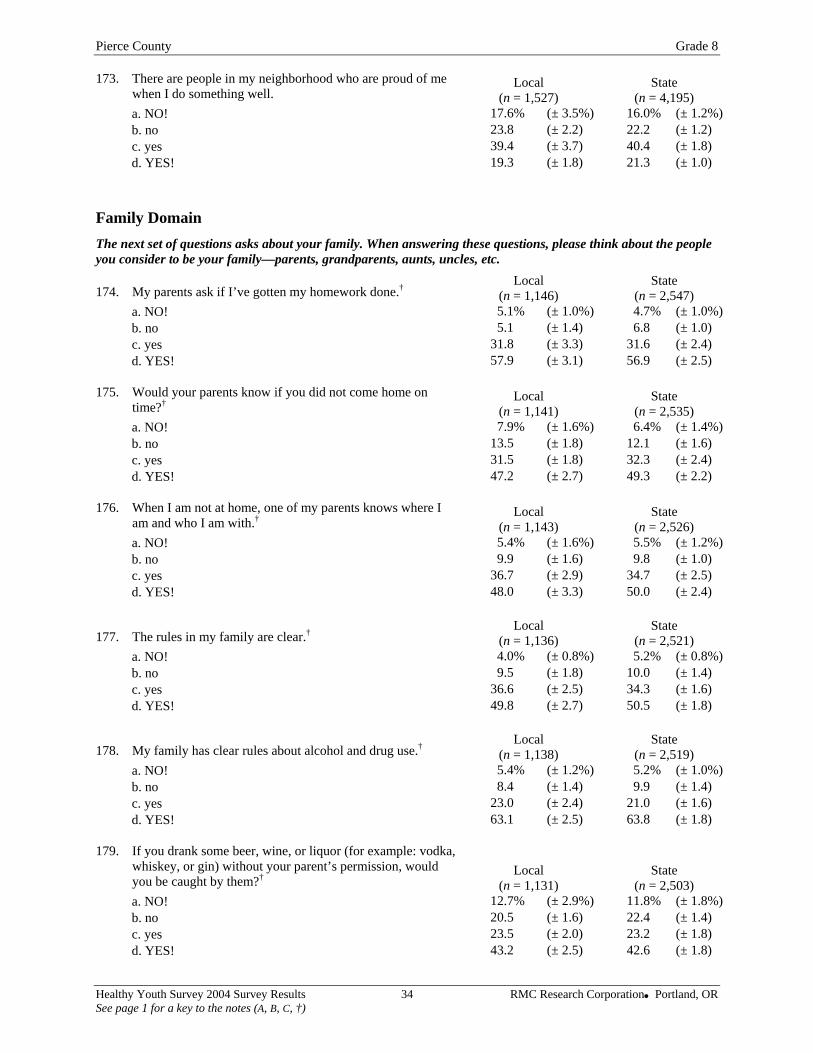
Pierce County Grade 8 173. There are people in my neighborhood who are proud of me
when I do something well. Local
(n = 1,527) State
(n = 4,195) a. NO! 17.6% (± 3.5%) 16.0% (± 1.2%)b. no 23.8 (± 2.2) 22.2 (± 1.2) c. yes 39.4 (± 3.7) 40.4 (± 1.8) d. YES! 19.3 (± 1.8) 21.3 (± 1.0)
Family Domain The next set of questions asks about your family. When answering these questions, please think about the people you consider to be your family—parents, grandparents, aunts, uncles, etc.
174. My parents ask if I’ve gotten my homework done.†Local
(n = 1,146) State
(n = 2,547) a. NO! 5.1% (± 1.0%) 4.7% (± 1.0%)b. no 5.1 (± 1.4) 6.8 (± 1.0) c. yes 31.8 (± 3.3) 31.6 (± 2.4) d. YES! 57.9 (± 3.1) 56.9 (± 2.5)
5.5% 9.8
34.7
12.7%
d. YES!
175. Would your parents know if you did not come home on time?† Local
(n = 1,141) State
(n = 2,535) a. NO! 7.9% (± 1.6%) 6.4% (± 1.4%)b. no 13.5 (± 1.8) 12.1 (± 1.6) c. yes 31.5 (± 1.8) 32.3 (± 2.4) d. YES! 47.2 (± 2.7) 49.3 (± 2.2)
176. When I am not at home, one of my parents knows where I am and who I am with.†
Local (n = 1,143)
State (n = 2,526)
a. NO! 5.4% (± 1.6%) (± 1.2%)b. no 9.9 (± 1.6) (± 1.0) c. yes 36.7 (± 2.9) (± 2.5) d. YES! 48.0 (± 3.3) 50.0 (± 2.4)
177. The rules in my family are clear.†Local
(n = 1,136) State
(n = 2,521) a. NO! 4.0% (± 0.8%) 5.2% (± 0.8%)b. no 9.5 (± 1.8) 10.0 (± 1.4) c. yes 36.6 (± 2.5) 34.3 (± 1.6) d. YES! 49.8 (± 2.7) 50.5 (± 1.8)
178. My family has clear rules about alcohol and drug use.†Local
(n = 1,138) State
(n = 2,519) a. NO! 5.4% (± 1.2%) 5.2% (± 1.0%)b. no 8.4 (± 1.4) 9.9 (± 1.4) c. yes 23.0 (± 2.4) 21.0 (± 1.6) d. YES! 63.1 (± 2.5) 63.8 (± 1.8)
179. If you drank some beer, wine, or liquor (for example: vodka, whiskey, or gin) without your parent’s permission, would you be caught by them?† Local
(n = 1,131) State
(n = 2,503) a. NO! (± 2.9%) 11.8% (± 1.8%)b. no 20.5 (± 1.6) 22.4 (± 1.4) c. yes 23.5 (± 2.0) 23.2 (± 1.8)
43.2 (± 2.5) 42.6 (± 1.8)
Healthy Youth Survey 2004 Survey Results 34 RMC Research Corporation Portland, OR See page 1 for a key to the notes (A, B, C, †)
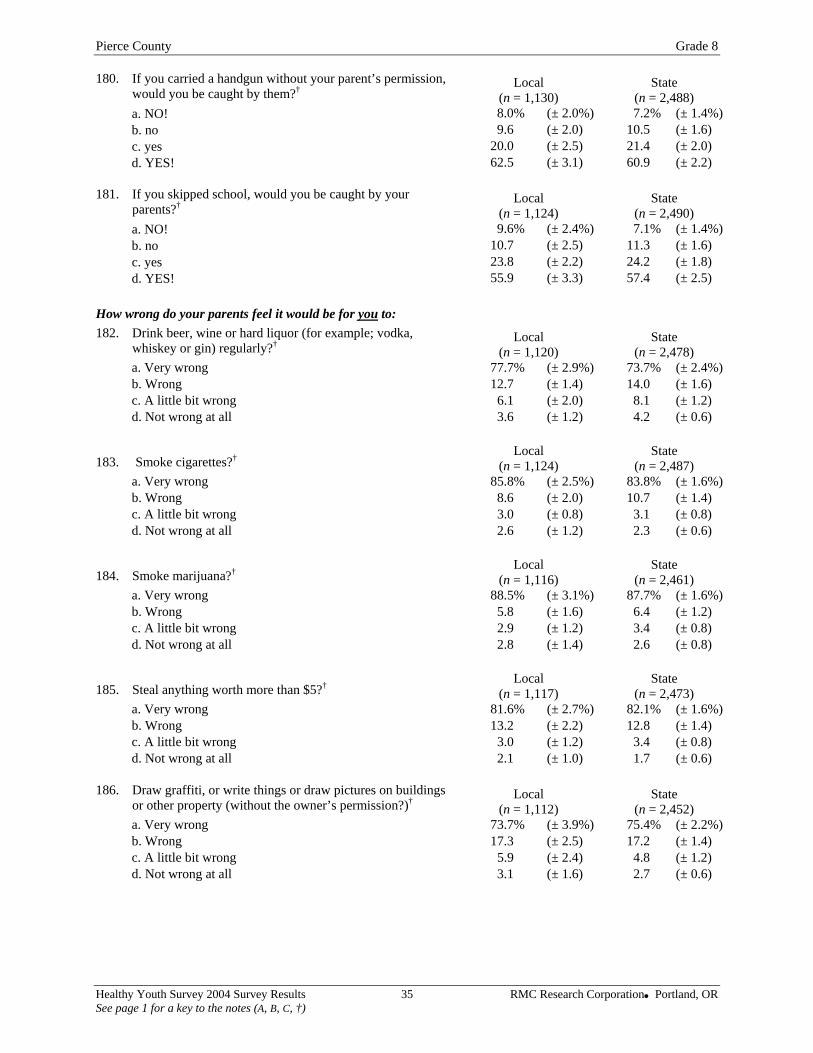
Pierce County Grade 8
180. If you carried a handgun without your parent’s permission, would you be caught by them?† Local
(n = 1,130) State
(n = 2,488) a. NO! 8.0% (± 2.0%) 7.2% (± 1.4%)b. no 9.6 (± 2.0) 10.5 (± 1.6) c. yes 20.0 (± 2.5) 21.4 (± 2.0) d. YES! 62.5 (± 3.1) 60.9 (± 2.2)
181. If you skipped school, would you be caught by your parents?† Local
(n = 1,124) State
(n = 2,490) a. NO! 9.6% (± 2.4%) 7.1% (± 1.4%)b. no 10.7 (± 2.5) 11.3 (± 1.6) c. yes 23.8 (± 2.2) 24.2 (± 1.8) d. YES! 55.9 (± 3.3) 57.4 (± 2.5)
How wrong do your parents feel it would be for you to: 182. Drink beer, wine or hard liquor (for example; vodka,
whiskey or gin) regularly?† Local (n = 1,120)
State (n = 2,478)
a. Very wrong 77.7% (± 2.9%) 73.7% (± 2.4%)b. Wrong 12.7 (± 1.4) 14.0 (± 1.6) c. A little bit wrong 6.1 (± 2.0) 8.1 (± 1.2) d. Not wrong at all 3.6 (± 1.2) 4.2 (± 0.6)
a. Very wrong b. Wrong
3.0 2.6
184. Smoke marijuana?†
(± 1.2)
82.1%
(± 1.0)
183. Smoke cigarettes?† Local (n = 1,124)
State (n = 2,487)
85.8% (± 2.5%) 83.8% (± 1.6%)8.6 (± 2.0) 10.7 (± 1.4)
c. A little bit wrong (± 0.8) 3.1 (± 0.8) d. Not wrong at all (± 1.2) 2.3 (± 0.6)
Local (n = 1,116)
State (n = 2,461)
a. Very wrong 88.5% (± 3.1%) 87.7% (± 1.6%)b. Wrong 5.8 (± 1.6) 6.4 (± 1.2) c. A little bit wrong 2.9 3.4 (± 0.8) d. Not wrong at all 2.8 (± 1.4) 2.6 (± 0.8)
185. Steal anything worth more than $5?† Local (n = 1,117)
State (n = 2,473)
a. Very wrong 81.6% (± 2.7%) (± 1.6%)b. Wrong 13.2 (± 2.2) 12.8 (± 1.4) c. A little bit wrong 3.0 (± 1.2) 3.4 (± 0.8) d. Not wrong at all 2.1 1.7 (± 0.6)
186. Draw graffiti, or write things or draw pictures on buildings or other property (without the owner’s permission?)† Local
(n = 1,112) State
(n = 2,452) a. Very wrong 73.7% (± 3.9%) 75.4% (± 2.2%)b. Wrong 17.3 (± 2.5) 17.2 (± 1.4) c. A little bit wrong 5.9 (± 2.4) 4.8 (± 1.2) d. Not wrong at all 3.1 (± 1.6) 2.7 (± 0.6)
Healthy Youth Survey 2004 Survey Results 35 RMC Research Corporation Portland, OR See page 1 for a key to the notes (A, B, C, †)
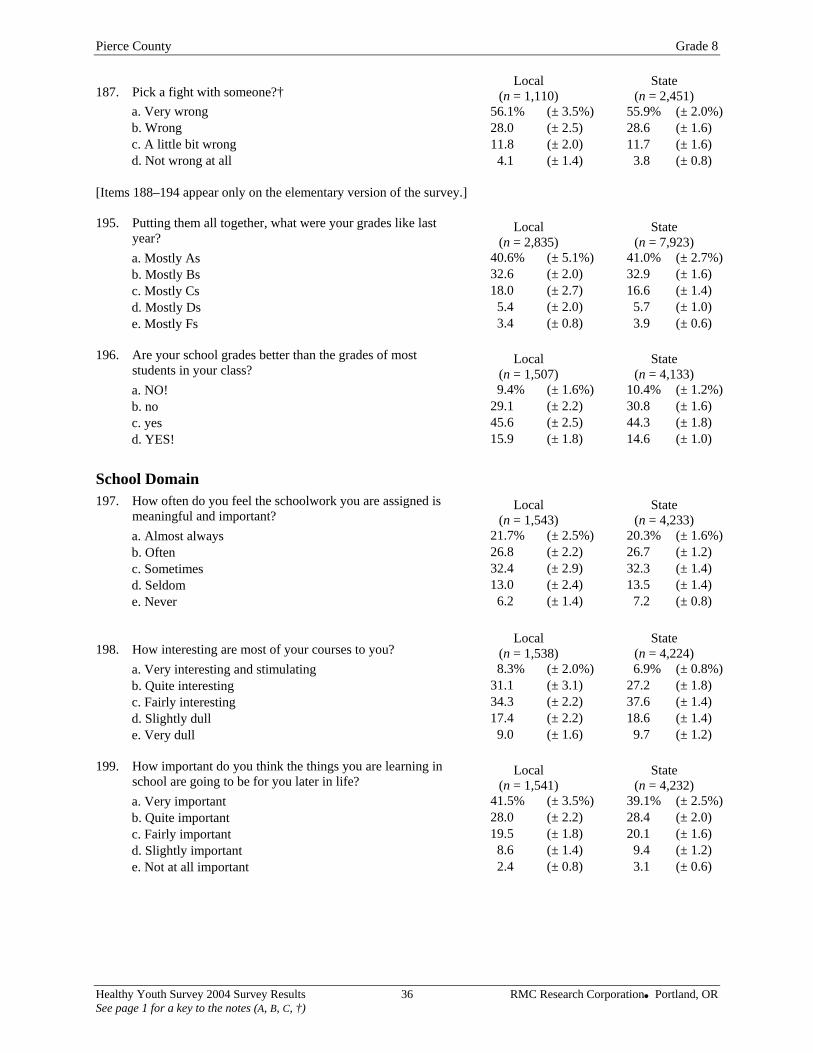
Pierce County Grade 8
187. Pick a fight with someone?† Local
(n = 1,110) State
(n = 2,451) a. Very wrong 56.1% (± 3.5%) 55.9% (± 2.0%)b. Wrong 28.0 (± 2.5) 28.6 (± 1.6) c. A little bit wrong 11.8 (± 2.0) 11.7 (± 1.6) d. Not wrong at all 4.1 (± 1.4) 3.8 (± 0.8)
[Items 188–194 appear only on the elementary version of the survey.] 195. Putting them all together, what were your grades like last
year? Local
(n = 2,835) State
(n = 7,923) a. Mostly As 40.6% (± 5.1%) 41.0% (± 2.7%)b. Mostly Bs 32.6 (± 2.0) 32.9 (± 1.6) c. Mostly Cs 18.0 (± 2.7) 16.6
5.7 3.9
State (n = 4,133)
10.4% 30.8 44.3 14.6
Local (n = 1,543)
20.3%
Local (n = 1,538)
(± 1.4) d. Mostly Ds 5.4 (± 2.0) (± 1.0) e. Mostly Fs 3.4 (± 0.8) (± 0.6)
196. Are your school grades better than the grades of most
students in your class? Local
(n = 1,507) a. NO! 9.4% (± 1.6%) (± 1.2%)b. no 29.1 (± 2.2) (± 1.6) c. yes 45.6 (± 2.5) (± 1.8) d. YES! 15.9 (± 1.8) (± 1.0)
School Domain 197. How often do you feel the schoolwork you are assigned is
meaningful and important? State
(n = 4,233) a. Almost always 21.7% (± 2.5%) (± 1.6%)b. Often 26.8 (± 2.2) 26.7 (± 1.2) c. Sometimes 32.4 (± 2.9) 32.3 (± 1.4) d. Seldom 13.0 (± 2.4) 13.5 (± 1.4) e. Never 6.2 (± 1.4) 7.2 (± 0.8)
198. How interesting are most of your courses to you? State
(n = 4,224) a. Very interesting and stimulating 8.3% (± 2.0%) 6.9% (± 0.8%)b. Quite interesting 31.1 (± 3.1) 27.2 (± 1.8) c. Fairly interesting 34.3 (± 2.2) 37.6 (± 1.4) d. Slightly dull 17.4 (± 2.2) 18.6 (± 1.4) e. Very dull 9.0 (± 1.6) 9.7 (± 1.2)
199. How important do you think the things you are learning in
school are going to be for you later in life? Local
(n = 1,541) State
(n = 4,232) a. Very important 41.5% (± 3.5%) 39.1% (± 2.5%)b. Quite important 28.0 (± 2.2) 28.4 (± 2.0) c. Fairly important 19.5 (± 1.8) 20.1 (± 1.6) d. Slightly important 8.6 (± 1.4) 9.4 (± 1.2) e. Not at all important 2.4 (± 0.8) 3.1 (± 0.6)
Healthy Youth Survey 2004 Survey Results 36 RMC Research Corporation Portland, OR See page 1 for a key to the notes (A, B, C, †)
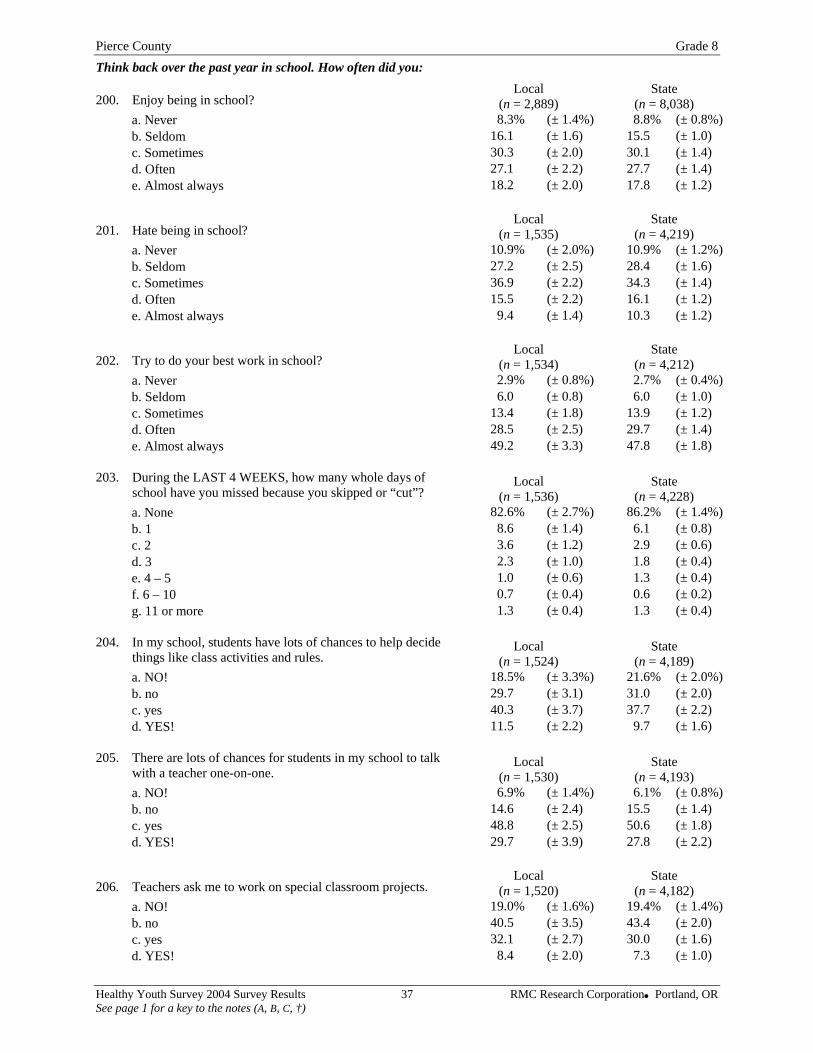
Pierce County Grade 8 Think back over the past year in school. How often did you:
200. Enjoy being in school? Local
(n = 2,889) State
(n = 8,038) a. Never 8.3% (± 1.4%) 8.8% (± 0.8%)b. Seldom 16.1 (± 1.6) 15.5 (± 1.0) c. Sometimes 30.3 (± 2.0) 30.1 (± 1.4) d. Often 27.1 (± 2.2) 27.7 (± 1.4) e. Almost always 18.2 (± 2.0) 17.8 (± 1.2)
201. Hate being in school? Local
(n = 1,535) State
(n = 4,219) a. Never 10.9% (± 2.0%) 10.9% (± 1.2%)b. Seldom 27.2 (± 2.5) 28.4 (± 1.6) c. Sometimes 36.9 (± 2.2) 34.3 (± 1.4) d. Often 15.5 (± 2.2) 16.1 (± 1.2) e. Almost always 9.4 (± 1.4) 10.3 (± 1.2)
202. Try to do your best work in school? Local
(n = 1,534) State
(n = 4,212) a. Never 2.9% (± 0.8%) 2.7% (± 0.4%)b. Seldom 6.0 (± 0.8) 6.0 (± 1.0) c. Sometimes 13.4 (± 1.8) 13.9 (± 1.2) d. Often 28.5 (± 2.5) 29.7 (± 1.4) e. Almost always 49.2 (± 3.3) 47.8 (± 1.8)
203. During the LAST 4 WEEKS, how many whole days of
school have you missed because you skipped or “cut”? Local
(n = 1,536) State
(n = 4,228) a. None 82.6% (± 2.7%) 86.2% (± 1.4%)b. 1 8.6 (± 1.4) 6.1 (± 0.8)
b. no c. yes
c. 2 3.6 (± 1.2) 2.9 (± 0.6) d. 3 2.3 (± 1.0) 1.8 (± 0.4) e. 4 – 5 1.0 (± 0.6) 1.3 (± 0.4) f. 6 – 10 0.7 (± 0.4) 0.6 (± 0.2) g. 11 or more 1.3 (± 0.4) 1.3 (± 0.4)
204. In my school, students have lots of chances to help decide
things like class activities and rules. Local
(n = 1,524) State
(n = 4,189) a. NO! 18.5% (± 3.3%) 21.6% (± 2.0%)b. no 29.7 (± 3.1) 31.0 (± 2.0) c. yes 40.3 (± 3.7) 37.7 (± 2.2) d. YES! 11.5 (± 2.2) 9.7 (± 1.6)
205. There are lots of chances for students in my school to talk
with a teacher one-on-one. Local
(n = 1,530) State
(n = 4,193) a. NO! 6.9% (± 1.4%) 6.1% (± 0.8%)
14.6 (± 2.4) 15.5 (± 1.4) 48.8 (± 2.5) 50.6 (± 1.8)
d. YES! 29.7 (± 3.9) 27.8 (± 2.2)
206. Teachers ask me to work on special classroom projects. Local
(n = 1,520) State
(n = 4,182) a. NO! 19.0% (± 1.6%) 19.4% (± 1.4%)b. no 40.5 (± 3.5) 43.4 (± 2.0) c. yes 32.1 (± 2.7) 30.0 (± 1.6) d. YES! 8.4 (± 2.0) 7.3 (± 1.0)
Healthy Youth Survey 2004 Survey Results 37 RMC Research Corporation Portland, OR See page 1 for a key to the notes (A, B, C, †)
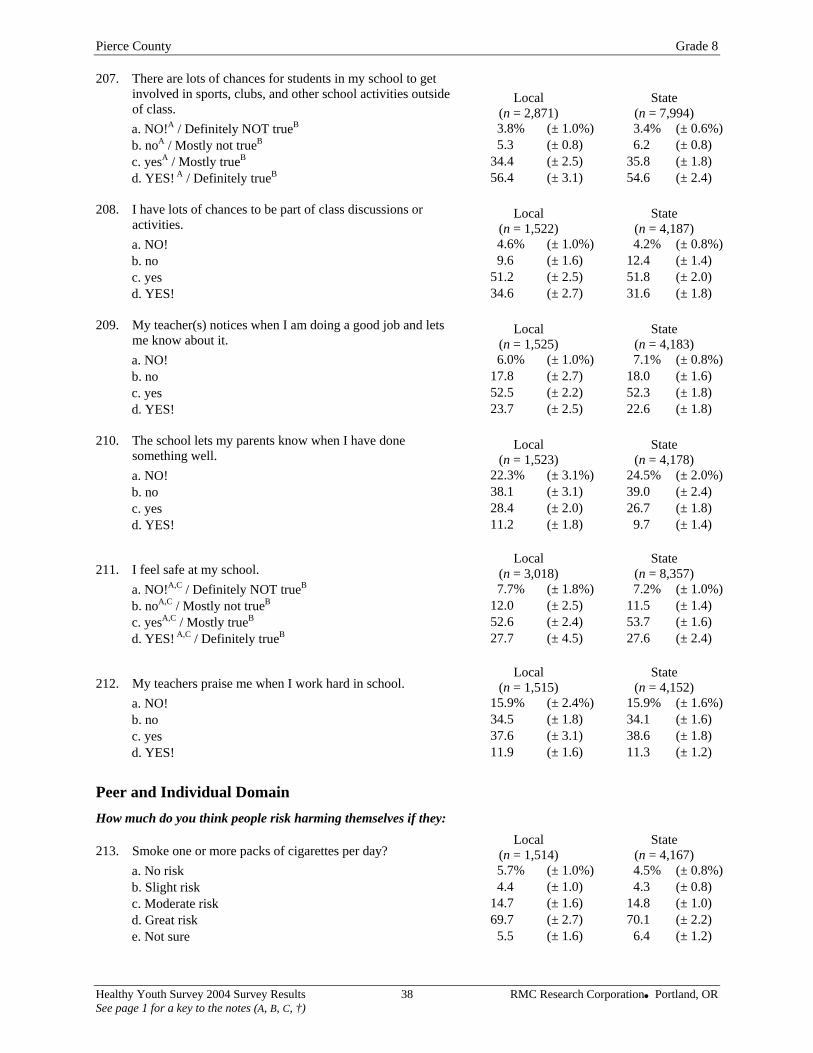
Pierce County Grade 8 207. There are lots of chances for students in my school to get
involved in sports, clubs, and other school activities outside of class.
Local (n = 2,871)
State (n = 7,994)
a. NO!A / Definitely NOT trueB 3.8% (± 1.0%) 3.4% (± 0.6%)b. noA / Mostly not trueB
a. NO! b. no c. yes
210. The school lets my parents know when I have done something well.
(± 1.6)
How much do you think people risk harming themselves if they:
5.3 (± 0.8) 6.2 (± 0.8) c. yesA / Mostly trueB 34.4 (± 2.5) 35.8 (± 1.8) d. YES! A / Definitely trueB 56.4 (± 3.1) 54.6 (± 2.4)
208. I have lots of chances to be part of class discussions or
activities. Local
(n = 1,522) State
(n = 4,187) 4.6% (± 1.0%) 4.2% (± 0.8%)9.6 (± 1.6) 12.4 (± 1.4)
51.2 (± 2.5) 51.8 (± 2.0) d. YES! 34.6 (± 2.7) 31.6 (± 1.8)
209. My teacher(s) notices when I am doing a good job and lets
me know about it. Local
(n = 1,525) State
(n = 4,183) a. NO! 6.0% (± 1.0%) 7.1% (± 0.8%)b. no 17.8 (± 2.7) 18.0 (± 1.6) c. yes 52.5 (± 2.2) 52.3 (± 1.8) d. YES! 23.7 (± 2.5) 22.6 (± 1.8)
Local
(n = 1,523) State
(n = 4,178) a. NO! 22.3% (± 3.1%) 24.5% (± 2.0%)b. no 38.1 (± 3.1) 39.0 (± 2.4) c. yes 28.4 (± 2.0) 26.7 (± 1.8) d. YES! 11.2 (± 1.8) 9.7 (± 1.4)
211. I feel safe at my school. Local
(n = 3,018) State
(n = 8,357) a. NO!A,C / Definitely NOT trueB 7.7% (± 1.8%) 7.2% (± 1.0%)b. noA,C / Mostly not trueB 12.0 (± 2.5) 11.5 (± 1.4) c. yesA,C / Mostly trueB 52.6 (± 2.4) 53.7 (± 1.6) d. YES! A,C / Definitely trueB 27.7 (± 4.5) 27.6 (± 2.4)
212. My teachers praise me when I work hard in school. Local
(n = 1,515) State
(n = 4,152) a. NO! 15.9% (± 2.4%) 15.9% (± 1.6%)b. no 34.5 (± 1.8) 34.1 (± 1.6) c. yes 37.6 (± 3.1) 38.6 (± 1.8) d. YES! 11.9 11.3 (± 1.2)
Peer and Individual Domain
213. Smoke one or more packs of cigarettes per day? Local
(n = 1,514) State
(n = 4,167) a. No risk 5.7% (± 1.0%) 4.5% (± 0.8%)b. Slight risk 4.4 (± 1.0) 4.3 (± 0.8) c. Moderate risk 14.7 (± 1.6) 14.8 (± 1.0) d. Great risk 69.7 (± 2.7) 70.1 (± 2.2) e. Not sure 5.5 (± 1.6) 6.4 (± 1.2)
Healthy Youth Survey 2004 Survey Results 38 RMC Research Corporation Portland, OR See page 1 for a key to the notes (A, B, C, †)
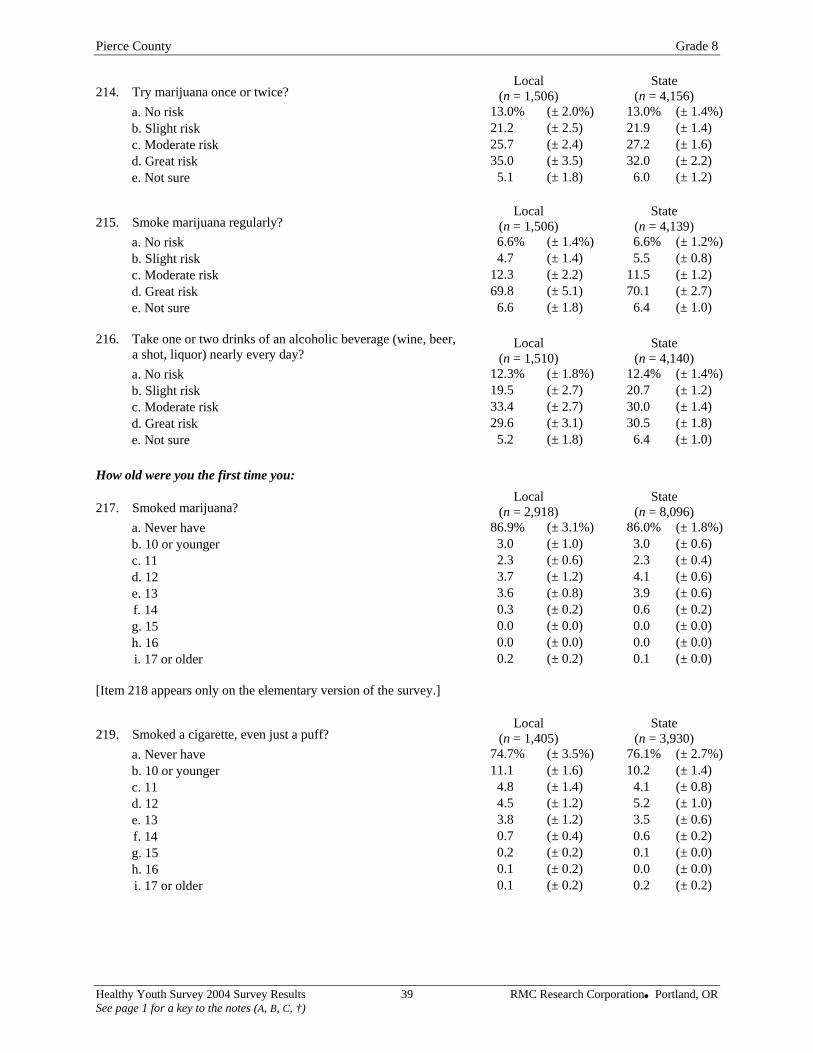
Pierce County Grade 8
214. Try marijuana once or twice? Local
(n = 1,506) State
(n = 4,156) a. No risk 13.0% (± 2.0%) 13.0% (± 1.4%)b. Slight risk 21.2 (± 2.5) 21.9 (± 1.4) c. Moderate risk 25.7 (± 2.4) 27.2 (± 1.6) d. Great risk 35.0
a. No risk b. Slight risk c. Moderate risk d. Great risk e. Not sure
29.6
a. Never have b. 10 or younger c. 11
f. 14 g. 15 h. 16 i. 17 or older
(± 1.4) (± 0.8)
(± 3.5) 32.0 (± 2.2) e. Not sure 5.1 (± 1.8) 6.0 (± 1.2)
215. Smoke marijuana regularly? Local
(n = 1,506) State
(n = 4,139) 6.6% (± 1.4%) 6.6% (± 1.2%)4.7 (± 1.4) 5.5 (± 0.8)
12.3 (± 2.2) 11.5 (± 1.2) 69.8 (± 5.1) 70.1 (± 2.7) 6.6 (± 1.8) 6.4 (± 1.0)
216. Take one or two drinks of an alcoholic beverage (wine, beer, a shot, liquor) nearly every day?
Local (n = 1,510)
State (n = 4,140)
a. No risk 12.3% (± 1.8%) 12.4% (± 1.4%)b. Slight risk 19.5 (± 2.7) 20.7 (± 1.2) c. Moderate risk 33.4 (± 2.7) 30.0 (± 1.4) d. Great risk (± 3.1) 30.5 (± 1.8) e. Not sure 5.2 (± 1.8) 6.4 (± 1.0)
How old were you the first time you:
217. Smoked marijuana? Local
(n = 2,918) State
(n = 8,096) 86.9% (± 3.1%) 86.0% (± 1.8%)3.0 (± 1.0) 3.0 (± 0.6) 2.3 (± 0.6) 2.3 (± 0.4)
d. 12 3.7 (± 1.2) 4.1 (± 0.6) e. 13 3.6 (± 0.8) 3.9 (± 0.6)
0.3 (± 0.2) 0.6 (± 0.2) 0.0 (± 0.0) 0.0 (± 0.0) 0.0 (± 0.0) 0.0 (± 0.0) 0.2 (± 0.2) 0.1 (± 0.0)
[Item 218 appears only on the elementary version of the survey.]
219. Smoked a cigarette, even just a puff? Local
(n = 1,405) State
(n = 3,930) a. Never have 74.7% (± 3.5%) 76.1% (± 2.7%)b. 10 or younger 11.1 (± 1.6) 10.2 (± 1.4) c. 11 4.8 4.1 d. 12 4.5 (± 1.2) 5.2 (± 1.0) e. 13 3.8 (± 1.2) 3.5 (± 0.6) f. 14 0.7 (± 0.4) 0.6 (± 0.2) g. 15 0.2 (± 0.2) 0.1 (± 0.0) h. 16 0.1 (± 0.2) 0.0 (± 0.0) i. 17 or older 0.1 (± 0.2) 0.2 (± 0.2)
Healthy Youth Survey 2004 Survey Results 39 RMC Research Corporation Portland, OR See page 1 for a key to the notes (A, B, C, †)
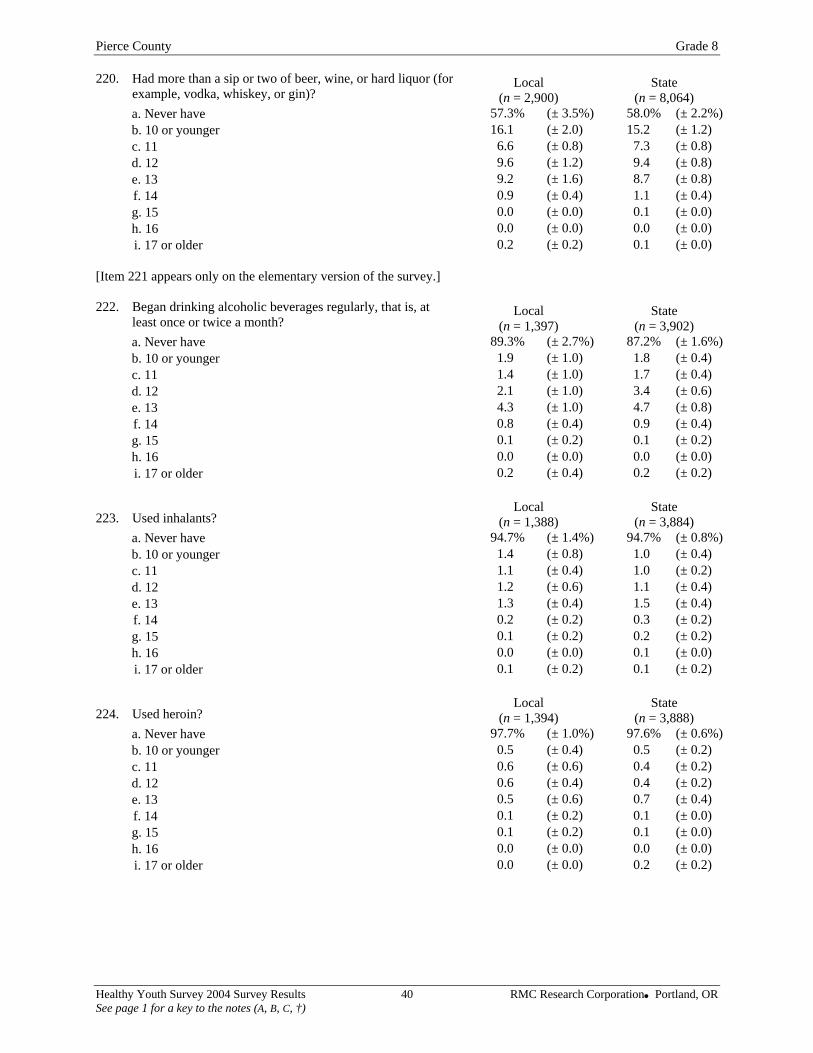
Pierce County Grade 8 220. Had more than a sip or two of beer, wine, or hard liquor (for
example, vodka, whiskey, or gin)? Local
(n = 2,900) State
(n = 8,064) a. Never have 57.3% (± 3.5%)
15.2
0.1
(± 2.7%) (± 1.0)
(± 1.4%)
0.1
0.4
0.1
0.0 0.0
58.0% (± 2.2%)b. 10 or younger 16.1 (± 2.0) (± 1.2) c. 11 6.6 (± 0.8) 7.3 (± 0.8) d. 12 9.6 (± 1.2) 9.4 (± 0.8) e. 13 9.2 (± 1.6) 8.7 (± 0.8) f. 14 0.9 (± 0.4) 1.1 (± 0.4) g. 15 0.0 (± 0.0) 0.1 (± 0.0) h. 16 0.0 (± 0.0) 0.0 (± 0.0) i. 17 or older 0.2 (± 0.2) (± 0.0)
[Item 221 appears only on the elementary version of the survey.] 222. Began drinking alcoholic beverages regularly, that is, at
least once or twice a month? Local
(n = 1,397) State
(n = 3,902) a. Never have 89.3% 87.2% (± 1.6%)b. 10 or younger 1.9 1.8 (± 0.4) c. 11 1.4 (± 1.0) 1.7 (± 0.4) d. 12 2.1 (± 1.0) 3.4 (± 0.6) e. 13 4.3 (± 1.0) 4.7 (± 0.8) f. 14 0.8 (± 0.4) 0.9 (± 0.4) g. 15 0.1 (± 0.2) 0.1 (± 0.2) h. 16 0.0 (± 0.0) 0.0 (± 0.0) i. 17 or older 0.2 (± 0.4) 0.2 (± 0.2)
223. Used inhalants? Local
(n = 1,388) State
(n = 3,884) a. Never have 94.7% 94.7% (± 0.8%)b. 10 or younger 1.4 (± 0.8) 1.0 (± 0.4) c. 11 1.1 (± 0.4) 1.0 (± 0.2) d. 12 1.2 (± 0.6) 1.1 (± 0.4) e. 13 1.3 (± 0.4) 1.5 (± 0.4) f. 14 0.2 (± 0.2) 0.3 (± 0.2) g. 15 (± 0.2) 0.2 (± 0.2) h. 16 0.0 (± 0.0) 0.1 (± 0.0) i. 17 or older 0.1 (± 0.2) 0.1 (± 0.2)
224. Used heroin? Local
(n = 1,394) State
(n = 3,888) a. Never have 97.7% (± 1.0%) 97.6% (± 0.6%)b. 10 or younger 0.5 (± 0.4) 0.5 (± 0.2) c. 11 0.6 (± 0.6) 0.4 (± 0.2) d. 12 0.6 (± 0.4) (± 0.2) e. 13 0.5 (± 0.6) 0.7 (± 0.4) f. 14 (± 0.2) 0.1 (± 0.0) g. 15 0.1 (± 0.2) 0.1 (± 0.0) h. 16 (± 0.0) 0.0 (± 0.0) i. 17 or older (± 0.0) 0.2 (± 0.2)
Healthy Youth Survey 2004 Survey Results 40 RMC Research Corporation Portland, OR See page 1 for a key to the notes (A, B, C, †)
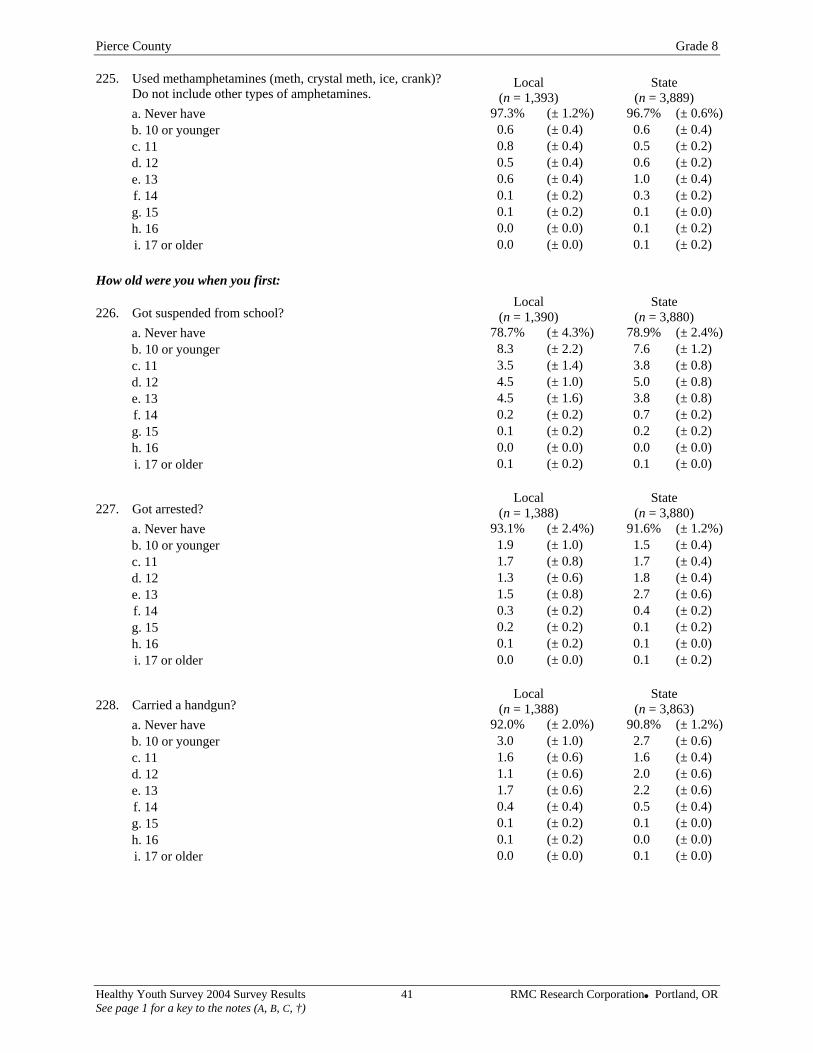
Pierce County Grade 8 225. Used methamphetamines (meth, crystal meth, ice, crank)?
Do not include other types of amphetamines. Local
(n = 1,393) State
(n = 3,889) a. Never have
(± 1.4) (± 1.0)
1.8
97.3% (± 1.2%) 96.7% (± 0.6%)b. 10 or younger 0.6 (± 0.4) 0.6 (± 0.4) c. 11 0.8 (± 0.4) 0.5 (± 0.2) d. 12 0.5 (± 0.4) 0.6 (± 0.2) e. 13 0.6 (± 0.4) 1.0 (± 0.4) f. 14 0.1 (± 0.2) 0.3 (± 0.2) g. 15 0.1 (± 0.2) 0.1 (± 0.0) h. 16 0.0 (± 0.0) 0.1 (± 0.2) i. 17 or older 0.0 (± 0.0) 0.1 (± 0.2)
How old were you when you first:
226. Got suspended from school? Local
(n = 1,390) State
(n = 3,880) a. Never have 78.7% (± 4.3%) 78.9% (± 2.4%)b. 10 or younger 8.3 (± 2.2) 7.6 (± 1.2) c. 11 3.5 3.8 (± 0.8) d. 12 4.5 5.0 (± 0.8) e. 13 4.5 (± 1.6) 3.8 (± 0.8) f. 14 0.2 (± 0.2) 0.7 (± 0.2) g. 15 0.1 (± 0.2) 0.2 (± 0.2) h. 16 0.0 (± 0.0) 0.0 (± 0.0) i. 17 or older 0.1 (± 0.2) 0.1 (± 0.0)
227. Got arrested? Local
(n = 1,388) State
(n = 3,880) a. Never have 93.1% (± 2.4%) 91.6% (± 1.2%)b. 10 or younger 1.9 (± 1.0) 1.5 (± 0.4) c. 11 1.7 (± 0.8) 1.7 (± 0.4) d. 12 1.3 (± 0.6) (± 0.4) e. 13 1.5 (± 0.8) 2.7 (± 0.6) f. 14 0.3 (± 0.2) 0.4 (± 0.2) g. 15 0.2 (± 0.2) 0.1 (± 0.2) h. 16 0.1 (± 0.2) 0.1 (± 0.0) i. 17 or older 0.0 (± 0.0) 0.1 (± 0.2)
228. Carried a handgun? Local
(n = 1,388) State
(n = 3,863) a. Never have 92.0% (± 2.0%) 90.8% (± 1.2%)b. 10 or younger 3.0 (± 1.0) 2.7 (± 0.6) c. 11 1.6 (± 0.6) 1.6 (± 0.4) d. 12 1.1 (± 0.6) 2.0 (± 0.6) e. 13 1.7 (± 0.6) 2.2 (± 0.6) f. 14 0.4 (± 0.4) 0.5 (± 0.4) g. 15 0.1 (± 0.2) 0.1 (± 0.0) h. 16 0.1 (± 0.2) 0.0 (± 0.0) i. 17 or older 0.0 (± 0.0) 0.1 (± 0.0)
Healthy Youth Survey 2004 Survey Results 41 RMC Research Corporation Portland, OR See page 1 for a key to the notes (A, B, C, †)
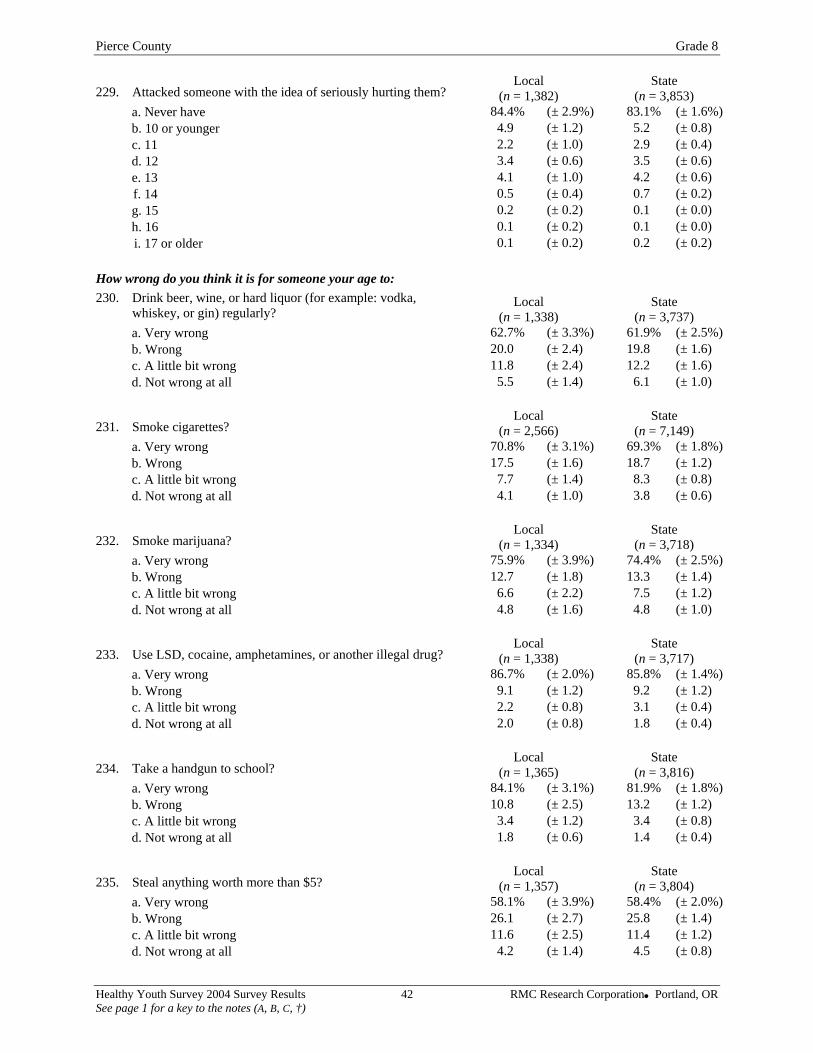
Pierce County Grade 8
229. Attacked someone with the idea of seriously hurting them? Local
(n = 1,382) State
(n = 3,853) a. Never have 84.4% (± 2.9%) 83.1% (± 1.6%)b. 10 or younger 4.9 (± 1.2) 5.2 (± 0.8) c. 11 2.2 (± 1.0) 2.9 (± 0.4) d. 12 3.4 (± 0.6) 3.5 (± 0.6) e. 13 4.1 (± 1.0) 4.2 (± 0.6) f. 14 0.5 (± 0.4) 0.7 (± 0.2) g. 15 0.2 (± 0.2) 0.1 (± 0.0) h. 16 0.1 (± 0.2) 0.1 (± 0.0) i. 17 or older 0.1 (± 0.2) 0.2 (± 0.2)
How wrong do you think it is for someone your age to: 230. Drink beer, wine, or hard liquor (for example: vodka,
whiskey, or gin) regularly? Local
(n = 1,338) State
(n = 3,737) a. Very wrong 62.7% (± 3.3%) 61.9% (± 2.5%)b. Wrong 20.0 (± 2.4) 19.8 (± 1.6) c. A little bit wrong 11.8 (± 2.4) 12.2 (± 1.6) d. Not wrong at all 5.5 (± 1.4) 6.1 (± 1.0)
231. Smoke cigarettes? Local
(n = 2,566) State
(n = 7,149) a. Very wrong 70.8% (± 3.1%) 69.3% (± 1.8%)b. Wrong 17.5 (± 1.6) 18.7 (± 1.2) c. A little bit wrong 7.7 (± 1.4) 8.3 (± 0.8) d. Not wrong at all 4.1 (± 1.0) 3.8 (± 0.6)
232. Smoke marijuana? Local
(n = 1,334) State
(n = 3,718) a. Very wrong 75.9% (± 3.9%) 74.4% (± 2.5%)b. Wrong 12.7 (± 1.8) 13.3 (± 1.4) c. A little bit wrong 6.6 (± 2.2) 7.5 (± 1.2) d. Not wrong at all 4.8 (± 1.6) 4.8 (± 1.0)
233. Use LSD, cocaine, amphetamines, or another illegal drug? Local
(n = 1,338) State
(n = 3,717) a. Very wrong 86.7% (± 2.0%) 85.8% (± 1.4%)b. Wrong 9.1 (± 1.2) 9.2 (± 1.2) c. A little bit wrong 2.2 (± 0.8) 3.1 (± 0.4) d. Not wrong at all 2.0 (± 0.8) 1.8 (± 0.4)
234. Take a handgun to school? Local
(n = 1,365) State
(n = 3,816) a. Very wrong 84.1% (± 3.1%) 81.9% (± 1.8%)b. Wrong 10.8 (± 2.5) 13.2 (± 1.2) c. A little bit wrong 3.4 (± 1.2) 3.4 (± 0.8) d. Not wrong at all 1.8 (± 0.6) 1.4 (± 0.4)
235. Steal anything worth more than $5? Local
(n = 1,357) State
(n = 3,804) a. Very wrong 58.1% (± 3.9%) 58.4% (± 2.0%)b. Wrong 26.1 (± 2.7) 25.8 (± 1.4) c. A little bit wrong 11.6 (± 2.5) 11.4 (± 1.2) d. Not wrong at all 4.2 (± 1.4) 4.5 (± 0.8)
Healthy Youth Survey 2004 Survey Results 42 RMC Research Corporation Portland, OR See page 1 for a key to the notes (A, B, C, †)
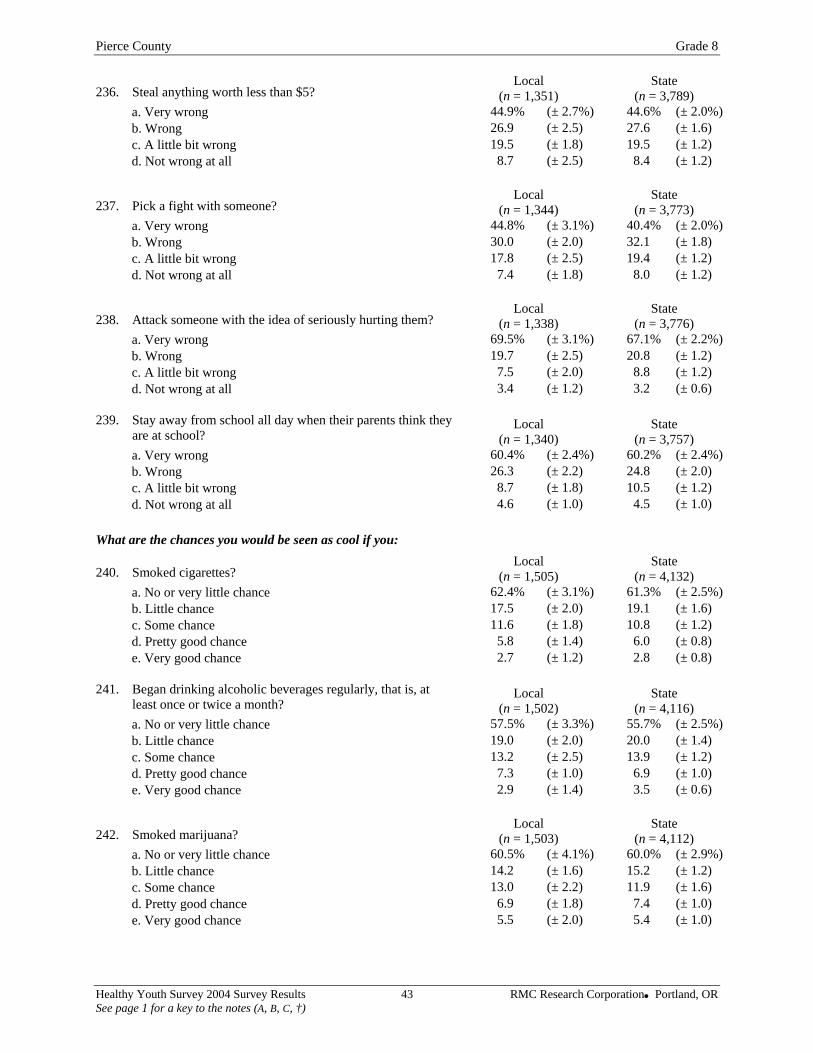
Pierce County Grade 8
236. Steal anything worth less than $5? Local
(n = 1,351) State
(n = 3,789) a. Very wrong 44.9% (± 2.7%) 44.6% (± 2.0%)b. Wrong 26.9 (± 2.5) 27.6 (± 1.6) c. A little bit wrong 19.5 (± 1.8) 19.5 (± 1.2) d. Not wrong at all 8.7 (± 2.5) 8.4 (± 1.2)
237. Pick a fight with someone? Local
(n = 1,344)
(± 3.1%) (± 2.5)
State (n = 3,773)
a. Very wrong 44.8% (± 3.1%) 40.4% (± 2.0%)b. Wrong 30.0 (± 2.0) 32.1 (± 1.8) c. A little bit wrong 17.8 (± 2.5) 19.4 (± 1.2) d. Not wrong at all 7.4 (± 1.8) 8.0 (± 1.2)
238. Attack someone with the idea of seriously hurting them? Local
(n = 1,338) State
(n = 3,776) a. Very wrong 69.5% 67.1% (± 2.2%)b. Wrong 19.7 20.8 (± 1.2) c. A little bit wrong 7.5 (± 2.0) 8.8 (± 1.2) d. Not wrong at all 3.4 (± 1.2) 3.2 (± 0.6)
239. Stay away from school all day when their parents think they
are at school? Local
(n = 1,340) State
(n = 3,757) a. Very wrong 60.4% (± 2.4%) 60.2% (± 2.4%)b. Wrong 26.3 (± 2.2) 24.8 (± 2.0) c. A little bit wrong 8.7 (± 1.8) 10.5 (± 1.2) d. Not wrong at all 4.6 (± 1.0) 4.5 (± 1.0)
What are the chances you would be seen as cool if you:
240. Smoked cigarettes? Local
(n = 1,505) State
(n = 4,132) a. No or very little chance 62.4% (± 3.1%) 61.3% (± 2.5%)b. Little chance 17.5 (± 2.0) 19.1 (± 1.6) c. Some chance 11.6 (± 1.8) 10.8 (± 1.2) d. Pretty good chance 5.8 (± 1.4) 6.0 (± 0.8) e. Very good chance 2.7 (± 1.2) 2.8 (± 0.8)
241. Began drinking alcoholic beverages regularly, that is, at
least once or twice a month? Local
(n = 1,502) State
(n = 4,116) a. No or very little chance 57.5% (± 3.3%) 55.7% (± 2.5%)b. Little chance 19.0 (± 2.0) 20.0 (± 1.4) c. Some chance 13.2 (± 2.5) 13.9 (± 1.2) d. Pretty good chance 7.3 (± 1.0) 6.9 (± 1.0) e. Very good chance 2.9 (± 1.4) 3.5 (± 0.6)
242. Smoked marijuana? Local
(n = 1,503) State
(n = 4,112) a. No or very little chance 60.5% (± 4.1%) 60.0% (± 2.9%)b. Little chance 14.2 (± 1.6) 15.2 (± 1.2) c. Some chance 13.0 (± 2.2) 11.9 (± 1.6) d. Pretty good chance 6.9 (± 1.8) 7.4 (± 1.0) e. Very good chance 5.5 (± 2.0) 5.4 (± 1.0)
Healthy Youth Survey 2004 Survey Results 43 RMC Research Corporation Portland, OR See page 1 for a key to the notes (A, B, C, †)
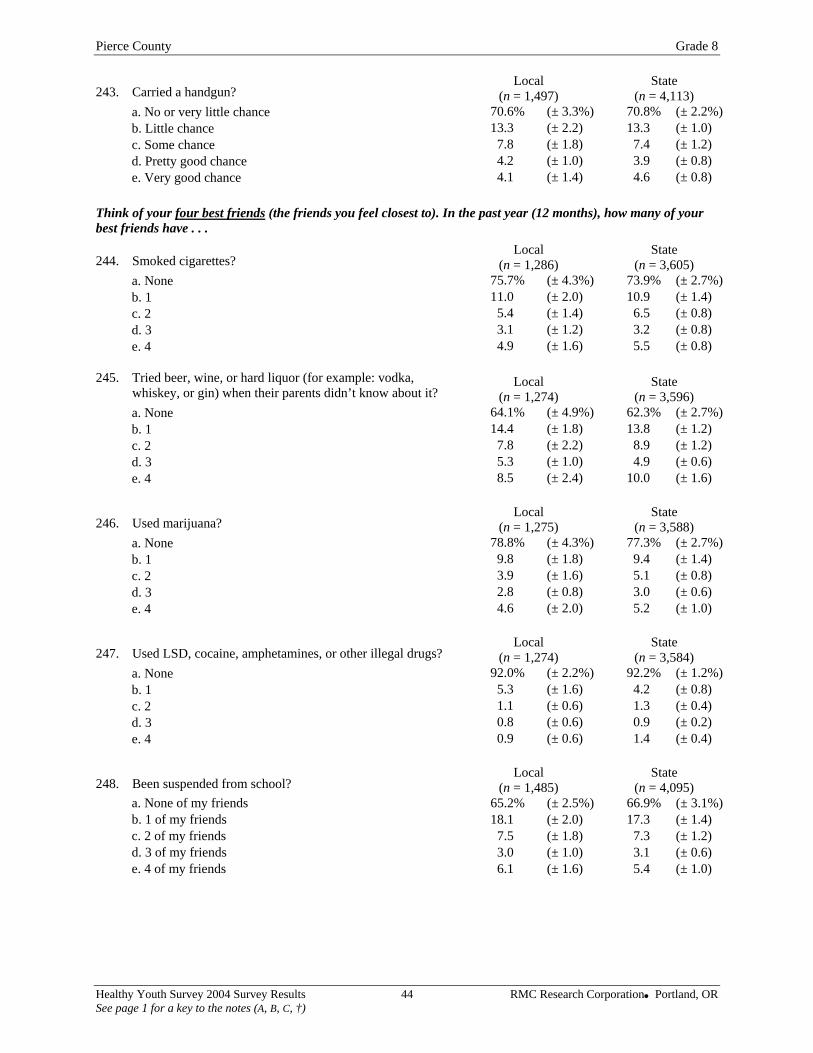
Pierce County Grade 8
243. Carried a handgun? Local
(n = 1,497) State
(n = 4,113) a. No or very little chance 70.6% (± 3.3%) 70.8% (± 2.2%)b. Little chance 13.3 (± 2.2) 13.3 (± 1.0) c. Some chance 7.8 (± 1.8) 7.4 (± 1.2) d. Pretty good chance 4.2 (± 1.0) 3.9 (± 0.8) e. Very good chance 4.1 (± 1.4) 4.6 (± 0.8)
Think of your four best friends (the friends you feel closest to). In the past year (12 months), how many of your best friends have . . .
13.8 8.9 4.9
10.0
State (n = 3,588)
(± 2.7%)(± 1.4)
d. 3
244. Smoked cigarettes? Local
(n = 1,286) State
(n = 3,605) a. None 75.7% (± 4.3%) 73.9% (± 2.7%)b. 1 11.0 (± 2.0) 10.9 (± 1.4) c. 2 5.4 (± 1.4) 6.5 (± 0.8) d. 3 3.1 (± 1.2) 3.2 (± 0.8) e. 4 4.9 (± 1.6) 5.5 (± 0.8)
245. Tried beer, wine, or hard liquor (for example: vodka,
whiskey, or gin) when their parents didn’t know about it? Local
(n = 1,274) State
(n = 3,596) a. None 64.1% (± 4.9%) 62.3% (± 2.7%)b. 1 14.4 (± 1.8) (± 1.2) c. 2 7.8 (± 2.2) (± 1.2) d. 3 5.3 (± 1.0) (± 0.6) e. 4 8.5 (± 2.4) (± 1.6)
246. Used marijuana? Local
(n = 1,275) a. None 78.8% (± 4.3%) 77.3% b. 1 9.8 (± 1.8) 9.4 c. 2 3.9 (± 1.6) 5.1 (± 0.8) d. 3 2.8 (± 0.8) 3.0 (± 0.6) e. 4 4.6 (± 2.0) 5.2 (± 1.0)
247. Used LSD, cocaine, amphetamines, or other illegal drugs? Local
(n = 1,274) State
(n = 3,584) a. None 92.0% (± 2.2%) 92.2% (± 1.2%)b. 1 5.3 (± 1.6) 4.2 (± 0.8) c. 2 1.1 (± 0.6) 1.3 (± 0.4)
0.8 (± 0.6) 0.9 (± 0.2) e. 4 0.9 (± 0.6) 1.4 (± 0.4)
248. Been suspended from school? Local
(n = 1,485) State
(n = 4,095) a. None of my friends 65.2% (± 2.5%) 66.9% (± 3.1%)b. 1 of my friends 18.1 (± 2.0) 17.3 (± 1.4) c. 2 of my friends 7.5 (± 1.8) 7.3 (± 1.2) d. 3 of my friends 3.0 (± 1.0) 3.1 (± 0.6) e. 4 of my friends 6.1 (± 1.6) 5.4 (± 1.0)
Healthy Youth Survey 2004 Survey Results 44 RMC Research Corporation Portland, OR See page 1 for a key to the notes (A, B, C, †)
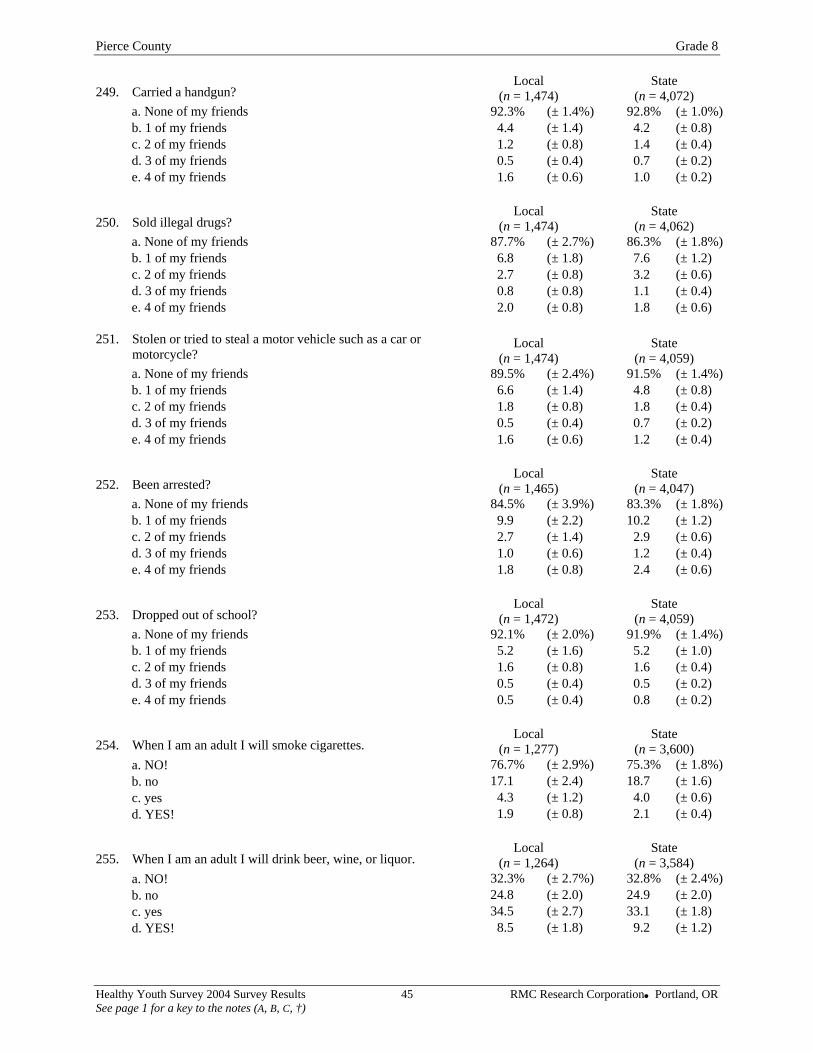
Pierce County Grade 8
249. Carried a handgun? Local
(n = 1,474) State
(n = 4,072) a. None of my friends 92.3% (± 1.4%) 92.8% (± 1.0%)b. 1 of my friends 4.4 (± 1.4) 4.2 (± 0.8) c. 2 of my friends 1.2 (± 0.8) 1.4 (± 0.4) d. 3 of my friends 0.5 (± 0.4) 0.7 (± 0.2) e. 4 of my friends 1.6 (± 0.6) 1.0 (± 0.2)
250. Sold illegal drugs? Local
(n = 1,474) State
(n = 4,062) a. None of my friends 87.7% (± 2.7%) 86.3% (± 1.8%)b. 1 of my friends 6.8 (± 1.8) 7.6 (± 1.2) c. 2 of my friends 2.7 (± 0.8) 3.2 (± 0.6) d. 3 of my friends 0.8 (± 0.8) 1.1 (± 0.4) e. 4 of my friends 2.0 (± 0.8) 1.8 (± 0.6)
251. Stolen or tried to steal a motor vehicle such as a car or
motorcycle? Local
(n = 1,474) State
(n = 4,059) a. None of my friends 89.5% (± 2.4%) 91.5% (± 1.4%)b. 1 of my friends 6.6 (± 1.4) 4.8 (± 0.8) c. 2 of my friends 1.8 (± 0.8) 1.8 (± 0.4) d. 3 of my friends 0.5 (± 0.4) 0.7 (± 0.2) e. 4 of my friends 1.6 (± 0.6) 1.2 (± 0.4)
252. Been arrested? Local
(n = 1,465) State
(n = 4,047) a. None of my friends 84.5% (± 3.9%) 83.3% (± 1.8%)b. 1 of my friends 9.9 (± 2.2) 10.2 (± 1.2) c. 2 of my friends 2.7 (± 1.4) 2.9 (± 0.6) d. 3 of my friends 1.0 (± 0.6) 1.2 (± 0.4) e. 4 of my friends 1.8 (± 0.8) 2.4 (± 0.6)
253. Dropped out of school? Local
(n = 1,472) 91.9% 5.2
d. YES!
State (n = 4,059)
a. None of my friends 92.1% (± 2.0%) (± 1.4%)b. 1 of my friends 5.2 (± 1.6) (± 1.0) c. 2 of my friends 1.6 (± 0.8) 1.6 (± 0.4) d. 3 of my friends 0.5 (± 0.4) 0.5 (± 0.2) e. 4 of my friends 0.5 (± 0.4) 0.8 (± 0.2)
254. When I am an adult I will smoke cigarettes. Local
(n = 1,277) State
(n = 3,600) a. NO! 76.7% (± 2.9%) 75.3% (± 1.8%)b. no 17.1 (± 2.4) 18.7 (± 1.6) c. yes 4.3 (± 1.2) 4.0 (± 0.6) d. YES! 1.9 (± 0.8) 2.1 (± 0.4)
255. When I am an adult I will drink beer, wine, or liquor. Local
(n = 1,264) State
(n = 3,584) a. NO! 32.3% (± 2.7%) 32.8% (± 2.4%)b. no 24.8 (± 2.0) 24.9 (± 2.0) c. yes 34.5 (± 2.7) 33.1 (± 1.8)
8.5 (± 1.8) 9.2 (± 1.2)
Healthy Youth Survey 2004 Survey Results 45 RMC Research Corporation Portland, OR See page 1 for a key to the notes (A, B, C, †)
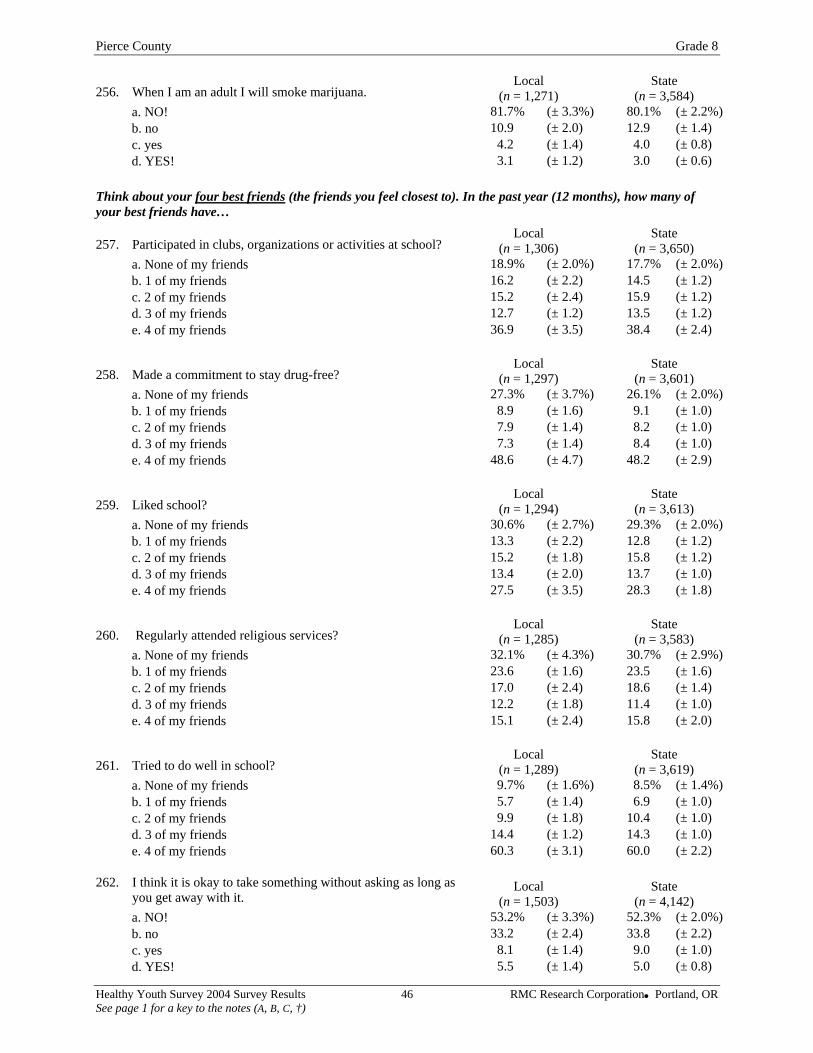
Pierce County Grade 8
256. When I am an adult I will smoke marijuana. Local
(n = 1,271) State
(n = 3,584) a. NO! 81.7% (± 3.3%) 80.1% (± 2.2%)
b. no 10.9 (± 2.0) 12.9 (± 1.4) c. yes 4.2 (± 1.4) 4.0 (± 0.8) d. YES! 3.1 (± 1.2) 3.0 (± 0.6)
Think about your four best friends (the friends you feel closest to). In the past year (12 months), how many of your best friends have…
257. Participated in clubs, organizations or activities at school? Local
(n = 1,306) State
(n = 3,650) a. None of my friends 18.9% (± 2.0%) 17.7% (± 2.0%)b. 1 of my friends 16.2 (± 2.2) 14.5
9.1 8.2 8.4
48.2
State (n = 3,613)
(± 2.0%)(± 1.2)
c. 2 of my friends
c. 2 of my friends
(± 1.2) c. 2 of my friends 15.2 (± 2.4) 15.9 (± 1.2) d. 3 of my friends 12.7 (± 1.2) 13.5 (± 1.2) e. 4 of my friends 36.9 (± 3.5) 38.4 (± 2.4)
258. Made a commitment to stay drug-free? Local
(n = 1,297) State
(n = 3,601) a. None of my friends 27.3% (± 3.7%) 26.1% (± 2.0%)b. 1 of my friends 8.9 (± 1.6) (± 1.0) c. 2 of my friends 7.9 (± 1.4) (± 1.0) d. 3 of my friends 7.3 (± 1.4) (± 1.0) e. 4 of my friends 48.6 (± 4.7) (± 2.9)
259. Liked school? Local
(n = 1,294) a. None of my friends 30.6% (± 2.7%) 29.3% b. 1 of my friends 13.3 (± 2.2) 12.8 c. 2 of my friends 15.2 (± 1.8) 15.8 (± 1.2) d. 3 of my friends 13.4 (± 2.0) 13.7 (± 1.0) e. 4 of my friends 27.5 (± 3.5) 28.3 (± 1.8)
260. Regularly attended religious services? Local
(n = 1,285) State
(n = 3,583) a. None of my friends 32.1% (± 4.3%) 30.7% (± 2.9%)b. 1 of my friends 23.6 (± 1.6) 23.5 (± 1.6)
17.0 (± 2.4) 18.6 (± 1.4) d. 3 of my friends 12.2 (± 1.8) 11.4 (± 1.0) e. 4 of my friends 15.1 (± 2.4) 15.8 (± 2.0)
261. Tried to do well in school? Local
(n = 1,289) State
(n = 3,619) a. None of my friends 9.7% (± 1.6%) 8.5% (± 1.4%)b. 1 of my friends 5.7 (± 1.4) 6.9 (± 1.0)
9.9 (± 1.8) 10.4 (± 1.0) d. 3 of my friends 14.4 (± 1.2) 14.3 (± 1.0) e. 4 of my friends 60.3 (± 3.1) 60.0 (± 2.2)
262. I think it is okay to take something without asking as long as
you get away with it. Local
(n = 1,503) State
(n = 4,142) a. NO! 53.2% (± 3.3%) 52.3% (± 2.0%)b. no 33.2 (± 2.4) 33.8 (± 2.2) c. yes 8.1 (± 1.4) 9.0 (± 1.0) d. YES! 5.5 (± 1.4) 5.0 (± 0.8)
Healthy Youth Survey 2004 Survey Results 46 RMC Research Corporation Portland, OR See page 1 for a key to the notes (A, B, C, †)
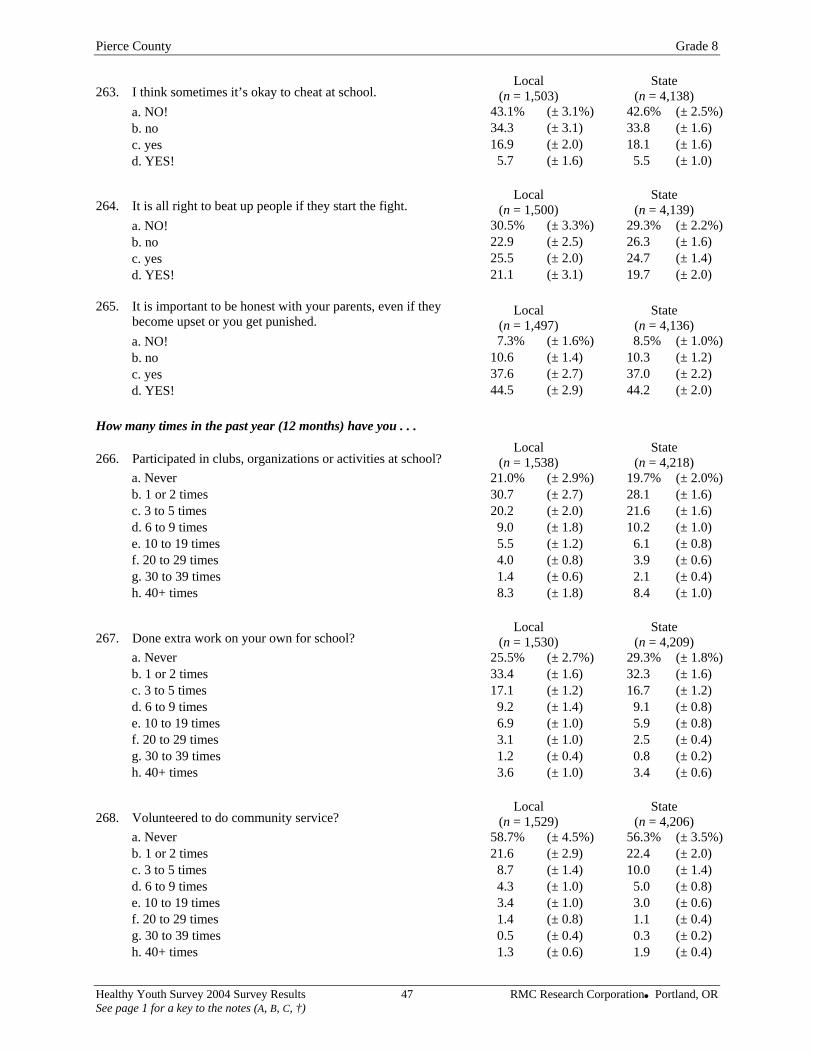
Pierce County Grade 8
263. I think sometimes it’s okay to cheat at school. Local
(n = 1,503) State
(n = 4,138) a. NO! 43.1% (± 3.1%) 42.6% (± 2.5%)b. no 34.3 (± 3.1) 33.8 (± 1.6) c. yes 16.9 (± 2.0) 18.1 (± 1.6) d. YES! 5.7 (± 1.6) 5.5 (± 1.0)
264. It is all right to beat up people if they start the fight. Local
(n = 1,500) State
(n = 4,139) a. NO! 30.5% (± 3.3%) 29.3% (± 2.2%)b. no 22.9 (± 2.5) 26.3 (± 1.6) c. yes 25.5 (± 2.0) 24.7 (± 1.4) d. YES! 21.1 (± 3.1) 19.7 (± 2.0)
(± 0.8)
25.5%
d. 6 to 9 times
265. It is important to be honest with your parents, even if they become upset or you get punished.
Local (n = 1,497)
State (n = 4,136)
a. NO! 7.3% (± 1.6%) 8.5% (± 1.0%)b. no 10.6 (± 1.4) 10.3 (± 1.2) c. yes 37.6 (± 2.7) 37.0 (± 2.2) d. YES! 44.5 (± 2.9) 44.2 (± 2.0)
How many times in the past year (12 months) have you . . .
266. Participated in clubs, organizations or activities at school? Local
(n = 1,538) State
(n = 4,218) a. Never 21.0% (± 2.9%) 19.7% (± 2.0%)b. 1 or 2 times 30.7 (± 2.7) 28.1 (± 1.6) c. 3 to 5 times 20.2 (± 2.0) 21.6 (± 1.6) d. 6 to 9 times 9.0 (± 1.8) 10.2 (± 1.0) e. 10 to 19 times 5.5 (± 1.2) 6.1 f. 20 to 29 times 4.0 (± 0.8) 3.9 (± 0.6) g. 30 to 39 times 1.4 (± 0.6) 2.1 (± 0.4) h. 40+ times 8.3 (± 1.8) 8.4 (± 1.0)
267. Done extra work on your own for school? Local
(n = 1,530) State
(n = 4,209) a. Never (± 2.7%) 29.3% (± 1.8%)b. 1 or 2 times 33.4 (± 1.6) 32.3 (± 1.6) c. 3 to 5 times 17.1 (± 1.2) 16.7 (± 1.2)
9.2 (± 1.4) 9.1 (± 0.8) e. 10 to 19 times 6.9 (± 1.0) 5.9 (± 0.8) f. 20 to 29 times 3.1 (± 1.0) 2.5 (± 0.4) g. 30 to 39 times 1.2 (± 0.4) 0.8 (± 0.2) h. 40+ times 3.6 (± 1.0) 3.4 (± 0.6)
268. Volunteered to do community service? Local
(n = 1,529) State
(n = 4,206) a. Never 58.7% (± 4.5%) 56.3% (± 3.5%)b. 1 or 2 times 21.6 (± 2.9) 22.4 (± 2.0) c. 3 to 5 times 8.7 (± 1.4) 10.0 (± 1.4) d. 6 to 9 times 4.3 (± 1.0) 5.0 (± 0.8) e. 10 to 19 times 3.4 (± 1.0) 3.0 (± 0.6) f. 20 to 29 times 1.4 (± 0.8) 1.1 (± 0.4) g. 30 to 39 times 0.5 (± 0.4) 0.3 (± 0.2) h. 40+ times 1.3 (± 0.6) 1.9 (± 0.4)
Healthy Youth Survey 2004 Survey Results 47 RMC Research Corporation Portland, OR See page 1 for a key to the notes (A, B, C, †)
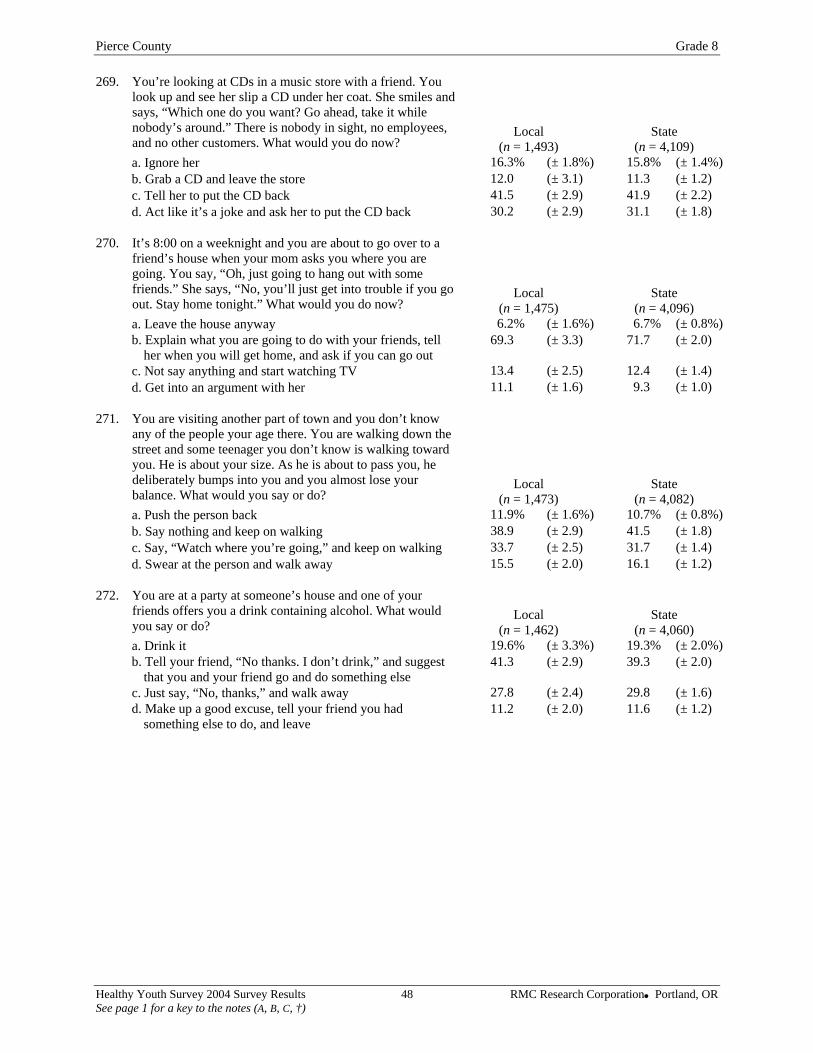
Pierce County Grade 8 269. You’re looking at CDs in a music store with a friend. You
look up and see her slip a CD under her coat. She smiles and says, “Which one do you want? Go ahead, take it while nobody’s around.” There is nobody in sight, no employees, and no other customers. What would you do now?
Local (n = 1,493)
State (n = 4,109)
a. Ignore her 16.3% (± 1.8%) 15.8% (± 1.4%)b. Grab a CD and leave the store 12.0 (± 3.1) 11.3
12.4
(± 1.6%)
(± 1.2) c. Tell her to put the CD back 41.5 (± 2.9) 41.9 (± 2.2) d. Act like it’s a joke and ask her to put the CD back 30.2 (± 2.9) 31.1 (± 1.8)
270. It’s 8:00 on a weeknight and you are about to go over to a
friend’s house when your mom asks you where you are going. You say, “Oh, just going to hang out with some friends.” She says, “No, you’ll just get into trouble if you go out. Stay home tonight.” What would you do now?
Local (n = 1,475)
State (n = 4,096)
a. Leave the house anyway 6.2% (± 1.6%) 6.7% (± 0.8%)b. Explain what you are going to do with your friends, tell
her when you will get home, and ask if you can go out 69.3 (± 3.3) 71.7 (± 2.0)
c. Not say anything and start watching TV 13.4 (± 2.5) (± 1.4) d. Get into an argument with her 11.1 (± 1.6) 9.3 (± 1.0)
271. You are visiting another part of town and you don’t know
any of the people your age there. You are walking down the street and some teenager you don’t know is walking toward you. He is about your size. As he is about to pass you, he deliberately bumps into you and you almost lose your balance. What would you say or do?
Local (n = 1,473)
State (n = 4,082)
a. Push the person back 11.9% 10.7% (± 0.8%)b. Say nothing and keep on walking 38.9 (± 2.9) 41.5 (± 1.8) c. Say, “Watch where you’re going,” and keep on walking 33.7 (± 2.5) 31.7 (± 1.4) d. Swear at the person and walk away 15.5 (± 2.0) 16.1 (± 1.2)
272. You are at a party at someone’s house and one of your
friends offers you a drink containing alcohol. What would you say or do?
Local (n = 1,462)
State (n = 4,060)
a. Drink it 19.6% (± 3.3%) 19.3% (± 2.0%)b. Tell your friend, “No thanks. I don’t drink,” and suggest
that you and your friend go and do something else 41.3 (± 2.9) 39.3 (± 2.0)
c. Just say, “No, thanks,” and walk away 27.8 (± 2.4) 29.8 (± 1.6) d. Make up a good excuse, tell your friend you had
something else to do, and leave 11.2 (± 2.0) 11.6 (± 1.2)
Healthy Youth Survey 2004 Survey Results 48 RMC Research Corporation Portland, OR See page 1 for a key to the notes (A, B, C, †)
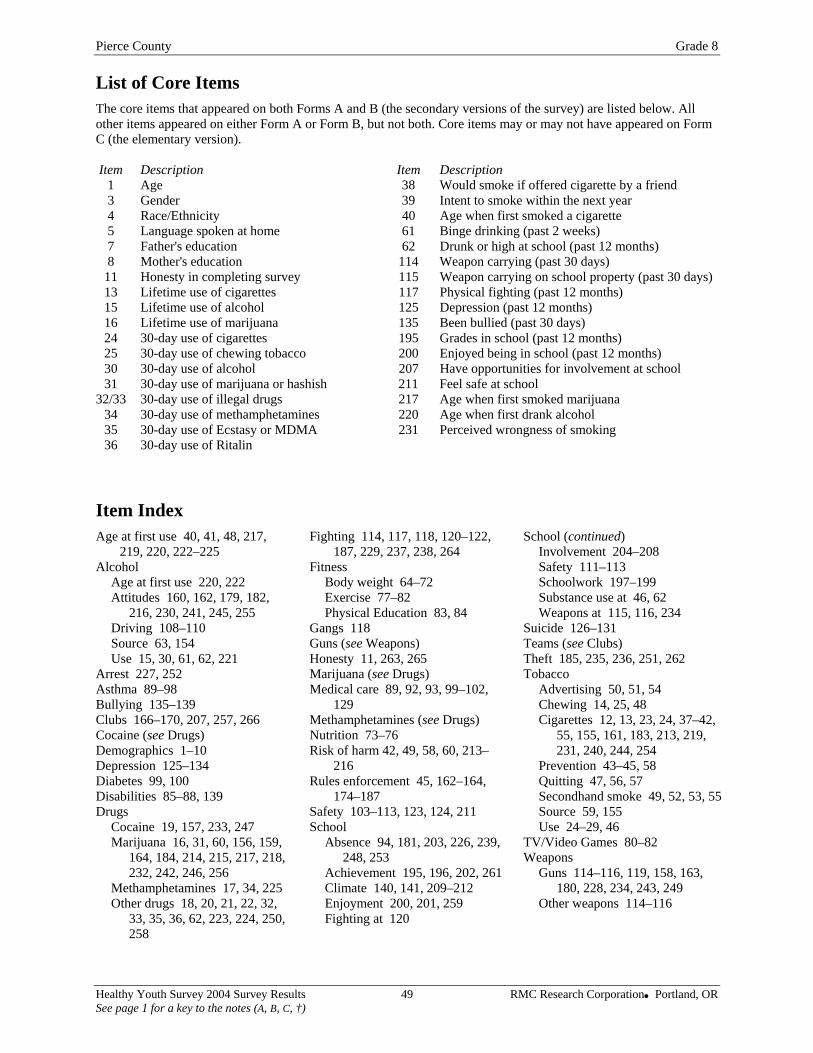
Pierce County Grade 8
List of Core Items The core items that appeared on both Forms A and B (the secondary versions of the survey) are listed below. All other items appeared on either Form A or Form B, but not both. Core items may or may not have appeared on Form C (the elementary version). Item Description Item Description
1 Age 38 Would smoke if offered cigarette by a friend 3 Gender 39 Intent to smoke within the next year 4 Race/Ethnicity 40
Binge drinking (past 2 weeks)
217
Age at first use 220, 222
Asthma 89–98
Diabetes 99, 100 Quitting 47, 56, 57
Age when first smoked a cigarette 5 Language spoken at home 61 7 Father's education 62 Drunk or high at school (past 12 months) 8 Mother's education 114 Weapon carrying (past 30 days)
11 Honesty in completing survey 115 Weapon carrying on school property (past 30 days) 13 Lifetime use of cigarettes 117 Physical fighting (past 12 months) 15 Lifetime use of alcohol 125 Depression (past 12 months) 16 Lifetime use of marijuana 135 Been bullied (past 30 days) 24 30-day use of cigarettes 195 Grades in school (past 12 months) 25 30-day use of chewing tobacco 200 Enjoyed being in school (past 12 months) 30 30-day use of alcohol 207 Have opportunities for involvement at school 31 30-day use of marijuana or hashish 211 Feel safe at school
32/33 30-day use of illegal drugs Age when first smoked marijuana 34 30-day use of methamphetamines 220 Age when first drank alcohol 35 30-day use of Ecstasy or MDMA 231 Perceived wrongness of smoking 36 30-day use of Ritalin
Item Index Age at first use 40, 41, 48, 217,
219, 220, 222–225 Alcohol
Attitudes 160, 162, 179, 182, 216, 230, 241, 245, 255
Driving 108–110 Source 63, 154 Use 15, 30, 61, 62, 221
Arrest 227, 252
Bullying 135–139 Clubs 166–170, 207, 257, 266 Cocaine (see Drugs) Demographics 1–10 Depression 125–134
Disabilities 85–88, 139 Drugs
Cocaine 19, 157, 233, 247 Marijuana 16, 31, 60, 156, 159,
164, 184, 214, 215, 217, 218, 232, 242, 246, 256
Methamphetamines 17, 34, 225 Other drugs 18, 20, 21, 22, 32,
33, 35, 36, 62, 223, 224, 250, 258
Fighting 114, 117, 118, 120–122, 187, 229, 237, 238, 264
Fitness Body weight 64–72 Exercise 77–82 Physical Education 83, 84
Gangs 118 Guns (see Weapons) Honesty 11, 263, 265 Marijuana (see Drugs) Medical care 89, 92, 93, 99–102,
129 Methamphetamines (see Drugs) Nutrition 73–76 Risk of harm 42, 49, 58, 60, 213–
216 Rules enforcement 45, 162–164,
174–187 Safety 103–113, 123, 124, 211 School
Absence 94, 181, 203, 226, 239, 248, 253
Achievement 195, 196, 202, 261 Climate 140, 141, 209–212 Enjoyment 200, 201, 259 Fighting at 120
School (continued) Involvement 204–208 Safety 111–113 Schoolwork 197–199 Substance use at 46, 62 Weapons at 115, 116, 234
Suicide 126–131 Teams (see Clubs) Theft 185, 235, 236, 251, 262 Tobacco
Advertising 50, 51, 54 Chewing 14, 25, 48 Cigarettes 12, 13, 23, 24, 37–42,
55, 155, 161, 183, 213, 219, 231, 240, 244, 254
Prevention 43–45, 58
Secondhand smoke 49, 52, 53, 55 Source 59, 155 Use 24–29, 46
TV/Video Games 80–82 Weapons
Guns 114–116, 119, 158, 163, 180, 228, 234, 243, 249
Other weapons 114–116
Healthy Youth Survey 2004 Survey Results 49 RMC Research Corporation Portland, OR See page 1 for a key to the notes (A, B, C, †)