Embed Size (px)
Citation preview
Healthy People 2010 Focus Area 15:
Injury and Violence Prevention
Progress ReviewAugust 16, 2007
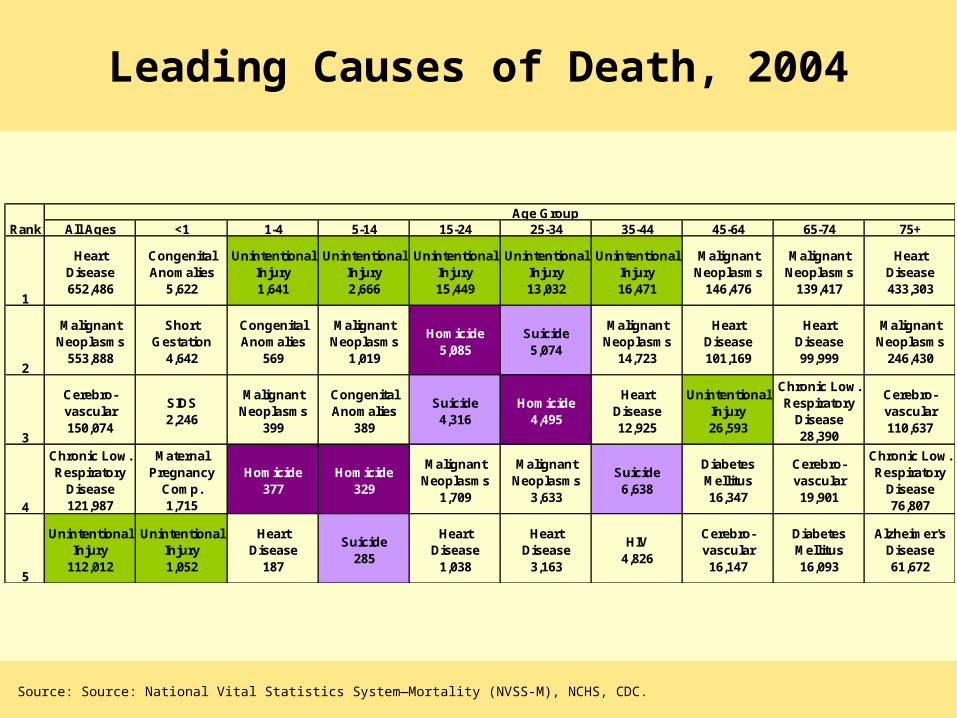
Rank All Ages <1 1-4 5-14 15-24 25-34 35-44 45-64 65-74 75+
1
HeartDisease 652,486
CongenitalAnomalies
5,622
UnintentionalInjury 1,641
UnintentionalInjury 2,666
UnintentionalInjury 15,449
UnintentionalInjury 13,032
UnintentionalInjury 16,471
MalignantNeoplasms
146,476
MalignantNeoplasms
139,417
HeartDisease 433,303
2
MalignantNeoplasms
553,888
ShortGestation
4,642
CongenitalAnomalies
569
MalignantNeoplasms
1,019
Homicide 5,085
Suicide 5,074
MalignantNeoplasms
14,723
HeartDisease 101,169
HeartDisease 99,999
MalignantNeoplasms
246,430
3
Cerebro-vascular 150,074
SIDS 2,246
MalignantNeoplasms
399
CongenitalAnomalies
389
Suicide 4,316
Homicide 4,495
HeartDisease 12,925
UnintentionalInjury 26,593
Chronic Low.Respiratory
Disease 28,390
Cerebro-vascular 110,637
4
Chronic Low.Respiratory
Disease 121,987
MaternalPregnancy
Comp. 1,715
Homicide 377
Homicide 329
MalignantNeoplasms
1,709
MalignantNeoplasms
3,633
Suicide 6,638
DiabetesMellitus 16,347
Cerebro-vascular 19,901
Chronic Low.Respiratory
Disease 76,807
5
UnintentionalInjury
112,012
UnintentionalInjury 1,052
HeartDisease
187
Suicide 285
HeartDisease
1,038
HeartDisease
3,163
HIV 4,826
Cerebro-vascular 16,147
DiabetesMellitus 16,093
Alzheimer'sDisease 61,672
Age Group
Leading Causes of Death, 2004
Source: Source: National Vital Statistics System—Mortality (NVSS-M), NCHS, CDC.
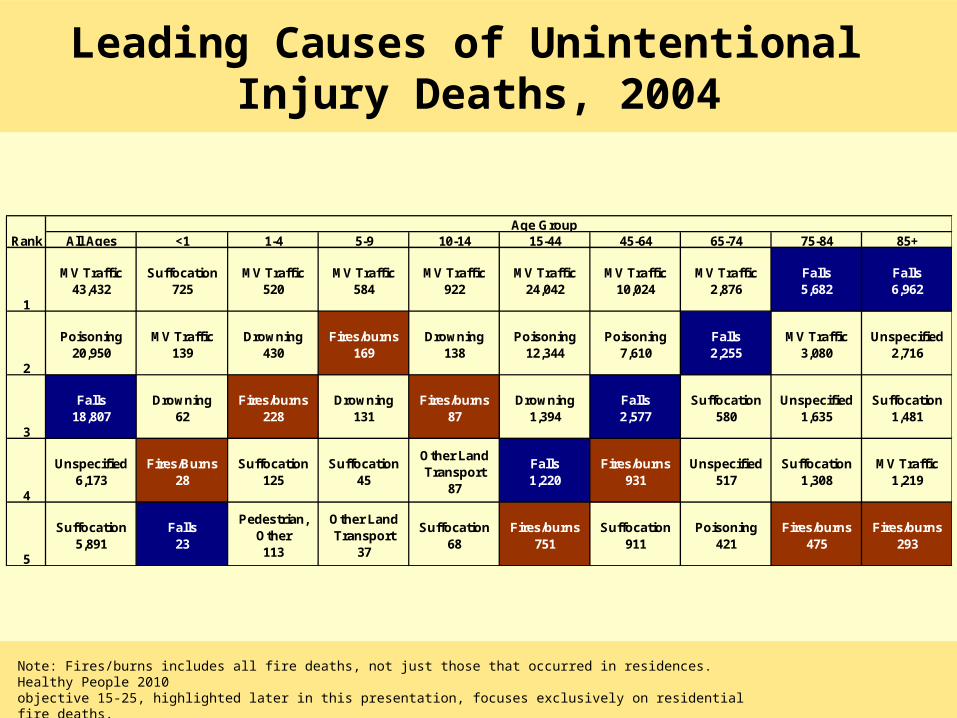
Leading Causes of Unintentional Injury Deaths, 2004
Note: Fires/burns includes all fire deaths, not just those that occurred in residences. Healthy People 2010 objective 15-25, highlighted later in this presentation, focuses exclusively on residential fire deaths.Source: Source: National Vital Statistics System—Mortality (NVSS-M), NCHS, CDC.
Rank All Ages <1 1-4 5-9 10-14 15-44 45-64 65-74 75-84 85+
1
MV Traffic 43,432
Suffocation 725
MV Traffic 520
MV Traffic 584
MV Traffic 922
MV Traffic 24,042
MV Traffic 10,024
MV Traffic 2,876
Falls5,682
Falls6,962
2
Poisoning 20,950
MV Traffic 139
Drowning 430
Fires/burns 169
Drowning 138
Poisoning 12,344
Poisoning 7,610
Falls2,255
MV Traffic 3,080
Unspecified 2,716
3
Falls 18,807
Drowning62
Fires/burns 228
Drowning 131
Fires/burns 87
Drowning 1,394
Falls2,577
Suffocation 580
Unspecified 1,635
Suffocation 1,481
4
Unspecified6,173
Fires/Burns 28
Suffocation125
Suffocation 45
Other Land Transport
87
Falls1,220
Fires/burns 931
Unspecified 517
Suffocation1,308
MV Traffic 1,219
5
Suffocation 5,891
Falls23
Pedestrian, Other113
Other Land Transport
37
Suffocation 68
Fires/burns 751
Suffocation 911
Poisoning 421
Fires/burns475
Fires/burns 293
Age Group
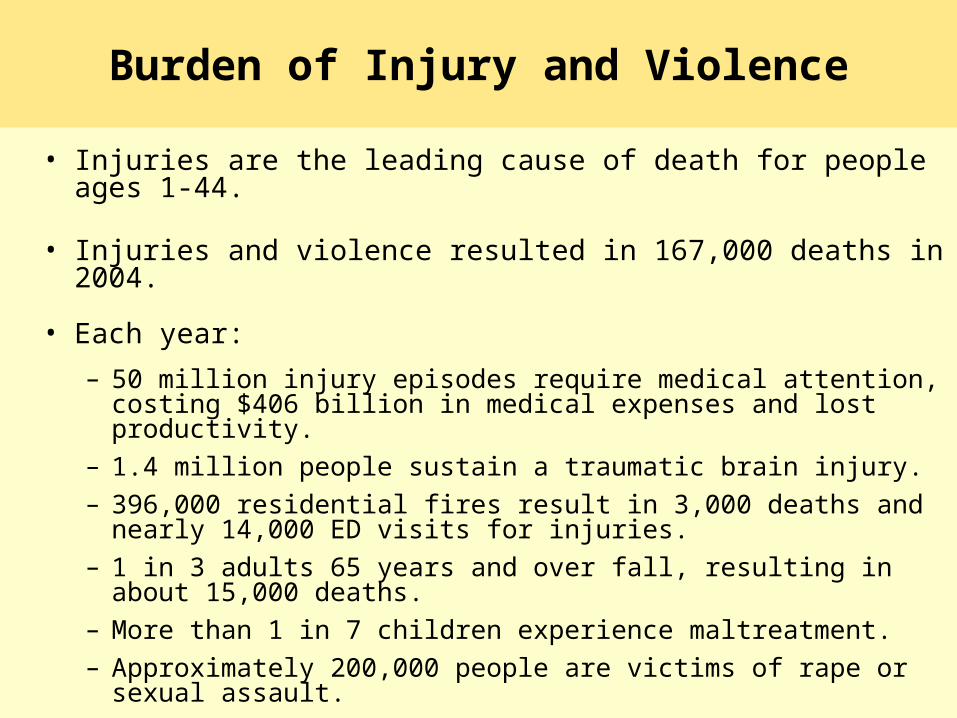
• Injuries are the leading cause of death for people ages 1-44.
• Injuries and violence resulted in 167,000 deaths in 2004.
• Each year:– 50 million injury episodes require medical attention,
costing $406 billion in medical expenses and lost productivity.
– 1.4 million people sustain a traumatic brain injury.– 396,000 residential fires result in 3,000 deaths and nearly
14,000 ED visits for injuries.– 1 in 3 adults 65 years and over fall, resulting in about
15,000 deaths.– More than 1 in 7 children experience maltreatment.– Approximately 200,000 people are victims of rape or
sexual assault.
Burden of Injury and Violence
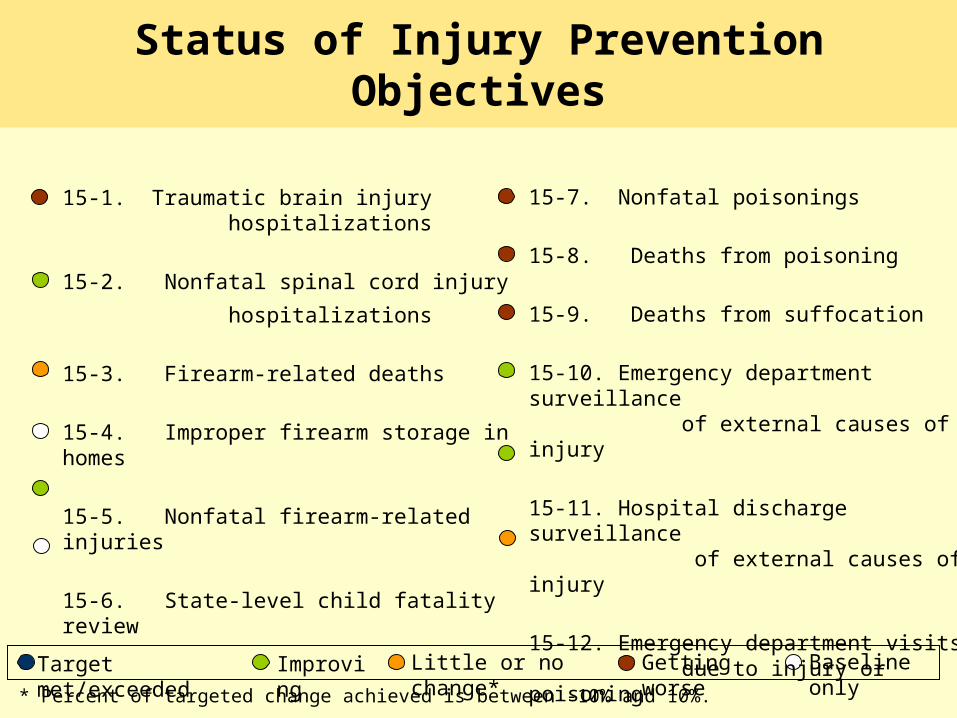
15-1. Traumatic brain injury hospitalizations
15-2. Nonfatal spinal cord injury
hospitalizations
15-3. Firearm-related deaths
15-4. Improper firearm storage in homes
15-5. Nonfatal firearm-related injuries
15-6. State-level child fatality review
Status of Injury Prevention Objectives
Improving
Getting worse
Little or no change*Target met/exceeded Baseline only
15-7. Nonfatal poisonings
15-8. Deaths from poisoning
15-9. Deaths from suffocation
15-10. Emergency department surveillance
of external causes of injury
15-11. Hospital discharge surveillance of external causes of injury
15-12. Emergency department visits due to injury or poisoning
* Percent of targeted change achieved is between -10% and 10%.
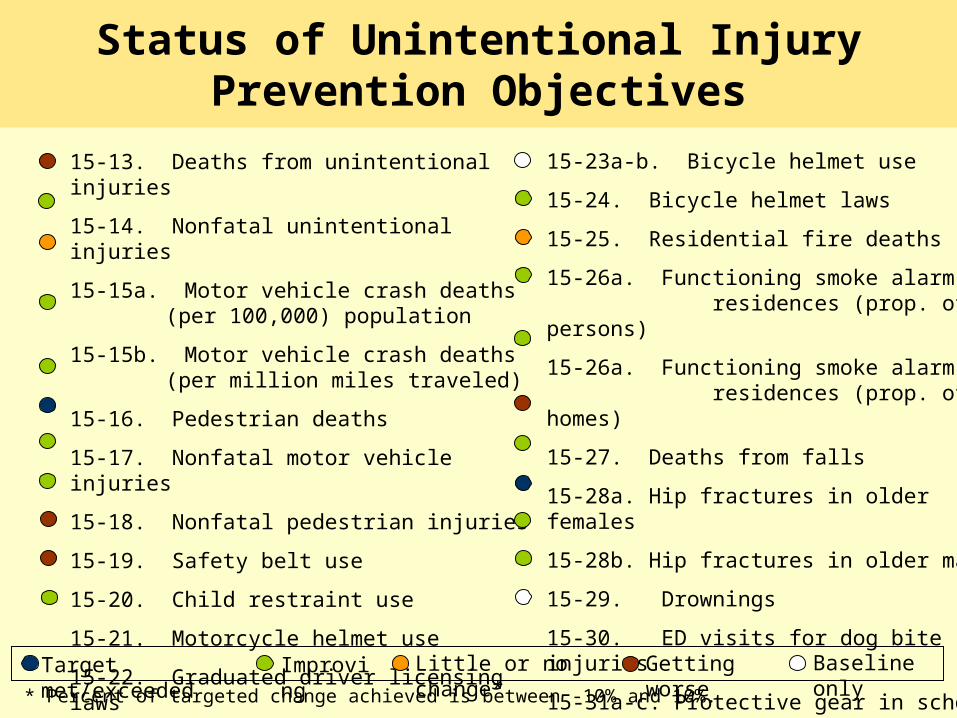
15-13. Deaths from unintentional injuries
15-14. Nonfatal unintentional injuries
15-15a. Motor vehicle crash deaths (per 100,000) population
15-15b. Motor vehicle crash deaths(per million miles traveled)
15-16. Pedestrian deaths
15-17. Nonfatal motor vehicle injuries
15-18. Nonfatal pedestrian injuries
15-19. Safety belt use
15-20. Child restraint use
15-21. Motorcycle helmet use
15-22. Graduated driver licensing laws
Status of Unintentional Injury Prevention Objectives
15-23a-b. Bicycle helmet use
15-24. Bicycle helmet laws
15-25. Residential fire deaths
15-26a. Functioning smoke alarms in residences (prop. of persons)
15-26a. Functioning smoke alarms in residences (prop. of homes)
15-27. Deaths from falls
15-28a. Hip fractures in older females
15-28b. Hip fractures in older males
15-29. Drownings
15-30. ED visits for dog bite injuries
15-31a-c. Protective gear in school sports
Improving
Getting worse
Little or no change*Target met/exceeded Baseline only
* Percent of targeted change achieved is between -10% and 10%.
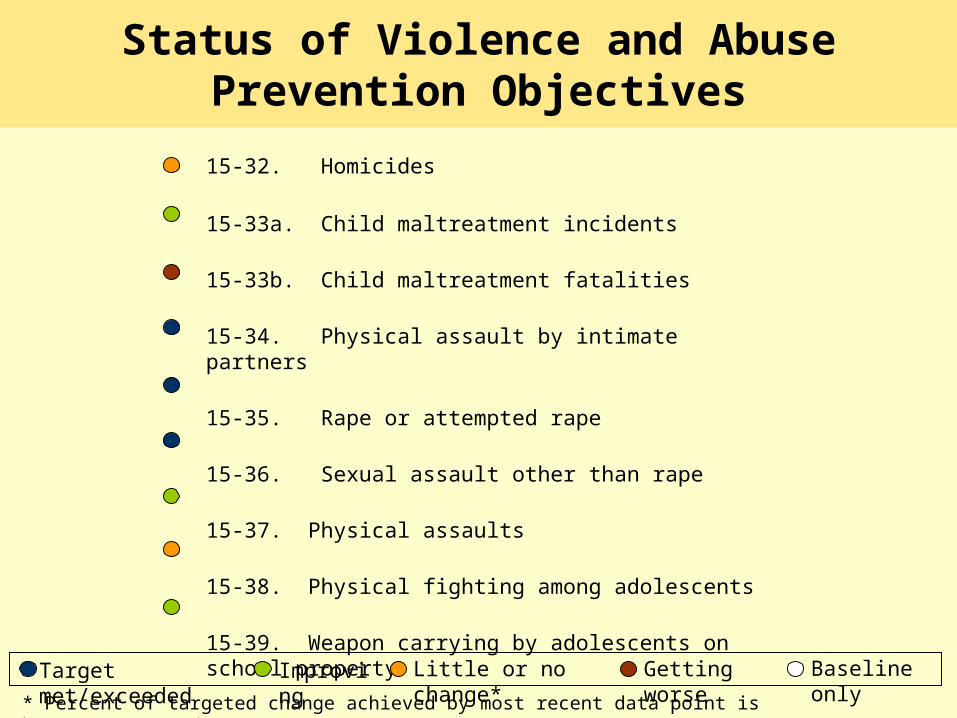
15-32. Homicides
15-33a. Child maltreatment incidents
15-33b. Child maltreatment fatalities
15-34. Physical assault by intimate partners
15-35. Rape or attempted rape
15-36. Sexual assault other than rape
15-37. Physical assaults
15-38. Physical fighting among adolescents
15-39. Weapon carrying by adolescents on school property
Status of Violence and Abuse Prevention Objectives
Improving
Getting worse
Little or no change*Target met/exceeded Baseline only
* Percent of targeted change achieved by most recent data point is between -10% and 10%.
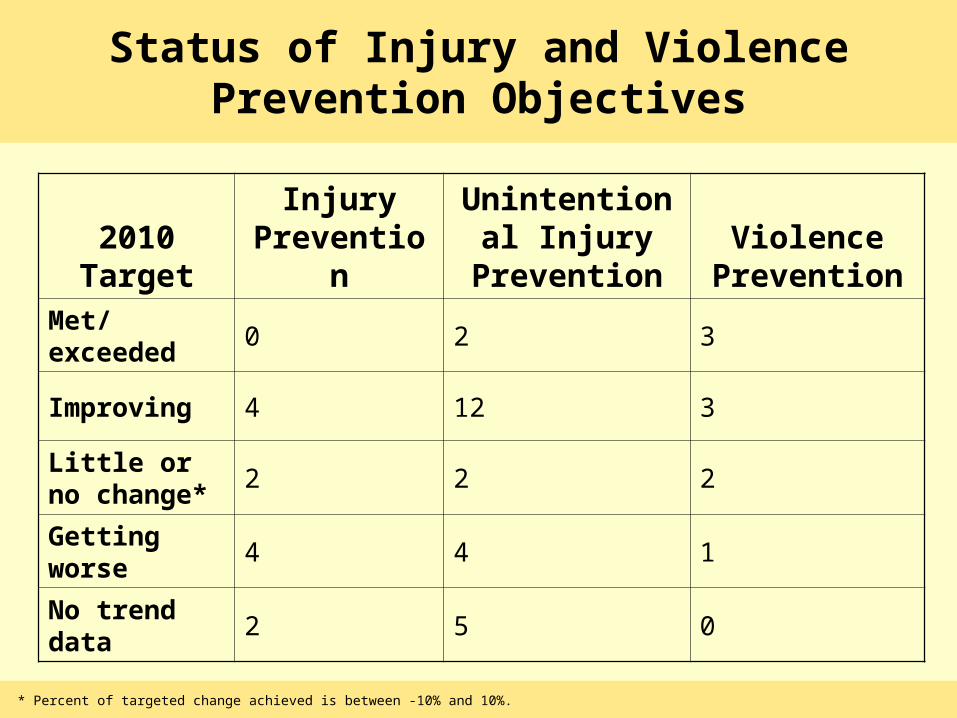
Status of Injury and Violence Prevention Objectives
* Percent of targeted change achieved is between -10% and 10%.
2010 Target
InjuryPrevention
Unintentional Injury
PreventionViolence
Prevention
Met/exceeded 0 2 3
Improving 4 12 3
Little or no change*
2 2 2
Getting worse
4 4 1
No trend data 2 5 0
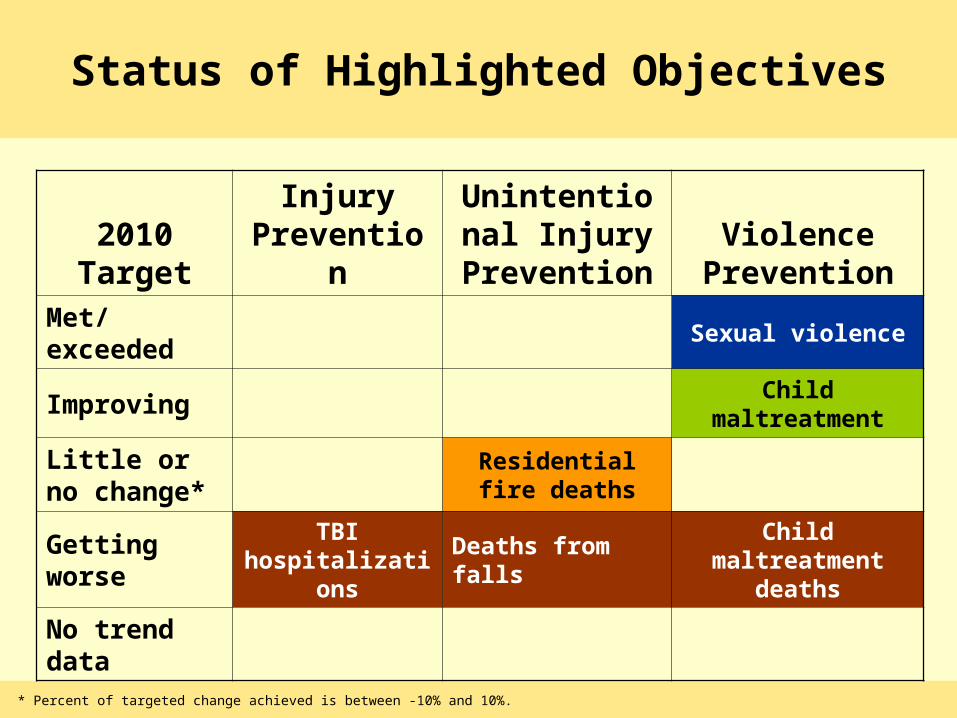
Status of Highlighted Objectives
* Percent of targeted change achieved is between -10% and 10%.
2010 Target
InjuryPrevention
Unintentional Injury
PreventionViolence
Prevention
Met/exceeded Sexual violence
Improving Child maltreatment
Little or no change*
Residential fire deaths
Getting worse
TBI hospitalizations
Deaths from fallsChild maltreatment
deaths
No trend data
Male
0
25
50
75
100
125
150
1998 1999 2000 2001 2002 2003 2004 2005
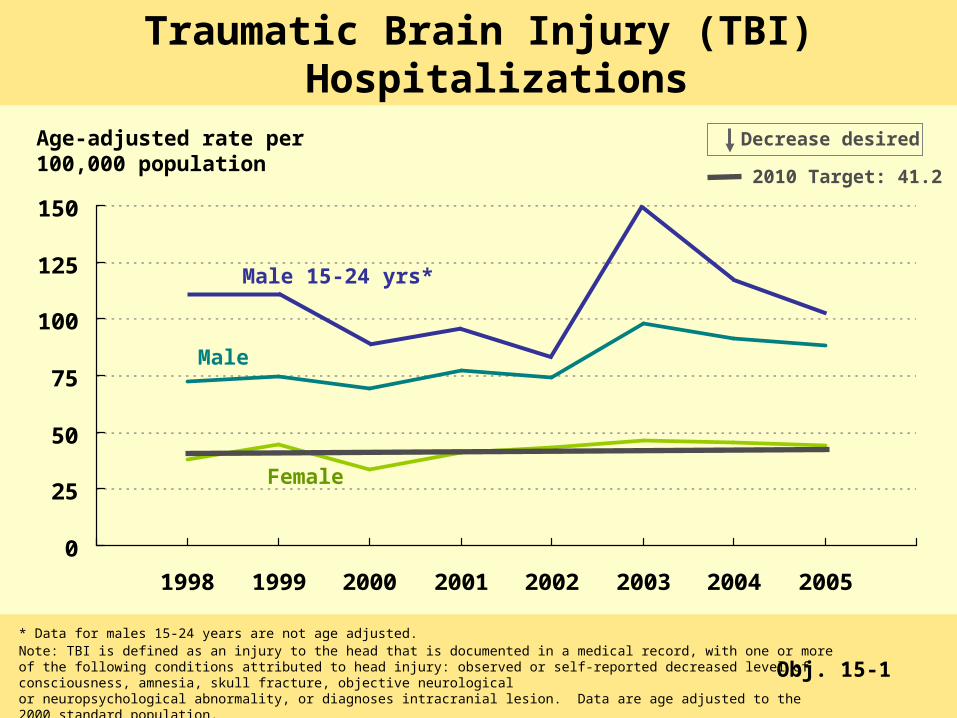
Traumatic Brain Injury (TBI) Hospitalizations
Obj. 15-1
* Data for males 15-24 years are not age adjusted.Note: TBI is defined as an injury to the head that is documented in a medical record, with one or more of the following conditions attributed to head injury: observed or self-reported decreased level of consciousness, amnesia, skull fracture, objective neurological or neuropsychological abnormality, or diagnoses intracranial lesion. Data are age adjusted to the 2000 standard population. Source: National Hospital Discharge Survey (NHDS), NCHS, CDC.
Age-adjusted rate per 100,000 population
Female
Male 15-24 yrs*
Decrease desired
2010 Target: 41.2
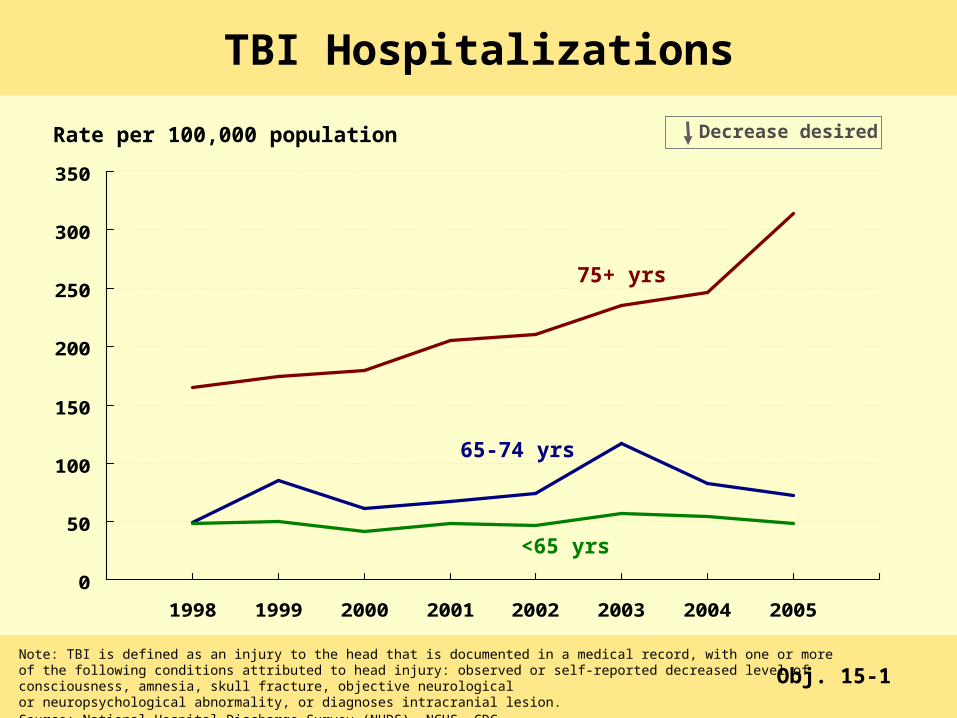
<65 yrs
75+ yrs
65-74 yrs
Rate per 100,000 population
0
50
100
150
200
250
300
350
1998 1999 2000 2001 2002 2003 2004 2005
TBI Hospitalizations
Note: TBI is defined as an injury to the head that is documented in a medical record, with one or more of the following conditions attributed to head injury: observed or self-reported decreased level of consciousness, amnesia, skull fracture, objective neurological or neuropsychological abnormality, or diagnoses intracranial lesion. Source: National Hospital Discharge Survey (NHDS), NCHS, CDC.
Obj. 15-1
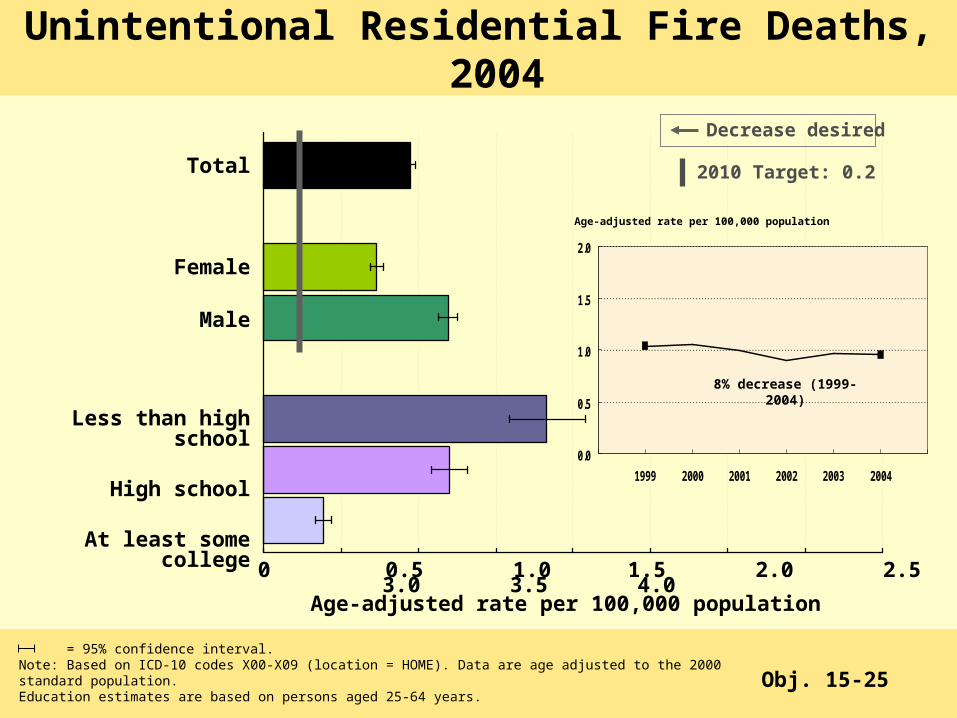
Decrease desired
0 0.5 1.0 1.5 2.0 2.5 3.0 3.5 4.0
Total
Female
Male
Less than high school
High school
At least some college
Obj. 15-25
= 95% confidence interval. Note: Based on ICD-10 codes X00-X09 (location = HOME). Data are age adjusted to the 2000 standard population. Education estimates are based on persons aged 25-64 years.
Source: National Vital Statistics System—Mortality (NVSS-M), NCHS, CDC.
Unintentional Residential Fire Deaths, 2004
Age-adjusted rate per 100,000 population
Decrease desired
2010 Target: 0.2
0.0
0.5
1.0
1.5
2.0
1999 2000 2001 2002 2003 2004
Age-adjusted rate per 100,000 population
8% decrease (1999-2004)
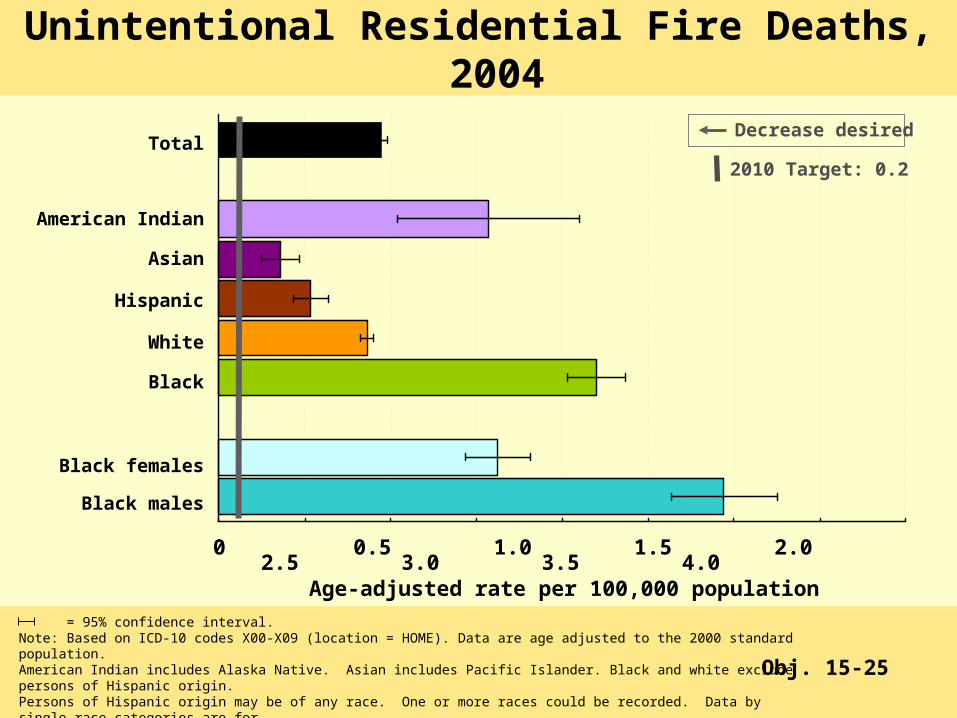
0 0.5 1.0 1.5 2.0 2.5 3.0 3.5 4.0
Total
American Indian
Asian
Hispanic
White
Black
Black females
Black males
Unintentional Residential Fire Deaths, 2004
Obj. 15-25
= 95% confidence interval. Note: Based on ICD-10 codes X00-X09 (location = HOME). Data are age adjusted to the 2000 standard population. American Indian includes Alaska Native. Asian includes Pacific Islander. Black and white exclude persons of Hispanic origin. Persons of Hispanic origin may be of any race. One or more races could be recorded. Data by single race categories are for persons for whom only one racial group was recorded. Source: National Vital Statistics System—Mortality (NVSS-M), NCHS, CDC.
Age-adjusted rate per 100,000 population
Decrease desired
2010 Target: 0.2
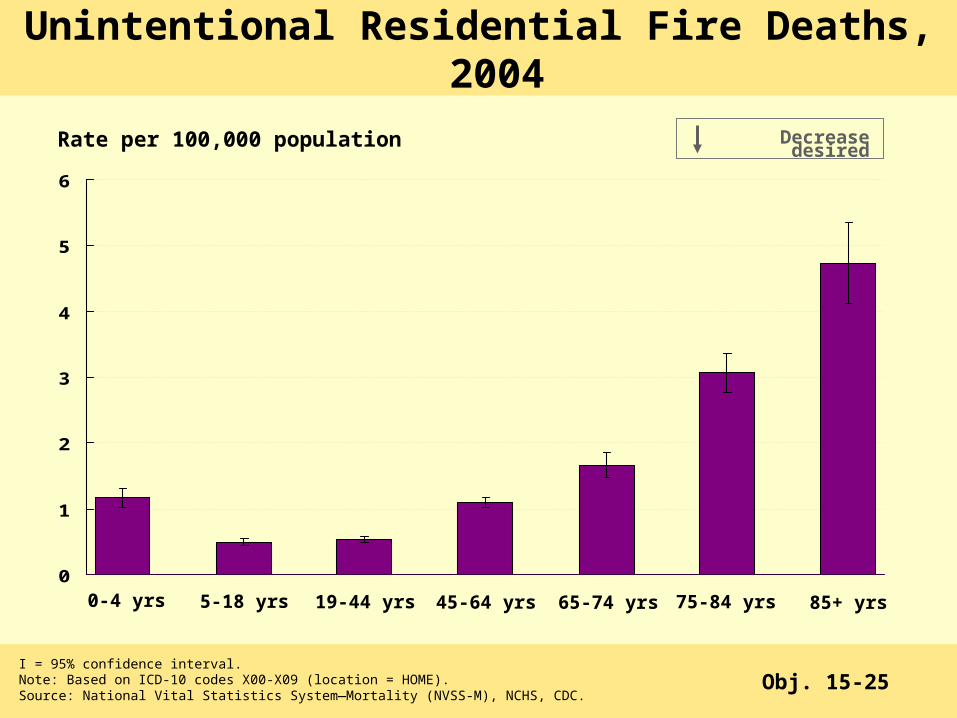
Rate per 100,000 population
0
1
2
3
4
5
6
Unintentional Residential Fire Deaths, 2004
I = 95% confidence interval.
Decrease desired
Note: Based on ICD-10 codes X00-X09 (location = HOME). Source: National Vital Statistics System—Mortality (NVSS-M), NCHS, CDC.
Obj. 15-25
5-18 yrs 85+ yrs45-64 yrs19-44 yrs 65-74 yrs 75-84 yrs0-4 yrs
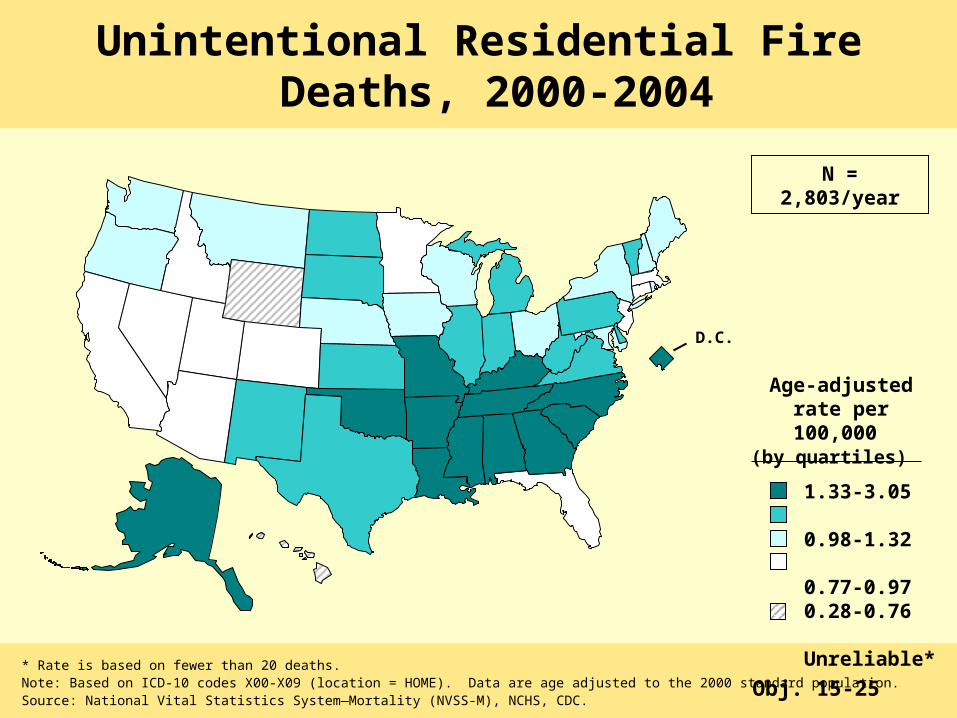
D.C.
Unintentional Residential Fire Deaths, 2000-2004
N = 2,803/year
* Rate is based on fewer than 20 deaths.Note: Based on ICD-10 codes X00-X09 (location = HOME). Data are age adjusted to the 2000 standard population.Source: National Vital Statistics System—Mortality (NVSS-M), NCHS, CDC.
Obj. 15-25
1.33-3.05 0.98-1.32 0.77-0.970.28-0.76
Unreliable*
Age-adjusted rate per 100,000
(by quartiles)
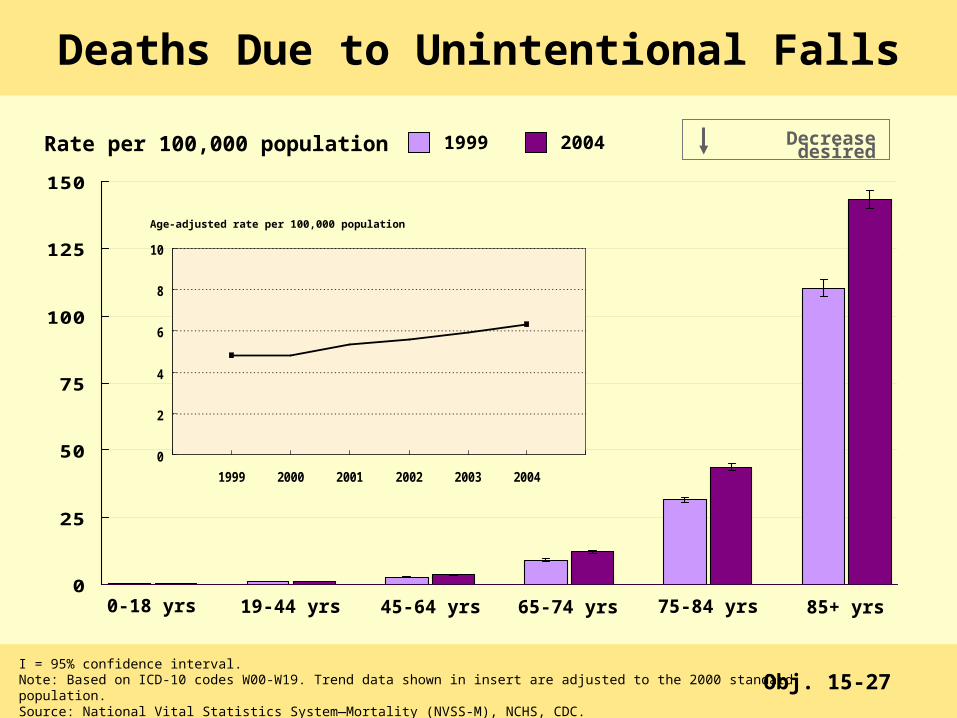
Rate per 100,000 population
0
25
50
75
100
125
150
1999 2004
Deaths Due to Unintentional Falls
I = 95% confidence interval.
Decrease desired
Note: Based on ICD-10 codes W00-W19. Trend data shown in insert are adjusted to the 2000 standard population.Source: National Vital Statistics System—Mortality (NVSS-M), NCHS, CDC.
Obj. 15-27
0-18 yrs 85+ yrs45-64 yrs19-44 yrs 65-74 yrs 75-84 yrs
0
2
4
6
8
10
1999 2000 2001 2002 2003 2004
Age-adjusted rate per 100,000 population
Obj. 15-27
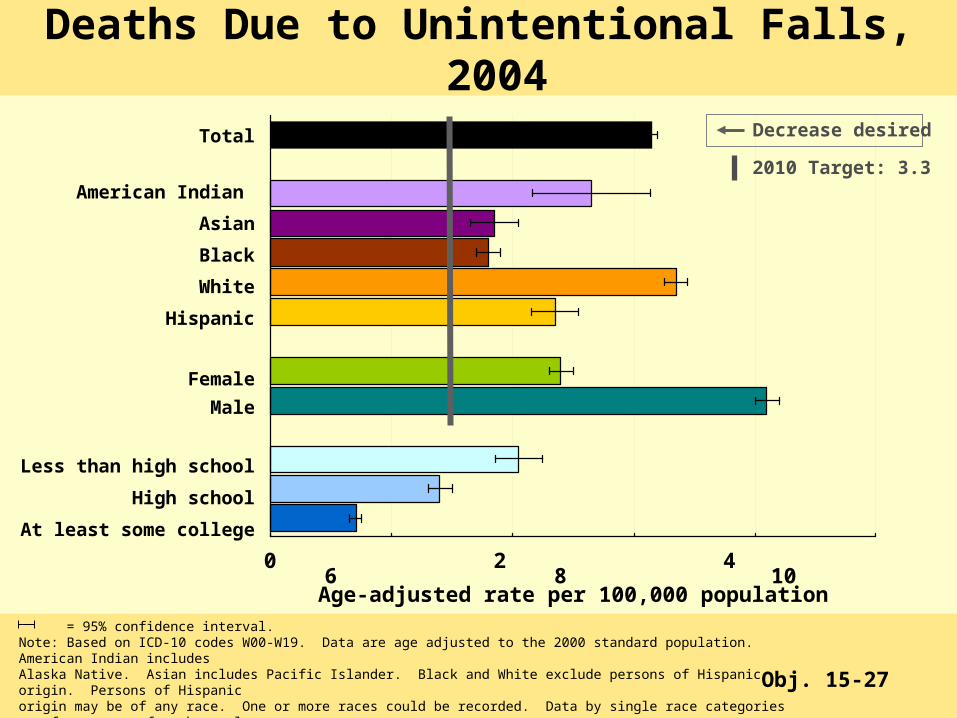
0 2 4 6 8 10
Total
American Indian
Asian
Black
White
Hispanic
Female
Male
Less than high school
High school
At least some college
= 95% confidence interval. Note: Based on ICD-10 codes W00-W19. Data are age adjusted to the 2000 standard population. American Indian includes Alaska Native. Asian includes Pacific Islander. Black and White exclude persons of Hispanic origin. Persons of Hispanic origin may be of any race. One or more races could be recorded. Data by single race categories are for persons for whom only one racial group was recorded. Education estimates are based on persons aged 25-64 years. Source: National Vital Statistics System—Mortality (NVSS-M), NCHS, CDC.
Deaths Due to Unintentional Falls, 2004
Age-adjusted rate per 100,000 population
Decrease desired
2010 Target: 3.3
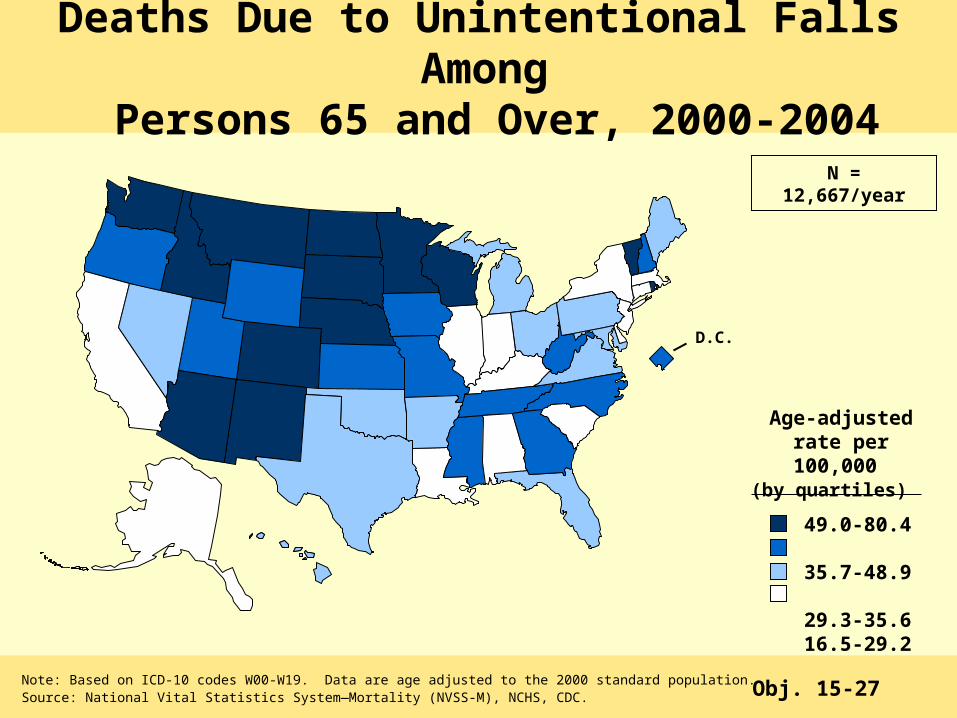
D.C.
N = 12,667/year
Note: Based on ICD-10 codes W00-W19. Data are age adjusted to the 2000 standard population.Source: National Vital Statistics System—Mortality (NVSS-M), NCHS, CDC.
49.0-80.4 35.7-48.9 29.3-35.616.5-29.2
Age-adjusted rate per 100,000
(by quartiles)
Deaths Due to Unintentional Falls Among
Persons 65 and Over, 2000-2004
Obj. 15-27
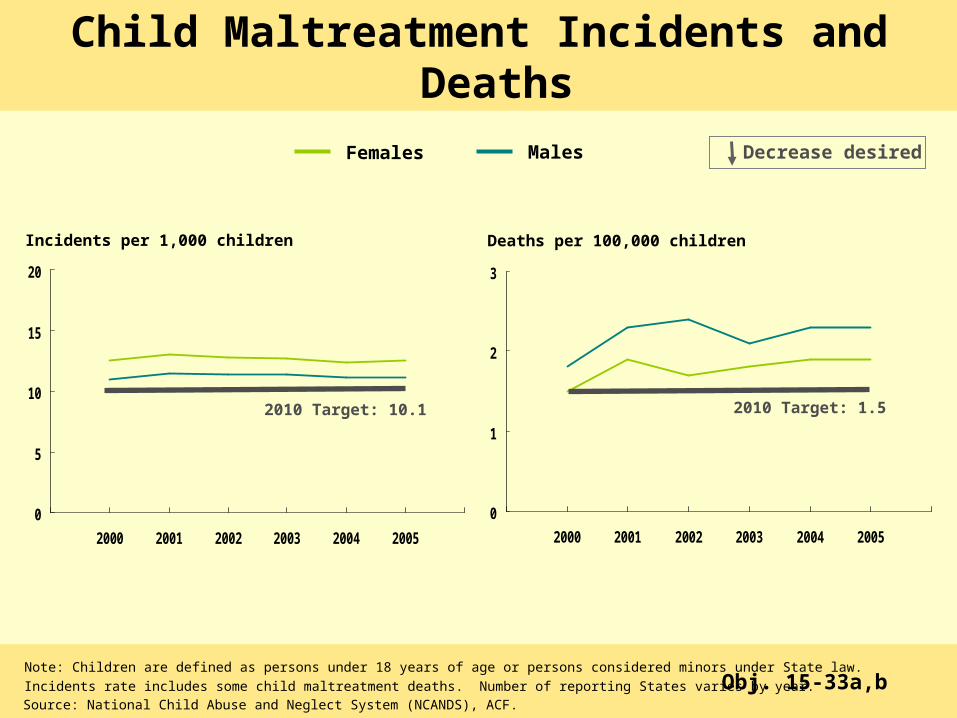
0
5
10
15
20
2000 2001 2002 2003 2004 2005
Source: National Child Abuse and Neglect System (NCANDS), ACF.
Note: Children are defined as persons under 18 years of age or persons considered minors under State law. Incidents rate includes some child maltreatment deaths. Number of reporting States varies by year.
Child Maltreatment Incidents and Deaths
Obj. 15-33a,b
Incidents per 1,000 children
0
1
2
3
2000 2001 2002 2003 2004 2005
Deaths per 100,000 children
Decrease desired
2010 Target: 10.1 2010 Target: 1.5
Females Males
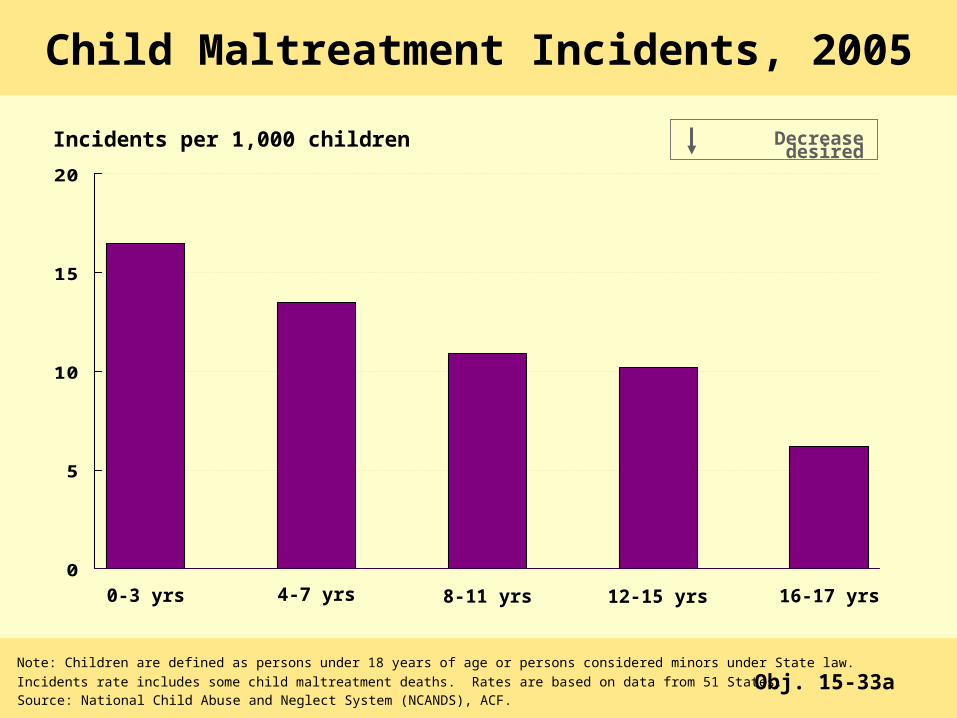
Incidents per 1,000 children
0
5
10
15
20
Child Maltreatment Incidents, 2005
Decrease desired
Obj. 15-33a
0-3 yrs 8-11 yrs4-7 yrs 12-15 yrs 16-17 yrs
Source: National Child Abuse and Neglect System (NCANDS), ACF.
Note: Children are defined as persons under 18 years of age or persons considered minors under State law. Incidents rate includes some child maltreatment deaths. Rates are based on data from 51 States.
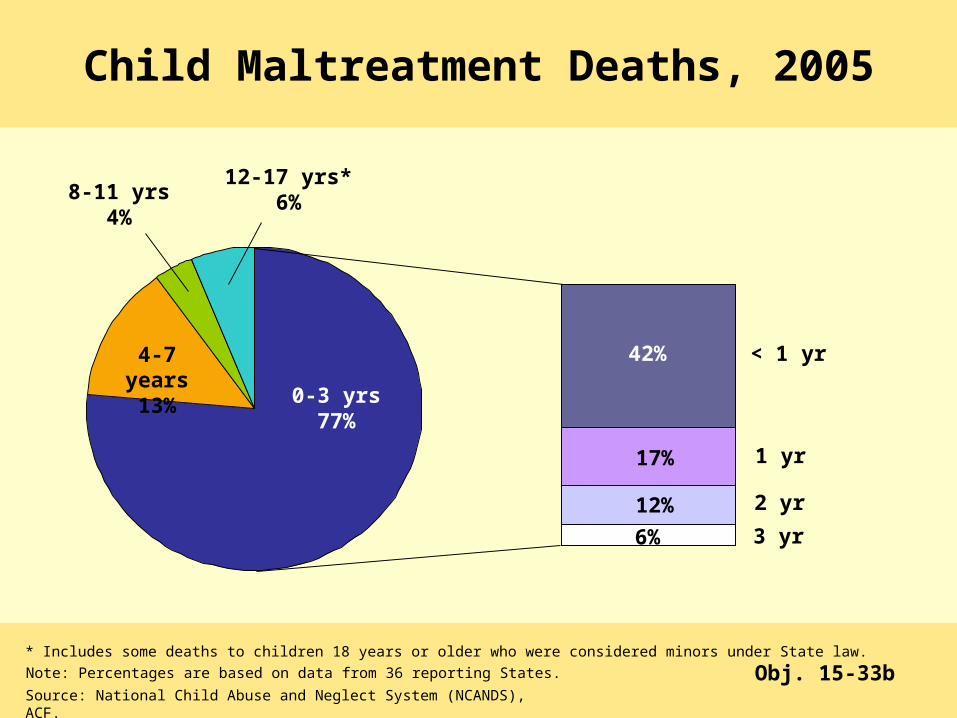
Source: National Child Abuse and Neglect System (NCANDS), ACF.
Note: Percentages are based on data from 36 reporting States.
0-3 yrs77%
4-7 years13%
8-11 yrs4%
Child Maltreatment Deaths, 2005
Obj. 15-33b
12-17 yrs*6%
17%
12%
3 yr
42%
2 yr
1 yr
< 1 yr
6%
* Includes some deaths to children 18 years or older who were considered minors under State law.
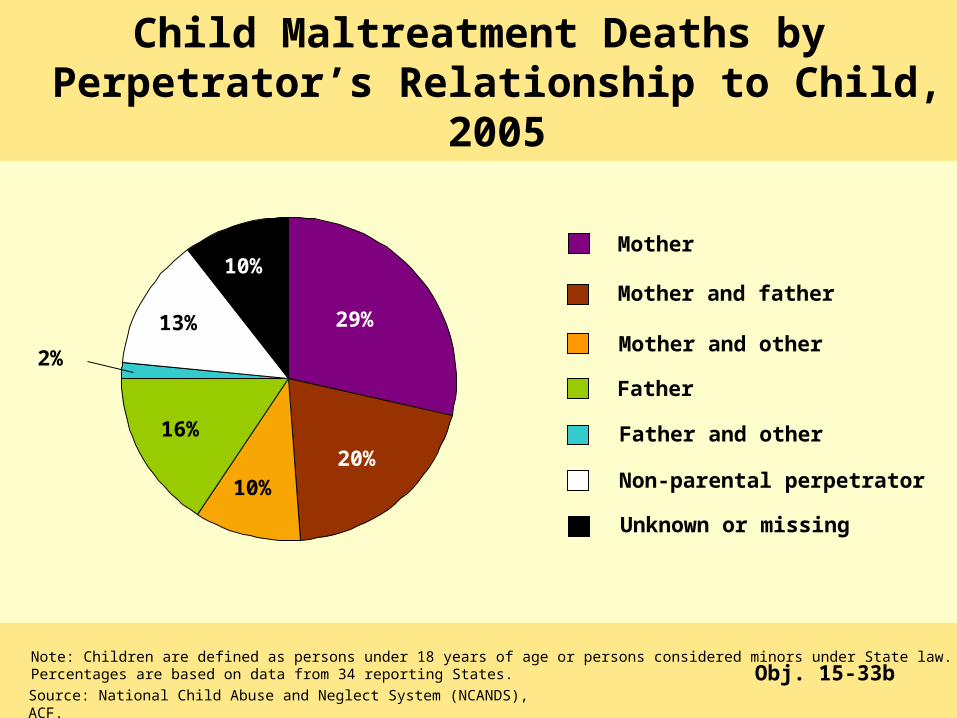
Source: National Child Abuse and Neglect System (NCANDS), ACF.
Note: Children are defined as persons under 18 years of age or persons considered minors under State law.Percentages are based on data from 34 reporting States.
29%
16%20%
Mother
Mother and father
Non-parental perpetrator
Father and other
Child Maltreatment Deaths by Perpetrator’s Relationship to Child,
2005
Obj. 15-33b
Father
Mother and other
10%
13%
2%
Unknown or missing
10%
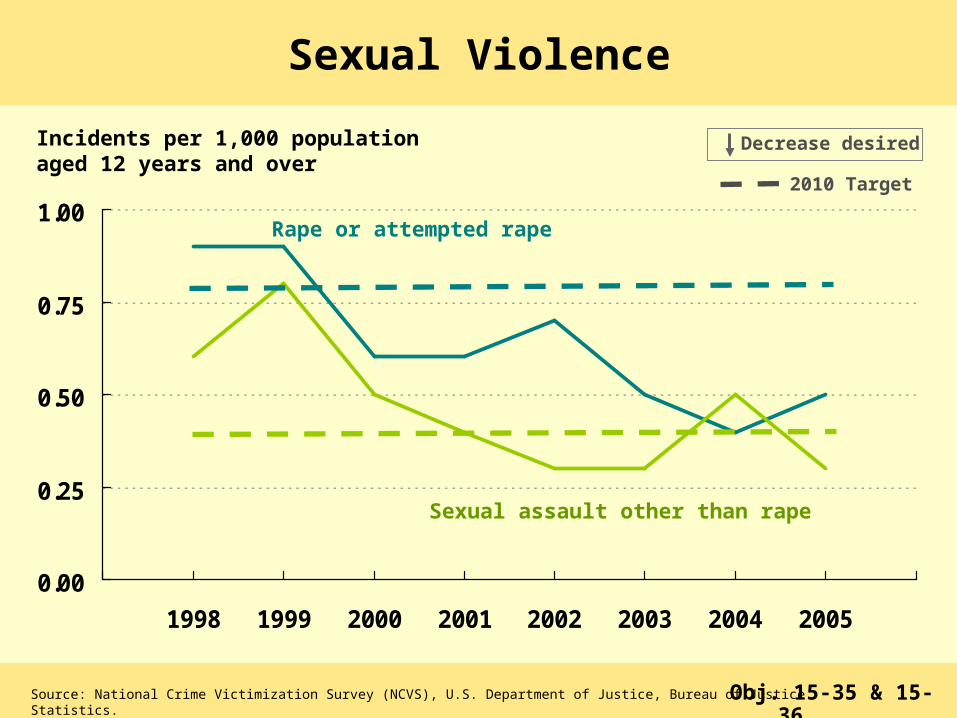
0.00
0.25
0.50
0.75
1.00
1998 1999 2000 2001 2002 2003 2004 2005
Sexual Violence
Obj. 15-35 & 15-36
Incidents per 1,000 populationaged 12 years and over
Sexual assault other than rape
Rape or attempted rape
Source: National Crime Victimization Survey (NCVS), U.S. Department of Justice, Bureau of Justice Statistics.
Decrease desired
2010 Target
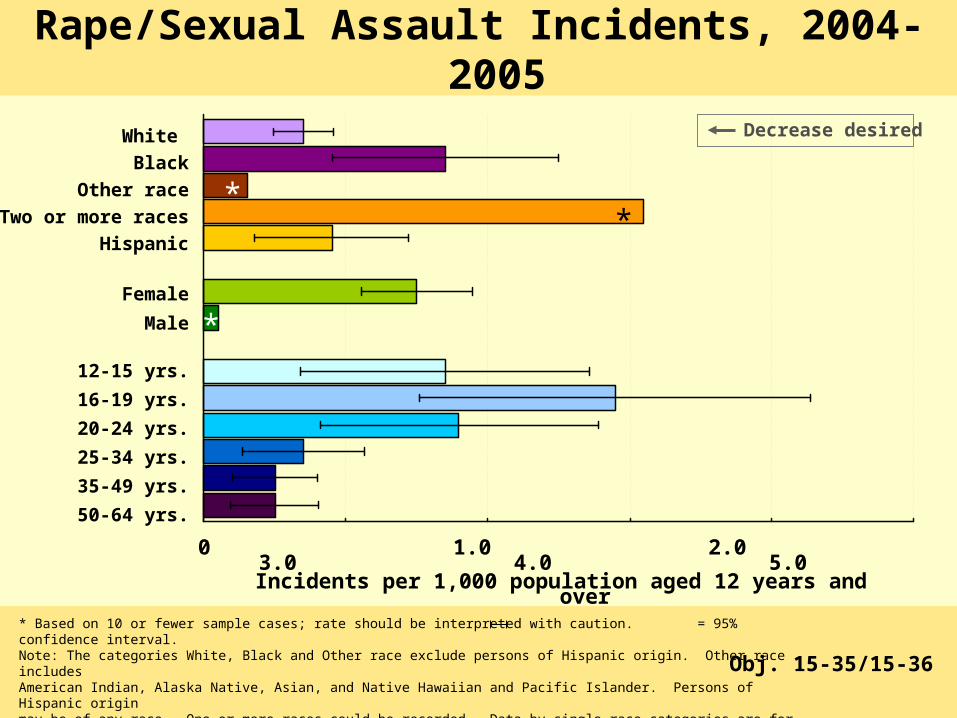
0 1.0 2.0 3.0 4.0 5.0
White Black
Other raceTwo or more races
Hispanic
Female
Male
12-15 yrs.
16-19 yrs.
20-24 yrs.
25-34 yrs.
35-49 yrs.
50-64 yrs.
Rape/Sexual Assault Incidents, 2004-2005
Incidents per 1,000 population aged 12 years and over
Decrease desired
*
*
*
* Based on 10 or fewer sample cases; rate should be interpreted with caution. = 95% confidence interval. Note: The categories White, Black and Other race exclude persons of Hispanic origin. Other race includes American Indian, Alaska Native, Asian, and Native Hawaiian and Pacific Islander. Persons of Hispanic origin may be of any race. One or more races could be recorded. Data by single race categories are for persons for whom only one racial group was recorded. Source: National Crime Victimization Survey (NCVS), U.S. Department of Justice, Bureau of Justice Statistics.
Obj. 15-35/15-36
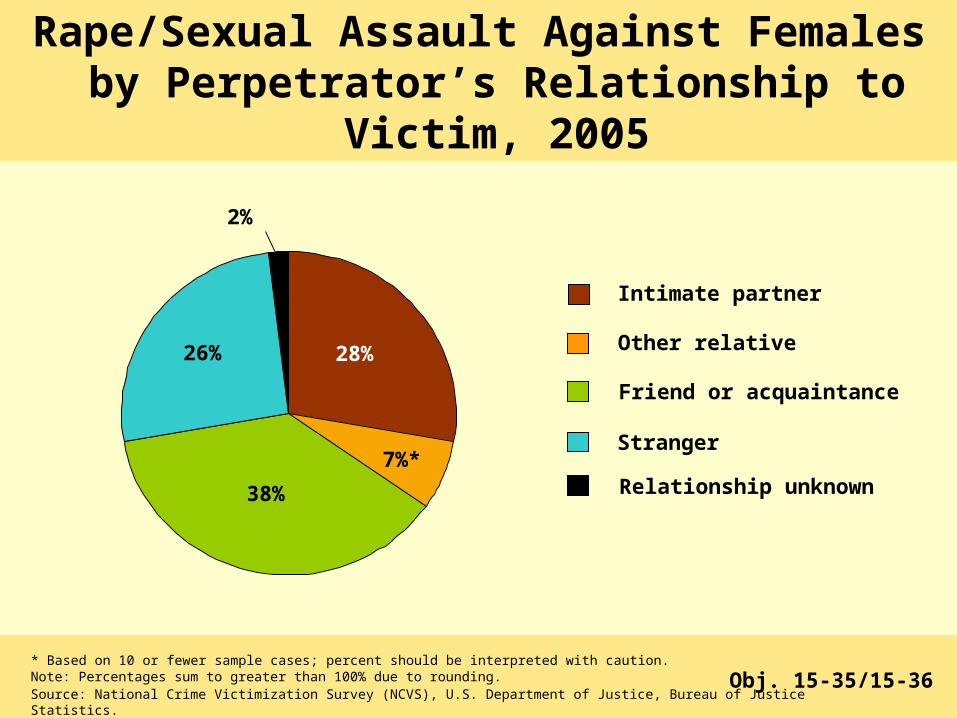
* Based on 10 or fewer sample cases; percent should be interpreted with caution.
28%26%
7%*
Intimate partner
Other relative
Relationship unknown
Stranger
Friend or acquaintance
38%
2%
Obj. 15-35/15-36Note: Percentages sum to greater than 100% due to rounding. Source: National Crime Victimization Survey (NCVS), U.S. Department of Justice, Bureau of Justice Statistics.
Rape/Sexual Assault Against Females by Perpetrator’s Relationship to
Victim, 2005
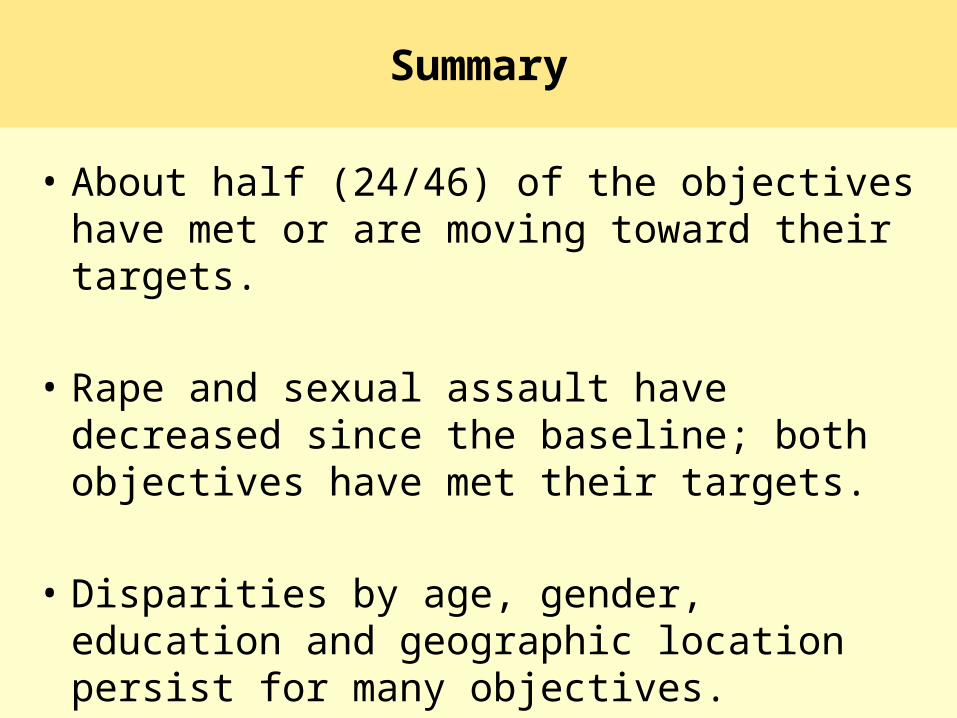
• About half (24/46) of the objectives have met or are moving toward their targets.
• Rape and sexual assault have decreased since the baseline; both objectives have met their targets.
• Disparities by age, gender, education and geographic location persist for many objectives.
Summary
Progress review data and slides
are available on the web at:
http://www.cdc.gov/nchs/hphome.htmhttp://www.cdc.gov/nchs/hphome.htm