Embed Size (px)
Citation preview
Injury and Violence
Healthy Kansans 2010
Steering Committee Meeting
May 12, 2005
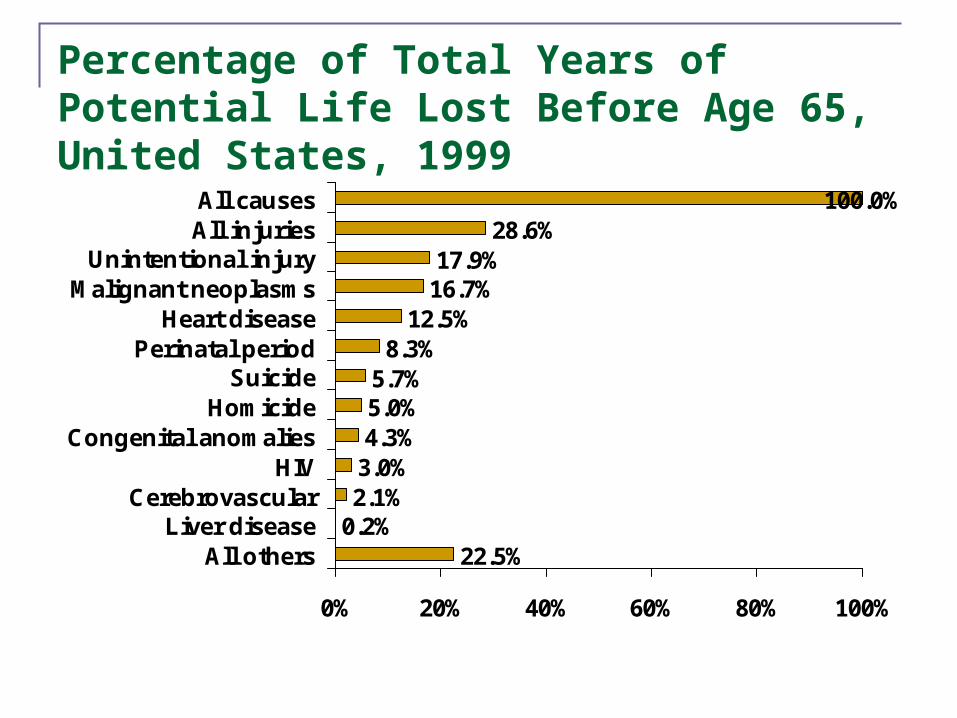
Percentage of Total Years of Potential Life Lost Before Age 65, United States, 1999
22.5%0.2%2.1%3.0%4.3%5.0%5.7%
8.3%12.5%
16.7%17.9%
28.6%100.0%
0% 20% 40% 60% 80% 100%
All othersLiver disease
CerebrovascularHIV
Congenital anomaliesHomicide
SuicidePerinatal period
Heart diseaseMalignant neoplasms
Unintentional injuryAll injuriesAll causes
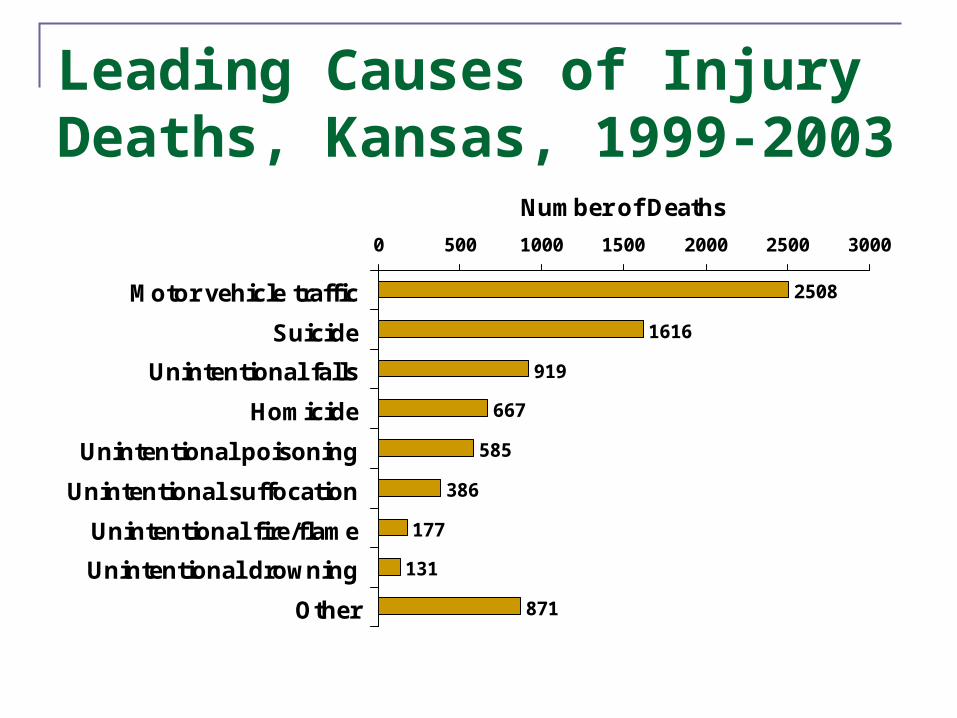
Leading Causes of Injury Deaths, Kansas, 1999-2003
2508
1616
919
667
585
386
177
131
871
0 500 1000 1500 2000 2500 3000
Motor vehicle traffic
Suicide
Unintentional falls
Homicide
Unintentional poisoning
Unintentional suffocation
Unintentional fire/flame
Unintentional drowning
Other
Number of Deaths
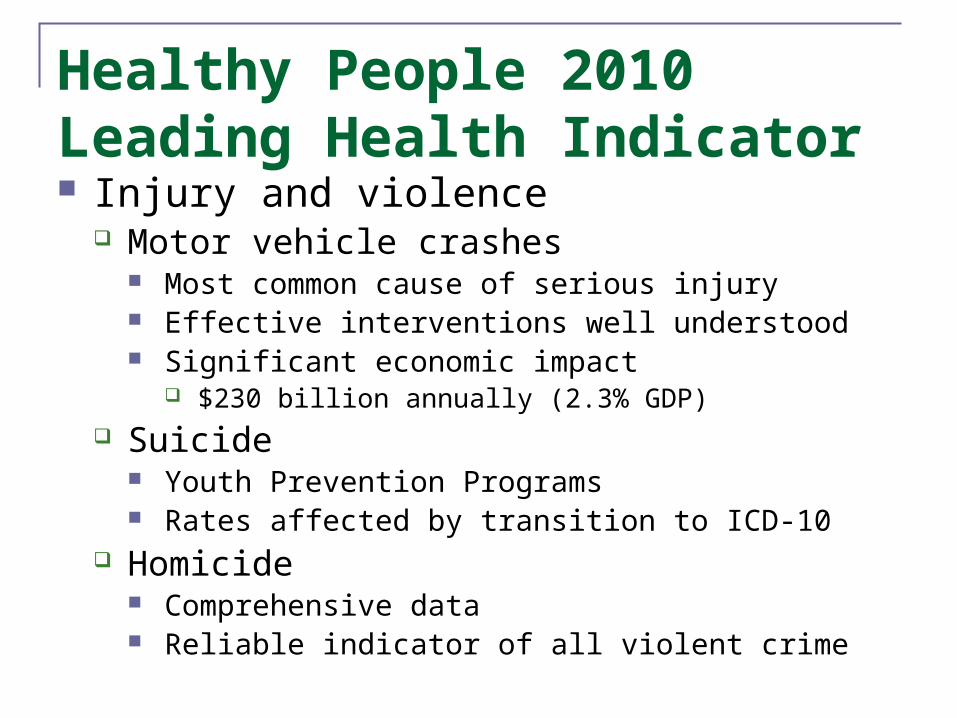
Healthy People 2010 Leading Health Indicator Injury and violence
Motor vehicle crashes Most common cause of serious injury Effective interventions well understood Significant economic impact
$230 billion annually (2.3% GDP) Suicide
Youth Prevention Programs Rates affected by transition to ICD-10
Homicide Comprehensive data Reliable indicator of all violent crime
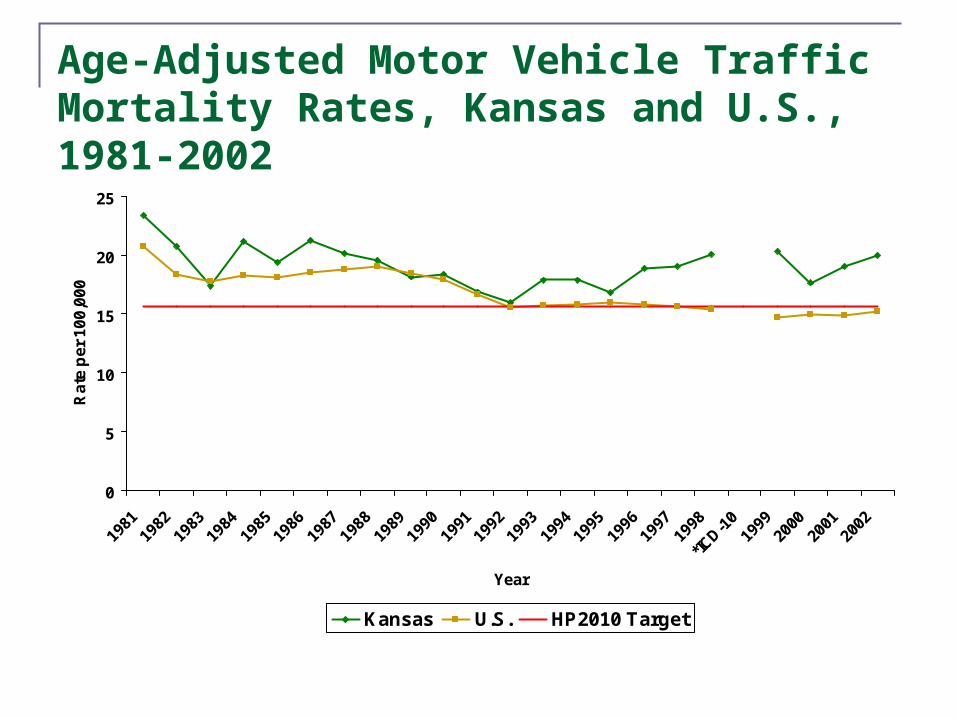
Age-Adjusted Motor Vehicle Traffic Mortality Rates, Kansas and U.S., 1981-2002
0
5
10
15
20
25
1981
1982
1983
1984
1985
1986
1987
1988
1989
1990
1991
1992
1993
1994
1995
1996
1997
1998
*ICD-1
019
9920
0020
0120
02
Year
Ra
te p
er
10
0,0
00
Kansas U.S. HP2010 Target
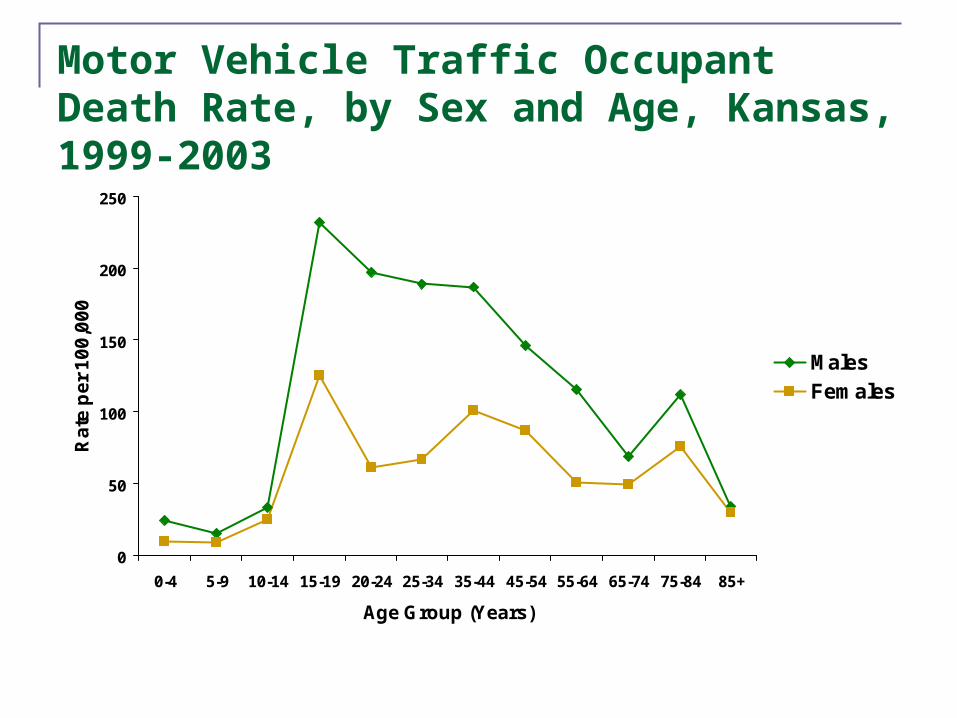
Motor Vehicle Traffic Occupant Death Rate, by Sex and Age, Kansas, 1999-2003
0
50
100
150
200
250
0-4 5-9 10-14 15-19 20-24 25-34 35-44 45-54 55-64 65-74 75-84 85+
Age Group (Years)
Ra
te p
er
10
0,0
00
MalesFemales
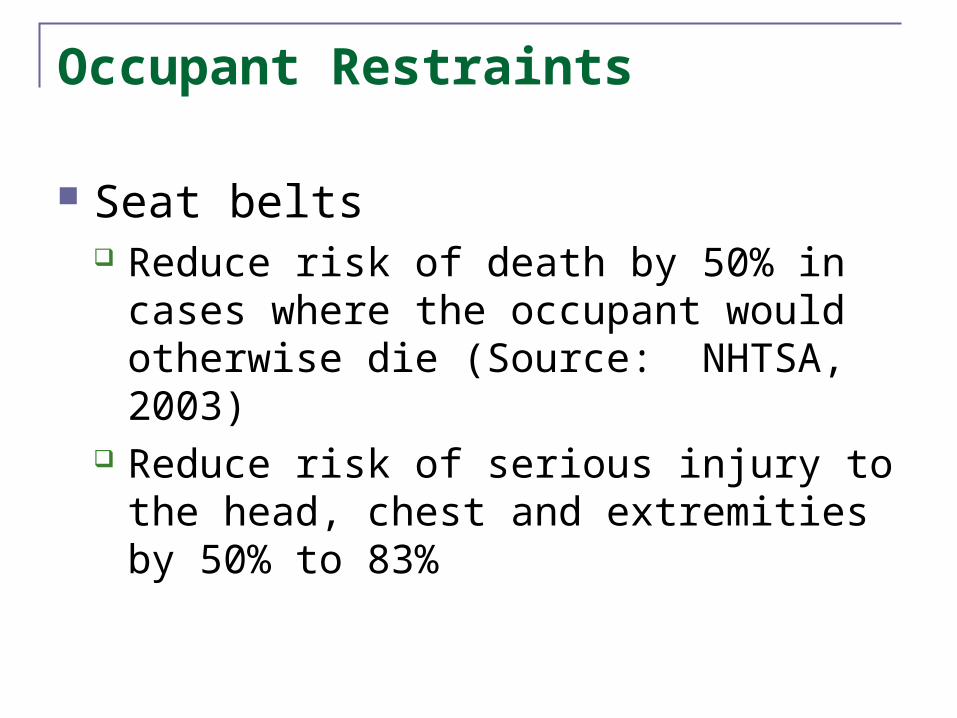
Occupant Restraints
Seat belts Reduce risk of death by 50% in cases
where the occupant would otherwise die (Source: NHTSA, 2003)
Reduce risk of serious injury to the head, chest and extremities by 50% to 83%
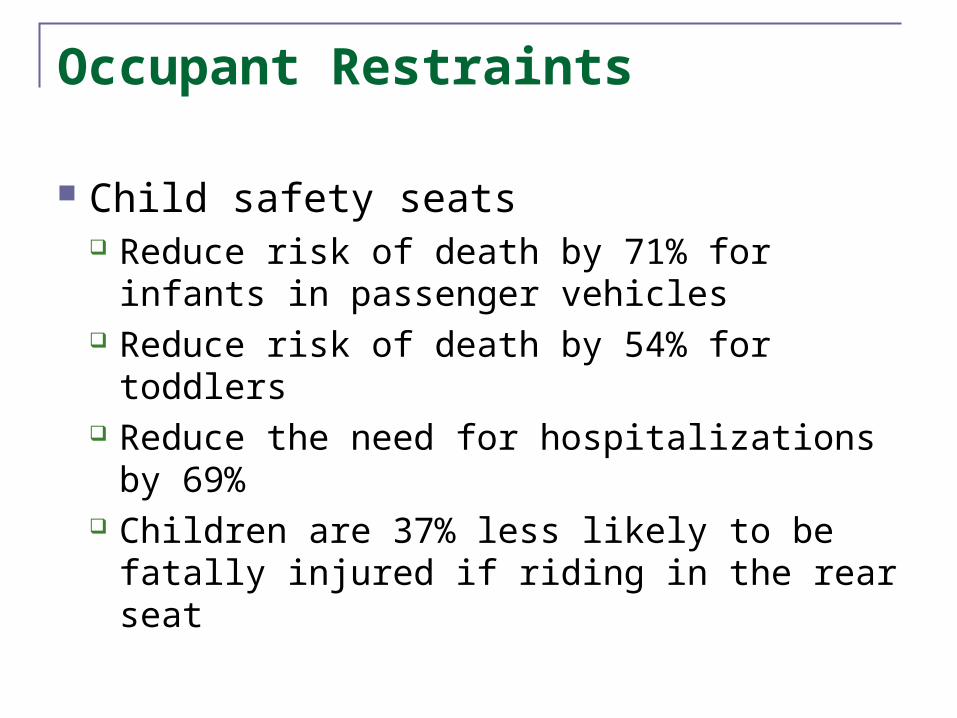
Occupant Restraints
Child safety seats Reduce risk of death by 71% for infants in
passenger vehicles Reduce risk of death by 54% for toddlers Reduce the need for hospitalizations by
69% Children are 37% less likely to be fatally
injured if riding in the rear seat
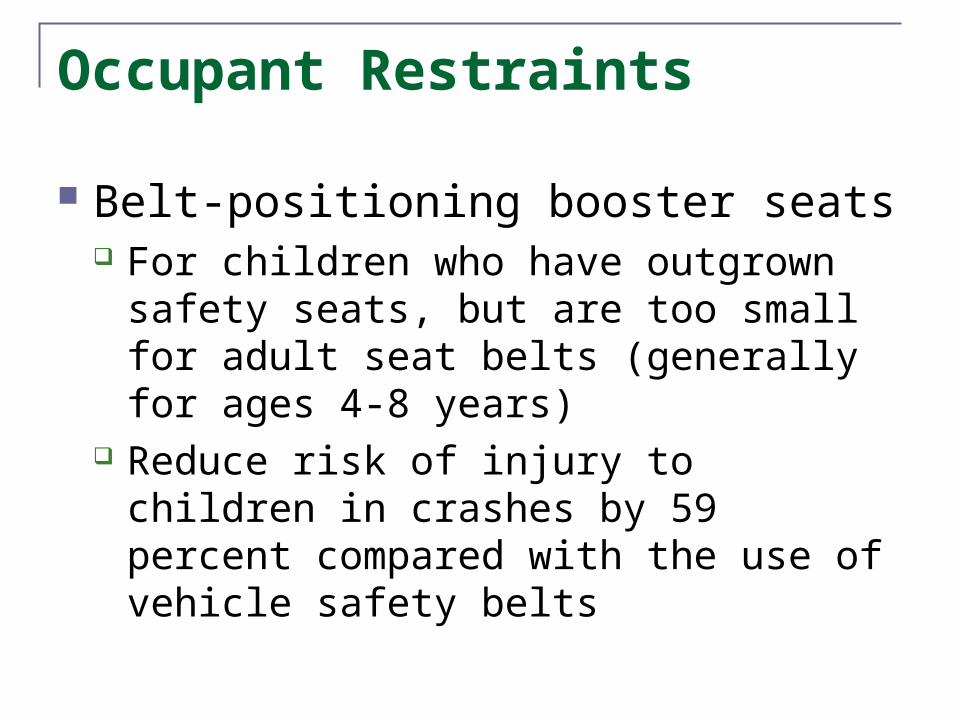
Occupant Restraints
Belt-positioning booster seats For children who have outgrown safety
seats, but are too small for adult seat belts (generally for ages 4-8 years)
Reduce risk of injury to children in crashes by 59 percent compared with the use of vehicle safety belts
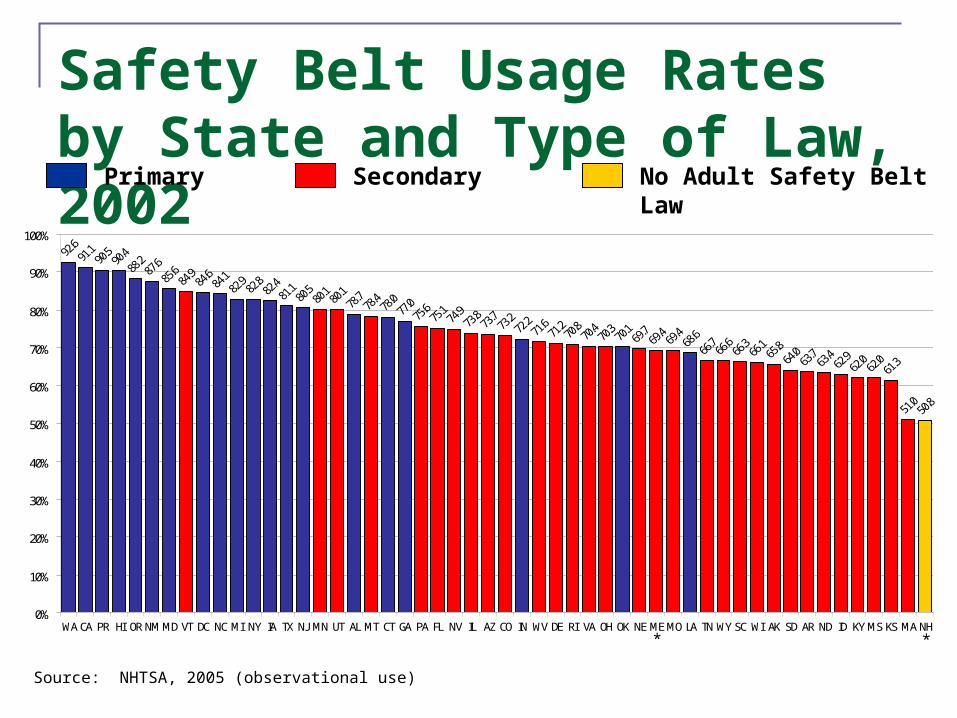
Safety Belt Usage Rates by State and Type of Law, 2002
0%
10%
20%
30%
40%
50%
60%
70%
80%
90%
100%
WACA PR HI ORNMMDVT DCNCMI NY IA TX NJ MNUT ALMT CT GA PA FL NV IL AZCO IN WVDE RI VA OHOK NEMEMOLA TNWYSCWI AK SDAR ND ID KYMSKSMANH* *
Primary
Secondary No Adult Safety Belt Law
Source: NHTSA, 2005 (observational use)
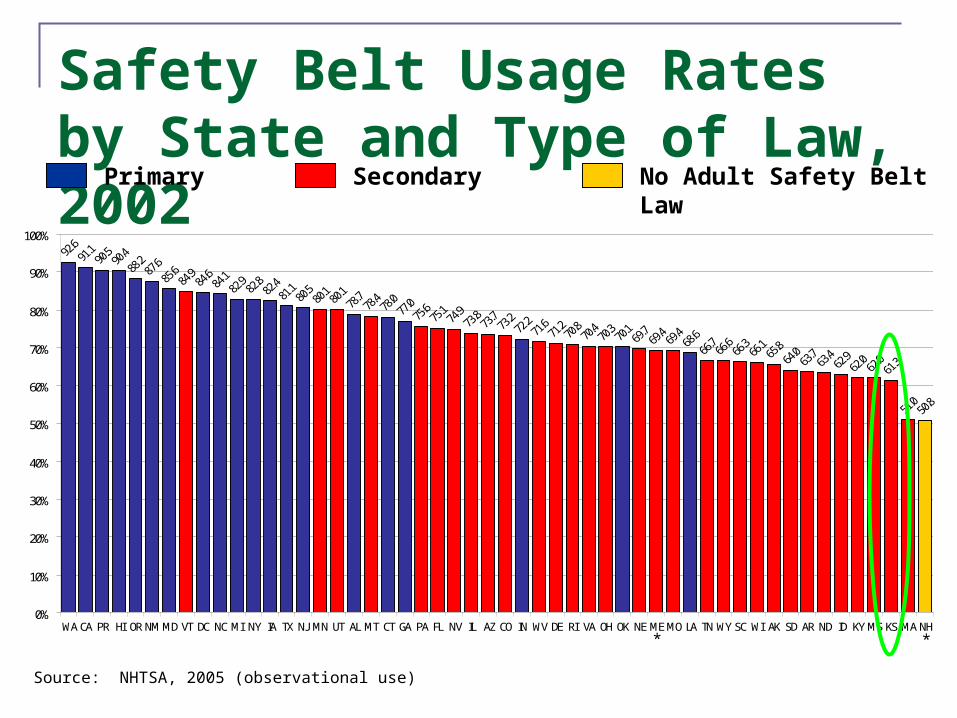
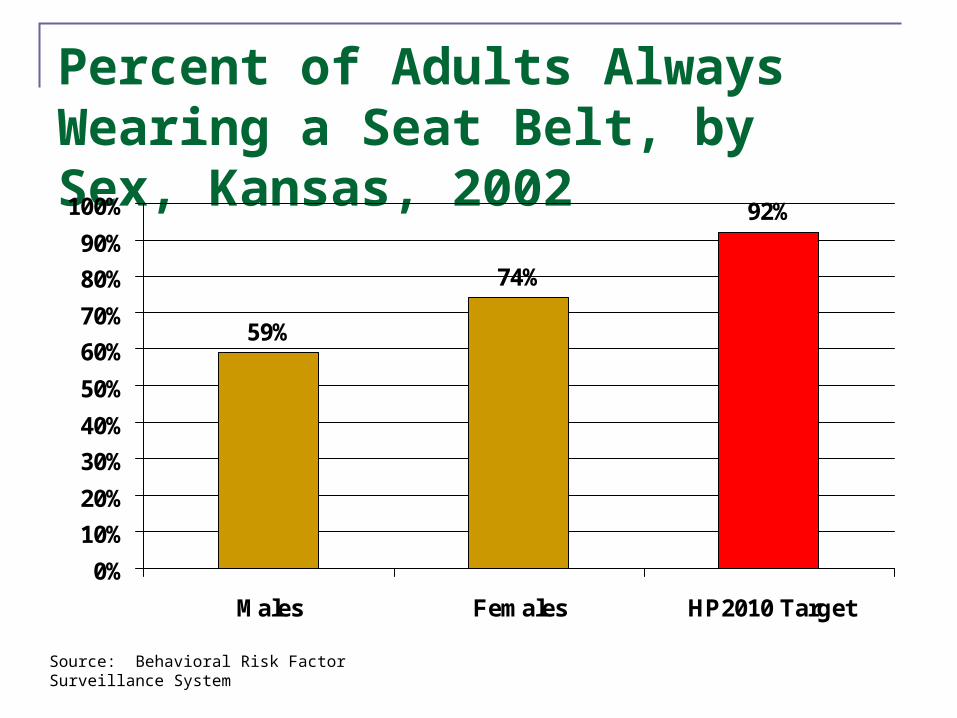
Percent of Adults Always Wearing a Seat Belt, by Sex, Kansas, 2002
59%
74%
92%
0%
10%
20%
30%
40%
50%
60%
70%
80%
90%
100%
Males Females HP2010 Target
Source: Behavioral Risk Factor Surveillance System
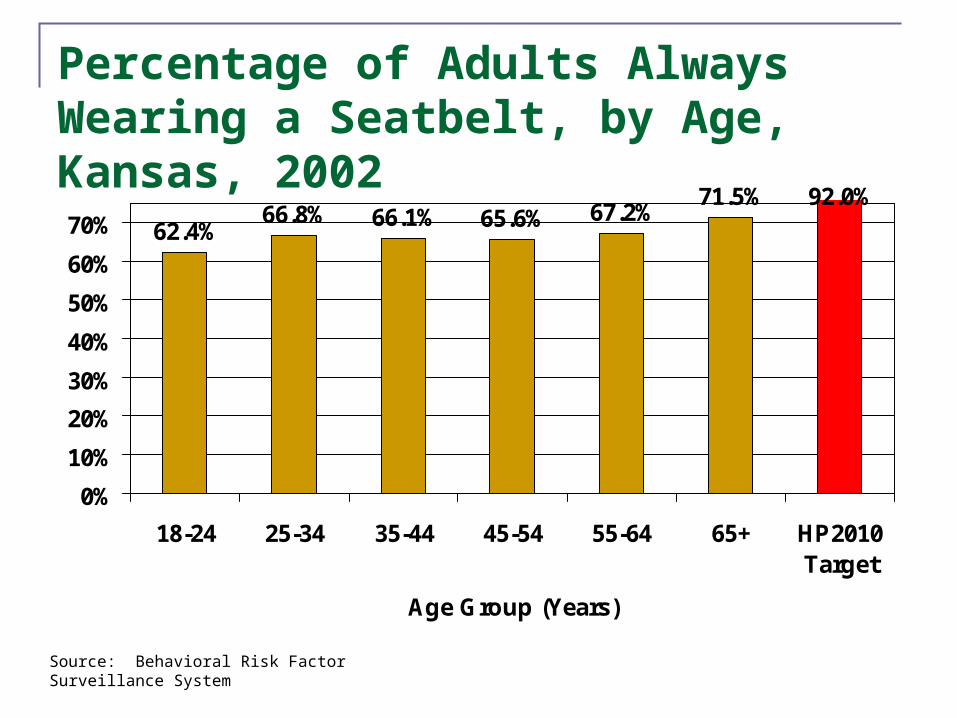
Percentage of Adults Always Wearing a Seatbelt, by Age, Kansas, 2002
62.4%66.8% 66.1% 65.6% 67.2%
71.5% 92.0%
0%
10%
20%
30%
40%
50%
60%
70%
18-24 25-34 35-44 45-54 55-64 65+ HP2010Target
Age Group (Years)
Source: Behavioral Risk Factor Surveillance System
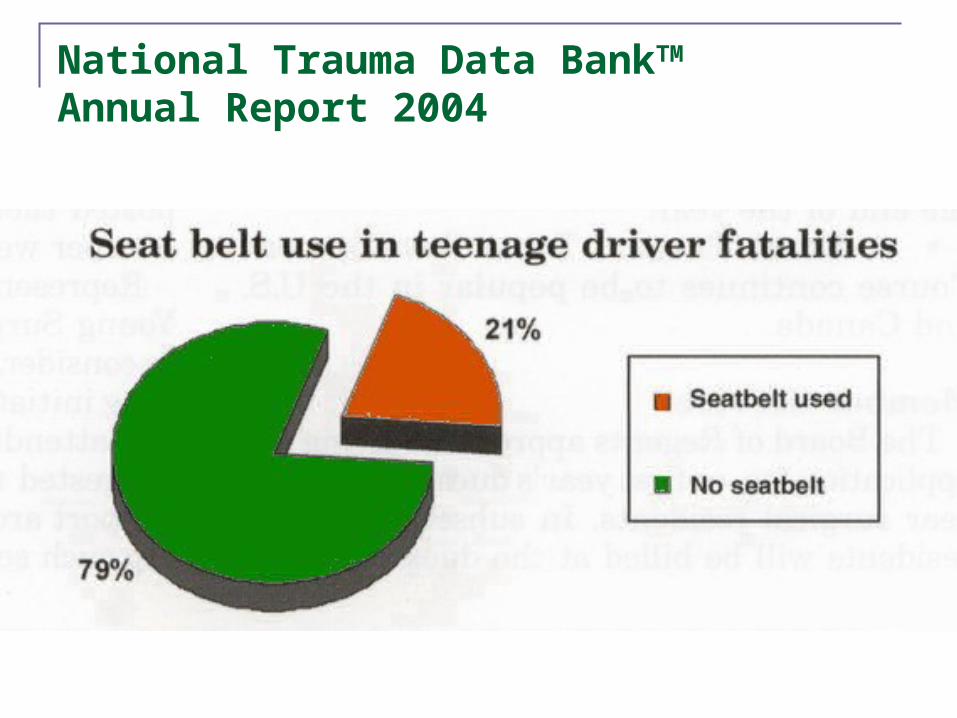
National Trauma Data BankTM
Annual Report 2004
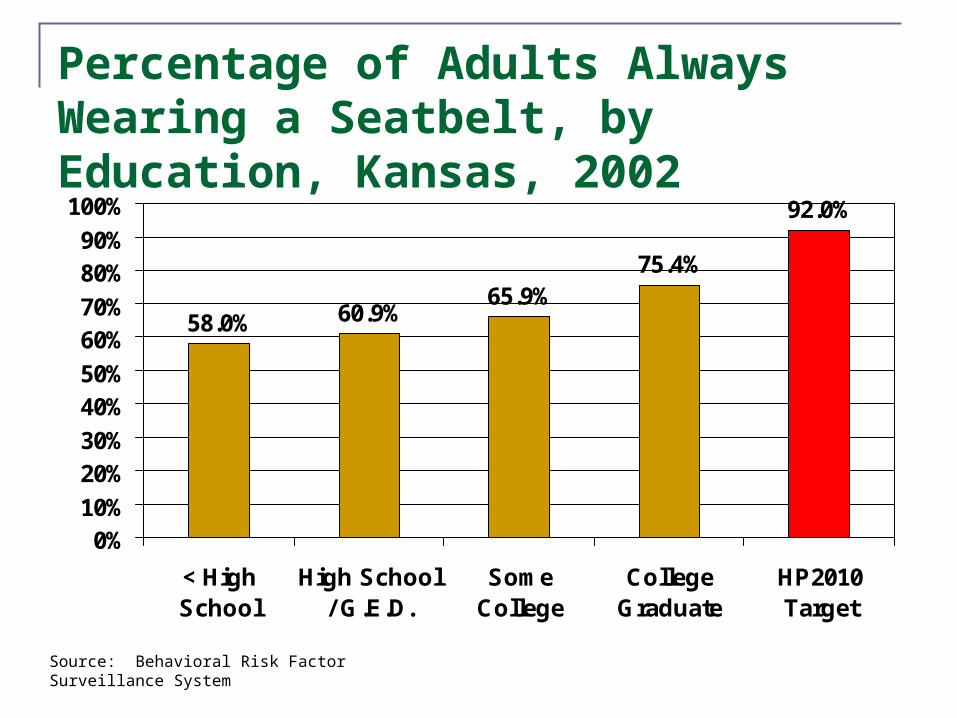
Percentage of Adults Always Wearing a Seatbelt, by Education, Kansas, 2002
58.0% 60.9%65.9%
75.4%
92.0%
0%10%
20%30%
40%50%
60%70%
80%90%
100%
< HighSchool
High School/ G.E.D.
SomeCollege
CollegeGraduate
HP2010Target
Source: Behavioral Risk Factor Surveillance System
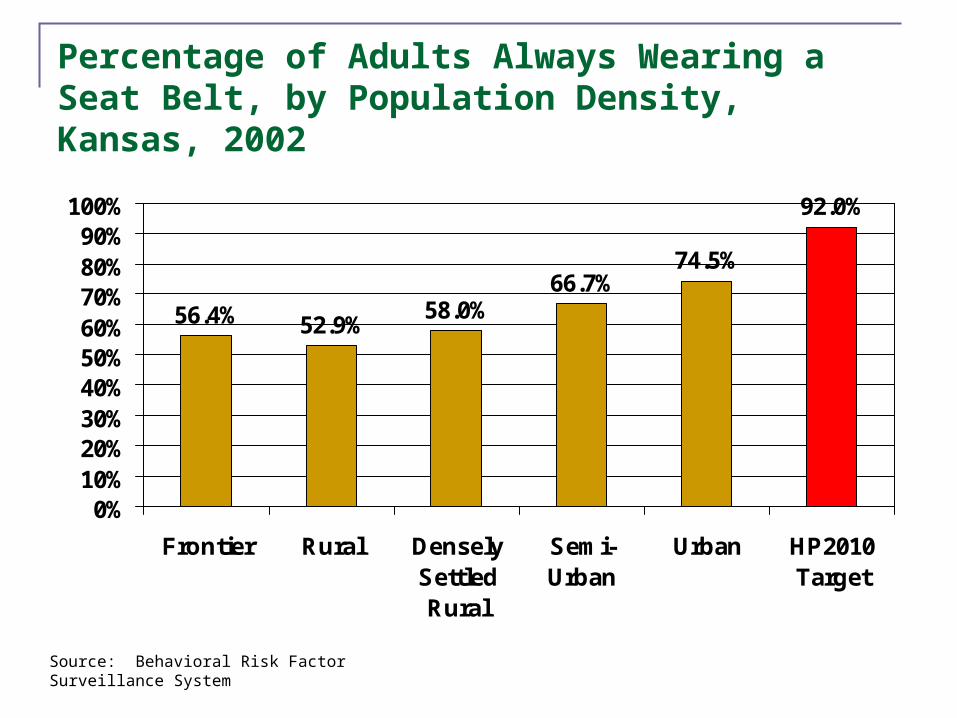
Percentage of Adults Always Wearing a Seat Belt, by Population Density, Kansas, 2002
56.4% 52.9%58.0%
66.7%74.5%
92.0%
0%10%20%30%40%50%60%70%80%90%
100%
Frontier Rural DenselySettledRural
Semi-Urban
Urban HP2010Target
Source: Behavioral Risk Factor Surveillance System
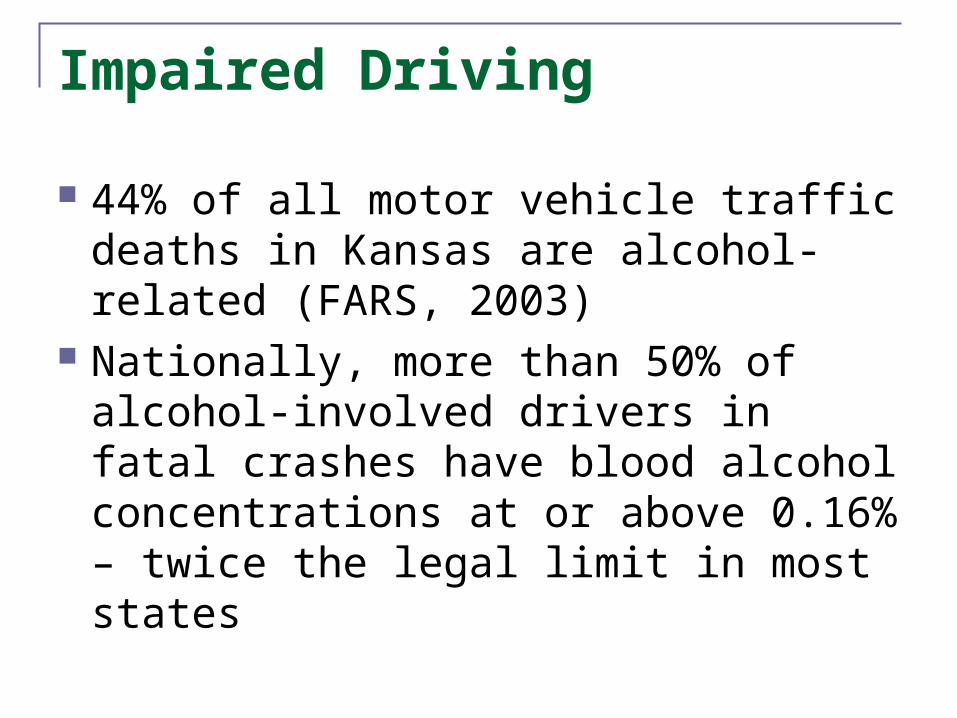
Impaired Driving
44% of all motor vehicle traffic deaths in Kansas are alcohol-related (FARS, 2003)
Nationally, more than 50% of alcohol-involved drivers in fatal crashes have blood alcohol concentrations at or above 0.16% – twice the legal limit in most states
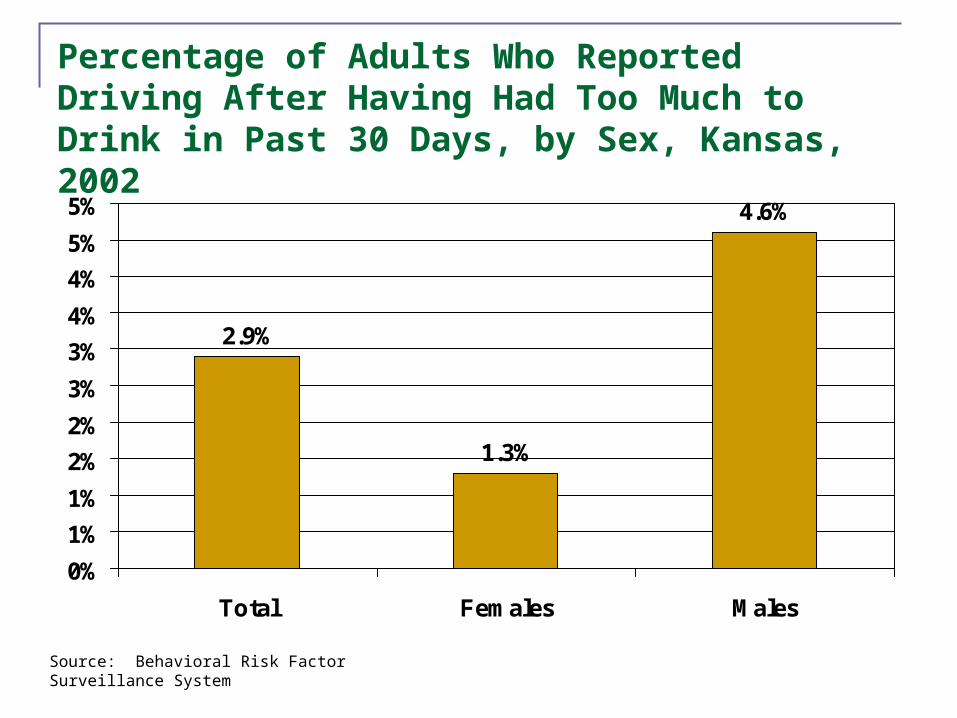
Percentage of Adults Who Reported Driving After Having Had Too Much to Drink in Past 30 Days, by Sex, Kansas, 2002
2.9%
1.3%
4.6%
0%
1%
1%
2%
2%
3%
3%
4%
4%
5%
5%
Total Females Males
Source: Behavioral Risk Factor Surveillance System
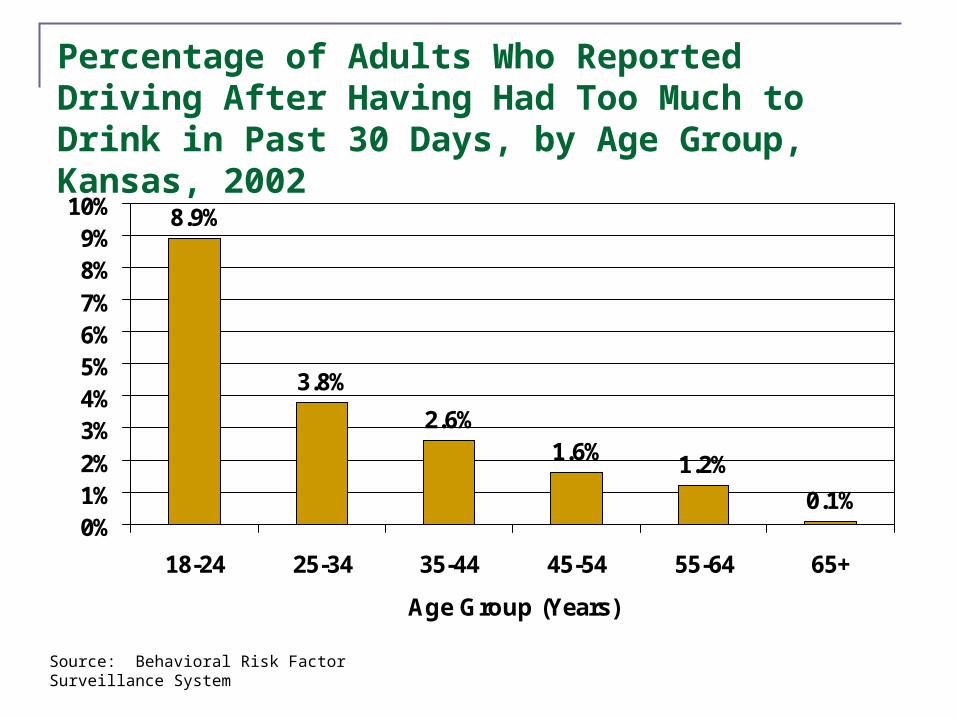
Percentage of Adults Who Reported Driving After Having Had Too Much to Drink in Past 30 Days, by Age Group, Kansas, 2002
8.9%
3.8%
2.6%1.6% 1.2%
0.1%0%1%2%3%4%5%6%7%8%9%
10%
18-24 25-34 35-44 45-54 55-64 65+
Age Group (Years)
Source: Behavioral Risk Factor Surveillance System
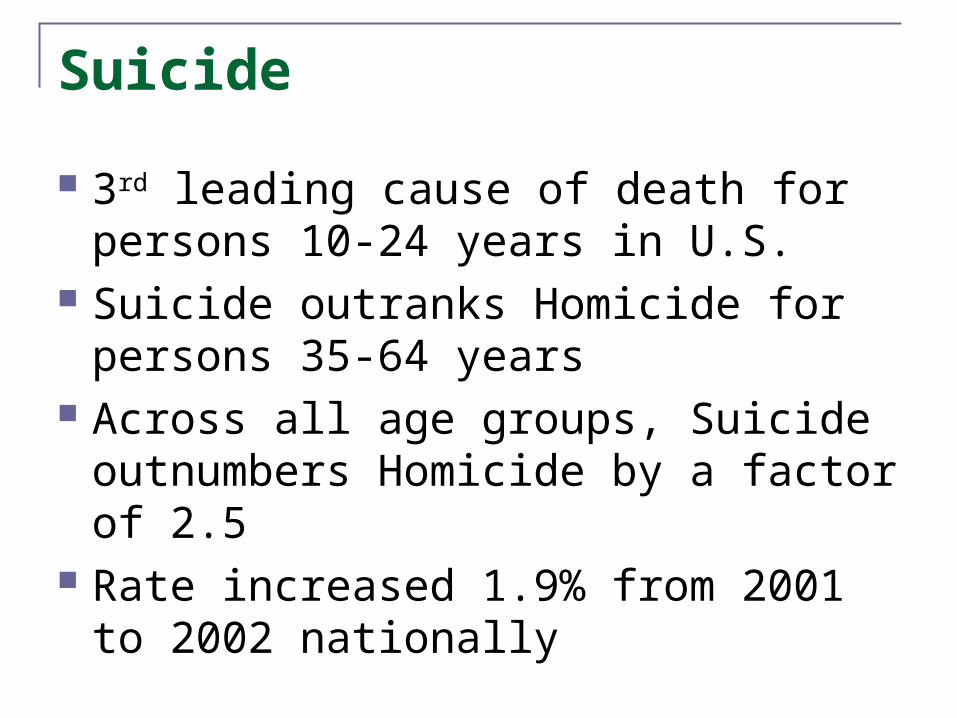
Suicide
3rd leading cause of death for persons 10-24 years in U.S.
Suicide outranks Homicide for persons 35-64 years
Across all age groups, Suicide outnumbers Homicide by a factor of 2.5
Rate increased 1.9% from 2001 to 2002 nationally
Suicide: Remove the Stigma
Twice as many Suicide deaths as HIV/AIDS deaths each year National and International attention
Very limited Public Awareness
Homicide
2nd leading cause of death for persons 15-24 years in U.S.
Leading cause of death for African Americans / Blacks ages 15-24 years in U.S. and Kansas
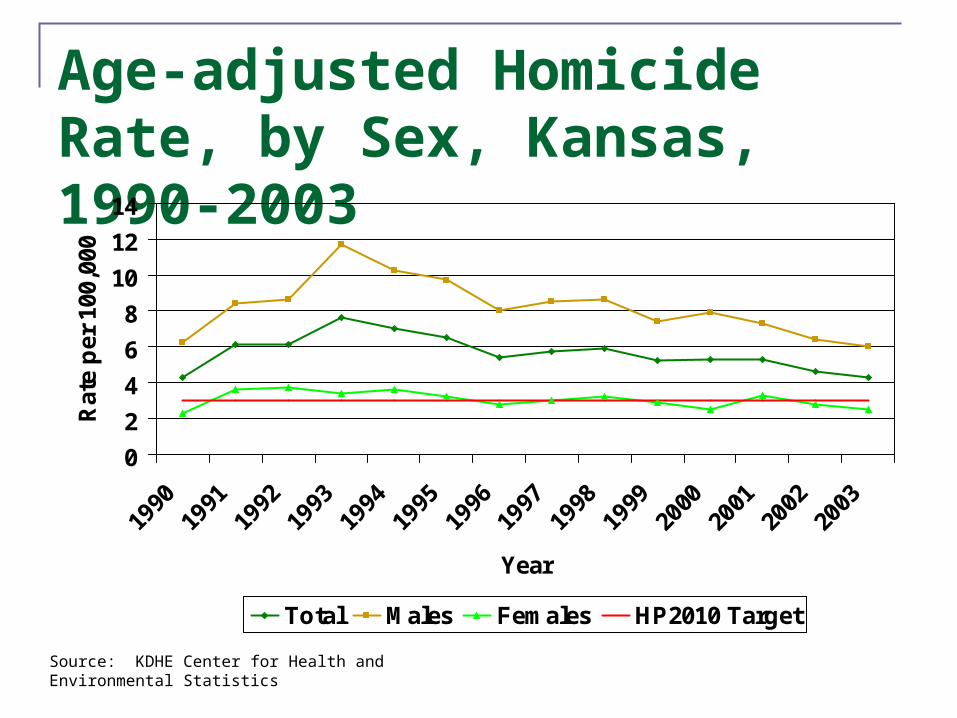
Age-adjusted Homicide Rate, by Sex, Kansas, 1990-2003
0
2
4
6
8
10
12
14
1990
1991
1992
1993
1994
1995
1996
1997
1998
1999
2000
2001
2002
2003
Year
Rat
e p
er 1
00,0
00
Total Males Females HP2010 Target
Source: KDHE Center for Health and Environmental Statistics
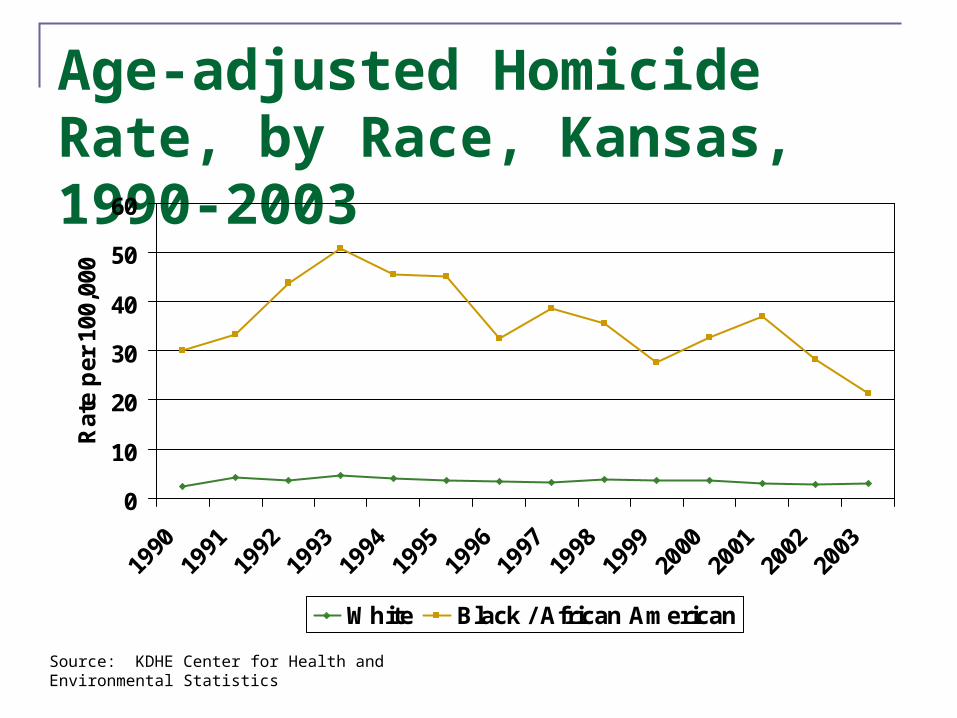
Age-adjusted Homicide Rate, by Race, Kansas, 1990-2003
0
10
20
30
40
50
60
1990
1991
1992
1993
1994
1995
1996
1997
1998
1999
2000
2001
2002
2003
Rat
e p
er 1
00,0
00
White Black / African American
Source: KDHE Center for Health and Environmental Statistics
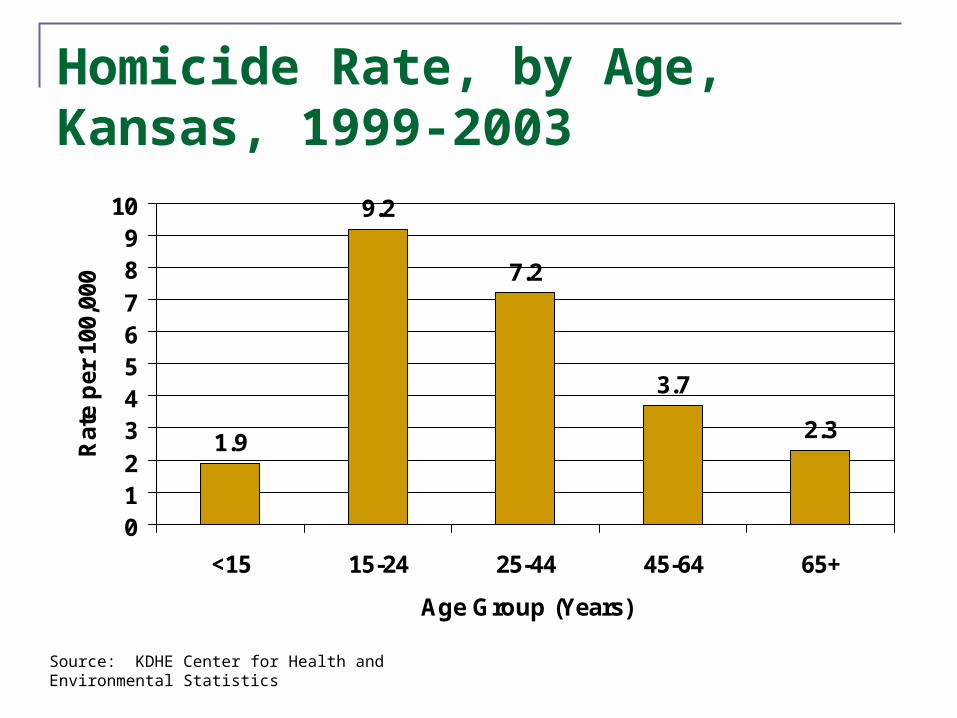
Homicide Rate, by Age, Kansas, 1999-2003
1.9
9.2
7.2
3.7
2.3
0123456789
10
<15 15-24 25-44 45-64 65+
Age Group (Years)
Rat
e p
er 1
00,0
00
Source: KDHE Center for Health and Environmental Statistics
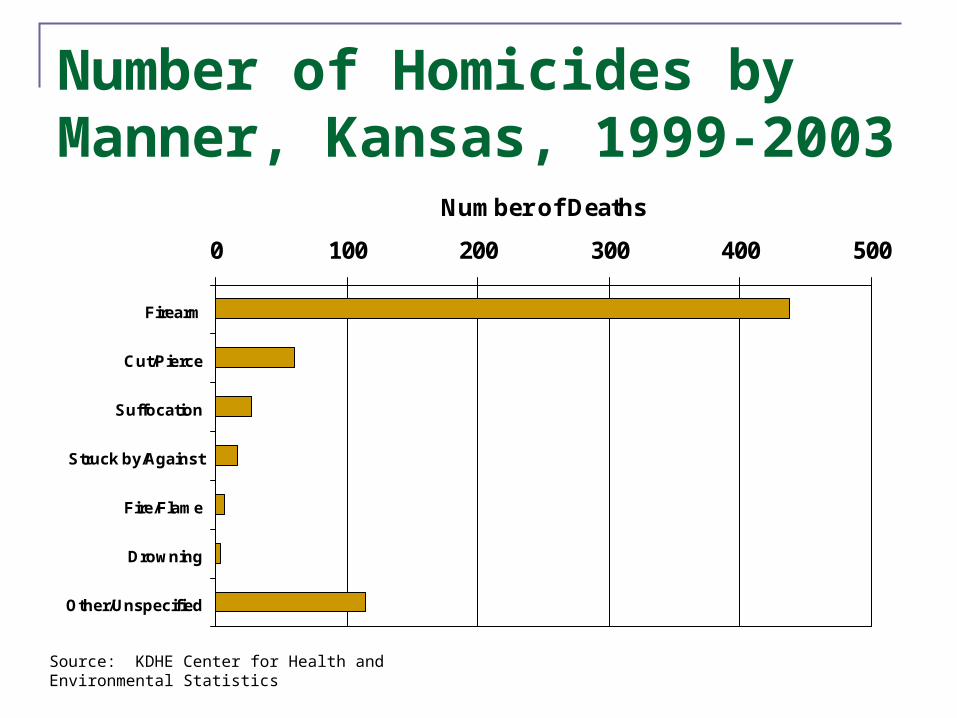
Number of Homicides by Manner, Kansas, 1999-2003
0 100 200 300 400 500
Firearm
Cut/Pierce
Suffocation
Struck by/Against
Fire/Flame
Drowning
Other/Unspecified
Number of Deaths
Source: KDHE Center for Health and Environmental Statistics
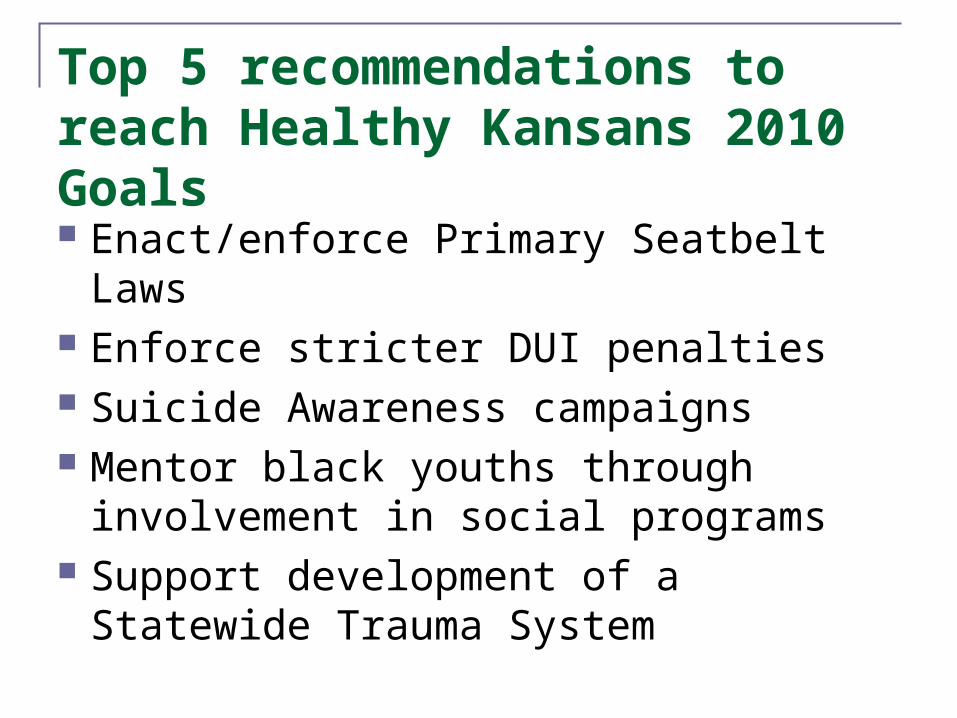
Top 5 recommendations to reach Healthy Kansans 2010 Goals
Enact/enforce Primary Seatbelt Laws Enforce stricter DUI penalties Suicide Awareness campaigns Mentor black youths through
involvement in social programs Support development of a Statewide
Trauma System
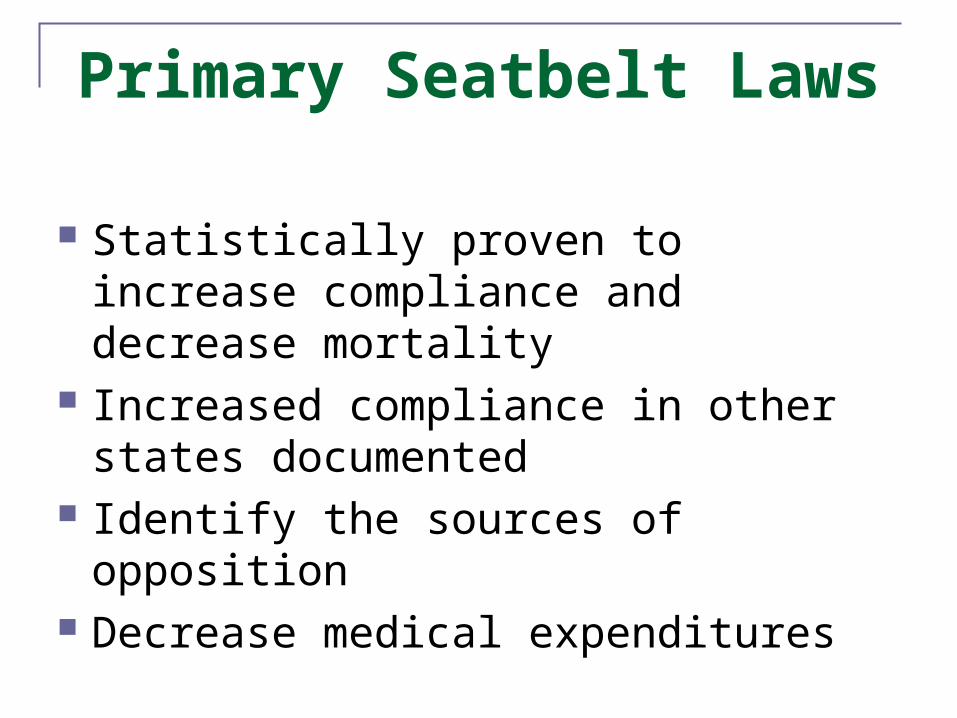
Primary Seatbelt Laws
Statistically proven to increase compliance and decrease mortality
Increased compliance in other states documented
Identify the sources of opposition Decrease medical expenditures
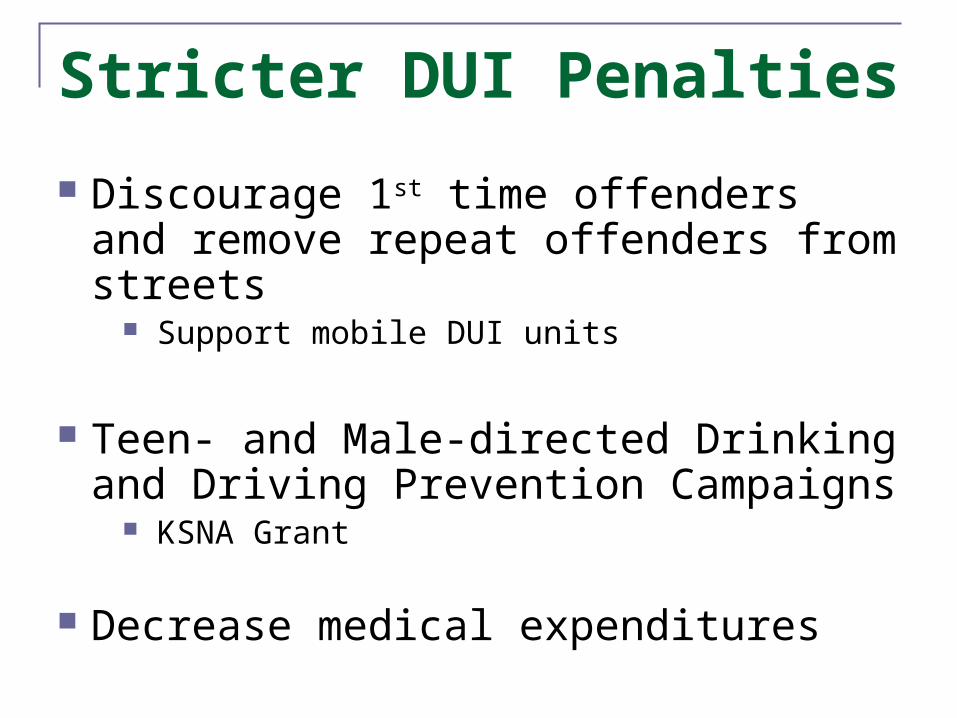
Stricter DUI Penalties
Discourage 1st time offenders and remove repeat offenders from streets
Support mobile DUI units
Teen- and Male-directed Drinking and Driving Prevention Campaigns
KSNA Grant
Decrease medical expenditures
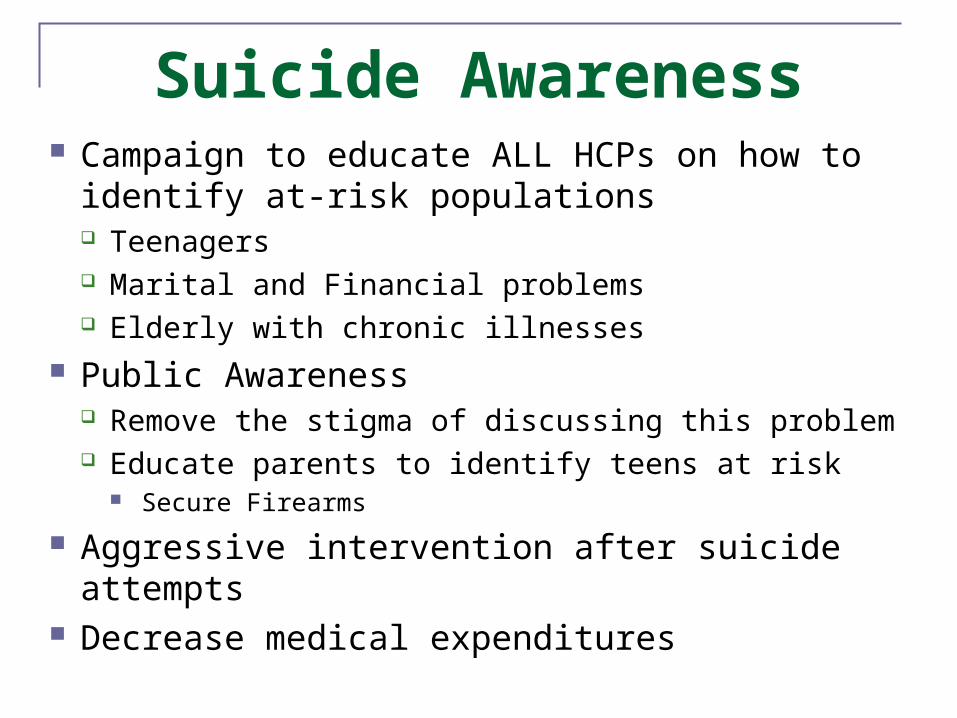
Suicide Awareness Campaign to educate ALL HCPs on how to
identify at-risk populations Teenagers Marital and Financial problems Elderly with chronic illnesses
Public Awareness Remove the stigma of discussing this problem Educate parents to identify teens at risk
Secure Firearms
Aggressive intervention after suicide attempts Decrease medical expenditures
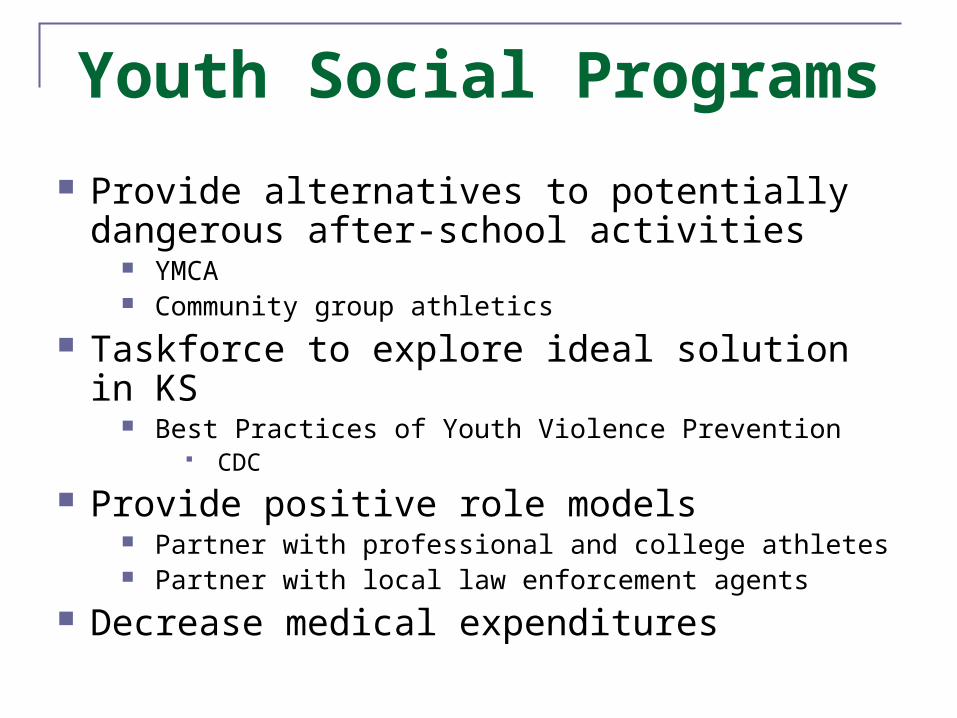
Youth Social Programs
Provide alternatives to potentially dangerous after-school activities
YMCA Community group athletics
Taskforce to explore ideal solution in KS Best Practices of Youth Violence Prevention
CDC
Provide positive role models Partner with professional and college athletes Partner with local law enforcement agents
Decrease medical expenditures
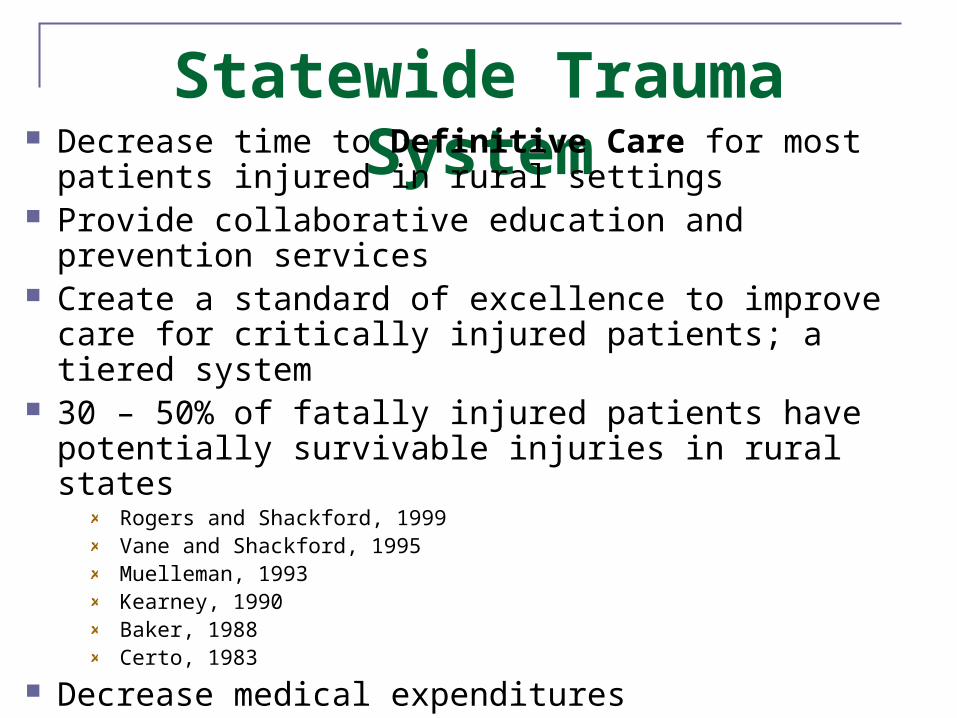
Statewide Trauma System Decrease time to Definitive Care for most patients
injured in rural settings Provide collaborative education and prevention
services Create a standard of excellence to improve care for
critically injured patients; a tiered system 30 – 50% of fatally injured patients have potentially
survivable injuries in rural statesRogers and Shackford, 1999Vane and Shackford, 1995 Muelleman, 1993Kearney, 1990Baker, 1988Certo, 1983
Decrease medical expenditures
3 reasons to provide consistent, fast, and perfect trauma care: