Embed Size (px)
Citation preview
n engl j med 373;21 nejm.org november 19, 2015 2089
correspondence
reflects improvements in patient care rather than case selection.
In response to de Miguel-Yanes et al.: we did not evaluate the subgroup with diabetes in our initial analysis. However, in contrast with de Miguel-Yanes et al., after stratifying our sample accord-ing to the presence of diabetes we observed higher mortality for the subgroup of patients with diabetes, and this difference persisted over time.
We agree with Hussain and Al-Omran that sur-gical volume is an important predictor of outcomes for abdominal aortic aneurysm repair.1 In our previous work, we found that the relationship be-tween hospital volume and outcomes was quite different for endovascular repair versus open repair and that experience with one type of repair did not carry over to improved outcomes in the other type of repair. We therefore did not conduct propensity-
score matching for procedure volume in our analy-sis, since doing so would have been helpful only for comparisons of the same procedure, not for comparisons between different procedures.Marc L. Schermerhorn, M.D.Beth Israel Deaconess Medical Center Boston, MA [email protected]
A. James O’Malley, Ph.D.Geisel School of Medicine at Dartmouth Lebanon, NH
Bruce E. Landon, M.D., M.B.A.Harvard Medical School Boston, MA
Since publication of their article, the authors report no fur-ther potential conflict of interest.
1. Landon BE, O’Malley AJ, Giles K, Cotterill P, Schermerhorn ML. Volume-outcome relationships and abdominal aortic aneu-rysm repair. Circulation 2010;122:1290-7.DOI: 10.1056/NEJMc1511634
Healthy Babies after Intrauterine Transfer of Mosaic Aneuploid Blastocysts
To the Editor: Chromosomal aneuploidy is rec-ognized as a factor that contributes to unsuc-cessful embryo implantation and spontaneous abortion. It provides an explanation for the rela-tively low success rate of in vitro fertilization (IVF) treatments. Preimplantation genetic screening is widely used to identify chromosomally normal (euploid) embryos and select them for intrauterine transfer in order to improve the clinical outcome of IVF.1
Chromosomal mosaicism is a relatively com-mon finding in IVF-derived human embryos.2 Mosaic embryos, which are characterized by the presence of a mixture of diploid and aneuploid cell lines, are not usually transferred because they are deemed to be abnormal. Although the effect of mosaicism on implantation and the developmental potential of these embryos is not known, it is reasonable to assume that mosa-icism reduces the likelihood of success of IVF.3
The low levels of mosaicism reported in pre-natal specimens and the reduced incidence of mosaicism with increasing gestational age sug-gest that there exists a mechanism by which mosaic aneuploidy is corrected or by which aneu-ploid cells are “outcompeted” by euploid cells.4 To our knowledge, healthy live births after trans-fer of mosaic aneuploid blastocysts obtained by means of IVF have not been reported. However,
a previous study in which the researchers were unaware of the results of genetic screening may have involved the transfer of mosaic embryos that resulted in clinical pregnancies.5
Between May 2013 and July 2014, we analyzed 3802 blastocysts by means of array-comparative genomic hybridization testing (see the Supple-mentary Appendix, available with the full text of this letter at NEJM.org). We detected chromoso-mal mosaicism in 181 blastocysts (4.8%). The transfer of mosaic embryos was made available to a consecutive nonselected series of 18 women for whom IVF had resulted in no euploid em-bryos. We provided the results of the genetic screening to the women and counseled them on the potential consequences of transferring a mosaic embryo. We tailored the counseling ac-cording to the type of aneuploidy.
An institutional ethics committee approved the protocol (available at NEJM.org), and we ob-tained written informed consent from each woman before proceeding with embryo implantation. All the women elected to undergo implantation (only one mosaic blastocyst was available in each case). Eight clinical pregnancies (maternal serum posi-tive for the beta subunit of human chorionic gonadotropin) ensued, of which six resulted in the birth of a singleton infant at term. All preg-nancies that went to term were confirmed, by
The New England Journal of Medicine Downloaded from nejm.org on November 18, 2015. For personal use only. No other uses without permission.
Copyright © 2015 Massachusetts Medical Society. All rights reserved.
n engl j med 373;21 nejm.org november 19, 20152090
correspondence
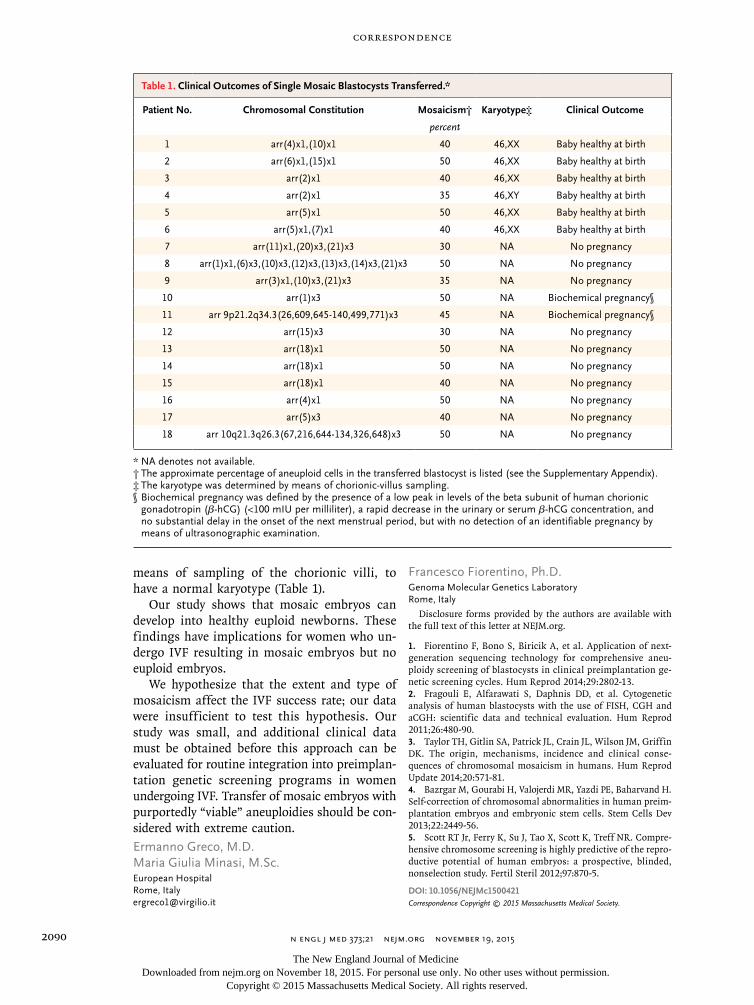
means of sampling of the chorionic villi, to have a normal karyotype (Table 1).
Our study shows that mosaic embryos can develop into healthy euploid newborns. These findings have implications for women who un-dergo IVF resulting in mosaic embryos but no euploid embryos.
We hypothesize that the extent and type of mosaicism affect the IVF success rate; our data were insufficient to test this hypothesis. Our study was small, and additional clinical data must be obtained before this approach can be evaluated for routine integration into preimplan-tation genetic screening programs in women undergoing IVF. Transfer of mosaic embryos with purportedly “viable” aneuploidies should be con-sidered with extreme caution.Ermanno Greco, M.D. Maria Giulia Minasi, M.Sc.European Hospital Rome, Italy [email protected]
Francesco Fiorentino, Ph.D.Genoma Molecular Genetics Laboratory Rome, Italy
Disclosure forms provided by the authors are available with the full text of this letter at NEJM.org.
1. Fiorentino F, Bono S, Biricik A, et al. Application of next-generation sequencing technology for comprehensive aneu-ploidy screening of blastocysts in clinical preimplantation ge-netic screening cycles. Hum Reprod 2014;29:2802-13.2. Fragouli E, Alfarawati S, Daphnis DD, et al. Cytogenetic analysis of human blastocysts with the use of FISH, CGH and aCGH: scientific data and technical evaluation. Hum Reprod 2011;26:480-90.3. Taylor TH, Gitlin SA, Patrick JL, Crain JL, Wilson JM, Griffin DK. The origin, mechanisms, incidence and clinical conse-quences of chromosomal mosaicism in humans. Hum Reprod Update 2014;20:571-81.4. Bazrgar M, Gourabi H, Valojerdi MR, Yazdi PE, Baharvand H. Self-correction of chromosomal abnormalities in human preim-plantation embryos and embryonic stem cells. Stem Cells Dev 2013;22:2449-56.5. Scott RT Jr, Ferry K, Su J, Tao X, Scott K, Treff NR. Compre-hensive chromosome screening is highly predictive of the repro-ductive potential of human embryos: a prospective, blinded, nonselection study. Fertil Steril 2012;97:870-5.
DOI: 10.1056/NEJMc1500421Correspondence Copyright © 2015 Massachusetts Medical Society.
Table 1. Clinical Outcomes of Single Mosaic Blastocysts Transferred.*
Patient No. Chromosomal Constitution Mosaicism† Karyotype‡ Clinical Outcome
percent
1 arr(4)x1,(10)x1 40 46,XX Baby healthy at birth
2 arr(6)x1,(15)x1 50 46,XX Baby healthy at birth
3 arr(2)x1 40 46,XX Baby healthy at birth
4 arr(2)x1 35 46,XY Baby healthy at birth
5 arr(5)x1 50 46,XX Baby healthy at birth
6 arr(5)x1,(7)x1 40 46,XX Baby healthy at birth
7 arr(11)x1,(20)x3,(21)x3 30 NA No pregnancy
8 arr(1)x1,(6)x3,(10)x3,(12)x3,(13)x3,(14)x3,(21)x3 50 NA No pregnancy
9 arr(3)x1,(10)x3,(21)x3 35 NA No pregnancy
10 arr(1)x3 50 NA Biochemical pregnancy§
11 arr 9p21.2q34.3(26,609,645-140,499,771)x3 45 NA Biochemical pregnancy§
12 arr(15)x3 30 NA No pregnancy
13 arr(18)x1 50 NA No pregnancy
14 arr(18)x1 50 NA No pregnancy
15 arr(18)x1 40 NA No pregnancy
16 arr(4)x1 50 NA No pregnancy
17 arr(5)x3 40 NA No pregnancy
18 arr 10q21.3q26.3(67,216,644-134,326,648)x3 50 NA No pregnancy
* NA denotes not available.† The approximate percentage of aneuploid cells in the transferred blastocyst is listed (see the Supplementary Appendix).‡ The karyotype was determined by means of chorionic-villus sampling.§ Biochemical pregnancy was defined by the presence of a low peak in levels of the beta subunit of human chorionic
gonadotropin (β-hCG) (<100 mIU per milliliter), a rapid decrease in the urinary or serum β-hCG concentration, and no substantial delay in the onset of the next menstrual period, but with no detection of an identifiable pregnancy by means of ultrasonographic examination.
The New England Journal of Medicine Downloaded from nejm.org on November 18, 2015. For personal use only. No other uses without permission.
Copyright © 2015 Massachusetts Medical Society. All rights reserved.

Supplementary Appendix
This appendix has been provided by the authors to give readers additional information about their work.
Supplement to: Greco E, Minasi MG, Fiorentino F. Healthy babies after intrauterine transfer of mosaic aneuploid blastocysts. N Engl J Med 2015;373:2089-90. DOI: 10.1056/NEJMc1500421
1
Healthy Babies After Intrauterine Transfer of Mosaic Aneuploid Blastocysts
Supplementary Appendix
Table of Contents Page
[1] Contributors 2
[2] Supplementary information 3
[3] Figure S1-S6 10-16
[4] Table S1-S3 17-19
[5] References 20

2
Contributors:
Ermanno Greco, M.D., European Hospital, Rome, Italy.
Maria Giulia Minasi, M. Sc., B.Sc.,European Hospital, Rome, Italy
Francesco Fiorentino, PhD., B. Sc., GENOMA Molecular Genetics Laboratories, Rome, Italy
Corresponding author: mail: [email protected]; Tel: +390665975643; Fax: +39066534897
Funding: All authors declare no other relationship with funding sources or sponsorships.
Conflict of interest: All authors have no conflicts of interest to disclose.
3
Supplementary information
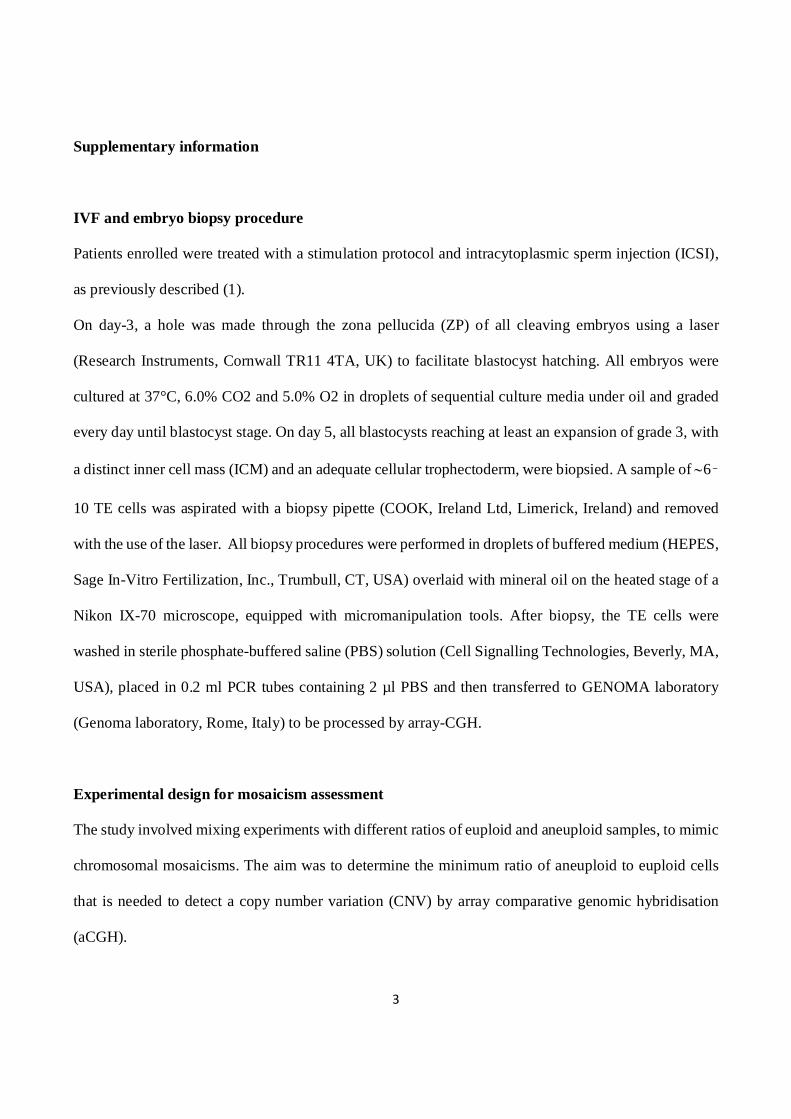
IVF and embryo biopsy procedure
Patients enrolled were treated with a stimulation protocol and intracytoplasmic sperm injection (ICSI),
as previously described (1).
On day-3, a hole was made through the zona pellucida (ZP) of all cleaving embryos using a laser
(Research Instruments, Cornwall TR11 4TA, UK) to facilitate blastocyst hatching. All embryos were
cultured at 37°C, 6.0% CO2 and 5.0% O2 in droplets of sequential culture media under oil and graded
every day until blastocyst stage. On day 5, all blastocysts reaching at least an expansion of grade 3, with
a distinct inner cell mass (ICM) and an adequate cellular trophectoderm, were biopsied. A sample of ∼6–
10 TE cells was aspirated with a biopsy pipette (COOK, Ireland Ltd, Limerick, Ireland) and removed
with the use of the laser. All biopsy procedures were performed in droplets of buffered medium (HEPES,
Sage In-Vitro Fertilization, Inc., Trumbull, CT, USA) overlaid with mineral oil on the heated stage of a
Nikon IX-70 microscope, equipped with micromanipulation tools. After biopsy, the TE cells were
washed in sterile phosphate-buffered saline (PBS) solution (Cell Signalling Technologies, Beverly, MA,
USA), placed in 0.2 ml PCR tubes containing 2 µl PBS and then transferred to GENOMA laboratory
(Genoma laboratory, Rome, Italy) to be processed by array-CGH.
Experimental design for mosaicism assessment
The study involved mixing experiments with different ratios of euploid and aneuploid samples, to mimic
chromosomal mosaicisms. The aim was to determine the minimum ratio of aneuploid to euploid cells
that is needed to detect a copy number variation (CNV) by array comparative genomic hybridisation
(aCGH).
4
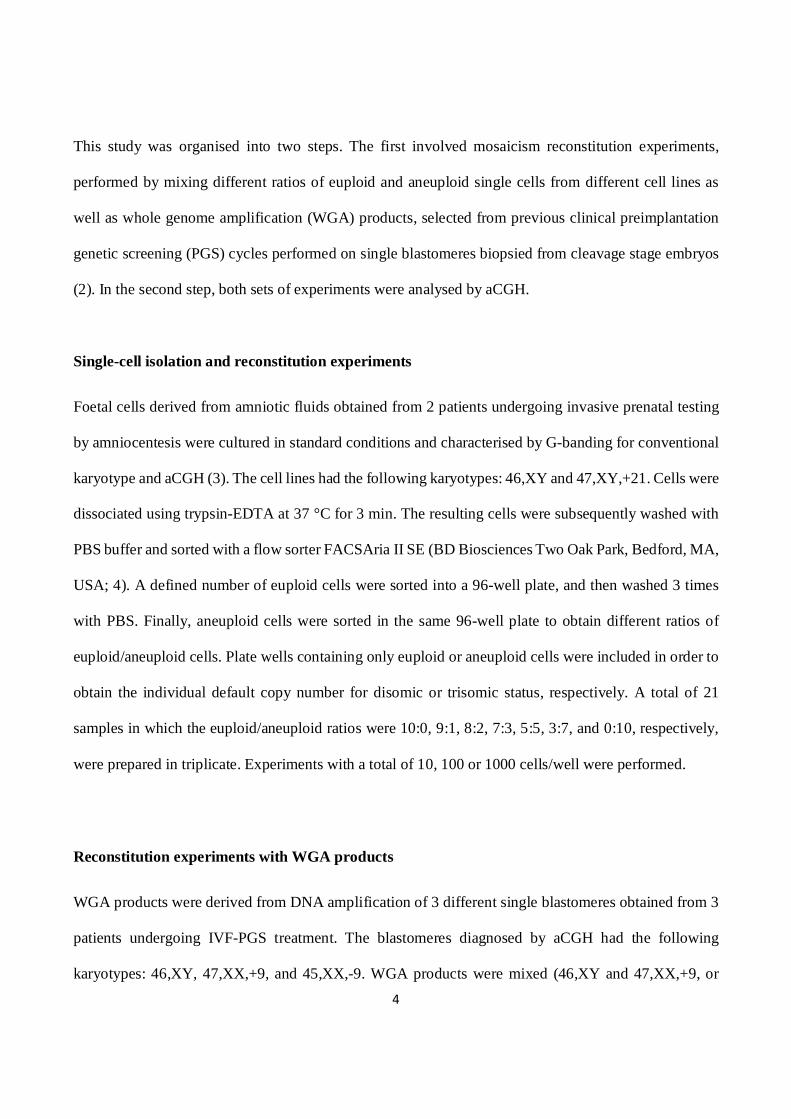
This study was organised into two steps. The first involved mosaicism reconstitution experiments,
performed by mixing different ratios of euploid and aneuploid single cells from different cell lines as
well as whole genome amplification (WGA) products, selected from previous clinical preimplantation
genetic screening (PGS) cycles performed on single blastomeres biopsied from cleavage stage embryos
(2). In the second step, both sets of experiments were analysed by aCGH.
Single-cell isolation and reconstitution experiments
Foetal cells derived from amniotic fluids obtained from 2 patients undergoing invasive prenatal testing
by amniocentesis were cultured in standard conditions and characterised by G-banding for conventional
karyotype and aCGH (3). The cell lines had the following karyotypes: 46,XY and 47,XY,+21. Cells were
dissociated using trypsin-EDTA at 37 °C for 3 min. The resulting cells were subsequently washed with
PBS buffer and sorted with a flow sorter FACSAria II SE (BD Biosciences Two Oak Park, Bedford, MA,
USA; 4). A defined number of euploid cells were sorted into a 96-well plate, and then washed 3 times
with PBS. Finally, aneuploid cells were sorted in the same 96-well plate to obtain different ratios of
euploid/aneuploid cells. Plate wells containing only euploid or aneuploid cells were included in order to
obtain the individual default copy number for disomic or trisomic status, respectively. A total of 21
samples in which the euploid/aneuploid ratios were 10:0, 9:1, 8:2, 7:3, 5:5, 3:7, and 0:10, respectively,
were prepared in triplicate. Experiments with a total of 10, 100 or 1000 cells/well were performed.
Reconstitution experiments with WGA products
WGA products were derived from DNA amplification of 3 different single blastomeres obtained from 3
patients undergoing IVF-PGS treatment. The blastomeres diagnosed by aCGH had the following
karyotypes: 46,XY, 47,XX,+9, and 45,XX,-9. WGA products were mixed (46,XY and 47,XX,+9, or
5
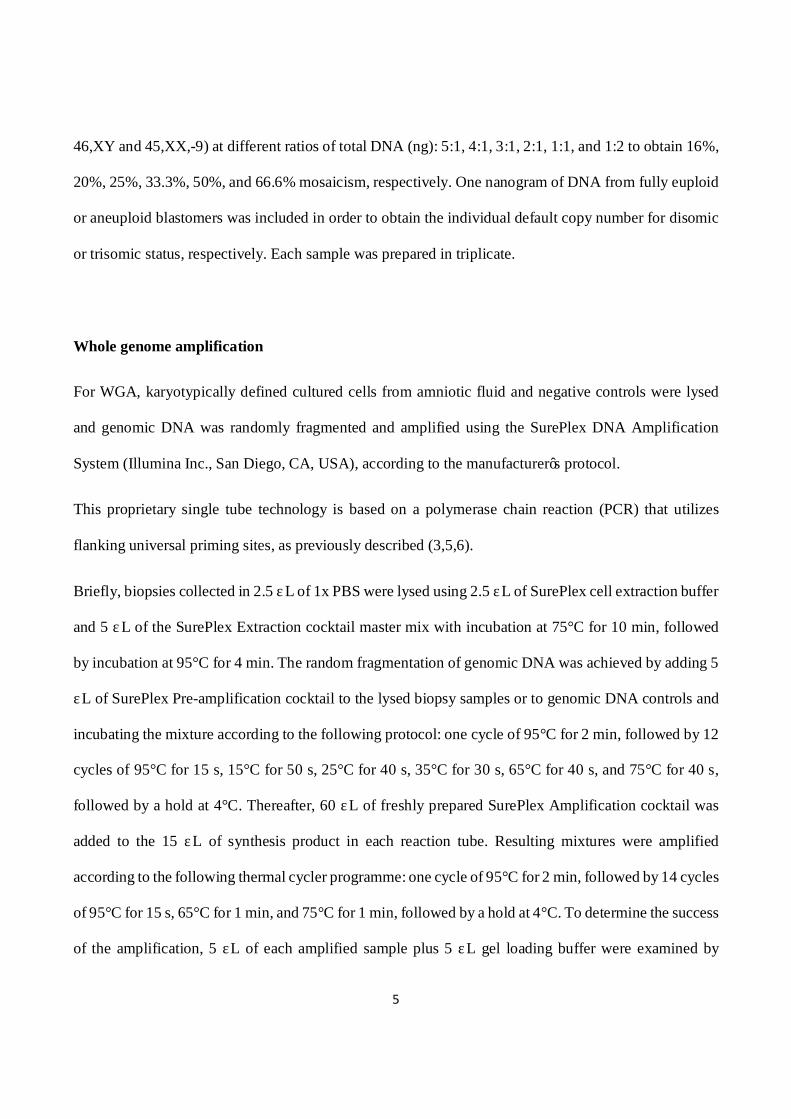
46,XY and 45,XX,-9) at different ratios of total DNA (ng): 5:1, 4:1, 3:1, 2:1, 1:1, and 1:2 to obtain 16%,
20%, 25%, 33.3%, 50%, and 66.6% mosaicism, respectively. One nanogram of DNA from fully euploid
or aneuploid blastomers was included in order to obtain the individual default copy number for disomic
or trisomic status, respectively. Each sample was prepared in triplicate.
Whole genome amplification
For WGA, karyotypically defined cultured cells from amniotic fluid and negative controls were lysed
and genomic DNA was randomly fragmented and amplified using the SurePlex DNA Amplification
System (Illumina Inc., San Diego, CA, USA), according to the manufacturer’s protocol.
This proprietary single tube technology is based on a polymerase chain reaction (PCR) that utilizes
flanking universal priming sites, as previously described (3,5,6).
Briefly, biopsies collected in 2.5 μL of 1x PBS were lysed using 2.5 μL of SurePlex cell extraction buffer
and 5 μL of the SurePlex Extraction cocktail master mix with incubation at 75°C for 10 min, followed
by incubation at 95°C for 4 min. The random fragmentation of genomic DNA was achieved by adding 5
μL of SurePlex Pre-amplification cocktail to the lysed biopsy samples or to genomic DNA controls and
incubating the mixture according to the following protocol: one cycle of 95°C for 2 min, followed by 12
cycles of 95°C for 15 s, 15°C for 50 s, 25°C for 40 s, 35°C for 30 s, 65°C for 40 s, and 75°C for 40 s,
followed by a hold at 4°C. Thereafter, 60 μL of freshly prepared SurePlex Amplification cocktail was
added to the 15 μL of synthesis product in each reaction tube. Resulting mixtures were amplified
according to the following thermal cycler programme: one cycle of 95°C for 2 min, followed by 14 cycles
of 95°C for 15 s, 65°C for 1 min, and 75°C for 1 min, followed by a hold at 4°C. To determine the success
of the amplification, 5 μL of each amplified sample plus 5 μL gel loading buffer were examined by
6
electrophoresis on a 1.5 % agarose 1x Tris-borate-EDTA (TBE) gel. WGA products were then quantified
using the Qubit® dsDNA HS Assay Kit (Life Technologies Corporation, Grand Island, NY, USA).
Array-CGH analysis
WGA products were processed with 24sure V3 microarrays (Illumina, Inc. San Diego, CA, USA),
according to the manufacturer’s protocol. Briefly, amplified samples, controls, and some reference DNAs
(Illumina, Inc.) were labelled with Cy3 and Cy5 fluorophores using random primers from the 24sure V3
pack, which contains the reagents needed to perform an assay, including: 24sure V3 arrays, a Fluorescent
Labelling System [dCTP], and Cot Human DNA. Every batch of biopsied samples requires the
hybridisation of 4 labelled reference DNA samples; 2 male and 2 female. These were compared in silico
with the intensities from biopsied sample hybridisations run at the same time in the same batch. The
resulting labelling mixes were combined and co-precipitated with Cot Human DNA in preparation for
hybridisation. Labelled DNA was resuspended in dextran sulphate hybridisation buffer and hybridised
under cover slips to 24sure V3 slides (2). Thereafter, the labelled products were hybridized to 24sure V3
slides and washed to remove unbound labelled DNA. A laser scanner was used to excite the hybridised
fluorophores and to read and store the resulting images of the hybridisation, as described elsewhere (3).
BlueFuse Multi (BFM) software was employed to analyse the 24sure V3 experiments, which included
the creation of a reference database using a single batch import file. The analysis of 24sure single channel
experiments was fully automated and proceeded in a similar way to all BlueGnome microarrays. It
automatically combines the data from both male and female references in the hybridised reference
subarrays in the single channel sample experiments, to produce a single fused result compared with a
sex-matched and a sex-mismatched reference. Once a specific amplification was observed (i.e., low
autosomal noise), autosomal profiles were assessed for gain or loss of whole chromosomal ratios using
7
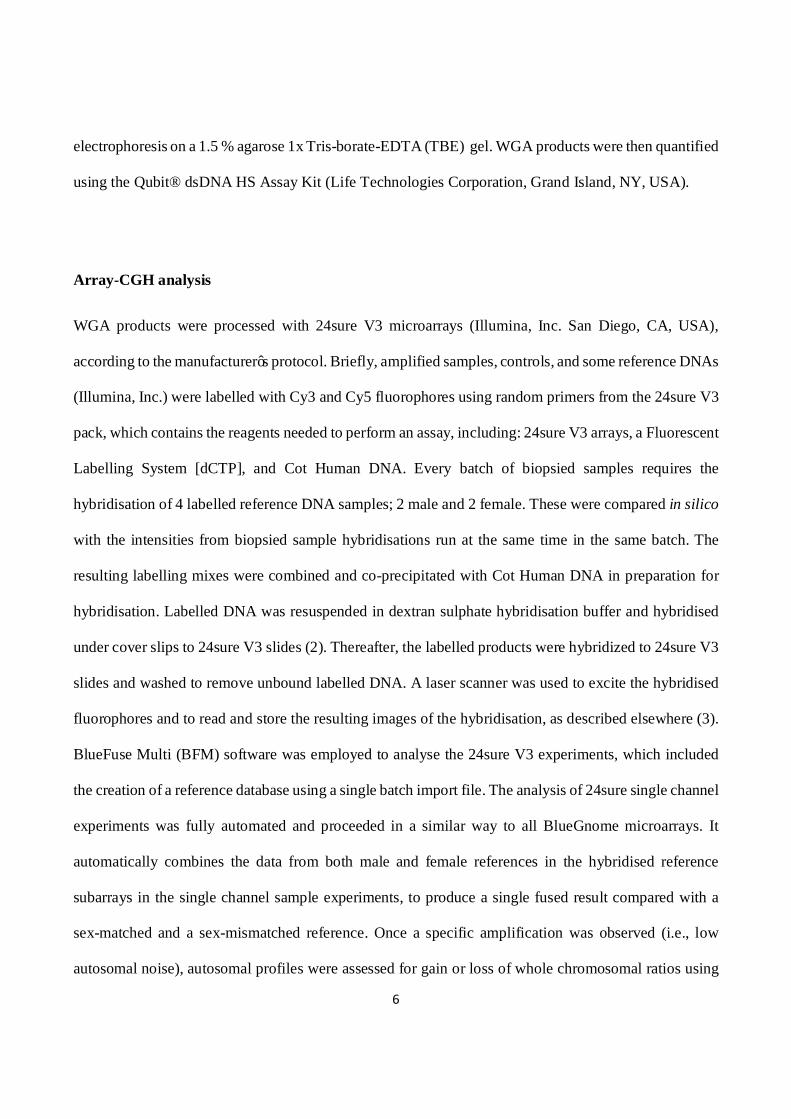
a 3 x standard deviation (SD) assessment, greater than ± 0.3 log2 ratio call, or both. To pass hybridisation
quality control, female samples hybridised with a male reference DNA (sex mismatch) had to show a
consistent gain on the X chromosome and a consistent loss of the Y chromosome (3,7).
Classification of results
Array-CGH results were defined as previously described (2, 3). Briefly, trisomy (partial or full) was
defined as a shift of the clones for a specific chromosome towards the green line (gain) on whole
chromosome BFM plots. In contrast, a monosomy (partial or full) was defined as a shift towards the red
line (loss) of BFM plots. A mosaicism result was assigned for a given chromosome when the ratio was
below 3 x SD and/or ± 0.3 log2 ratio call.
Copy-number cells automatically generated by the aCGH pipeline and BFM software were also assessed
manually.
Mosaicism detection in reconstruction experiments and construction of reference curve
Single-cell aCGH experiments were performed on mixed cells obtained from euploid (46,XY) and
aneuploid (47,XY,+21) cells. To obtain conditions closer to a trophectoderm biopsy, a sample size of 10
cells was initially chosen for the mosaicism reconstruction experiments. However, experiments on a
series of samples with total cell numbers of 100 and 1000 cells were also analysed, in order to minimise
the risk of bias due to cell damage.
A total of 111 samples (48 derived from mixing experiments of WGA products and 63 from those
performed with mixed cell lines) were assessed by aCGH. An interpretable microarray profile was
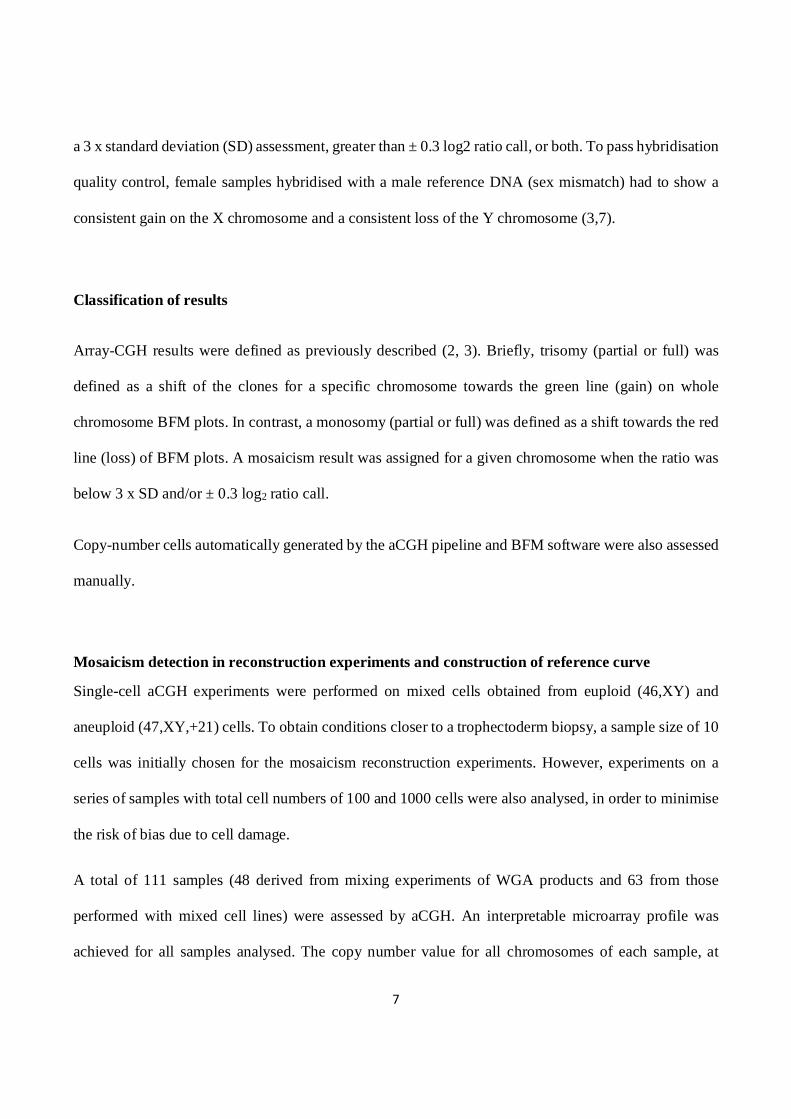
achieved for all samples analysed. The copy number value for all chromosomes of each sample, at
8
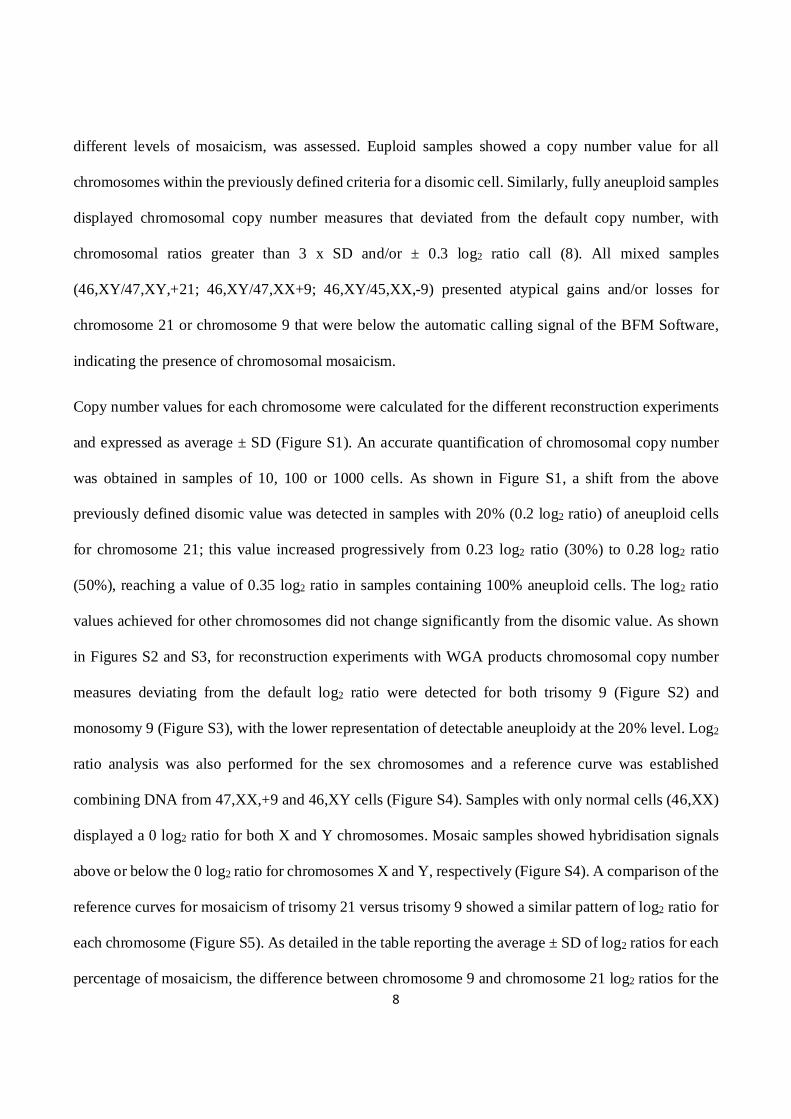
different levels of mosaicism, was assessed. Euploid samples showed a copy number value for all
chromosomes within the previously defined criteria for a disomic cell. Similarly, fully aneuploid samples
displayed chromosomal copy number measures that deviated from the default copy number, with
chromosomal ratios greater than 3 x SD and/or ± 0.3 log2 ratio call (8). All mixed samples
(46,XY/47,XY,+21; 46,XY/47,XX+9; 46,XY/45,XX,-9) presented atypical gains and/or losses for
chromosome 21 or chromosome 9 that were below the automatic calling signal of the BFM Software,
indicating the presence of chromosomal mosaicism.
Copy number values for each chromosome were calculated for the different reconstruction experiments
and expressed as average ± SD (Figure S1). An accurate quantification of chromosomal copy number
was obtained in samples of 10, 100 or 1000 cells. As shown in Figure S1, a shift from the above
previously defined disomic value was detected in samples with 20% (0.2 log2 ratio) of aneuploid cells
for chromosome 21; this value increased progressively from 0.23 log2 ratio (30%) to 0.28 log2 ratio
(50%), reaching a value of 0.35 log2 ratio in samples containing 100% aneuploid cells. The log2 ratio
values achieved for other chromosomes did not change significantly from the disomic value. As shown
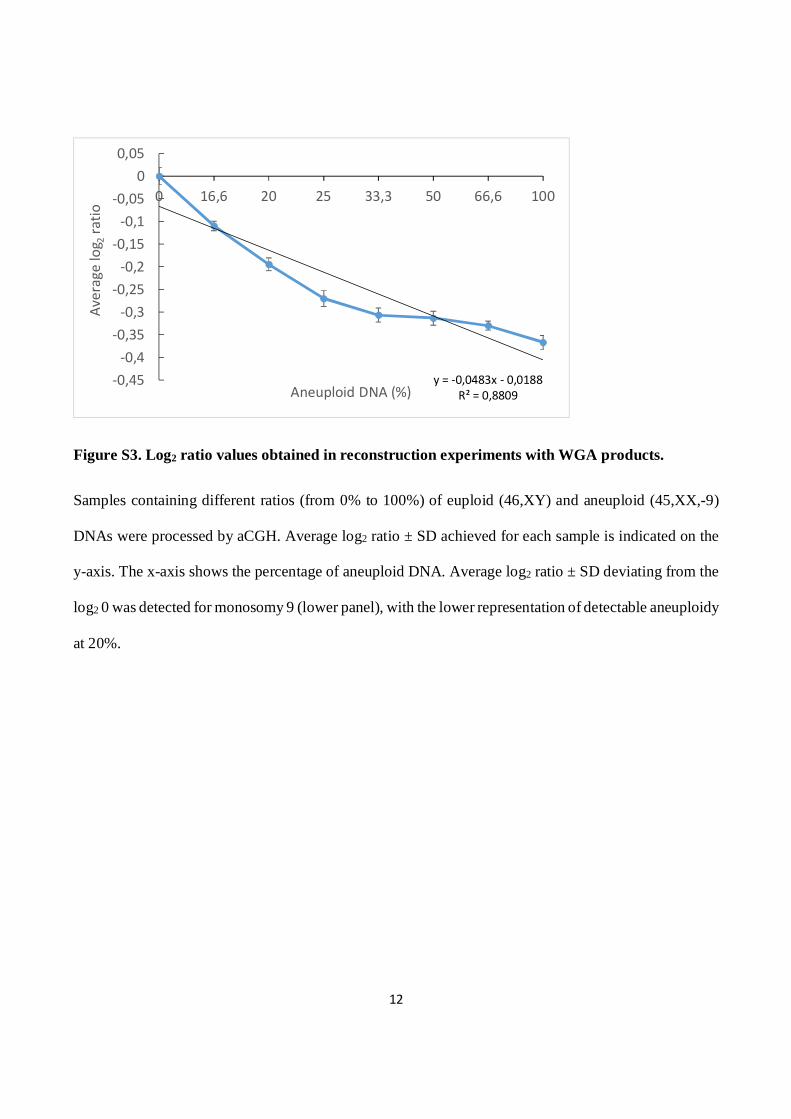
in Figures S2 and S3, for reconstruction experiments with WGA products chromosomal copy number
measures deviating from the default log2 ratio were detected for both trisomy 9 (Figure S2) and
monosomy 9 (Figure S3), with the lower representation of detectable aneuploidy at the 20% level. Log2
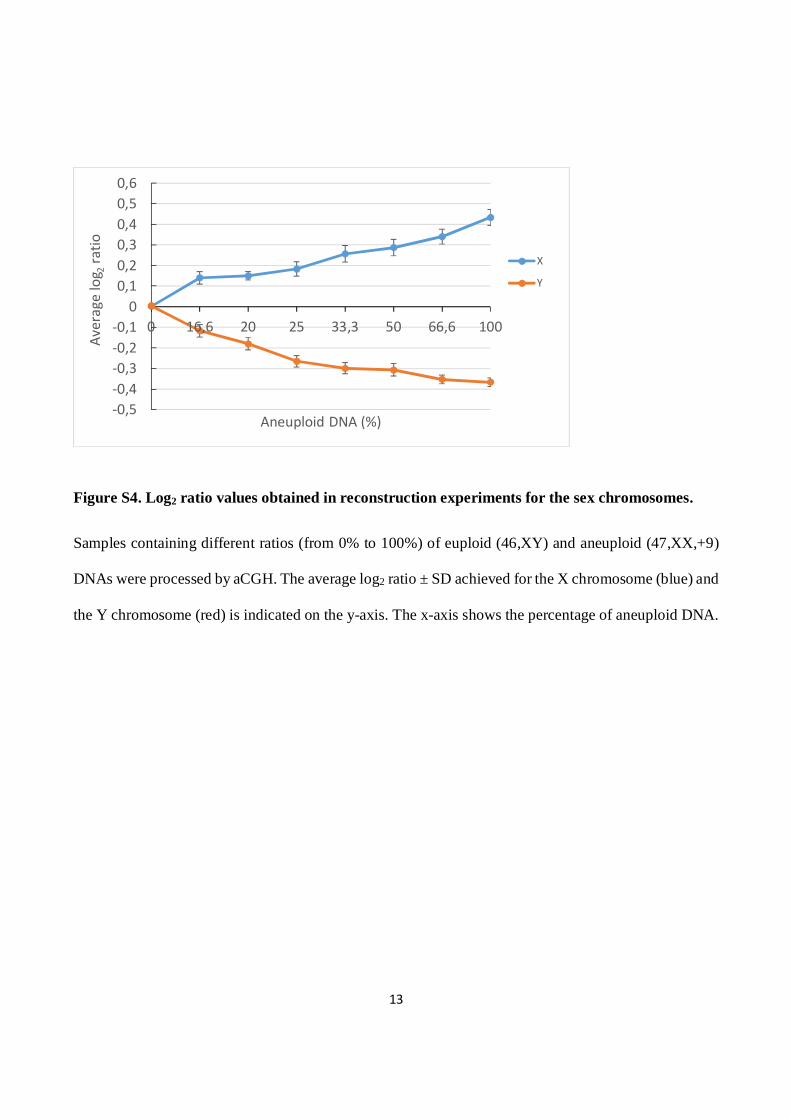
ratio analysis was also performed for the sex chromosomes and a reference curve was established
combining DNA from 47,XX,+9 and 46,XY cells (Figure S4). Samples with only normal cells (46,XX)
displayed a 0 log2 ratio for both X and Y chromosomes. Mosaic samples showed hybridisation signals
above or below the 0 log2 ratio for chromosomes X and Y, respectively (Figure S4). A comparison of the
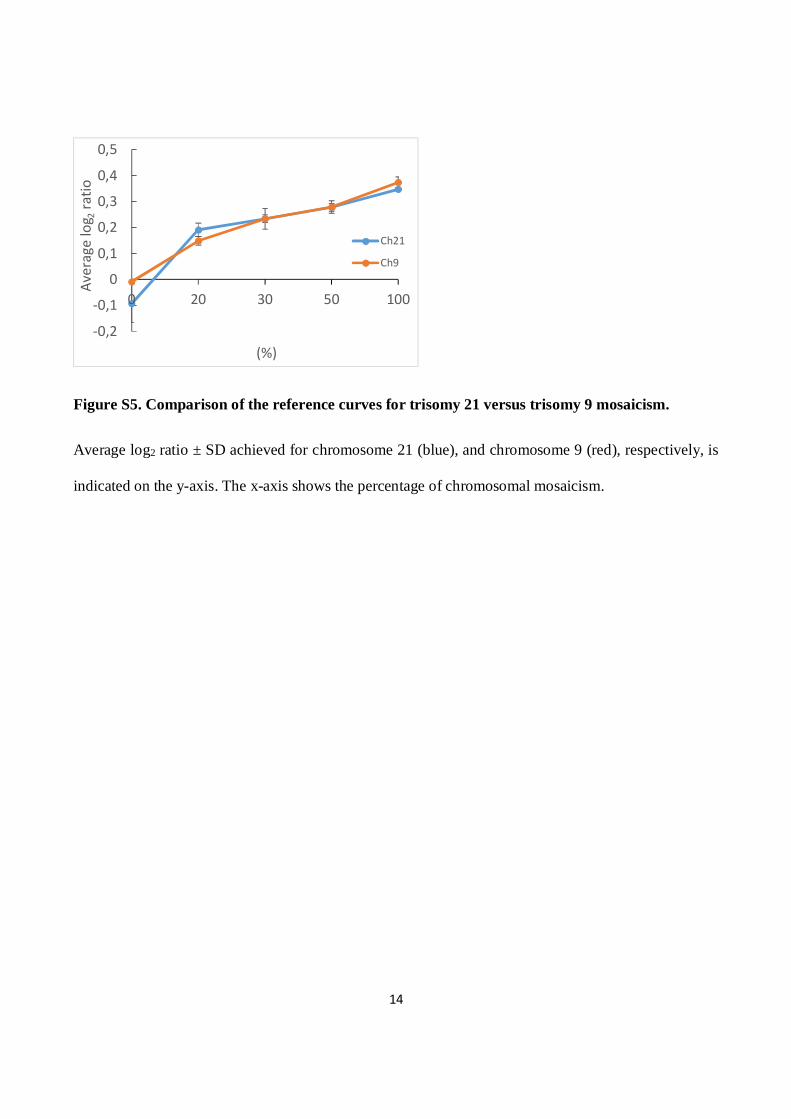
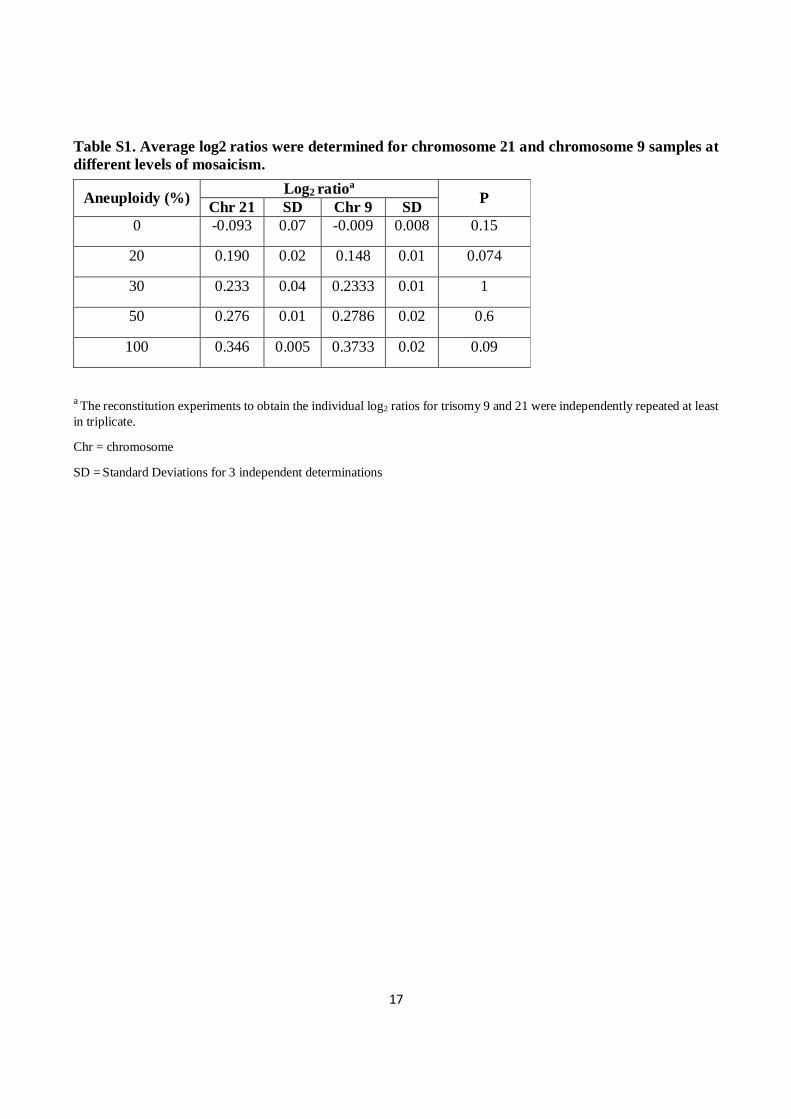
reference curves for mosaicism of trisomy 21 versus trisomy 9 showed a similar pattern of log2 ratio for
each chromosome (Figure S5). As detailed in the table reporting the average ± SD of log2 ratios for each
percentage of mosaicism, the difference between chromosome 9 and chromosome 21 log2 ratios for the
9
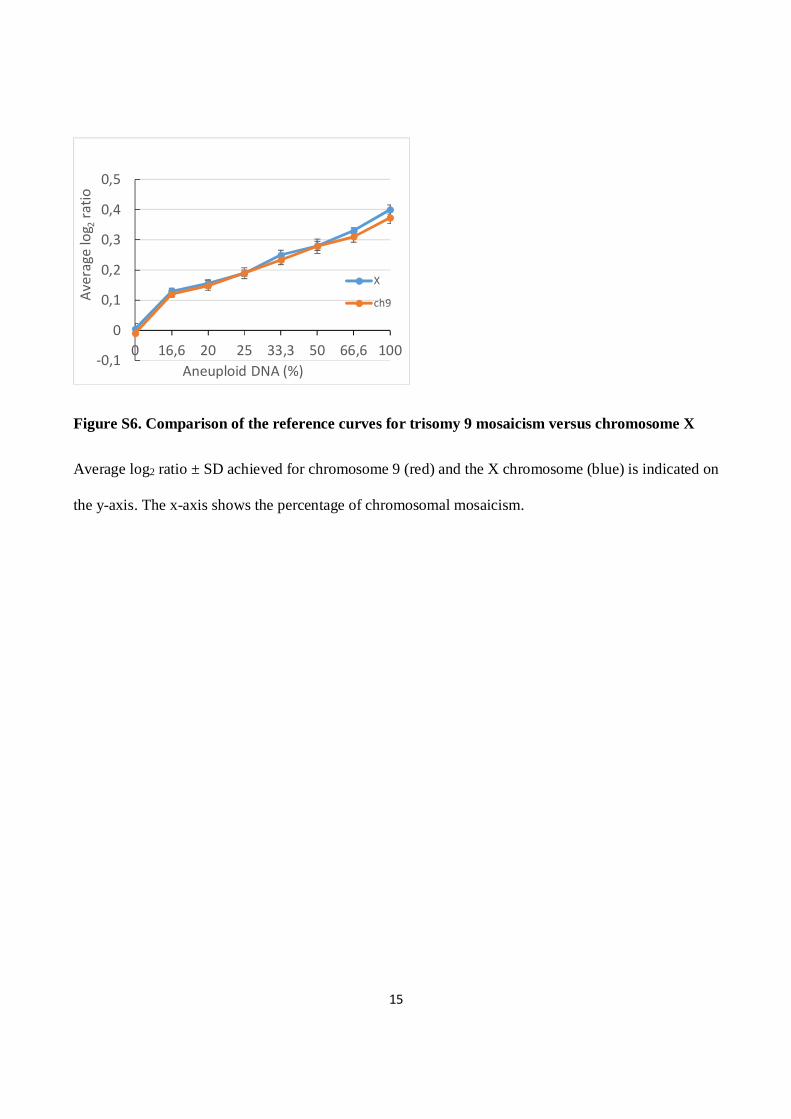
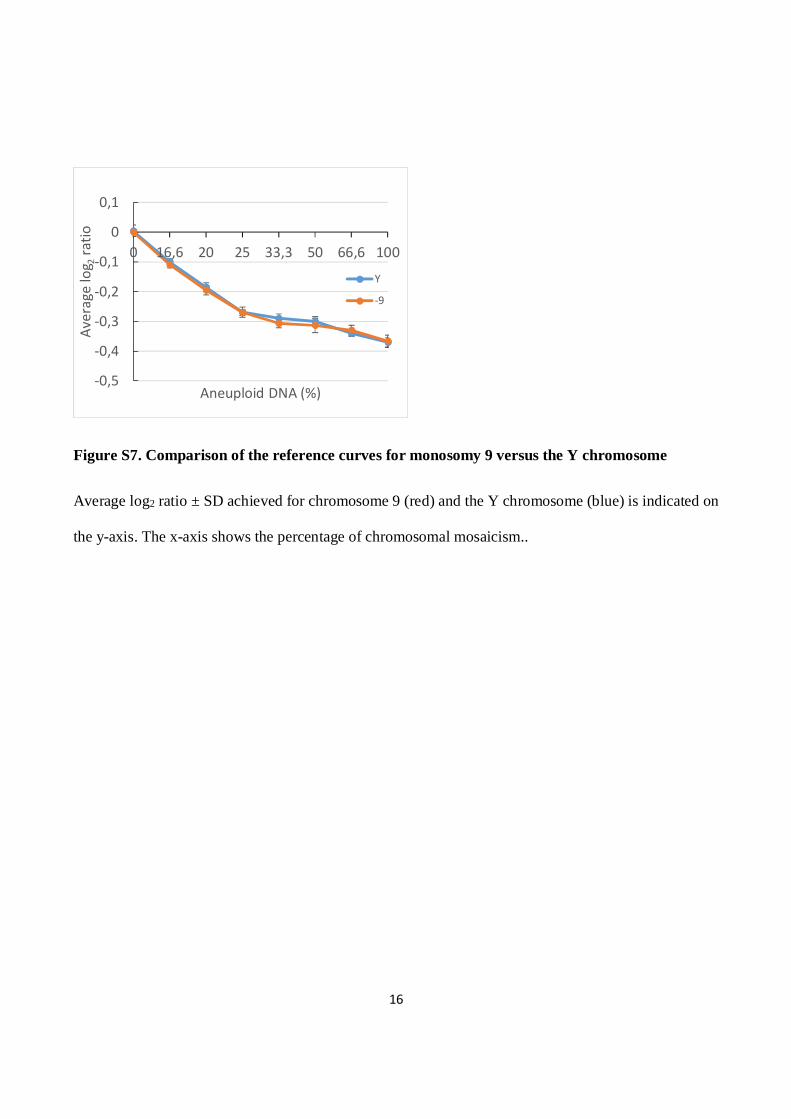
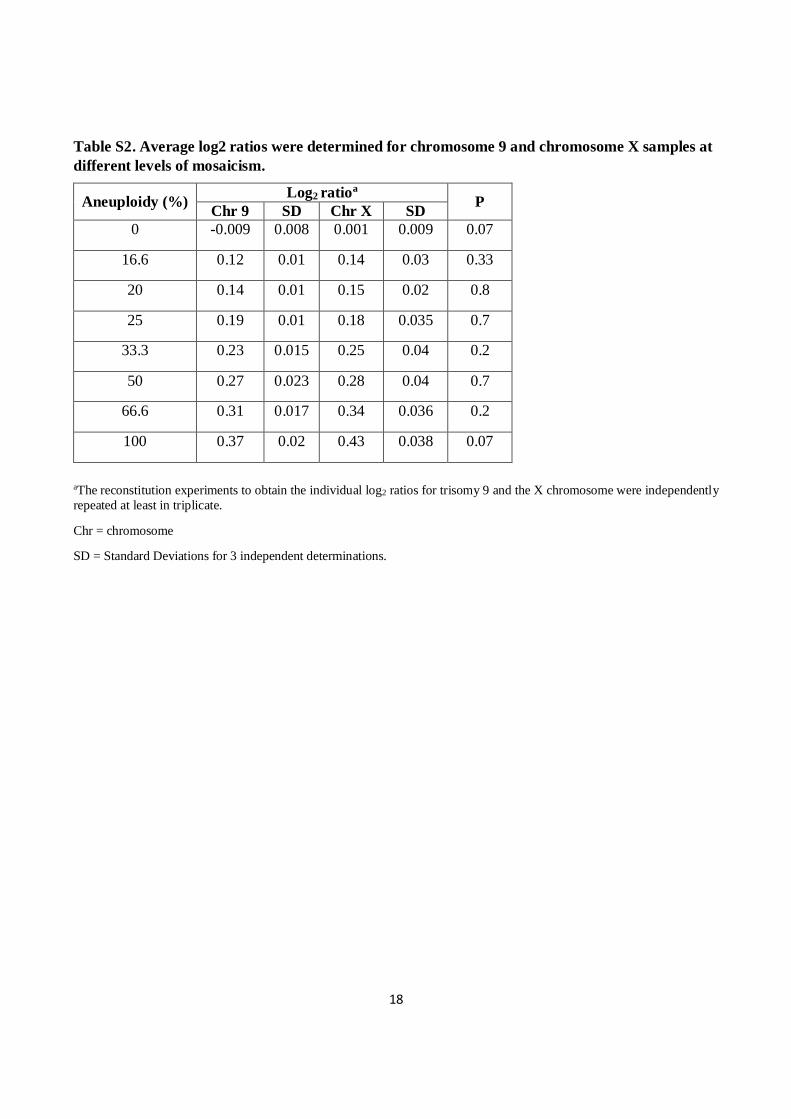
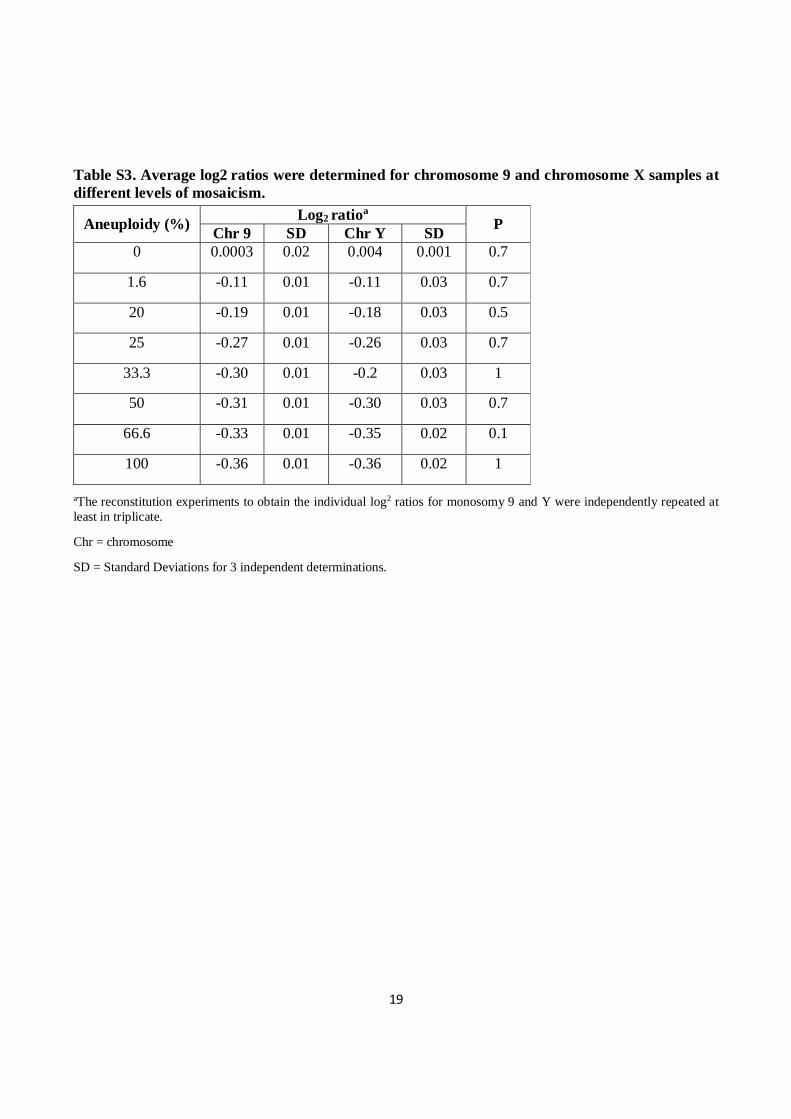
same level of mosaicism was statistically not significant. Comparison of trisomy 9 versus the X
chromosome (obtained combining 47,XX,+9 and 46,XY WGA products, Figure S6) or monosomy 9
versus the Y chromosome (Figure S7) also found no statistically significant difference in log2 ratio for
the same level of mosaicism, as shown in the tables (Figures S6 and S7).
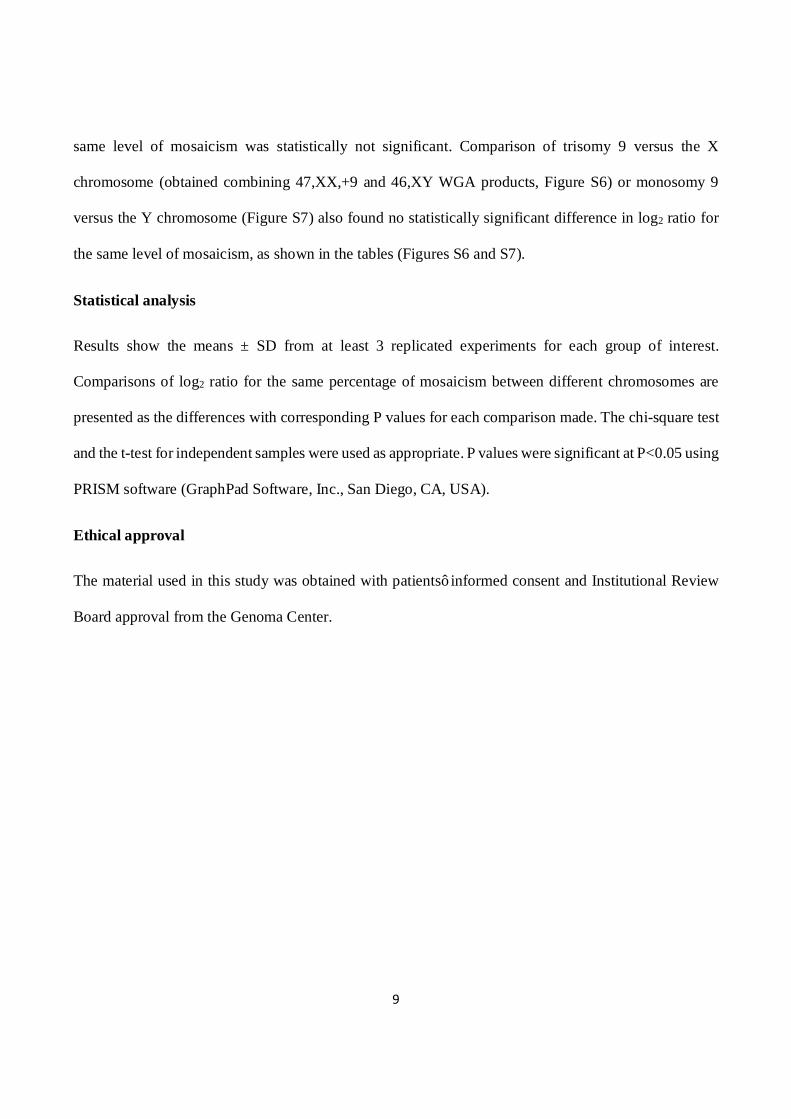
Statistical analysis
Results show the means ± SD from at least 3 replicated experiments for each group of interest.
Comparisons of log2 ratio for the same percentage of mosaicism between different chromosomes are
presented as the differences with corresponding P values for each comparison made. The chi-square test
and the t-test for independent samples were used as appropriate. P values were significant at P<0.05 using
PRISM software (GraphPad Software, Inc., San Diego, CA, USA).
Ethical approval
The material used in this study was obtained with patients’ informed consent and Institutional Review
Board approval from the Genoma Center.
10
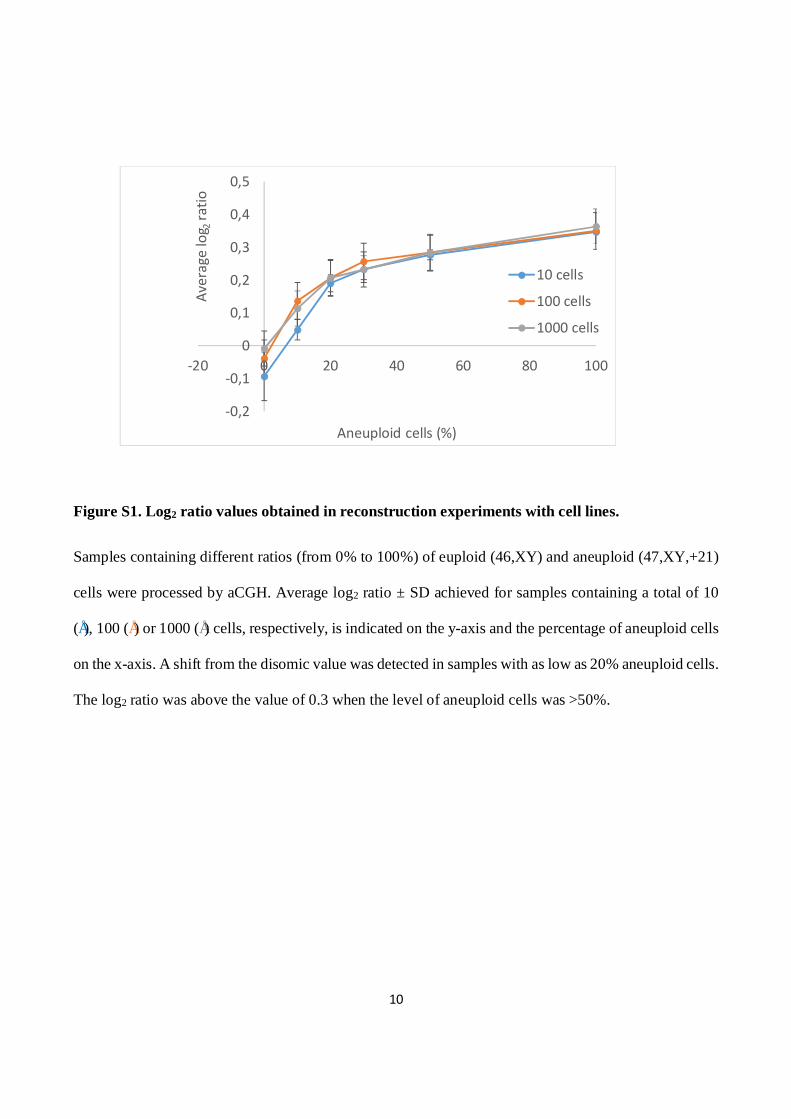
Figure S1. Log2 ratio values obtained in reconstruction experiments with cell lines.
Samples containing different ratios (from 0% to 100%) of euploid (46,XY) and aneuploid (47,XY,+21)
cells were processed by aCGH. Average log2 ratio ± SD achieved for samples containing a total of 10
(•), 100 (•) or 1000 (•) cells, respectively, is indicated on the y-axis and the percentage of aneuploid cells
on the x-axis. A shift from the disomic value was detected in samples with as low as 20% aneuploid cells.
The log2 ratio was above the value of 0.3 when the level of aneuploid cells was >50%.
-0,2
-0,1
0
0,1
0,2
0,3
0,4
0,5
-20 0 20 40 60 80 100
Aver
age
log 2
ratio
Aneuploid cells (%)
10 cells
100 cells
1000 cells
11
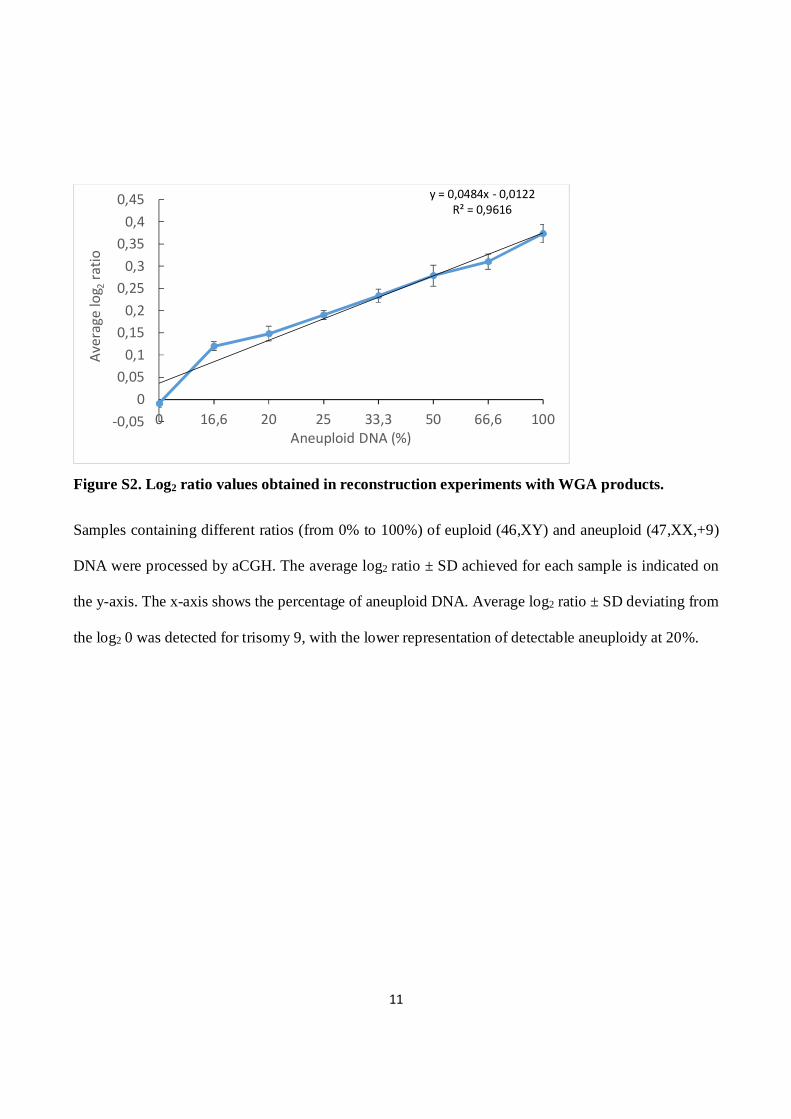
Figure S2. Log2 ratio values obtained in reconstruction experiments with WGA products.
Samples containing different ratios (from 0% to 100%) of euploid (46,XY) and aneuploid (47,XX,+9)
DNA were processed by aCGH. The average log2 ratio ± SD achieved for each sample is indicated on
the y-axis. The x-axis shows the percentage of aneuploid DNA. Average log2 ratio ± SD deviating from
the log2 0 was detected for trisomy 9, with the lower representation of detectable aneuploidy at 20%.
y = 0,0484x - 0,0122R² = 0,9616
-0,050
0,050,1
0,150,2
0,250,3
0,350,4
0,45
0 16,6 20 25 33,3 50 66,6 100
Aver
age
log 2
ratio
Aneuploid DNA (%)
12
Figure S3. Log2 ratio values obtained in reconstruction experiments with WGA products.
Samples containing different ratios (from 0% to 100%) of euploid (46,XY) and aneuploid (45,XX,-9)
DNAs were processed by aCGH. Average log2 ratio ± SD achieved for each sample is indicated on the
y-axis. The x-axis shows the percentage of aneuploid DNA. Average log2 ratio ± SD deviating from the
log2 0 was detected for monosomy 9 (lower panel), with the lower representation of detectable aneuploidy
at 20%.
y = -0,0483x - 0,0188R² = 0,8809
-0,45-0,4
-0,35-0,3
-0,25-0,2
-0,15-0,1
-0,050
0,05
0 16,6 20 25 33,3 50 66,6 100
Aver
age
log 2
ratio
Aneuploid DNA (%)
13
Figure S4. Log2 ratio values obtained in reconstruction experiments for the sex chromosomes.
Samples containing different ratios (from 0% to 100%) of euploid (46,XY) and aneuploid (47,XX,+9)
DNAs were processed by aCGH. The average log2 ratio ± SD achieved for the X chromosome (blue) and
the Y chromosome (red) is indicated on the y-axis. The x-axis shows the percentage of aneuploid DNA.
-0,5-0,4-0,3-0,2-0,1
00,10,20,30,40,50,6
0 16,6 20 25 33,3 50 66,6 100
Aver
age
log 2
ratio
Aneuploid DNA (%)
X
Y
14
Figure S5. Comparison of the reference curves for trisomy 21 versus trisomy 9 mosaicism.
Average log2 ratio ± SD achieved for chromosome 21 (blue), and chromosome 9 (red), respectively, is
indicated on the y-axis. The x-axis shows the percentage of chromosomal mosaicism.
-0,2
-0,1
0
0,1
0,2
0,3
0,4
0,5
0 20 30 50 100
Aver
age
log 2
ratio
(%)
Ch21
Ch9
15
Figure S6. Comparison of the reference curves for trisomy 9 mosaicism versus chromosome X
Average log2 ratio ± SD achieved for chromosome 9 (red) and the X chromosome (blue) is indicated on
the y-axis. The x-axis shows the percentage of chromosomal mosaicism.
-0,1
0
0,1
0,2
0,3
0,4
0,5
0 16,6 20 25 33,3 50 66,6 100
Aver
age
log 2
ratio
Aneuploid DNA (%)
X
ch9
16
Figure S7. Comparison of the reference curves for monosomy 9 versus the Y chromosome
Average log2 ratio ± SD achieved for chromosome 9 (red) and the Y chromosome (blue) is indicated on
the y-axis. The x-axis shows the percentage of chromosomal mosaicism..
-0,5
-0,4
-0,3
-0,2
-0,1
0
0,1
0 16,6 20 25 33,3 50 66,6 100
Aver
age
log 2
ratio
Aneuploid DNA (%)
Y
-9
17
Table S1. Average log2 ratios were determined for chromosome 21 and chromosome 9 samples at different levels of mosaicism.
a The reconstitution experiments to obtain the individual log2 ratios for trisomy 9 and 21 were independently repeated at least in triplicate.
Chr = chromosome
SD = Standard Deviations for 3 independent determinations
Aneuploidy (%) Log2 ratioa P Chr 21 SD Chr 9 SD 0 -0.093 0.07 -0.009 0.008 0.15
20 0.190 0.02 0.148 0.01 0.074
30 0.233 0.04 0.2333 0.01 1
50 0.276 0.01 0.2786 0.02 0.6
100 0.346 0.005 0.3733 0.02 0.09
18
Table S2. Average log2 ratios were determined for chromosome 9 and chromosome X samples at different levels of mosaicism.
aThe reconstitution experiments to obtain the individual log2 ratios for trisomy 9 and the X chromosome were independently repeated at least in triplicate.
Chr = chromosome
SD = Standard Deviations for 3 independent determinations.
Aneuploidy (%) Log2 ratioa P Chr 9 SD Chr X SD 0 -0.009 0.008 0.001 0.009 0.07
16.6 0.12 0.01 0.14 0.03 0.33
20 0.14 0.01 0.15 0.02 0.8
25 0.19 0.01 0.18 0.035 0.7
33.3 0.23 0.015 0.25 0.04 0.2
50 0.27 0.023 0.28 0.04 0.7
66.6 0.31 0.017 0.34 0.036 0.2
100 0.37 0.02 0.43 0.038 0.07
19
Table S3. Average log2 ratios were determined for chromosome 9 and chromosome X samples at different levels of mosaicism.
aThe reconstitution experiments to obtain the individual log2 ratios for monosomy 9 and Y were independently repeated at least in triplicate.
Chr = chromosome
SD = Standard Deviations for 3 independent determinations.
Aneuploidy (%) Log2 ratioa P Chr 9 SD Chr Y SD 0 0.0003 0.02 0.004 0.001 0.7
1.6 -0.11 0.01 -0.11 0.03 0.7
20 -0.19 0.01 -0.18 0.03 0.5
25 -0.27 0.01 -0.26 0.03 0.7
33.3 -0.30 0.01 -0.2 0.03 1
50 -0.31 0.01 -0.30 0.03 0.7
66.6 -0.33 0.01 -0.35 0.02 0.1
100 -0.36 0.01 -0.36 0.02 1
20
References
1. Greco E, Litwicka K, Ferrero S, et al. GnRH antagonists in ovarian stimulation for ICSI with oocyte restriction: a matched, controlled study. Reprod Biomed Online 2007;14:572–578.
2. Fiorentino F, Biricik A, Bono S, et al. Development and validation of a next-generation sequencing-based protocol for 24-chromosome aneuploidy screening of embryos. Fertil Steril. 2014;101:1375-82.
3. Fiorentino F, Caiazzo F, Napolitano S, et al. Introducing array comparative genomic hybridization into routine prenatal diagnosis practice: a prospective study on over 1000 consecutive clinical cases. Prenat Diagn. 2011;31:1270-82.
4. Rosado MM, Scarsella M, Cascioli S, et al. Evaluating B-cells: from bone marrow precursors to antibody-producing cells. Methods Mol Biol. 2013; 1032:45-57.
5. Yang Z, Liu J, Collins GS,et al. Selection of single blastocysts for fresh transfer via standard morphology assessment alone and with array CGH for good prognosis IVF patients: results from a randomized pilot study. Mol Cytogenet. 2012 ;5:24
6. Alfarawati S, Fragouli E, Colls P, et al. The relationship between blastocyst morphology, chromosomal abnormality, and embryo gender. Fertil Steril. 2011; 95:520-4.
7. Fiorentino F, Bono S, Biricik A, et al. Application of next-generation sequencing technology for comprehensive aneuploidy screening of blastocysts in clinical preimplantation genetic screening cycles. Hum Reprod. 2014;29:2802-13.
8. Gutiérrez-Mateo C, Colls P, Sánchez-García J, et al. Validation of microarray comparative genomic hybridization for comprehensive chromosome analysis of embryos. Fertil Steril. 2011;95:953-8.

Protocol
This protocol has been provided by the authors to give readers additional information about their work.
Protocol for: Greco E, Minasi MG, Fiorentino F. Healthy babies after intrauterine transfer of mosaic aneuploid blastocysts. N Engl J Med 2015;373:2089-90. DOI: 10.1056/NEJMc1500421
1
European Hospital & Genoma Group MET-001 protocol November 2012
OPERATIVE CLINICAL PROTOCOL
Procedure for transfer of blastocysts with chromosomal mosaicism
(Mosaic Embryo Transfer-001 protocol)
Medical Director: Dr. Ermanno Greco
European Hospital, Rome
P.I
Dr. Francesco Fiorentino Genoma, Molecular Genetics Laboratories, Rome, Italy
Organization (CRO): European Hospital,
Center for Reproductive Medicine
Via Portuense, 700
Rome, Italy
2
European Hospital & Genoma Group MET-001 protocol November 2012
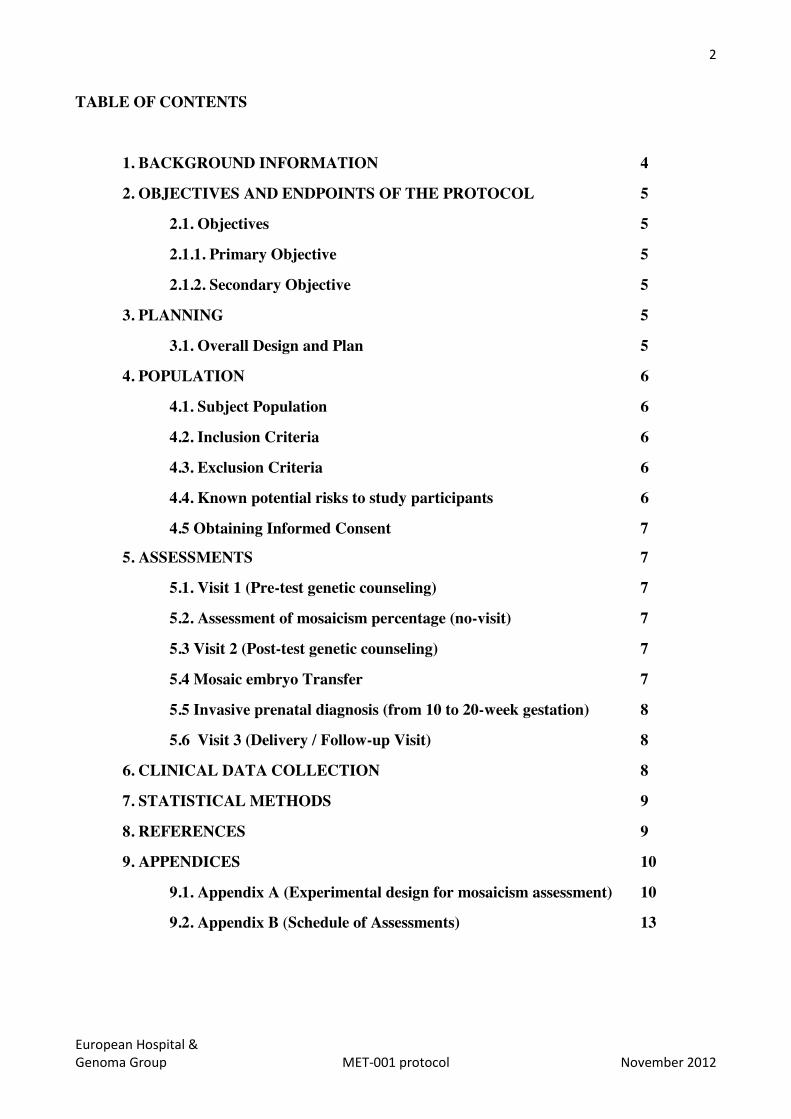
TABLE OF CONTENTS
1. BACKGROUND INFORMATION 4
2. OBJECTIVES AND ENDPOINTS OF THE PROTOCOL 5
2.1. Objectives 5
2.1.1. Primary Objective 5
2.1.2. Secondary Objective 5
3. PLANNING 5
3.1. Overall Design and Plan 5
4. POPULATION 6
4.1. Subject Population 6
4.2. Inclusion Criteria 6
4.3. Exclusion Criteria 6
4.4. Known potential risks to study participants 6
4.5 Obtaining Informed Consent 7
5. ASSESSMENTS 7
5.1. Visit 1 (Pre-test genetic counseling) 7
5.2. Assessment of mosaicism percentage (no-visit) 7
5.3 Visit 2 (Post-test genetic counseling) 7
5.4 Mosaic embryo Transfer 7
5.5 Invasive prenatal diagnosis (from 10 to 20-week gestation) 8
5.6 Visit 3 (Delivery / Follow-up Visit) 8
6. CLINICAL DATA COLLECTION 8
7. STATISTICAL METHODS 9
8. REFERENCES 9
9. APPENDICES 10
9.1. Appendix A (Experimental design for mosaicism assessment) 10
9.2. Appendix B (Schedule of Assessments) 13
3
European Hospital & Genoma Group MET-001 protocol November 2012
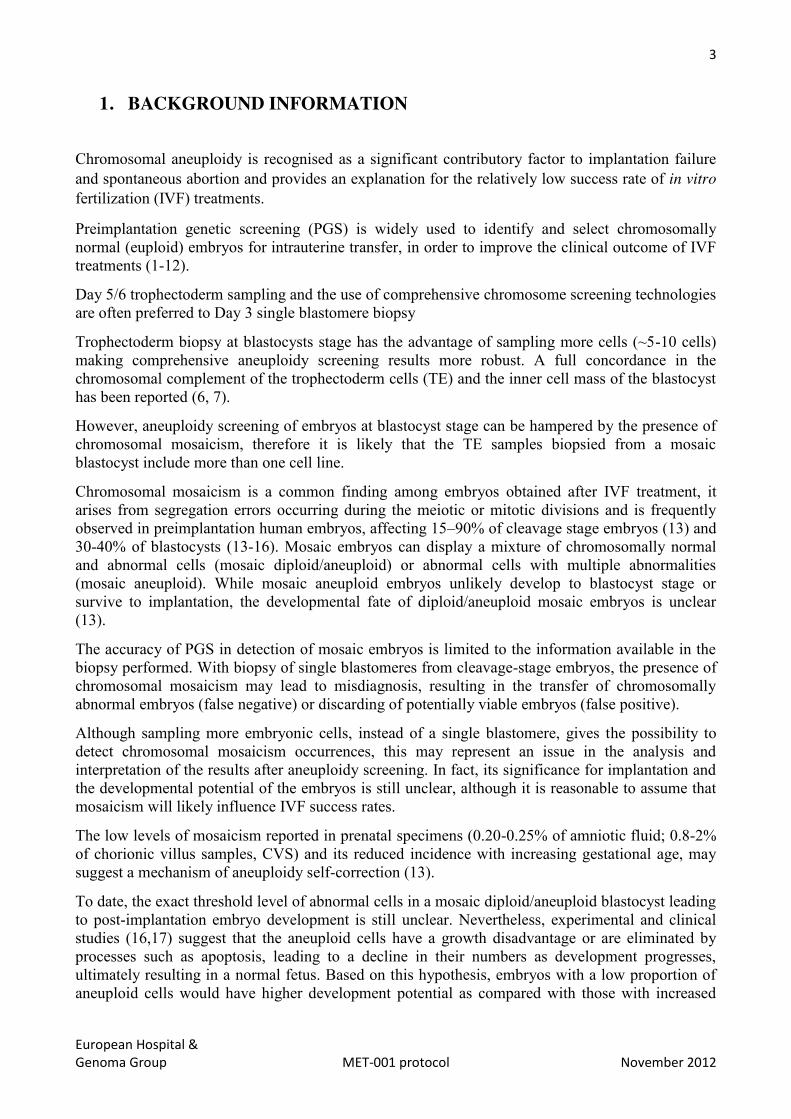
1. BACKGROUND INFORMATION
Chromosomal aneuploidy is recognised as a significant contributory factor to implantation failure and spontaneous abortion and provides an explanation for the relatively low success rate of in vitro fertilization (IVF) treatments. Preimplantation genetic screening (PGS) is widely used to identify and select chromosomally normal (euploid) embryos for intrauterine transfer, in order to improve the clinical outcome of IVF treatments (1-12).
Day 5/6 trophectoderm sampling and the use of comprehensive chromosome screening technologies are often preferred to Day 3 single blastomere biopsy
Trophectoderm biopsy at blastocysts stage has the advantage of sampling more cells (~5-10 cells) making comprehensive aneuploidy screening results more robust. A full concordance in the chromosomal complement of the trophectoderm cells (TE) and the inner cell mass of the blastocyst has been reported (6, 7).
However, aneuploidy screening of embryos at blastocyst stage can be hampered by the presence of chromosomal mosaicism, therefore it is likely that the TE samples biopsied from a mosaic blastocyst include more than one cell line.
Chromosomal mosaicism is a common finding among embryos obtained after IVF treatment, it arises from segregation errors occurring during the meiotic or mitotic divisions and is frequently observed in preimplantation human embryos, affecting 15–90% of cleavage stage embryos (13) and 30-40% of blastocysts (13-16). Mosaic embryos can display a mixture of chromosomally normal and abnormal cells (mosaic diploid/aneuploid) or abnormal cells with multiple abnormalities (mosaic aneuploid). While mosaic aneuploid embryos unlikely develop to blastocyst stage or survive to implantation, the developmental fate of diploid/aneuploid mosaic embryos is unclear (13).
The accuracy of PGS in detection of mosaic embryos is limited to the information available in the biopsy performed. With biopsy of single blastomeres from cleavage-stage embryos, the presence of chromosomal mosaicism may lead to misdiagnosis, resulting in the transfer of chromosomally abnormal embryos (false negative) or discarding of potentially viable embryos (false positive).
Although sampling more embryonic cells, instead of a single blastomere, gives the possibility to detect chromosomal mosaicism occurrences, this may represent an issue in the analysis and interpretation of the results after aneuploidy screening. In fact, its significance for implantation and the developmental potential of the embryos is still unclear, although it is reasonable to assume that mosaicism will likely influence IVF success rates.
The low levels of mosaicism reported in prenatal specimens (0.20-0.25% of amniotic fluid; 0.8-2% of chorionic villus samples, CVS) and its reduced incidence with increasing gestational age, may suggest a mechanism of aneuploidy self-correction (13).
To date, the exact threshold level of abnormal cells in a mosaic diploid/aneuploid blastocyst leading to post-implantation embryo development is still unclear. Nevertheless, experimental and clinical studies (16,17) suggest that the aneuploid cells have a growth disadvantage or are eliminated by processes such as apoptosis, leading to a decline in their numbers as development progresses, ultimately resulting in a normal fetus. Based on this hypothesis, embryos with a low proportion of aneuploid cells would have higher development potential as compared with those with increased

4
European Hospital & Genoma Group MET-001 protocol November 2012
mosaicism rate. In this view, the identification and transfer of low-level mosaic embryos may avoid discarding of potentially viable embryos.
As trophectoderm biopsy becomes the preferred stage for biopsy, it is expected that questions related with the viability for transfer will raise for a huge number of mosaic embryos.
In fact, a part of these embryos may hold the potential to implant, resulting in mosaic pregnancies (the most of which will miscarry) or in chromosomally normal pregnancies going to term with the birth of healthy babies.
2. OBJECTIVES AND ENDPOINTS OF THE PROTOCOL
2.1. Objectives
2.1.1. Primary Objective
The primary objective of the protocol is to identify mosaic embryos and offer the transfer of these embryos to women with no euploid embryos available; this will avoid discarding potentially viable embryos and reducing the chances for IVF patients of achieving a pregnancy.
2.1.2. Secondary Objective
The secondary objectives of the study are:
1. To get more insights on the impact of chromosomal mosaicism on embryos development. 2. To establish reference parameters for chromosomal mosaicism detection.
3. PLANNING
3.1. Overall Design and Plan
The protocol consists in three-step. The first will involve mosaicism reconstitution experiments, performed by mixing different ratios of euploid and aneuploid single cells from different cell lines as well as whole genome amplification (WGA) products, selected from previous clinical PGS cycles performed on single blastomeres biopsied from cleavage stage embryos (2). Both sets of experiments will be analyzed by aCGH. The aim is to determine the minimum ratio of aneuploid to euploid cells that is needed to detect a copy number variation (CNV) by array-CGH and to obtain a reference curve for chromosomal mosaicism (see Appendix A).
The second step will involve determination of the approximate chromosomal mosaicism percentage in embryos scored as mosaics in previously performed PGS-cycles, based on the reference curves obtained from reconstructed experiment.
The third step will involve enrollments of patients that meet the protocol’s eligibility criteria, with the aim of offering embryo transfer of mosaic embryos. Any ensued pregnancy will be followed-up
5
European Hospital & Genoma Group MET-001 protocol November 2012
by invasive prenatal diagnosis (preferably amniocentesis) performing traditional cytogenetics karyotyping of the fetus.
Participation in the study does not otherwise alter standard of care. All clinical evaluation, procedures and data collection for determining suitability for IVF, ovarian stimulation, retrieval, fertilization, embryo culture, biopsy, vitrification, selection, warming, transfer, and pregnancy management will be in accordance with the European Hospital institution’s IVF standard protocols.
4. POPULATION
4.1. Subject Population
The population will include women aged 25 to 44 years undergoing IVF procedures, who meet the inclusion criteria but none of the exclusion criteria described below.
The protocol is expected to be apply in early 2013, involving patient’s enrollment over 12 months at European Hospital.
4.2. Inclusion Criteria
Eligibility
Women undergoing IVF with the intent to receive single embryo transfer after vitrification and subsequent warming, that did not obtained euploid embryos, or that had a negative result after the transfer of the only euploid embryo available, and that signed informed written consent (see Obtaining Informed Consent). Participants may be included in the protocol only if they meet the following inclusion criteria and none of the exclusion criteria:
Inclusion Criteria:
At Screening Visit – beginning IVF cycle:
Women from age 25 years and up to 40 years old at time of IVF cycle initiation.
At Day 5/Day 6 (as early as 110 hours post-fertilization):
No euploid blastocysts available for transfer (110-150 hours following oocyte collection and fertilization).
With at least one blastocyst with chromosomal mosaicism
4.3 Exclusion Criteria:
Women with one or more euploid blastocysts available for transfer
4.4 Known potential risks studying participants
Patients accepting to participate to this protocol are already planning to undergo elective IVF with all of its inherent risks and benefits as explained by their clinical providers. Study participation does not increase the physical risks, and there is no guarantee that any IVF cycle will result in successful embryo transfer and subsequent pregnancy. There is also a known risk of embryo non-survival upon
6
European Hospital & Genoma Group MET-001 protocol November 2012
warming after cryopreservation. If this occurs, it is considered a discontinuation of intended intervention (excluded from primary analysis). The transfer of embryos with chromosomal mosaicism could increase the risk of achieving a chromosomally abnormal pregnancy.
4.5 Obtaining Informed Consent
Informed consent will be documented by the use of a language appropriate written informed consent form (ICF) that has been approved by the IRB at European Hospital. Each participant will review the ICF with the clinician and/or clinical geneticist; when all questions and concerns have been addressed, written informed consent will be obtained. The original signed copy will be kept in a secure area at the clinical site. A copy of the ICF will be provided to the participant.
5. ASSESSMENTS
5.1. Visit 1. (Pre-test genetic counseling)
All the couples involved will be initially seen by a clinical geneticist.
Genetic counselling consists of reviewing the couple’s clinical history, followed by an explanation of the PGS process, a discussion on the likely accuracy in terms of sensitivity, specificity, positive and negative predictive values of the procedure against the index result (array-CGH), potential benefits of testing and its limitations. A calculation of the possible genetic outcomes, the likely success rates, the possibility of having no embryos for transfer and the risk of misdiagnosis will be also discussed. The patients will be then referred to the collaborating IVF clinic to arrange the clinical aspects of the treatment.
5.2 Assessment of mosaicism percentage (no-visit).
After PGS, for each embryos diagnosed with chromosomal mosaicism, the percentage of aneuploidy cell will be determined based on the reference curve obtained in the experimental model (see Appendix A and B).
5.3. Visit 2 (post-test genetic counseling)
In the second visit, all the patient the will meet the inclusion/exclusion criteria, will be adequately informed on PGS results achieved and the potential consequences related with the transfer of each specific mosaic embryo. During the consultation, when possible, the patients will be also informed on the clinical outcome of the previous experiences related with the transfer of mosaic embryos. If embryos with a mosaicism occurrence involving a single trisomy 8, 9, 13, 18 or 21 will be detected, the patients will have properly counselled accordingly, leaving them the final decision to face the risk of transferring such embryos.
5.4 Mosaic embryo transfer
Warming of a single mosaic embryo selected for transfer. Transfer single embryo to subject per standard clinical protocols.
7
European Hospital & Genoma Group MET-001 protocol November 2012
Record whether there is a failure of embryo survival upon warming. Record date and reason for any patient withdrawals or study discontinuation occurring prior
to embryo transfer.
5.5 Invasive prenatal diagnosis (from 11 to 20-week gestation)
For patients with viable pregnancy documented by fetal heartbeat, traditional cytogenetics karyotyping of the fetus will be performed in all pregnancies, preferentially through amniocentesis (see schedule Appendix B).
Results of invasive prenatal diagnosis will be recorded in the clinical study database when received
5.6 Visit 3 (Delivery / Follow-up Visit)
Patient completes visits and tests (e.g, biochemical pregnancy test, ultrasound studies) per routine IVF clinical follow-up procedures and protocols (see schedule Appendix B).
Collect and enter all relevant clinical information as required on the study. Confirm and record pregnancy status (ongoing or not) by review of patient’s obstetrical
records at the specified time points (e.g, 11 weeks, 20 weeks). Record week of delivery and follow-up visit data. For subjects with a positive pregnancy test, obtain signed release of medical information
consent to collect ongoing pregnancy and follow-up data from obstetrician. Record date and reason for any patient withdrawals or early study discontinuation occurring
during this period. Document any subjects lost-to-follow-up.
6. CLINICAL DATA COLLECTION
Clinical data will be collected on all subjects beginning at the time of consent, enrollment, and intermittently following embryo transfer for all the pregnancy as outlined above.
Information will be abstracted from the subject’s medical records and other source documents completed by medical personnel at the IVF clinic and subsequently at an obstetrician’s office.
Baseline information related to the study should be entered into the electronic data capture system (eDC) within 72 hours of obtaining signed consent.
Review of records should be performed on a schedule suitable for documenting implantation and pregnancy status (Appendix B). Copies of all relevant documentation, including laboratory test reports must be made available to clinical monitors who will conduct source data verification of information entered in the eDC. If for any reason it becomes necessary to collect copies of subject’s medical record reports those reports will be appended to the subject’s Electronic Case Report Form in the eDC system.
7. STATISTICAL METHODS
8
European Hospital & Genoma Group MET-001 protocol November 2012
Statistical analysis for mosaicism reconstructed experiments will be performed applying chi-square test or the t-test for independent samples as appropriate. P values were significant at P<0.05.
8. REFERENCES
1. Lathi RB, Westphal MD, Milki AA. Aneuploidy in the miscarriages of infertile women and the potential benefit of preimplantation genetic diagnosis. Fertil Steril 2008;89:353–7.
2. Wilton L. Preimplantation genetic diagnosis for aneuploidy screening in early human embryos: a review. Prenat Diagn 2002;22:512–8.
3. De Ugarte M, Li M, Surrey M, Danzer H, Hill D, DeCherney AH. Accuracy of FISH analysis in predicting chromosomal status in patients undergoing preimplantation genetic diagnosis. Fertil Steril 2008;90:1049–1054.
4. Wells D, Alfarawati S, Fragouli E. Use of comprehensive chromosomal screening for embryo assessment: microarrays and CGH. Mol Hum Reprod 2008;14:703–710.
5. Gutie´rrez-Mateo C, Colls P, Sa´nchez-Garcı´a J, et al. Validation of microarray comparative genomic hybridization for comprehensive chromosome analysis of embryos. Fertil Steril 2011;95:953–958.
6. Treff NR, Su J, Tao X, Levy B, Scott RT Jr. Accurate single cell 24 chromosome aneuploidy screening using whole genome amplification and single nucleotide polymorphism microarrays. Fertil Steril 2010; 94:2017–2021.
7. Treff NR, Tao X, Ferry KM, Su J, Taylor D, Scott RT Jr. Development and validation of an accurate quantitative real-time polymerase chain reaction–based assay for human blastocyst comprehensive chromosomal aneuploidy screening. Fertil Steril 2012;97:819–24.
8. Thornhill A, Ottolini C, Harton G, Griffin D. Aneuploidy testing by array-CGH. In: Markus Montag (ed). A Practical Guide to Selecting Gametes and Embryos. CRC Press, 2014, 255–268.
9. Yang Z, Liu J, Collins GS, et al. Selection of single blastocysts for fresh transfer via standard morphology assessment alone and with array CGH for good prognosis IVF patients: results from a randomized pilot study. Mol Cytogenet 2012;5:24.
10. Fiorentino F, Rienzi L, Bono S, et al. Preimplantation genetic screening on day 3 embryos using array comparative genomic hybridization in patients with advanced maternal age: a prospective double blinded randomized controlled trial. Hum Reprod 2013;28 (Suppl 1):i49–i50.
11. Scott RT Jr, Upham KM, Forman EJ, et al. Blastocyst biopsy with comprehensive chromosome screening and fresh embryo transfer significantly increases IVF implantation and delivery rates: a randomized controlled trial. Fertil Steril 2013;100:697–703.
12. Harper JC, Coonen E, De Rycke M, et al. ESHRE PGD Consortium data collection X: cycles from January to December 2007 with pregnancy follow-up to October 2008. Hum Reprod. 2010; 25:2685-707.
13. Taylor TH, Gitlin SA, Patrick JL, Crain JL, Wilson JM, Griffin DK. The origin, mechanisms, incidence and clinical consequences of chromosomal mosaicism in humans. Hum Reprod Update. 2014;20:571-81.
14. Baart EB, Martini E, van den Berg I, Macklon NS, Galjaard RJ, Fauser BC, et al. Preimplantation genetic screening reveals a high incidence of aneuploidy and mosaicism in embryos from young women undergoing IVF. Hum Reprod. 2006;21:223-33.
15. Fragouli E, Lenzi M, Ross R, Katz-Jaffe M, Schoolcraft WB, Wells D. Comprehensive molecular cytogenetic analysis of the human blastocyst stage. Hum Reprod. 2008;23:2596-608.
9
European Hospital & Genoma Group MET-001 protocol November 2012
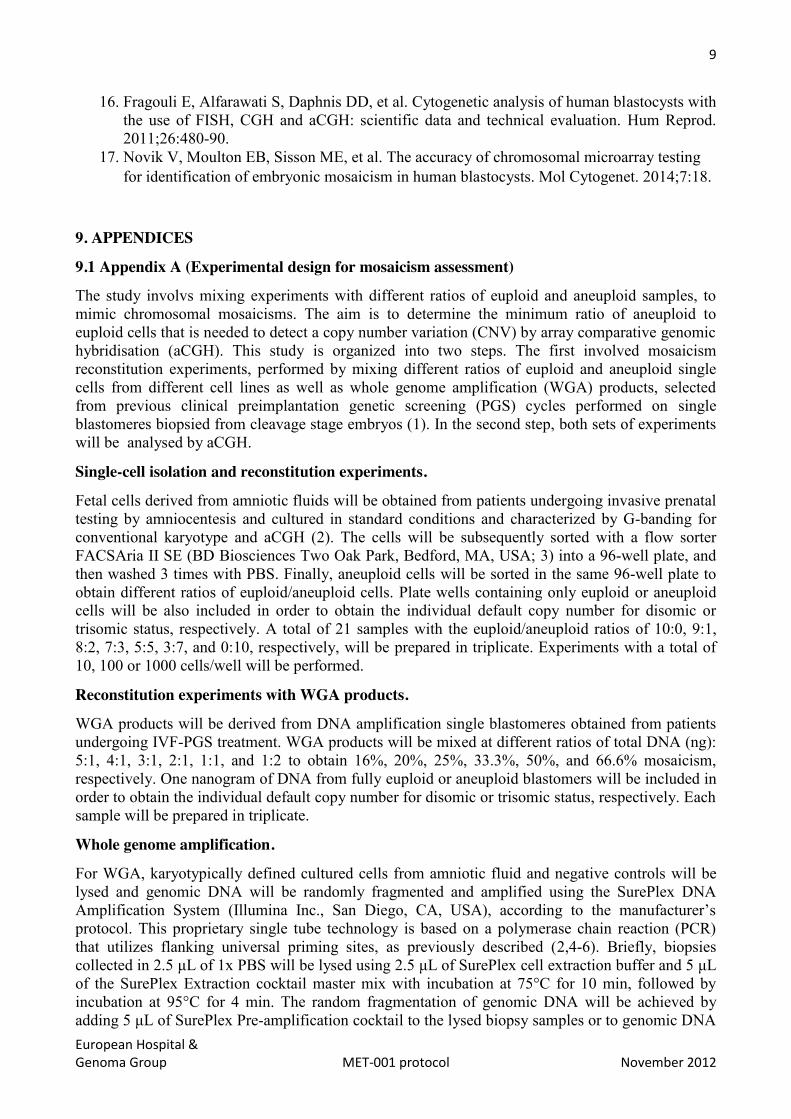
16. Fragouli E, Alfarawati S, Daphnis DD, et al. Cytogenetic analysis of human blastocysts with the use of FISH, CGH and aCGH: scientific data and technical evaluation. Hum Reprod. 2011;26:480-90.
17. Novik V, Moulton EB, Sisson ME, et al. The accuracy of chromosomal microarray testing for identification of embryonic mosaicism in human blastocysts. Mol Cytogenet. 2014;7:18.
9. APPENDICES
9.1 Appendix A (Experimental design for mosaicism assessment)
The study involvs mixing experiments with different ratios of euploid and aneuploid samples, to mimic chromosomal mosaicisms. The aim is to determine the minimum ratio of aneuploid to euploid cells that is needed to detect a copy number variation (CNV) by array comparative genomic hybridisation (aCGH). This study is organized into two steps. The first involved mosaicism reconstitution experiments, performed by mixing different ratios of euploid and aneuploid single cells from different cell lines as well as whole genome amplification (WGA) products, selected from previous clinical preimplantation genetic screening (PGS) cycles performed on single blastomeres biopsied from cleavage stage embryos (1). In the second step, both sets of experiments will be analysed by aCGH.
Single-cell isolation and reconstitution experiments.
Fetal cells derived from amniotic fluids will be obtained from patients undergoing invasive prenatal testing by amniocentesis and cultured in standard conditions and characterized by G-banding for conventional karyotype and aCGH (2). The cells will be subsequently sorted with a flow sorter FACSAria II SE (BD Biosciences Two Oak Park, Bedford, MA, USA; 3) into a 96-well plate, and then washed 3 times with PBS. Finally, aneuploid cells will be sorted in the same 96-well plate to obtain different ratios of euploid/aneuploid cells. Plate wells containing only euploid or aneuploid cells will be also included in order to obtain the individual default copy number for disomic or trisomic status, respectively. A total of 21 samples with the euploid/aneuploid ratios of 10:0, 9:1, 8:2, 7:3, 5:5, 3:7, and 0:10, respectively, will be prepared in triplicate. Experiments with a total of 10, 100 or 1000 cells/well will be performed.
Reconstitution experiments with WGA products.
WGA products will be derived from DNA amplification single blastomeres obtained from patients undergoing IVF-PGS treatment. WGA products will be mixed at different ratios of total DNA (ng): 5:1, 4:1, 3:1, 2:1, 1:1, and 1:2 to obtain 16%, 20%, 25%, 33.3%, 50%, and 66.6% mosaicism, respectively. One nanogram of DNA from fully euploid or aneuploid blastomers will be included in order to obtain the individual default copy number for disomic or trisomic status, respectively. Each sample will be prepared in triplicate.
Whole genome amplification.
For WGA, karyotypically defined cultured cells from amniotic fluid and negative controls will be lysed and genomic DNA will be randomly fragmented and amplified using the SurePlex DNA Amplification System (Illumina Inc., San Diego, CA, USA), according to the manufacturer’s protocol. This proprietary single tube technology is based on a polymerase chain reaction (PCR) that utilizes flanking universal priming sites, as previously described (2,4-6). Briefly, biopsies collected in 2.5 μL of 1x PBS will be lysed using 2.5 μL of SurePlex cell extraction buffer and 5 μL of the SurePlex Extraction cocktail master mix with incubation at 75°C for 10 min, followed by incubation at 95°C for 4 min. The random fragmentation of genomic DNA will be achieved by adding 5 μL of SurePlex Pre-amplification cocktail to the lysed biopsy samples or to genomic DNA
10
European Hospital & Genoma Group MET-001 protocol November 2012
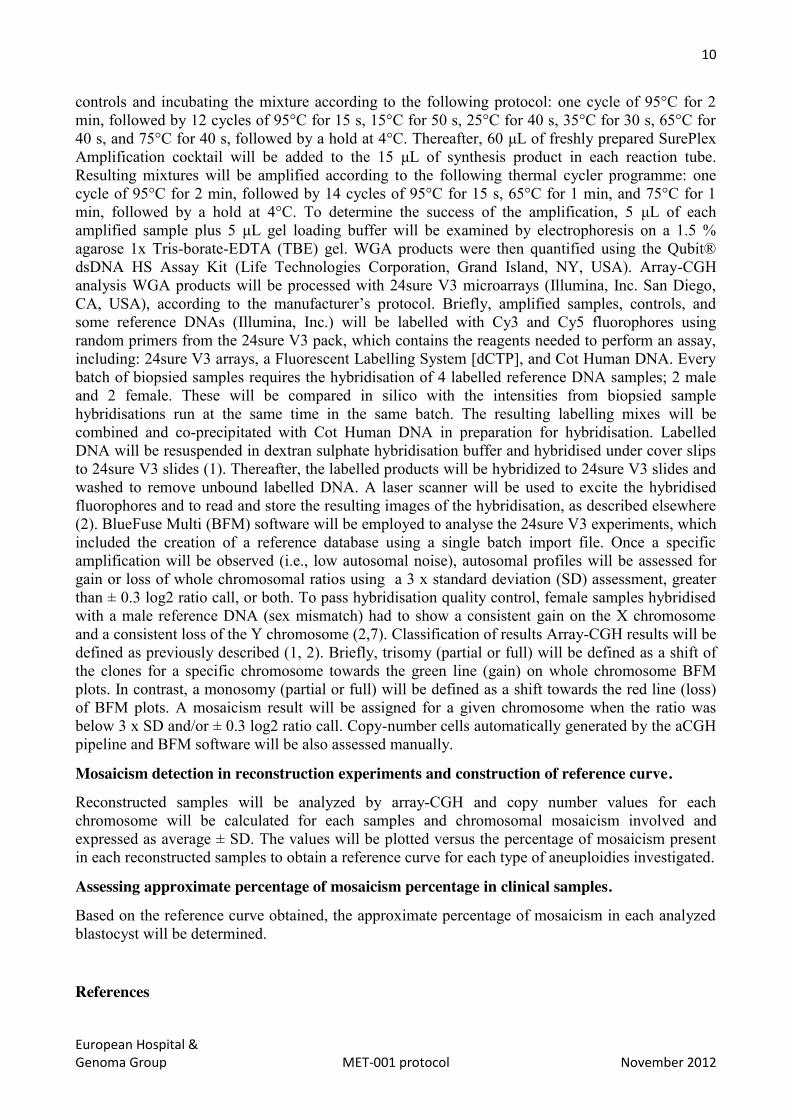
controls and incubating the mixture according to the following protocol: one cycle of 95°C for 2 min, followed by 12 cycles of 95°C for 15 s, 15°C for 50 s, 25°C for 40 s, 35°C for 30 s, 65°C for 40 s, and 75°C for 40 s, followed by a hold at 4°C. Thereafter, 60 μL of freshly prepared SurePlex Amplification cocktail will be added to the 15 μL of synthesis product in each reaction tube. Resulting mixtures will be amplified according to the following thermal cycler programme: one cycle of 95°C for 2 min, followed by 14 cycles of 95°C for 15 s, 65°C for 1 min, and 75°C for 1 min, followed by a hold at 4°C. To determine the success of the amplification, 5 μL of each amplified sample plus 5 μL gel loading buffer will be examined by electrophoresis on a 1.5 % agarose 1x Tris-borate-EDTA (TBE) gel. WGA products were then quantified using the Qubit® dsDNA HS Assay Kit (Life Technologies Corporation, Grand Island, NY, USA). Array-CGH analysis WGA products will be processed with 24sure V3 microarrays (Illumina, Inc. San Diego, CA, USA), according to the manufacturer’s protocol. Briefly, amplified samples, controls, and some reference DNAs (Illumina, Inc.) will be labelled with Cy3 and Cy5 fluorophores using random primers from the 24sure V3 pack, which contains the reagents needed to perform an assay, including: 24sure V3 arrays, a Fluorescent Labelling System [dCTP], and Cot Human DNA. Every batch of biopsied samples requires the hybridisation of 4 labelled reference DNA samples; 2 male and 2 female. These will be compared in silico with the intensities from biopsied sample hybridisations run at the same time in the same batch. The resulting labelling mixes will be combined and co-precipitated with Cot Human DNA in preparation for hybridisation. Labelled DNA will be resuspended in dextran sulphate hybridisation buffer and hybridised under cover slips to 24sure V3 slides (1). Thereafter, the labelled products will be hybridized to 24sure V3 slides and washed to remove unbound labelled DNA. A laser scanner will be used to excite the hybridised fluorophores and to read and store the resulting images of the hybridisation, as described elsewhere (2). BlueFuse Multi (BFM) software will be employed to analyse the 24sure V3 experiments, which included the creation of a reference database using a single batch import file. Once a specific amplification will be observed (i.e., low autosomal noise), autosomal profiles will be assessed for gain or loss of whole chromosomal ratios using a 3 x standard deviation (SD) assessment, greater than ± 0.3 log2 ratio call, or both. To pass hybridisation quality control, female samples hybridised with a male reference DNA (sex mismatch) had to show a consistent gain on the X chromosome and a consistent loss of the Y chromosome (2,7). Classification of results Array-CGH results will be defined as previously described (1, 2). Briefly, trisomy (partial or full) will be defined as a shift of the clones for a specific chromosome towards the green line (gain) on whole chromosome BFM plots. In contrast, a monosomy (partial or full) will be defined as a shift towards the red line (loss) of BFM plots. A mosaicism result will be assigned for a given chromosome when the ratio was below 3 x SD and/or ± 0.3 log2 ratio call. Copy-number cells automatically generated by the aCGH pipeline and BFM software will be also assessed manually.
Mosaicism detection in reconstruction experiments and construction of reference curve.
Reconstructed samples will be analyzed by array-CGH and copy number values for each chromosome will be calculated for each samples and chromosomal mosaicism involved and expressed as average ± SD. The values will be plotted versus the percentage of mosaicism present in each reconstructed samples to obtain a reference curve for each type of aneuploidies investigated.
Assessing approximate percentage of mosaicism percentage in clinical samples.
Based on the reference curve obtained, the approximate percentage of mosaicism in each analyzed blastocyst will be determined.
References
11
European Hospital & Genoma Group MET-001 protocol November 2012
1. Fiorentino F, Biricik A, Bono S, et al. Development and validation of a next-generation sequencing-based protocol for 24-chromosome aneuploidy screening of embryos. Fertil Steril. 2014;101:1375-82.
2. Fiorentino F, Caiazzo F, Napolitano S, et al. Introducing array comparative genomic hybridization into routine prenatal diagnosis practice: a prospective study on over 1000 consecutive clinical cases. Prenat Diagn. 2011;31:1270-82.
3. Rosado MM, Scarsella M, Cascioli S, et al. Evaluating B-cells: from bone marrow precursors to antibody-producing cells. Methods Mol Biol. 2013; 1032:45-57.
4. Yang Z, Liu J, Collins GS,et al. Selection of single blastocysts for fresh transfer via standard morphology assessment alone and with array CGH for good prognosis IVF patients: results from a randomized pilot study. Mol Cytogenet. 2012 ;5:24
5. Alfarawati S, Fragouli E, Colls P, et al. The relationship between blastocyst morphology, chromosomal abnormality, and embryo gender. Fertil Steril. 2011; 95:520-4.
6. Fiorentino F, Bono S, Biricik A, et al. Application of next-generation sequencing technology for comprehensive aneuploidy screening of blastocysts in clinical preimplantation genetic screening cycles. Hum Reprod. 2014;29:2802-13.
7. Gutiérrez-Mateo C, Colls P, Sánchez-García J, et al. Validation of microarray comparative genomic hybridization for comprehensive chromosome analysis of embryos. Fertil Steril. 2011;95:953-8.

12
European Hospital & Genoma Group MET-001 protocol November 2012
9.2 Appendix B (Schedule of Assessments)
The following is a key to the planned schedule of assessments and timing: Day -28 to Day5
Determine eligibility using inclusion and exclusion criteria Obtain Informed Consent Collect relevant demographic and medical history
Day 5
Determination of the approximate chromosomal mosaicism percentage in embryos scored as mosaics
Day 7 to 60
Embryo transfer Day 10 ± 3 post-transfer
Biochemical pregnancy test
Week 4-5 post-transfer
Confirmation of gestational sac by ultrasound
Week 10 post-transfer
Check pregnancy status, fetal heartbeat by ultrasound If pregnancy confirmed, perform invasive prenatal diagnosis
Week 20 post-transfer
Check pregnancy status If pregnancy confirmed, perform invasive prenatal diagnosis
Week 38-41 (Delivery)
Follow-up Visit
13
European Hospital & Genoma Group MET-001 protocol November 2012
I have read, understood, and agree to abide by all the conditions and instructions contained in this protocol.
Investigator Name Investigator Signature Date
Francesco Fiorentino _______________________ 19.11.2012
Clinical Director Name Clinical Director Signature Date
Ermanno Greco _______________________ 19.11.2012