Embed Size (px)
Citation preview
Health Service Plan 2019-2029
Activity and Projections Paper
Darling Downs HealthHealth Service Plan Activity and Projections Paper March 2019
Version control3711.v2 |First published March 2019Last reviewed August 2019
Office of the Chief Executive Darling Downs Hospital and Health Service Jofre Level 1 Baillie Henderson Hospital PO Box 405 Toowoomba Qld 4350
Copyright© Darling Downs Hospital and Health Service 2019
LicenceThis annual report is licensed by the State of Queensland (Darling Downs Hospital and Health Service) under a Creative Commons Attribution Non-Commercial 4.0 International licence.
CC BY Licence Summary StatementIn essence, you are free to copy, communicate and adapt the work for non-commercial purposes, as long as you attribute Darling Downs Hospital and Health Service and abide by the licence terms.To view a copy of this licence, visit http://creativecommons.org/licenses/by-nc/3.0/au/deed.en/
2
Contents
Section 1 ..............................................................................................6Introduction ............................................................................................................................. 6
Section 2 ..............................................................................................8Analyse the Darling Downs Health Base Case ........................................................................... 82.1. Introduction ............................................................................................................................................................92.2. Population Projections Underpinning the Base Case ............................................................................................ 102.3. AIM Base Case Activity Projections ........................................................................................................................ 122.3.1 Medical ................................................................................................................................................................. 142.3.2 Surgical Services .................................................................................................................................................. 172.3.3 Mental Health.......................................................................................................................................................222.3.4 Obstetrics and Gynaecology ................................................................................................................................. 252.3.5 Subacute .............................................................................................................................................................. 312.3.6 Critical Care .......................................................................................................................................................... 342.3.7 Paediatric ............................................................................................................................................................. 352.4. Non-AIM Activity Projections .................................................................................................................................402.4.1. Mental Health .....................................................................................................................................................402.4.2. Renal Dialysis ...................................................................................................................................................... 432.4.3. Cancer Services .................................................................................................................................................. 452.4.4. Endoscopy .......................................................................................................................................................... 472.4.5 Emergency and Elective Surgical Activity by SRG &ESRG ......................................................................................482.4.6. Interventional Cardiology .................................................................................................................................... 512.4.7. Qualified Neonates .............................................................................................................................................. 522.4.8. Emergency Department....................................................................................................................................... 532.4.9. Outpatients .........................................................................................................................................................602.4.10 Telehealth ..........................................................................................................................................................622.5. Base Case Treatment Space Projections .................................................................................................................642.5.1 Projected bed comparisons with ‘Base Case 2016/17’ beds .................................................................................642.5.2 Bed Numbers as Recorded in the Monthly Activity Collection ............................................................................... 762.5.3. Renal Dialysis ...................................................................................................................................................... 782.5.4. Chemotherapy ..................................................................................................................................................... 79
3
Section 3 .............................................................................................80Changing Models of Care ......................................................................................................... 803.1. Introduction ........................................................................................................................................................... 813.2 Bed days saved implementing strategies identified in the Health Service Plan at TH .............................................. 833.2.1 Bed days saved Hospital in the Home (HITH) ........................................................................................................ 833.2.2 Bed days saved Hospital in the Home (HITH) Community Palliative Care .............................................................843.2.3 Bed days saved Acute Geriatric Evaluation Service (AGES) ...................................................................................843.2.4 Contribution of ieMR in reducing ALOS at TH ........................................................................................................ 853.2.5 Additional reductions required in ALOS ................................................................................................................863.2.6 Reductions in readmission rates ..........................................................................................................................863.2.7 Summary of impact of strategies on reducing projected bed requirements .......................................................... 873.3. Accounting for Potential Changes in AIM Base Case Assumptions .........................................................................883.3.1. Methodology ......................................................................................................................................................883.4. Reducing Projected Other Non-Acute Activity at TH ................................................................................................ 933.4.1. Methodology ...................................................................................................................................................... 933.4.2. The Potential Impact ........................................................................................................................................... 93
Section 4 .............................................................................................94The future role of rural and remote services within Darling Downs Health ................................ 944.1. Introduction ........................................................................................................................................................... 954.1.1 Access to Primary Care .......................................................................................................................................... 954.1.2 The Kingaroy Hospital Redevelopment ................................................................................................................. 954.2. Endoscopy Services ............................................................................................................................................... 974.2.1. Methodology ...................................................................................................................................................... 974.2.2 Potential increase in endoscopy procedures at Kingaroy Hospital due to potential shift in treatment of private patients ........................................................................................................................................................................984.2.3 Warwick Hospital Endoscopy Services .................................................................................................................984.3 Subacute Services ...................................................................................................................................................994.3.1. Methodology ......................................................................................................................................................994.3.2 Jandowae Hospital – Review of Excessive Bed Days ............................................................................................ 1004.4 Medical Services .................................................................................................................................................... 101
Section 5 ............................................................................................102Consolidating the role of Toowoomba Hospital as a regional referral hospital .........................1025.1. Introduction .......................................................................................................................................................... 1035.2. Opportunities ....................................................................................................................................................... 1035.2.1 Proposed new day surgery facility Toowoomba Hospital ...................................................................................... 1045.3 Methodology .......................................................................................................................................................... 1045.3.1. Analysis of Priority Specialties ........................................................................................................................... 1045.3.2 Flow reversal from Brisbane public hospitals ...................................................................................................... 1045.4. Potential impact ................................................................................................................................................... 1055.4.1. Potential Impact of Flow Reversal from Metropolitan Public Hospitals on Overnight Bed Requirements ............ 1055.4.2. Adult Services .................................................................................................................................................... 1055.4.3 Interventional Cardiology .................................................................................................................................... 105
4
Section 6 ............................................................................................106Private health sector future demand and potential impact on public sector services ...............1066.1. Introduction .......................................................................................................................................................... 1076.2. Projected Private Hospital Demand ...................................................................................................................... 1086.3. Private Public Market Share Analysis ......................................................................................................................1116.4. Chargeable Patient Analysis ...................................................................................................................................1126.5. Low Volume Specialty Areas ...................................................................................................................................115
Section 7 ............................................................................................ 116Projected capacity requirements summary ..............................................................................1167.1. Toowoomba Hospital ..............................................................................................................................................1177.1.1. Toowoomba Hospital with Adult Interventional Cardiology by 2021/22 ................................................................1177.2 Capacity Changes Due to Changing Models of Care ................................................................................................ 1197.3 Capacity Changes Due to Changing Role of Rural Services ...................................................................................... 1207.4 Capacity Changes Due to Possible Changes Private Sector Service Delivery ........................................................... 120
References .........................................................................................124
Appendices ........................................................................................125
5

Introduction
Section 1
6
The purpose of the Health Service Plan Activity and Projections 2019-29 (this paper) is to provide projected service activity estimates to inform and support the Chief Executive and Board to make decisions regarding the development of services across Darling Downs Hospital and Health Service (Darling Downs Health).
The paper provides by facility the estimated inpatient bed and treatment spaces requirements up to 2036/37. The most critical of these findings are highlighted in the accompanying document, the Darling Downs Health Health Service Plan 2019-29.
Future estimates for capacity requirements are set out in the following chapters based on Queensland Health endorsed data sets and methodologies to create the ‘Base Case’ scenario. The Base Case Scenario is fundamentally representative of maintaining future services without change to the type of services provided or historical patient flows. The Base Case estimates are based on built in assumptions about public private market share, continued reductions in hospital length of stay and static rates for self-sufficiency. This paper measures the change to forecast Base Case capacity by moderating benchmarks used in the assumptions for reduced length of stay, market share and self-sufficiency.
This paper also looks at the impact on the Base Case of providing alternative models of care or new services as identified during stakeholder consultations. Alternative models of care are mostly focused on hospital substitution and avoidance and therefore should reduce projected capacity requirements. Caution is required interpreting the impact of these results on the Base Case projections. In the first instance any projected reduction in demand for services arising from alternative models of care must be used to account for reductions arising from the built in Base Case assumptions.
Finally, while there is limited capacity to develop new services in the next ten years at Toowoomba Hospital due to physical space constraints, stakeholder consultation highlighted discrete requests for service development, the impact on Base Case capacity of providing these services is outlined in this paper.
7
Analyse the Darling Downs Health Base Case
Section 2
8
2.1. INTRODUCTION The System Planning Branch, Department of Health (DoH) annually provides data sets with projected future health service activity to each Hospital and Health Service.
The projections of future health service activity are a collection of medium term, health service planning projections that forecast demand for anticipated healthcare by service type and location.
In addition to the data set DoH also provide endorsed guidelines for standard methodologies to determine specific service stream requirements (medical inpatient beds, special care nursery cots, chemotherapy bed alternatives etcetera). Note that the inpatient bed guidelines were endorsed in 2009 and do not reference the ‘market share adjustment’.The DoH has since added this adjustment to allow for the impact of decreasing rates of private health insurance and the subsequent rising increase in demand for public services. A summary of methodologies for projecting health service activity is provided in the Appendix C section. Alternatively, to access the page with the complete set of endorsed projection methodologies go to:
http://qheps.health.qld.gov.au/ppb/html/ppb_plan_guidelines_home.htm
The resulting analysis based on interrogation of the DoH data sets and using the endorsed guidelines for projecting bed and services requirements for each facility determines the ‘Base Case’. The Base Case forms the foundation for determining what is required to meet future activity demand. For the purposes of this report, the ‘Base Case’ refers to all activity projections using the latest DoH data sets for general inpatient admissions, endoscopy, mental health, renal dialysis, outpatients, emergency department presentations and chemotherapy. All projections in the ‘Base Case’ are calculated using DoH methodology developed specifically for each activity type.
The ‘Base Case’ provides projections based on a business as usual approach including historical trend of separations, current utilisation of services and current referral patterns. The tool generates a model of projected activity which based on state averages may result in a subtle change over time.For example, if the Darling Downs Health Average Length of Stay (ALOS) for a particular specialty related group is higher than the state average then the model will subtly trend the ALOS in the projections down close to the State ALOS. If the Darling Downs Health ALOS is less than the State average the projection will be status quo. It should also be noted that the ALOS generated in the DoH data sets do not include any portion of the inpatient stay greater than 90 days.
For the purposes of health service planning the ‘Base Case’ is reviewed in order to provide a comparator for individually modelled scenario’s that can be viewed as ‘what-if’s’ based around key strategic questions for Darling Downs Health. That is, what would the impact be, in terms of health service activity and capacity requirements at Toowoomba Hospital (TH), if Darling Downs Health:
• Systematically implemented a series of targeted model of care changes aimed at reducing demand on acute inpatient beds?
• Pursued an altered future role for its rural and remote facilities? • Took steps to expand the role of TH to increase self-sufficiency for targeted specialty services? • Expanded public/private arrangements for future acute service delivery?
These questions are explored within Sections 3 through to 6 of this report.
9
2.2. POPULATION PROJECTIONS UNDERPINNING THE BASE CASE
Acute Inpatient Modelling (AIM) and non-AIM projections are informed by a variety of inputs and one of the most important is the population projections provided by Queensland Government Statistician’s Office (QGSO) based on Australian Bureau of Statistics (ABS) data.
Population level 2016 Census data was released by the ABS at the end of June 2017 allowing a comparison of the QGSO 2015 edition population projections for the year 2016. The QGSO 2015 edition population projections underpin AIM and other non-AIM population-based projections (such as mental health).
Analysis of the total Darling Downs Health population indicates that the QGSO 2015 edition projections for 2016 overestimated the population growth in the region by 2,410 people or 0.9 percent based on the 2016 census results. When analysed by age groups, for all residents 60 years and over, there is very little difference between the QGSO 2015 edition projection for 2016 and the 2016 Census.For the following age groups, the QGSO 2016 projections overestimated the resident population:
• zero to 14 years of age cohort by 726 residents• 30 to 59 years of age cohort by 2,343 residents.
For the age group 15 to 29 years of age the QGSO 2016 projections underestimated the resident population by 614 residents.
Table 1 below shows the difference between QGSO projection and Census results in five-year intervals. This means that population growth factors in the methodology for AIM and non-AIM projections are accurate for the over 60 years old cohort. For all other age groups, the projections will be slightly inflated due to the overestimate in population.
Comparison of the 2011 and 2016 Census figures shows an increase in the total Darling Downs Health population by about 12,000 residents for the five-year period. By age group, most of population growth occurred in the over 55 years and over age groups. Refer to Table 1.
10
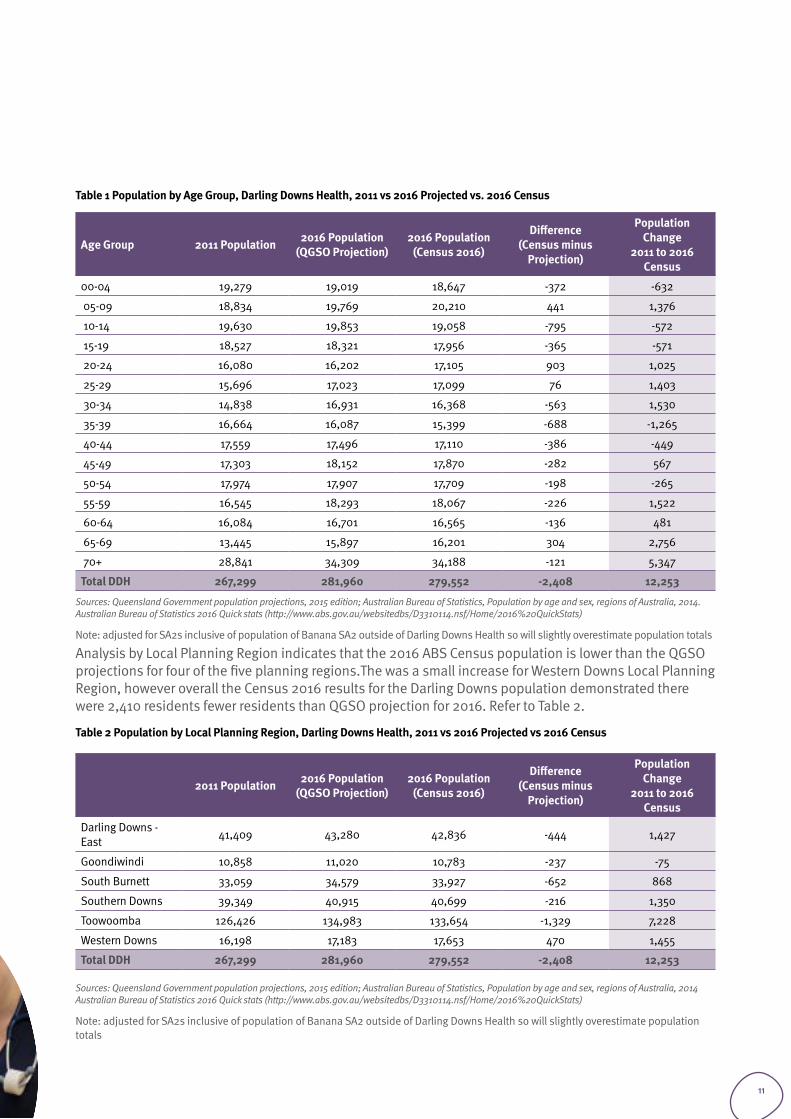
Table 1 Population by Age Group, Darling Downs Health, 2011 vs 2016 Projected vs. 2016 Census
Age Group 2011 Population 2016 Population (QGSO Projection)
2016 Population (Census 2016)
Difference (Census minus
Projection)
Population Change
2011 to 2016 Census
00-04 19,279 19,019 18,647 -372 -632
05-09 18,834 19,769 20,210 441 1,376
10-14 19,630 19,853 19,058 -795 -572
15-19 18,527 18,321 17,956 -365 -571
20-24 16,080 16,202 17,105 903 1,025
25-29 15,696 17,023 17,099 76 1,403
30-34 14,838 16,931 16,368 -563 1,530
35-39 16,664 16,087 15,399 -688 -1,265
40-44 17,559 17,496 17,110 -386 -449
45-49 17,303 18,152 17,870 -282 567
50-54 17,974 17,907 17,709 -198 -265
55-59 16,545 18,293 18,067 -226 1,522
60-64 16,084 16,701 16,565 -136 481
65-69 13,445 15,897 16,201 304 2,756
70+ 28,841 34,309 34,188 -121 5,347
Total DDH 267,299 281,960 279,552 -2,408 12,253
Sources: Queensland Government population projections, 2015 edition; Australian Bureau of Statistics, Population by age and sex, regions of Australia, 2014.Australian Bureau of Statistics 2016 Quick stats (http://www.abs.gov.au/websitedbs/D3310114.nsf/Home/2016%20QuickStats)
Note: adjusted for SA2s inclusive of population of Banana SA2 outside of Darling Downs Health so will slightly overestimate population totals
Analysis by Local Planning Region indicates that the 2016 ABS Census population is lower than the QGSO projections for four of the five planning regions.The was a small increase for Western Downs Local Planning Region, however overall the Census 2016 results for the Darling Downs population demonstrated there were 2,410 residents fewer residents than QGSO projection for 2016. Refer to Table 2.
Table 2 Population by Local Planning Region, Darling Downs Health, 2011 vs 2016 Projected vs 2016 Census
2011 Population 2016 Population (QGSO Projection)
2016 Population (Census 2016)
Difference (Census minus
Projection)
Population Change
2011 to 2016 Census
Darling Downs - East 41,409 43,280 42,836 -444 1,427
Goondiwindi 10,858 11,020 10,783 -237 -75
South Burnett 33,059 34,579 33,927 -652 868
Southern Downs 39,349 40,915 40,699 -216 1,350
Toowoomba 126,426 134,983 133,654 -1,329 7,228
Western Downs 16,198 17,183 17,653 470 1,455
Total DDH 267,299 281,960 279,552 -2,408 12,253
Sources: Queensland Government population projections, 2015 edition; Australian Bureau of Statistics, Population by age and sex, regions of Australia, 2014 Australian Bureau of Statistics 2016 Quick stats (http://www.abs.gov.au/websitedbs/D3310114.nsf/Home/2016%20QuickStats)
Note: adjusted for SA2s inclusive of population of Banana SA2 outside of Darling Downs Health so will slightly overestimate population totals
11
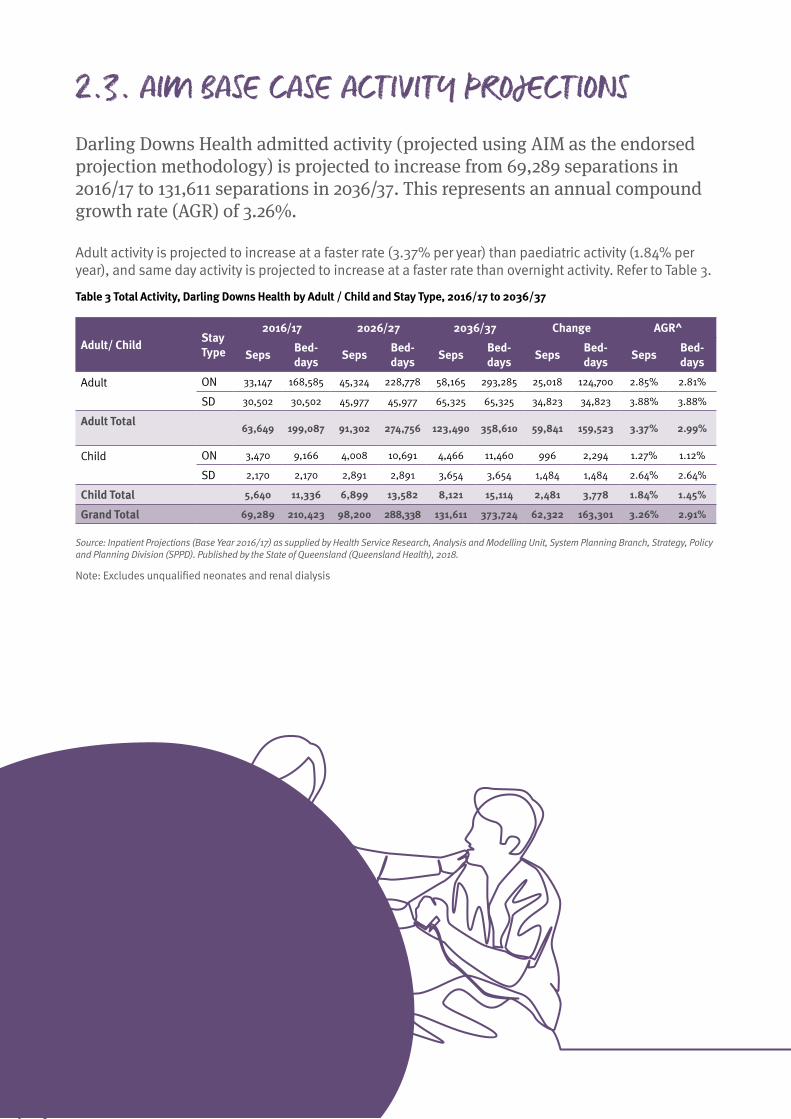
2.3. AIM BASE CASE ACTIVITY PROJECTIONS Darling Downs Health admitted activity (projected using AIM as the endorsed projection methodology) is projected to increase from 69,289 separations in 2016/17 to 131,611 separations in 2036/37. This represents an annual compound growth rate (AGR) of 3.26%.
Adult activity is projected to increase at a faster rate (3.37% per year) than paediatric activity (1.84% per year), and same day activity is projected to increase at a faster rate than overnight activity. Refer to Table 3.
Table 3 Total Activity, Darling Downs Health by Adult / Child and Stay Type, 2016/17 to 2036/37
Adult/ Child Stay Type
2016/17 2026/27 2036/37 Change AGR^
Seps Bed-days Seps Bed-
days Seps Bed-days Seps Bed-
days Seps Bed-days
Adult
ON 33,147 168,585 45,324 228,778 58,165 293,285 25,018 124,700 2.85% 2.81%
SD 30,502 30,502 45,977 45,977 65,325 65,325 34,823 34,823 3.88% 3.88%
Adult Total
63,649 199,087 91,302 274,756 123,490 358,610 59,841 159,523 3.37% 2.99%
Child
ON 3,470 9,166 4,008 10,691 4,466 11,460 996 2,294 1.27% 1.12%
SD 2,170 2,170 2,891 2,891 3,654 3,654 1,484 1,484 2.64% 2.64%
Child Total 5,640 11,336 6,899 13,582 8,121 15,114 2,481 3,778 1.84% 1.45%
Grand Total 69,289 210,423 98,200 288,338 131,611 373,724 62,322 163,301 3.26% 2.91%
Source: Inpatient Projections (Base Year 2016/17) as supplied by Health Service Research, Analysis and Modelling Unit, System Planning Branch, Strategy, Policy and Planning Division (SPPD). Published by the State of Queensland (Queensland Health), 2018.
Note: Excludes unqualified neonates and renal dialysis
12
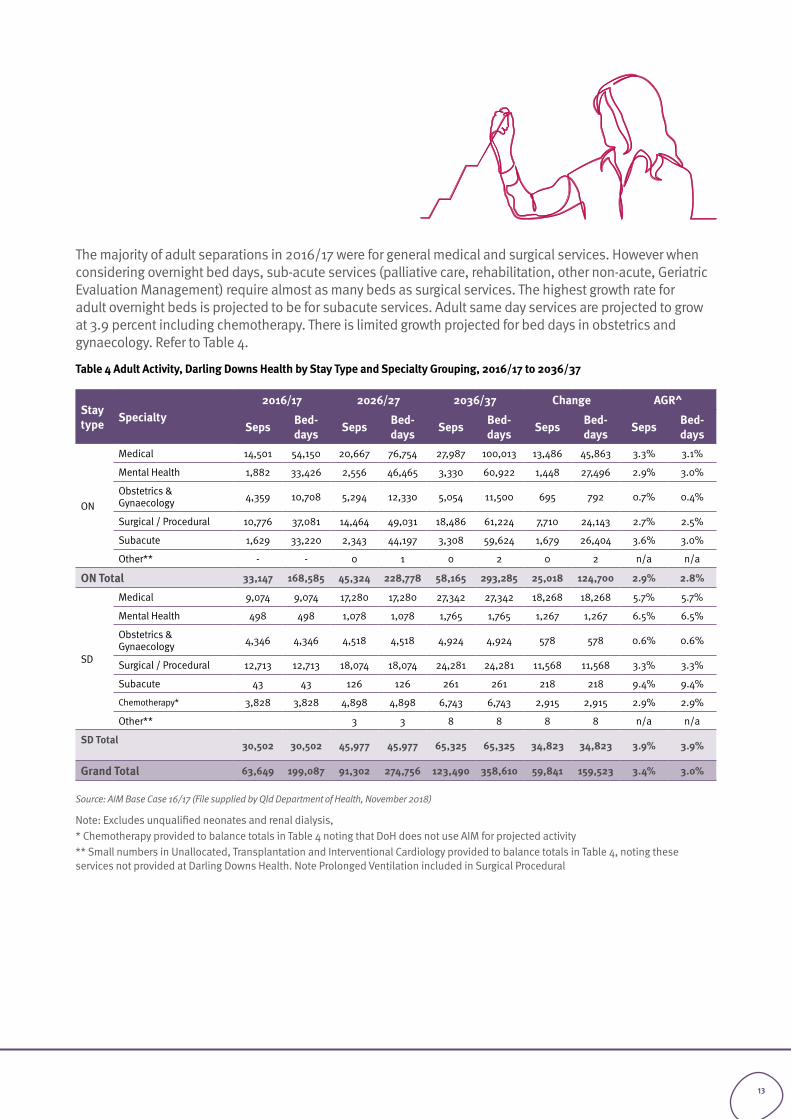
The majority of adult separations in 2016/17 were for general medical and surgical services. However when considering overnight bed days, sub-acute services (palliative care, rehabilitation, other non-acute, Geriatric Evaluation Management) require almost as many beds as surgical services. The highest growth rate for adult overnight beds is projected to be for subacute services. Adult same day services are projected to grow at 3.9 percent including chemotherapy. There is limited growth projected for bed days in obstetrics and gynaecology. Refer to Table 4.
Table 4 Adult Activity, Darling Downs Health by Stay Type and Specialty Grouping, 2016/17 to 2036/37
Stay type Specialty
2016/17 2026/27 2036/37 Change AGR^
Seps Bed-days Seps Bed-
days Seps Bed-days Seps Bed-
days Seps Bed-days
ON
Medical 14,501 54,150 20,667 76,754 27,987 100,013 13,486 45,863 3.3% 3.1%
Mental Health 1,882 33,426 2,556 46,465 3,330 60,922 1,448 27,496 2.9% 3.0%
Obstetrics & Gynaecology 4,359 10,708 5,294 12,330 5,054 11,500 695 792 0.7% 0.4%
Surgical / Procedural 10,776 37,081 14,464 49,031 18,486 61,224 7,710 24,143 2.7% 2.5%
Subacute 1,629 33,220 2,343 44,197 3,308 59,624 1,679 26,404 3.6% 3.0%
Other** - - 0 1 0 2 0 2 n/a n/a
ON Total 33,147 168,585 45,324 228,778 58,165 293,285 25,018 124,700 2.9% 2.8%
SD
Medical 9,074 9,074 17,280 17,280 27,342 27,342 18,268 18,268 5.7% 5.7%
Mental Health 498 498 1,078 1,078 1,765 1,765 1,267 1,267 6.5% 6.5%
Obstetrics & Gynaecology 4,346 4,346 4,518 4,518 4,924 4,924 578 578 0.6% 0.6%
Surgical / Procedural 12,713 12,713 18,074 18,074 24,281 24,281 11,568 11,568 3.3% 3.3%
Subacute 43 43 126 126 261 261 218 218 9.4% 9.4%
Chemotherapy* 3,828 3,828 4,898 4,898 6,743 6,743 2,915 2,915 2.9% 2.9%
Other** 3 3 8 8 8 8 n/a n/a
SD Total 30,502 30,502 45,977 45,977 65,325 65,325 34,823 34,823 3.9% 3.9%
Grand Total 63,649 199,087 91,302 274,756 123,490 358,610 59,841 159,523 3.4% 3.0%
Source: AIM Base Case 16/17 (File supplied by Qld Department of Health, November 2018)
Note: Excludes unqualified neonates and renal dialysis, * Chemotherapy provided to balance totals in Table 4 noting that DoH does not use AIM for projected activity** Small numbers in Unallocated, Transplantation and Interventional Cardiology provided to balance totals in Table 4, noting these services not provided at Darling Downs Health. Note Prolonged Ventilation included in Surgical Procedural
13
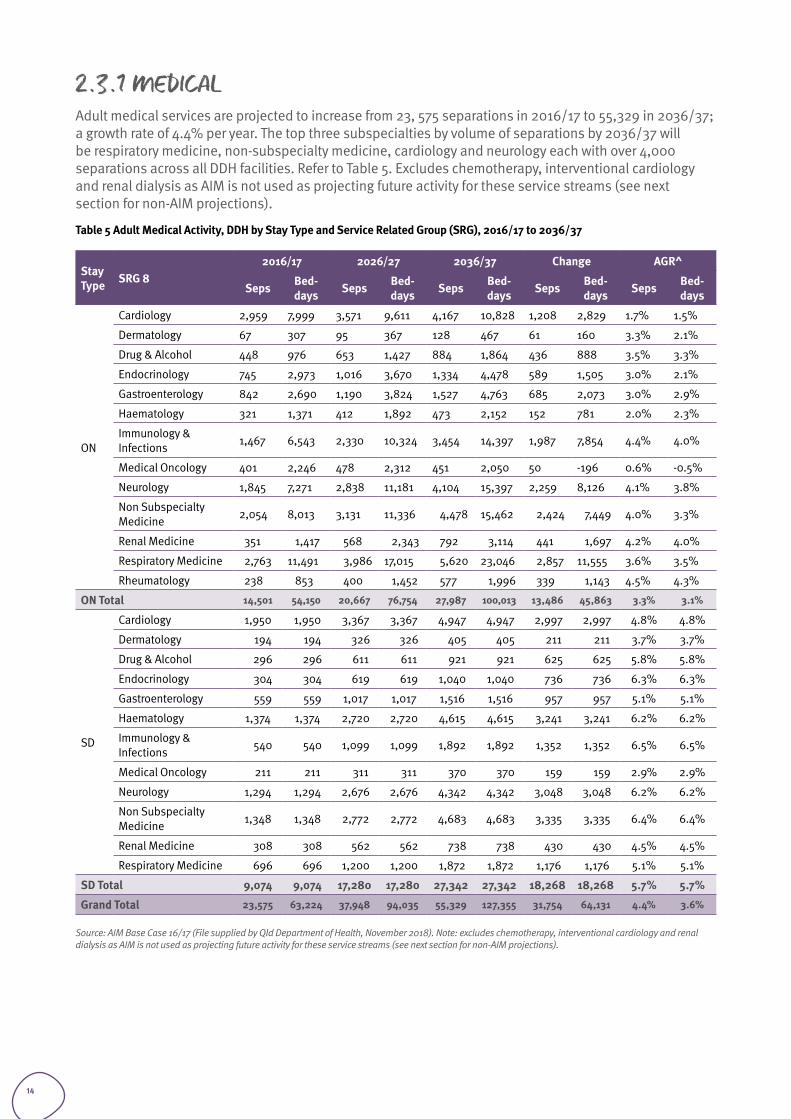
2.3.1 MEDICALAdult medical services are projected to increase from 23, 575 separations in 2016/17 to 55,329 in 2036/37; a growth rate of 4.4% per year. The top three subspecialties by volume of separations by 2036/37 will be respiratory medicine, non-subspecialty medicine, cardiology and neurology each with over 4,000 separations across all DDH facilities. Refer to Table 5. Excludes chemotherapy, interventional cardiology and renal dialysis as AIM is not used as projecting future activity for these service streams (see next section for non-AIM projections).
Table 5 Adult Medical Activity, DDH by Stay Type and Service Related Group (SRG), 2016/17 to 2036/37
Stay Type SRG 8
2016/17 2026/27 2036/37 Change AGR^
Seps Bed-days Seps Bed-
days Seps Bed-days Seps Bed-
days Seps Bed-days
ON
Cardiology 2,959 7,999 3,571 9,611 4,167 10,828 1,208 2,829 1.7% 1.5%
Dermatology 67 307 95 367 128 467 61 160 3.3% 2.1%
Drug & Alcohol 448 976 653 1,427 884 1,864 436 888 3.5% 3.3%
Endocrinology 745 2,973 1,016 3,670 1,334 4,478 589 1,505 3.0% 2.1%
Gastroenterology 842 2,690 1,190 3,824 1,527 4,763 685 2,073 3.0% 2.9%
Haematology 321 1,371 412 1,892 473 2,152 152 781 2.0% 2.3%
Immunology & Infections 1,467 6,543 2,330 10,324 3,454 14,397 1,987 7,854 4.4% 4.0%
Medical Oncology 401 2,246 478 2,312 451 2,050 50 -196 0.6% -0.5%
Neurology 1,845 7,271 2,838 11,181 4,104 15,397 2,259 8,126 4.1% 3.8%
Non Subspecialty Medicine 2,054 8,013 3,131 11,336 4,478 15,462 2,424 7,449 4.0% 3.3%
Renal Medicine 351 1,417 568 2,343 792 3,114 441 1,697 4.2% 4.0%
Respiratory Medicine 2,763 11,491 3,986 17,015 5,620 23,046 2,857 11,555 3.6% 3.5%
Rheumatology 238 853 400 1,452 577 1,996 339 1,143 4.5% 4.3%
ON Total 14,501 54,150 20,667 76,754 27,987 100,013 13,486 45,863 3.3% 3.1%
SD
Cardiology 1,950 1,950 3,367 3,367 4,947 4,947 2,997 2,997 4.8% 4.8%
Dermatology 194 194 326 326 405 405 211 211 3.7% 3.7%
Drug & Alcohol 296 296 611 611 921 921 625 625 5.8% 5.8%
Endocrinology 304 304 619 619 1,040 1,040 736 736 6.3% 6.3%
Gastroenterology 559 559 1,017 1,017 1,516 1,516 957 957 5.1% 5.1%
Haematology 1,374 1,374 2,720 2,720 4,615 4,615 3,241 3,241 6.2% 6.2%
Immunology & Infections 540 540 1,099 1,099 1,892 1,892 1,352 1,352 6.5% 6.5%
Medical Oncology 211 211 311 311 370 370 159 159 2.9% 2.9%
Neurology 1,294 1,294 2,676 2,676 4,342 4,342 3,048 3,048 6.2% 6.2%
Non Subspecialty Medicine 1,348 1,348 2,772 2,772 4,683 4,683 3,335 3,335 6.4% 6.4%
Renal Medicine 308 308 562 562 738 738 430 430 4.5% 4.5%
Respiratory Medicine 696 696 1,200 1,200 1,872 1,872 1,176 1,176 5.1% 5.1%
SD Total 9,074 9,074 17,280 17,280 27,342 27,342 18,268 18,268 5.7% 5.7%
Grand Total 23,575 63,224 37,948 94,035 55,329 127,355 31,754 64,131 4.4% 3.6%
Source: AIM Base Case 16/17 (File supplied by Qld Department of Health, November 2018). Note: excludes chemotherapy, interventional cardiology and renal dialysis as AIM is not used as projecting future activity for these service streams (see next section for non-AIM projections).
14
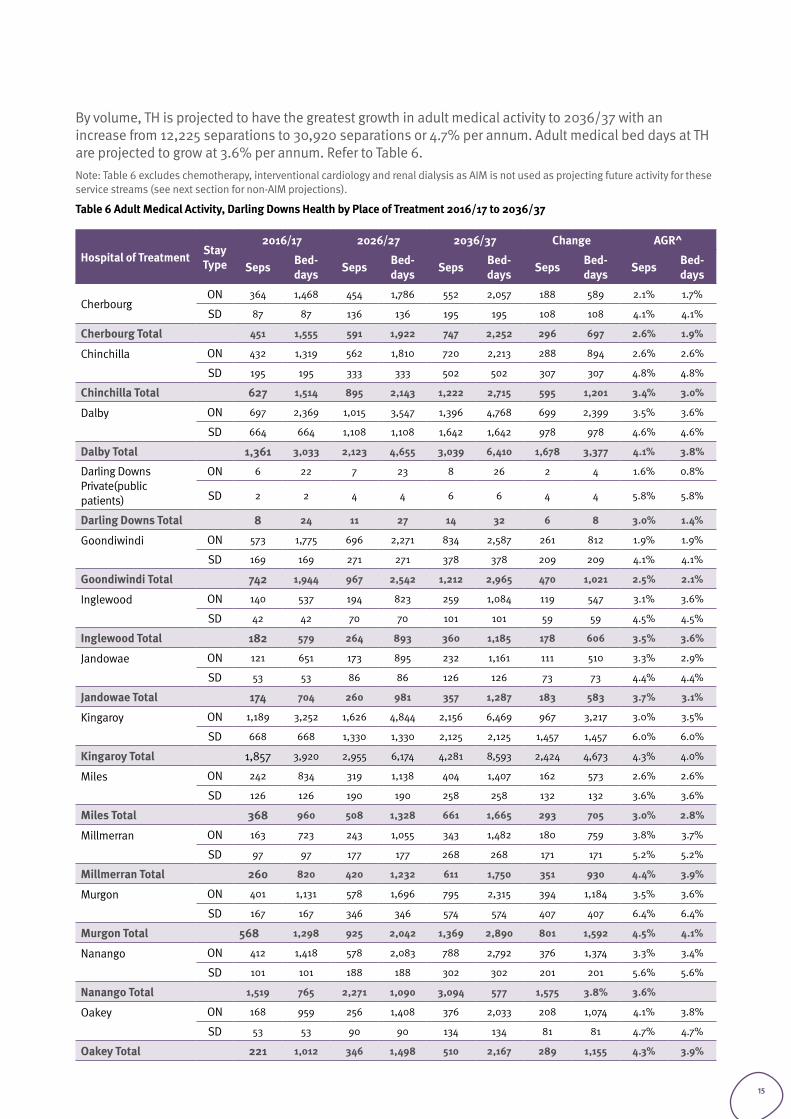
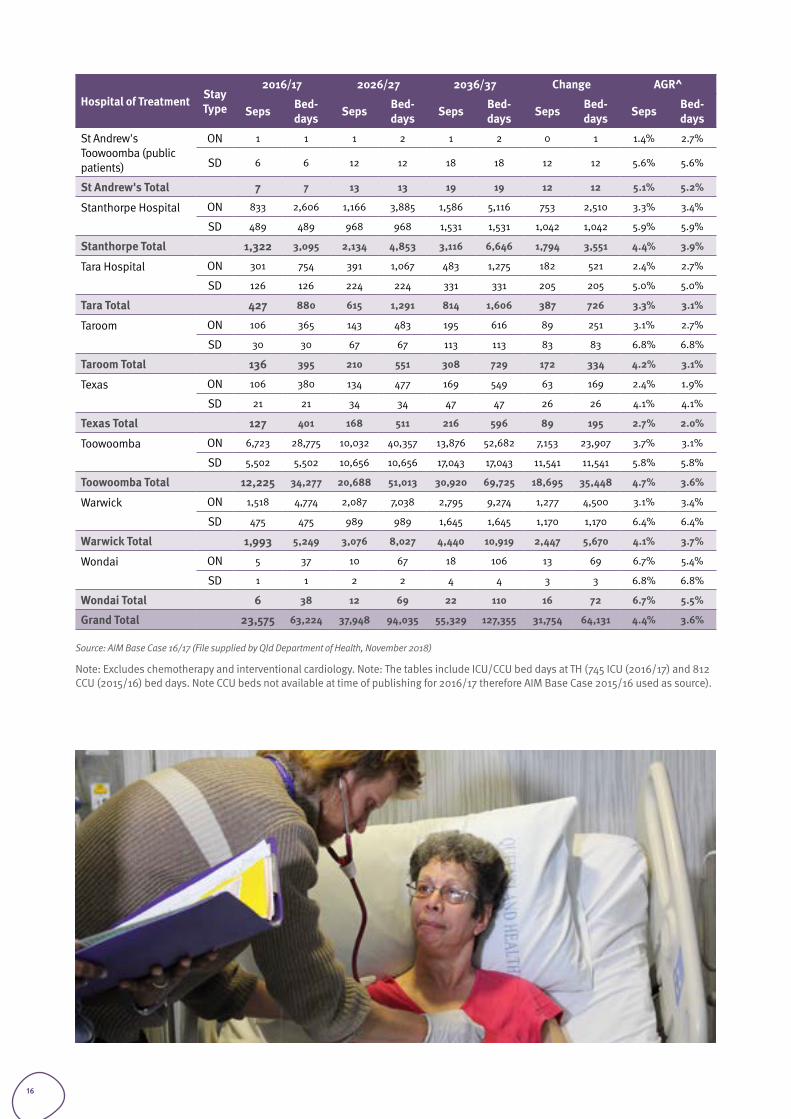
By volume, TH is projected to have the greatest growth in adult medical activity to 2036/37 with an increase from 12,225 separations to 30,920 separations or 4.7% per annum. Adult medical bed days at TH are projected to grow at 3.6% per annum. Refer to Table 6.Note: Table 6 excludes chemotherapy, interventional cardiology and renal dialysis as AIM is not used as projecting future activity for these service streams (see next section for non-AIM projections).
Table 6 Adult Medical Activity, Darling Downs Health by Place of Treatment 2016/17 to 2036/37
Hospital of Treatment Stay Type
2016/17 2026/27 2036/37 Change AGR^
Seps Bed-days Seps Bed-
days Seps Bed-days Seps Bed-
days Seps Bed-days
CherbourgON 364 1,468 454 1,786 552 2,057 188 589 2.1% 1.7%
SD 87 87 136 136 195 195 108 108 4.1% 4.1%
Cherbourg Total 451 1,555 591 1,922 747 2,252 296 697 2.6% 1.9%
Chinchilla
ON 432 1,319 562 1,810 720 2,213 288 894 2.6% 2.6%
SD 195 195 333 333 502 502 307 307 4.8% 4.8%
Chinchilla Total 627 1,514 895 2,143 1,222 2,715 595 1,201 3.4% 3.0%
Dalby
ON 697 2,369 1,015 3,547 1,396 4,768 699 2,399 3.5% 3.6%
SD 664 664 1,108 1,108 1,642 1,642 978 978 4.6% 4.6%
Dalby Total 1,361 3,033 2,123 4,655 3,039 6,410 1,678 3,377 4.1% 3.8%
Darling Downs Private(public patients)
ON 6 22 7 23 8 26 2 4 1.6% 0.8%
SD 2 2 4 4 6 6 4 4 5.8% 5.8%
Darling Downs Total 8 24 11 27 14 32 6 8 3.0% 1.4%
Goondiwindi
ON 573 1,775 696 2,271 834 2,587 261 812 1.9% 1.9%
SD 169 169 271 271 378 378 209 209 4.1% 4.1%
Goondiwindi Total 742 1,944 967 2,542 1,212 2,965 470 1,021 2.5% 2.1%
Inglewood
ON 140 537 194 823 259 1,084 119 547 3.1% 3.6%
SD 42 42 70 70 101 101 59 59 4.5% 4.5%
Inglewood Total 182 579 264 893 360 1,185 178 606 3.5% 3.6%
Jandowae
ON 121 651 173 895 232 1,161 111 510 3.3% 2.9%
SD 53 53 86 86 126 126 73 73 4.4% 4.4%
Jandowae Total 174 704 260 981 357 1,287 183 583 3.7% 3.1%
Kingaroy
ON 1,189 3,252 1,626 4,844 2,156 6,469 967 3,217 3.0% 3.5%
SD 668 668 1,330 1,330 2,125 2,125 1,457 1,457 6.0% 6.0%
Kingaroy Total 1,857 3,920 2,955 6,174 4,281 8,593 2,424 4,673 4.3% 4.0%
Miles
ON 242 834 319 1,138 404 1,407 162 573 2.6% 2.6%
SD 126 126 190 190 258 258 132 132 3.6% 3.6%
Miles Total 368 960 508 1,328 661 1,665 293 705 3.0% 2.8%
Millmerran
ON 163 723 243 1,055 343 1,482 180 759 3.8% 3.7%
SD 97 97 177 177 268 268 171 171 5.2% 5.2%
Millmerran Total 260 820 420 1,232 611 1,750 351 930 4.4% 3.9%
Murgon
ON 401 1,131 578 1,696 795 2,315 394 1,184 3.5% 3.6%
SD 167 167 346 346 574 574 407 407 6.4% 6.4%
Murgon Total 568 1,298 925 2,042 1,369 2,890 801 1,592 4.5% 4.1%
Nanango
ON 412 1,418 578 2,083 788 2,792 376 1,374 3.3% 3.4%
SD 101 101 188 188 302 302 201 201 5.6% 5.6%
Nanango Total 1,519 765 2,271 1,090 3,094 577 1,575 3.8% 3.6%
Oakey
ON 168 959 256 1,408 376 2,033 208 1,074 4.1% 3.8%
SD 53 53 90 90 134 134 81 81 4.7% 4.7%
Oakey Total 221 1,012 346 1,498 510 2,167 289 1,155 4.3% 3.9%
15
Hospital of Treatment Stay Type
2016/17 2026/27 2036/37 Change AGR^
Seps Bed-days Seps Bed-
days Seps Bed-days Seps Bed-
days Seps Bed-days
St Andrew's Toowoomba (public patients)
ON 1 1 1 2 1 2 0 1 1.4% 2.7%
SD 6 6 12 12 18 18 12 12 5.6% 5.6%
St Andrew's Total 7 7 13 13 19 19 12 12 5.1% 5.2%
Stanthorpe Hospital
ON 833 2,606 1,166 3,885 1,586 5,116 753 2,510 3.3% 3.4%
SD 489 489 968 968 1,531 1,531 1,042 1,042 5.9% 5.9%
Stanthorpe Total 1,322 3,095 2,134 4,853 3,116 6,646 1,794 3,551 4.4% 3.9%
Tara Hospital
ON 301 754 391 1,067 483 1,275 182 521 2.4% 2.7%
SD 126 126 224 224 331 331 205 205 5.0% 5.0%
Tara Total 427 880 615 1,291 814 1,606 387 726 3.3% 3.1%
Taroom
ON 106 365 143 483 195 616 89 251 3.1% 2.7%
SD 30 30 67 67 113 113 83 83 6.8% 6.8%
Taroom Total 136 395 210 551 308 729 172 334 4.2% 3.1%
Texas
ON 106 380 134 477 169 549 63 169 2.4% 1.9%
SD 21 21 34 34 47 47 26 26 4.1% 4.1%
Texas Total 127 401 168 511 216 596 89 195 2.7% 2.0%
Toowoomba
ON 6,723 28,775 10,032 40,357 13,876 52,682 7,153 23,907 3.7% 3.1%
SD 5,502 5,502 10,656 10,656 17,043 17,043 11,541 11,541 5.8% 5.8%
Toowoomba Total 12,225 34,277 20,688 51,013 30,920 69,725 18,695 35,448 4.7% 3.6%
Warwick
ON 1,518 4,774 2,087 7,038 2,795 9,274 1,277 4,500 3.1% 3.4%
SD 475 475 989 989 1,645 1,645 1,170 1,170 6.4% 6.4%
Warwick Total 1,993 5,249 3,076 8,027 4,440 10,919 2,447 5,670 4.1% 3.7%
Wondai
ON 5 37 10 67 18 106 13 69 6.7% 5.4%
SD 1 1 2 2 4 4 3 3 6.8% 6.8%
Wondai Total 6 38 12 69 22 110 16 72 6.7% 5.5%
Grand Total 23,575 63,224 37,948 94,035 55,329 127,355 31,754 64,131 4.4% 3.6%
Source: AIM Base Case 16/17 (File supplied by Qld Department of Health, November 2018)
Note: Excludes chemotherapy and interventional cardiology. Note: The tables include ICU/CCU bed days at TH (745 ICU (2016/17) and 812 CCU (2015/16) bed days. Note CCU beds not available at time of publishing for 2016/17 therefore AIM Base Case 2015/16 used as source).
16
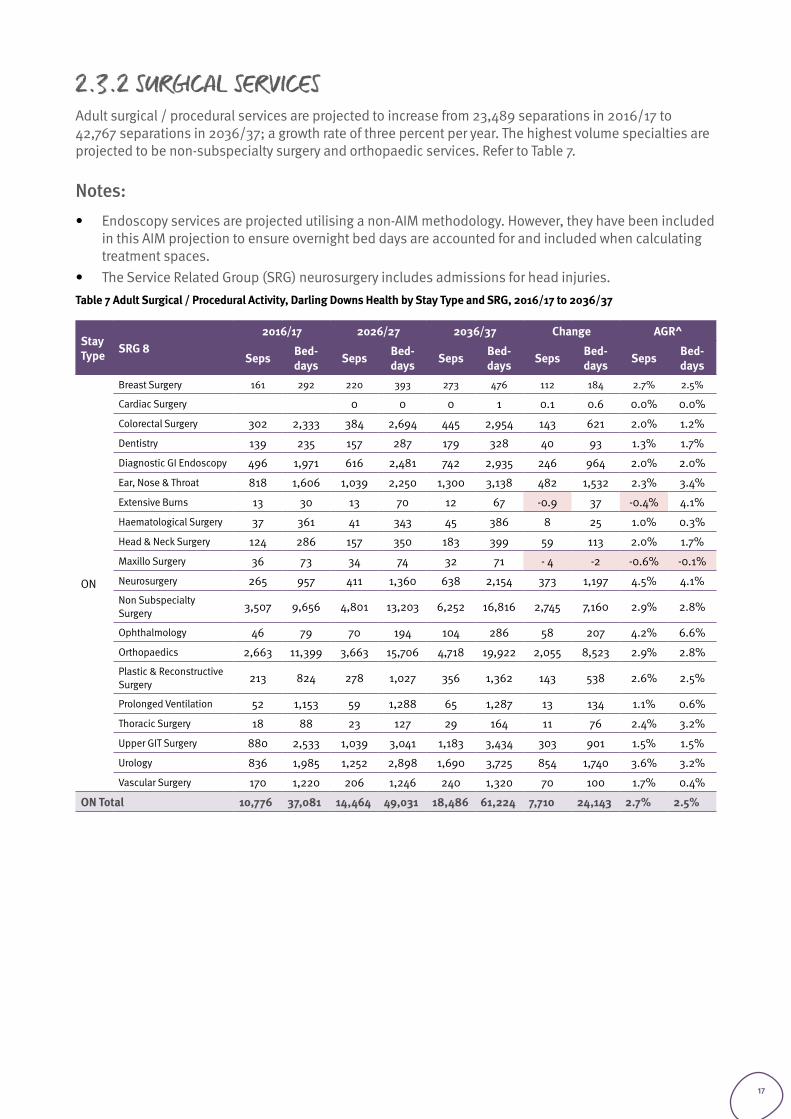
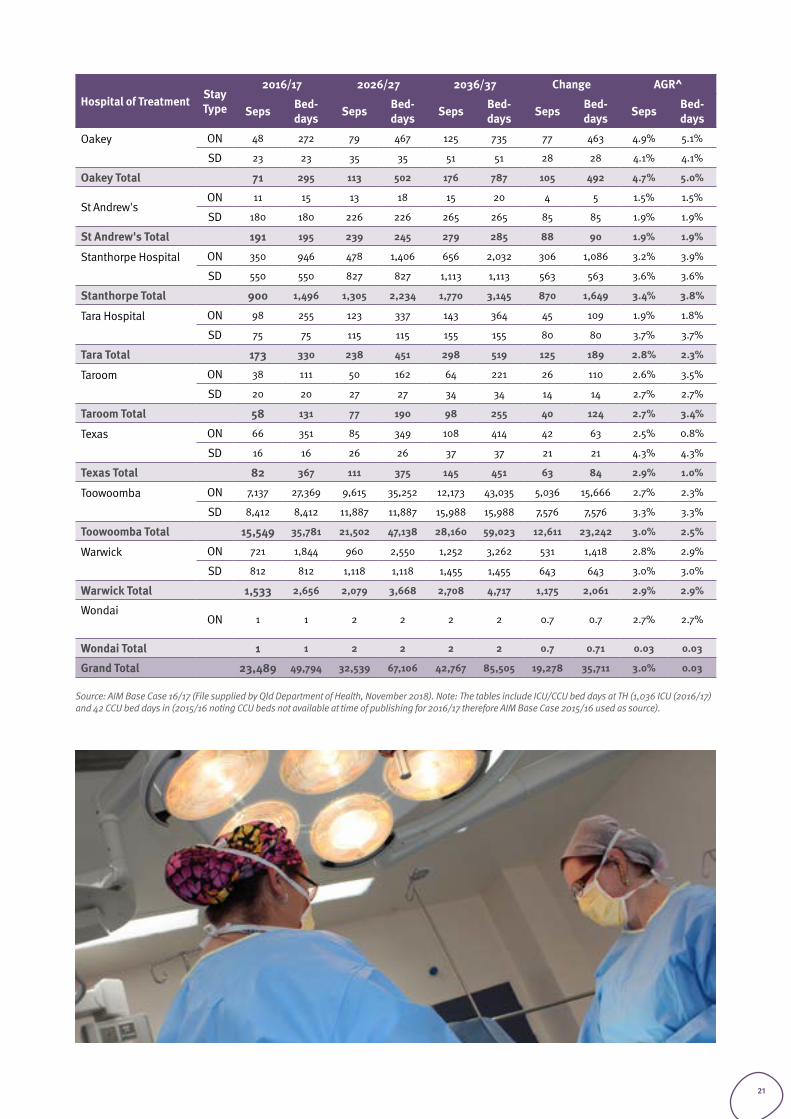
2.3.2 SURGICAL SERVICESAdult surgical / procedural services are projected to increase from 23,489 separations in 2016/17 to 42,767 separations in 2036/37; a growth rate of three percent per year. The highest volume specialties are projected to be non-subspecialty surgery and orthopaedic services. Refer to Table 7.
Notes: • Endoscopy services are projected utilising a non-AIM methodology. However, they have been included
in this AIM projection to ensure overnight bed days are accounted for and included when calculating treatment spaces.
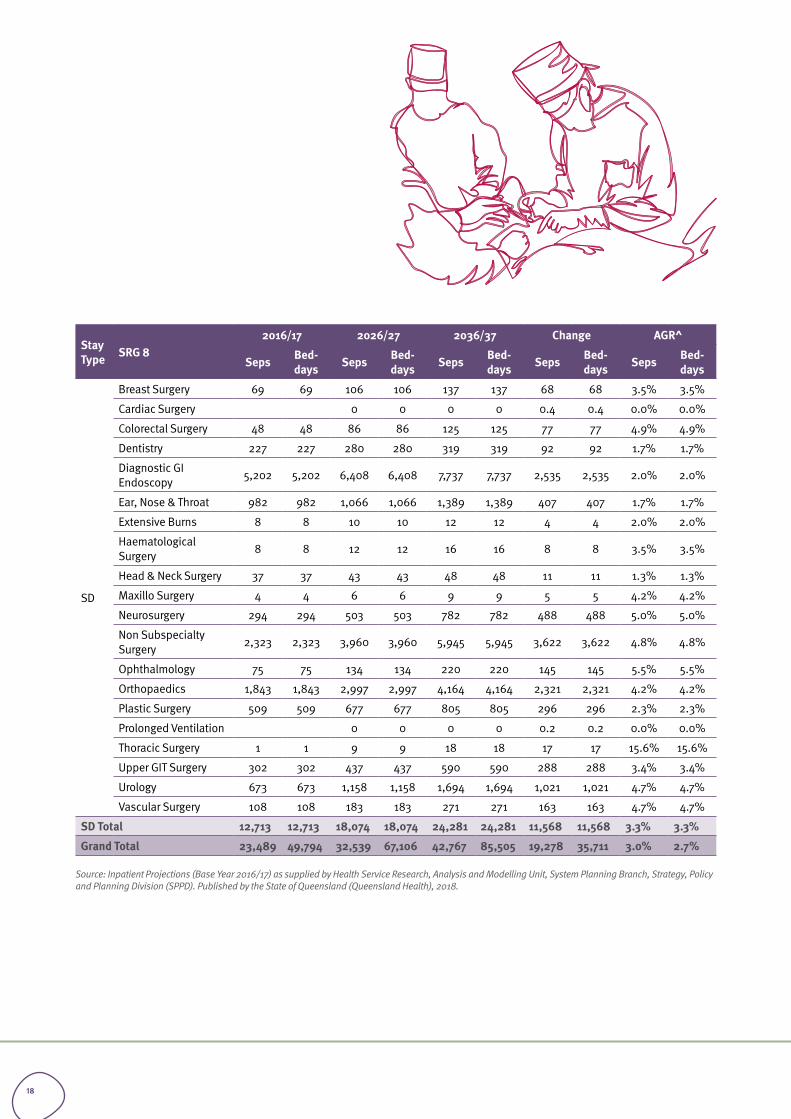
• The Service Related Group (SRG) neurosurgery includes admissions for head injuries. Table 7 Adult Surgical / Procedural Activity, Darling Downs Health by Stay Type and SRG, 2016/17 to 2036/37
Stay Type SRG 8
2016/17 2026/27 2036/37 Change AGR^
Seps Bed-days Seps Bed-
days Seps Bed-days Seps Bed-
days Seps Bed-days
ON
Breast Surgery 161 292 220 393 273 476 112 184 2.7% 2.5%
Cardiac Surgery 0 0 0 1 0.1 0.6 0.0% 0.0%
Colorectal Surgery 302 2,333 384 2,694 445 2,954 143 621 2.0% 1.2%
Dentistry 139 235 157 287 179 328 40 93 1.3% 1.7%
Diagnostic GI Endoscopy 496 1,971 616 2,481 742 2,935 246 964 2.0% 2.0%
Ear, Nose & Throat 818 1,606 1,039 2,250 1,300 3,138 482 1,532 2.3% 3.4%
Extensive Burns 13 30 13 70 12 67 -0.9 37 -0.4% 4.1%
Haematological Surgery 37 361 41 343 45 386 8 25 1.0% 0.3%
Head & Neck Surgery 124 286 157 350 183 399 59 113 2.0% 1.7%
Maxillo Surgery 36 73 34 74 32 71 - 4 -2 -0.6% -0.1%
Neurosurgery 265 957 411 1,360 638 2,154 373 1,197 4.5% 4.1%
Non Subspecialty Surgery 3,507 9,656 4,801 13,203 6,252 16,816 2,745 7,160 2.9% 2.8%
Ophthalmology 46 79 70 194 104 286 58 207 4.2% 6.6%
Orthopaedics 2,663 11,399 3,663 15,706 4,718 19,922 2,055 8,523 2.9% 2.8%
Plastic & Reconstructive Surgery 213 824 278 1,027 356 1,362 143 538 2.6% 2.5%
Prolonged Ventilation 52 1,153 59 1,288 65 1,287 13 134 1.1% 0.6%
Thoracic Surgery 18 88 23 127 29 164 11 76 2.4% 3.2%
Upper GIT Surgery 880 2,533 1,039 3,041 1,183 3,434 303 901 1.5% 1.5%
Urology 836 1,985 1,252 2,898 1,690 3,725 854 1,740 3.6% 3.2%
Vascular Surgery 170 1,220 206 1,246 240 1,320 70 100 1.7% 0.4%
ON Total 10,776 37,081 14,464 49,031 18,486 61,224 7,710 24,143 2.7% 2.5%
17
Stay Type SRG 8
2016/17 2026/27 2036/37 Change AGR^
Seps Bed-days Seps Bed-
days Seps Bed-days Seps Bed-
days Seps Bed-days
SD
Breast Surgery 69 69 106 106 137 137 68 68 3.5% 3.5%
Cardiac Surgery 0 0 0 0 0.4 0.4 0.0% 0.0%
Colorectal Surgery 48 48 86 86 125 125 77 77 4.9% 4.9%
Dentistry 227 227 280 280 319 319 92 92 1.7% 1.7%
Diagnostic GI Endoscopy 5,202 5,202 6,408 6,408 7,737 7,737 2,535 2,535 2.0% 2.0%
Ear, Nose & Throat 982 982 1,066 1,066 1,389 1,389 407 407 1.7% 1.7%
Extensive Burns 8 8 10 10 12 12 4 4 2.0% 2.0%
Haematological Surgery 8 8 12 12 16 16 8 8 3.5% 3.5%
Head & Neck Surgery 37 37 43 43 48 48 11 11 1.3% 1.3%
Maxillo Surgery 4 4 6 6 9 9 5 5 4.2% 4.2%
Neurosurgery 294 294 503 503 782 782 488 488 5.0% 5.0%
Non Subspecialty Surgery 2,323 2,323 3,960 3,960 5,945 5,945 3,622 3,622 4.8% 4.8%
Ophthalmology 75 75 134 134 220 220 145 145 5.5% 5.5%
Orthopaedics 1,843 1,843 2,997 2,997 4,164 4,164 2,321 2,321 4.2% 4.2%
Plastic Surgery 509 509 677 677 805 805 296 296 2.3% 2.3%
Prolonged Ventilation 0 0 0 0 0.2 0.2 0.0% 0.0%
Thoracic Surgery 1 1 9 9 18 18 17 17 15.6% 15.6%
Upper GIT Surgery 302 302 437 437 590 590 288 288 3.4% 3.4%
Urology 673 673 1,158 1,158 1,694 1,694 1,021 1,021 4.7% 4.7%
Vascular Surgery 108 108 183 183 271 271 163 163 4.7% 4.7%
SD Total 12,713 12,713 18,074 18,074 24,281 24,281 11,568 11,568 3.3% 3.3%
Grand Total 23,489 49,794 32,539 67,106 42,767 85,505 19,278 35,711 3.0% 2.7%
Source: Inpatient Projections (Base Year 2016/17) as supplied by Health Service Research, Analysis and Modelling Unit, System Planning Branch, Strategy, Policy and Planning Division (SPPD). Published by the State of Queensland (Queensland Health), 2018.
18
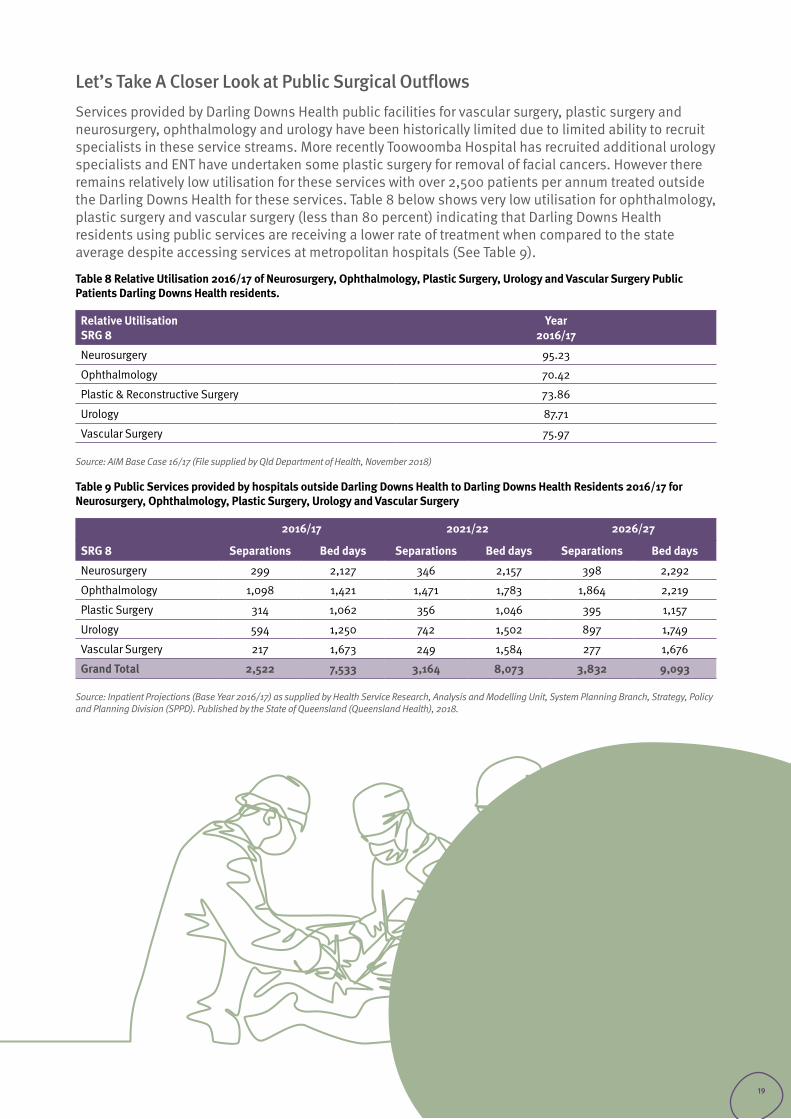
Let’s Take A Closer Look at Public Surgical OutflowsServices provided by Darling Downs Health public facilities for vascular surgery, plastic surgery and neurosurgery, ophthalmology and urology have been historically limited due to limited ability to recruit specialists in these service streams. More recently Toowoomba Hospital has recruited additional urology specialists and ENT have undertaken some plastic surgery for removal of facial cancers. However there remains relatively low utilisation for these services with over 2,500 patients per annum treated outside the Darling Downs Health for these services. Table 8 below shows very low utilisation for ophthalmology, plastic surgery and vascular surgery (less than 80 percent) indicating that Darling Downs Health residents using public services are receiving a lower rate of treatment when compared to the state average despite accessing services at metropolitan hospitals (See Table 9).
Table 8 Relative Utilisation 2016/17 of Neurosurgery, Ophthalmology, Plastic Surgery, Urology and Vascular Surgery Public Patients Darling Downs Health residents.
Relative UtilisationSRG 8
Year2016/17
Neurosurgery 95.23
Ophthalmology 70.42
Plastic & Reconstructive Surgery 73.86
Urology 87.71
Vascular Surgery 75.97
Source: AIM Base Case 16/17 (File supplied by Qld Department of Health, November 2018)
Table 9 Public Services provided by hospitals outside Darling Downs Health to Darling Downs Health Residents 2016/17 for Neurosurgery, Ophthalmology, Plastic Surgery, Urology and Vascular Surgery
2016/17 2021/22 2026/27
SRG 8 Separations Bed days Separations Bed days Separations Bed days
Neurosurgery 299 2,127 346 2,157 398 2,292
Ophthalmology 1,098 1,421 1,471 1,783 1,864 2,219
Plastic Surgery 314 1,062 356 1,046 395 1,157
Urology 594 1,250 742 1,502 897 1,749
Vascular Surgery 217 1,673 249 1,584 277 1,676
Grand Total 2,522 7,533 3,164 8,073 3,832 9,093
Source: Inpatient Projections (Base Year 2016/17) as supplied by Health Service Research, Analysis and Modelling Unit, System Planning Branch, Strategy, Policy and Planning Division (SPPD). Published by the State of Queensland (Queensland Health), 2018.
19
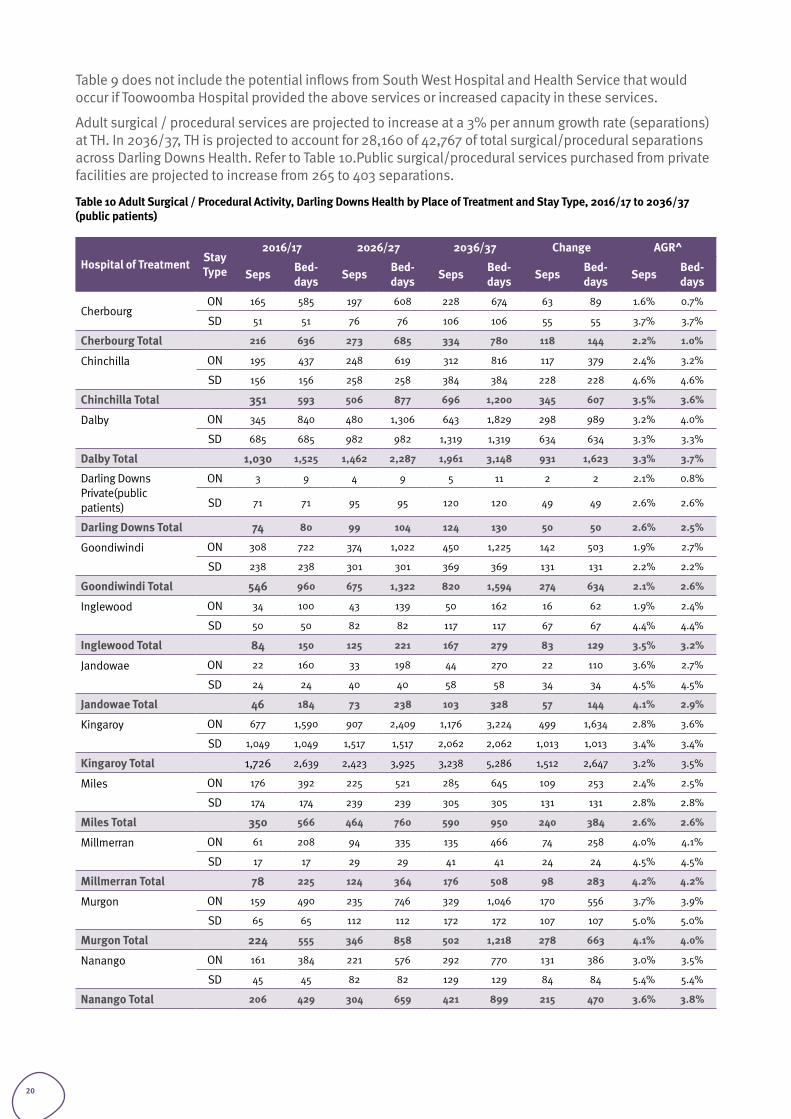
Table 9 does not include the potential inflows from South West Hospital and Health Service that would occur if Toowoomba Hospital provided the above services or increased capacity in these services.
Adult surgical / procedural services are projected to increase at a 3% per annum growth rate (separations) at TH. In 2036/37, TH is projected to account for 28,160 of 42,767 of total surgical/procedural separations across Darling Downs Health. Refer to Table 10.Public surgical/procedural services purchased from private facilities are projected to increase from 265 to 403 separations.
Table 10 Adult Surgical / Procedural Activity, Darling Downs Health by Place of Treatment and Stay Type, 2016/17 to 2036/37 (public patients)
Hospital of Treatment Stay Type
2016/17 2026/27 2036/37 Change AGR^
Seps Bed-days Seps Bed-
days Seps Bed-days Seps Bed-
days Seps Bed-days
CherbourgON 165 585 197 608 228 674 63 89 1.6% 0.7%
SD 51 51 76 76 106 106 55 55 3.7% 3.7%
Cherbourg Total 216 636 273 685 334 780 118 144 2.2% 1.0%
Chinchilla
ON 195 437 248 619 312 816 117 379 2.4% 3.2%
SD 156 156 258 258 384 384 228 228 4.6% 4.6%
Chinchilla Total 351 593 506 877 696 1,200 345 607 3.5% 3.6%
Dalby
ON 345 840 480 1,306 643 1,829 298 989 3.2% 4.0%
SD 685 685 982 982 1,319 1,319 634 634 3.3% 3.3%
Dalby Total 1,030 1,525 1,462 2,287 1,961 3,148 931 1,623 3.3% 3.7%
Darling Downs Private(public patients)
ON 3 9 4 9 5 11 2 2 2.1% 0.8%
SD 71 71 95 95 120 120 49 49 2.6% 2.6%
Darling Downs Total 74 80 99 104 124 130 50 50 2.6% 2.5%
Goondiwindi
ON 308 722 374 1,022 450 1,225 142 503 1.9% 2.7%
SD 238 238 301 301 369 369 131 131 2.2% 2.2%
Goondiwindi Total 546 960 675 1,322 820 1,594 274 634 2.1% 2.6%
Inglewood
ON 34 100 43 139 50 162 16 62 1.9% 2.4%
SD 50 50 82 82 117 117 67 67 4.4% 4.4%
Inglewood Total 84 150 125 221 167 279 83 129 3.5% 3.2%
Jandowae
ON 22 160 33 198 44 270 22 110 3.6% 2.7%
SD 24 24 40 40 58 58 34 34 4.5% 4.5%
Jandowae Total 46 184 73 238 103 328 57 144 4.1% 2.9%
Kingaroy
ON 677 1,590 907 2,409 1,176 3,224 499 1,634 2.8% 3.6%
SD 1,049 1,049 1,517 1,517 2,062 2,062 1,013 1,013 3.4% 3.4%
Kingaroy Total 1,726 2,639 2,423 3,925 3,238 5,286 1,512 2,647 3.2% 3.5%
Miles
ON 176 392 225 521 285 645 109 253 2.4% 2.5%
SD 174 174 239 239 305 305 131 131 2.8% 2.8%
Miles Total 350 566 464 760 590 950 240 384 2.6% 2.6%
Millmerran
ON 61 208 94 335 135 466 74 258 4.0% 4.1%
SD 17 17 29 29 41 41 24 24 4.5% 4.5%
Millmerran Total 78 225 124 364 176 508 98 283 4.2% 4.2%
Murgon
ON 159 490 235 746 329 1,046 170 556 3.7% 3.9%
SD 65 65 112 112 172 172 107 107 5.0% 5.0%
Murgon Total 224 555 346 858 502 1,218 278 663 4.1% 4.0%
Nanango
ON 161 384 221 576 292 770 131 386 3.0% 3.5%
SD 45 45 82 82 129 129 84 84 5.4% 5.4%
Nanango Total 206 429 304 659 421 899 215 470 3.6% 3.8%
20
Hospital of Treatment Stay Type
2016/17 2026/27 2036/37 Change AGR^
Seps Bed-days Seps Bed-
days Seps Bed-days Seps Bed-
days Seps Bed-days
Oakey
ON 48 272 79 467 125 735 77 463 4.9% 5.1%
SD 23 23 35 35 51 51 28 28 4.1% 4.1%
Oakey Total 71 295 113 502 176 787 105 492 4.7% 5.0%
St Andrew'sON 11 15 13 18 15 20 4 5 1.5% 1.5%
SD 180 180 226 226 265 265 85 85 1.9% 1.9%
St Andrew's Total 191 195 239 245 279 285 88 90 1.9% 1.9%
Stanthorpe Hospital
ON 350 946 478 1,406 656 2,032 306 1,086 3.2% 3.9%
SD 550 550 827 827 1,113 1,113 563 563 3.6% 3.6%
Stanthorpe Total 900 1,496 1,305 2,234 1,770 3,145 870 1,649 3.4% 3.8%
Tara Hospital
ON 98 255 123 337 143 364 45 109 1.9% 1.8%
SD 75 75 115 115 155 155 80 80 3.7% 3.7%
Tara Total 173 330 238 451 298 519 125 189 2.8% 2.3%
Taroom
ON 38 111 50 162 64 221 26 110 2.6% 3.5%
SD 20 20 27 27 34 34 14 14 2.7% 2.7%
Taroom Total 58 131 77 190 98 255 40 124 2.7% 3.4%
Texas
ON 66 351 85 349 108 414 42 63 2.5% 0.8%
SD 16 16 26 26 37 37 21 21 4.3% 4.3%
Texas Total 82 367 111 375 145 451 63 84 2.9% 1.0%
Toowoomba
ON 7,137 27,369 9,615 35,252 12,173 43,035 5,036 15,666 2.7% 2.3%
SD 8,412 8,412 11,887 11,887 15,988 15,988 7,576 7,576 3.3% 3.3%
Toowoomba Total 15,549 35,781 21,502 47,138 28,160 59,023 12,611 23,242 3.0% 2.5%
Warwick
ON 721 1,844 960 2,550 1,252 3,262 531 1,418 2.8% 2.9%
SD 812 812 1,118 1,118 1,455 1,455 643 643 3.0% 3.0%
Warwick Total 1,533 2,656 2,079 3,668 2,708 4,717 1,175 2,061 2.9% 2.9%
Wondai
ON 1 1 2 2 2 2 0.7 0.7 2.7% 2.7%
Wondai Total 1 1 2 2 2 2 0.7 0.71 0.03 0.03
Grand Total 23,489 49,794 32,539 67,106 42,767 85,505 19,278 35,711 3.0% 0.03
Source: AIM Base Case 16/17 (File supplied by Qld Department of Health, November 2018). Note: The tables include ICU/CCU bed days at TH (1,036 ICU (2016/17) and 42 CCU bed days in (2015/16 noting CCU beds not available at time of publishing for 2016/17 therefore AIM Base Case 2015/16 used as source).
21
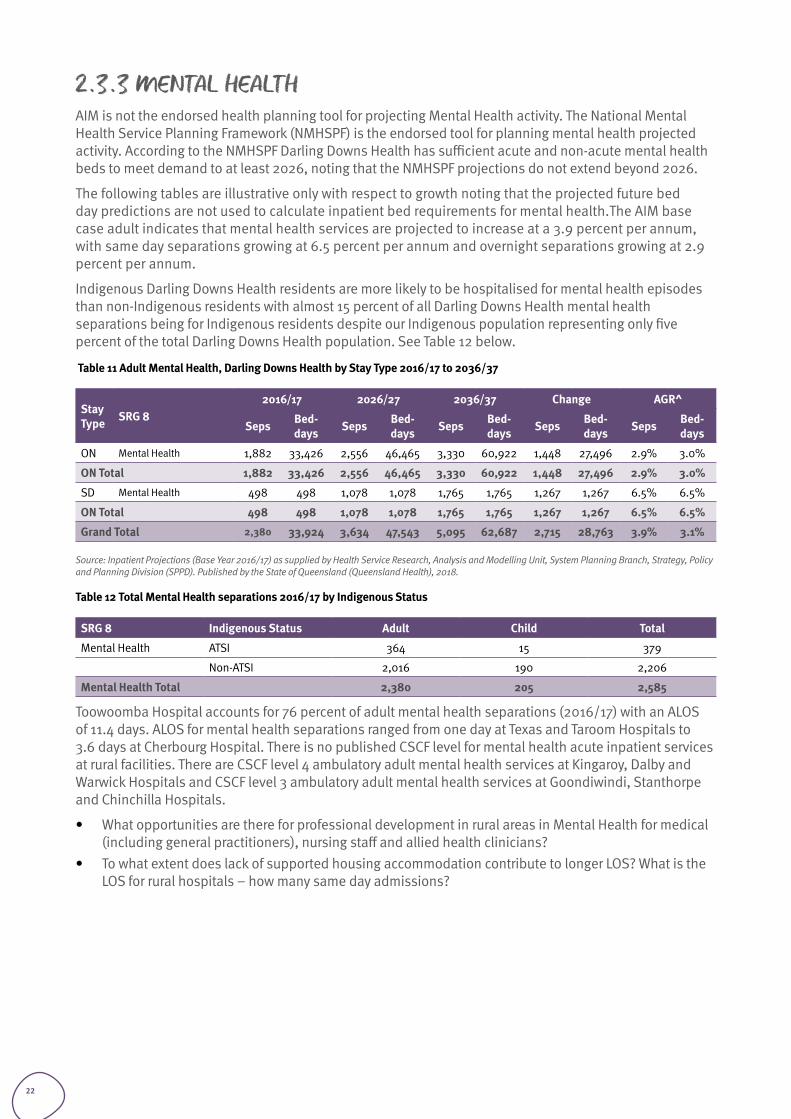
2.3.3 MENTAL HEALTHAIM is not the endorsed health planning tool for projecting Mental Health activity. The National Mental Health Service Planning Framework (NMHSPF) is the endorsed tool for planning mental health projected activity. According to the NMHSPF Darling Downs Health has sufficient acute and non-acute mental health beds to meet demand to at least 2026, noting that the NMHSPF projections do not extend beyond 2026.
The following tables are illustrative only with respect to growth noting that the projected future bed day predictions are not used to calculate inpatient bed requirements for mental health.The AIM base case adult indicates that mental health services are projected to increase at a 3.9 percent per annum, with same day separations growing at 6.5 percent per annum and overnight separations growing at 2.9 percent per annum.
Indigenous Darling Downs Health residents are more likely to be hospitalised for mental health episodes than non-Indigenous residents with almost 15 percent of all Darling Downs Health mental health separations being for Indigenous residents despite our Indigenous population representing only five percent of the total Darling Downs Health population. See Table 12 below.
Table 11 Adult Mental Health, Darling Downs Health by Stay Type 2016/17 to 2036/37
Stay Type SRG 8
2016/17 2026/27 2036/37 Change AGR^
Seps Bed-days Seps Bed-
days Seps Bed-days Seps Bed-
days Seps Bed-days
ON Mental Health 1,882 33,426 2,556 46,465 3,330 60,922 1,448 27,496 2.9% 3.0%
ON Total 1,882 33,426 2,556 46,465 3,330 60,922 1,448 27,496 2.9% 3.0%
SD Mental Health 498 498 1,078 1,078 1,765 1,765 1,267 1,267 6.5% 6.5%
ON Total 498 498 1,078 1,078 1,765 1,765 1,267 1,267 6.5% 6.5%
Grand Total 2,380 33,924 3,634 47,543 5,095 62,687 2,715 28,763 3.9% 3.1%
Source: Inpatient Projections (Base Year 2016/17) as supplied by Health Service Research, Analysis and Modelling Unit, System Planning Branch, Strategy, Policy and Planning Division (SPPD). Published by the State of Queensland (Queensland Health), 2018.
Table 12 Total Mental Health separations 2016/17 by Indigenous Status
SRG 8 Indigenous Status Adult Child Total
Mental Health ATSI 364 15 379
Non-ATSI 2,016 190 2,206
Mental Health Total 2,380 205 2,585
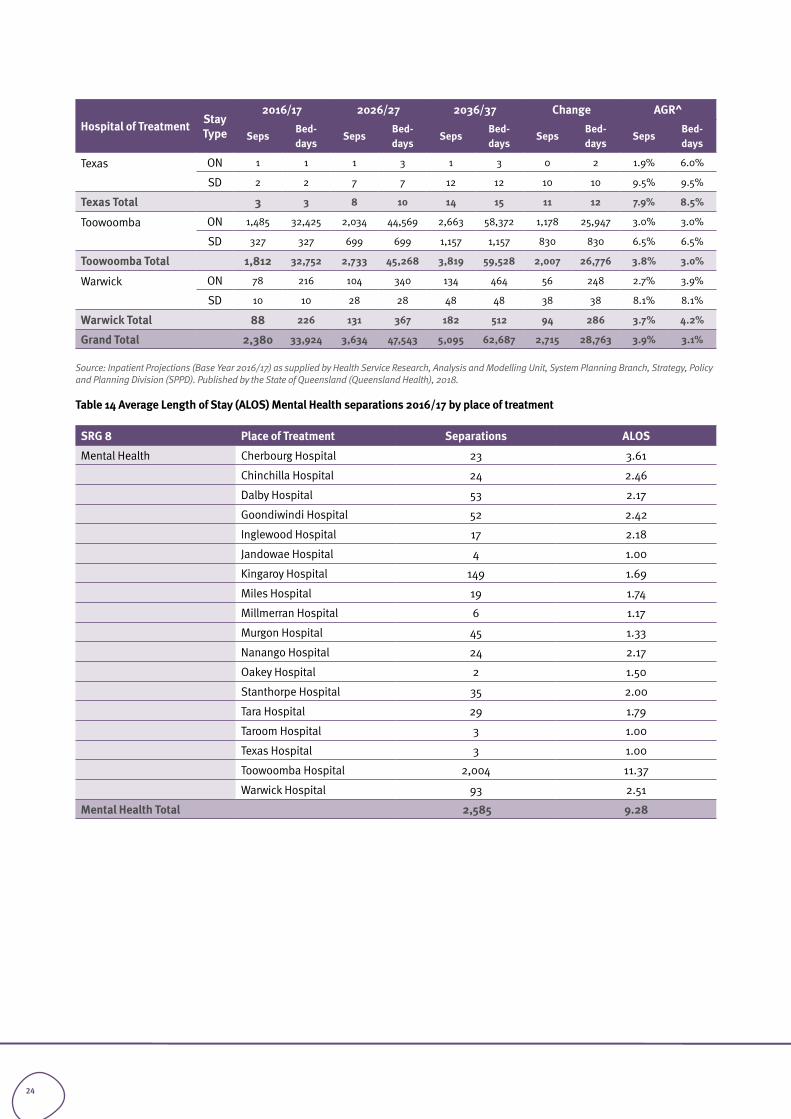
Toowoomba Hospital accounts for 76 percent of adult mental health separations (2016/17) with an ALOS of 11.4 days. ALOS for mental health separations ranged from one day at Texas and Taroom Hospitals to 3.6 days at Cherbourg Hospital. There is no published CSCF level for mental health acute inpatient services at rural facilities. There are CSCF level 4 ambulatory adult mental health services at Kingaroy, Dalby and Warwick Hospitals and CSCF level 3 ambulatory adult mental health services at Goondiwindi, Stanthorpe and Chinchilla Hospitals.
• What opportunities are there for professional development in rural areas in Mental Health for medical (including general practitioners), nursing staff and allied health clinicians?
• To what extent does lack of supported housing accommodation contribute to longer LOS? What is the LOS for rural hospitals – how many same day admissions?
22
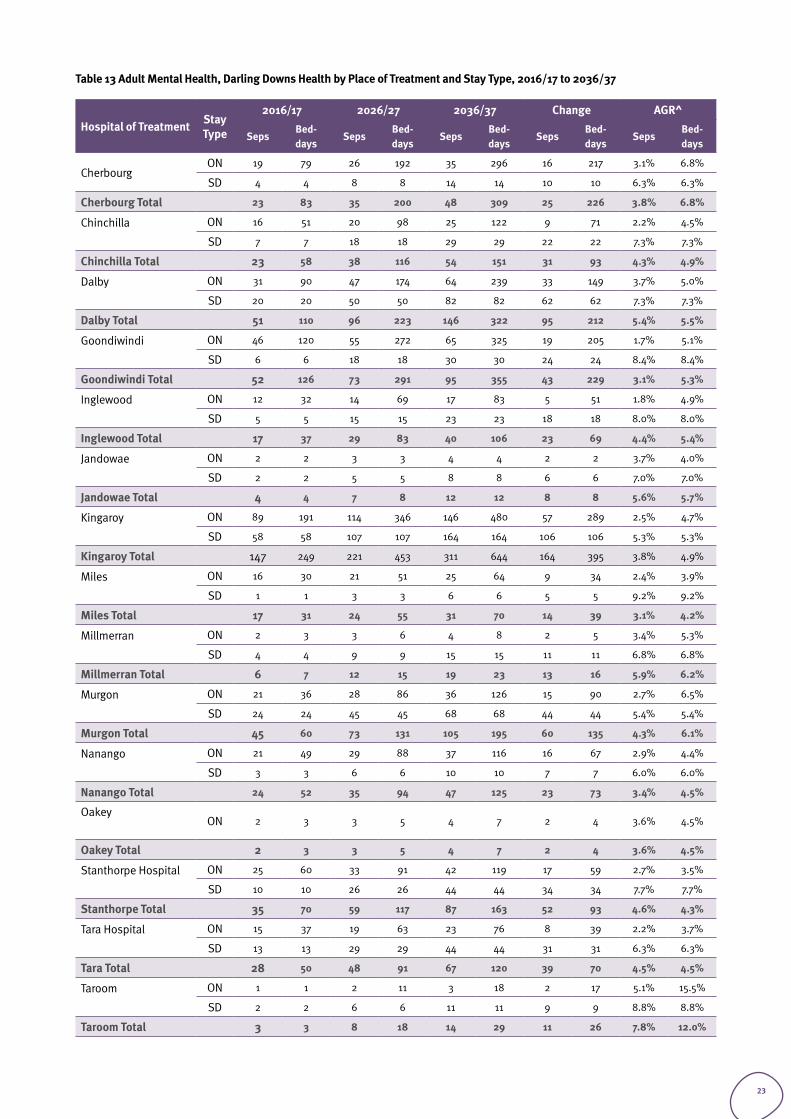
Table 13 Adult Mental Health, Darling Downs Health by Place of Treatment and Stay Type, 2016/17 to 2036/37
Hospital of Treatment Stay Type
2016/17 2026/27 2036/37 Change AGR^
SepsBed-days
SepsBed-days
SepsBed-days
SepsBed-days
SepsBed-days
CherbourgON 19 79 26 192 35 296 16 217 3.1% 6.8%
SD 4 4 8 8 14 14 10 10 6.3% 6.3%
Cherbourg Total 23 83 35 200 48 309 25 226 3.8% 6.8%
Chinchilla
ON 16 51 20 98 25 122 9 71 2.2% 4.5%
SD 7 7 18 18 29 29 22 22 7.3% 7.3%
Chinchilla Total 23 58 38 116 54 151 31 93 4.3% 4.9%
Dalby
ON 31 90 47 174 64 239 33 149 3.7% 5.0%
SD 20 20 50 50 82 82 62 62 7.3% 7.3%
Dalby Total 51 110 96 223 146 322 95 212 5.4% 5.5%
Goondiwindi
ON 46 120 55 272 65 325 19 205 1.7% 5.1%
SD 6 6 18 18 30 30 24 24 8.4% 8.4%
Goondiwindi Total 52 126 73 291 95 355 43 229 3.1% 5.3%
Inglewood
ON 12 32 14 69 17 83 5 51 1.8% 4.9%
SD 5 5 15 15 23 23 18 18 8.0% 8.0%
Inglewood Total 17 37 29 83 40 106 23 69 4.4% 5.4%
Jandowae
ON 2 2 3 3 4 4 2 2 3.7% 4.0%
SD 2 2 5 5 8 8 6 6 7.0% 7.0%
Jandowae Total 4 4 7 8 12 12 8 8 5.6% 5.7%
Kingaroy
ON 89 191 114 346 146 480 57 289 2.5% 4.7%
SD 58 58 107 107 164 164 106 106 5.3% 5.3%
Kingaroy Total 147 249 221 453 311 644 164 395 3.8% 4.9%
Miles
ON 16 30 21 51 25 64 9 34 2.4% 3.9%
SD 1 1 3 3 6 6 5 5 9.2% 9.2%
Miles Total 17 31 24 55 31 70 14 39 3.1% 4.2%
Millmerran
ON 2 3 3 6 4 8 2 5 3.4% 5.3%
SD 4 4 9 9 15 15 11 11 6.8% 6.8%
Millmerran Total 6 7 12 15 19 23 13 16 5.9% 6.2%
Murgon
ON 21 36 28 86 36 126 15 90 2.7% 6.5%
SD 24 24 45 45 68 68 44 44 5.4% 5.4%
Murgon Total 45 60 73 131 105 195 60 135 4.3% 6.1%
Nanango
ON 21 49 29 88 37 116 16 67 2.9% 4.4%
SD 3 3 6 6 10 10 7 7 6.0% 6.0%
Nanango Total 24 52 35 94 47 125 23 73 3.4% 4.5%
Oakey
ON 2 3 3 5 4 7 2 4 3.6% 4.5%
Oakey Total 2 3 3 5 4 7 2 4 3.6% 4.5%
Stanthorpe Hospital
ON 25 60 33 91 42 119 17 59 2.7% 3.5%
SD 10 10 26 26 44 44 34 34 7.7% 7.7%
Stanthorpe Total 35 70 59 117 87 163 52 93 4.6% 4.3%
Tara Hospital
ON 15 37 19 63 23 76 8 39 2.2% 3.7%
SD 13 13 29 29 44 44 31 31 6.3% 6.3%
Tara Total 28 50 48 91 67 120 39 70 4.5% 4.5%
Taroom
ON 1 1 2 11 3 18 2 17 5.1% 15.5%
SD 2 2 6 6 11 11 9 9 8.8% 8.8%
Taroom Total 3 3 8 18 14 29 11 26 7.8% 12.0%
23
Hospital of Treatment Stay Type
2016/17 2026/27 2036/37 Change AGR^
SepsBed-days
SepsBed-days
SepsBed-days
SepsBed-days
SepsBed-days
Texas
ON 1 1 1 3 1 3 0 2 1.9% 6.0%
SD 2 2 7 7 12 12 10 10 9.5% 9.5%
Texas Total 3 3 8 10 14 15 11 12 7.9% 8.5%
Toowoomba
ON 1,485 32,425 2,034 44,569 2,663 58,372 1,178 25,947 3.0% 3.0%
SD 327 327 699 699 1,157 1,157 830 830 6.5% 6.5%
Toowoomba Total 1,812 32,752 2,733 45,268 3,819 59,528 2,007 26,776 3.8% 3.0%
Warwick
ON 78 216 104 340 134 464 56 248 2.7% 3.9%
SD 10 10 28 28 48 48 38 38 8.1% 8.1%
Warwick Total 88 226 131 367 182 512 94 286 3.7% 4.2%
Grand Total 2,380 33,924 3,634 47,543 5,095 62,687 2,715 28,763 3.9% 3.1%
Source: Inpatient Projections (Base Year 2016/17) as supplied by Health Service Research, Analysis and Modelling Unit, System Planning Branch, Strategy, Policy and Planning Division (SPPD). Published by the State of Queensland (Queensland Health), 2018.
Table 14 Average Length of Stay (ALOS) Mental Health separations 2016/17 by place of treatment
SRG 8 Place of Treatment Separations ALOS
Mental Health Cherbourg Hospital 23 3.61
Chinchilla Hospital 24 2.46
Dalby Hospital 53 2.17
Goondiwindi Hospital 52 2.42
Inglewood Hospital 17 2.18
Jandowae Hospital 4 1.00
Kingaroy Hospital 149 1.69
Miles Hospital 19 1.74
Millmerran Hospital 6 1.17
Murgon Hospital 45 1.33
Nanango Hospital 24 2.17
Oakey Hospital 2 1.50
Stanthorpe Hospital 35 2.00
Tara Hospital 29 1.79
Taroom Hospital 3 1.00
Texas Hospital 3 1.00
Toowoomba Hospital 2,004 11.37
Warwick Hospital 93 2.51
Mental Health Total 2,585 9.28
24
2.3.4 OBSTETRICS AND GYNAECOLOGYAdult obstetrics and gynaecology services are projected to increase from 8,721 separations in 2016/17 to 10,008 in 2036/37; a growth rate of 0.7 percent per year. Vaginal and caesarean deliveries are projected to increase from 2,899 in 2016/17 to 3,481 by 2036/37 in Darling Downs Health. This represents an annual growth rate of 0.9 percent per annum.
There were 3,925 antenatal separations in 2016/17, 880 more separations than actual births for that year.
Table 15 Obstetrics and Gynaecology Activity, DDH by Stay Type and SRG/ESRG, 2016/17 to 2036/37
Stay Type SRG 8
2016/17 2026/27 2036/37 Change AGR^
Seps Bed-days Seps Bed-
days Seps Bed-days Seps Bed-
days Seps Bed-days
ON Gynaecology 627 1,370 749 1,454 839 1,513 212 143 1.5% 0.5%
Ante-natal Admission 858 1,390 973 1,456 857 1,184 - 1.0 -206 -0.01% -0.8%
Caesarean Delivery 831 3,140 1,014 3,721 1,093 3,954 262 814 1.4% 1.2%
Post-Natal Admission 137 278 148 273 157 267 20 -11 0.7% -0.2%
Vaginal Delivery 1,916 4,553 2,425 5,453 2,128 4,617 212 64 0.5% 0.1%
ON Total 4,369 10,731 5,309 12,357 5,073 11,535 704 804 0.7% 0.4%
SD Gynaecology 1,085 1,085 1,280 1,280 1,374 1,374 289 289 1.2% 1.2%
Ante-natal Admission 3,067 3,067 2,975 2,975 3,208 3,208 141 141 0.2% 0.2%
Caesarean Delivery 2 2 2 2 1 1 - 0.8 - 0.8 -2.4% -2.4%
Post-Natal Admission 48 48 65 65 92 92 44 44 3.3% 3.3%
Vaginal Delivery 150 150 204 204 259 259 109 109 2.8% 2.8%
SD Total 4,352 4,352 4,526 4,526 4,935 4,935 583 583 0.6% 0.6%
Grand Total 8,721 15,083 9,835 16,883 10,008 16,470 1,287 1,387 0.7% 0.4%
Source: Inpatient Projections (Base Year 2016/17) as supplied by Health Service Research, Analysis and Modelling Unit, System Planning Branch, Strategy, Policy and Planning Division (SPPD). Published by the State of Queensland (Queensland Health), 2018.
25
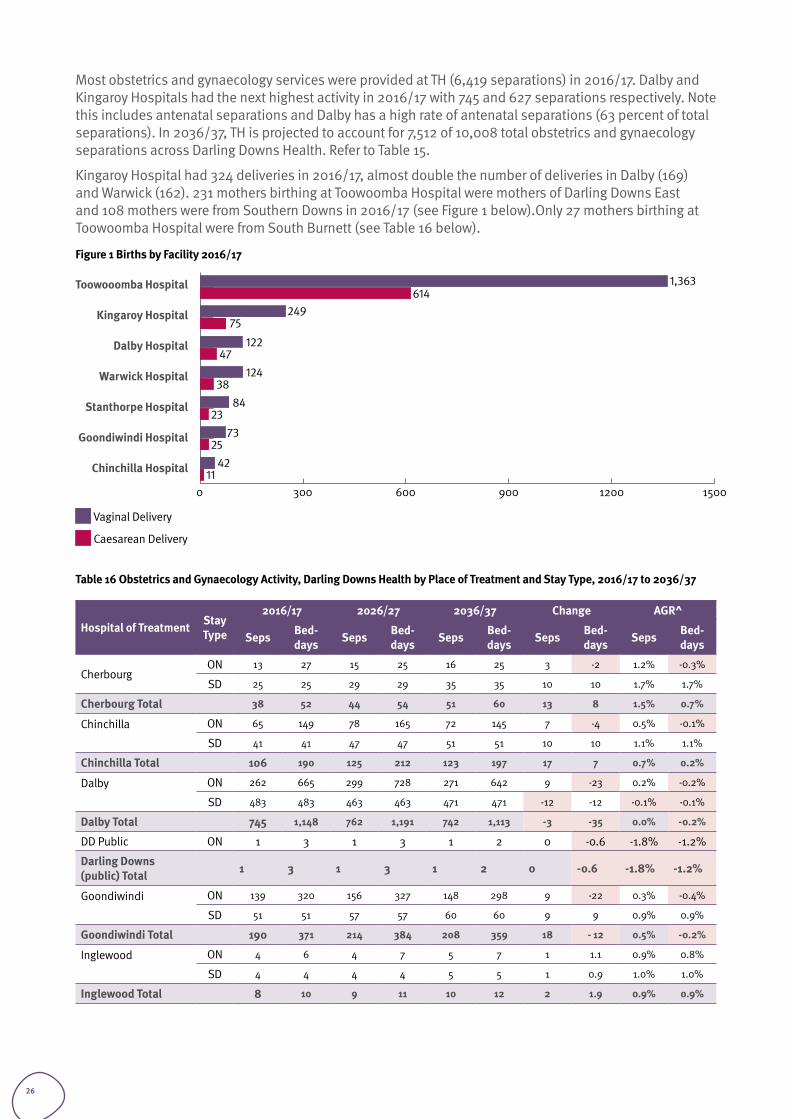
Most obstetrics and gynaecology services were provided at TH (6,419 separations) in 2016/17. Dalby and Kingaroy Hospitals had the next highest activity in 2016/17 with 745 and 627 separations respectively. Note this includes antenatal separations and Dalby has a high rate of antenatal separations (63 percent of total separations). In 2036/37, TH is projected to account for 7,512 of 10,008 total obstetrics and gynaecology separations across Darling Downs Health. Refer to Table 15.
Kingaroy Hospital had 324 deliveries in 2016/17, almost double the number of deliveries in Dalby (169) and Warwick (162). 231 mothers birthing at Toowoomba Hospital were mothers of Darling Downs East and 108 mothers were from Southern Downs in 2016/17 (see Figure 1 below).Only 27 mothers birthing at Toowoomba Hospital were from South Burnett (see Table 16 below).
Figure 1 Births by Facility 2016/17
Toowooomba Hospital
Kingaroy Hospital
Dalby Hospital
Warwick Hospital
Stanthorpe Hospital
Goondiwindi Hospital
Chinchilla Hospital
Vaginal Delivery
Caesarean Delivery
Table 16 Obstetrics and Gynaecology Activity, Darling Downs Health by Place of Treatment and Stay Type, 2016/17 to 2036/37
Hospital of Treatment Stay Type
2016/17 2026/27 2036/37 Change AGR^
Seps Bed-days Seps Bed-
days Seps Bed-days Seps Bed-
days Seps Bed-days
CherbourgON 13 27 15 25 16 25 3 -2 1.2% -0.3%
SD 25 25 29 29 35 35 10 10 1.7% 1.7%
Cherbourg Total 38 52 44 54 51 60 13 8 1.5% 0.7%
Chinchilla
ON 65 149 78 165 72 145 7 -4 0.5% -0.1%
SD 41 41 47 47 51 51 10 10 1.1% 1.1%
Chinchilla Total 106 190 125 212 123 197 17 7 0.7% 0.2%
Dalby
ON 262 665 299 728 271 642 9 -23 0.2% -0.2%
SD 483 483 463 463 471 471 -12 -12 -0.1% -0.1%
Dalby Total 745 1,148 762 1,191 742 1,113 -3 -35 0.0% -0.2%
DD Public ON 1 3 1 3 1 2 0 -0.6 -1.8% -1.2%
Darling Downs (public) Total 1 3 1 3 1 2 0 -0.6 -1.8% -1.2%
Goondiwindi
ON 139 320 156 327 148 298 9 -22 0.3% -0.4%
SD 51 51 57 57 60 60 9 9 0.9% 0.9%
Goondiwindi Total 190 371 214 384 208 359 18 - 12 0.5% -0.2%
Inglewood
ON 4 6 4 7 5 7 1 1.1 0.9% 0.8%
SD 4 4 4 4 5 5 1 0.9 1.0% 1.0%
Inglewood Total 8 10 9 11 10 12 2 1.9 0.9% 0.9%
1,363614
24975
12247
12438
8423
7325
4211
26
Hospital of Treatment Stay Type
2016/17 2026/27 2036/37 Change AGR^
Seps Bed-days Seps Bed-
days Seps Bed-days Seps Bed-
days Seps Bed-days
Jandowae
ON 4 8 5 7 5 7 1 -0.9 1.1% -0.6%
SD 1 1 1 1 1 1 0 0.4 1.5% 1.5%
Jandowae Total 5 9 6 8 6 8 1 -0.6 1.2% -0.3%
Kingaroy
ON 442 1,012 548 1,189 506 1,073 64 61 0.7% 0.3%
SD 185 185 208 208 224 224 39 39 1.0% 1.0%
Kingaroy Total 627 1,197 756 1,397 730 1,297 103 100 0.8% 0.4%
Miles
ON 4 5 5 5 5 5 1 0.4 1.1% 0.3%
SD 4 4 5 5 7 7 3 3 2.7% 2.7%
Miles Total 8 9 10 11 12 12 4 3 1.9% 1.5%
Millmerran
ON 4 5 4 5 4 5 0 0.1 0.3% 0.1%
SD 1 1 1 1 1 1 0 -0.1 -0.5% -0.5%
Millmerran Total 5 6 5 6 5 6 0 0.0 0.1% 0.0%
Murgon
ON 3 4 4 5 5 6 2 2 2.3% 1.7%
SD 6 6 8 8 10 10 4 4 2.7% 2.7%
Murgon Total 9 10 12 13 15 16 6 6 2.6% 2.3%
Nanango
ON 5 7 5 6 5 6 0 -1.2 0.1% -1.0%
SD 1 1 1 1 1 1 0 0.2 0.8% 0.8%
Nanango Total 6 8 6 7 6 7 0 -1.1 0.3% -0.7%
Stanthorpe Hospital
ON 159 398 173 407 165 372 6 -26 0.2% -0.3%
SD 61 61 69 69 74 74 13 13 1.0% 1.0%
Stanthorpe Total 220 459 242 475 239 445 19 -14 0.4% -0.1%
Tara Hospital
ON 8 10 9 11 10 11 2 1.1 1.1% 0.5%
SD 17 17 18 18 20 20 3 3 0.8% 0.8%
Tara Total 25 27 27 29 30 31 5 4 0.9% 0.7%
Taroom
ON 1 2 1 3 1 2 0 0.0 0.4% 0.1%
SD 1 1 1 1 1 1 0 0.1 0.4% 0.4%
Taroom Total 2 3 2 4 2 3 0 0.1 0.4% 0.2%
Texas
ON 2 2 2 2 2 2 0 0.1 0.2% 0.2%
SD 2 2 3 3 3 3 1 1.4 2.7% 2.7%
Texas Total 4 4 5 5 6 6 2 2 1.6% 1.6%
Toowoomba
ON 3,019 7,573 3,737 8,913 3,612 8,438 593 865 0.9% 0.5%
SD 3,400 3,400 3,541 3,541 3,899 3,899 499 499 0.7% 0.7%
Toowoomba Total 6,419 10,973 7,278 12,454 7,512 12,337 1,093 1,364 0.8% 0.6%
Warwick
ON 234 535 262 550 240 487 6 -48 0.1% -0.5%
SD 69 69 70 70 70 70 1 1.3 0.1% 0.1%
Warwick Total 303 604 332 620 310 557 7 -47 0.1% -0.4%
Grand Total 8,721 15,083 9,835 16,883 10,008 16,470 1,287 1,387 0.7% 0.4%
Source: Inpatient Projections (Base Year 2016/17) as supplied by Health Service Research, Analysis and Modelling Unit, System Planning Branch, Strategy, Policy and Planning Division (SPPD). Published by the State of Queensland (Queensland Health), 2018.
27
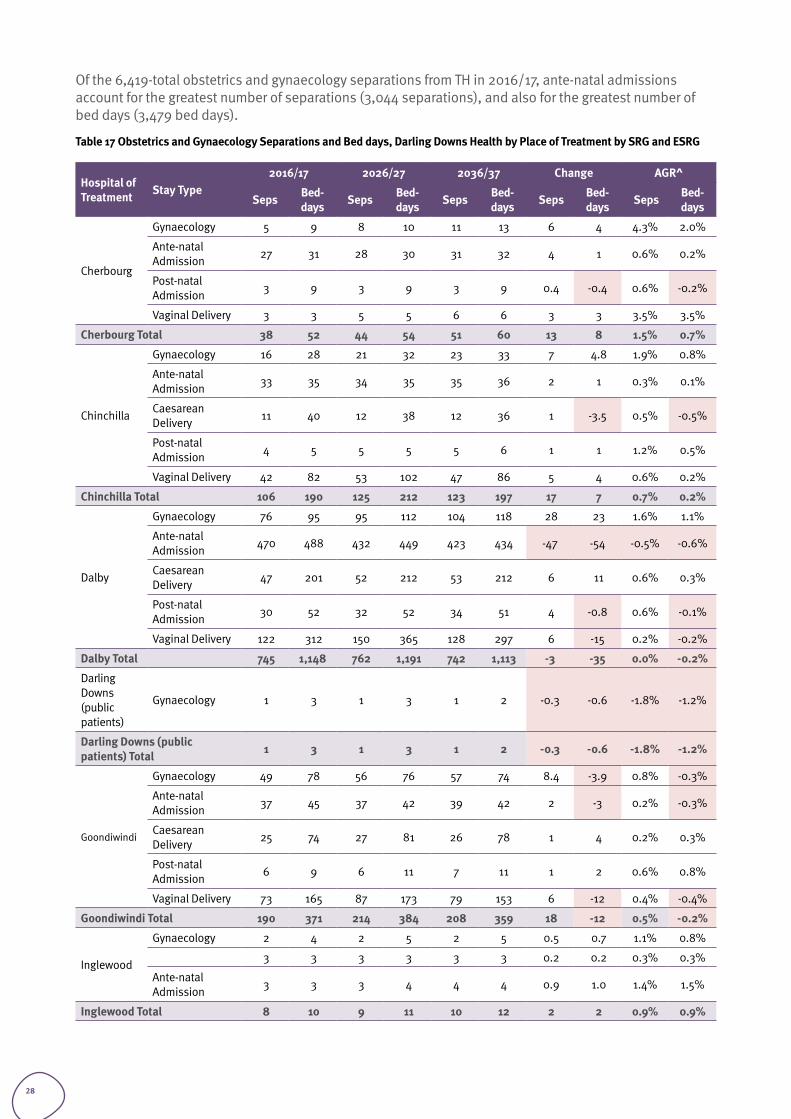
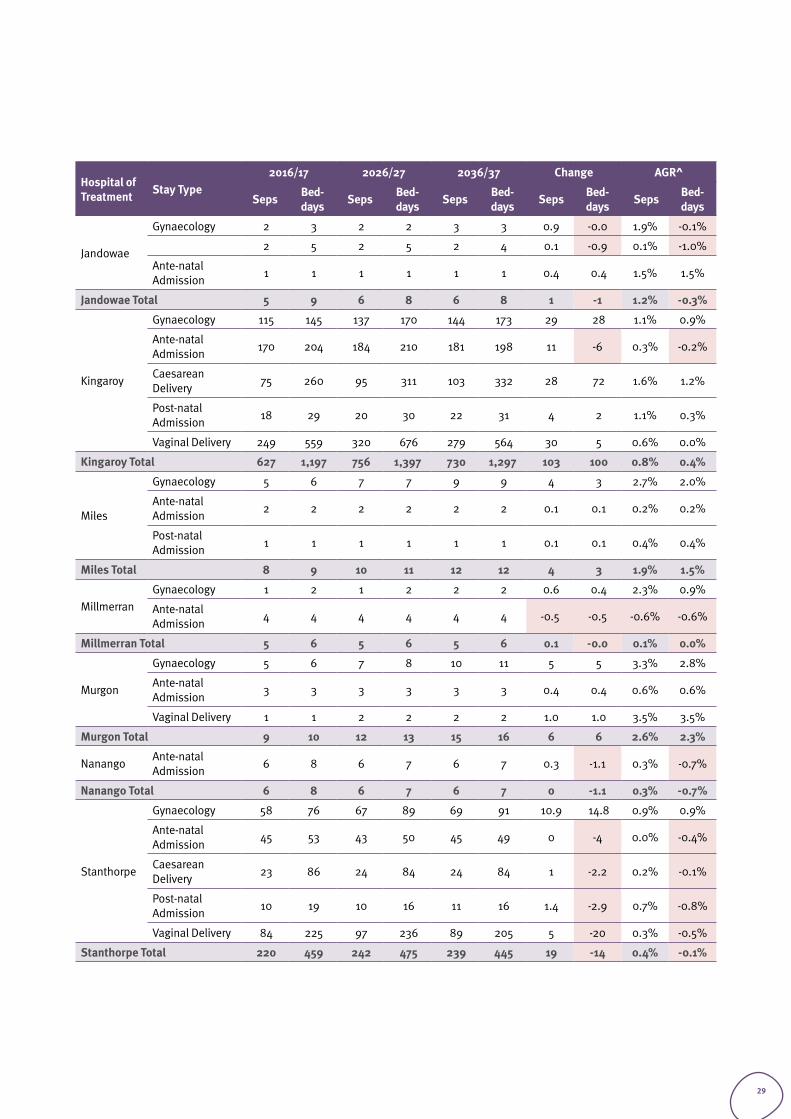
Of the 6,419-total obstetrics and gynaecology separations from TH in 2016/17, ante-natal admissions account for the greatest number of separations (3,044 separations), and also for the greatest number of bed days (3,479 bed days).
Table 17 Obstetrics and Gynaecology Separations and Bed days, Darling Downs Health by Place of Treatment by SRG and ESRG
Hospital of Treatment Stay Type
2016/17 2026/27 2036/37 Change AGR^
Seps Bed-days Seps Bed-
days Seps Bed-days Seps Bed-
days Seps Bed-days
Cherbourg
Gynaecology 5 9 8 10 11 13 6 4 4.3% 2.0%
Ante-natal Admission 27 31 28 30 31 32 4 1 0.6% 0.2%
Post-natal Admission 3 9 3 9 3 9 0.4 -0.4 0.6% -0.2%
Vaginal Delivery 3 3 5 5 6 6 3 3 3.5% 3.5%
Cherbourg Total 38 52 44 54 51 60 13 8 1.5% 0.7%
Chinchilla
Gynaecology 16 28 21 32 23 33 7 4.8 1.9% 0.8%
Ante-natal Admission 33 35 34 35 35 36 2 1 0.3% 0.1%
Caesarean Delivery 11 40 12 38 12 36 1 -3.5 0.5% -0.5%
Post-natal Admission 4 5 5 5 5 6 1 1 1.2% 0.5%
Vaginal Delivery 42 82 53 102 47 86 5 4 0.6% 0.2%
Chinchilla Total 106 190 125 212 123 197 17 7 0.7% 0.2%
Dalby
Gynaecology 76 95 95 112 104 118 28 23 1.6% 1.1%
Ante-natal Admission 470 488 432 449 423 434 -47 -54 -0.5% -0.6%
Caesarean Delivery 47 201 52 212 53 212 6 11 0.6% 0.3%
Post-natal Admission 30 52 32 52 34 51 4 -0.8 0.6% -0.1%
Vaginal Delivery 122 312 150 365 128 297 6 -15 0.2% -0.2%
Dalby Total 745 1,148 762 1,191 742 1,113 -3 -35 0.0% -0.2%
Darling Downs (public patients)
Gynaecology 1 3 1 3 1 2 -0.3 -0.6 -1.8% -1.2%
Darling Downs (public patients) Total 1 3 1 3 1 2 -0.3 -0.6 -1.8% -1.2%
Goondiwindi
Gynaecology 49 78 56 76 57 74 8.4 -3.9 0.8% -0.3%
Ante-natal Admission 37 45 37 42 39 42 2 -3 0.2% -0.3%
Caesarean Delivery 25 74 27 81 26 78 1 4 0.2% 0.3%
Post-natal Admission 6 9 6 11 7 11 1 2 0.6% 0.8%
Vaginal Delivery 73 165 87 173 79 153 6 -12 0.4% -0.4%
Goondiwindi Total 190 371 214 384 208 359 18 -12 0.5% -0.2%
Inglewood
Gynaecology 2 4 2 5 2 5 0.5 0.7 1.1% 0.8%
3 3 3 3 3 3 0.2 0.2 0.3% 0.3%
Ante-natal Admission 3 3 3 4 4 4 0.9 1.0 1.4% 1.5%
Inglewood Total 8 10 9 11 10 12 2 2 0.9% 0.9%
28
Hospital of Treatment Stay Type
2016/17 2026/27 2036/37 Change AGR^
Seps Bed-days Seps Bed-
days Seps Bed-days Seps Bed-
days Seps Bed-days
Jandowae
Gynaecology 2 3 2 2 3 3 0.9 -0.0 1.9% -0.1%
2 5 2 5 2 4 0.1 -0.9 0.1% -1.0%
Ante-natal Admission 1 1 1 1 1 1 0.4 0.4 1.5% 1.5%
Jandowae Total 5 9 6 8 6 8 1 -1 1.2% -0.3%
Kingaroy
Gynaecology 115 145 137 170 144 173 29 28 1.1% 0.9%
Ante-natal Admission 170 204 184 210 181 198 11 -6 0.3% -0.2%
Caesarean Delivery 75 260 95 311 103 332 28 72 1.6% 1.2%
Post-natal Admission 18 29 20 30 22 31 4 2 1.1% 0.3%
Vaginal Delivery 249 559 320 676 279 564 30 5 0.6% 0.0%
Kingaroy Total 627 1,197 756 1,397 730 1,297 103 100 0.8% 0.4%
Miles
Gynaecology 5 6 7 7 9 9 4 3 2.7% 2.0%
Ante-natal Admission 2 2 2 2 2 2 0.1 0.1 0.2% 0.2%
Post-natal Admission 1 1 1 1 1 1 0.1 0.1 0.4% 0.4%
Miles Total 8 9 10 11 12 12 4 3 1.9% 1.5%
MillmerranGynaecology 1 2 1 2 2 2 0.6 0.4 2.3% 0.9%
Ante-natal Admission 4 4 4 4 4 4 -0.5 -0.5 -0.6% -0.6%
Millmerran Total 5 6 5 6 5 6 0.1 -0.0 0.1% 0.0%
Murgon
Gynaecology 5 6 7 8 10 11 5 5 3.3% 2.8%
Ante-natal Admission 3 3 3 3 3 3 0.4 0.4 0.6% 0.6%
Vaginal Delivery 1 1 2 2 2 2 1.0 1.0 3.5% 3.5%
Murgon Total 9 10 12 13 15 16 6 6 2.6% 2.3%
Nanango Ante-natal Admission 6 8 6 7 6 7 0.3 -1.1 0.3% -0.7%
Nanango Total 6 8 6 7 6 7 0 -1.1 0.3% -0.7%
Stanthorpe
Gynaecology 58 76 67 89 69 91 10.9 14.8 0.9% 0.9%
Ante-natal Admission 45 53 43 50 45 49 0 -4 0.0% -0.4%
Caesarean Delivery 23 86 24 84 24 84 1 -2.2 0.2% -0.1%
Post-natal Admission 10 19 10 16 11 16 1.4 -2.9 0.7% -0.8%
Vaginal Delivery 84 225 97 236 89 205 5 -20 0.3% -0.5%
Stanthorpe Total 220 459 242 475 239 445 19 -14 0.4% -0.1%
29
Hospital of Treatment Stay Type
2016/17 2026/27 2036/37 Change AGR^
Seps Bed-days Seps Bed-
days Seps Bed-days Seps Bed-
days Seps Bed-days
Tara
Gynaecology 4 4 5 5 6 6 2 2 1.9% 1.9%
Ante-natal Admission 17 19 18 19 19 20 2 1.3 0.6% 0.3%
Post-natal Admission 1 1 1 1 1 1 0 0 0.4% 0.4%
Vaginal Delivery 3 3 4 4 4 4 0.9 0.9 1.4% 1.4%
Tara Total 25 27 27 29 30 31 5 4 0.9% 0.7%
TaroomAnte-natal Admission 1 1 1 1 1 1 0.1 0.1 0.4% 0.4%
Vaginal Delivery 1 2 1 3 1 2 0.1 0.0 0.4% 0.1%
Taroom Total 2 3 2 4 2 3 0.2 0.1 0.4% 0.2%
TexasAnte-natal Admission 3 3 3 3 3 3 0.1 0.1 0.1% 0.1%
Vaginal Delivery 1 1 2 2 2 2 1.4 1.4 4.5% 4.5%
Texas Total 4 4 5 5 6 6 2 2 1.6% 1.6%
Toowoomba
Gynaecology 1,300 1,903 1,539 2,114 1,691 2,250 391 347 1.3% 0.8%
Ante-natal Admission 3,044 3,479 3,092 3,496 3,214 3,489 170 10 0.3% 0.0%
Caesarean Delivery 614 2,339 763 2,851 833 3,067 219 728 1.5% 1.4%
Post-natal Admission 98 177 119 191 147 212 49 35 2.0% 0.9%
Vaginal Delivery 1,363 3,075 1,765 3,802 1,626 3,320 263 245 0.9% 0.4%
Toowoomba Total 6,419 10,973 7,278 12,454 7,512 12,337 1,093 1,364 0.8% 0.6%
Warwick
Gynaecology 73 93 79 99 80 98 7.4 4.8 0.5% 0.3%
Ante-natal Admission 58 74 56 71 54 64 -4 -10 -0.4% -0.7%
Caesarean Delivery 38 142 42 145 43 145 5 3 0.6% 0.1%
Post-natal Admission 10 20 10 17 11 16 1.2 -4 0.6% -1.0%
Vaginal Delivery 124 275 145 289 122 234 -2.2 -41 -0.1% -0.8%
Warwick Total 303 604 332 620 310 557 7 -47 0.1% -0.4%
Grand Total 8,721 15,083 9,835 16,883 10,008 16,470 1,287 1,387 0.7% 0.4%
Source: AIM Base Case 16/17 (File supplied by Qld Department of Health, November 2018)
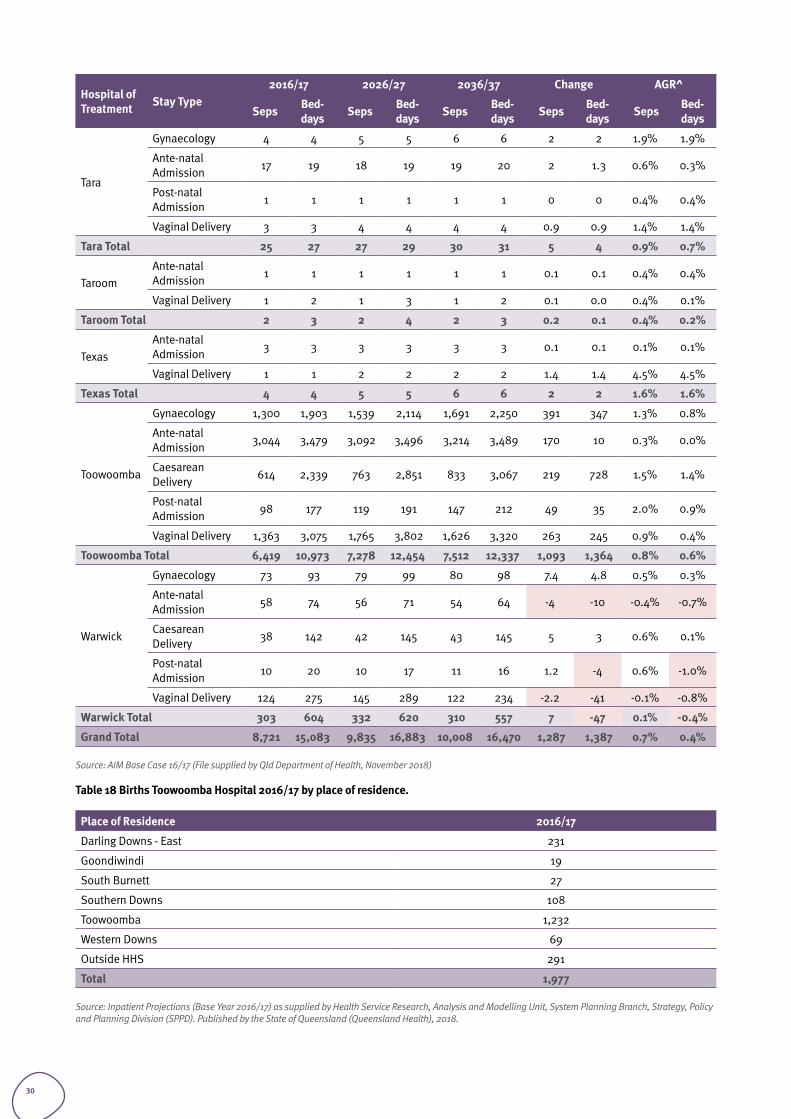
Table 18 Births Toowoomba Hospital 2016/17 by place of residence.
Place of Residence 2016/17
Darling Downs - East 231
Goondiwindi 19
South Burnett 27
Southern Downs 108
Toowoomba 1,232
Western Downs 69
Outside HHS 291
Total 1,977
Source: Inpatient Projections (Base Year 2016/17) as supplied by Health Service Research, Analysis and Modelling Unit, System Planning Branch, Strategy, Policy and Planning Division (SPPD). Published by the State of Queensland (Queensland Health), 2018.
30
2.3.5 SUBACUTEAdult subacute activity is projected to increase from 1,672 separations in 2016/17 to 3,569 in 2036/37; a growth rate of 3.9 percent per year. The highest volume specialty (in terms of separations) is projected to be palliative (non-acute). Refer to Table 19.The total number of same day sub-acute separations is 261 by 2036/37, indicating little demand for dedicated same day beds for any of the sub-acute SRGs based on current models of care.
Table 19 Adult Subacute Activity, Darling Downs Health by Stay Type and SRG/ESRG, 2016/17 to 2036/37
ESRG 82016/17 2026/27 2036/37 Change AGR^
Seps Bed-days Seps Bed-
days Seps Bed-days Seps Bed-
days Seps Bed-days
ON Geriatric Management 163 3,327 381 6,757 741 13,250 578 9,923 7.9% 7.2%
Other Non-Acute 636 18,489 736 21,115 877 24,949 241 6,460 1.6% 1.5%
Palliative 467 4,197 672 5,647 921 6,898 454 2,701 3.5% 2.5%
Rehabilitation 363 7,207 553 10,678 769 14,528 406 7,321 3.8% 3.6%
ON Total 1,629 33,220 2,343 44,197 3,308 59,624 1,679 26,404 3.6% 3.0%
SD Geriatric Management 2 2 5 5 4.9 4.9 0.0% 0.0%
Other Non-Acute 5 5 8 8 10 10 5.5 5.5 3.8% 3.8%
Palliative 38 38 60 60 86 86 48 48 4.1% 4.1%
Rehabilitation 56 56 160 160 160 160 0.0% 0.0%
SD Total 43 43 126 126 261 261 218 218 9.4% 9.4%
Grand Total 1,672 33,263 2,469 44,323 3,569 9,886 1,897 26,623 3.9% 3.0%
Source: Inpatient Projections (Base Year 2016/17) as supplied by Health Service Research, Analysis and Modelling Unit, System Planning Branch, Strategy, Policy and Planning Division (SPPD). Published by the State of Queensland (Queensland Health), 2018.
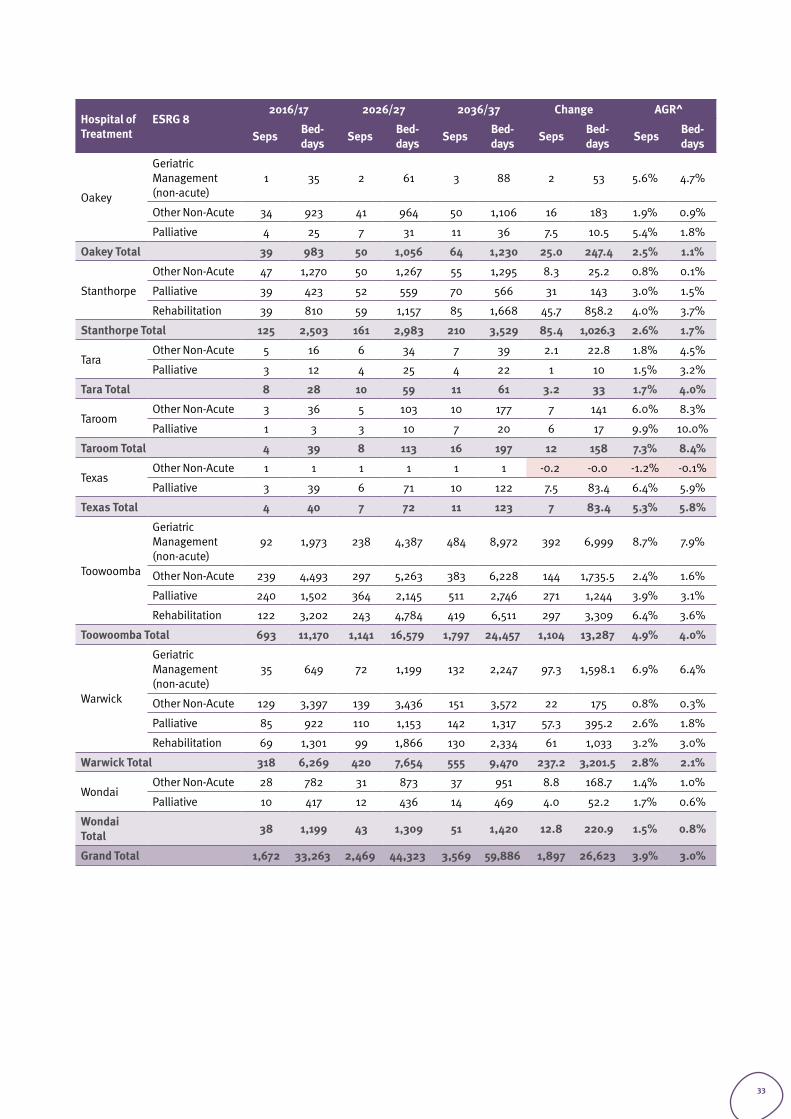
Adult subacute separations are projected to increase at 4.9 percent annually at TH and 5.3 percent annually at Dalby Hospital. In 2036/37, TH is projected to account for 1,797 of 3,569 total subacute separations across Darling Downs Health. Refer to Table 20. There will be a corresponding increase in bed days at TH from 11,170 in 2016/17 to 16,579 in 2026/27 and 24,457 in 2036/37.
31
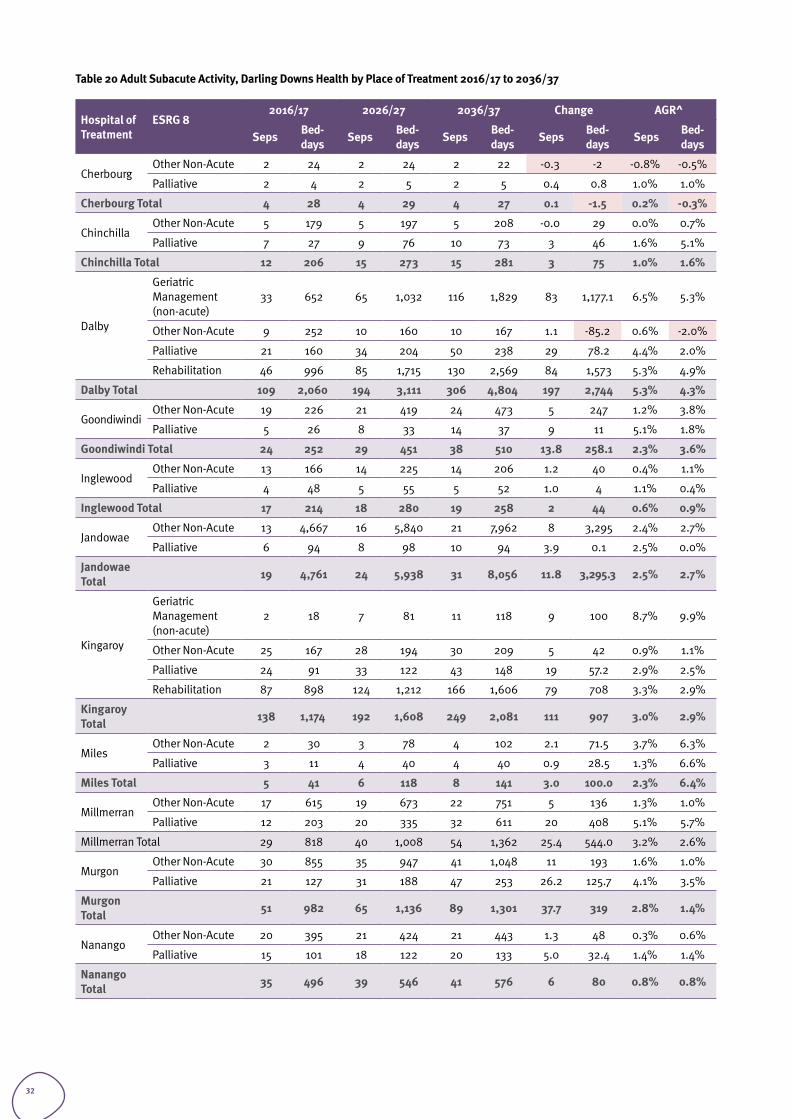
Table 20 Adult Subacute Activity, Darling Downs Health by Place of Treatment 2016/17 to 2036/37
Hospital of Treatment
ESRG 82016/17 2026/27 2036/37 Change AGR^
Seps Bed-days Seps Bed-
days Seps Bed-days Seps Bed-
days Seps Bed-days
CherbourgOther Non-Acute 2 24 2 24 2 22 -0.3 -2 -0.8% -0.5%
Palliative 2 4 2 5 2 5 0.4 0.8 1.0% 1.0%
Cherbourg Total 4 28 4 29 4 27 0.1 -1.5 0.2% -0.3%
ChinchillaOther Non-Acute 5 179 5 197 5 208 -0.0 29 0.0% 0.7%
Palliative 7 27 9 76 10 73 3 46 1.6% 5.1%
Chinchilla Total 12 206 15 273 15 281 3 75 1.0% 1.6%
Dalby
Geriatric Management (non-acute)
33 652 65 1,032 116 1,829 83 1,177.1 6.5% 5.3%
Other Non-Acute 9 252 10 160 10 167 1.1 -85.2 0.6% -2.0%
Palliative 21 160 34 204 50 238 29 78.2 4.4% 2.0%
Rehabilitation 46 996 85 1,715 130 2,569 84 1,573 5.3% 4.9%
Dalby Total 109 2,060 194 3,111 306 4,804 197 2,744 5.3% 4.3%
Goondiwindi Other Non-Acute 19 226 21 419 24 473 5 247 1.2% 3.8%
Palliative 5 26 8 33 14 37 9 11 5.1% 1.8%
Goondiwindi Total 24 252 29 451 38 510 13.8 258.1 2.3% 3.6%
Inglewood Other Non-Acute 13 166 14 225 14 206 1.2 40 0.4% 1.1%
Palliative 4 48 5 55 5 52 1.0 4 1.1% 0.4%
Inglewood Total 17 214 18 280 19 258 2 44 0.6% 0.9%
JandowaeOther Non-Acute 13 4,667 16 5,840 21 7,962 8 3,295 2.4% 2.7%
Palliative 6 94 8 98 10 94 3.9 0.1 2.5% 0.0%
Jandowae Total 19 4,761 24 5,938 31 8,056 11.8 3,295.3 2.5% 2.7%
Kingaroy
Geriatric Management (non-acute)
2 18 7 81 11 118 9 100 8.7% 9.9%
Other Non-Acute 25 167 28 194 30 209 5 42 0.9% 1.1%
Palliative 24 91 33 122 43 148 19 57.2 2.9% 2.5%
Rehabilitation 87 898 124 1,212 166 1,606 79 708 3.3% 2.9%
Kingaroy Total 138 1,174 192 1,608 249 2,081 111 907 3.0% 2.9%
MilesOther Non-Acute 2 30 3 78 4 102 2.1 71.5 3.7% 6.3%
Palliative 3 11 4 40 4 40 0.9 28.5 1.3% 6.6%
Miles Total 5 41 6 118 8 141 3.0 100.0 2.3% 6.4%
MillmerranOther Non-Acute 17 615 19 673 22 751 5 136 1.3% 1.0%
Palliative 12 203 20 335 32 611 20 408 5.1% 5.7%
Millmerran Total 29 818 40 1,008 54 1,362 25.4 544.0 3.2% 2.6%
Murgon Other Non-Acute 30 855 35 947 41 1,048 11 193 1.6% 1.0%
Palliative 21 127 31 188 47 253 26.2 125.7 4.1% 3.5%
Murgon Total 51 982 65 1,136 89 1,301 37.7 319 2.8% 1.4%
NanangoOther Non-Acute 20 395 21 424 21 443 1.3 48 0.3% 0.6%
Palliative 15 101 18 122 20 133 5.0 32.4 1.4% 1.4%
Nanango Total 35 496 39 546 41 576 6 80 0.8% 0.8%
32
Hospital of Treatment
ESRG 82016/17 2026/27 2036/37 Change AGR^
Seps Bed-days Seps Bed-
days Seps Bed-days Seps Bed-
days Seps Bed-days
Oakey
Geriatric Management (non-acute)
1 35 2 61 3 88 2 53 5.6% 4.7%
Other Non-Acute 34 923 41 964 50 1,106 16 183 1.9% 0.9%
Palliative 4 25 7 31 11 36 7.5 10.5 5.4% 1.8%
Oakey Total 39 983 50 1,056 64 1,230 25.0 247.4 2.5% 1.1%
Stanthorpe
Other Non-Acute 47 1,270 50 1,267 55 1,295 8.3 25.2 0.8% 0.1%
Palliative 39 423 52 559 70 566 31 143 3.0% 1.5%
Rehabilitation 39 810 59 1,157 85 1,668 45.7 858.2 4.0% 3.7%
Stanthorpe Total 125 2,503 161 2,983 210 3,529 85.4 1,026.3 2.6% 1.7%
TaraOther Non-Acute 5 16 6 34 7 39 2.1 22.8 1.8% 4.5%
Palliative 3 12 4 25 4 22 1 10 1.5% 3.2%
Tara Total 8 28 10 59 11 61 3.2 33 1.7% 4.0%
TaroomOther Non-Acute 3 36 5 103 10 177 7 141 6.0% 8.3%
Palliative 1 3 3 10 7 20 6 17 9.9% 10.0%
Taroom Total 4 39 8 113 16 197 12 158 7.3% 8.4%
TexasOther Non-Acute 1 1 1 1 1 1 -0.2 -0.0 -1.2% -0.1%
Palliative 3 39 6 71 10 122 7.5 83.4 6.4% 5.9%
Texas Total 4 40 7 72 11 123 7 83.4 5.3% 5.8%
Toowoomba
Geriatric Management (non-acute)
92 1,973 238 4,387 484 8,972 392 6,999 8.7% 7.9%
Other Non-Acute 239 4,493 297 5,263 383 6,228 144 1,735.5 2.4% 1.6%
Palliative 240 1,502 364 2,145 511 2,746 271 1,244 3.9% 3.1%
Rehabilitation 122 3,202 243 4,784 419 6,511 297 3,309 6.4% 3.6%
Toowoomba Total 693 11,170 1,141 16,579 1,797 24,457 1,104 13,287 4.9% 4.0%
Warwick
Geriatric Management (non-acute)
35 649 72 1,199 132 2,247 97.3 1,598.1 6.9% 6.4%
Other Non-Acute 129 3,397 139 3,436 151 3,572 22 175 0.8% 0.3%
Palliative 85 922 110 1,153 142 1,317 57.3 395.2 2.6% 1.8%
Rehabilitation 69 1,301 99 1,866 130 2,334 61 1,033 3.2% 3.0%
Warwick Total 318 6,269 420 7,654 555 9,470 237.2 3,201.5 2.8% 2.1%
WondaiOther Non-Acute 28 782 31 873 37 951 8.8 168.7 1.4% 1.0%
Palliative 10 417 12 436 14 469 4.0 52.2 1.7% 0.6%
Wondai Total 38 1,199 43 1,309 51 1,420 12.8 220.9 1.5% 0.8%
Grand Total 1,672 33,263 2,469 44,323 3,569 59,886 1,897 26,623 3.9% 3.0%
33
2.3.6 CRITICAL CAREIn the Darling Downs Health adult intensive care (ICU) and coronary care (CCU) services are provided from TH. Only bed days are identifiable in the AIM dataset, and therefore no separations are provided.
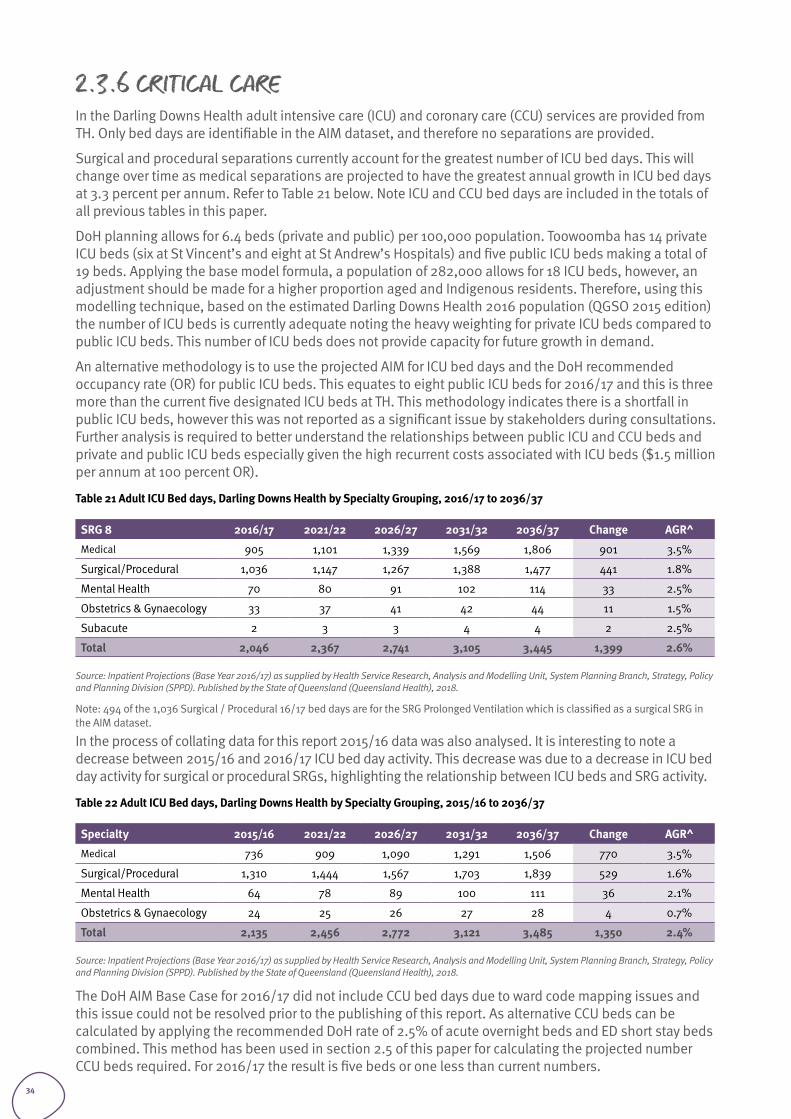
Surgical and procedural separations currently account for the greatest number of ICU bed days. This will change over time as medical separations are projected to have the greatest annual growth in ICU bed days at 3.3 percent per annum. Refer to Table 21 below. Note ICU and CCU bed days are included in the totals of all previous tables in this paper.
DoH planning allows for 6.4 beds (private and public) per 100,000 population. Toowoomba has 14 private ICU beds (six at St Vincent’s and eight at St Andrew’s Hospitals) and five public ICU beds making a total of 19 beds. Applying the base model formula, a population of 282,000 allows for 18 ICU beds, however, an adjustment should be made for a higher proportion aged and Indigenous residents. Therefore, using this modelling technique, based on the estimated Darling Downs Health 2016 population (QGSO 2015 edition) the number of ICU beds is currently adequate noting the heavy weighting for private ICU beds compared to public ICU beds. This number of ICU beds does not provide capacity for future growth in demand.
An alternative methodology is to use the projected AIM for ICU bed days and the DoH recommended occupancy rate (OR) for public ICU beds. This equates to eight public ICU beds for 2016/17 and this is three more than the current five designated ICU beds at TH. This methodology indicates there is a shortfall in public ICU beds, however this was not reported as a significant issue by stakeholders during consultations. Further analysis is required to better understand the relationships between public ICU and CCU beds and private and public ICU beds especially given the high recurrent costs associated with ICU beds ($1.5 million per annum at 100 percent OR).
Table 21 Adult ICU Bed days, Darling Downs Health by Specialty Grouping, 2016/17 to 2036/37
SRG 8 2016/17 2021/22 2026/27 2031/32 2036/37 Change AGR^Medical 905 1,101 1,339 1,569 1,806 901 3.5%
Surgical/Procedural 1,036 1,147 1,267 1,388 1,477 441 1.8%
Mental Health 70 80 91 102 114 33 2.5%
Obstetrics & Gynaecology 33 37 41 42 44 11 1.5%
Subacute 2 3 3 4 4 2 2.5%
Total 2,046 2,367 2,741 3,105 3,445 1,399 2.6%
Source: Inpatient Projections (Base Year 2016/17) as supplied by Health Service Research, Analysis and Modelling Unit, System Planning Branch, Strategy, Policy and Planning Division (SPPD). Published by the State of Queensland (Queensland Health), 2018.
Note: 494 of the 1,036 Surgical / Procedural 16/17 bed days are for the SRG Prolonged Ventilation which is classified as a surgical SRG in the AIM dataset.
In the process of collating data for this report 2015/16 data was also analysed. It is interesting to note a decrease between 2015/16 and 2016/17 ICU bed day activity. This decrease was due to a decrease in ICU bed day activity for surgical or procedural SRGs, highlighting the relationship between ICU beds and SRG activity.
Table 22 Adult ICU Bed days, Darling Downs Health by Specialty Grouping, 2015/16 to 2036/37
Specialty 2015/16 2021/22 2026/27 2031/32 2036/37 Change AGR^Medical 736 909 1,090 1,291 1,506 770 3.5%
Surgical/Procedural 1,310 1,444 1,567 1,703 1,839 529 1.6%
Mental Health 64 78 89 100 111 36 2.1%
Obstetrics & Gynaecology 24 25 26 27 28 4 0.7%
Total 2,135 2,456 2,772 3,121 3,485 1,350 2.4%
Source: Inpatient Projections (Base Year 2016/17) as supplied by Health Service Research, Analysis and Modelling Unit, System Planning Branch, Strategy, Policy and Planning Division (SPPD). Published by the State of Queensland (Queensland Health), 2018.
The DoH AIM Base Case for 2016/17 did not include CCU bed days due to ward code mapping issues and this issue could not be resolved prior to the publishing of this report. As alternative CCU beds can be calculated by applying the recommended DoH rate of 2.5% of acute overnight beds and ED short stay beds combined. This method has been used in section 2.5 of this paper for calculating the projected number CCU beds required. For 2016/17 the result is five beds or one less than current numbers.
34
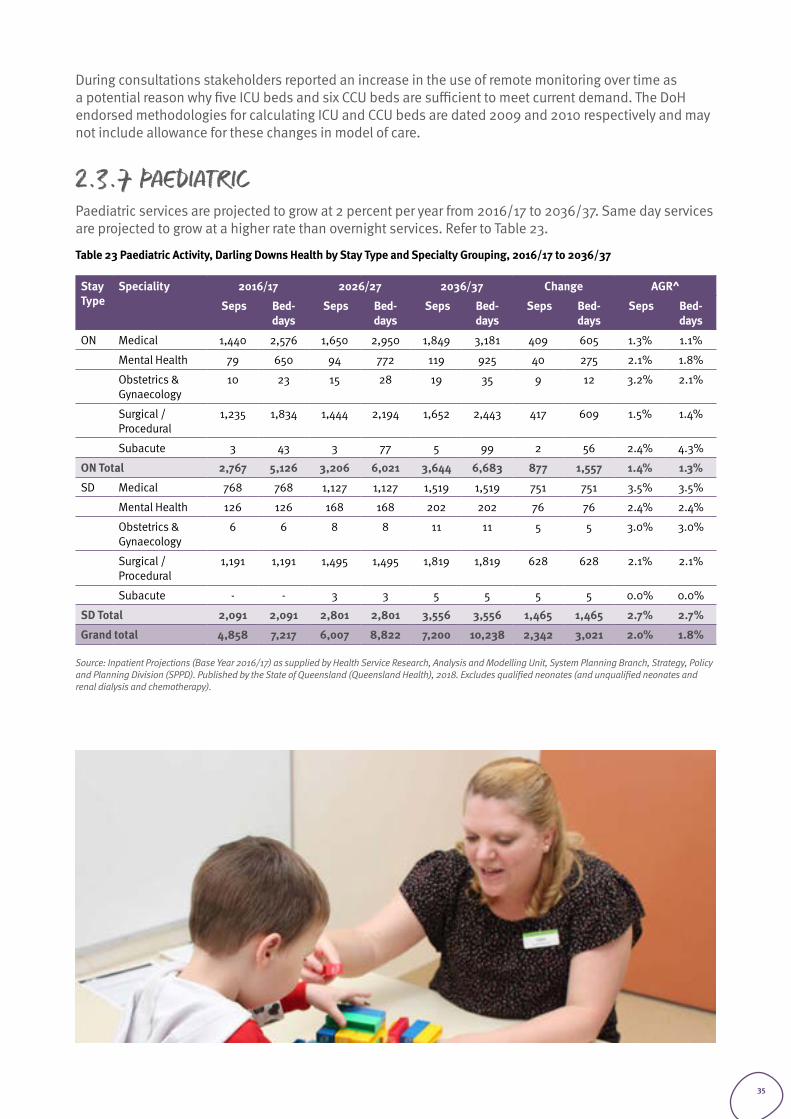
During consultations stakeholders reported an increase in the use of remote monitoring over time as a potential reason why five ICU beds and six CCU beds are sufficient to meet current demand. The DoH endorsed methodologies for calculating ICU and CCU beds are dated 2009 and 2010 respectively and may not include allowance for these changes in model of care.
2.3.7 PAEDIATRICPaediatric services are projected to grow at 2 percent per year from 2016/17 to 2036/37. Same day services are projected to grow at a higher rate than overnight services. Refer to Table 23.
Table 23 Paediatric Activity, Darling Downs Health by Stay Type and Specialty Grouping, 2016/17 to 2036/37
Stay Type
Speciality 2016/17 2026/27 2036/37 Change AGR^
Seps Bed-days
Seps Bed-days
Seps Bed-days
Seps Bed-days
Seps Bed-days
ON Medical 1,440 2,576 1,650 2,950 1,849 3,181 409 605 1.3% 1.1%
Mental Health 79 650 94 772 119 925 40 275 2.1% 1.8%
Obstetrics & Gynaecology
10 23 15 28 19 35 9 12 3.2% 2.1%
Surgical / Procedural
1,235 1,834 1,444 2,194 1,652 2,443 417 609 1.5% 1.4%
Subacute 3 43 3 77 5 99 2 56 2.4% 4.3%
ON Total 2,767 5,126 3,206 6,021 3,644 6,683 877 1,557 1.4% 1.3%
SD Medical 768 768 1,127 1,127 1,519 1,519 751 751 3.5% 3.5%
Mental Health 126 126 168 168 202 202 76 76 2.4% 2.4%
Obstetrics & Gynaecology
6 6 8 8 11 11 5 5 3.0% 3.0%
Surgical / Procedural
1,191 1,191 1,495 1,495 1,819 1,819 628 628 2.1% 2.1%
Subacute - - 3 3 5 5 5 5 0.0% 0.0%
SD Total 2,091 2,091 2,801 2,801 3,556 3,556 1,465 1,465 2.7% 2.7%
Grand total 4,858 7,217 6,007 8,822 7,200 10,238 2,342 3,021 2.0% 1.8%
Source: Inpatient Projections (Base Year 2016/17) as supplied by Health Service Research, Analysis and Modelling Unit, System Planning Branch, Strategy, Policy and Planning Division (SPPD). Published by the State of Queensland (Queensland Health), 2018. Excludes qualified neonates (and unqualified neonates and renal dialysis and chemotherapy).
35
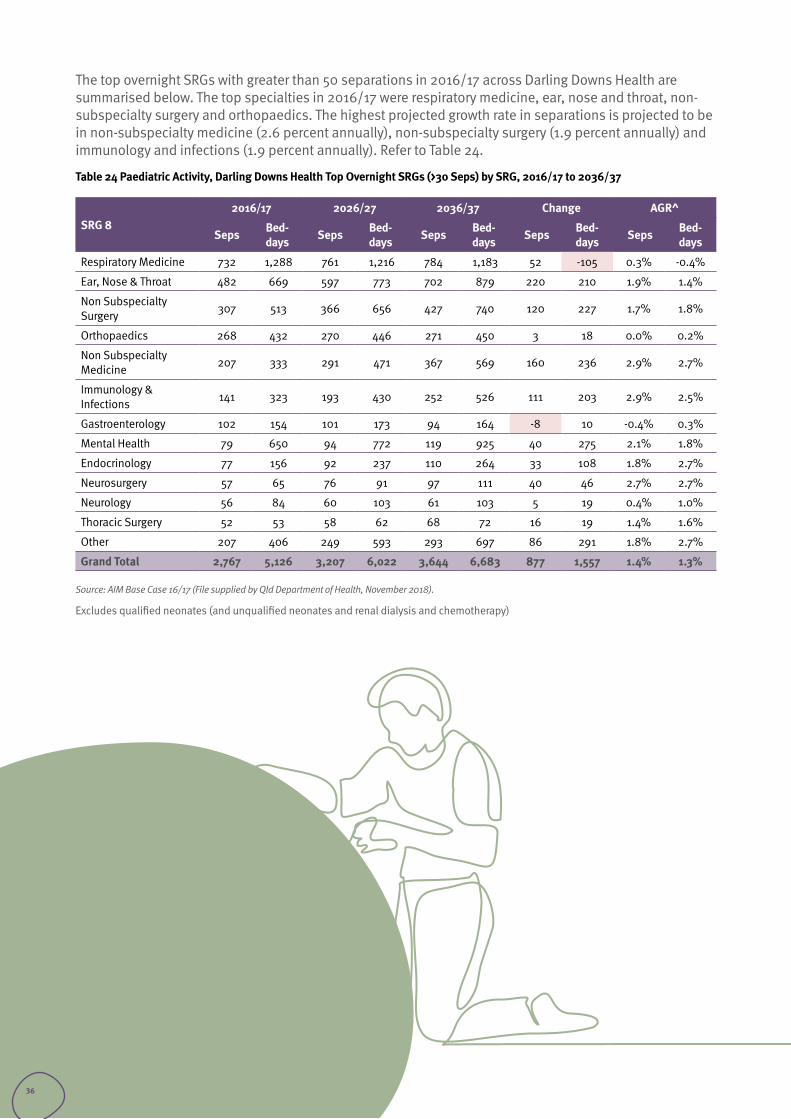
The top overnight SRGs with greater than 50 separations in 2016/17 across Darling Downs Health are summarised below. The top specialties in 2016/17 were respiratory medicine, ear, nose and throat, non-subspecialty surgery and orthopaedics. The highest projected growth rate in separations is projected to be in non-subspecialty medicine (2.6 percent annually), non-subspecialty surgery (1.9 percent annually) and immunology and infections (1.9 percent annually). Refer to Table 24.
Table 24 Paediatric Activity, Darling Downs Health Top Overnight SRGs (>30 Seps) by SRG, 2016/17 to 2036/37
SRG 82016/17 2026/27 2036/37 Change AGR^
Seps Bed-days Seps Bed-
days Seps Bed-days Seps Bed-
days Seps Bed-days
Respiratory Medicine 732 1,288 761 1,216 784 1,183 52 -105 0.3% -0.4%
Ear, Nose & Throat 482 669 597 773 702 879 220 210 1.9% 1.4%
Non Subspecialty Surgery 307 513 366 656 427 740 120 227 1.7% 1.8%
Orthopaedics 268 432 270 446 271 450 3 18 0.0% 0.2%
Non Subspecialty Medicine 207 333 291 471 367 569 160 236 2.9% 2.7%
Immunology & Infections 141 323 193 430 252 526 111 203 2.9% 2.5%
Gastroenterology 102 154 101 173 94 164 -8 10 -0.4% 0.3%
Mental Health 79 650 94 772 119 925 40 275 2.1% 1.8%
Endocrinology 77 156 92 237 110 264 33 108 1.8% 2.7%
Neurosurgery 57 65 76 91 97 111 40 46 2.7% 2.7%
Neurology 56 84 60 103 61 103 5 19 0.4% 1.0%
Thoracic Surgery 52 53 58 62 68 72 16 19 1.4% 1.6%
Other 207 406 249 593 293 697 86 291 1.8% 2.7%
Grand Total 2,767 5,126 3,207 6,022 3,644 6,683 877 1,557 1.4% 1.3%
Source: AIM Base Case 16/17 (File supplied by Qld Department of Health, November 2018).
Excludes qualified neonates (and unqualified neonates and renal dialysis and chemotherapy)
36
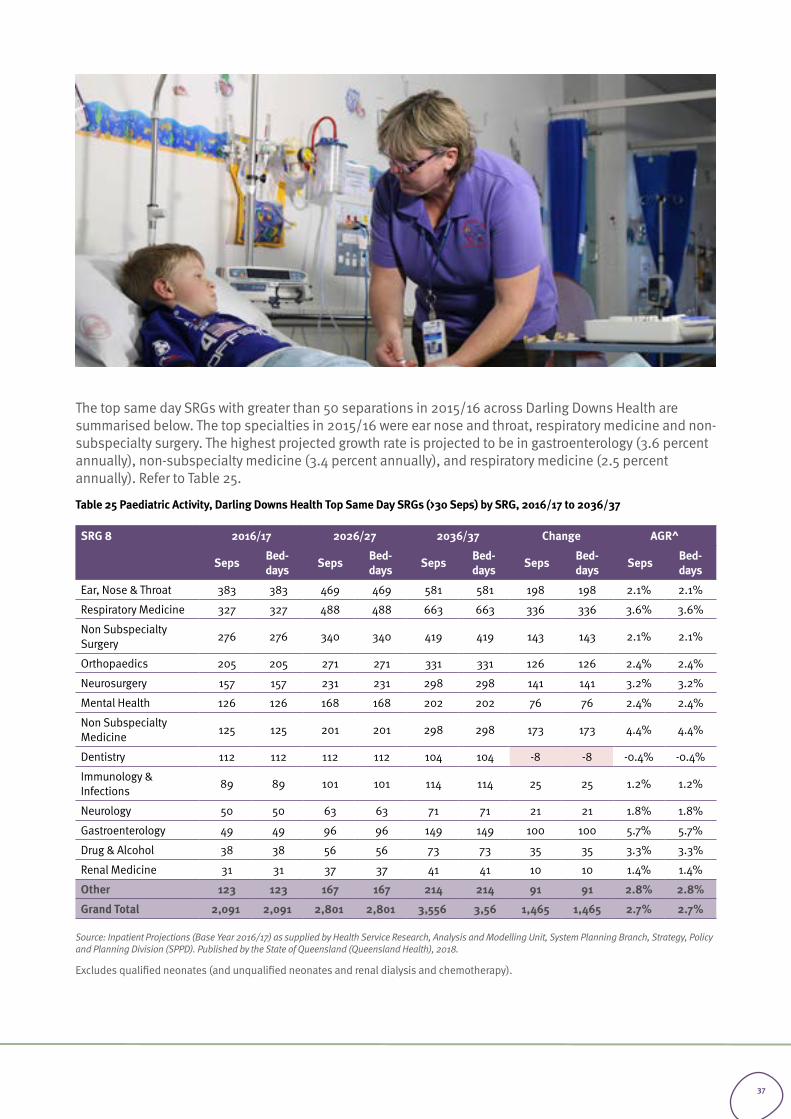
The top same day SRGs with greater than 50 separations in 2015/16 across Darling Downs Health are summarised below. The top specialties in 2015/16 were ear nose and throat, respiratory medicine and non-subspecialty surgery. The highest projected growth rate is projected to be in gastroenterology (3.6 percent annually), non-subspecialty medicine (3.4 percent annually), and respiratory medicine (2.5 percent annually). Refer to Table 25.
Table 25 Paediatric Activity, Darling Downs Health Top Same Day SRGs (>30 Seps) by SRG, 2016/17 to 2036/37
SRG 8 2016/17 2026/27 2036/37 Change AGR^
Seps Bed-days Seps Bed-
days Seps Bed-days Seps Bed-
days Seps Bed-days
Ear, Nose & Throat 383 383 469 469 581 581 198 198 2.1% 2.1%
Respiratory Medicine 327 327 488 488 663 663 336 336 3.6% 3.6%
Non Subspecialty Surgery 276 276 340 340 419 419 143 143 2.1% 2.1%
Orthopaedics 205 205 271 271 331 331 126 126 2.4% 2.4%
Neurosurgery 157 157 231 231 298 298 141 141 3.2% 3.2%
Mental Health 126 126 168 168 202 202 76 76 2.4% 2.4%
Non Subspecialty Medicine 125 125 201 201 298 298 173 173 4.4% 4.4%
Dentistry 112 112 112 112 104 104 -8 -8 -0.4% -0.4%
Immunology & Infections 89 89 101 101 114 114 25 25 1.2% 1.2%
Neurology 50 50 63 63 71 71 21 21 1.8% 1.8%
Gastroenterology 49 49 96 96 149 149 100 100 5.7% 5.7%
Drug & Alcohol 38 38 56 56 73 73 35 35 3.3% 3.3%
Renal Medicine 31 31 37 37 41 41 10 10 1.4% 1.4%
Other 123 123 167 167 214 214 91 91 2.8% 2.8%
Grand Total 2,091 2,091 2,801 2,801 3,556 3,56 1,465 1,465 2.7% 2.7%
Source: Inpatient Projections (Base Year 2016/17) as supplied by Health Service Research, Analysis and Modelling Unit, System Planning Branch, Strategy, Policy and Planning Division (SPPD). Published by the State of Queensland (Queensland Health), 2018.
Excludes qualified neonates (and unqualified neonates and renal dialysis and chemotherapy).
37
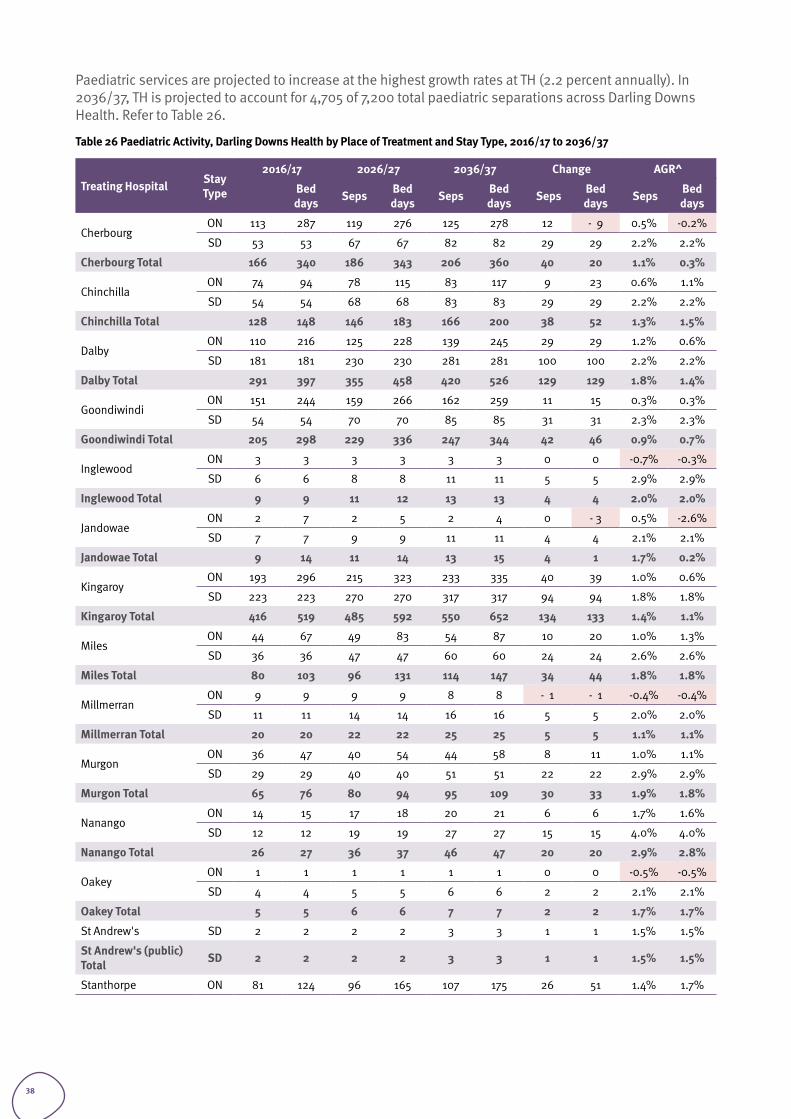
Paediatric services are projected to increase at the highest growth rates at TH (2.2 percent annually). In 2036/37, TH is projected to account for 4,705 of 7,200 total paediatric separations across Darling Downs Health. Refer to Table 26.
Table 26 Paediatric Activity, Darling Downs Health by Place of Treatment and Stay Type, 2016/17 to 2036/37
Treating Hospital Stay Type
2016/17 2026/27 2036/37 Change AGR^
Bed days Seps Bed
days Seps Bed days Seps Bed
days Seps Bed days
CherbourgON 113 287 119 276 125 278 12 - 9 0.5% -0.2%
SD 53 53 67 67 82 82 29 29 2.2% 2.2%
Cherbourg Total 166 340 186 343 206 360 40 20 1.1% 0.3%
ChinchillaON 74 94 78 115 83 117 9 23 0.6% 1.1%
SD 54 54 68 68 83 83 29 29 2.2% 2.2%
Chinchilla Total 128 148 146 183 166 200 38 52 1.3% 1.5%
Dalby ON 110 216 125 228 139 245 29 29 1.2% 0.6%
SD 181 181 230 230 281 281 100 100 2.2% 2.2%
Dalby Total 291 397 355 458 420 526 129 129 1.8% 1.4%
Goondiwindi ON 151 244 159 266 162 259 11 15 0.3% 0.3%
SD 54 54 70 70 85 85 31 31 2.3% 2.3%
Goondiwindi Total 205 298 229 336 247 344 42 46 0.9% 0.7%
Inglewood ON 3 3 3 3 3 3 0 0 -0.7% -0.3%
SD 6 6 8 8 11 11 5 5 2.9% 2.9%
Inglewood Total 9 9 11 12 13 13 4 4 2.0% 2.0%
Jandowae ON 2 7 2 5 2 4 0 - 3 0.5% -2.6%
SD 7 7 9 9 11 11 4 4 2.1% 2.1%
Jandowae Total 9 14 11 14 13 15 4 1 1.7% 0.2%
Kingaroy ON 193 296 215 323 233 335 40 39 1.0% 0.6%
SD 223 223 270 270 317 317 94 94 1.8% 1.8%
Kingaroy Total 416 519 485 592 550 652 134 133 1.4% 1.1%
MilesON 44 67 49 83 54 87 10 20 1.0% 1.3%
SD 36 36 47 47 60 60 24 24 2.6% 2.6%
Miles Total 80 103 96 131 114 147 34 44 1.8% 1.8%
Millmerran ON 9 9 9 9 8 8 - 1 - 1 -0.4% -0.4%
SD 11 11 14 14 16 16 5 5 2.0% 2.0%
Millmerran Total 20 20 22 22 25 25 5 5 1.1% 1.1%
Murgon ON 36 47 40 54 44 58 8 11 1.0% 1.1%
SD 29 29 40 40 51 51 22 22 2.9% 2.9%
Murgon Total 65 76 80 94 95 109 30 33 1.9% 1.8%
Nanango ON 14 15 17 18 20 21 6 6 1.7% 1.6%
SD 12 12 19 19 27 27 15 15 4.0% 4.0%
Nanango Total 26 27 36 37 46 47 20 20 2.9% 2.8%
Oakey ON 1 1 1 1 1 1 0 0 -0.5% -0.5%
SD 4 4 5 5 6 6 2 2 2.1% 2.1%
Oakey Total 5 5 6 6 7 7 2 2 1.7% 1.7%
St Andrew's SD 2 2 2 2 3 3 1 1 1.5% 1.5%
St Andrew's (public) Total SD 2 2 2 2 3 3 1 1 1.5% 1.5%
Stanthorpe ON 81 124 96 165 107 175 26 51 1.4% 1.7%
38

Treating Hospital Stay Type
2016/17 2026/27 2036/37 Change AGR^
Bed days Seps Bed
days Seps Bed days Seps Bed
days Seps Bed days
SD 53 53 82 82 110 110 57 57 3.7% 3.7%
Stanthorpe Total SD 134 177 177 247 217 286 83 109 2.4% 2.4%
Tara ON 17 19 18 44 19 43 2 24 0.5% 4.1%
SD 28 28 35 35 44 44 16 16 2.3% 2.3%
Tara Total SD 45 47 53 79 62 86 17 39 1.6% 3.1%
Taroom ON 12 17 12 19 12 17 0 0 -0.1% 0.1%
SD 13 13 15 15 17 17 4 4 1.5% 1.5%
Taroom Total SD 25 30 27 33 29 35 4 5 0.8% 0.7%
Texas ON 12 17 13 20 15 21 3 4 1.0% 1.1%
SD 6 6 8 8 9 9 3 3 2.0% 2.0%
Texas Total SD 18 23 21 28 23 30 5 7 1.3% 1.4%
Toowoomba ON 1,742 3,430 2,087 4,130 2,449 4,746 707 1,316 1.7% 1.6%
SD 1,278 1,278 1,748 1,748 2,256 2,256 978 978 2.9% 2.9%
Toowoomba Total SD 3,020 4,708 3,834 5,878 4,705 7,002 1,685 2,294 2.2% 2.0%
Warwick ON 153 233 163 263 169 265 16 32 0.5% 0.6%
SD 41 41 65 65 89 89 48 48 3.9% 3.9%
Warwick Total SD 194 274 228 328 258 353 64 79 1.4% 1.3%
Grand Total 4,858 7,217 6,008 8,823 7,200 10,239 2,342 3,022 2.0% 1.8%
Source: Acute Inpatient Model: Darling Downs Health Scenario (16/17 Base). The above table excludes unqualified neonates and renal dialysis, qualified neonates (741 separations 16/17) and chemotherapy (41 separations 16/17).
Table 27 Paediatric Activity Outflow to Metropolitan Hospitals * by Stay Type 2016/17 to 2036/37 (all SRGs)
Paediatrics Treated Metro*
Stay Type
2016/17 2026/27 2036/37 Change AGR^
Bed days Seps Bed
days Seps Bed days Seps Bed
days Seps Bed days
All SRGs ON 826 6,903 982 7,478 1,143 8,235 317 1,332 1.6% 0.9%
SD 681 681 859 859 1,042 1,042 361 361 2.2% 2.2%
Total Paediatrics Metro 1,507 7,584 1,841 8,337 2,185 9,277 678 1,693 1.9% 1.0%
Source: Acute Inpatient Model: Darling Downs Health Scenario (16/17 Base). * Ellen Barron Family Centre, Queensland Children’s Hospital, Mater Mothers’ Public Hospital, Royal Brisbane & Women’s Hospital, The Prince Charles Hospital.
See Section 2.4.7 for qualified neonate activity projections.
39
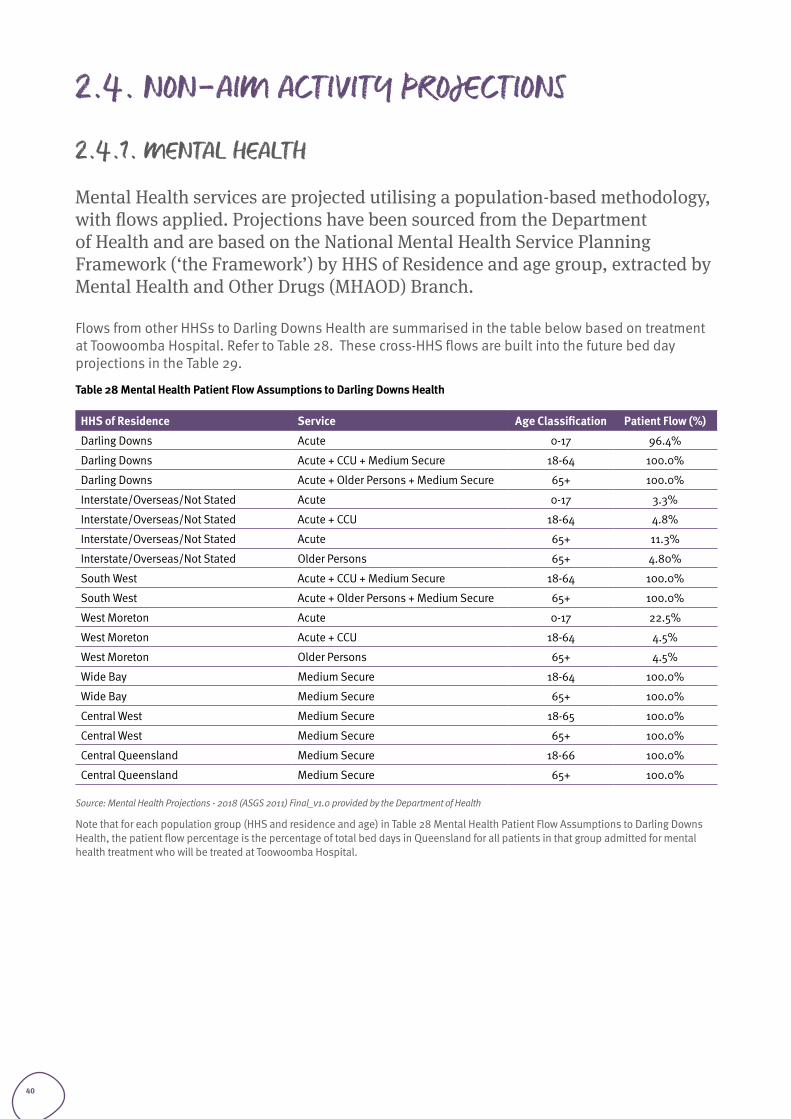
2.4. NON-AIM ACTIVITY PROJECTIONS
2.4.1. MENTAL HEALTH
Mental Health services are projected utilising a population-based methodology, with flows applied. Projections have been sourced from the Department of Health and are based on the National Mental Health Service Planning Framework (‘the Framework’) by HHS of Residence and age group, extracted by Mental Health and Other Drugs (MHAOD) Branch.
Flows from other HHSs to Darling Downs Health are summarised in the table below based on treatment at Toowoomba Hospital. Refer to Table 28. These cross-HHS flows are built into the future bed day projections in the Table 29.
Table 28 Mental Health Patient Flow Assumptions to Darling Downs Health
HHS of Residence Service Age Classification Patient Flow (%)
Darling Downs Acute 0-17 96.4%
Darling Downs Acute + CCU + Medium Secure 18-64 100.0%
Darling Downs Acute + Older Persons + Medium Secure 65+ 100.0%
Interstate/Overseas/Not Stated Acute 0-17 3.3%
Interstate/Overseas/Not Stated Acute + CCU 18-64 4.8%
Interstate/Overseas/Not Stated Acute 65+ 11.3%
Interstate/Overseas/Not Stated Older Persons 65+ 4.80%
South West Acute + CCU + Medium Secure 18-64 100.0%
South West Acute + Older Persons + Medium Secure 65+ 100.0%
West Moreton Acute 0-17 22.5%
West Moreton Acute + CCU 18-64 4.5%
West Moreton Older Persons 65+ 4.5%
Wide Bay Medium Secure 18-64 100.0%
Wide Bay Medium Secure 65+ 100.0%
Central West Medium Secure 18-65 100.0%
Central West Medium Secure 65+ 100.0%
Central Queensland Medium Secure 18-66 100.0%
Central Queensland Medium Secure 65+ 100.0%
Source: Mental Health Projections - 2018 (ASGS 2011) Final_v1.0 provided by the Department of Health
Note that for each population group (HHS and residence and age) in Table 28 Mental Health Patient Flow Assumptions to Darling Downs Health, the patient flow percentage is the percentage of total bed days in Queensland for all patients in that group admitted for mental health treatment who will be treated at Toowoomba Hospital.
40
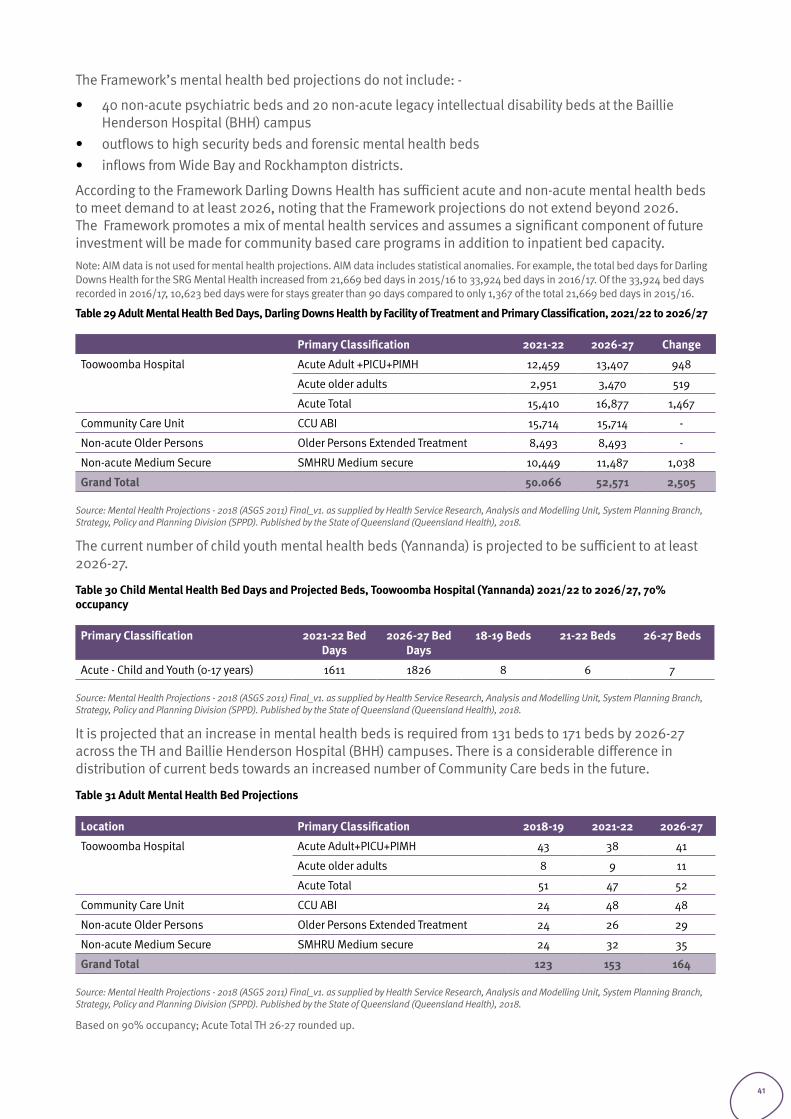
The Framework’s mental health bed projections do not include: -
• 40 non-acute psychiatric beds and 20 non-acute legacy intellectual disability beds at the Baillie Henderson Hospital (BHH) campus
• outflows to high security beds and forensic mental health beds• inflows from Wide Bay and Rockhampton districts.
According to the Framework Darling Downs Health has sufficient acute and non-acute mental health beds to meet demand to at least 2026, noting that the Framework projections do not extend beyond 2026. The Framework promotes a mix of mental health services and assumes a significant component of future investment will be made for community based care programs in addition to inpatient bed capacity.Note: AIM data is not used for mental health projections. AIM data includes statistical anomalies. For example, the total bed days for Darling Downs Health for the SRG Mental Health increased from 21,669 bed days in 2015/16 to 33,924 bed days in 2016/17. Of the 33,924 bed days recorded in 2016/17, 10,623 bed days were for stays greater than 90 days compared to only 1,367 of the total 21,669 bed days in 2015/16.
Table 29 Adult Mental Health Bed Days, Darling Downs Health by Facility of Treatment and Primary Classification, 2021/22 to 2026/27
Primary Classification 2021-22 2026-27 Change
Toowoomba Hospital Acute Adult +PICU+PIMH 12,459 13,407 948
Acute older adults 2,951 3,470 519
Acute Total 15,410 16,877 1,467
Community Care Unit CCU ABI 15,714 15,714 -
Non-acute Older Persons Older Persons Extended Treatment 8,493 8,493 -
Non-acute Medium Secure SMHRU Medium secure 10,449 11,487 1,038
Grand Total 50.066 52,571 2,505
Source: Mental Health Projections - 2018 (ASGS 2011) Final_v1. as supplied by Health Service Research, Analysis and Modelling Unit, System Planning Branch, Strategy, Policy and Planning Division (SPPD). Published by the State of Queensland (Queensland Health), 2018.
The current number of child youth mental health beds (Yannanda) is projected to be sufficient to at least 2026-27.
Table 30 Child Mental Health Bed Days and Projected Beds, Toowoomba Hospital (Yannanda) 2021/22 to 2026/27, 70% occupancy
Primary Classification 2021-22 Bed Days
2026-27 Bed Days
18-19 Beds 21-22 Beds 26-27 Beds
Acute - Child and Youth (0-17 years) 1611 1826 8 6 7
Source: Mental Health Projections - 2018 (ASGS 2011) Final_v1. as supplied by Health Service Research, Analysis and Modelling Unit, System Planning Branch, Strategy, Policy and Planning Division (SPPD). Published by the State of Queensland (Queensland Health), 2018.
It is projected that an increase in mental health beds is required from 131 beds to 171 beds by 2026-27 across the TH and Baillie Henderson Hospital (BHH) campuses. There is a considerable difference in distribution of current beds towards an increased number of Community Care beds in the future.
Table 31 Adult Mental Health Bed Projections
Location Primary Classification 2018-19 2021-22 2026-27
Toowoomba Hospital Acute Adult+PICU+PIMH 43 38 41
Acute older adults 8 9 11
Acute Total 51 47 52
Community Care Unit CCU ABI 24 48 48
Non-acute Older Persons Older Persons Extended Treatment 24 26 29
Non-acute Medium Secure SMHRU Medium secure 24 32 35
Grand Total 123 153 164
Source: Mental Health Projections - 2018 (ASGS 2011) Final_v1. as supplied by Health Service Research, Analysis and Modelling Unit, System Planning Branch, Strategy, Policy and Planning Division (SPPD). Published by the State of Queensland (Queensland Health), 2018.
Based on 90% occupancy; Acute Total TH 26-27 rounded up.
41
The Framework methodology is based on a complex array of expert opinions and draws upon literature in both Australian and other jurisdictions. The planning principles contained in the Framework methodology need to be contextualised to reflect local needs. The Framework assumes a healthy community service is operating supported through funding mechanisms such as the NDIS. Capacity to manage within the projected planning figures above relies upon a full and comprehensive array of primary services yet to be achieved in most areas.
Darling Downs Health is currently working on a local mental health planning document with the DDWMPHN to localise the Framework principles and when this work is completed Darling Downs Health will be better informed with respect to the future planning of inpatient and community resources. Issues to be considered contextualising the Framework include:
2.4.1.1 Acute Adult Mental Health (including Older Persons) • The Framework methodology doesn’t account for all cross-district flows, nor do the planning figures
reflect adjustments for rural and Aboriginal and Torres Strait Islander (ATSI) population issues particularly well. How many acute beds are adequate depends in part upon the supply of extended beds to ensure long stay patients in acute units do not create access block.
2.4.1.2 Child Youth Mental Health• Currently Yannanda has eight beds the original planning being based on economy of scale, capacity
for overflow and future proofing. Note the beds in Yannanda are for adolescents aged 12 to 18 years and not the zero to 17 years range listed in the Framework.
2.4.1.3 Medium Secure and Extended Secure• Planning figures need to consider impact on medium secure facilities when high secure beds within
the State are in demand. Some longer-term residents are from catchments outside the extended secure boundaries and would not be included in planning figure methodology.
2.4.1.4 Community Care Unit (CCU)• The Framework allows for 48 community care beds in Darling Downs Health. Darling Downs Health
currently has 24 CCU beds and a further 24 beds in extended treatment and rehabilitation (Jacaranda). Effectively this provides for the correct number of beds for this program although they are configured slightly differently.
2.4.1.5 Older Persons Beds (non-Acute)• Currently there are 24 older person extended beds in Darling Downs Health (Connolly BHH) and this
is consistent with the Framework noting some consumers are outside the catchment listed in Table 31 above. The current unit was recently refurbished.
2.4.1.6 Walwa and Giabal (formerly Morris Mouatt)• Giabal is unlikely to be decommissioned in the short to medium term due to complex issues with
the NDIS model and high-level funding provisions by the NDIA planners. It should be noted that the consumers here have benefited from increased community access hours.
• Walwa residents include young people requiring nursing home care and a number of individuals who have significant behavioural disturbances that make their care in alternative environments unlikely at this point in time in the absence of highly specialised NDIS programs with specialist disability accommodation.
2.4.1.7 Longer Term Planning• Going forward the greatest challenges relate to the adequacy of community based funding, not only
in terms of our community based services, but also in terms of the adequacy of primary care supports and increased challenges with regard to co-morbid drug and alcohol related issues.
42
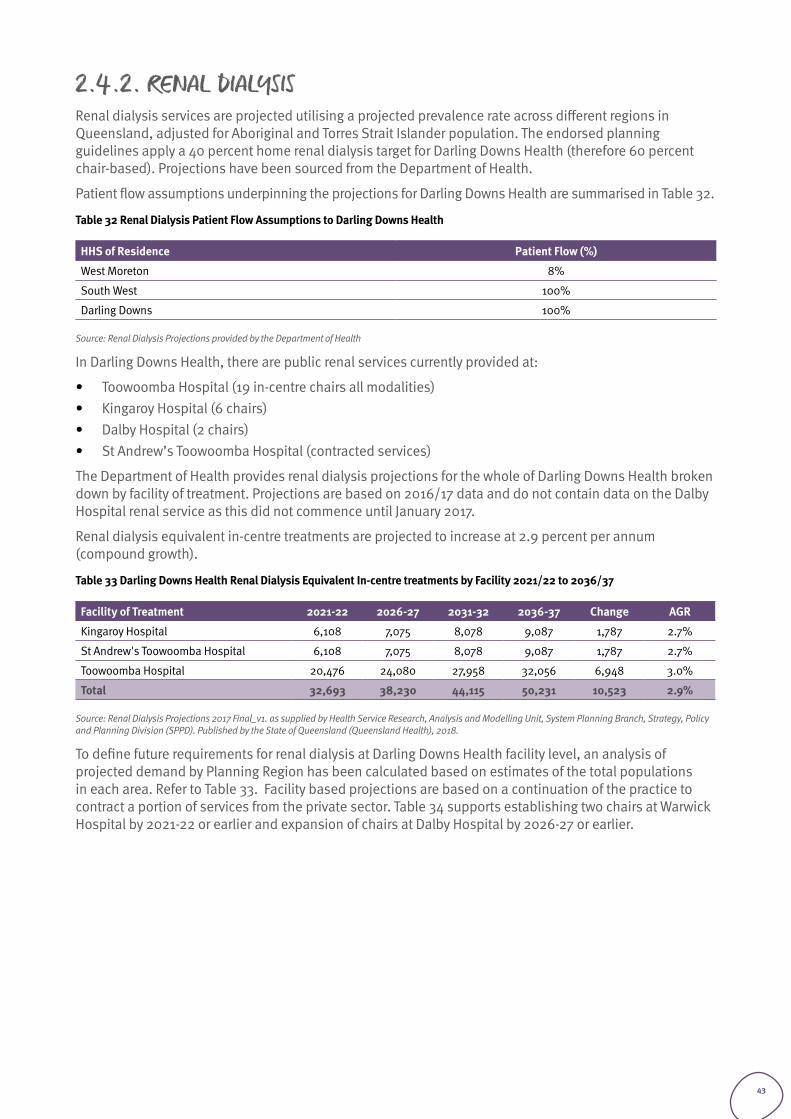
2.4.2. RENAL DIALYSISRenal dialysis services are projected utilising a projected prevalence rate across different regions in Queensland, adjusted for Aboriginal and Torres Strait Islander population. The endorsed planning guidelines apply a 40 percent home renal dialysis target for Darling Downs Health (therefore 60 percent chair-based). Projections have been sourced from the Department of Health.
Patient flow assumptions underpinning the projections for Darling Downs Health are summarised in Table 32.
Table 32 Renal Dialysis Patient Flow Assumptions to Darling Downs Health
HHS of Residence Patient Flow (%)
West Moreton 8%
South West 100%
Darling Downs 100%
Source: Renal Dialysis Projections provided by the Department of Health
In Darling Downs Health, there are public renal services currently provided at:
• Toowoomba Hospital (19 in-centre chairs all modalities) • Kingaroy Hospital (6 chairs) • Dalby Hospital (2 chairs) • St Andrew’s Toowoomba Hospital (contracted services)
The Department of Health provides renal dialysis projections for the whole of Darling Downs Health broken down by facility of treatment. Projections are based on 2016/17 data and do not contain data on the Dalby Hospital renal service as this did not commence until January 2017.
Renal dialysis equivalent in-centre treatments are projected to increase at 2.9 percent per annum (compound growth).
Table 33 Darling Downs Health Renal Dialysis Equivalent In-centre treatments by Facility 2021/22 to 2036/37
Facility of Treatment 2021-22 2026-27 2031-32 2036-37 Change AGR
Kingaroy Hospital 6,108 7,075 8,078 9,087 1,787 2.7%
St Andrew's Toowoomba Hospital 6,108 7,075 8,078 9,087 1,787 2.7%
Toowoomba Hospital 20,476 24,080 27,958 32,056 6,948 3.0%
Total 32,693 38,230 44,115 50,231 10,523 2.9%
Source: Renal Dialysis Projections 2017 Final_v1. as supplied by Health Service Research, Analysis and Modelling Unit, System Planning Branch, Strategy, Policy and Planning Division (SPPD). Published by the State of Queensland (Queensland Health), 2018.
To define future requirements for renal dialysis at Darling Downs Health facility level, an analysis of projected demand by Planning Region has been calculated based on estimates of the total populations in each area. Refer to Table 33. Facility based projections are based on a continuation of the practice to contract a portion of services from the private sector. Table 34 supports establishing two chairs at Warwick Hospital by 2021-22 or earlier and expansion of chairs at Dalby Hospital by 2026-27 or earlier.
43
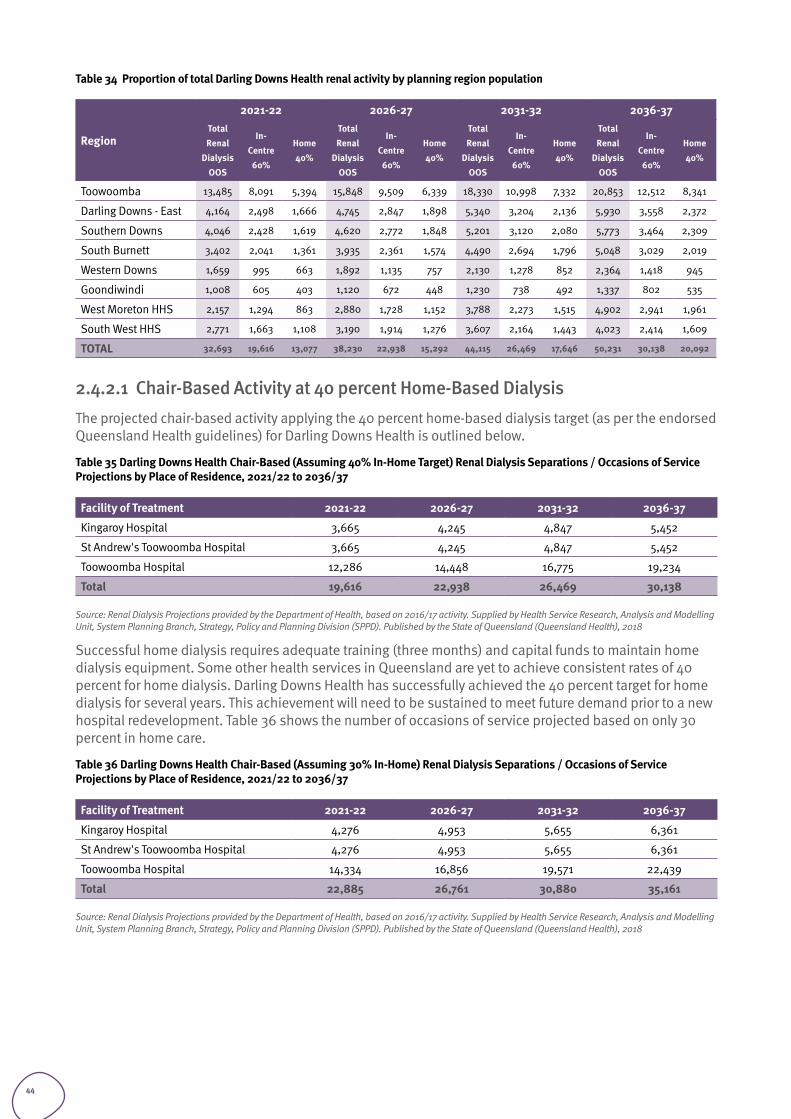
Table 34 Proportion of total Darling Downs Health renal activity by planning region population
Region
2021-22 2026-27 2031-32 2036-37Total Renal
Dialysis OOS
In-Centre 60%
Home 40%
Total Renal
Dialysis OOS
In-Centre 60%
Home 40%
Total Renal
Dialysis OOS
In-Centre 60%
Home 40%
Total Renal
Dialysis OOS
In-Centre 60%
Home 40%
Toowoomba 13,485 8,091 5,394 15,848 9,509 6,339 18,330 10,998 7,332 20,853 12,512 8,341
Darling Downs - East 4,164 2,498 1,666 4,745 2,847 1,898 5,340 3,204 2,136 5,930 3,558 2,372
Southern Downs 4,046 2,428 1,619 4,620 2,772 1,848 5,201 3,120 2,080 5,773 3,464 2,309
South Burnett 3,402 2,041 1,361 3,935 2,361 1,574 4,490 2,694 1,796 5,048 3,029 2,019
Western Downs 1,659 995 663 1,892 1,135 757 2,130 1,278 852 2,364 1,418 945
Goondiwindi 1,008 605 403 1,120 672 448 1,230 738 492 1,337 802 535
West Moreton HHS 2,157 1,294 863 2,880 1,728 1,152 3,788 2,273 1,515 4,902 2,941 1,961
South West HHS 2,771 1,663 1,108 3,190 1,914 1,276 3,607 2,164 1,443 4,023 2,414 1,609
TOTAL 32,693 19,616 13,077 38,230 22,938 15,292 44,115 26,469 17,646 50,231 30,138 20,092
2.4.2.1 Chair-Based Activity at 40 percent Home-Based Dialysis The projected chair-based activity applying the 40 percent home-based dialysis target (as per the endorsed Queensland Health guidelines) for Darling Downs Health is outlined below.
Table 35 Darling Downs Health Chair-Based (Assuming 40% In-Home Target) Renal Dialysis Separations / Occasions of Service Projections by Place of Residence, 2021/22 to 2036/37
Facility of Treatment 2021-22 2026-27 2031-32 2036-37
Kingaroy Hospital 3,665 4,245 4,847 5,452
St Andrew's Toowoomba Hospital 3,665 4,245 4,847 5,452
Toowoomba Hospital 12,286 14,448 16,775 19,234
Total 19,616 22,938 26,469 30,138
Source: Renal Dialysis Projections provided by the Department of Health, based on 2016/17 activity. Supplied by Health Service Research, Analysis and Modelling Unit, System Planning Branch, Strategy, Policy and Planning Division (SPPD). Published by the State of Queensland (Queensland Health), 2018
Successful home dialysis requires adequate training (three months) and capital funds to maintain home dialysis equipment. Some other health services in Queensland are yet to achieve consistent rates of 40 percent for home dialysis. Darling Downs Health has successfully achieved the 40 percent target for home dialysis for several years. This achievement will need to be sustained to meet future demand prior to a new hospital redevelopment. Table 36 shows the number of occasions of service projected based on only 30 percent in home care.
Table 36 Darling Downs Health Chair-Based (Assuming 30% In-Home) Renal Dialysis Separations / Occasions of Service Projections by Place of Residence, 2021/22 to 2036/37
Facility of Treatment 2021-22 2026-27 2031-32 2036-37
Kingaroy Hospital 4,276 4,953 5,655 6,361
St Andrew's Toowoomba Hospital 4,276 4,953 5,655 6,361
Toowoomba Hospital 14,334 16,856 19,571 22,439
Total 22,885 26,761 30,880 35,161
Source: Renal Dialysis Projections provided by the Department of Health, based on 2016/17 activity. Supplied by Health Service Research, Analysis and Modelling Unit, System Planning Branch, Strategy, Policy and Planning Division (SPPD). Published by the State of Queensland (Queensland Health), 2018
44
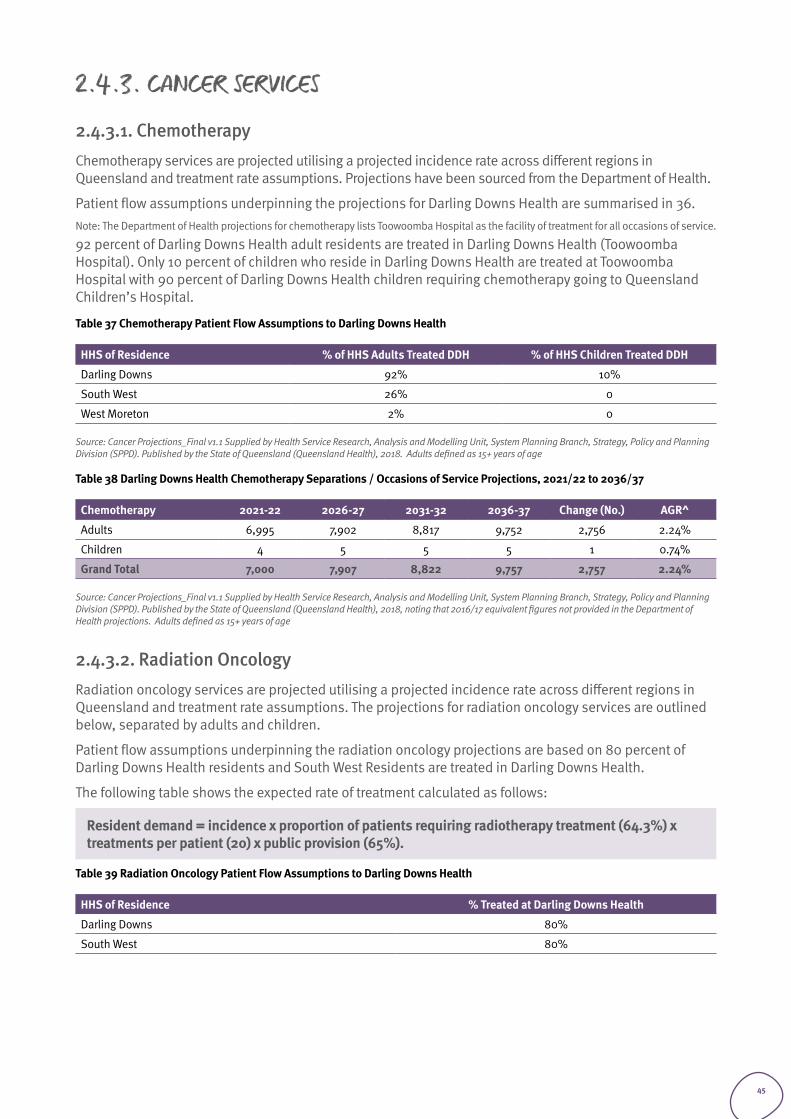
2.4.3. CANCER SERVICES
2.4.3.1. Chemotherapy Chemotherapy services are projected utilising a projected incidence rate across different regions in Queensland and treatment rate assumptions. Projections have been sourced from the Department of Health.
Patient flow assumptions underpinning the projections for Darling Downs Health are summarised in 36. Note: The Department of Health projections for chemotherapy lists Toowoomba Hospital as the facility of treatment for all occasions of service.
92 percent of Darling Downs Health adult residents are treated in Darling Downs Health (Toowoomba Hospital). Only 10 percent of children who reside in Darling Downs Health are treated at Toowoomba Hospital with 90 percent of Darling Downs Health children requiring chemotherapy going to Queensland Children’s Hospital.
Table 37 Chemotherapy Patient Flow Assumptions to Darling Downs Health
HHS of Residence % of HHS Adults Treated DDH % of HHS Children Treated DDH
Darling Downs 92% 10%
South West 26% 0
West Moreton 2% 0
Source: Cancer Projections_Final v1.1 Supplied by Health Service Research, Analysis and Modelling Unit, System Planning Branch, Strategy, Policy and Planning Division (SPPD). Published by the State of Queensland (Queensland Health), 2018. Adults defined as 15+ years of age
Table 38 Darling Downs Health Chemotherapy Separations / Occasions of Service Projections, 2021/22 to 2036/37
Chemotherapy 2021-22 2026-27 2031-32 2036-37 Change (No.) AGR^
Adults 6,995 7,902 8,817 9,752 2,756 2.24%
Children 4 5 5 5 1 0.74%
Grand Total 7,000 7,907 8,822 9,757 2,757 2.24%
Source: Cancer Projections_Final v1.1 Supplied by Health Service Research, Analysis and Modelling Unit, System Planning Branch, Strategy, Policy and Planning Division (SPPD). Published by the State of Queensland (Queensland Health), 2018, noting that 2016/17 equivalent figures not provided in the Department of Health projections. Adults defined as 15+ years of age
2.4.3.2. Radiation OncologyRadiation oncology services are projected utilising a projected incidence rate across different regions in Queensland and treatment rate assumptions. The projections for radiation oncology services are outlined below, separated by adults and children.
Patient flow assumptions underpinning the radiation oncology projections are based on 80 percent of Darling Downs Health residents and South West Residents are treated in Darling Downs Health.
The following table shows the expected rate of treatment calculated as follows:
Resident demand = incidence x proportion of patients requiring radiotherapy treatment (64.3%) x treatments per patient (20) x public provision (65%).
Table 39 Radiation Oncology Patient Flow Assumptions to Darling Downs Health
HHS of Residence % Treated at Darling Downs Health
Darling Downs 80%
South West 80%
45
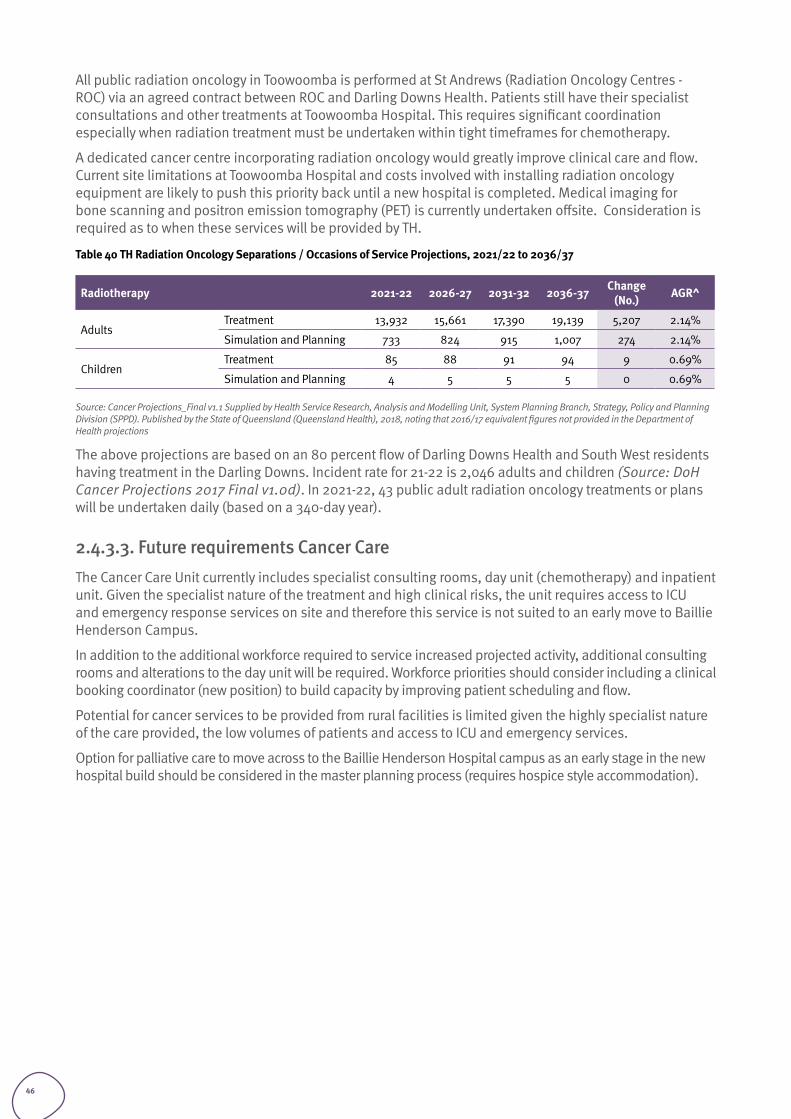
All public radiation oncology in Toowoomba is performed at St Andrews (Radiation Oncology Centres - ROC) via an agreed contract between ROC and Darling Downs Health. Patients still have their specialist consultations and other treatments at Toowoomba Hospital. This requires significant coordination especially when radiation treatment must be undertaken within tight timeframes for chemotherapy.
A dedicated cancer centre incorporating radiation oncology would greatly improve clinical care and flow. Current site limitations at Toowoomba Hospital and costs involved with installing radiation oncology equipment are likely to push this priority back until a new hospital is completed. Medical imaging for bone scanning and positron emission tomography (PET) is currently undertaken offsite. Consideration is required as to when these services will be provided by TH.
Table 40 TH Radiation Oncology Separations / Occasions of Service Projections, 2021/22 to 2036/37
Radiotherapy 2021-22 2026-27 2031-32 2036-37 Change (No.) AGR^
AdultsTreatment 13,932 15,661 17,390 19,139 5,207 2.14%
Simulation and Planning 733 824 915 1,007 274 2.14%
ChildrenTreatment 85 88 91 94 9 0.69%
Simulation and Planning 4 5 5 5 0 0.69%
Source: Cancer Projections_Final v1.1 Supplied by Health Service Research, Analysis and Modelling Unit, System Planning Branch, Strategy, Policy and Planning Division (SPPD). Published by the State of Queensland (Queensland Health), 2018, noting that 2016/17 equivalent figures not provided in the Department of Health projections
The above projections are based on an 80 percent flow of Darling Downs Health and South West residents having treatment in the Darling Downs. Incident rate for 21-22 is 2,046 adults and children (Source: DoH Cancer Projections 2017 Final v1.0d). In 2021-22, 43 public adult radiation oncology treatments or plans will be undertaken daily (based on a 340-day year).
2.4.3.3. Future requirements Cancer CareThe Cancer Care Unit currently includes specialist consulting rooms, day unit (chemotherapy) and inpatient unit. Given the specialist nature of the treatment and high clinical risks, the unit requires access to ICU and emergency response services on site and therefore this service is not suited to an early move to Baillie Henderson Campus.
In addition to the additional workforce required to service increased projected activity, additional consulting rooms and alterations to the day unit will be required. Workforce priorities should consider including a clinical booking coordinator (new position) to build capacity by improving patient scheduling and flow.
Potential for cancer services to be provided from rural facilities is limited given the highly specialist nature of the care provided, the low volumes of patients and access to ICU and emergency services.
Option for palliative care to move across to the Baillie Henderson Hospital campus as an early stage in the new hospital build should be considered in the master planning process (requires hospice style accommodation).
46
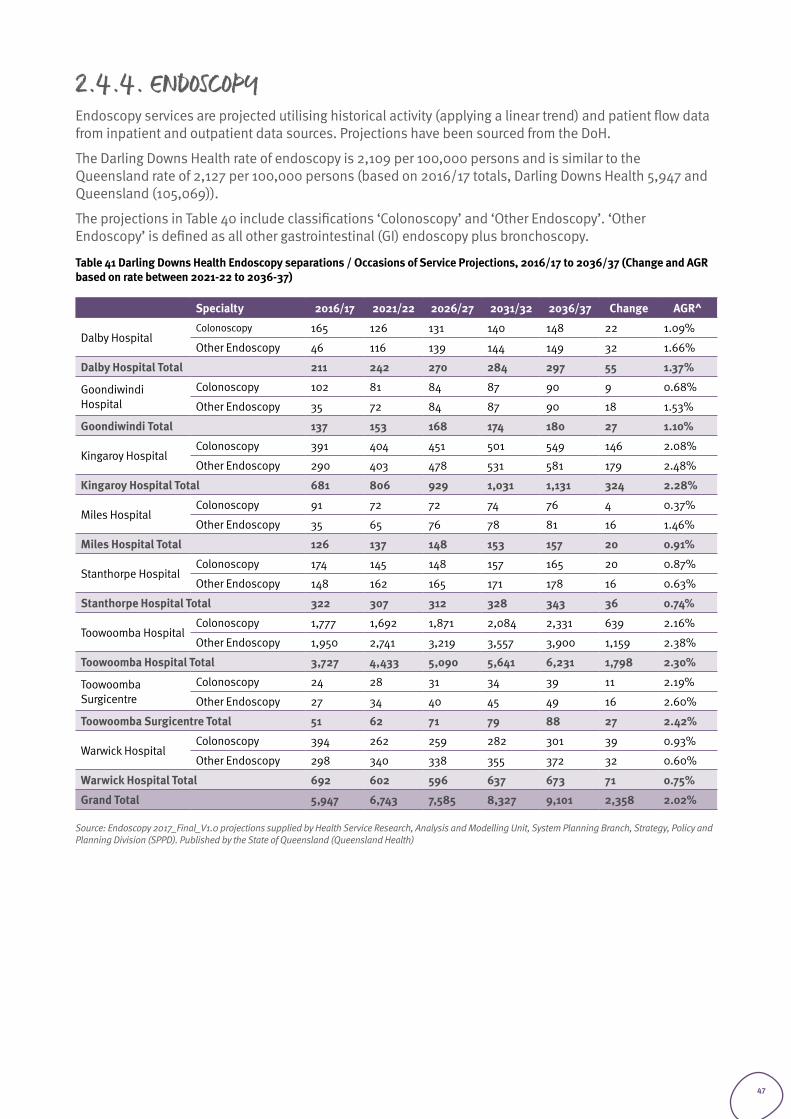
2.4.4. ENDOSCOPYEndoscopy services are projected utilising historical activity (applying a linear trend) and patient flow data from inpatient and outpatient data sources. Projections have been sourced from the DoH.
The Darling Downs Health rate of endoscopy is 2,109 per 100,000 persons and is similar to the Queensland rate of 2,127 per 100,000 persons (based on 2016/17 totals, Darling Downs Health 5,947 and Queensland (105,069)).
The projections in Table 40 include classifications ‘Colonoscopy’ and ‘Other Endoscopy’. ‘Other Endoscopy’ is defined as all other gastrointestinal (GI) endoscopy plus bronchoscopy.
Table 41 Darling Downs Health Endoscopy separations / Occasions of Service Projections, 2016/17 to 2036/37 (Change and AGR based on rate between 2021-22 to 2036-37)
Specialty 2016/17 2021/22 2026/27 2031/32 2036/37 Change AGR^
Dalby HospitalColonoscopy 165 126 131 140 148 22 1.09%
Other Endoscopy 46 116 139 144 149 32 1.66%
Dalby Hospital Total 211 242 270 284 297 55 1.37%
Goondiwindi Hospital
Colonoscopy 102 81 84 87 90 9 0.68%
Other Endoscopy 35 72 84 87 90 18 1.53%
Goondiwindi Total 137 153 168 174 180 27 1.10%
Kingaroy HospitalColonoscopy 391 404 451 501 549 146 2.08%
Other Endoscopy 290 403 478 531 581 179 2.48%
Kingaroy Hospital Total 681 806 929 1,031 1,131 324 2.28%
Miles HospitalColonoscopy 91 72 72 74 76 4 0.37%
Other Endoscopy 35 65 76 78 81 16 1.46%
Miles Hospital Total 126 137 148 153 157 20 0.91%
Stanthorpe HospitalColonoscopy 174 145 148 157 165 20 0.87%
Other Endoscopy 148 162 165 171 178 16 0.63%
Stanthorpe Hospital Total 322 307 312 328 343 36 0.74%
Toowoomba HospitalColonoscopy 1,777 1,692 1,871 2,084 2,331 639 2.16%
Other Endoscopy 1,950 2,741 3,219 3,557 3,900 1,159 2.38%
Toowoomba Hospital Total 3,727 4,433 5,090 5,641 6,231 1,798 2.30%
Toowoomba Surgicentre
Colonoscopy 24 28 31 34 39 11 2.19%
Other Endoscopy 27 34 40 45 49 16 2.60%
Toowoomba Surgicentre Total 51 62 71 79 88 27 2.42%
Warwick HospitalColonoscopy 394 262 259 282 301 39 0.93%
Other Endoscopy 298 340 338 355 372 32 0.60%
Warwick Hospital Total 692 602 596 637 673 71 0.75%
Grand Total 5,947 6,743 7,585 8,327 9,101 2,358 2.02%
Source: Endoscopy 2017_Final_V1.0 projections supplied by Health Service Research, Analysis and Modelling Unit, System Planning Branch, Strategy, Policy and Planning Division (SPPD). Published by the State of Queensland (Queensland Health)
47
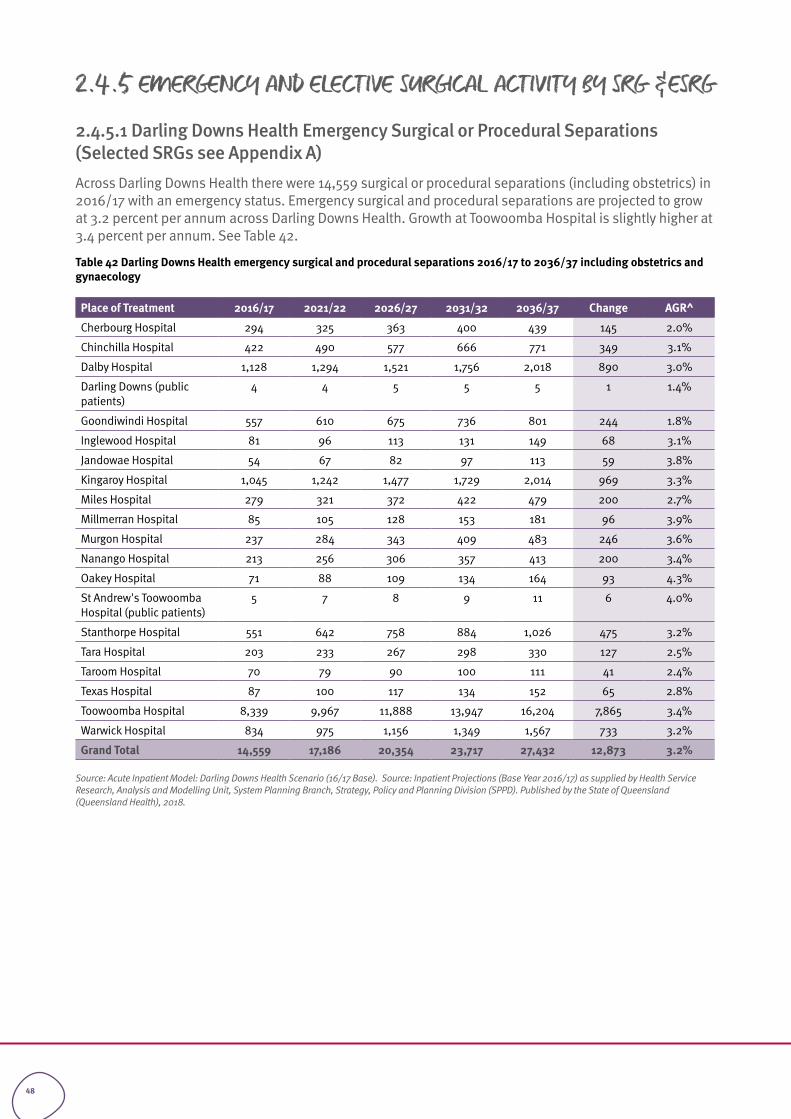
2.4.5 EMERGENCY AND ELECTIVE SURGICAL ACTIVITY BY SRG &ESRG
2.4.5.1 Darling Downs Health Emergency Surgical or Procedural Separations (Selected SRGs see Appendix A)Across Darling Downs Health there were 14,559 surgical or procedural separations (including obstetrics) in 2016/17 with an emergency status. Emergency surgical and procedural separations are projected to grow at 3.2 percent per annum across Darling Downs Health. Growth at Toowoomba Hospital is slightly higher at 3.4 percent per annum. See Table 42.
Table 42 Darling Downs Health emergency surgical and procedural separations 2016/17 to 2036/37 including obstetrics and gynaecology
Place of Treatment 2016/17 2021/22 2026/27 2031/32 2036/37 Change AGR^
Cherbourg Hospital 294 325 363 400 439 145 2.0%
Chinchilla Hospital 422 490 577 666 771 349 3.1%
Dalby Hospital 1,128 1,294 1,521 1,756 2,018 890 3.0%
Darling Downs (public patients)
4 4 5 5 5 1 1.4%
Goondiwindi Hospital 557 610 675 736 801 244 1.8%
Inglewood Hospital 81 96 113 131 149 68 3.1%
Jandowae Hospital 54 67 82 97 113 59 3.8%
Kingaroy Hospital 1,045 1,242 1,477 1,729 2,014 969 3.3%
Miles Hospital 279 321 372 422 479 200 2.7%
Millmerran Hospital 85 105 128 153 181 96 3.9%
Murgon Hospital 237 284 343 409 483 246 3.6%
Nanango Hospital 213 256 306 357 413 200 3.4%
Oakey Hospital 71 88 109 134 164 93 4.3%
St Andrew's Toowoomba Hospital (public patients)
5 7 8 9 11 6 4.0%
Stanthorpe Hospital 551 642 758 884 1,026 475 3.2%
Tara Hospital 203 233 267 298 330 127 2.5%
Taroom Hospital 70 79 90 100 111 41 2.4%
Texas Hospital 87 100 117 134 152 65 2.8%
Toowoomba Hospital 8,339 9,967 11,888 13,947 16,204 7,865 3.4%
Warwick Hospital 834 975 1,156 1,349 1,567 733 3.2%
Grand Total 14,559 17,186 20,354 23,717 27,432 12,873 3.2%
Source: Acute Inpatient Model: Darling Downs Health Scenario (16/17 Base). Source: Inpatient Projections (Base Year 2016/17) as supplied by Health Service Research, Analysis and Modelling Unit, System Planning Branch, Strategy, Policy and Planning Division (SPPD). Published by the State of Queensland (Queensland Health), 2018.
48
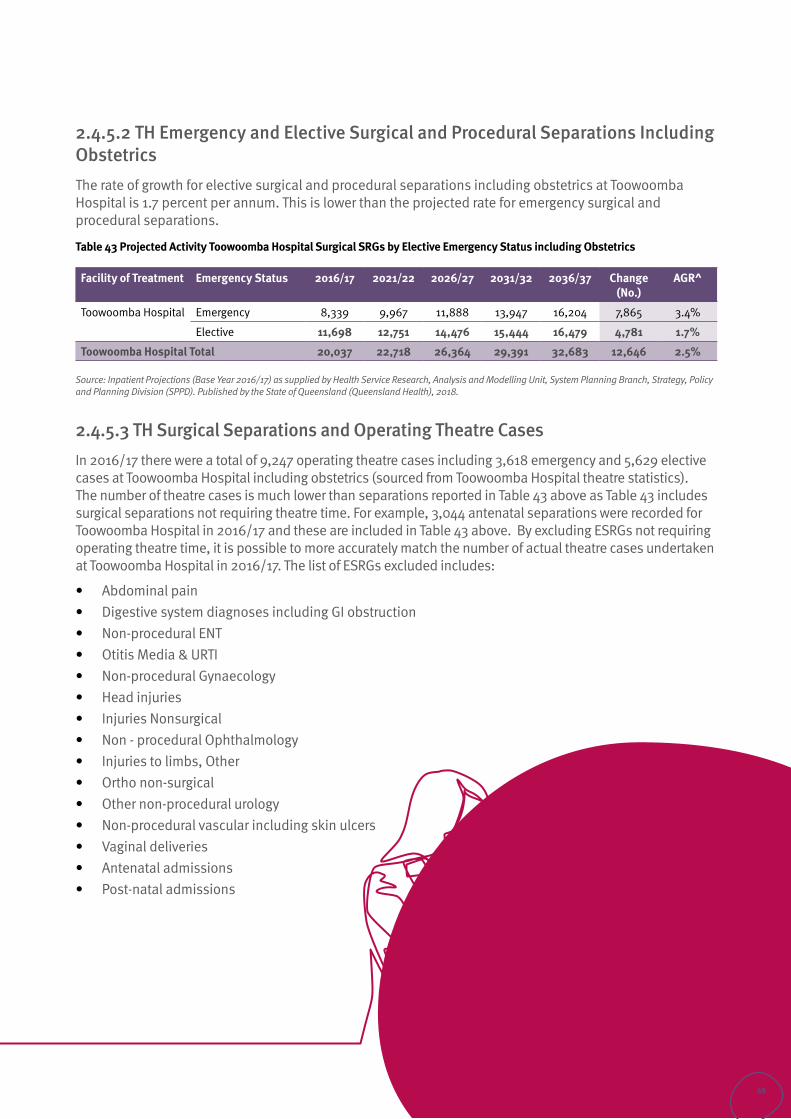
2.4.5.2 TH Emergency and Elective Surgical and Procedural Separations Including ObstetricsThe rate of growth for elective surgical and procedural separations including obstetrics at Toowoomba Hospital is 1.7 percent per annum. This is lower than the projected rate for emergency surgical and procedural separations.
Table 43 Projected Activity Toowoomba Hospital Surgical SRGs by Elective Emergency Status including Obstetrics
Facility of Treatment Emergency Status 2016/17 2021/22 2026/27 2031/32 2036/37 Change (No.)
AGR^
Toowoomba Hospital Emergency 8,339 9,967 11,888 13,947 16,204 7,865 3.4%
Elective 11,698 12,751 14,476 15,444 16,479 4,781 1.7%
Toowoomba Hospital Total 20,037 22,718 26,364 29,391 32,683 12,646 2.5%
Source: Inpatient Projections (Base Year 2016/17) as supplied by Health Service Research, Analysis and Modelling Unit, System Planning Branch, Strategy, Policy and Planning Division (SPPD). Published by the State of Queensland (Queensland Health), 2018.
2.4.5.3 TH Surgical Separations and Operating Theatre CasesIn 2016/17 there were a total of 9,247 operating theatre cases including 3,618 emergency and 5,629 elective cases at Toowoomba Hospital including obstetrics (sourced from Toowoomba Hospital theatre statistics). The number of theatre cases is much lower than separations reported in Table 43 above as Table 43 includes surgical separations not requiring theatre time. For example, 3,044 antenatal separations were recorded for Toowoomba Hospital in 2016/17 and these are included in Table 43 above. By excluding ESRGs not requiring operating theatre time, it is possible to more accurately match the number of actual theatre cases undertaken at Toowoomba Hospital in 2016/17. The list of ESRGs excluded includes:
• Abdominal pain• Digestive system diagnoses including GI obstruction• Non-procedural ENT • Otitis Media & URTI • Non-procedural Gynaecology • Head injuries• Injuries Nonsurgical • Non - procedural Ophthalmology• Injuries to limbs, Other • Ortho non-surgical • Other non-procedural urology • Non-procedural vascular including skin ulcers• Vaginal deliveries• Antenatal admissions• Post-natal admissions
49
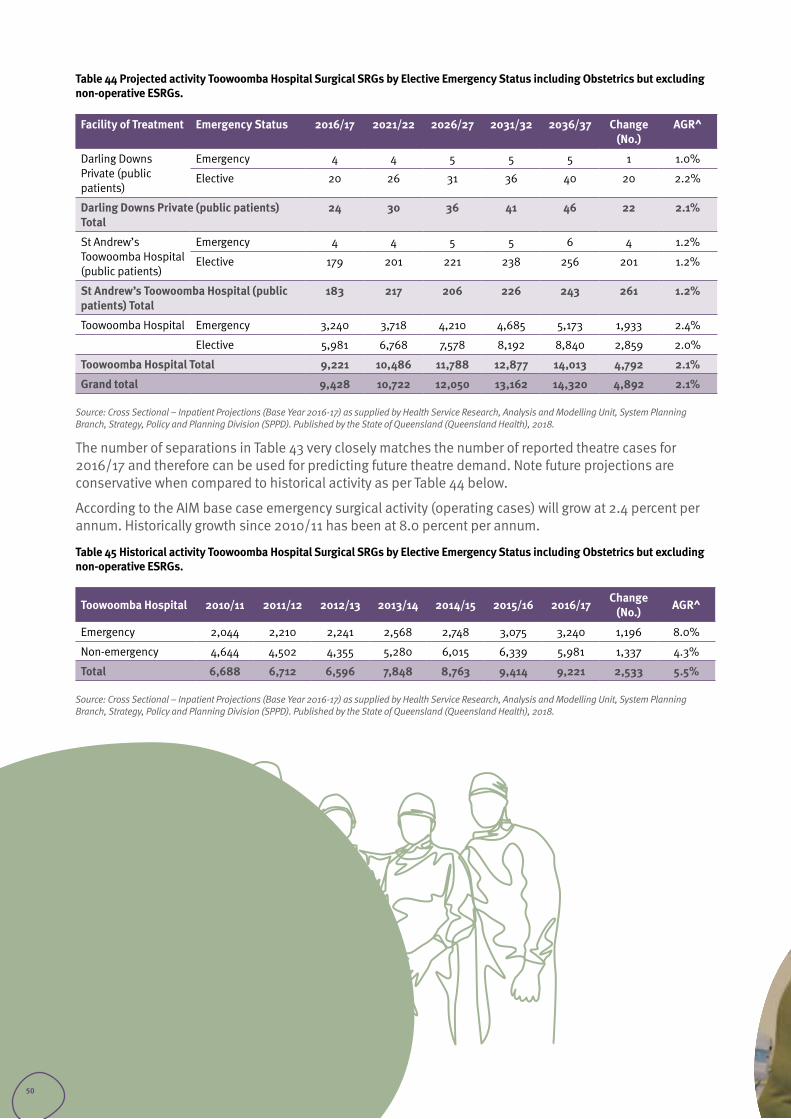
Table 44 Projected activity Toowoomba Hospital Surgical SRGs by Elective Emergency Status including Obstetrics but excluding non-operative ESRGs.
Facility of Treatment Emergency Status 2016/17 2021/22 2026/27 2031/32 2036/37 Change (No.)
AGR^
Darling Downs Private (public patients)
Emergency 4 4 5 5 5 1 1.0%
Elective 20 26 31 36 40 20 2.2%
Darling Downs Private (public patients) Total
24 30 36 41 46 22 2.1%
St Andrew’s Toowoomba Hospital (public patients)
Emergency 4 4 5 5 6 4 1.2%
Elective 179 201 221 238 256 201 1.2%
St Andrew’s Toowoomba Hospital (public patients) Total
183 217 206 226 243 261 1.2%
Toowoomba Hospital Emergency 3,240 3,718 4,210 4,685 5,173 1,933 2.4%
Elective 5,981 6,768 7,578 8,192 8,840 2,859 2.0%
Toowoomba Hospital Total 9,221 10,486 11,788 12,877 14,013 4,792 2.1%
Grand total 9,428 10,722 12,050 13,162 14,320 4,892 2.1%
Source: Cross Sectional – Inpatient Projections (Base Year 2016-17) as supplied by Health Service Research, Analysis and Modelling Unit, System Planning Branch, Strategy, Policy and Planning Division (SPPD). Published by the State of Queensland (Queensland Health), 2018.
The number of separations in Table 43 very closely matches the number of reported theatre cases for 2016/17 and therefore can be used for predicting future theatre demand. Note future projections are conservative when compared to historical activity as per Table 44 below.
According to the AIM base case emergency surgical activity (operating cases) will grow at 2.4 percent per annum. Historically growth since 2010/11 has been at 8.0 percent per annum.
Table 45 Historical activity Toowoomba Hospital Surgical SRGs by Elective Emergency Status including Obstetrics but excluding non-operative ESRGs.
Toowoomba Hospital 2010/11 2011/12 2012/13 2013/14 2014/15 2015/16 2016/17 Change (No.) AGR^
Emergency 2,044 2,210 2,241 2,568 2,748 3,075 3,240 1,196 8.0%
Non-emergency 4,644 4,502 4,355 5,280 6,015 6,339 5,981 1,337 4.3%
Total 6,688 6,712 6,596 7,848 8,763 9,414 9,221 2,533 5.5%
Source: Cross Sectional – Inpatient Projections (Base Year 2016-17) as supplied by Health Service Research, Analysis and Modelling Unit, System Planning Branch, Strategy, Policy and Planning Division (SPPD). Published by the State of Queensland (Queensland Health), 2018.
50
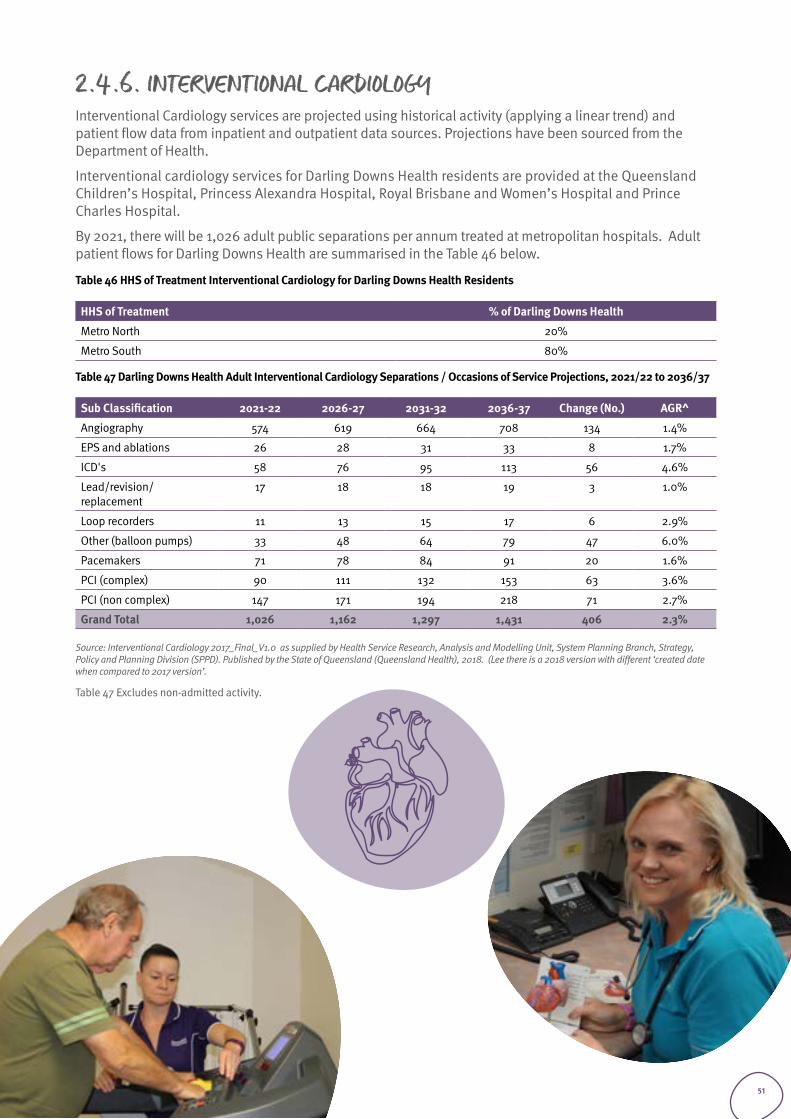
2.4.6. INTERVENTIONAL CARDIOLOGYInterventional Cardiology services are projected using historical activity (applying a linear trend) and patient flow data from inpatient and outpatient data sources. Projections have been sourced from the Department of Health.
Interventional cardiology services for Darling Downs Health residents are provided at the Queensland Children’s Hospital, Princess Alexandra Hospital, Royal Brisbane and Women’s Hospital and Prince Charles Hospital.
By 2021, there will be 1,026 adult public separations per annum treated at metropolitan hospitals. Adult patient flows for Darling Downs Health are summarised in the Table 46 below.
Table 46 HHS of Treatment Interventional Cardiology for Darling Downs Health Residents
HHS of Treatment % of Darling Downs Health
Metro North 20%
Metro South 80%
Table 47 Darling Downs Health Adult Interventional Cardiology Separations / Occasions of Service Projections, 2021/22 to 2036/37
Sub Classification 2021-22 2026-27 2031-32 2036-37 Change (No.) AGR^
Angiography 574 619 664 708 134 1.4%
EPS and ablations 26 28 31 33 8 1.7%
ICD's 58 76 95 113 56 4.6%
Lead/revision/replacement
17 18 18 19 3 1.0%
Loop recorders 11 13 15 17 6 2.9%
Other (balloon pumps) 33 48 64 79 47 6.0%
Pacemakers 71 78 84 91 20 1.6%
PCI (complex) 90 111 132 153 63 3.6%
PCI (non complex) 147 171 194 218 71 2.7%
Grand Total 1,026 1,162 1,297 1,431 406 2.3%
Source: Interventional Cardiology 2017_Final_V1.0 as supplied by Health Service Research, Analysis and Modelling Unit, System Planning Branch, Strategy, Policy and Planning Division (SPPD). Published by the State of Queensland (Queensland Health), 2018. (Lee there is a 2018 version with different ‘created date when compared to 2017 version’.
Table 47 Excludes non-admitted activity.
51
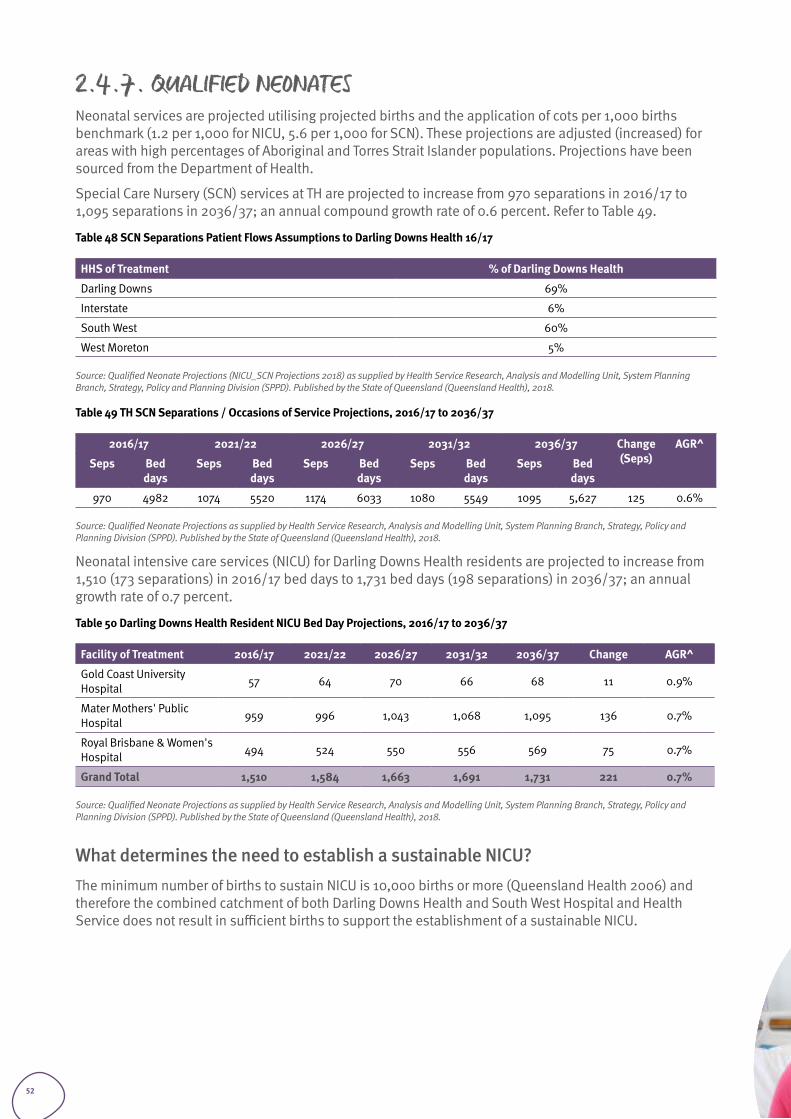
2.4.7. QUALIFIED NEONATESNeonatal services are projected utilising projected births and the application of cots per 1,000 births benchmark (1.2 per 1,000 for NICU, 5.6 per 1,000 for SCN). These projections are adjusted (increased) for areas with high percentages of Aboriginal and Torres Strait Islander populations. Projections have been sourced from the Department of Health.
Special Care Nursery (SCN) services at TH are projected to increase from 970 separations in 2016/17 to 1,095 separations in 2036/37; an annual compound growth rate of 0.6 percent. Refer to Table 49.
Table 48 SCN Separations Patient Flows Assumptions to Darling Downs Health 16/17
HHS of Treatment % of Darling Downs Health
Darling Downs 69%
Interstate 6%
South West 60%
West Moreton 5%
Source: Qualified Neonate Projections (NICU_SCN Projections 2018) as supplied by Health Service Research, Analysis and Modelling Unit, System Planning Branch, Strategy, Policy and Planning Division (SPPD). Published by the State of Queensland (Queensland Health), 2018.
Table 49 TH SCN Separations / Occasions of Service Projections, 2016/17 to 2036/37
2016/17 2021/22 2026/27 2031/32 2036/37 Change (Seps)
AGR^
Seps Bed days
Seps Bed days
Seps Bed days
Seps Bed days
Seps Bed days
970 4982 1074 5520 1174 6033 1080 5549 1095 5,627 125 0.6%
Source: Qualified Neonate Projections as supplied by Health Service Research, Analysis and Modelling Unit, System Planning Branch, Strategy, Policy and Planning Division (SPPD). Published by the State of Queensland (Queensland Health), 2018.
Neonatal intensive care services (NICU) for Darling Downs Health residents are projected to increase from 1,510 (173 separations) in 2016/17 bed days to 1,731 bed days (198 separations) in 2036/37; an annual growth rate of 0.7 percent.
Table 50 Darling Downs Health Resident NICU Bed Day Projections, 2016/17 to 2036/37
Facility of Treatment 2016/17 2021/22 2026/27 2031/32 2036/37 Change AGR^
Gold Coast University Hospital 57 64 70 66 68 11 0.9%
Mater Mothers' Public Hospital 959 996 1,043 1,068 1,095 136 0.7%
Royal Brisbane & Women's Hospital 494 524 550 556 569 75 0.7%
Grand Total 1,510 1,584 1,663 1,691 1,731 221 0.7%
Source: Qualified Neonate Projections as supplied by Health Service Research, Analysis and Modelling Unit, System Planning Branch, Strategy, Policy and Planning Division (SPPD). Published by the State of Queensland (Queensland Health), 2018.
What determines the need to establish a sustainable NICU?The minimum number of births to sustain NICU is 10,000 births or more (Queensland Health 2006) and therefore the combined catchment of both Darling Downs Health and South West Hospital and Health Service does not result in sufficient births to support the establishment of a sustainable NICU.
52
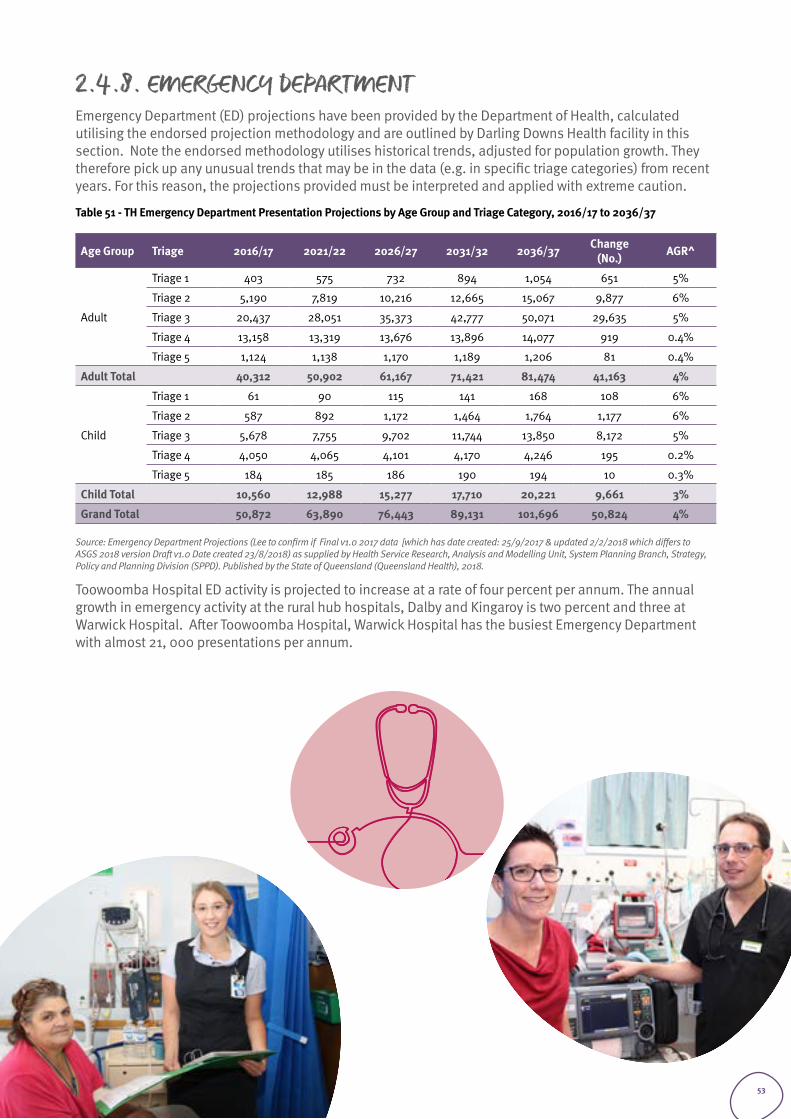
2.4.8. EMERGENCY DEPARTMENTEmergency Department (ED) projections have been provided by the Department of Health, calculated utilising the endorsed projection methodology and are outlined by Darling Downs Health facility in this section. Note the endorsed methodology utilises historical trends, adjusted for population growth. They therefore pick up any unusual trends that may be in the data (e.g. in specific triage categories) from recent years. For this reason, the projections provided must be interpreted and applied with extreme caution.
Table 51 - TH Emergency Department Presentation Projections by Age Group and Triage Category, 2016/17 to 2036/37
Age Group Triage 2016/17 2021/22 2026/27 2031/32 2036/37 Change (No.) AGR^
Adult
Triage 1 403 575 732 894 1,054 651 5%
Triage 2 5,190 7,819 10,216 12,665 15,067 9,877 6%
Triage 3 20,437 28,051 35,373 42,777 50,071 29,635 5%
Triage 4 13,158 13,319 13,676 13,896 14,077 919 0.4%
Triage 5 1,124 1,138 1,170 1,189 1,206 81 0.4%
Adult Total 40,312 50,902 61,167 71,421 81,474 41,163 4%
Child
Triage 1 61 90 115 141 168 108 6%
Triage 2 587 892 1,172 1,464 1,764 1,177 6%
Triage 3 5,678 7,755 9,702 11,744 13,850 8,172 5%
Triage 4 4,050 4,065 4,101 4,170 4,246 195 0.2%
Triage 5 184 185 186 190 194 10 0.3%
Child Total 10,560 12,988 15,277 17,710 20,221 9,661 3%
Grand Total 50,872 63,890 76,443 89,131 101,696 50,824 4%
Source: Emergency Department Projections (Lee to confirm if Final v1.0 2017 data [which has date created: 25/9/2017 & updated 2/2/2018 which differs to ASGS 2018 version Draft v1.0 Date created 23/8/2018) as supplied by Health Service Research, Analysis and Modelling Unit, System Planning Branch, Strategy, Policy and Planning Division (SPPD). Published by the State of Queensland (Queensland Health), 2018.
Toowoomba Hospital ED activity is projected to increase at a rate of four percent per annum. The annual growth in emergency activity at the rural hub hospitals, Dalby and Kingaroy is two percent and three at Warwick Hospital. After Toowoomba Hospital, Warwick Hospital has the busiest Emergency Department with almost 21, 000 presentations per annum.
53
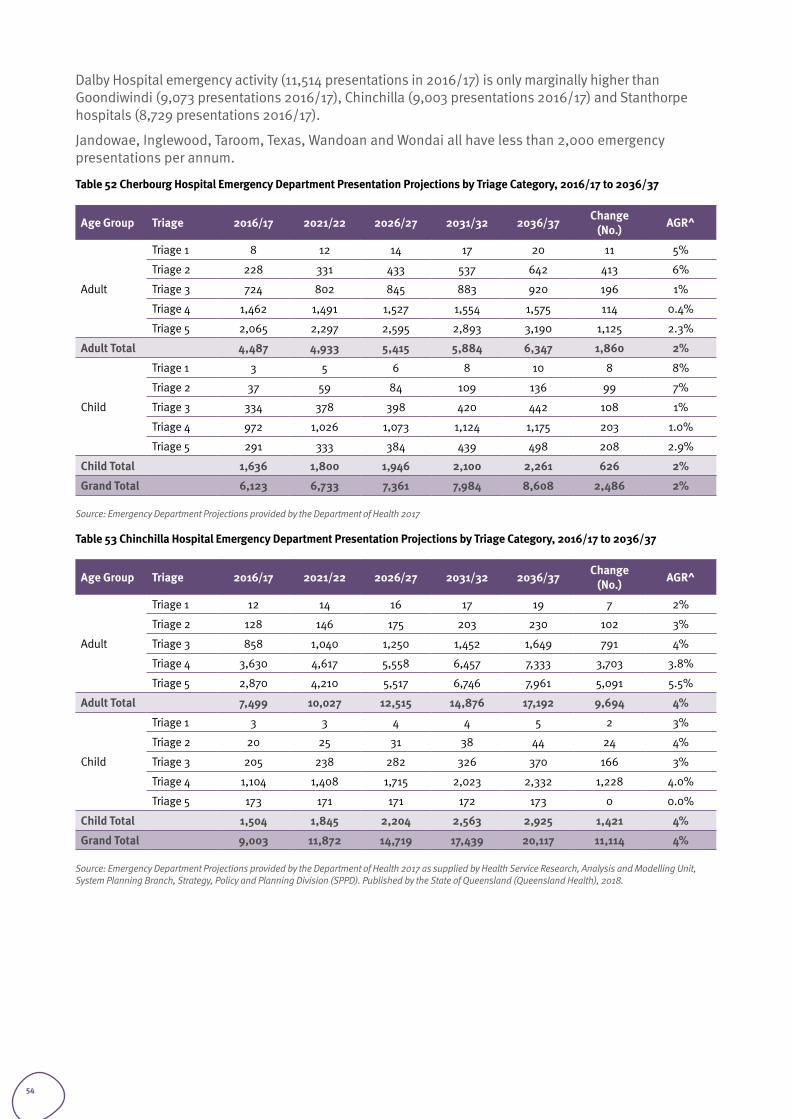
Dalby Hospital emergency activity (11,514 presentations in 2016/17) is only marginally higher than Goondiwindi (9,073 presentations 2016/17), Chinchilla (9,003 presentations 2016/17) and Stanthorpe hospitals (8,729 presentations 2016/17).
Jandowae, Inglewood, Taroom, Texas, Wandoan and Wondai all have less than 2,000 emergency presentations per annum.
Table 52 Cherbourg Hospital Emergency Department Presentation Projections by Triage Category, 2016/17 to 2036/37
Age Group Triage 2016/17 2021/22 2026/27 2031/32 2036/37 Change (No.) AGR^
Adult
Triage 1 8 12 14 17 20 11 5%
Triage 2 228 331 433 537 642 413 6%
Triage 3 724 802 845 883 920 196 1%
Triage 4 1,462 1,491 1,527 1,554 1,575 114 0.4%
Triage 5 2,065 2,297 2,595 2,893 3,190 1,125 2.3%
Adult Total 4,487 4,933 5,415 5,884 6,347 1,860 2%
Child
Triage 1 3 5 6 8 10 8 8%
Triage 2 37 59 84 109 136 99 7%
Triage 3 334 378 398 420 442 108 1%
Triage 4 972 1,026 1,073 1,124 1,175 203 1.0%
Triage 5 291 333 384 439 498 208 2.9%
Child Total 1,636 1,800 1,946 2,100 2,261 626 2%
Grand Total 6,123 6,733 7,361 7,984 8,608 2,486 2%
Source: Emergency Department Projections provided by the Department of Health 2017
Table 53 Chinchilla Hospital Emergency Department Presentation Projections by Triage Category, 2016/17 to 2036/37
Age Group Triage 2016/17 2021/22 2026/27 2031/32 2036/37 Change (No.) AGR^
Adult
Triage 1 12 14 16 17 19 7 2%
Triage 2 128 146 175 203 230 102 3%
Triage 3 858 1,040 1,250 1,452 1,649 791 4%
Triage 4 3,630 4,617 5,558 6,457 7,333 3,703 3.8%
Triage 5 2,870 4,210 5,517 6,746 7,961 5,091 5.5%
Adult Total 7,499 10,027 12,515 14,876 17,192 9,694 4%
Child
Triage 1 3 3 4 4 5 2 3%
Triage 2 20 25 31 38 44 24 4%
Triage 3 205 238 282 326 370 166 3%
Triage 4 1,104 1,408 1,715 2,023 2,332 1,228 4.0%
Triage 5 173 171 171 172 173 0 0.0%
Child Total 1,504 1,845 2,204 2,563 2,925 1,421 4%
Grand Total 9,003 11,872 14,719 17,439 20,117 11,114 4%
Source: Emergency Department Projections provided by the Department of Health 2017 as supplied by Health Service Research, Analysis and Modelling Unit, System Planning Branch, Strategy, Policy and Planning Division (SPPD). Published by the State of Queensland (Queensland Health), 2018.
54
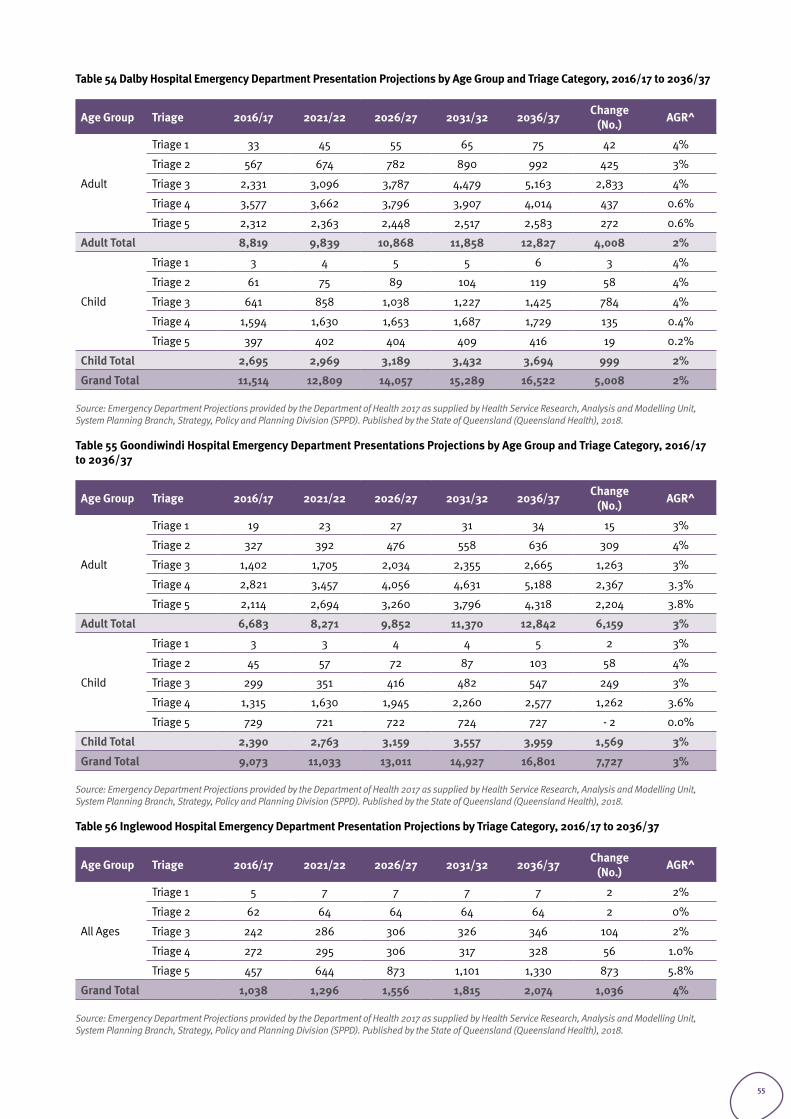
Table 54 Dalby Hospital Emergency Department Presentation Projections by Age Group and Triage Category, 2016/17 to 2036/37
Age Group Triage 2016/17 2021/22 2026/27 2031/32 2036/37 Change (No.) AGR^
Adult
Triage 1 33 45 55 65 75 42 4%
Triage 2 567 674 782 890 992 425 3%
Triage 3 2,331 3,096 3,787 4,479 5,163 2,833 4%
Triage 4 3,577 3,662 3,796 3,907 4,014 437 0.6%
Triage 5 2,312 2,363 2,448 2,517 2,583 272 0.6%
Adult Total 8,819 9,839 10,868 11,858 12,827 4,008 2%
Child
Triage 1 3 4 5 5 6 3 4%
Triage 2 61 75 89 104 119 58 4%
Triage 3 641 858 1,038 1,227 1,425 784 4%
Triage 4 1,594 1,630 1,653 1,687 1,729 135 0.4%
Triage 5 397 402 404 409 416 19 0.2%
Child Total 2,695 2,969 3,189 3,432 3,694 999 2%
Grand Total 11,514 12,809 14,057 15,289 16,522 5,008 2%
Source: Emergency Department Projections provided by the Department of Health 2017 as supplied by Health Service Research, Analysis and Modelling Unit, System Planning Branch, Strategy, Policy and Planning Division (SPPD). Published by the State of Queensland (Queensland Health), 2018.
Table 55 Goondiwindi Hospital Emergency Department Presentations Projections by Age Group and Triage Category, 2016/17 to 2036/37
Age Group Triage 2016/17 2021/22 2026/27 2031/32 2036/37 Change (No.) AGR^
Adult
Triage 1 19 23 27 31 34 15 3%
Triage 2 327 392 476 558 636 309 4%
Triage 3 1,402 1,705 2,034 2,355 2,665 1,263 3%
Triage 4 2,821 3,457 4,056 4,631 5,188 2,367 3.3%
Triage 5 2,114 2,694 3,260 3,796 4,318 2,204 3.8%
Adult Total 6,683 8,271 9,852 11,370 12,842 6,159 3%
Child
Triage 1 3 3 4 4 5 2 3%
Triage 2 45 57 72 87 103 58 4%
Triage 3 299 351 416 482 547 249 3%
Triage 4 1,315 1,630 1,945 2,260 2,577 1,262 3.6%
Triage 5 729 721 722 724 727 - 2 0.0%
Child Total 2,390 2,763 3,159 3,557 3,959 1,569 3%
Grand Total 9,073 11,033 13,011 14,927 16,801 7,727 3%
Source: Emergency Department Projections provided by the Department of Health 2017 as supplied by Health Service Research, Analysis and Modelling Unit, System Planning Branch, Strategy, Policy and Planning Division (SPPD). Published by the State of Queensland (Queensland Health), 2018.
Table 56 Inglewood Hospital Emergency Department Presentation Projections by Triage Category, 2016/17 to 2036/37
Age Group Triage 2016/17 2021/22 2026/27 2031/32 2036/37 Change (No.) AGR^
All Ages
Triage 1 5 7 7 7 7 2 2%
Triage 2 62 64 64 64 64 2 0%
Triage 3 242 286 306 326 346 104 2%
Triage 4 272 295 306 317 328 56 1.0%
Triage 5 457 644 873 1,101 1,330 873 5.8%
Grand Total 1,038 1,296 1,556 1,815 2,074 1,036 4%
Source: Emergency Department Projections provided by the Department of Health 2017 as supplied by Health Service Research, Analysis and Modelling Unit, System Planning Branch, Strategy, Policy and Planning Division (SPPD). Published by the State of Queensland (Queensland Health), 2018.
55
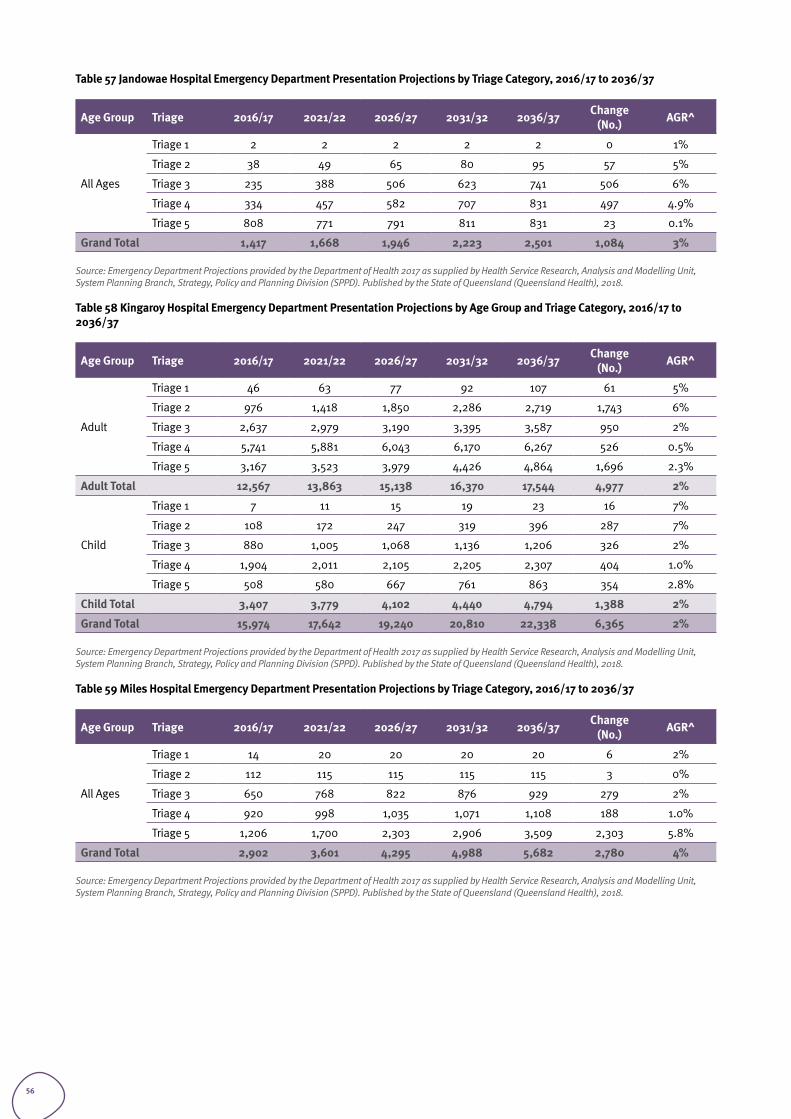
Table 57 Jandowae Hospital Emergency Department Presentation Projections by Triage Category, 2016/17 to 2036/37
Age Group Triage 2016/17 2021/22 2026/27 2031/32 2036/37 Change (No.) AGR^
All Ages
Triage 1 2 2 2 2 2 0 1%
Triage 2 38 49 65 80 95 57 5%
Triage 3 235 388 506 623 741 506 6%
Triage 4 334 457 582 707 831 497 4.9%
Triage 5 808 771 791 811 831 23 0.1%
Grand Total 1,417 1,668 1,946 2,223 2,501 1,084 3%
Source: Emergency Department Projections provided by the Department of Health 2017 as supplied by Health Service Research, Analysis and Modelling Unit, System Planning Branch, Strategy, Policy and Planning Division (SPPD). Published by the State of Queensland (Queensland Health), 2018.
Table 58 Kingaroy Hospital Emergency Department Presentation Projections by Age Group and Triage Category, 2016/17 to 2036/37
Age Group Triage 2016/17 2021/22 2026/27 2031/32 2036/37 Change (No.) AGR^
Adult
Triage 1 46 63 77 92 107 61 5%
Triage 2 976 1,418 1,850 2,286 2,719 1,743 6%
Triage 3 2,637 2,979 3,190 3,395 3,587 950 2%
Triage 4 5,741 5,881 6,043 6,170 6,267 526 0.5%
Triage 5 3,167 3,523 3,979 4,426 4,864 1,696 2.3%
Adult Total 12,567 13,863 15,138 16,370 17,544 4,977 2%
Child
Triage 1 7 11 15 19 23 16 7%
Triage 2 108 172 247 319 396 287 7%
Triage 3 880 1,005 1,068 1,136 1,206 326 2%
Triage 4 1,904 2,011 2,105 2,205 2,307 404 1.0%
Triage 5 508 580 667 761 863 354 2.8%
Child Total 3,407 3,779 4,102 4,440 4,794 1,388 2%
Grand Total 15,974 17,642 19,240 20,810 22,338 6,365 2%
Source: Emergency Department Projections provided by the Department of Health 2017 as supplied by Health Service Research, Analysis and Modelling Unit, System Planning Branch, Strategy, Policy and Planning Division (SPPD). Published by the State of Queensland (Queensland Health), 2018.
Table 59 Miles Hospital Emergency Department Presentation Projections by Triage Category, 2016/17 to 2036/37
Age Group Triage 2016/17 2021/22 2026/27 2031/32 2036/37 Change (No.) AGR^
All Ages
Triage 1 14 20 20 20 20 6 2%
Triage 2 112 115 115 115 115 3 0%
Triage 3 650 768 822 876 929 279 2%
Triage 4 920 998 1,035 1,071 1,108 188 1.0%
Triage 5 1,206 1,700 2,303 2,906 3,509 2,303 5.8%
Grand Total 2,902 3,601 4,295 4,988 5,682 2,780 4%
Source: Emergency Department Projections provided by the Department of Health 2017 as supplied by Health Service Research, Analysis and Modelling Unit, System Planning Branch, Strategy, Policy and Planning Division (SPPD). Published by the State of Queensland (Queensland Health), 2018.
56
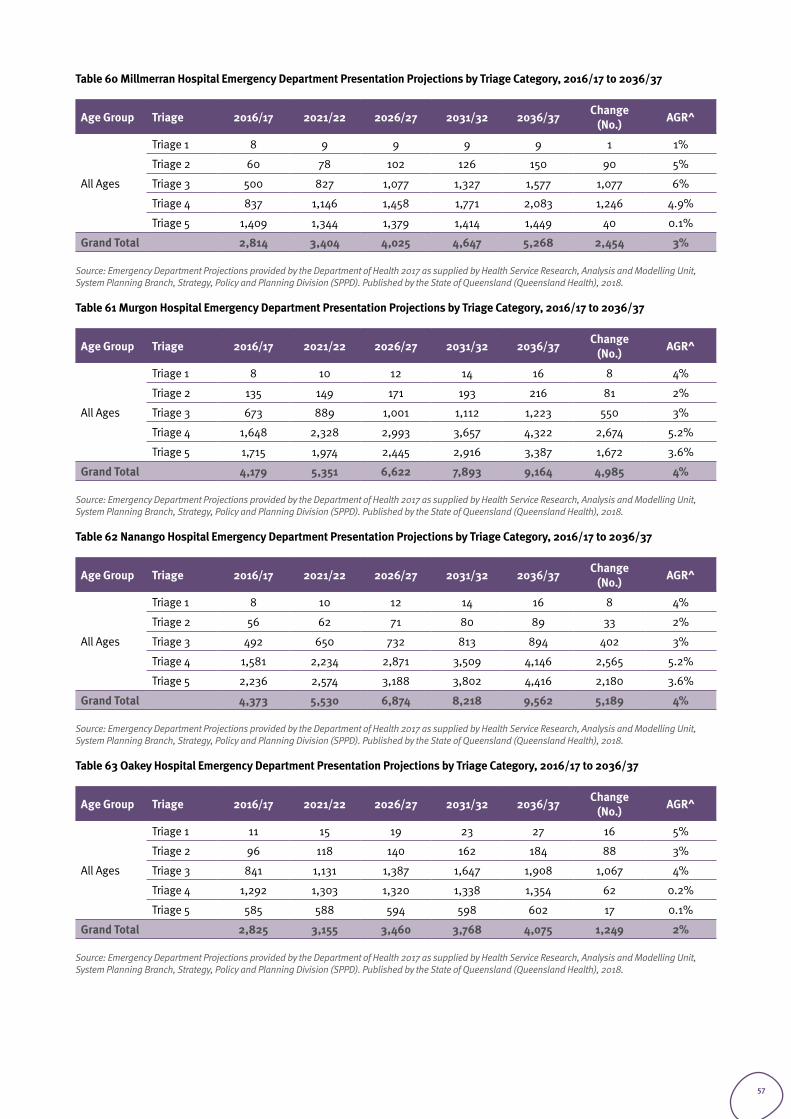
Table 60 Millmerran Hospital Emergency Department Presentation Projections by Triage Category, 2016/17 to 2036/37
Age Group Triage 2016/17 2021/22 2026/27 2031/32 2036/37 Change (No.) AGR^
All Ages
Triage 1 8 9 9 9 9 1 1%
Triage 2 60 78 102 126 150 90 5%
Triage 3 500 827 1,077 1,327 1,577 1,077 6%
Triage 4 837 1,146 1,458 1,771 2,083 1,246 4.9%
Triage 5 1,409 1,344 1,379 1,414 1,449 40 0.1%
Grand Total 2,814 3,404 4,025 4,647 5,268 2,454 3%
Source: Emergency Department Projections provided by the Department of Health 2017 as supplied by Health Service Research, Analysis and Modelling Unit, System Planning Branch, Strategy, Policy and Planning Division (SPPD). Published by the State of Queensland (Queensland Health), 2018.
Table 61 Murgon Hospital Emergency Department Presentation Projections by Triage Category, 2016/17 to 2036/37
Age Group Triage 2016/17 2021/22 2026/27 2031/32 2036/37 Change (No.) AGR^
All Ages
Triage 1 8 10 12 14 16 8 4%
Triage 2 135 149 171 193 216 81 2%
Triage 3 673 889 1,001 1,112 1,223 550 3%
Triage 4 1,648 2,328 2,993 3,657 4,322 2,674 5.2%
Triage 5 1,715 1,974 2,445 2,916 3,387 1,672 3.6%
Grand Total 4,179 5,351 6,622 7,893 9,164 4,985 4%
Source: Emergency Department Projections provided by the Department of Health 2017 as supplied by Health Service Research, Analysis and Modelling Unit, System Planning Branch, Strategy, Policy and Planning Division (SPPD). Published by the State of Queensland (Queensland Health), 2018.
Table 62 Nanango Hospital Emergency Department Presentation Projections by Triage Category, 2016/17 to 2036/37
Age Group Triage 2016/17 2021/22 2026/27 2031/32 2036/37 Change (No.) AGR^
All Ages
Triage 1 8 10 12 14 16 8 4%
Triage 2 56 62 71 80 89 33 2%
Triage 3 492 650 732 813 894 402 3%
Triage 4 1,581 2,234 2,871 3,509 4,146 2,565 5.2%
Triage 5 2,236 2,574 3,188 3,802 4,416 2,180 3.6%
Grand Total 4,373 5,530 6,874 8,218 9,562 5,189 4%
Source: Emergency Department Projections provided by the Department of Health 2017 as supplied by Health Service Research, Analysis and Modelling Unit, System Planning Branch, Strategy, Policy and Planning Division (SPPD). Published by the State of Queensland (Queensland Health), 2018.
Table 63 Oakey Hospital Emergency Department Presentation Projections by Triage Category, 2016/17 to 2036/37
Age Group Triage 2016/17 2021/22 2026/27 2031/32 2036/37 Change (No.) AGR^
All Ages
Triage 1 11 15 19 23 27 16 5%
Triage 2 96 118 140 162 184 88 3%
Triage 3 841 1,131 1,387 1,647 1,908 1,067 4%
Triage 4 1,292 1,303 1,320 1,338 1,354 62 0.2%
Triage 5 585 588 594 598 602 17 0.1%
Grand Total 2,825 3,155 3,460 3,768 4,075 1,249 2%
Source: Emergency Department Projections provided by the Department of Health 2017 as supplied by Health Service Research, Analysis and Modelling Unit, System Planning Branch, Strategy, Policy and Planning Division (SPPD). Published by the State of Queensland (Queensland Health), 2018.
57
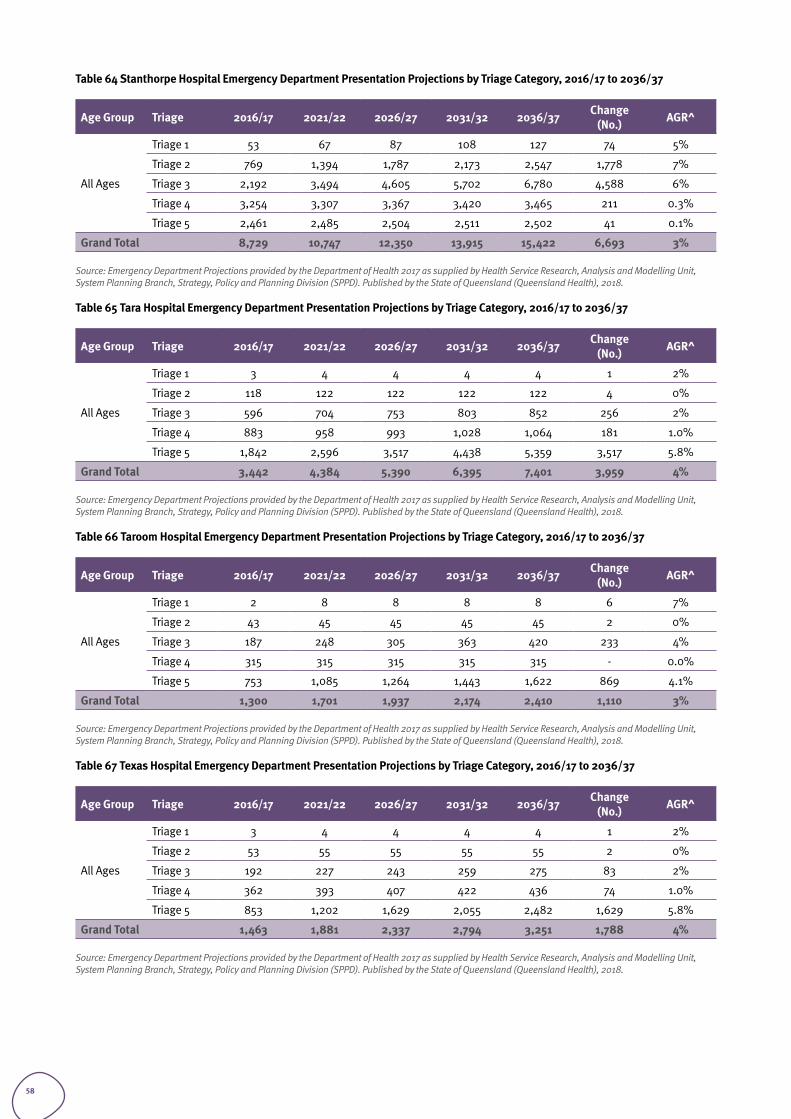
Table 64 Stanthorpe Hospital Emergency Department Presentation Projections by Triage Category, 2016/17 to 2036/37
Age Group Triage 2016/17 2021/22 2026/27 2031/32 2036/37 Change (No.) AGR^
All Ages
Triage 1 53 67 87 108 127 74 5%
Triage 2 769 1,394 1,787 2,173 2,547 1,778 7%
Triage 3 2,192 3,494 4,605 5,702 6,780 4,588 6%
Triage 4 3,254 3,307 3,367 3,420 3,465 211 0.3%
Triage 5 2,461 2,485 2,504 2,511 2,502 41 0.1%
Grand Total 8,729 10,747 12,350 13,915 15,422 6,693 3%
Source: Emergency Department Projections provided by the Department of Health 2017 as supplied by Health Service Research, Analysis and Modelling Unit, System Planning Branch, Strategy, Policy and Planning Division (SPPD). Published by the State of Queensland (Queensland Health), 2018.
Table 65 Tara Hospital Emergency Department Presentation Projections by Triage Category, 2016/17 to 2036/37
Age Group Triage 2016/17 2021/22 2026/27 2031/32 2036/37 Change (No.) AGR^
All Ages
Triage 1 3 4 4 4 4 1 2%
Triage 2 118 122 122 122 122 4 0%
Triage 3 596 704 753 803 852 256 2%
Triage 4 883 958 993 1,028 1,064 181 1.0%
Triage 5 1,842 2,596 3,517 4,438 5,359 3,517 5.8%
Grand Total 3,442 4,384 5,390 6,395 7,401 3,959 4%
Source: Emergency Department Projections provided by the Department of Health 2017 as supplied by Health Service Research, Analysis and Modelling Unit, System Planning Branch, Strategy, Policy and Planning Division (SPPD). Published by the State of Queensland (Queensland Health), 2018.
Table 66 Taroom Hospital Emergency Department Presentation Projections by Triage Category, 2016/17 to 2036/37
Age Group Triage 2016/17 2021/22 2026/27 2031/32 2036/37 Change (No.) AGR^
All Ages
Triage 1 2 8 8 8 8 6 7%
Triage 2 43 45 45 45 45 2 0%
Triage 3 187 248 305 363 420 233 4%
Triage 4 315 315 315 315 315 - 0.0%
Triage 5 753 1,085 1,264 1,443 1,622 869 4.1%
Grand Total 1,300 1,701 1,937 2,174 2,410 1,110 3%
Source: Emergency Department Projections provided by the Department of Health 2017 as supplied by Health Service Research, Analysis and Modelling Unit, System Planning Branch, Strategy, Policy and Planning Division (SPPD). Published by the State of Queensland (Queensland Health), 2018.
Table 67 Texas Hospital Emergency Department Presentation Projections by Triage Category, 2016/17 to 2036/37
Age Group Triage 2016/17 2021/22 2026/27 2031/32 2036/37 Change (No.) AGR^
All Ages
Triage 1 3 4 4 4 4 1 2%
Triage 2 53 55 55 55 55 2 0%
Triage 3 192 227 243 259 275 83 2%
Triage 4 362 393 407 422 436 74 1.0%
Triage 5 853 1,202 1,629 2,055 2,482 1,629 5.8%
Grand Total 1,463 1,881 2,337 2,794 3,251 1,788 4%
Source: Emergency Department Projections provided by the Department of Health 2017 as supplied by Health Service Research, Analysis and Modelling Unit, System Planning Branch, Strategy, Policy and Planning Division (SPPD). Published by the State of Queensland (Queensland Health), 2018.
58
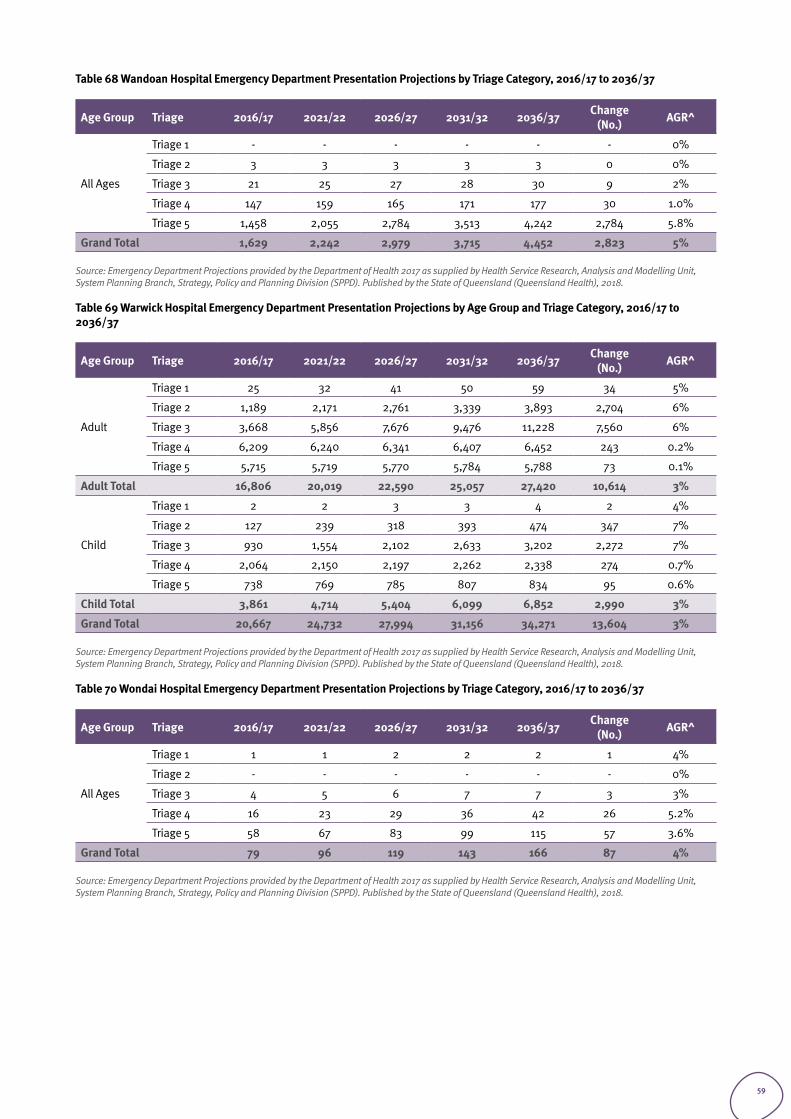
Table 68 Wandoan Hospital Emergency Department Presentation Projections by Triage Category, 2016/17 to 2036/37
Age Group Triage 2016/17 2021/22 2026/27 2031/32 2036/37 Change (No.) AGR^
All Ages
Triage 1 - - - - - - 0%
Triage 2 3 3 3 3 3 0 0%
Triage 3 21 25 27 28 30 9 2%
Triage 4 147 159 165 171 177 30 1.0%
Triage 5 1,458 2,055 2,784 3,513 4,242 2,784 5.8%
Grand Total 1,629 2,242 2,979 3,715 4,452 2,823 5%
Source: Emergency Department Projections provided by the Department of Health 2017 as supplied by Health Service Research, Analysis and Modelling Unit, System Planning Branch, Strategy, Policy and Planning Division (SPPD). Published by the State of Queensland (Queensland Health), 2018.
Table 69 Warwick Hospital Emergency Department Presentation Projections by Age Group and Triage Category, 2016/17 to 2036/37
Age Group Triage 2016/17 2021/22 2026/27 2031/32 2036/37 Change (No.) AGR^
Adult
Triage 1 25 32 41 50 59 34 5%
Triage 2 1,189 2,171 2,761 3,339 3,893 2,704 6%
Triage 3 3,668 5,856 7,676 9,476 11,228 7,560 6%
Triage 4 6,209 6,240 6,341 6,407 6,452 243 0.2%
Triage 5 5,715 5,719 5,770 5,784 5,788 73 0.1%
Adult Total 16,806 20,019 22,590 25,057 27,420 10,614 3%
Child
Triage 1 2 2 3 3 4 2 4%
Triage 2 127 239 318 393 474 347 7%
Triage 3 930 1,554 2,102 2,633 3,202 2,272 7%
Triage 4 2,064 2,150 2,197 2,262 2,338 274 0.7%
Triage 5 738 769 785 807 834 95 0.6%
Child Total 3,861 4,714 5,404 6,099 6,852 2,990 3%
Grand Total 20,667 24,732 27,994 31,156 34,271 13,604 3%
Source: Emergency Department Projections provided by the Department of Health 2017 as supplied by Health Service Research, Analysis and Modelling Unit, System Planning Branch, Strategy, Policy and Planning Division (SPPD). Published by the State of Queensland (Queensland Health), 2018.
Table 70 Wondai Hospital Emergency Department Presentation Projections by Triage Category, 2016/17 to 2036/37
Age Group Triage 2016/17 2021/22 2026/27 2031/32 2036/37 Change (No.) AGR^
All Ages
Triage 1 1 1 2 2 2 1 4%
Triage 2 - - - - - - 0%
Triage 3 4 5 6 7 7 3 3%
Triage 4 16 23 29 36 42 26 5.2%
Triage 5 58 67 83 99 115 57 3.6%
Grand Total 79 96 119 143 166 87 4%
Source: Emergency Department Projections provided by the Department of Health 2017 as supplied by Health Service Research, Analysis and Modelling Unit, System Planning Branch, Strategy, Policy and Planning Division (SPPD). Published by the State of Queensland (Queensland Health), 2018.
59
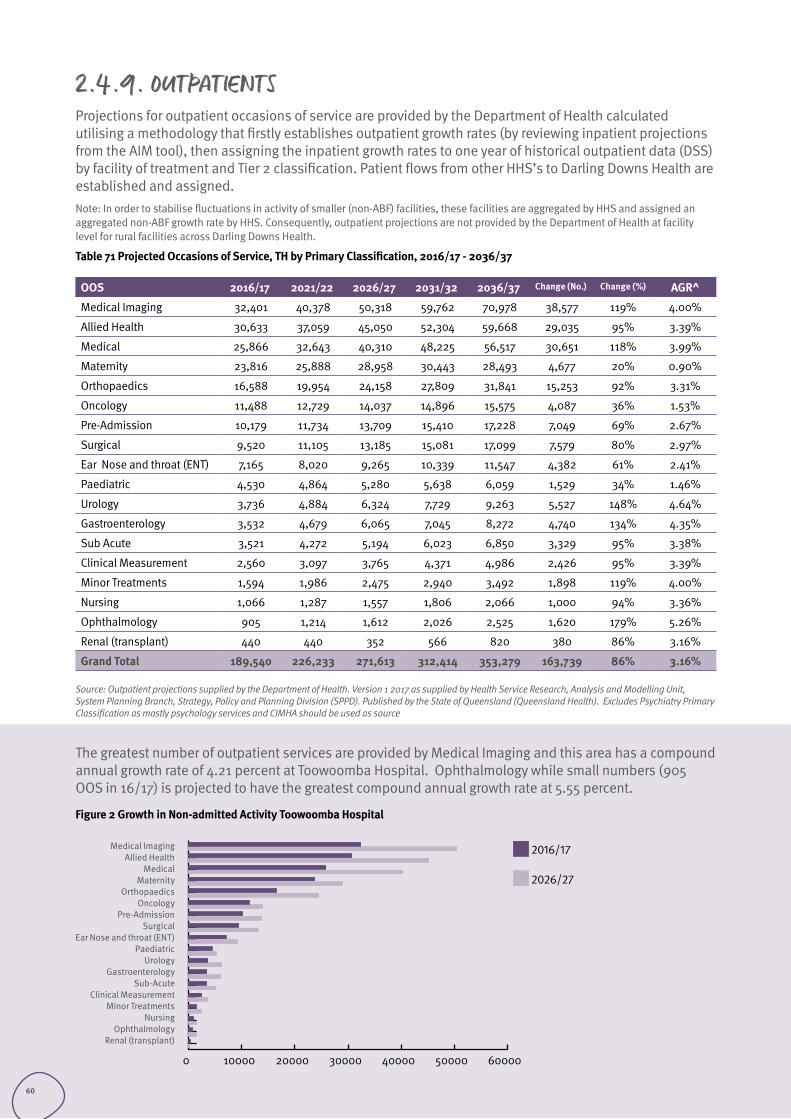
2.4.9. OUTPATIENTSProjections for outpatient occasions of service are provided by the Department of Health calculated utilising a methodology that firstly establishes outpatient growth rates (by reviewing inpatient projections from the AIM tool), then assigning the inpatient growth rates to one year of historical outpatient data (DSS) by facility of treatment and Tier 2 classification. Patient flows from other HHS’s to Darling Downs Health are established and assigned. Note: In order to stabilise fluctuations in activity of smaller (non-ABF) facilities, these facilities are aggregated by HHS and assigned an aggregated non-ABF growth rate by HHS. Consequently, outpatient projections are not provided by the Department of Health at facility level for rural facilities across Darling Downs Health.
Table 71 Projected Occasions of Service, TH by Primary Classification, 2016/17 - 2036/37
OOS 2016/17 2021/22 2026/27 2031/32 2036/37 Change (No.) Change (%) AGR^
Medical Imaging 32,401 40,378 50,318 59,762 70,978 38,577 119% 4.00%
Allied Health 30,633 37,059 45,050 52,304 59,668 29,035 95% 3.39%
Medical 25,866 32,643 40,310 48,225 56,517 30,651 118% 3.99%
Maternity 23,816 25,888 28,958 30,443 28,493 4,677 20% 0.90%
Orthopaedics 16,588 19,954 24,158 27,809 31,841 15,253 92% 3.31%
Oncology 11,488 12,729 14,037 14,896 15,575 4,087 36% 1.53%
Pre-Admission 10,179 11,734 13,709 15,410 17,228 7,049 69% 2.67%
Surgical 9,520 11,105 13,185 15,081 17,099 7,579 80% 2.97%
Ear Nose and throat (ENT) 7,165 8,020 9,265 10,339 11,547 4,382 61% 2.41%
Paediatric 4,530 4,864 5,280 5,638 6,059 1,529 34% 1.46%
Urology 3,736 4,884 6,324 7,729 9,263 5,527 148% 4.64%
Gastroenterology 3,532 4,679 6,065 7,045 8,272 4,740 134% 4.35%
Sub Acute 3,521 4,272 5,194 6,023 6,850 3,329 95% 3.38%
Clinical Measurement 2,560 3,097 3,765 4,371 4,986 2,426 95% 3.39%
Minor Treatments 1,594 1,986 2,475 2,940 3,492 1,898 119% 4.00%
Nursing 1,066 1,287 1,557 1,806 2,066 1,000 94% 3.36%
Ophthalmology 905 1,214 1,612 2,026 2,525 1,620 179% 5.26%
Renal (transplant) 440 440 352 566 820 380 86% 3.16%
Grand Total 189,540 226,233 271,613 312,414 353,279 163,739 86% 3.16%
Source: Outpatient projections supplied by the Department of Health. Version 1 2017 as supplied by Health Service Research, Analysis and Modelling Unit, System Planning Branch, Strategy, Policy and Planning Division (SPPD). Published by the State of Queensland (Queensland Health). Excludes Psychiatry Primary Classification as mostly psychology services and CIMHA should be used as source
0 10000 20000 30000 40000 50000 60000
Medical ImagingAllied Health
MedicalMaternity
OrthopaedicsOncology
Pre-AdmissionSurgical
Ear Nose and throat (ENT)Paediatric
UrologyGastroenterology
Sub-AcuteClinical Measurement
Minor TreatmentsNursing
OphthalmologyRenal (transplant)
The greatest number of outpatient services are provided by Medical Imaging and this area has a compound annual growth rate of 4.21 percent at Toowoomba Hospital. Ophthalmology while small numbers (905 OOS in 16/17) is projected to have the greatest compound annual growth rate at 5.55 percent.
Figure 2 Growth in Non-admitted Activity Toowoomba Hospital
2016/17
2026/27
60
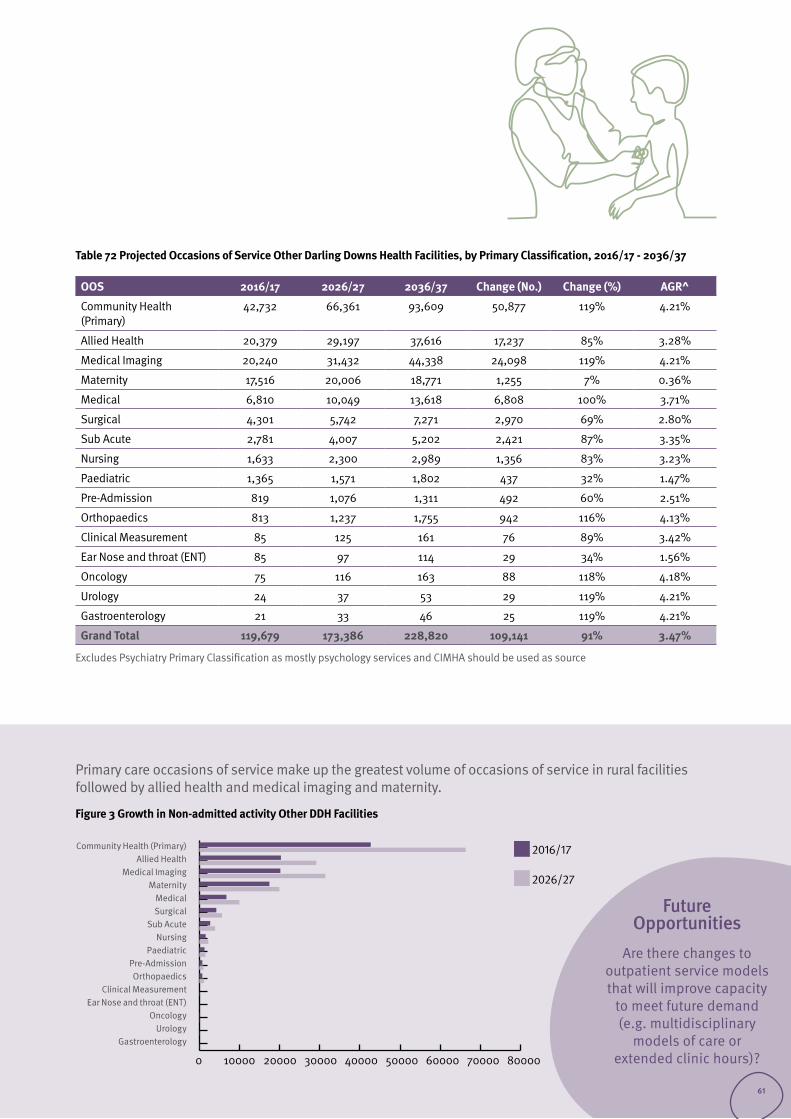
Table 72 Projected Occasions of Service Other Darling Downs Health Facilities, by Primary Classification, 2016/17 - 2036/37
OOS 2016/17 2026/27 2036/37 Change (No.) Change (%) AGR^
Community Health (Primary)
42,732 66,361 93,609 50,877 119% 4.21%
Allied Health 20,379 29,197 37,616 17,237 85% 3.28%
Medical Imaging 20,240 31,432 44,338 24,098 119% 4.21%
Maternity 17,516 20,006 18,771 1,255 7% 0.36%
Medical 6,810 10,049 13,618 6,808 100% 3.71%
Surgical 4,301 5,742 7,271 2,970 69% 2.80%
Sub Acute 2,781 4,007 5,202 2,421 87% 3.35%
Nursing 1,633 2,300 2,989 1,356 83% 3.23%
Paediatric 1,365 1,571 1,802 437 32% 1.47%
Pre-Admission 819 1,076 1,311 492 60% 2.51%
Orthopaedics 813 1,237 1,755 942 116% 4.13%
Clinical Measurement 85 125 161 76 89% 3.42%
Ear Nose and throat (ENT) 85 97 114 29 34% 1.56%
Oncology 75 116 163 88 118% 4.18%
Urology 24 37 53 29 119% 4.21%
Gastroenterology 21 33 46 25 119% 4.21%
Grand Total 119,679 173,386 228,820 109,141 91% 3.47%
Excludes Psychiatry Primary Classification as mostly psychology services and CIMHA should be used as source
0 10000 20000 30000 40000 50000 60000 70000 80000
Community Health (Primary)Allied Health
Medical ImagingMaternity
MedicalSurgical
Sub AcuteNursing
PaediatricPre-AdmissionOrthopaedics
Clinical MeasurementEar Nose and throat (ENT)
OncologyUrology
Gastroenterology
2016/17
2026/27
Primary care occasions of service make up the greatest volume of occasions of service in rural facilities followed by allied health and medical imaging and maternity.
Figure 3 Growth in Non-admitted activity Other DDH Facilities
Future Opportunities
Are there changes to outpatient service models that will improve capacity
to meet future demand (e.g. multidisciplinary
models of care or extended clinic hours)?
61
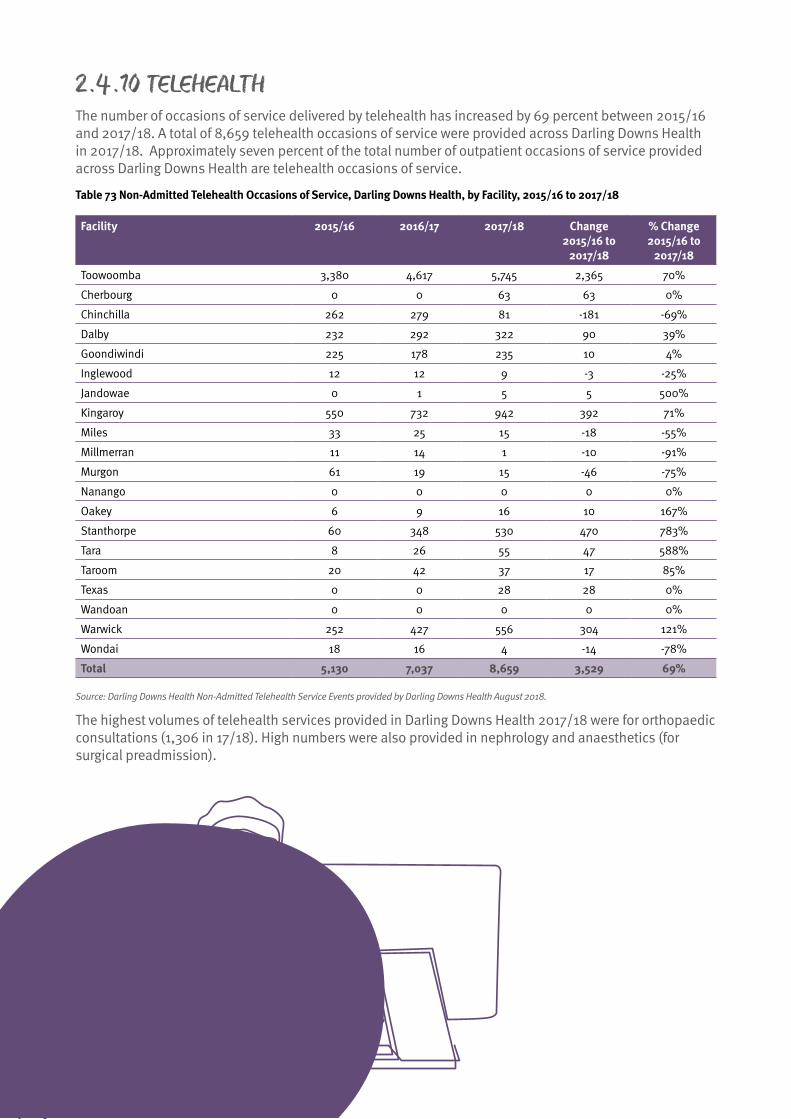
2.4.10 TELEHEALTH The number of occasions of service delivered by telehealth has increased by 69 percent between 2015/16 and 2017/18. A total of 8,659 telehealth occasions of service were provided across Darling Downs Health in 2017/18. Approximately seven percent of the total number of outpatient occasions of service provided across Darling Downs Health are telehealth occasions of service.
Table 73 Non-Admitted Telehealth Occasions of Service, Darling Downs Health, by Facility, 2015/16 to 2017/18
Facility 2015/16 2016/17 2017/18 Change 2015/16 to
2017/18
% Change 2015/16 to
2017/18
Toowoomba 3,380 4,617 5,745 2,365 70%
Cherbourg 0 0 63 63 0%
Chinchilla 262 279 81 -181 -69%
Dalby 232 292 322 90 39%
Goondiwindi 225 178 235 10 4%
Inglewood 12 12 9 -3 -25%
Jandowae 0 1 5 5 500%
Kingaroy 550 732 942 392 71%
Miles 33 25 15 -18 -55%
Millmerran 11 14 1 -10 -91%
Murgon 61 19 15 -46 -75%
Nanango 0 0 0 0 0%
Oakey 6 9 16 10 167%
Stanthorpe 60 348 530 470 783%
Tara 8 26 55 47 588%
Taroom 20 42 37 17 85%
Texas 0 0 28 28 0%
Wandoan 0 0 0 0 0%
Warwick 252 427 556 304 121%
Wondai 18 16 4 -14 -78%
Total 5,130 7,037 8,659 3,529 69%
Source: Darling Downs Health Non-Admitted Telehealth Service Events provided by Darling Downs Health August 2018.
The highest volumes of telehealth services provided in Darling Downs Health 2017/18 were for orthopaedic consultations (1,306 in 17/18). High numbers were also provided in nephrology and anaesthetics (for surgical preadmission).
62
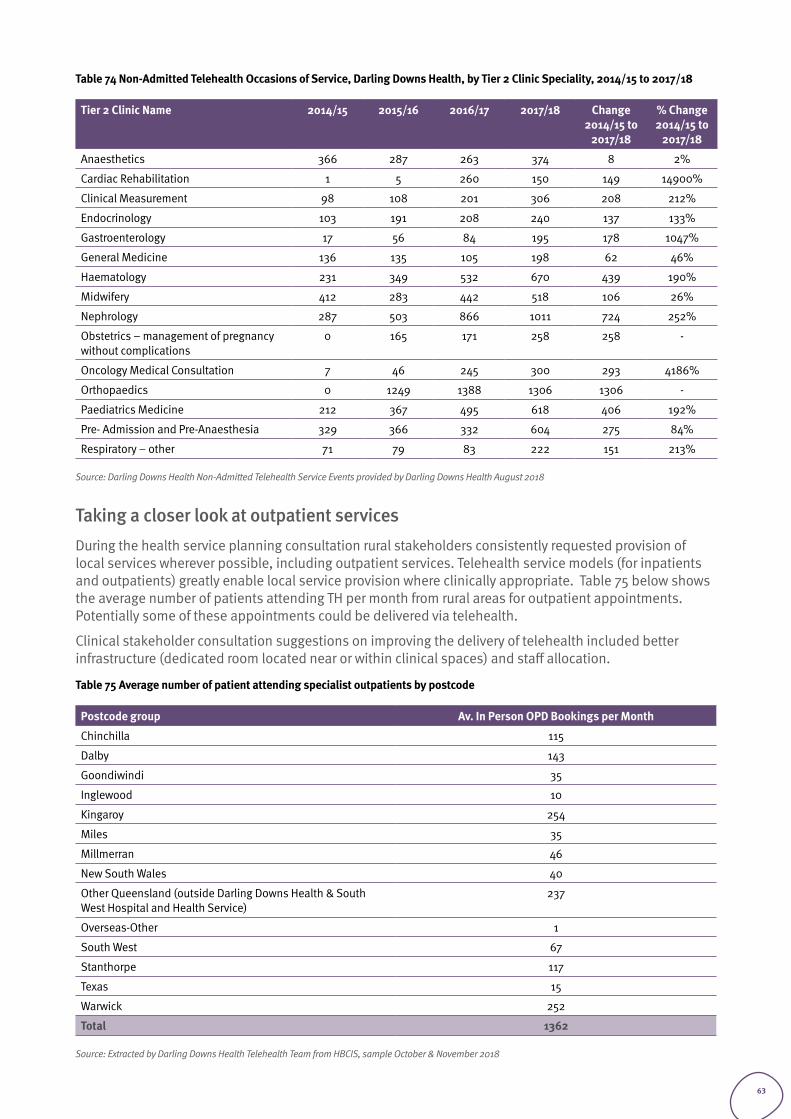
Table 74 Non-Admitted Telehealth Occasions of Service, Darling Downs Health, by Tier 2 Clinic Speciality, 2014/15 to 2017/18
Tier 2 Clinic Name 2014/15 2015/16 2016/17 2017/18 Change 2014/15 to
2017/18
% Change 2014/15 to
2017/18
Anaesthetics 366 287 263 374 8 2%
Cardiac Rehabilitation 1 5 260 150 149 14900%
Clinical Measurement 98 108 201 306 208 212%
Endocrinology 103 191 208 240 137 133%
Gastroenterology 17 56 84 195 178 1047%
General Medicine 136 135 105 198 62 46%
Haematology 231 349 532 670 439 190%
Midwifery 412 283 442 518 106 26%
Nephrology 287 503 866 1011 724 252%
Obstetrics – management of pregnancy without complications
0 165 171 258 258 -
Oncology Medical Consultation 7 46 245 300 293 4186%
Orthopaedics 0 1249 1388 1306 1306 -
Paediatrics Medicine 212 367 495 618 406 192%
Pre- Admission and Pre-Anaesthesia 329 366 332 604 275 84%
Respiratory – other 71 79 83 222 151 213%
Source: Darling Downs Health Non-Admitted Telehealth Service Events provided by Darling Downs Health August 2018
Taking a closer look at outpatient services During the health service planning consultation rural stakeholders consistently requested provision of local services wherever possible, including outpatient services. Telehealth service models (for inpatients and outpatients) greatly enable local service provision where clinically appropriate. Table 75 below shows the average number of patients attending TH per month from rural areas for outpatient appointments. Potentially some of these appointments could be delivered via telehealth.
Clinical stakeholder consultation suggestions on improving the delivery of telehealth included better infrastructure (dedicated room located near or within clinical spaces) and staff allocation.
Table 75 Average number of patient attending specialist outpatients by postcode
Postcode group Av. In Person OPD Bookings per Month
Chinchilla 115
Dalby 143
Goondiwindi 35
Inglewood 10
Kingaroy 254
Miles 35
Millmerran 46
New South Wales 40
Other Queensland (outside Darling Downs Health & South West Hospital and Health Service)
237
Overseas-Other 1
South West 67
Stanthorpe 117
Texas 15
Warwick 252
Total 1362
Source: Extracted by Darling Downs Health Telehealth Team from HBCIS, sample October & November 2018
63
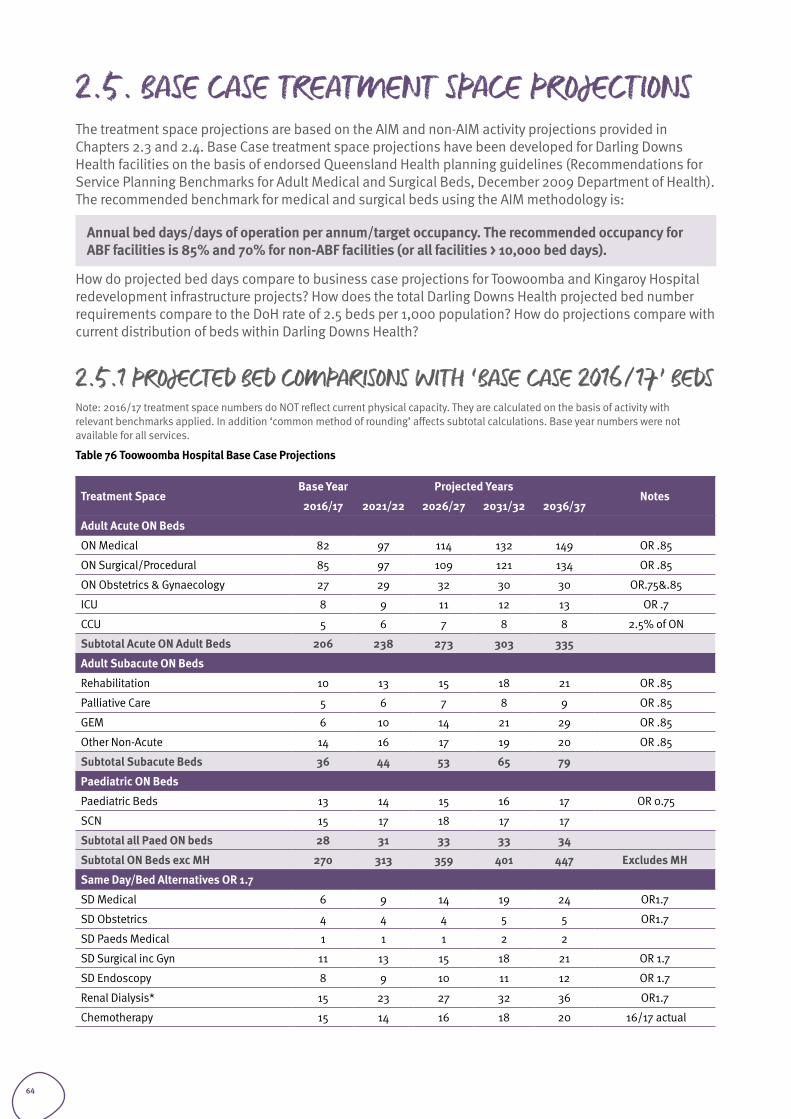
2.5. BASE CASE TREATMENT SPACE PROJECTIONSThe treatment space projections are based on the AIM and non-AIM activity projections provided in Chapters 2.3 and 2.4. Base Case treatment space projections have been developed for Darling Downs Health facilities on the basis of endorsed Queensland Health planning guidelines (Recommendations for Service Planning Benchmarks for Adult Medical and Surgical Beds, December 2009 Department of Health). The recommended benchmark for medical and surgical beds using the AIM methodology is:
Annual bed days/days of operation per annum/target occupancy. The recommended occupancy for ABF facilities is 85% and 70% for non-ABF facilities (or all facilities > 10,000 bed days).
How do projected bed days compare to business case projections for Toowoomba and Kingaroy Hospital redevelopment infrastructure projects? How does the total Darling Downs Health projected bed number requirements compare to the DoH rate of 2.5 beds per 1,000 population? How do projections compare with current distribution of beds within Darling Downs Health?
2.5.1 PROJECTED BED COMPARISONS WITH ‘BASE CASE 2016/17’ BEDSNote: 2016/17 treatment space numbers do NOT reflect current physical capacity. They are calculated on the basis of activity with relevant benchmarks applied. In addition ‘common method of rounding’ affects subtotal calculations. Base year numbers were not available for all services.
Table 76 Toowoomba Hospital Base Case Projections
Treatment SpaceBase Year Projected Years
Notes2016/17 2021/22 2026/27 2031/32 2036/37
Adult Acute ON Beds
ON Medical 82 97 114 132 149 OR .85
ON Surgical/Procedural 85 97 109 121 134 OR .85
ON Obstetrics & Gynaecology 27 29 32 30 30 OR.75&.85
ICU 8 9 11 12 13 OR .7
CCU 5 6 7 8 8 2.5% of ON
Subtotal Acute ON Adult Beds 206 238 273 303 335
Adult Subacute ON Beds
Rehabilitation 10 13 15 18 21 OR .85
Palliative Care 5 6 7 8 9 OR .85
GEM 6 10 14 21 29 OR .85
Other Non-Acute 14 16 17 19 20 OR .85
Subtotal Subacute Beds 36 44 53 65 79
Paediatric ON Beds
Paediatric Beds 13 14 15 16 17 OR 0.75
SCN 15 17 18 17 17
Subtotal all Paed ON beds 28 31 33 33 34
Subtotal ON Beds exc MH 270 313 359 401 447 Excludes MH
Same Day/Bed Alternatives OR 1.7
SD Medical 6 9 14 19 24 OR1.7
SD Obstetrics 4 4 4 5 5 OR1.7
SD Paeds Medical 1 1 1 2 2
SD Surgical inc Gyn 11 13 15 18 21 OR 1.7
SD Endoscopy 8 9 10 11 12 OR 1.7
Renal Dialysis* 15 23 27 32 36 OR1.7
Chemotherapy 15 14 16 18 20 16/17 actual
64
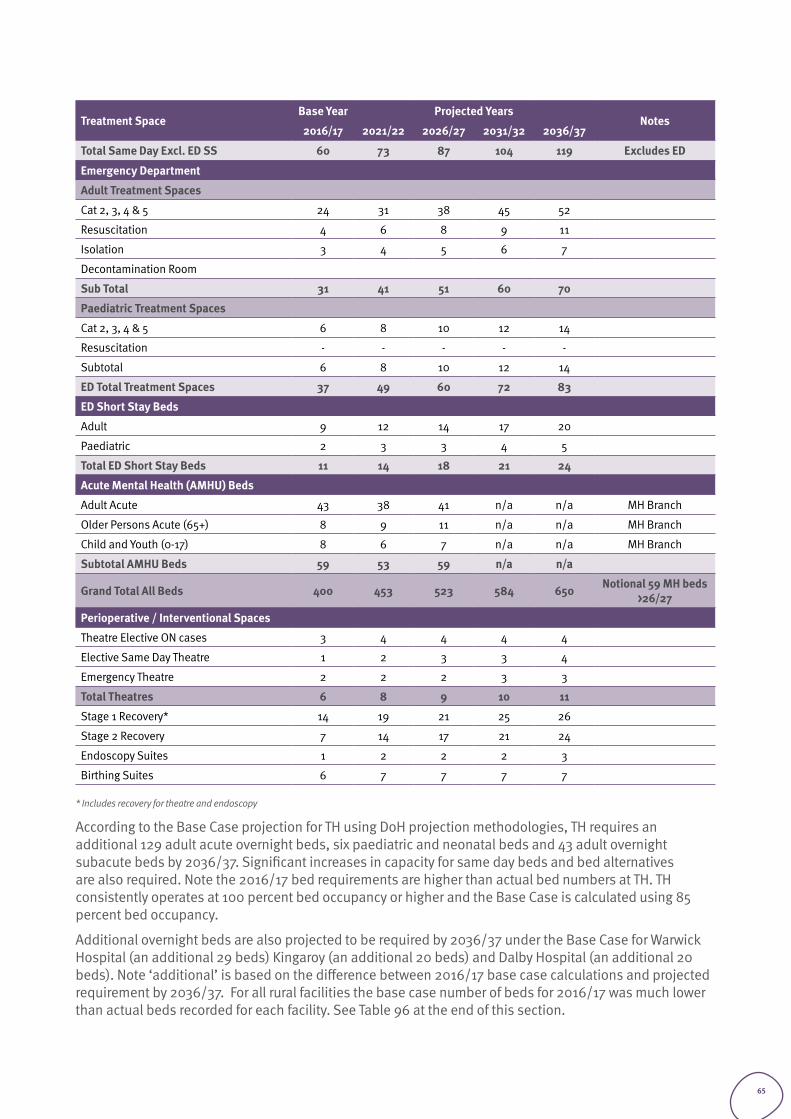
Treatment SpaceBase Year Projected Years
Notes2016/17 2021/22 2026/27 2031/32 2036/37
Total Same Day Excl. ED SS 60 73 87 104 119 Excludes ED
Emergency Department
Adult Treatment Spaces
Cat 2, 3, 4 & 5 24 31 38 45 52
Resuscitation 4 6 8 9 11
Isolation 3 4 5 6 7
Decontamination Room
Sub Total 31 41 51 60 70
Paediatric Treatment Spaces
Cat 2, 3, 4 & 5 6 8 10 12 14
Resuscitation - - - - -
Subtotal 6 8 10 12 14
ED Total Treatment Spaces 37 49 60 72 83
ED Short Stay Beds
Adult 9 12 14 17 20
Paediatric 2 3 3 4 5
Total ED Short Stay Beds 11 14 18 21 24
Acute Mental Health (AMHU) Beds
Adult Acute 43 38 41 n/a n/a MH Branch
Older Persons Acute (65+) 8 9 11 n/a n/a MH Branch
Child and Youth (0-17) 8 6 7 n/a n/a MH Branch
Subtotal AMHU Beds 59 53 59 n/a n/a
Grand Total All Beds 400 453 523 584 650 Notional 59 MH beds >26/27
Perioperative / Interventional Spaces
Theatre Elective ON cases 3 4 4 4 4
Elective Same Day Theatre 1 2 3 3 4
Emergency Theatre 2 2 2 3 3
Total Theatres 6 8 9 10 11
Stage 1 Recovery* 14 19 21 25 26
Stage 2 Recovery 7 14 17 21 24
Endoscopy Suites 1 2 2 2 3
Birthing Suites 6 7 7 7 7
* Includes recovery for theatre and endoscopy
According to the Base Case projection for TH using DoH projection methodologies, TH requires an additional 129 adult acute overnight beds, six paediatric and neonatal beds and 43 adult overnight subacute beds by 2036/37. Significant increases in capacity for same day beds and bed alternatives are also required. Note the 2016/17 bed requirements are higher than actual bed numbers at TH. TH consistently operates at 100 percent bed occupancy or higher and the Base Case is calculated using 85 percent bed occupancy.
Additional overnight beds are also projected to be required by 2036/37 under the Base Case for Warwick Hospital (an additional 29 beds) Kingaroy (an additional 20 beds) and Dalby Hospital (an additional 20 beds). Note ‘additional’ is based on the difference between 2016/17 base case calculations and projected requirement by 2036/37. For all rural facilities the base case number of beds for 2016/17 was much lower than actual beds recorded for each facility. See Table 96 at the end of this section.
65
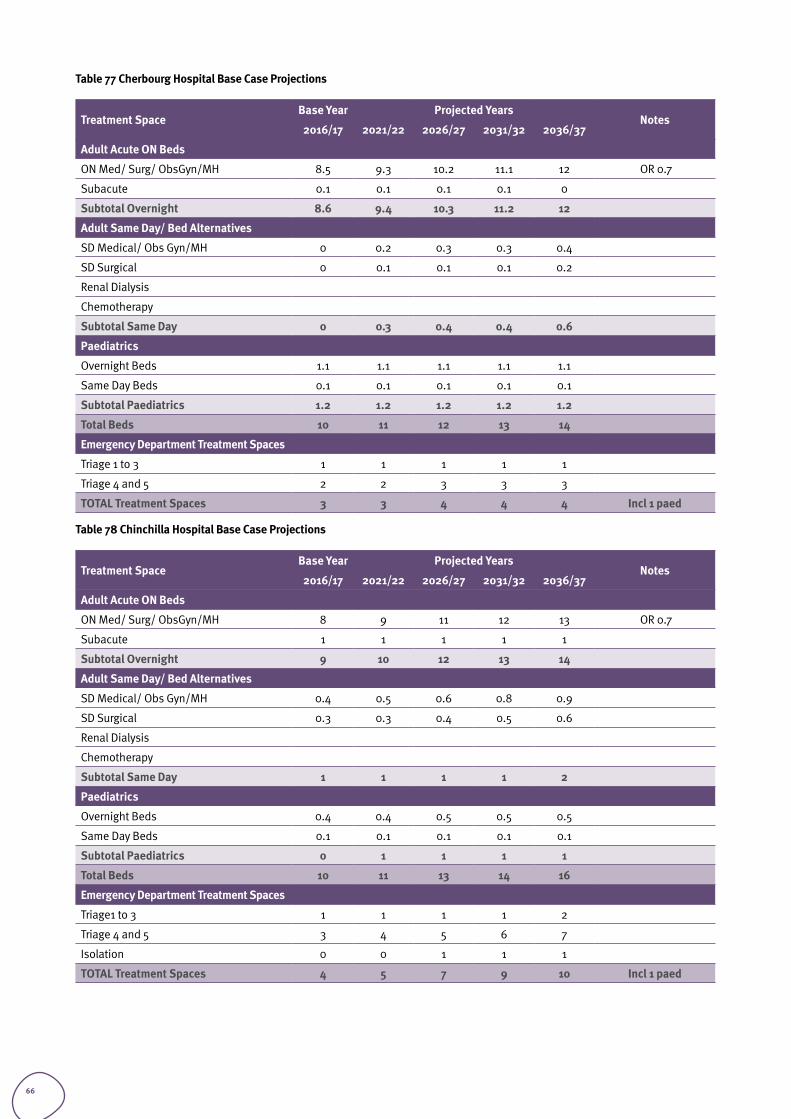
Table 77 Cherbourg Hospital Base Case Projections
Treatment SpaceBase Year Projected Years
Notes2016/17 2021/22 2026/27 2031/32 2036/37
Adult Acute ON Beds
ON Med/ Surg/ ObsGyn/MH 8.5 9.3 10.2 11.1 12 OR 0.7
Subacute 0.1 0.1 0.1 0.1 0
Subtotal Overnight 8.6 9.4 10.3 11.2 12
Adult Same Day/ Bed Alternatives
SD Medical/ Obs Gyn/MH 0 0.2 0.3 0.3 0.4
SD Surgical 0 0.1 0.1 0.1 0.2
Renal Dialysis
Chemotherapy
Subtotal Same Day 0 0.3 0.4 0.4 0.6
Paediatrics
Overnight Beds 1.1 1.1 1.1 1.1 1.1
Same Day Beds 0.1 0.1 0.1 0.1 0.1
Subtotal Paediatrics 1.2 1.2 1.2 1.2 1.2
Total Beds 10 11 12 13 14
Emergency Department Treatment Spaces
Triage 1 to 3 1 1 1 1 1
Triage 4 and 5 2 2 3 3 3
TOTAL Treatment Spaces 3 3 4 4 4 Incl 1 paed
Table 78 Chinchilla Hospital Base Case Projections
Treatment SpaceBase Year Projected Years
Notes2016/17 2021/22 2026/27 2031/32 2036/37
Adult Acute ON Beds
ON Med/ Surg/ ObsGyn/MH 8 9 11 12 13 OR 0.7
Subacute 1 1 1 1 1
Subtotal Overnight 9 10 12 13 14
Adult Same Day/ Bed Alternatives
SD Medical/ Obs Gyn/MH 0.4 0.5 0.6 0.8 0.9
SD Surgical 0.3 0.3 0.4 0.5 0.6
Renal Dialysis
Chemotherapy
Subtotal Same Day 1 1 1 1 2
Paediatrics
Overnight Beds 0.4 0.4 0.5 0.5 0.5
Same Day Beds 0.1 0.1 0.1 0.1 0.1
Subtotal Paediatrics 0 1 1 1 1
Total Beds 10 11 13 14 16
Emergency Department Treatment Spaces
Triage1 to 3 1 1 1 1 2
Triage 4 and 5 3 4 5 6 7
Isolation 0 0 1 1 1
TOTAL Treatment Spaces 4 5 7 9 10 Incl 1 paed
66
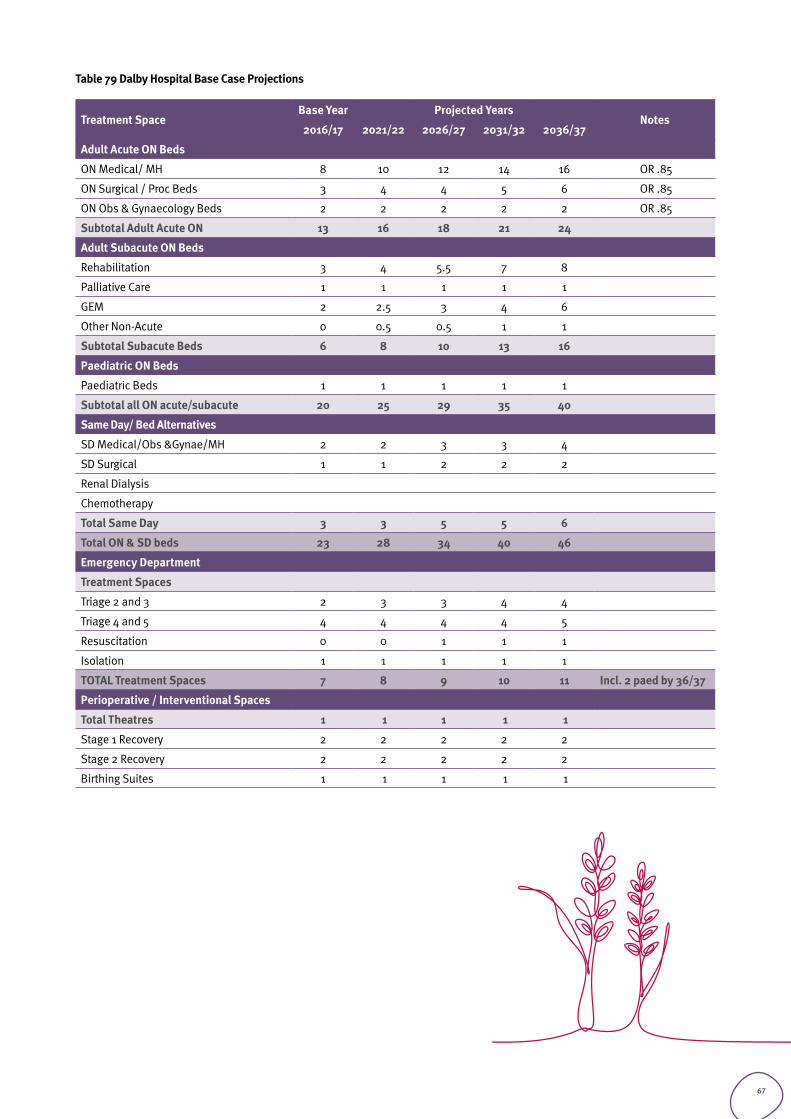
Table 79 Dalby Hospital Base Case Projections
Treatment SpaceBase Year Projected Years
Notes2016/17 2021/22 2026/27 2031/32 2036/37
Adult Acute ON Beds
ON Medical/ MH 8 10 12 14 16 OR .85
ON Surgical / Proc Beds 3 4 4 5 6 OR .85
ON Obs & Gynaecology Beds 2 2 2 2 2 OR .85
Subtotal Adult Acute ON 13 16 18 21 24
Adult Subacute ON Beds
Rehabilitation 3 4 5.5 7 8
Palliative Care 1 1 1 1 1
GEM 2 2.5 3 4 6
Other Non-Acute 0 0.5 0.5 1 1
Subtotal Subacute Beds 6 8 10 13 16
Paediatric ON Beds
Paediatric Beds 1 1 1 1 1
Subtotal all ON acute/subacute 20 25 29 35 40
Same Day/ Bed Alternatives
SD Medical/Obs &Gynae/MH 2 2 3 3 4
SD Surgical 1 1 2 2 2
Renal Dialysis
Chemotherapy
Total Same Day 3 3 5 5 6
Total ON & SD beds 23 28 34 40 46
Emergency Department
Treatment Spaces
Triage 2 and 3 2 3 3 4 4
Triage 4 and 5 4 4 4 4 5
Resuscitation 0 0 1 1 1
Isolation 1 1 1 1 1
TOTAL Treatment Spaces 7 8 9 10 11 Incl. 2 paed by 36/37
Perioperative / Interventional Spaces
Total Theatres 1 1 1 1 1
Stage 1 Recovery 2 2 2 2 2
Stage 2 Recovery 2 2 2 2 2
Birthing Suites 1 1 1 1 1
67
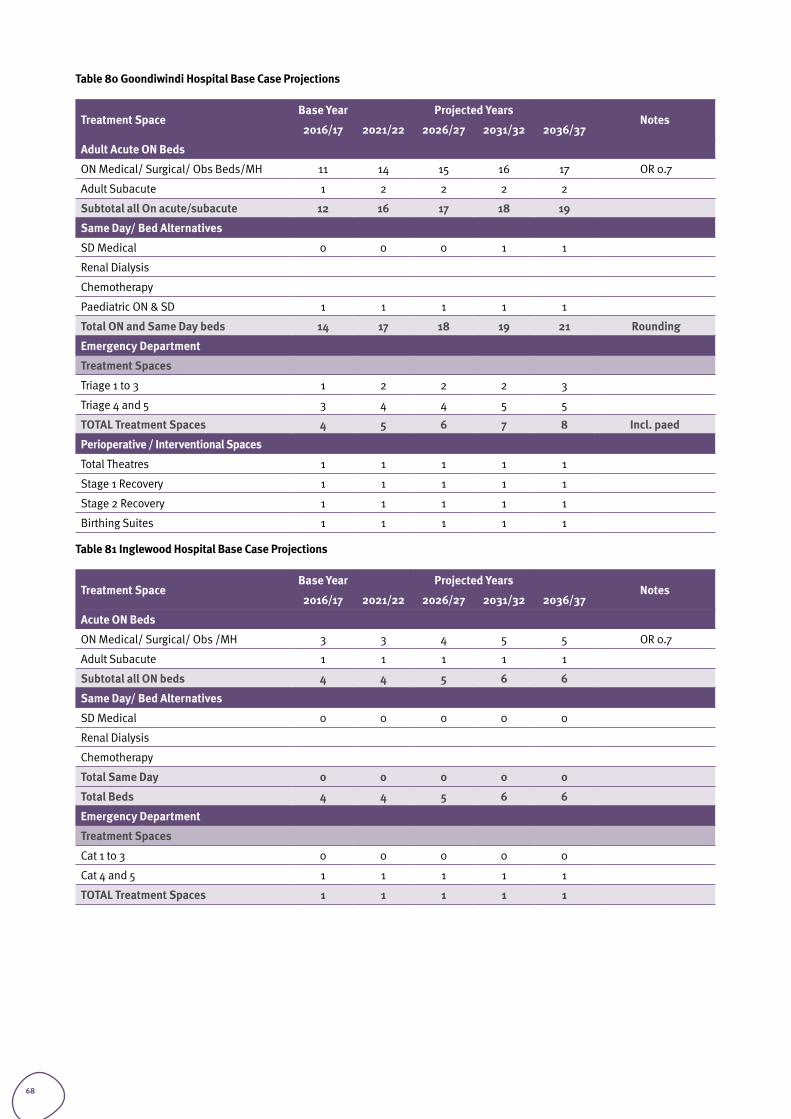
Table 80 Goondiwindi Hospital Base Case Projections
Treatment SpaceBase Year Projected Years
Notes2016/17 2021/22 2026/27 2031/32 2036/37
Adult Acute ON Beds
ON Medical/ Surgical/ Obs Beds/MH 11 14 15 16 17 OR 0.7
Adult Subacute 1 2 2 2 2
Subtotal all On acute/subacute 12 16 17 18 19
Same Day/ Bed Alternatives
SD Medical 0 0 0 1 1
Renal Dialysis
Chemotherapy
Paediatric ON & SD 1 1 1 1 1
Total ON and Same Day beds 14 17 18 19 21 Rounding
Emergency Department
Treatment Spaces
Triage 1 to 3 1 2 2 2 3
Triage 4 and 5 3 4 4 5 5
TOTAL Treatment Spaces 4 5 6 7 8 Incl. paed
Perioperative / Interventional Spaces
Total Theatres 1 1 1 1 1
Stage 1 Recovery 1 1 1 1 1
Stage 2 Recovery 1 1 1 1 1
Birthing Suites 1 1 1 1 1
Table 81 Inglewood Hospital Base Case Projections
Treatment SpaceBase Year Projected Years
Notes2016/17 2021/22 2026/27 2031/32 2036/37
Acute ON Beds
ON Medical/ Surgical/ Obs /MH 3 3 4 5 5 OR 0.7
Adult Subacute 1 1 1 1 1
Subtotal all ON beds 4 4 5 6 6
Same Day/ Bed Alternatives
SD Medical 0 0 0 0 0
Renal Dialysis
Chemotherapy
Total Same Day 0 0 0 0 0
Total Beds 4 4 5 6 6
Emergency Department
Treatment Spaces
Cat 1 to 3 0 0 0 0 0
Cat 4 and 5 1 1 1 1 1
TOTAL Treatment Spaces 1 1 1 1 1
68
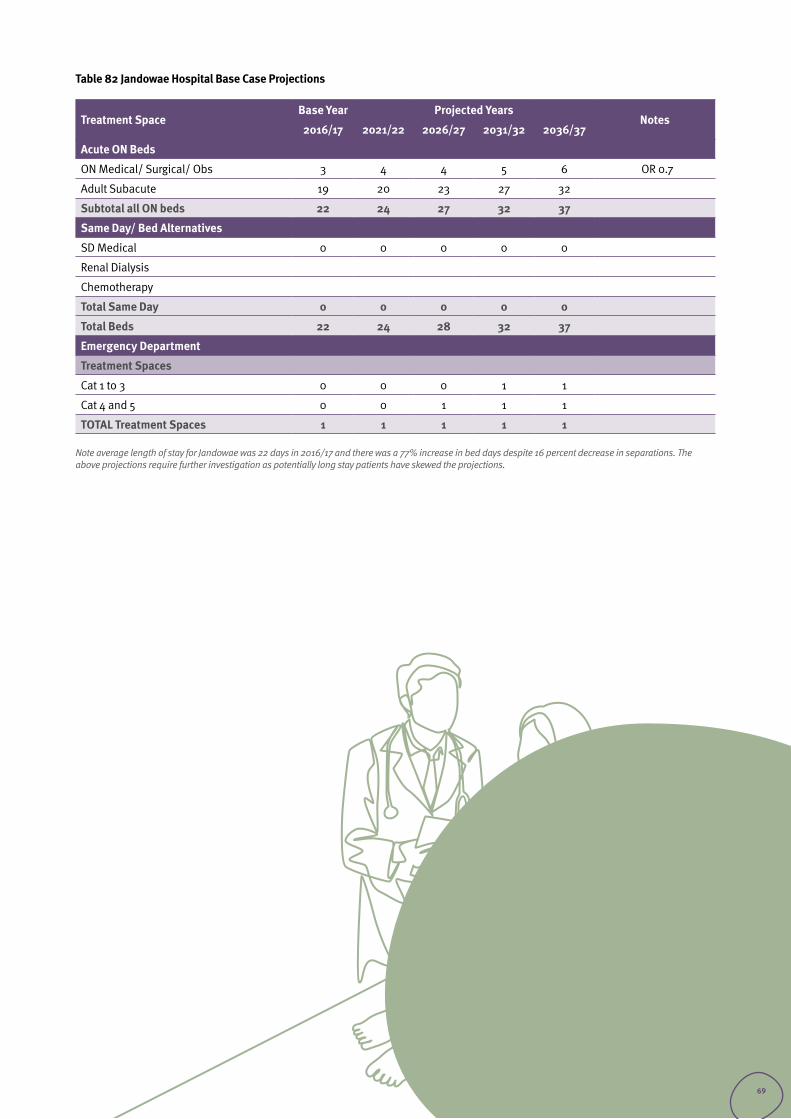
Table 82 Jandowae Hospital Base Case Projections
Treatment SpaceBase Year Projected Years
Notes2016/17 2021/22 2026/27 2031/32 2036/37
Acute ON Beds
ON Medical/ Surgical/ Obs 3 4 4 5 6 OR 0.7
Adult Subacute 19 20 23 27 32
Subtotal all ON beds 22 24 27 32 37
Same Day/ Bed Alternatives
SD Medical 0 0 0 0 0
Renal Dialysis
Chemotherapy
Total Same Day 0 0 0 0 0
Total Beds 22 24 28 32 37
Emergency Department
Treatment Spaces
Cat 1 to 3 0 0 0 1 1
Cat 4 and 5 0 0 1 1 1
TOTAL Treatment Spaces 1 1 1 1 1
Note average length of stay for Jandowae was 22 days in 2016/17 and there was a 77% increase in bed days despite 16 percent decrease in separations. The above projections require further investigation as potentially long stay patients have skewed the projections.
69
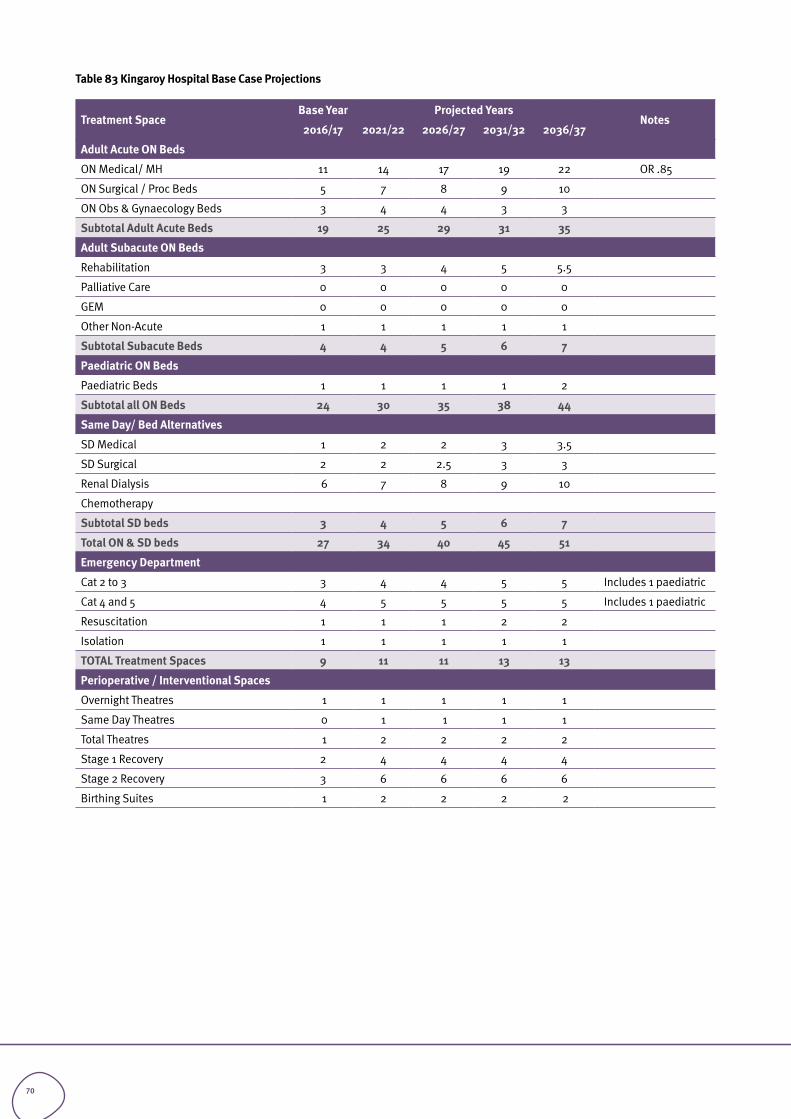
Table 83 Kingaroy Hospital Base Case Projections
Treatment SpaceBase Year Projected Years
Notes2016/17 2021/22 2026/27 2031/32 2036/37
Adult Acute ON Beds
ON Medical/ MH 11 14 17 19 22 OR .85
ON Surgical / Proc Beds 5 7 8 9 10
ON Obs & Gynaecology Beds 3 4 4 3 3
Subtotal Adult Acute Beds 19 25 29 31 35
Adult Subacute ON Beds
Rehabilitation 3 3 4 5 5.5
Palliative Care 0 0 0 0 0
GEM 0 0 0 0 0
Other Non-Acute 1 1 1 1 1
Subtotal Subacute Beds 4 4 5 6 7
Paediatric ON Beds
Paediatric Beds 1 1 1 1 2
Subtotal all ON Beds 24 30 35 38 44
Same Day/ Bed Alternatives
SD Medical 1 2 2 3 3.5
SD Surgical 2 2 2.5 3 3
Renal Dialysis 6 7 8 9 10
Chemotherapy
Subtotal SD beds 3 4 5 6 7
Total ON & SD beds 27 34 40 45 51
Emergency Department
Cat 2 to 3 3 4 4 5 5 Includes 1 paediatric
Cat 4 and 5 4 5 5 5 5 Includes 1 paediatric
Resuscitation 1 1 1 2 2
Isolation 1 1 1 1 1
TOTAL Treatment Spaces 9 11 11 13 13
Perioperative / Interventional Spaces
Overnight Theatres 1 1 1 1 1
Same Day Theatres 0 1 1 1 1
Total Theatres 1 2 2 2 2
Stage 1 Recovery 2 4 4 4 4
Stage 2 Recovery 3 6 6 6 6
Birthing Suites 1 2 2 2 2
70
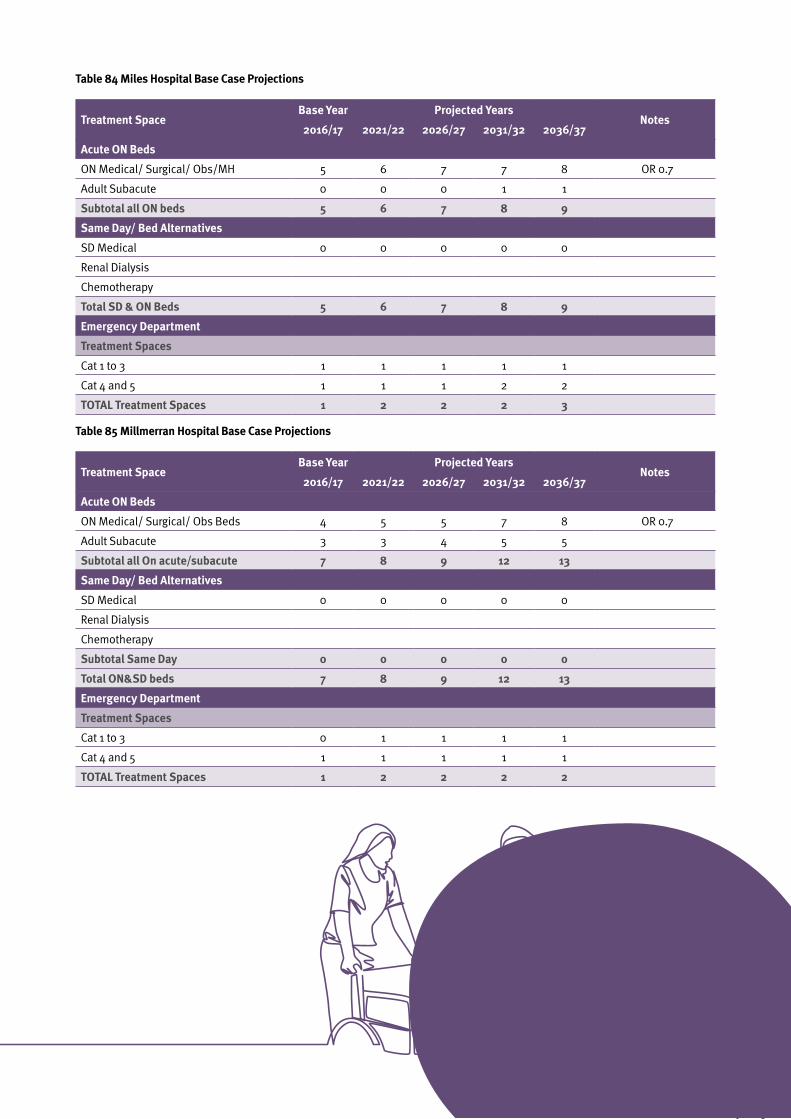
Table 84 Miles Hospital Base Case Projections
Treatment SpaceBase Year Projected Years
Notes2016/17 2021/22 2026/27 2031/32 2036/37
Acute ON Beds
ON Medical/ Surgical/ Obs/MH 5 6 7 7 8 OR 0.7
Adult Subacute 0 0 0 1 1
Subtotal all ON beds 5 6 7 8 9
Same Day/ Bed Alternatives
SD Medical 0 0 0 0 0
Renal Dialysis
Chemotherapy
Total SD & ON Beds 5 6 7 8 9
Emergency Department
Treatment Spaces
Cat 1 to 3 1 1 1 1 1
Cat 4 and 5 1 1 1 2 2
TOTAL Treatment Spaces 1 2 2 2 3
Table 85 Millmerran Hospital Base Case Projections
Treatment SpaceBase Year Projected Years
Notes2016/17 2021/22 2026/27 2031/32 2036/37
Acute ON Beds
ON Medical/ Surgical/ Obs Beds 4 5 5 7 8 OR 0.7
Adult Subacute 3 3 4 5 5
Subtotal all On acute/subacute 7 8 9 12 13
Same Day/ Bed Alternatives
SD Medical 0 0 0 0 0
Renal Dialysis
Chemotherapy
Subtotal Same Day 0 0 0 0 0
Total ON&SD beds 7 8 9 12 13
Emergency Department
Treatment Spaces
Cat 1 to 3 0 1 1 1 1
Cat 4 and 5 1 1 1 1 1
TOTAL Treatment Spaces 1 2 2 2 2
71
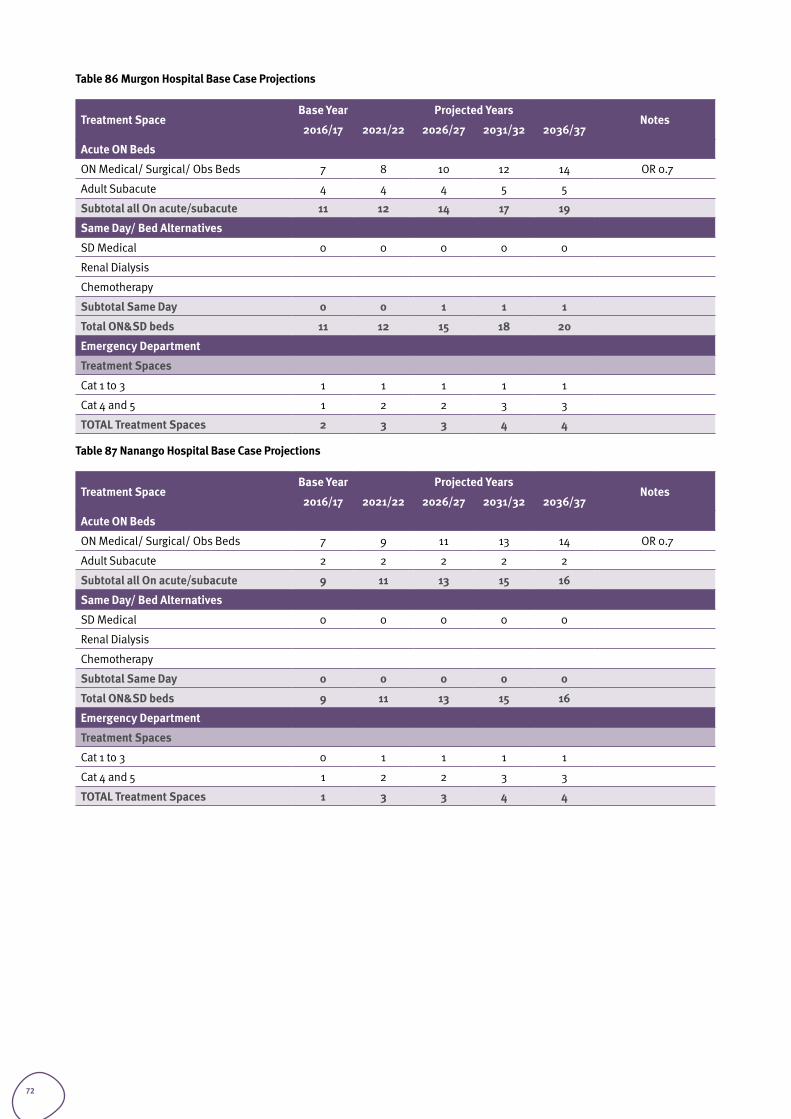
Table 86 Murgon Hospital Base Case Projections
Treatment SpaceBase Year Projected Years
Notes2016/17 2021/22 2026/27 2031/32 2036/37
Acute ON Beds
ON Medical/ Surgical/ Obs Beds 7 8 10 12 14 OR 0.7
Adult Subacute 4 4 4 5 5
Subtotal all On acute/subacute 11 12 14 17 19
Same Day/ Bed Alternatives
SD Medical 0 0 0 0 0
Renal Dialysis
Chemotherapy
Subtotal Same Day 0 0 1 1 1
Total ON&SD beds 11 12 15 18 20
Emergency Department
Treatment Spaces
Cat 1 to 3 1 1 1 1 1
Cat 4 and 5 1 2 2 3 3
TOTAL Treatment Spaces 2 3 3 4 4
Table 87 Nanango Hospital Base Case Projections
Treatment SpaceBase Year Projected Years
Notes2016/17 2021/22 2026/27 2031/32 2036/37
Acute ON Beds
ON Medical/ Surgical/ Obs Beds 7 9 11 13 14 OR 0.7
Adult Subacute 2 2 2 2 2
Subtotal all On acute/subacute 9 11 13 15 16
Same Day/ Bed Alternatives
SD Medical 0 0 0 0 0
Renal Dialysis
Chemotherapy
Subtotal Same Day 0 0 0 0 0
Total ON&SD beds 9 11 13 15 16
Emergency Department
Treatment Spaces
Cat 1 to 3 0 1 1 1 1
Cat 4 and 5 1 2 2 3 3
TOTAL Treatment Spaces 1 3 3 4 4
72
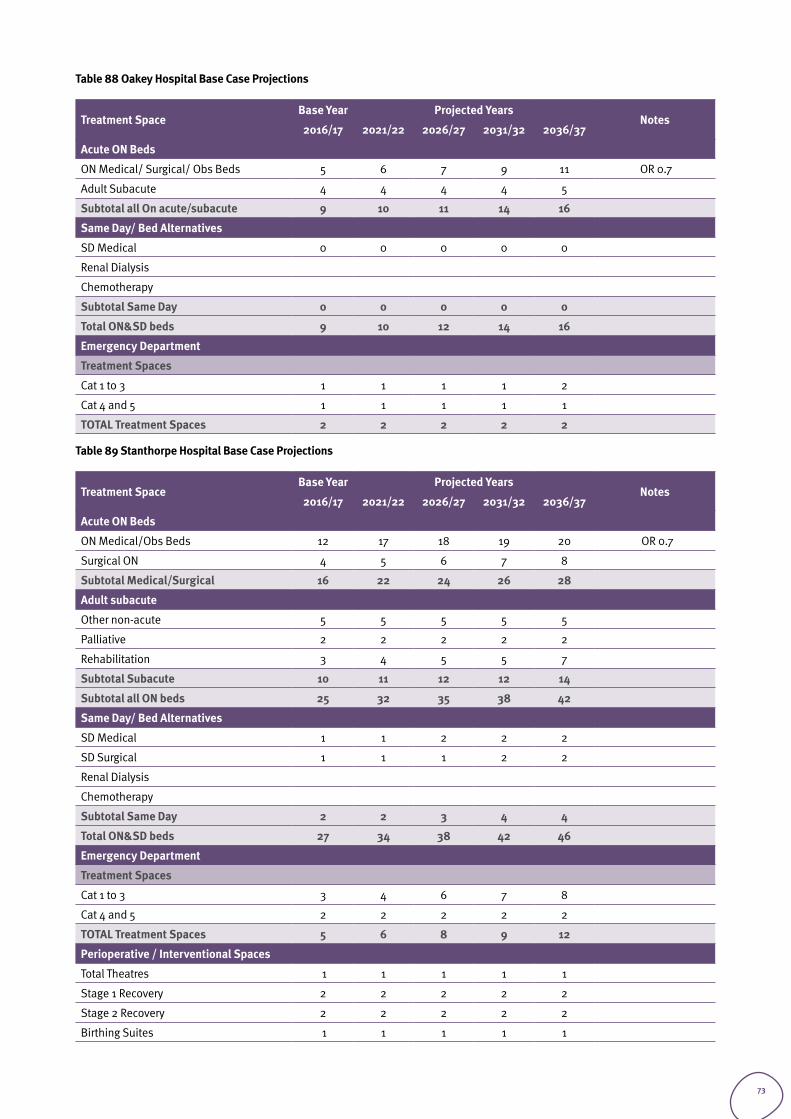
Table 88 Oakey Hospital Base Case Projections
Treatment SpaceBase Year Projected Years
Notes2016/17 2021/22 2026/27 2031/32 2036/37
Acute ON Beds
ON Medical/ Surgical/ Obs Beds 5 6 7 9 11 OR 0.7
Adult Subacute 4 4 4 4 5
Subtotal all On acute/subacute 9 10 11 14 16
Same Day/ Bed Alternatives
SD Medical 0 0 0 0 0
Renal Dialysis
Chemotherapy
Subtotal Same Day 0 0 0 0 0
Total ON&SD beds 9 10 12 14 16
Emergency Department
Treatment Spaces
Cat 1 to 3 1 1 1 1 2
Cat 4 and 5 1 1 1 1 1
TOTAL Treatment Spaces 2 2 2 2 2
Table 89 Stanthorpe Hospital Base Case Projections
Treatment SpaceBase Year Projected Years
Notes2016/17 2021/22 2026/27 2031/32 2036/37
Acute ON Beds
ON Medical/Obs Beds 12 17 18 19 20 OR 0.7
Surgical ON 4 5 6 7 8
Subtotal Medical/Surgical 16 22 24 26 28
Adult subacute
Other non-acute 5 5 5 5 5
Palliative 2 2 2 2 2
Rehabilitation 3 4 5 5 7
Subtotal Subacute 10 11 12 12 14
Subtotal all ON beds 25 32 35 38 42
Same Day/ Bed Alternatives
SD Medical 1 1 2 2 2
SD Surgical 1 1 1 2 2
Renal Dialysis
Chemotherapy
Subtotal Same Day 2 2 3 4 4
Total ON&SD beds 27 34 38 42 46
Emergency Department
Treatment Spaces
Cat 1 to 3 3 4 6 7 8
Cat 4 and 5 2 2 2 2 2
TOTAL Treatment Spaces 5 6 8 9 12
Perioperative / Interventional Spaces
Total Theatres 1 1 1 1 1
Stage 1 Recovery 2 2 2 2 2
Stage 2 Recovery 2 2 2 2 2
Birthing Suites 1 1 1 1 1
73
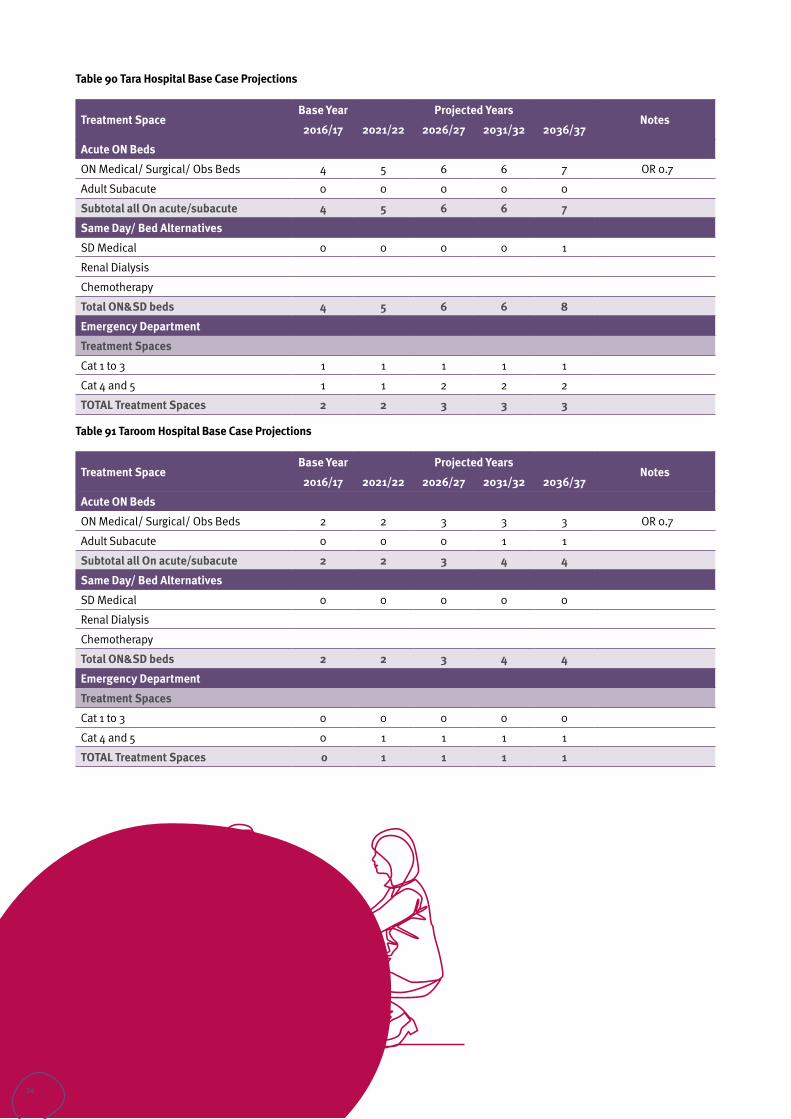
Table 90 Tara Hospital Base Case Projections
Treatment SpaceBase Year Projected Years
Notes2016/17 2021/22 2026/27 2031/32 2036/37
Acute ON Beds
ON Medical/ Surgical/ Obs Beds 4 5 6 6 7 OR 0.7
Adult Subacute 0 0 0 0 0
Subtotal all On acute/subacute 4 5 6 6 7
Same Day/ Bed Alternatives
SD Medical 0 0 0 0 1
Renal Dialysis
Chemotherapy
Total ON&SD beds 4 5 6 6 8
Emergency Department
Treatment Spaces
Cat 1 to 3 1 1 1 1 1
Cat 4 and 5 1 1 2 2 2
TOTAL Treatment Spaces 2 2 3 3 3
Table 91 Taroom Hospital Base Case Projections
Treatment SpaceBase Year Projected Years
Notes2016/17 2021/22 2026/27 2031/32 2036/37
Acute ON Beds
ON Medical/ Surgical/ Obs Beds 2 2 3 3 3 OR 0.7
Adult Subacute 0 0 0 1 1
Subtotal all On acute/subacute 2 2 3 4 4
Same Day/ Bed Alternatives
SD Medical 0 0 0 0 0
Renal Dialysis
Chemotherapy
Total ON&SD beds 2 2 3 4 4
Emergency Department
Treatment Spaces
Cat 1 to 3 0 0 0 0 0
Cat 4 and 5 0 1 1 1 1
TOTAL Treatment Spaces 0 1 1 1 1
74
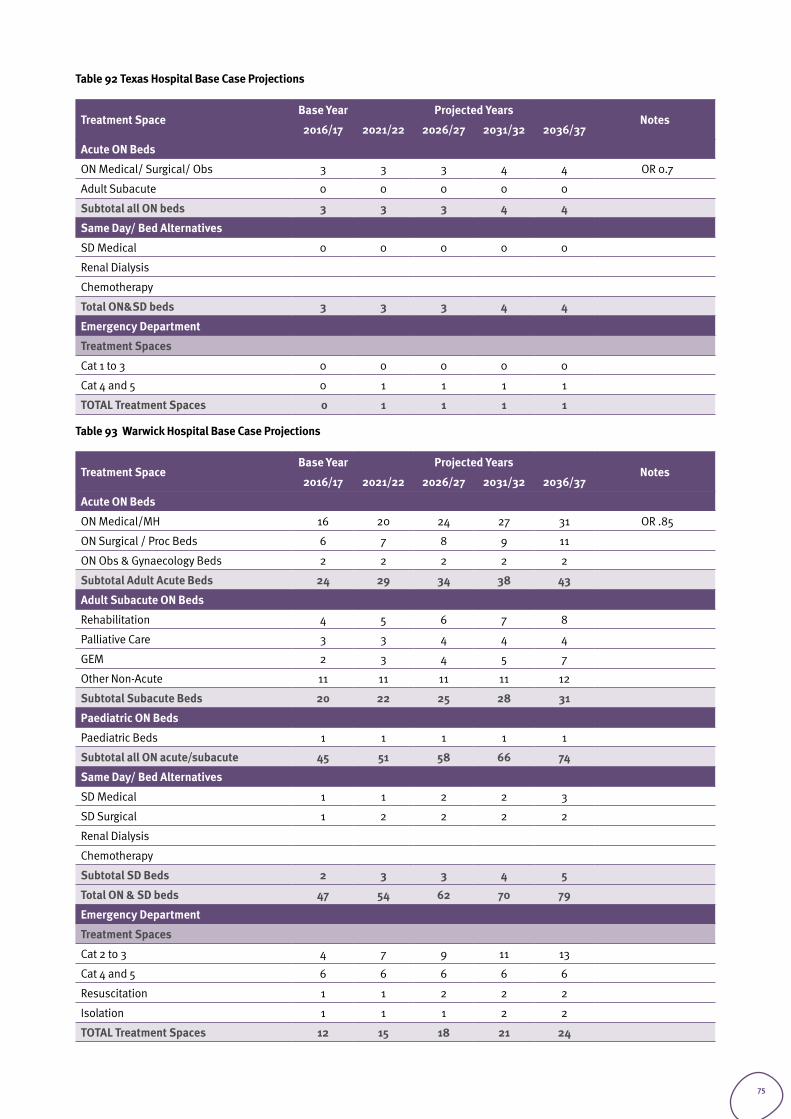
Table 92 Texas Hospital Base Case Projections
Treatment SpaceBase Year Projected Years
Notes2016/17 2021/22 2026/27 2031/32 2036/37
Acute ON Beds
ON Medical/ Surgical/ Obs 3 3 3 4 4 OR 0.7
Adult Subacute 0 0 0 0 0
Subtotal all ON beds 3 3 3 4 4
Same Day/ Bed Alternatives
SD Medical 0 0 0 0 0
Renal Dialysis
Chemotherapy
Total ON&SD beds 3 3 3 4 4
Emergency Department
Treatment Spaces
Cat 1 to 3 0 0 0 0 0
Cat 4 and 5 0 1 1 1 1
TOTAL Treatment Spaces 0 1 1 1 1
Table 93 Warwick Hospital Base Case Projections
Treatment SpaceBase Year Projected Years
Notes2016/17 2021/22 2026/27 2031/32 2036/37
Acute ON Beds
ON Medical/MH 16 20 24 27 31 OR .85
ON Surgical / Proc Beds 6 7 8 9 11
ON Obs & Gynaecology Beds 2 2 2 2 2
Subtotal Adult Acute Beds 24 29 34 38 43
Adult Subacute ON Beds
Rehabilitation 4 5 6 7 8
Palliative Care 3 3 4 4 4
GEM 2 3 4 5 7
Other Non-Acute 11 11 11 11 12
Subtotal Subacute Beds 20 22 25 28 31
Paediatric ON Beds
Paediatric Beds 1 1 1 1 1
Subtotal all ON acute/subacute 45 51 58 66 74
Same Day/ Bed Alternatives
SD Medical 1 1 2 2 3
SD Surgical 1 2 2 2 2
Renal Dialysis
Chemotherapy
Subtotal SD Beds 2 3 3 4 5
Total ON & SD beds 47 54 62 70 79
Emergency Department
Treatment Spaces
Cat 2 to 3 4 7 9 11 13
Cat 4 and 5 6 6 6 6 6
Resuscitation 1 1 2 2 2
Isolation 1 1 1 2 2
TOTAL Treatment Spaces 12 15 18 21 24
75
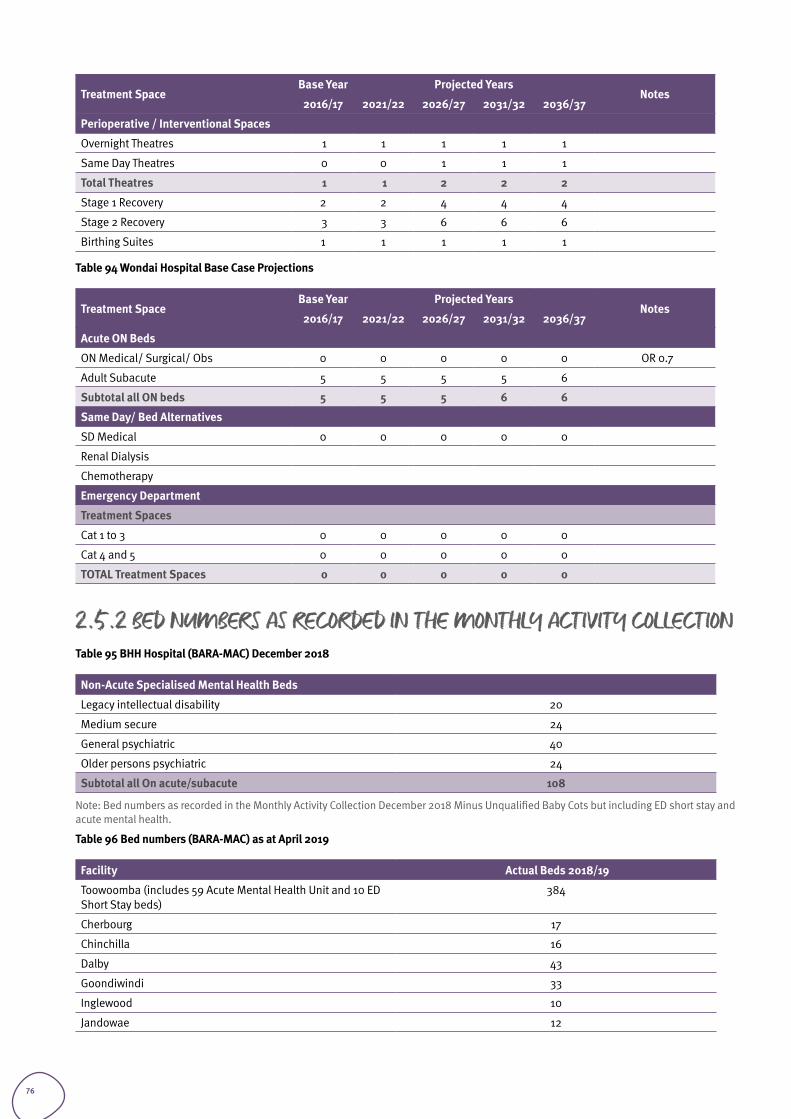
Treatment SpaceBase Year Projected Years
Notes2016/17 2021/22 2026/27 2031/32 2036/37
Perioperative / Interventional Spaces
Overnight Theatres 1 1 1 1 1
Same Day Theatres 0 0 1 1 1
Total Theatres 1 1 2 2 2
Stage 1 Recovery 2 2 4 4 4
Stage 2 Recovery 3 3 6 6 6
Birthing Suites 1 1 1 1 1
Table 94 Wondai Hospital Base Case Projections
Treatment SpaceBase Year Projected Years
Notes2016/17 2021/22 2026/27 2031/32 2036/37
Acute ON Beds
ON Medical/ Surgical/ Obs 0 0 0 0 0 OR 0.7
Adult Subacute 5 5 5 5 6
Subtotal all ON beds 5 5 5 6 6
Same Day/ Bed Alternatives
SD Medical 0 0 0 0 0
Renal Dialysis
Chemotherapy
Emergency Department
Treatment Spaces
Cat 1 to 3 0 0 0 0 0
Cat 4 and 5 0 0 0 0 0
TOTAL Treatment Spaces 0 0 0 0 0
2.5.2 BED NUMBERS AS RECORDED IN THE MONTHLY ACTIVITY COLLECTIONTable 95 BHH Hospital (BARA-MAC) December 2018
Non-Acute Specialised Mental Health Beds
Legacy intellectual disability 20
Medium secure 24
General psychiatric 40
Older persons psychiatric 24
Subtotal all On acute/subacute 108
Note: Bed numbers as recorded in the Monthly Activity Collection December 2018 Minus Unqualified Baby Cots but including ED short stay and acute mental health.
Table 96 Bed numbers (BARA-MAC) as at April 2019
Facility Actual Beds 2018/19
Toowoomba (includes 59 Acute Mental Health Unit and 10 ED Short Stay beds)
384
Cherbourg 17
Chinchilla 16
Dalby 43
Goondiwindi 33
Inglewood 10
Jandowae 12
76
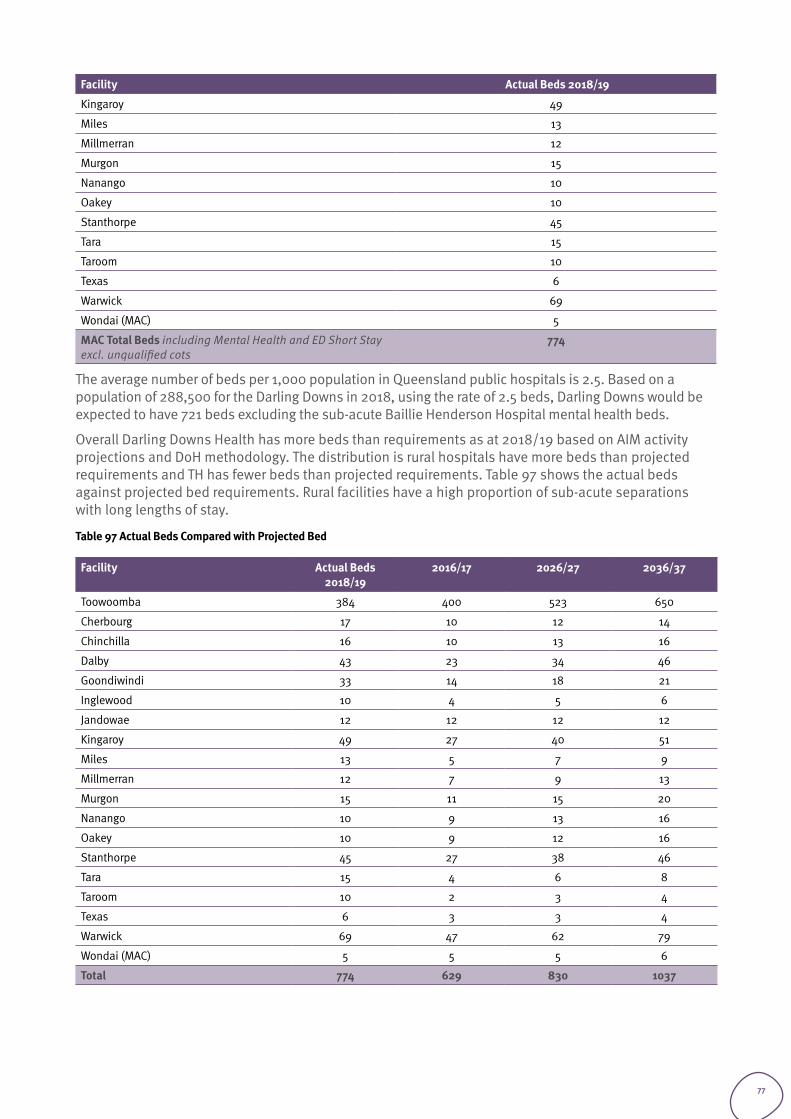
Facility Actual Beds 2018/19
Kingaroy 49
Miles 13
Millmerran 12
Murgon 15
Nanango 10
Oakey 10
Stanthorpe 45
Tara 15
Taroom 10
Texas 6
Warwick 69
Wondai (MAC) 5
MAC Total Beds including Mental Health and ED Short Stay excl. unqualified cots
774
The average number of beds per 1,000 population in Queensland public hospitals is 2.5. Based on a population of 288,500 for the Darling Downs in 2018, using the rate of 2.5 beds, Darling Downs would be expected to have 721 beds excluding the sub-acute Baillie Henderson Hospital mental health beds.
Overall Darling Downs Health has more beds than requirements as at 2018/19 based on AIM activity projections and DoH methodology. The distribution is rural hospitals have more beds than projected requirements and TH has fewer beds than projected requirements. Table 97 shows the actual beds against projected bed requirements. Rural facilities have a high proportion of sub-acute separations with long lengths of stay.
Table 97 Actual Beds Compared with Projected Bed
Facility Actual Beds 2018/19
2016/17 2026/27 2036/37
Toowoomba 384 400 523 650
Cherbourg 17 10 12 14
Chinchilla 16 10 13 16
Dalby 43 23 34 46
Goondiwindi 33 14 18 21
Inglewood 10 4 5 6
Jandowae 12 12 12 12
Kingaroy 49 27 40 51
Miles 13 5 7 9
Millmerran 12 7 9 13
Murgon 15 11 15 20
Nanango 10 9 13 16
Oakey 10 9 12 16
Stanthorpe 45 27 38 46
Tara 15 4 6 8
Taroom 10 2 3 4
Texas 6 3 3 4
Warwick 69 47 62 79
Wondai (MAC) 5 5 5 6
Total 774 629 830 1037
77
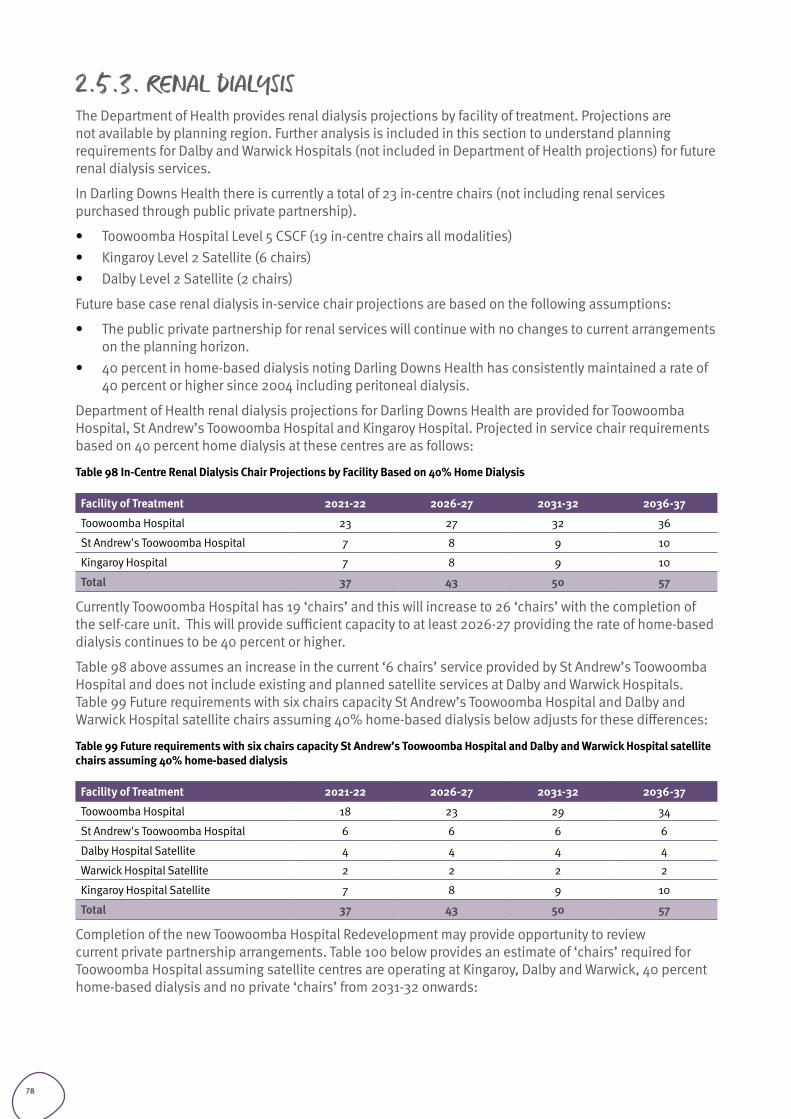
2.5.3. RENAL DIALYSISThe Department of Health provides renal dialysis projections by facility of treatment. Projections are not available by planning region. Further analysis is included in this section to understand planning requirements for Dalby and Warwick Hospitals (not included in Department of Health projections) for future renal dialysis services.
In Darling Downs Health there is currently a total of 23 in-centre chairs (not including renal services purchased through public private partnership).
• Toowoomba Hospital Level 5 CSCF (19 in-centre chairs all modalities)• Kingaroy Level 2 Satellite (6 chairs)• Dalby Level 2 Satellite (2 chairs)
Future base case renal dialysis in-service chair projections are based on the following assumptions:
• The public private partnership for renal services will continue with no changes to current arrangements on the planning horizon.
• 40 percent in home-based dialysis noting Darling Downs Health has consistently maintained a rate of 40 percent or higher since 2004 including peritoneal dialysis.
Department of Health renal dialysis projections for Darling Downs Health are provided for Toowoomba Hospital, St Andrew’s Toowoomba Hospital and Kingaroy Hospital. Projected in service chair requirements based on 40 percent home dialysis at these centres are as follows:
Table 98 In-Centre Renal Dialysis Chair Projections by Facility Based on 40% Home Dialysis
Facility of Treatment 2021-22 2026-27 2031-32 2036-37
Toowoomba Hospital 23 27 32 36
St Andrew's Toowoomba Hospital 7 8 9 10
Kingaroy Hospital 7 8 9 10
Total 37 43 50 57
Currently Toowoomba Hospital has 19 ‘chairs’ and this will increase to 26 ‘chairs’ with the completion of the self-care unit. This will provide sufficient capacity to at least 2026-27 providing the rate of home-based dialysis continues to be 40 percent or higher.
Table 98 above assumes an increase in the current ‘6 chairs’ service provided by St Andrew’s Toowoomba Hospital and does not include existing and planned satellite services at Dalby and Warwick Hospitals. Table 99 Future requirements with six chairs capacity St Andrew’s Toowoomba Hospital and Dalby and Warwick Hospital satellite chairs assuming 40% home-based dialysis below adjusts for these differences:
Table 99 Future requirements with six chairs capacity St Andrew’s Toowoomba Hospital and Dalby and Warwick Hospital satellite chairs assuming 40% home-based dialysis
Facility of Treatment 2021-22 2026-27 2031-32 2036-37
Toowoomba Hospital 18 23 29 34
St Andrew's Toowoomba Hospital 6 6 6 6
Dalby Hospital Satellite 4 4 4 4
Warwick Hospital Satellite 2 2 2 2
Kingaroy Hospital Satellite 7 8 9 10
Total 37 43 50 57
Completion of the new Toowoomba Hospital Redevelopment may provide opportunity to review current private partnership arrangements. Table 100 below provides an estimate of ‘chairs’ required for Toowoomba Hospital assuming satellite centres are operating at Kingaroy, Dalby and Warwick, 40 percent home-based dialysis and no private ‘chairs’ from 2031-32 onwards:
78
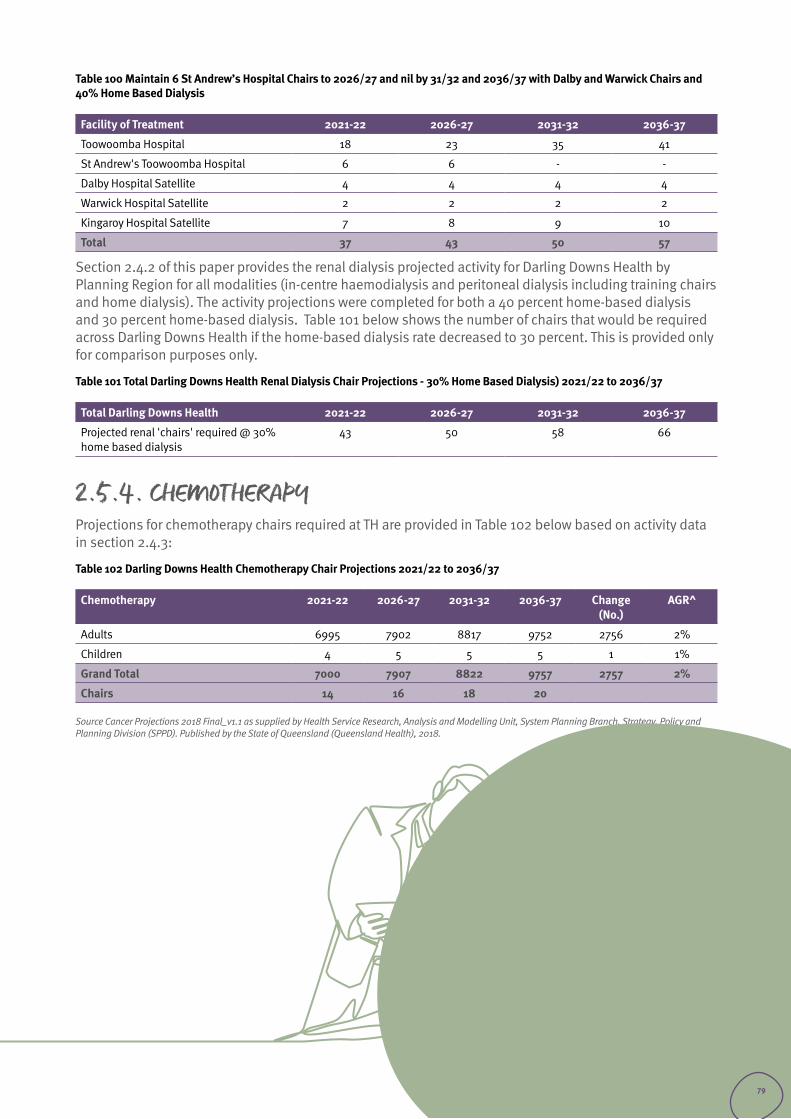
Table 100 Maintain 6 St Andrew’s Hospital Chairs to 2026/27 and nil by 31/32 and 2036/37 with Dalby and Warwick Chairs and 40% Home Based Dialysis
Facility of Treatment 2021-22 2026-27 2031-32 2036-37
Toowoomba Hospital 18 23 35 41
St Andrew's Toowoomba Hospital 6 6 - -
Dalby Hospital Satellite 4 4 4 4
Warwick Hospital Satellite 2 2 2 2
Kingaroy Hospital Satellite 7 8 9 10
Total 37 43 50 57
Section 2.4.2 of this paper provides the renal dialysis projected activity for Darling Downs Health by Planning Region for all modalities (in-centre haemodialysis and peritoneal dialysis including training chairs and home dialysis). The activity projections were completed for both a 40 percent home-based dialysis and 30 percent home-based dialysis. Table 101 below shows the number of chairs that would be required across Darling Downs Health if the home-based dialysis rate decreased to 30 percent. This is provided only for comparison purposes only.
Table 101 Total Darling Downs Health Renal Dialysis Chair Projections - 30% Home Based Dialysis) 2021/22 to 2036/37
Total Darling Downs Health 2021-22 2026-27 2031-32 2036-37
Projected renal 'chairs' required @ 30% home based dialysis
43 50 58 66
2.5.4. CHEMOTHERAPYProjections for chemotherapy chairs required at TH are provided in Table 102 below based on activity data in section 2.4.3:
Table 102 Darling Downs Health Chemotherapy Chair Projections 2021/22 to 2036/37
Chemotherapy 2021-22 2026-27 2031-32 2036-37 Change (No.)
AGR^
Adults 6995 7902 8817 9752 2756 2%
Children 4 5 5 5 1 1%
Grand Total 7000 7907 8822 9757 2757 2%
Chairs 14 16 18 20
Source Cancer Projections 2018 Final_v1.1 as supplied by Health Service Research, Analysis and Modelling Unit, System Planning Branch, Strategy, Policy and Planning Division (SPPD). Published by the State of Queensland (Queensland Health), 2018.
79
Changing Models of Care
Section 3
80
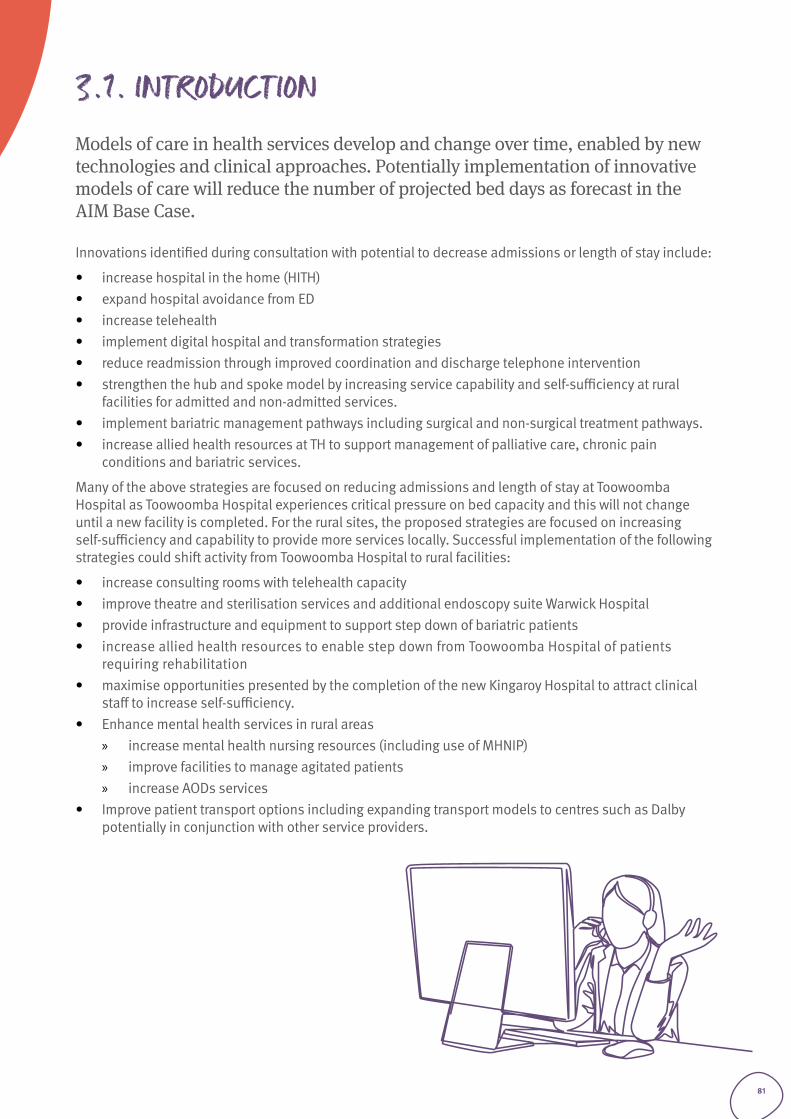
3.1. INTRODUCTION Models of care in health services develop and change over time, enabled by new technologies and clinical approaches. Potentially implementation of innovative models of care will reduce the number of projected bed days as forecast in the AIM Base Case.
Innovations identified during consultation with potential to decrease admissions or length of stay include:
• increase hospital in the home (HITH)• expand hospital avoidance from ED• increase telehealth• implement digital hospital and transformation strategies• reduce readmission through improved coordination and discharge telephone intervention• strengthen the hub and spoke model by increasing service capability and self-sufficiency at rural
facilities for admitted and non-admitted services.• implement bariatric management pathways including surgical and non-surgical treatment pathways.• increase allied health resources at TH to support management of palliative care, chronic pain
conditions and bariatric services.
Many of the above strategies are focused on reducing admissions and length of stay at Toowoomba Hospital as Toowoomba Hospital experiences critical pressure on bed capacity and this will not change until a new facility is completed. For the rural sites, the proposed strategies are focused on increasing self-sufficiency and capability to provide more services locally. Successful implementation of the following strategies could shift activity from Toowoomba Hospital to rural facilities:
• increase consulting rooms with telehealth capacity• improve theatre and sterilisation services and additional endoscopy suite Warwick Hospital• provide infrastructure and equipment to support step down of bariatric patients• increase allied health resources to enable step down from Toowoomba Hospital of patients
requiring rehabilitation• maximise opportunities presented by the completion of the new Kingaroy Hospital to attract clinical
staff to increase self-sufficiency. • Enhance mental health services in rural areas
» increase mental health nursing resources (including use of MHNIP) » improve facilities to manage agitated patients » increase AODs services
• Improve patient transport options including expanding transport models to centres such as Dalby potentially in conjunction with other service providers.
81
Some strategies that could reduce demand require implementation at a whole of Darling Downs Health level:
• Improve management of patients with dementia (particularly for patients with behaviour that results in discharge delays back to nursing homes or carers)
• Develop effective and efficient models of care for social admission patients.• Increase chronic disease specialists for management of diabetes to manage projected future increase
in morbidity.• Improve Indigenous health services
» Improve integration with Aboriginal Medical Services » Develop role of Indigenous Health Workers » Provide improved outreach paediatric and Child Youth Mental Health Services at Cherbourg Hospital.
Strategies to increase self-sufficiency for speciality services could change patient flows from metropolitan hospitals to Toowoomba Hospital. Other strategies improving access may also lead to an increase in demand for services. Therefore, implementation of the following strategies is likely to increase the projected bed day requirements in the AIM Base Case:
• Increase paediatric services (including early childhood development), ophthalmology, dental care, cancer services and renal services
• Establish an interventional cardiology service at TH• Increase after hours services:
» to support increase in emergency admissions at TH including pathology, pharmacy, allied health and dentistry
» in medical imaging services at rural facilities.
82
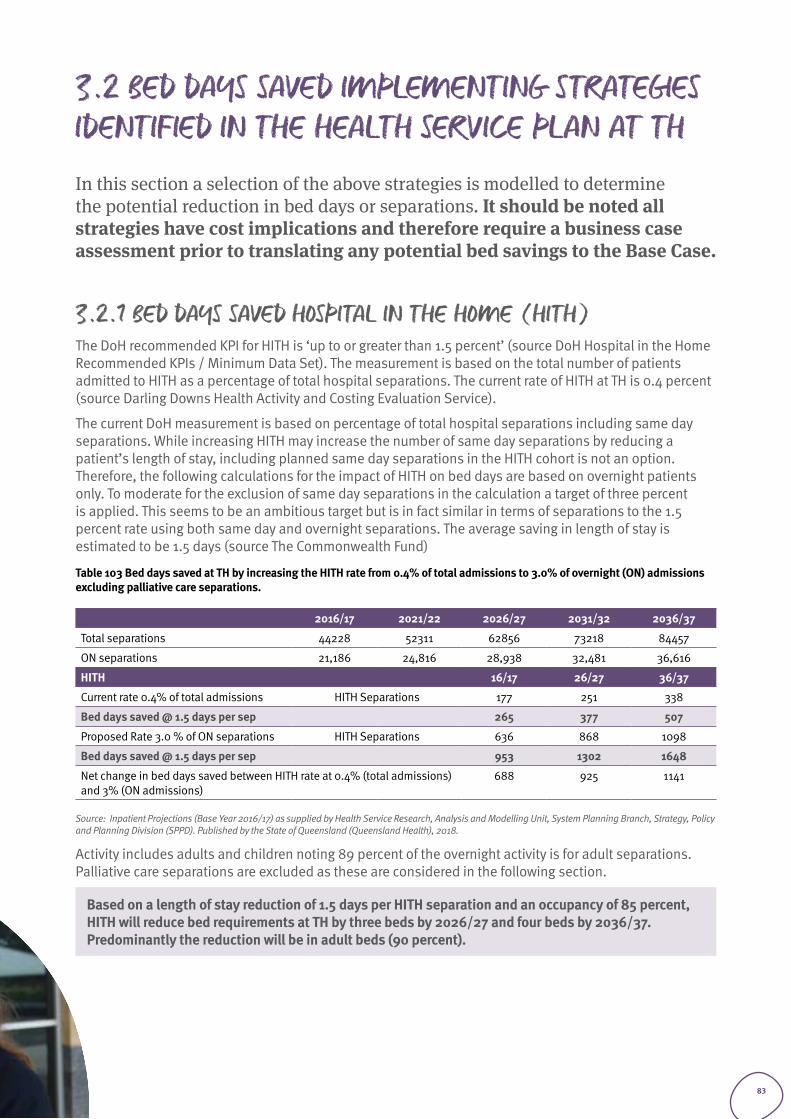
3.2 BED DAYS SAVED IMPLEMENTING STRATEGIES IDENTIFIED IN THE HEALTH SERVICE PLAN AT THIn this section a selection of the above strategies is modelled to determine the potential reduction in bed days or separations. It should be noted all strategies have cost implications and therefore require a business case assessment prior to translating any potential bed savings to the Base Case.
3.2.1 BED DAYS SAVED HOSPITAL IN THE HOME (HITH)The DoH recommended KPI for HITH is ‘up to or greater than 1.5 percent’ (source DoH Hospital in the Home Recommended KPIs / Minimum Data Set). The measurement is based on the total number of patients admitted to HITH as a percentage of total hospital separations. The current rate of HITH at TH is 0.4 percent (source Darling Downs Health Activity and Costing Evaluation Service).
The current DoH measurement is based on percentage of total hospital separations including same day separations. While increasing HITH may increase the number of same day separations by reducing a patient’s length of stay, including planned same day separations in the HITH cohort is not an option. Therefore, the following calculations for the impact of HITH on bed days are based on overnight patients only. To moderate for the exclusion of same day separations in the calculation a target of three percent is applied. This seems to be an ambitious target but is in fact similar in terms of separations to the 1.5 percent rate using both same day and overnight separations. The average saving in length of stay is estimated to be 1.5 days (source The Commonwealth Fund)
Table 103 Bed days saved at TH by increasing the HITH rate from 0.4% of total admissions to 3.0% of overnight (ON) admissions excluding palliative care separations.
2016/17 2021/22 2026/27 2031/32 2036/37
Total separations 44228 52311 62856 73218 84457
ON separations 21,186 24,816 28,938 32,481 36,616
HITH 16/17 26/27 36/37
Current rate 0.4% of total admissions HITH Separations 177 251 338
Bed days saved @ 1.5 days per sep 265 377 507
Proposed Rate 3.0 % of ON separations HITH Separations 636 868 1098
Bed days saved @ 1.5 days per sep 953 1302 1648
Net change in bed days saved between HITH rate at 0.4% (total admissions) and 3% (ON admissions)
688 925 1141
Source: Inpatient Projections (Base Year 2016/17) as supplied by Health Service Research, Analysis and Modelling Unit, System Planning Branch, Strategy, Policy and Planning Division (SPPD). Published by the State of Queensland (Queensland Health), 2018.
Activity includes adults and children noting 89 percent of the overnight activity is for adult separations. Palliative care separations are excluded as these are considered in the following section.
Based on a length of stay reduction of 1.5 days per HITH separation and an occupancy of 85 percent, HITH will reduce bed requirements at TH by three beds by 2026/27 and four beds by 2036/37. Predominantly the reduction will be in adult beds (90 percent).
83
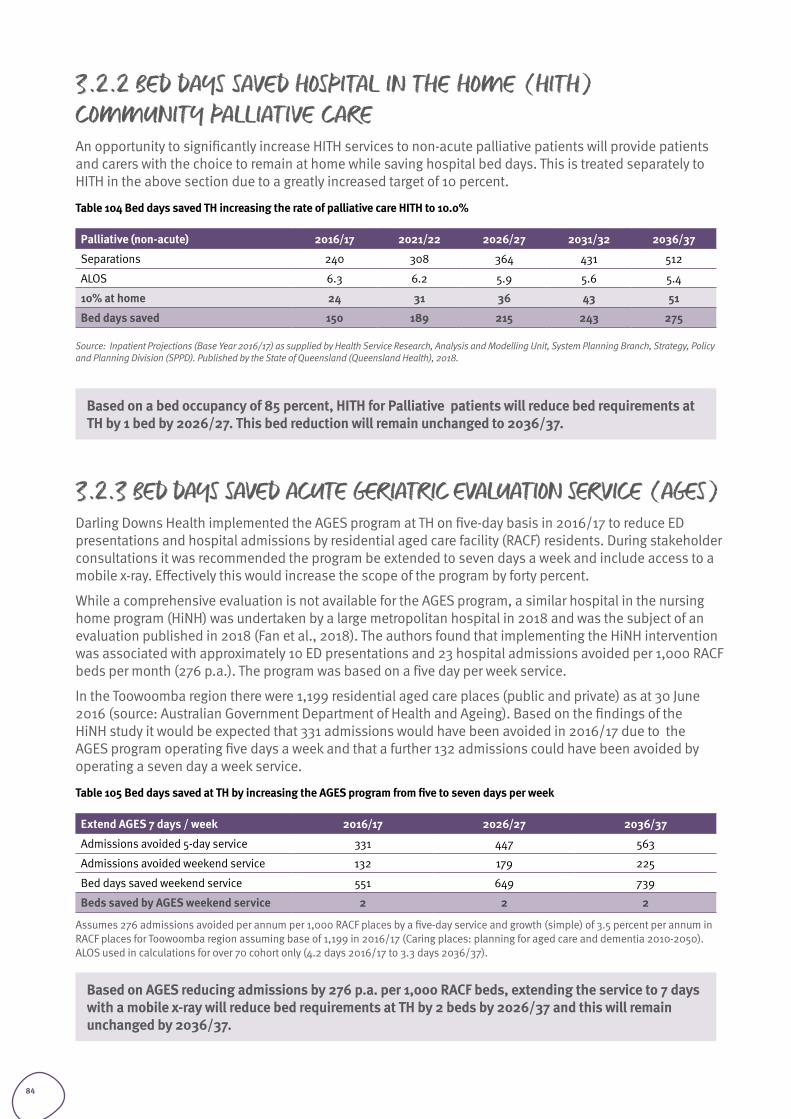
3.2.2 BED DAYS SAVED HOSPITAL IN THE HOME (HITH) COMMUNITY PALLIATIVE CAREAn opportunity to significantly increase HITH services to non-acute palliative patients will provide patients and carers with the choice to remain at home while saving hospital bed days. This is treated separately to HITH in the above section due to a greatly increased target of 10 percent.
Table 104 Bed days saved TH increasing the rate of palliative care HITH to 10.0%
Palliative (non-acute) 2016/17 2021/22 2026/27 2031/32 2036/37
Separations 240 308 364 431 512
ALOS 6.3 6.2 5.9 5.6 5.4
10% at home 24 31 36 43 51
Bed days saved 150 189 215 243 275
Source: Inpatient Projections (Base Year 2016/17) as supplied by Health Service Research, Analysis and Modelling Unit, System Planning Branch, Strategy, Policy and Planning Division (SPPD). Published by the State of Queensland (Queensland Health), 2018.
Based on a bed occupancy of 85 percent, HITH for Palliative patients will reduce bed requirements at TH by 1 bed by 2026/27. This bed reduction will remain unchanged to 2036/37.
3.2.3 BED DAYS SAVED ACUTE GERIATRIC EVALUATION SERVICE (AGES)Darling Downs Health implemented the AGES program at TH on five-day basis in 2016/17 to reduce ED presentations and hospital admissions by residential aged care facility (RACF) residents. During stakeholder consultations it was recommended the program be extended to seven days a week and include access to a mobile x-ray. Effectively this would increase the scope of the program by forty percent.
While a comprehensive evaluation is not available for the AGES program, a similar hospital in the nursing home program (HiNH) was undertaken by a large metropolitan hospital in 2018 and was the subject of an evaluation published in 2018 (Fan et al., 2018). The authors found that implementing the HiNH intervention was associated with approximately 10 ED presentations and 23 hospital admissions avoided per 1,000 RACF beds per month (276 p.a.). The program was based on a five day per week service.
In the Toowoomba region there were 1,199 residential aged care places (public and private) as at 30 June 2016 (source: Australian Government Department of Health and Ageing). Based on the findings of the HiNH study it would be expected that 331 admissions would have been avoided in 2016/17 due to the AGES program operating five days a week and that a further 132 admissions could have been avoided by operating a seven day a week service.
Table 105 Bed days saved at TH by increasing the AGES program from five to seven days per week
Extend AGES 7 days / week 2016/17 2026/27 2036/37
Admissions avoided 5-day service 331 447 563
Admissions avoided weekend service 132 179 225
Bed days saved weekend service 551 649 739
Beds saved by AGES weekend service 2 2 2
Assumes 276 admissions avoided per annum per 1,000 RACF places by a five-day service and growth (simple) of 3.5 percent per annum in RACF places for Toowoomba region assuming base of 1,199 in 2016/17 (Caring places: planning for aged care and dementia 2010-2050). ALOS used in calculations for over 70 cohort only (4.2 days 2016/17 to 3.3 days 2036/37).
Based on AGES reducing admissions by 276 p.a. per 1,000 RACF beds, extending the service to 7 days with a mobile x-ray will reduce bed requirements at TH by 2 beds by 2026/37 and this will remain unchanged by 2036/37.
84
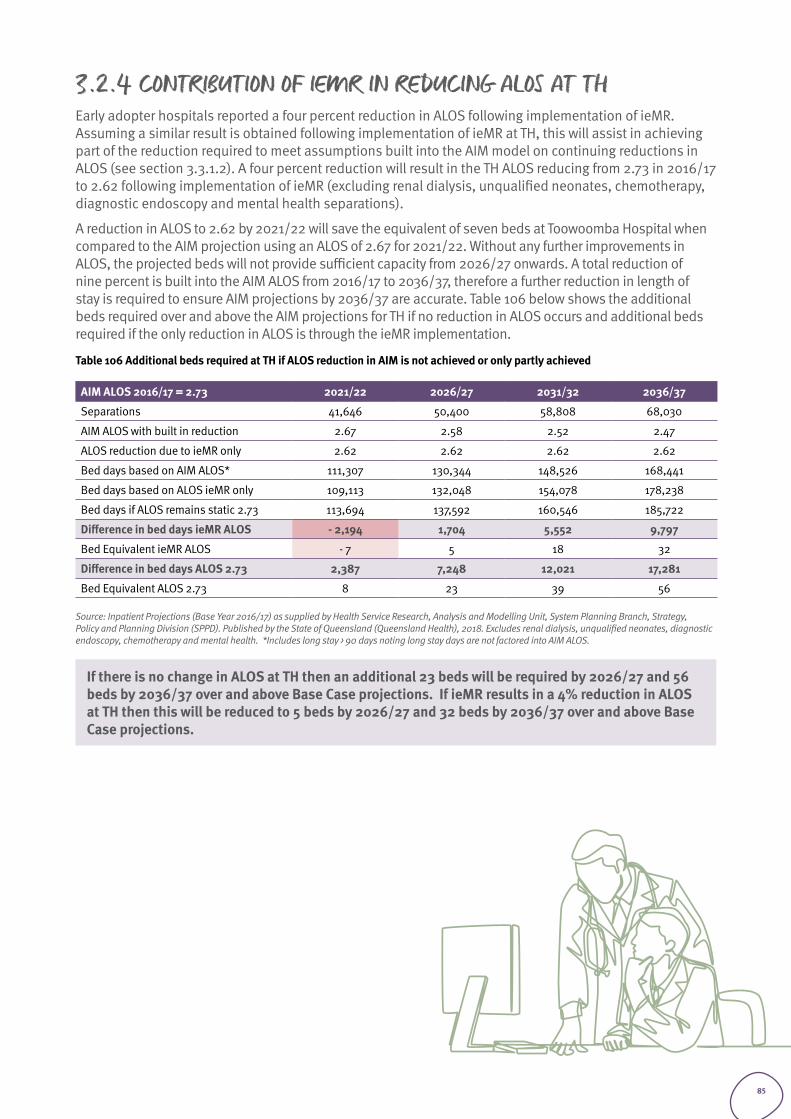
3.2.4 CONTRIBUTION OF IEMR IN REDUCING ALOS AT THEarly adopter hospitals reported a four percent reduction in ALOS following implementation of ieMR. Assuming a similar result is obtained following implementation of ieMR at TH, this will assist in achieving part of the reduction required to meet assumptions built into the AIM model on continuing reductions in ALOS (see section 3.3.1.2). A four percent reduction will result in the TH ALOS reducing from 2.73 in 2016/17 to 2.62 following implementation of ieMR (excluding renal dialysis, unqualified neonates, chemotherapy, diagnostic endoscopy and mental health separations).
A reduction in ALOS to 2.62 by 2021/22 will save the equivalent of seven beds at Toowoomba Hospital when compared to the AIM projection using an ALOS of 2.67 for 2021/22. Without any further improvements in ALOS, the projected beds will not provide sufficient capacity from 2026/27 onwards. A total reduction of nine percent is built into the AIM ALOS from 2016/17 to 2036/37, therefore a further reduction in length of stay is required to ensure AIM projections by 2036/37 are accurate. Table 106 below shows the additional beds required over and above the AIM projections for TH if no reduction in ALOS occurs and additional beds required if the only reduction in ALOS is through the ieMR implementation.
Table 106 Additional beds required at TH if ALOS reduction in AIM is not achieved or only partly achieved
AIM ALOS 2016/17 = 2.73 2021/22 2026/27 2031/32 2036/37
Separations 41,646 50,400 58,808 68,030
AIM ALOS with built in reduction 2.67 2.58 2.52 2.47
ALOS reduction due to ieMR only 2.62 2.62 2.62 2.62
Bed days based on AIM ALOS* 111,307 130,344 148,526 168,441
Bed days based on ALOS ieMR only 109,113 132,048 154,078 178,238
Bed days if ALOS remains static 2.73 113,694 137,592 160,546 185,722
Difference in bed days ieMR ALOS - 2,194 1,704 5,552 9,797
Bed Equivalent ieMR ALOS - 7 5 18 32
Difference in bed days ALOS 2.73 2,387 7,248 12,021 17,281
Bed Equivalent ALOS 2.73 8 23 39 56
Source: Inpatient Projections (Base Year 2016/17) as supplied by Health Service Research, Analysis and Modelling Unit, System Planning Branch, Strategy, Policy and Planning Division (SPPD). Published by the State of Queensland (Queensland Health), 2018. Excludes renal dialysis, unqualified neonates, diagnostic endoscopy, chemotherapy and mental health. *Includes long stay > 90 days noting long stay days are not factored into AIM ALOS.
If there is no change in ALOS at TH then an additional 23 beds will be required by 2026/27 and 56 beds by 2036/37 over and above Base Case projections. If ieMR results in a 4% reduction in ALOS at TH then this will be reduced to 5 beds by 2026/27 and 32 beds by 2036/37 over and above Base Case projections.
85
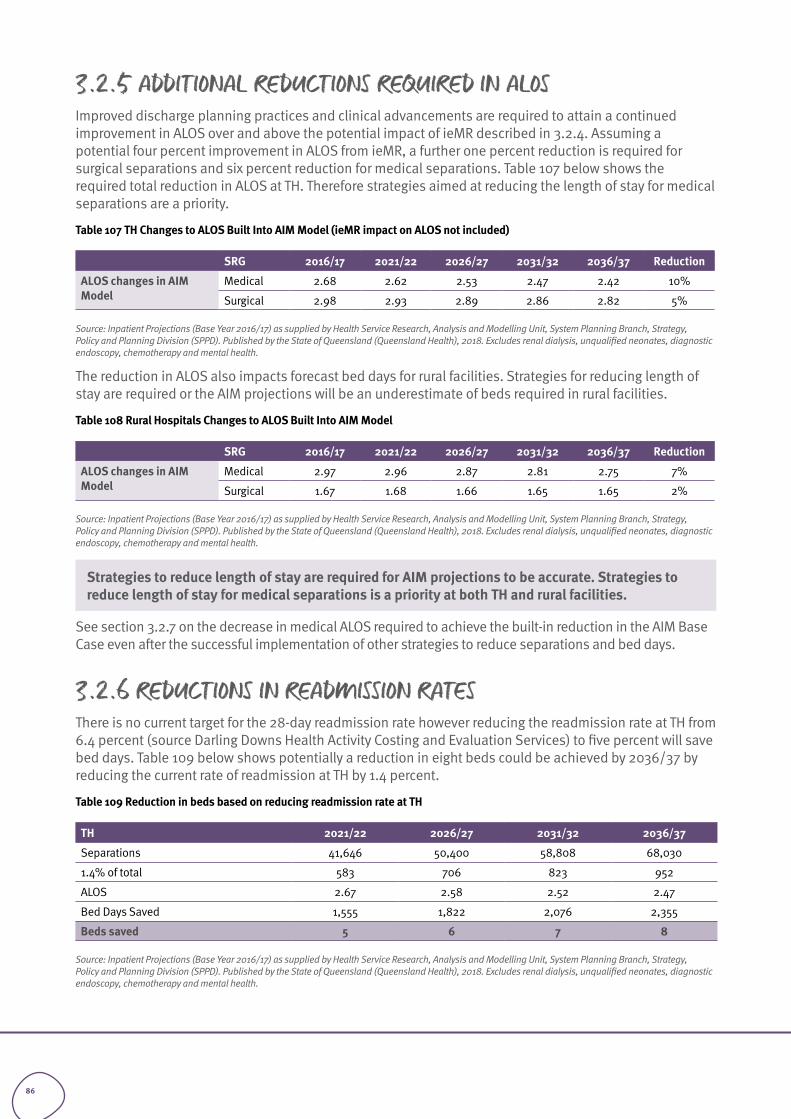
3.2.5 ADDITIONAL REDUCTIONS REQUIRED IN ALOSImproved discharge planning practices and clinical advancements are required to attain a continued improvement in ALOS over and above the potential impact of ieMR described in 3.2.4. Assuming a potential four percent improvement in ALOS from ieMR, a further one percent reduction is required for surgical separations and six percent reduction for medical separations. Table 107 below shows the required total reduction in ALOS at TH. Therefore strategies aimed at reducing the length of stay for medical separations are a priority.
Table 107 TH Changes to ALOS Built Into AIM Model (ieMR impact on ALOS not included)
SRG 2016/17 2021/22 2026/27 2031/32 2036/37 Reduction
ALOS changes in AIM Model
Medical 2.68 2.62 2.53 2.47 2.42 10%
Surgical 2.98 2.93 2.89 2.86 2.82 5%
Source: Inpatient Projections (Base Year 2016/17) as supplied by Health Service Research, Analysis and Modelling Unit, System Planning Branch, Strategy, Policy and Planning Division (SPPD). Published by the State of Queensland (Queensland Health), 2018. Excludes renal dialysis, unqualified neonates, diagnostic endoscopy, chemotherapy and mental health.
The reduction in ALOS also impacts forecast bed days for rural facilities. Strategies for reducing length of stay are required or the AIM projections will be an underestimate of beds required in rural facilities.
Table 108 Rural Hospitals Changes to ALOS Built Into AIM Model
SRG 2016/17 2021/22 2026/27 2031/32 2036/37 Reduction
ALOS changes in AIM Model
Medical 2.97 2.96 2.87 2.81 2.75 7%
Surgical 1.67 1.68 1.66 1.65 1.65 2%
Source: Inpatient Projections (Base Year 2016/17) as supplied by Health Service Research, Analysis and Modelling Unit, System Planning Branch, Strategy, Policy and Planning Division (SPPD). Published by the State of Queensland (Queensland Health), 2018. Excludes renal dialysis, unqualified neonates, diagnostic endoscopy, chemotherapy and mental health.
Strategies to reduce length of stay are required for AIM projections to be accurate. Strategies to reduce length of stay for medical separations is a priority at both TH and rural facilities.
See section 3.2.7 on the decrease in medical ALOS required to achieve the built-in reduction in the AIM Base Case even after the successful implementation of other strategies to reduce separations and bed days.
3.2.6 REDUCTIONS IN READMISSION RATESThere is no current target for the 28-day readmission rate however reducing the readmission rate at TH from 6.4 percent (source Darling Downs Health Activity Costing and Evaluation Services) to five percent will save bed days. Table 109 below shows potentially a reduction in eight beds could be achieved by 2036/37 by reducing the current rate of readmission at TH by 1.4 percent.
Table 109 Reduction in beds based on reducing readmission rate at TH
TH 2021/22 2026/27 2031/32 2036/37
Separations 41,646 50,400 58,808 68,030
1.4% of total 583 706 823 952
ALOS 2.67 2.58 2.52 2.47
Bed Days Saved 1,555 1,822 2,076 2,355
Beds saved 5 6 7 8
Source: Inpatient Projections (Base Year 2016/17) as supplied by Health Service Research, Analysis and Modelling Unit, System Planning Branch, Strategy, Policy and Planning Division (SPPD). Published by the State of Queensland (Queensland Health), 2018. Excludes renal dialysis, unqualified neonates, diagnostic endoscopy, chemotherapy and mental health.
86
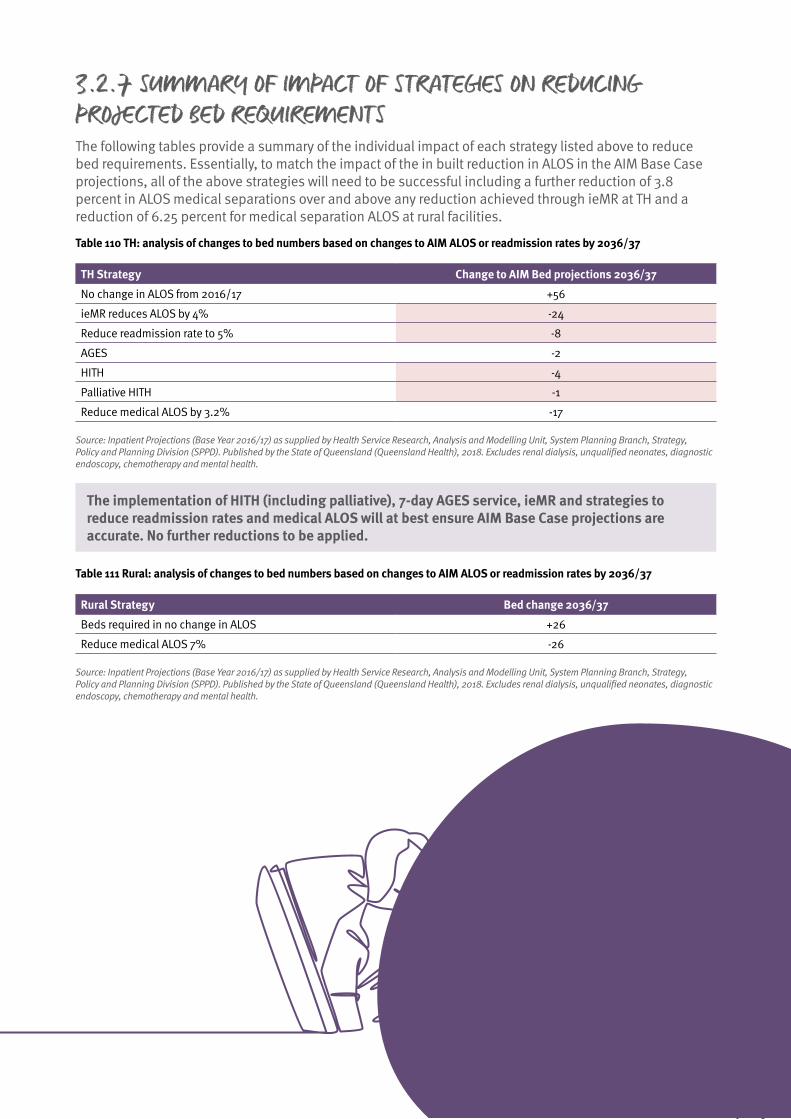
3.2.7 SUMMARY OF IMPACT OF STRATEGIES ON REDUCING PROJECTED BED REQUIREMENTSThe following tables provide a summary of the individual impact of each strategy listed above to reduce bed requirements. Essentially, to match the impact of the in built reduction in ALOS in the AIM Base Case projections, all of the above strategies will need to be successful including a further reduction of 3.8 percent in ALOS medical separations over and above any reduction achieved through ieMR at TH and a reduction of 6.25 percent for medical separation ALOS at rural facilities.
Table 110 TH: analysis of changes to bed numbers based on changes to AIM ALOS or readmission rates by 2036/37
TH Strategy Change to AIM Bed projections 2036/37
No change in ALOS from 2016/17 +56
ieMR reduces ALOS by 4% -24
Reduce readmission rate to 5% -8
AGES -2
HITH -4
Palliative HITH -1
Reduce medical ALOS by 3.2% -17
Source: Inpatient Projections (Base Year 2016/17) as supplied by Health Service Research, Analysis and Modelling Unit, System Planning Branch, Strategy, Policy and Planning Division (SPPD). Published by the State of Queensland (Queensland Health), 2018. Excludes renal dialysis, unqualified neonates, diagnostic endoscopy, chemotherapy and mental health.
The implementation of HITH (including palliative), 7-day AGES service, ieMR and strategies to reduce readmission rates and medical ALOS will at best ensure AIM Base Case projections are accurate. No further reductions to be applied.
Table 111 Rural: analysis of changes to bed numbers based on changes to AIM ALOS or readmission rates by 2036/37
Rural Strategy Bed change 2036/37
Beds required in no change in ALOS +26
Reduce medical ALOS 7% -26
Source: Inpatient Projections (Base Year 2016/17) as supplied by Health Service Research, Analysis and Modelling Unit, System Planning Branch, Strategy, Policy and Planning Division (SPPD). Published by the State of Queensland (Queensland Health), 2018. Excludes renal dialysis, unqualified neonates, diagnostic endoscopy, chemotherapy and mental health.
87
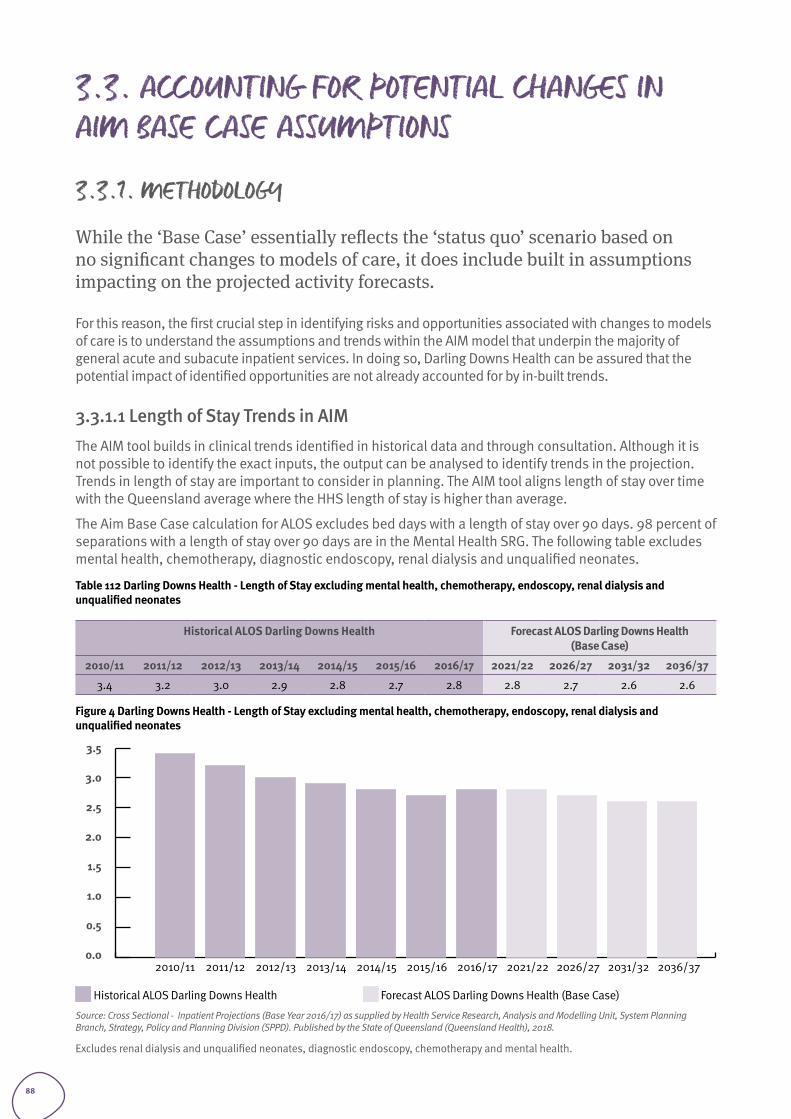
3.3. ACCOUNTING FOR POTENTIAL CHANGES IN AIM BASE CASE ASSUMPTIONS
3.3.1. METHODOLOGY
While the ‘Base Case’ essentially reflects the ‘status quo’ scenario based on no significant changes to models of care, it does include built in assumptions impacting on the projected activity forecasts.
For this reason, the first crucial step in identifying risks and opportunities associated with changes to models of care is to understand the assumptions and trends within the AIM model that underpin the majority of general acute and subacute inpatient services. In doing so, Darling Downs Health can be assured that the potential impact of identified opportunities are not already accounted for by in-built trends.
3.3.1.1 Length of Stay Trends in AIM The AIM tool builds in clinical trends identified in historical data and through consultation. Although it is not possible to identify the exact inputs, the output can be analysed to identify trends in the projection. Trends in length of stay are important to consider in planning. The AIM tool aligns length of stay over time with the Queensland average where the HHS length of stay is higher than average.
The Aim Base Case calculation for ALOS excludes bed days with a length of stay over 90 days. 98 percent of separations with a length of stay over 90 days are in the Mental Health SRG. The following table excludes mental health, chemotherapy, diagnostic endoscopy, renal dialysis and unqualified neonates.
Table 112 Darling Downs Health - Length of Stay excluding mental health, chemotherapy, endoscopy, renal dialysis and unqualified neonates
Historical ALOS Darling Downs Health Forecast ALOS Darling Downs Health (Base Case)
2010/11 2011/12 2012/13 2013/14 2014/15 2015/16 2016/17 2021/22 2026/27 2031/32 2036/37
3.4 3.2 3.0 2.9 2.8 2.7 2.8 2.8 2.7 2.6 2.6
Figure 4 Darling Downs Health - Length of Stay excluding mental health, chemotherapy, endoscopy, renal dialysis and unqualified neonates
2010/11 2011/12 2012/13 2013/14 2014/15 2015/16 2016/17 2021/22 2026/27 2031/32 2036/37
3.5
3.0
2.5
2.0
1.5
1.0
0.5
0.0
Historical ALOS Darling Downs Health Forecast ALOS Darling Downs Health (Base Case)
Source: Cross Sectional - Inpatient Projections (Base Year 2016/17) as supplied by Health Service Research, Analysis and Modelling Unit, System Planning Branch, Strategy, Policy and Planning Division (SPPD). Published by the State of Queensland (Queensland Health), 2018.
Excludes renal dialysis and unqualified neonates, diagnostic endoscopy, chemotherapy and mental health.
88
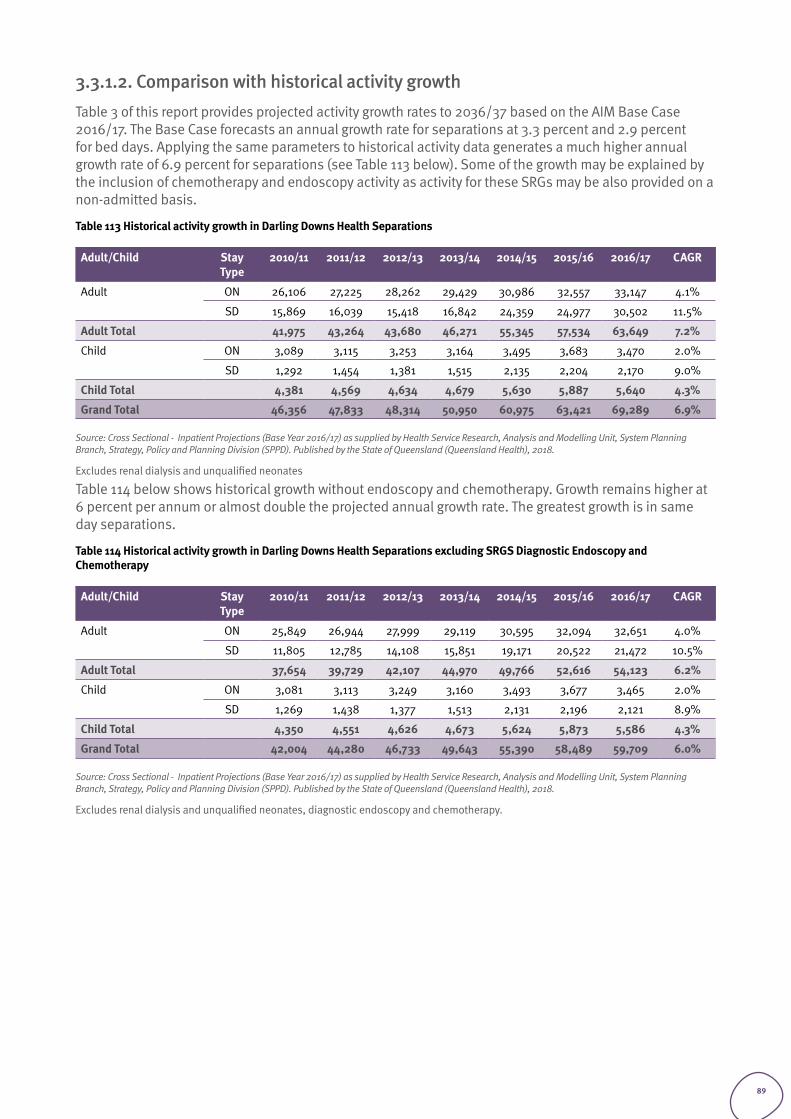
3.3.1.2. Comparison with historical activity growthTable 3 of this report provides projected activity growth rates to 2036/37 based on the AIM Base Case 2016/17. The Base Case forecasts an annual growth rate for separations at 3.3 percent and 2.9 percent for bed days. Applying the same parameters to historical activity data generates a much higher annual growth rate of 6.9 percent for separations (see Table 113 below). Some of the growth may be explained by the inclusion of chemotherapy and endoscopy activity as activity for these SRGs may be also provided on a non-admitted basis.
Table 113 Historical activity growth in Darling Downs Health Separations
Adult/Child Stay Type
2010/11 2011/12 2012/13 2013/14 2014/15 2015/16 2016/17 CAGR
Adult
ON 26,106 27,225 28,262 29,429 30,986 32,557 33,147 4.1%
SD 15,869 16,039 15,418 16,842 24,359 24,977 30,502 11.5%
Adult Total 41,975 43,264 43,680 46,271 55,345 57,534 63,649 7.2%
Child
ON 3,089 3,115 3,253 3,164 3,495 3,683 3,470 2.0%
SD 1,292 1,454 1,381 1,515 2,135 2,204 2,170 9.0%
Child Total 4,381 4,569 4,634 4,679 5,630 5,887 5,640 4.3%
Grand Total 46,356 47,833 48,314 50,950 60,975 63,421 69,289 6.9%
Source: Cross Sectional - Inpatient Projections (Base Year 2016/17) as supplied by Health Service Research, Analysis and Modelling Unit, System Planning Branch, Strategy, Policy and Planning Division (SPPD). Published by the State of Queensland (Queensland Health), 2018.
Excludes renal dialysis and unqualified neonates
Table 114 below shows historical growth without endoscopy and chemotherapy. Growth remains higher at 6 percent per annum or almost double the projected annual growth rate. The greatest growth is in same day separations.
Table 114 Historical activity growth in Darling Downs Health Separations excluding SRGS Diagnostic Endoscopy and Chemotherapy
Adult/Child Stay Type
2010/11 2011/12 2012/13 2013/14 2014/15 2015/16 2016/17 CAGR
Adult ON 25,849 26,944 27,999 29,119 30,595 32,094 32,651 4.0%
SD 11,805 12,785 14,108 15,851 19,171 20,522 21,472 10.5%
Adult Total 37,654 39,729 42,107 44,970 49,766 52,616 54,123 6.2%
Child ON 3,081 3,113 3,249 3,160 3,493 3,677 3,465 2.0%
SD 1,269 1,438 1,377 1,513 2,131 2,196 2,121 8.9%
Child Total 4,350 4,551 4,626 4,673 5,624 5,873 5,586 4.3%
Grand Total 42,004 44,280 46,733 49,643 55,390 58,489 59,709 6.0%
Source: Cross Sectional - Inpatient Projections (Base Year 2016/17) as supplied by Health Service Research, Analysis and Modelling Unit, System Planning Branch, Strategy, Policy and Planning Division (SPPD). Published by the State of Queensland (Queensland Health), 2018.
Excludes renal dialysis and unqualified neonates, diagnostic endoscopy and chemotherapy.
89
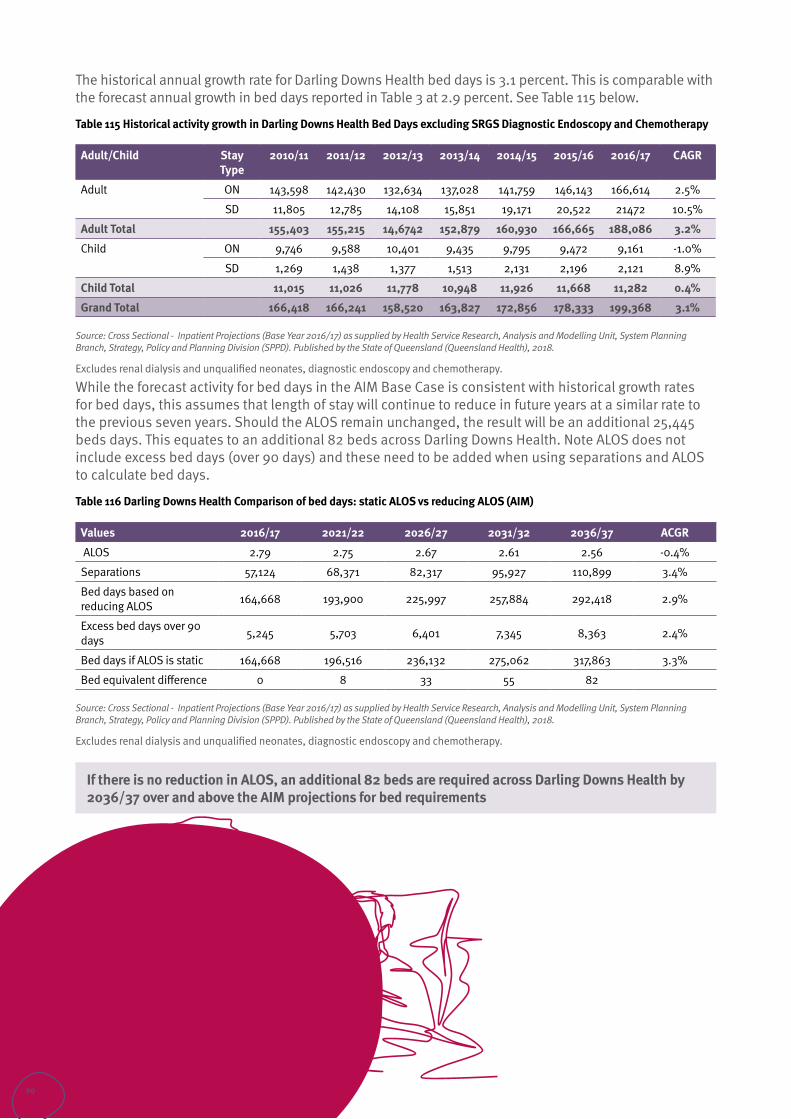
The historical annual growth rate for Darling Downs Health bed days is 3.1 percent. This is comparable with the forecast annual growth in bed days reported in Table 3 at 2.9 percent. See Table 115 below.
Table 115 Historical activity growth in Darling Downs Health Bed Days excluding SRGS Diagnostic Endoscopy and Chemotherapy
Adult/Child Stay Type
2010/11 2011/12 2012/13 2013/14 2014/15 2015/16 2016/17 CAGR
Adult ON 143,598 142,430 132,634 137,028 141,759 146,143 166,614 2.5%
SD 11,805 12,785 14,108 15,851 19,171 20,522 21472 10.5%
Adult Total 155,403 155,215 14,6742 152,879 160,930 166,665 188,086 3.2%
Child ON 9,746 9,588 10,401 9,435 9,795 9,472 9,161 -1.0%
SD 1,269 1,438 1,377 1,513 2,131 2,196 2,121 8.9%
Child Total 11,015 11,026 11,778 10,948 11,926 11,668 11,282 0.4%
Grand Total 166,418 166,241 158,520 163,827 172,856 178,333 199,368 3.1%
Source: Cross Sectional - Inpatient Projections (Base Year 2016/17) as supplied by Health Service Research, Analysis and Modelling Unit, System Planning Branch, Strategy, Policy and Planning Division (SPPD). Published by the State of Queensland (Queensland Health), 2018.
Excludes renal dialysis and unqualified neonates, diagnostic endoscopy and chemotherapy.
While the forecast activity for bed days in the AIM Base Case is consistent with historical growth rates for bed days, this assumes that length of stay will continue to reduce in future years at a similar rate to the previous seven years. Should the ALOS remain unchanged, the result will be an additional 25,445 beds days. This equates to an additional 82 beds across Darling Downs Health. Note ALOS does not include excess bed days (over 90 days) and these need to be added when using separations and ALOS to calculate bed days.
Table 116 Darling Downs Health Comparison of bed days: static ALOS vs reducing ALOS (AIM)
Values 2016/17 2021/22 2026/27 2031/32 2036/37 ACGR
ALOS 2.79 2.75 2.67 2.61 2.56 -0.4%
Separations 57,124 68,371 82,317 95,927 110,899 3.4%
Bed days based on reducing ALOS 164,668 193,900 225,997 257,884 292,418 2.9%
Excess bed days over 90 days 5,245 5,703 6,401 7,345 8,363 2.4%
Bed days if ALOS is static 164,668 196,516 236,132 275,062 317,863 3.3%
Bed equivalent difference 0 8 33 55 82
Source: Cross Sectional - Inpatient Projections (Base Year 2016/17) as supplied by Health Service Research, Analysis and Modelling Unit, System Planning Branch, Strategy, Policy and Planning Division (SPPD). Published by the State of Queensland (Queensland Health), 2018.
Excludes renal dialysis and unqualified neonates, diagnostic endoscopy and chemotherapy.
If there is no reduction in ALOS, an additional 82 beds are required across Darling Downs Health by 2036/37 over and above the AIM projections for bed requirements
90
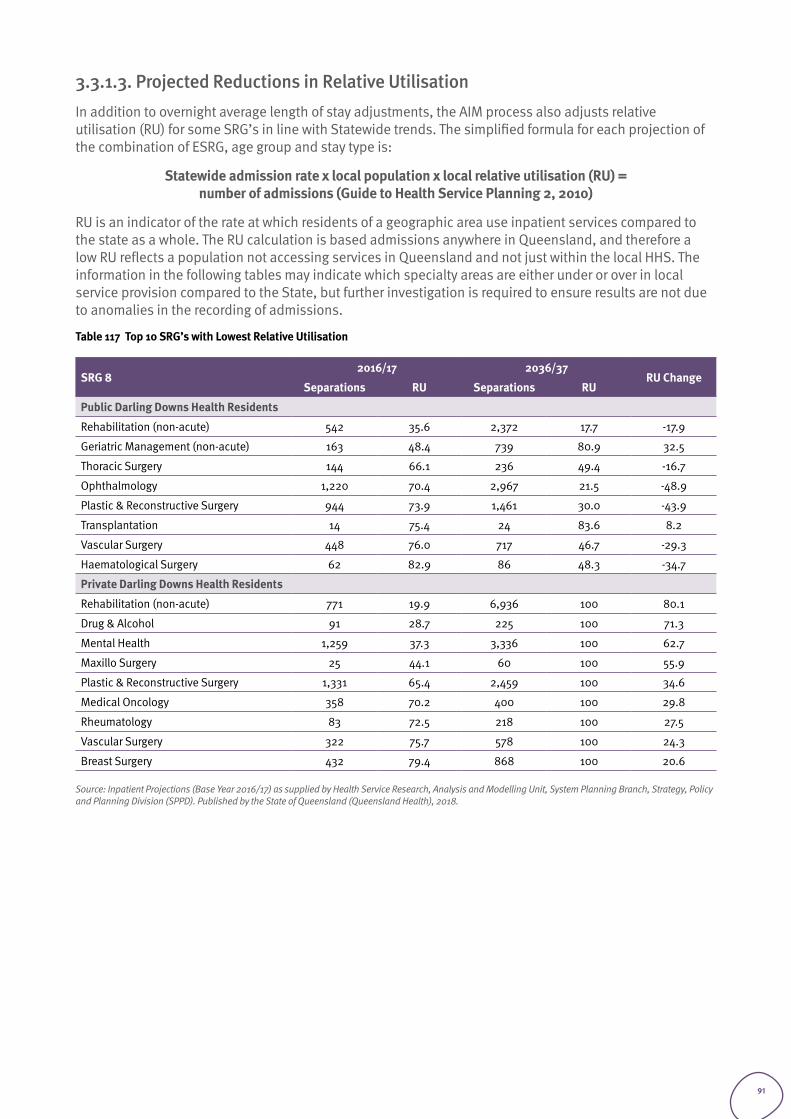
3.3.1.3. Projected Reductions in Relative Utilisation In addition to overnight average length of stay adjustments, the AIM process also adjusts relative utilisation (RU) for some SRG’s in line with Statewide trends. The simplified formula for each projection of the combination of ESRG, age group and stay type is:
Statewide admission rate x local population x local relative utilisation (RU) = number of admissions (Guide to Health Service Planning 2, 2010)
RU is an indicator of the rate at which residents of a geographic area use inpatient services compared to the state as a whole. The RU calculation is based admissions anywhere in Queensland, and therefore a low RU reflects a population not accessing services in Queensland and not just within the local HHS. The information in the following tables may indicate which specialty areas are either under or over in local service provision compared to the State, but further investigation is required to ensure results are not due to anomalies in the recording of admissions.
Table 117 Top 10 SRG’s with Lowest Relative Utilisation
SRG 82016/17 2036/37
RU ChangeSeparations RU Separations RU
Public Darling Downs Health Residents
Rehabilitation (non-acute) 542 35.6 2,372 17.7 -17.9
Geriatric Management (non-acute) 163 48.4 739 80.9 32.5
Thoracic Surgery 144 66.1 236 49.4 -16.7
Ophthalmology 1,220 70.4 2,967 21.5 -48.9
Plastic & Reconstructive Surgery 944 73.9 1,461 30.0 -43.9
Transplantation 14 75.4 24 83.6 8.2
Vascular Surgery 448 76.0 717 46.7 -29.3
Haematological Surgery 62 82.9 86 48.3 -34.7
Private Darling Downs Health Residents
Rehabilitation (non-acute) 771 19.9 6,936 100 80.1
Drug & Alcohol 91 28.7 225 100 71.3
Mental Health 1,259 37.3 3,336 100 62.7
Maxillo Surgery 25 44.1 60 100 55.9
Plastic & Reconstructive Surgery 1,331 65.4 2,459 100 34.6
Medical Oncology 358 70.2 400 100 29.8
Rheumatology 83 72.5 218 100 27.5
Vascular Surgery 322 75.7 578 100 24.3
Breast Surgery 432 79.4 868 100 20.6
Source: Inpatient Projections (Base Year 2016/17) as supplied by Health Service Research, Analysis and Modelling Unit, System Planning Branch, Strategy, Policy and Planning Division (SPPD). Published by the State of Queensland (Queensland Health), 2018.
91
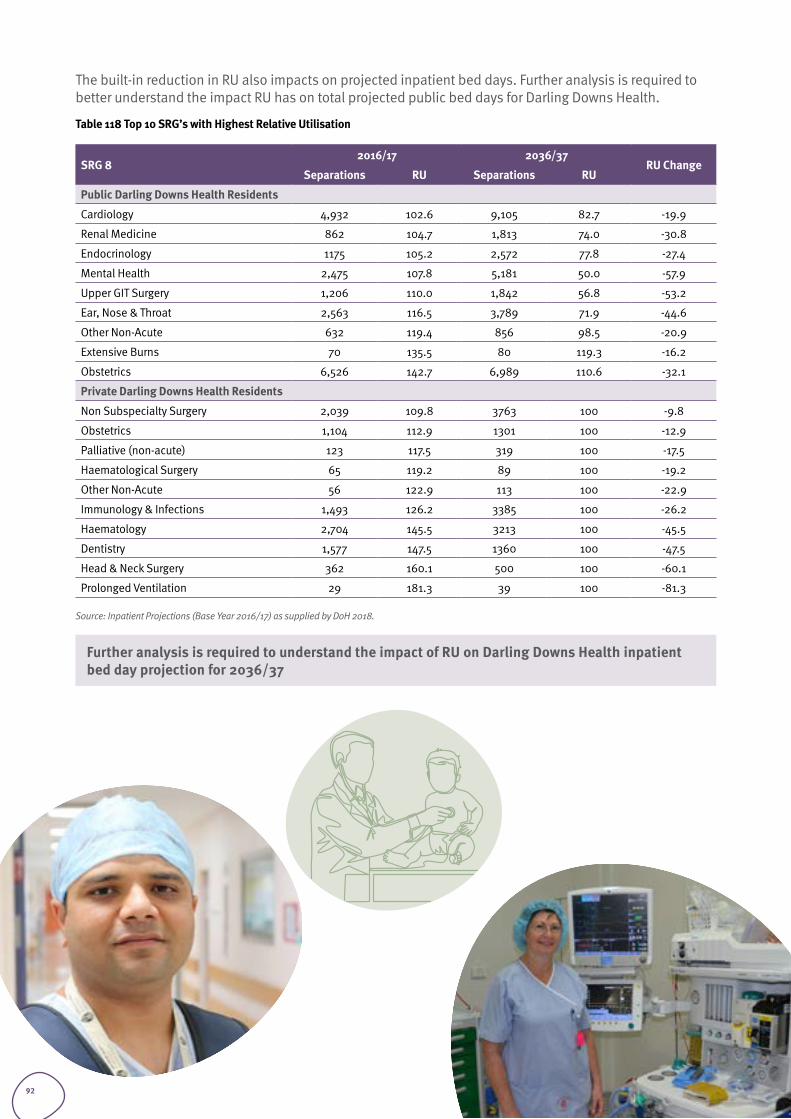
The built-in reduction in RU also impacts on projected inpatient bed days. Further analysis is required to better understand the impact RU has on total projected public bed days for Darling Downs Health.
Table 118 Top 10 SRG’s with Highest Relative Utilisation
SRG 82016/17 2036/37
RU ChangeSeparations RU Separations RU
Public Darling Downs Health Residents
Cardiology 4,932 102.6 9,105 82.7 -19.9
Renal Medicine 862 104.7 1,813 74.0 -30.8
Endocrinology 1175 105.2 2,572 77.8 -27.4
Mental Health 2,475 107.8 5,181 50.0 -57.9
Upper GIT Surgery 1,206 110.0 1,842 56.8 -53.2
Ear, Nose & Throat 2,563 116.5 3,789 71.9 -44.6
Other Non-Acute 632 119.4 856 98.5 -20.9
Extensive Burns 70 135.5 80 119.3 -16.2
Obstetrics 6,526 142.7 6,989 110.6 -32.1
Private Darling Downs Health Residents
Non Subspecialty Surgery 2,039 109.8 3763 100 -9.8
Obstetrics 1,104 112.9 1301 100 -12.9
Palliative (non-acute) 123 117.5 319 100 -17.5
Haematological Surgery 65 119.2 89 100 -19.2
Other Non-Acute 56 122.9 113 100 -22.9
Immunology & Infections 1,493 126.2 3385 100 -26.2
Haematology 2,704 145.5 3213 100 -45.5
Dentistry 1,577 147.5 1360 100 -47.5
Head & Neck Surgery 362 160.1 500 100 -60.1
Prolonged Ventilation 29 181.3 39 100 -81.3
Source: Inpatient Projections (Base Year 2016/17) as supplied by DoH 2018.
Further analysis is required to understand the impact of RU on Darling Downs Health inpatient bed day projection for 2036/37
92

3.4. REDUCING PROJECTED OTHER NON-ACUTE ACTIVITY AT THThere are a number of non-acute separations (primarily maintenance) at TH not requiring an acute hospital environment. This cohort of patients are generally elderly and awaiting placement in an appropriate residential aged care facility.
The development of a ‘social admission patient unit’ or SAPU will reduce the number of maintenance patients admitted to TH by changing existing models of care. The unit will explore the availability of out-of-hospital service options including partnerships with local aged care providers to decrease both length of stay and number of admissions.
3.4.1. METHODOLOGY The Base Case projection for Other Non-Acute SRG patients in TH has been analysed. A 25 percent potential reduction in the number of maintenance patients has been modelled below in Table 119 .
3.4.2. THE POTENTIAL IMPACT If 25 percent of maintenance separations and bed days are removed from TH future Base Case activity projections, there is potential to reduce bed requirements by up to 5 beds by 2036/37.
Table 119 Removing “Other Non-Acute” Patients - Potential Impact on TH
2016/17 2021/22 2026/27 2031/32 2036/37
Base Case
Separations 240 265 297 339 384
Bed days 4,518 4,826 5,272 5,776 6,245
Beds 15 16 17 19 20
25% Reduction in Activity
Separations 180 199 223 254 288
Bed days 3,389 3,619 3,954 4,332 4,684
Beds 11 12 13 14 15
Difference Base Case vs 25% Reduction
Bed reduction 4 4 4 5 5
A 25% reduction in Other non-acute separations will result in a 5 bed reduction at TH 2036/37
93
The future role of rural and remote services within Darling Downs Health
Section 4
94
4.1. INTRODUCTION Rural and remote facilities in Darling Downs Health are currently located at Dalby, Kingaroy, Warwick, Jandowae, Tara, Oakey, Miles, Chinchilla, Wandoan, Taroom, Goondiwindi, Inglewood, Millmerran, Stanthorpe, Texas, Cherbourg, Wondai, Murgon and Nanango.
The rural primary hubs (CSCF Level 3 facilities) in Darling Downs Health may have the potential to increase their service capability and self-sufficiency for admitted and non-admitted services. These facilities are:
• Warwick Hospital (84km south of Toowoomba) • Kingaroy Hospital (153km north of Toowoomba) • Dalby Hospital (82km west of Toowoomba).
4.1.1 ACCESS TO PRIMARY CAREPeople living in rural, and remote areas are more likely to defer access to general practitioners due to cost. They have higher rates of potentially preventable hospitalisations and are less likely to gain timely access to aged care. Rural communities often find it difficult to attract and retain doctors, making local access to medical services challenging. Rural patients often have a long wait to see a GP close to where they live (AMA, 2014). Access to primary care health care services has a significant impact on rural hospitals beyond the parameters of the AIM modelling tool. Further analysis is required separate to the DDH Health Service Plan 2019-29 to better understand the reasons for a higher percentage of long stay maintenance separations, longer length of stay, increased category four and five ED presentations and travel for medical imaging, allied health and speciality services.
4.1.2 THE KINGAROY HOSPITAL REDEVELOPMENTThe redevelopment when completed will provide improved infrastructure enabling greater capacity and additional services including:
• computerised tomography (CT) scanner imaging facilities• birthing suites with contemporary facilities• digital-hospital ready• increase in theatre capacity (from one operating theatre to two) including provision for day surgery
admission and recovery• increased capacity for specialist outpatient consulting rooms (from four to six) with contemporary facilities• capacity for chemotherapy treatment• increased renal dialysis capacity• improved telehealth facilities
The new facility will provide an opportunity for increased private public partnerships and is also more likely to be seen as an attractive workplace thus assisting in the recruitment and retention of staff. Additionally, patients currently choosing private health care options may consider public options when the redevelopment is completed due to attractiveness of a new contemporary facility in their local area. The AIM Base case does not include any increase in activity for Kingaroy Hospital based on the impact of the new facility. The following information provides a high-level analysis of potential areas for increased activity.
95
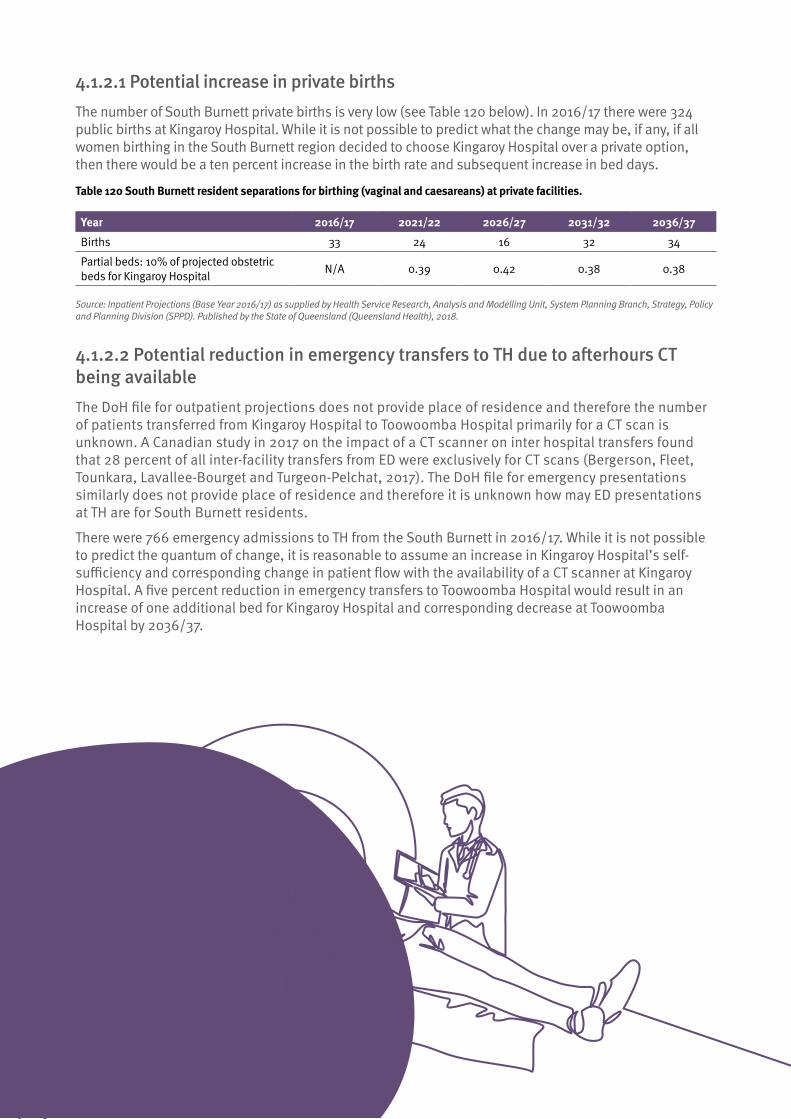
4.1.2.1 Potential increase in private birthsThe number of South Burnett private births is very low (see Table 120 below). In 2016/17 there were 324 public births at Kingaroy Hospital. While it is not possible to predict what the change may be, if any, if all women birthing in the South Burnett region decided to choose Kingaroy Hospital over a private option, then there would be a ten percent increase in the birth rate and subsequent increase in bed days.
Table 120 South Burnett resident separations for birthing (vaginal and caesareans) at private facilities.
Year 2016/17 2021/22 2026/27 2031/32 2036/37
Births 33 24 16 32 34
Partial beds: 10% of projected obstetric beds for Kingaroy Hospital N/A 0.39 0.42 0.38 0.38
Source: Inpatient Projections (Base Year 2016/17) as supplied by Health Service Research, Analysis and Modelling Unit, System Planning Branch, Strategy, Policy and Planning Division (SPPD). Published by the State of Queensland (Queensland Health), 2018.
4.1.2.2 Potential reduction in emergency transfers to TH due to afterhours CT being availableThe DoH file for outpatient projections does not provide place of residence and therefore the number of patients transferred from Kingaroy Hospital to Toowoomba Hospital primarily for a CT scan is unknown. A Canadian study in 2017 on the impact of a CT scanner on inter hospital transfers found that 28 percent of all inter-facility transfers from ED were exclusively for CT scans (Bergerson, Fleet, Tounkara, Lavallee-Bourget and Turgeon-Pelchat, 2017). The DoH file for emergency presentations similarly does not provide place of residence and therefore it is unknown how may ED presentations at TH are for South Burnett residents.
There were 766 emergency admissions to TH from the South Burnett in 2016/17. While it is not possible to predict the quantum of change, it is reasonable to assume an increase in Kingaroy Hospital’s self-sufficiency and corresponding change in patient flow with the availability of a CT scanner at Kingaroy Hospital. A five percent reduction in emergency transfers to Toowoomba Hospital would result in an increase of one additional bed for Kingaroy Hospital and corresponding decrease at Toowoomba Hospital by 2036/37.
96
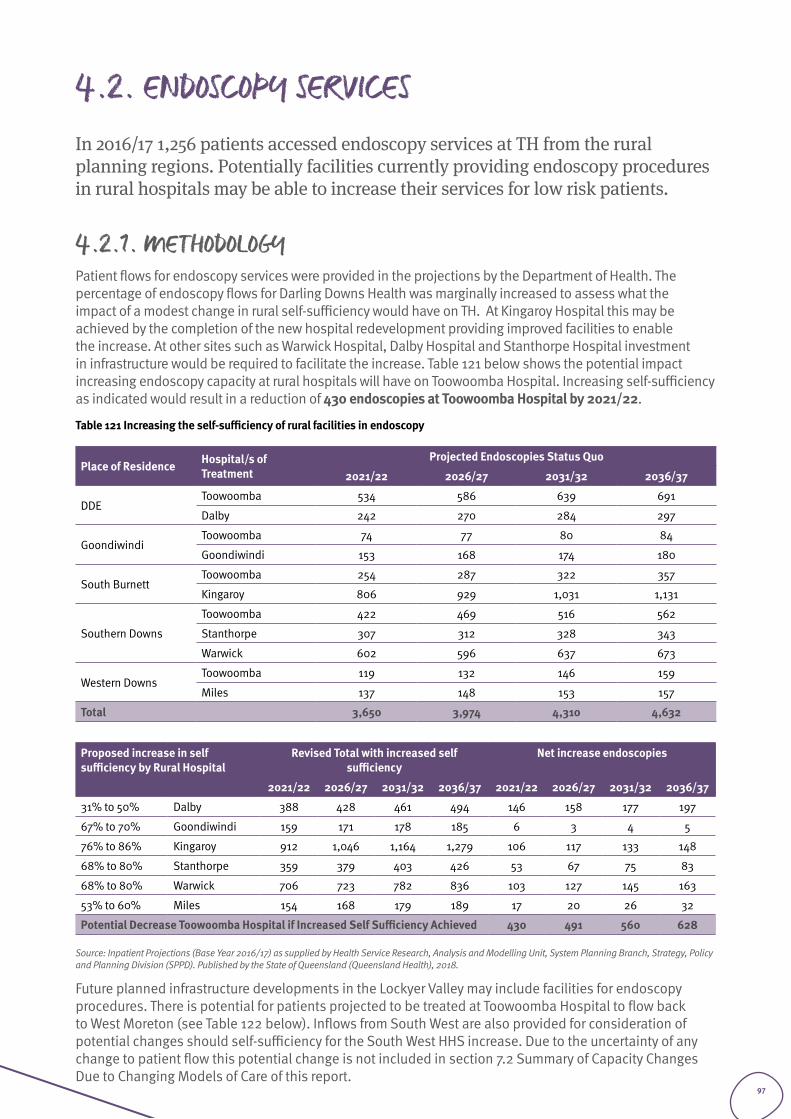
4.2. ENDOSCOPY SERVICES In 2016/17 1,256 patients accessed endoscopy services at TH from the rural planning regions. Potentially facilities currently providing endoscopy procedures in rural hospitals may be able to increase their services for low risk patients.
4.2.1. METHODOLOGY Patient flows for endoscopy services were provided in the projections by the Department of Health. The percentage of endoscopy flows for Darling Downs Health was marginally increased to assess what the impact of a modest change in rural self-sufficiency would have on TH. At Kingaroy Hospital this may be achieved by the completion of the new hospital redevelopment providing improved facilities to enable the increase. At other sites such as Warwick Hospital, Dalby Hospital and Stanthorpe Hospital investment in infrastructure would be required to facilitate the increase. Table 121 below shows the potential impact increasing endoscopy capacity at rural hospitals will have on Toowoomba Hospital. Increasing self-sufficiency as indicated would result in a reduction of 430 endoscopies at Toowoomba Hospital by 2021/22.
Table 121 Increasing the self-sufficiency of rural facilities in endoscopy
Place of Residence Hospital/s of Treatment
Projected Endoscopies Status Quo
2021/22 2026/27 2031/32 2036/37
DDEToowoomba 534 586 639 691
Dalby 242 270 284 297
GoondiwindiToowoomba 74 77 80 84
Goondiwindi 153 168 174 180
South BurnettToowoomba 254 287 322 357
Kingaroy 806 929 1,031 1,131
Southern Downs
Toowoomba 422 469 516 562
Stanthorpe 307 312 328 343
Warwick 602 596 637 673
Western DownsToowoomba 119 132 146 159
Miles 137 148 153 157
Total 3,650 3,974 4,310 4,632
Proposed increase in self sufficiency by Rural Hospital
Revised Total with increased self sufficiency
Net increase endoscopies
2021/22 2026/27 2031/32 2036/37 2021/22 2026/27 2031/32 2036/37
31% to 50% Dalby 388 428 461 494 146 158 177 197
67% to 70% Goondiwindi 159 171 178 185 6 3 4 5
76% to 86% Kingaroy 912 1,046 1,164 1,279 106 117 133 148
68% to 80% Stanthorpe 359 379 403 426 53 67 75 83
68% to 80% Warwick 706 723 782 836 103 127 145 163
53% to 60% Miles 154 168 179 189 17 20 26 32
Potential Decrease Toowoomba Hospital if Increased Self Sufficiency Achieved 430 491 560 628
Source: Inpatient Projections (Base Year 2016/17) as supplied by Health Service Research, Analysis and Modelling Unit, System Planning Branch, Strategy, Policy and Planning Division (SPPD). Published by the State of Queensland (Queensland Health), 2018.
Future planned infrastructure developments in the Lockyer Valley may include facilities for endoscopy procedures. There is potential for patients projected to be treated at Toowoomba Hospital to flow back to West Moreton (see Table 122 below). Inflows from South West are also provided for consideration of potential changes should self-sufficiency for the South West HHS increase. Due to the uncertainty of any change to patient flow this potential change is not included in section 7.2 Summary of Capacity Changes Due to Changing Models of Care of this report.
97
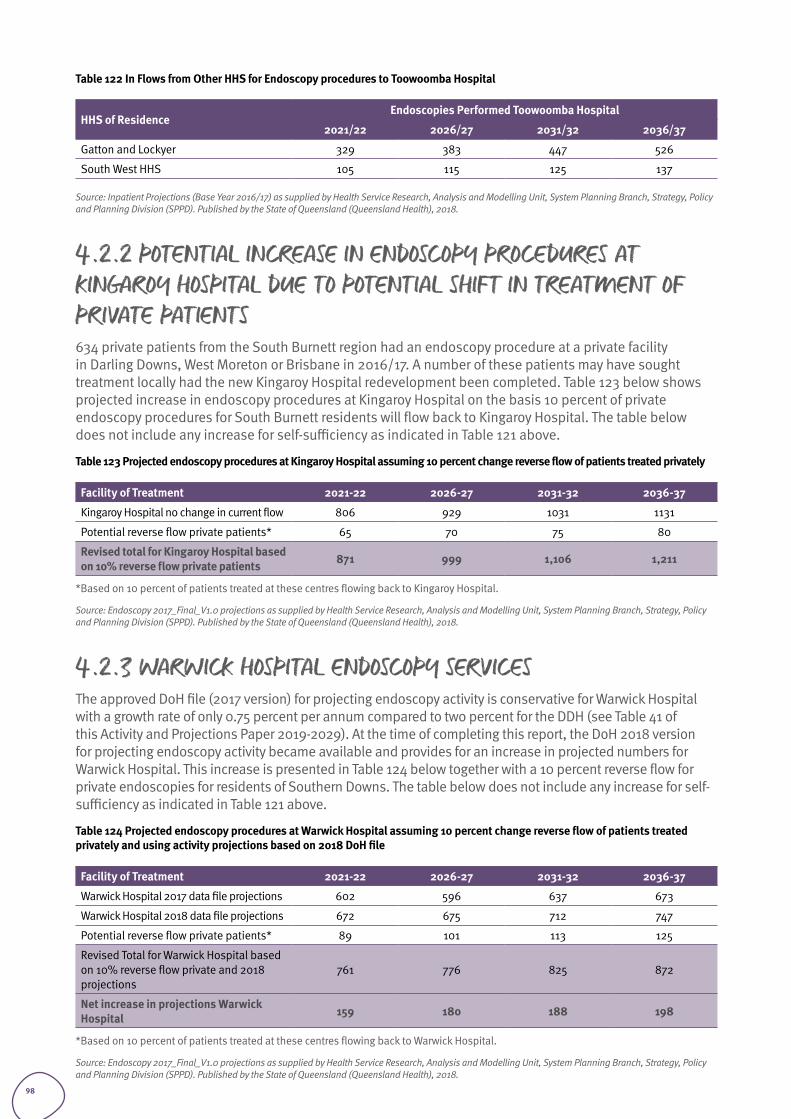
Table 122 In Flows from Other HHS for Endoscopy procedures to Toowoomba Hospital
HHS of ResidenceEndoscopies Performed Toowoomba Hospital
2021/22 2026/27 2031/32 2036/37
Gatton and Lockyer 329 383 447 526
South West HHS 105 115 125 137
Source: Inpatient Projections (Base Year 2016/17) as supplied by Health Service Research, Analysis and Modelling Unit, System Planning Branch, Strategy, Policy and Planning Division (SPPD). Published by the State of Queensland (Queensland Health), 2018.
4.2.2 POTENTIAL INCREASE IN ENDOSCOPY PROCEDURES AT KINGAROY HOSPITAL DUE TO POTENTIAL SHIFT IN TREATMENT OF PRIVATE PATIENTS634 private patients from the South Burnett region had an endoscopy procedure at a private facility in Darling Downs, West Moreton or Brisbane in 2016/17. A number of these patients may have sought treatment locally had the new Kingaroy Hospital redevelopment been completed. Table 123 below shows projected increase in endoscopy procedures at Kingaroy Hospital on the basis 10 percent of private endoscopy procedures for South Burnett residents will flow back to Kingaroy Hospital. The table below does not include any increase for self-sufficiency as indicated in Table 121 above.
Table 123 Projected endoscopy procedures at Kingaroy Hospital assuming 10 percent change reverse flow of patients treated privately
Facility of Treatment 2021-22 2026-27 2031-32 2036-37
Kingaroy Hospital no change in current flow 806 929 1031 1131
Potential reverse flow private patients* 65 70 75 80
Revised total for Kingaroy Hospital based on 10% reverse flow private patients 871 999 1,106 1,211
*Based on 10 percent of patients treated at these centres flowing back to Kingaroy Hospital.
Source: Endoscopy 2017_Final_V1.0 projections as supplied by Health Service Research, Analysis and Modelling Unit, System Planning Branch, Strategy, Policy and Planning Division (SPPD). Published by the State of Queensland (Queensland Health), 2018.
4.2.3 WARWICK HOSPITAL ENDOSCOPY SERVICESThe approved DoH file (2017 version) for projecting endoscopy activity is conservative for Warwick Hospital with a growth rate of only 0.75 percent per annum compared to two percent for the DDH (see Table 41 of this Activity and Projections Paper 2019-2029). At the time of completing this report, the DoH 2018 version for projecting endoscopy activity became available and provides for an increase in projected numbers for Warwick Hospital. This increase is presented in Table 124 below together with a 10 percent reverse flow for private endoscopies for residents of Southern Downs. The table below does not include any increase for self-sufficiency as indicated in Table 121 above.
Table 124 Projected endoscopy procedures at Warwick Hospital assuming 10 percent change reverse flow of patients treated privately and using activity projections based on 2018 DoH file
Facility of Treatment 2021-22 2026-27 2031-32 2036-37
Warwick Hospital 2017 data file projections 602 596 637 673
Warwick Hospital 2018 data file projections 672 675 712 747
Potential reverse flow private patients* 89 101 113 125
Revised Total for Warwick Hospital based on 10% reverse flow private and 2018 projections
761 776 825 872
Net increase in projections Warwick Hospital 159 180 188 198
*Based on 10 percent of patients treated at these centres flowing back to Warwick Hospital.
Source: Endoscopy 2017_Final_V1.0 projections as supplied by Health Service Research, Analysis and Modelling Unit, System Planning Branch, Strategy, Policy and Planning Division (SPPD). Published by the State of Queensland (Queensland Health), 2018.
98
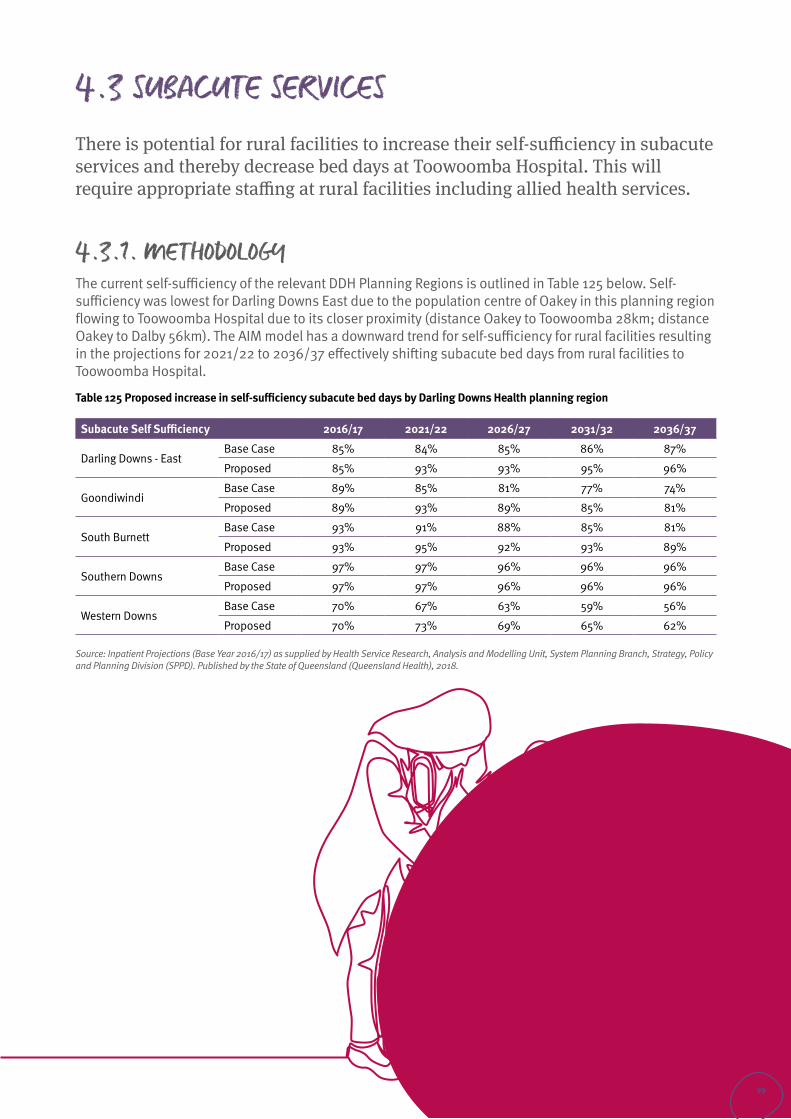
4.3 SUBACUTE SERVICESThere is potential for rural facilities to increase their self-sufficiency in subacute services and thereby decrease bed days at Toowoomba Hospital. This will require appropriate staffing at rural facilities including allied health services.
4.3.1. METHODOLOGY The current self-sufficiency of the relevant DDH Planning Regions is outlined in Table 125 below. Self-sufficiency was lowest for Darling Downs East due to the population centre of Oakey in this planning region flowing to Toowoomba Hospital due to its closer proximity (distance Oakey to Toowoomba 28km; distance Oakey to Dalby 56km). The AIM model has a downward trend for self-sufficiency for rural facilities resulting in the projections for 2021/22 to 2036/37 effectively shifting subacute bed days from rural facilities to Toowoomba Hospital.
Table 125 Proposed increase in self-sufficiency subacute bed days by Darling Downs Health planning region
Subacute Self Sufficiency 2016/17 2021/22 2026/27 2031/32 2036/37
Darling Downs - East Base Case 85% 84% 85% 86% 87%
Proposed 85% 93% 93% 95% 96%
GoondiwindiBase Case 89% 85% 81% 77% 74%
Proposed 89% 93% 89% 85% 81%
South Burnett Base Case 93% 91% 88% 85% 81%
Proposed 93% 95% 92% 93% 89%
Southern Downs Base Case 97% 97% 96% 96% 96%
Proposed 97% 97% 96% 96% 96%
Western DownsBase Case 70% 67% 63% 59% 56%
Proposed 70% 73% 69% 65% 62%
Source: Inpatient Projections (Base Year 2016/17) as supplied by Health Service Research, Analysis and Modelling Unit, System Planning Branch, Strategy, Policy and Planning Division (SPPD). Published by the State of Queensland (Queensland Health), 2018.
99
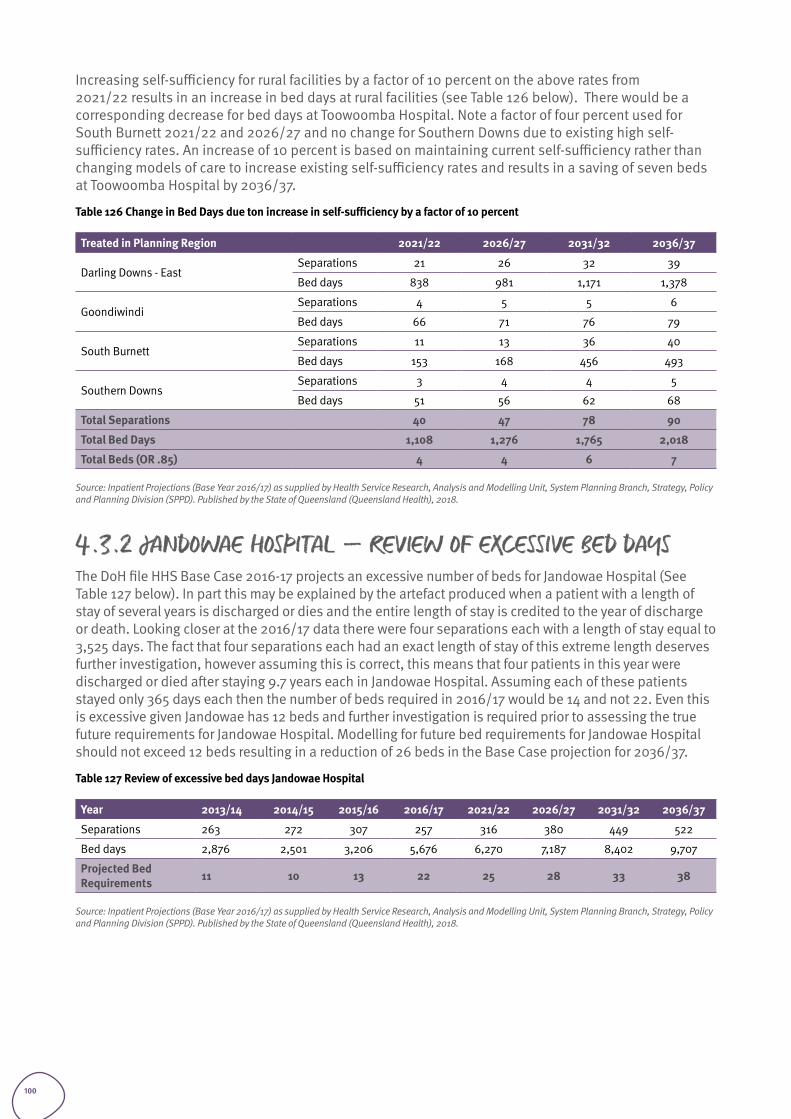
Increasing self-sufficiency for rural facilities by a factor of 10 percent on the above rates from 2021/22 results in an increase in bed days at rural facilities (see Table 126 below). There would be a corresponding decrease for bed days at Toowoomba Hospital. Note a factor of four percent used for South Burnett 2021/22 and 2026/27 and no change for Southern Downs due to existing high self-sufficiency rates. An increase of 10 percent is based on maintaining current self-sufficiency rather than changing models of care to increase existing self-sufficiency rates and results in a saving of seven beds at Toowoomba Hospital by 2036/37.
Table 126 Change in Bed Days due ton increase in self-sufficiency by a factor of 10 percent
Treated in Planning Region 2021/22 2026/27 2031/32 2036/37
Darling Downs - East Separations 21 26 32 39
Bed days 838 981 1,171 1,378
Goondiwindi Separations 4 5 5 6
Bed days 66 71 76 79
South Burnett Separations 11 13 36 40
Bed days 153 168 456 493
Southern Downs Separations 3 4 4 5
Bed days 51 56 62 68
Total Separations 40 47 78 90
Total Bed Days 1,108 1,276 1,765 2,018
Total Beds (OR .85) 4 4 6 7
Source: Inpatient Projections (Base Year 2016/17) as supplied by Health Service Research, Analysis and Modelling Unit, System Planning Branch, Strategy, Policy and Planning Division (SPPD). Published by the State of Queensland (Queensland Health), 2018.
4.3.2 JANDOWAE HOSPITAL – REVIEW OF EXCESSIVE BED DAYSThe DoH file HHS Base Case 2016-17 projects an excessive number of beds for Jandowae Hospital (See Table 127 below). In part this may be explained by the artefact produced when a patient with a length of stay of several years is discharged or dies and the entire length of stay is credited to the year of discharge or death. Looking closer at the 2016/17 data there were four separations each with a length of stay equal to 3,525 days. The fact that four separations each had an exact length of stay of this extreme length deserves further investigation, however assuming this is correct, this means that four patients in this year were discharged or died after staying 9.7 years each in Jandowae Hospital. Assuming each of these patients stayed only 365 days each then the number of beds required in 2016/17 would be 14 and not 22. Even this is excessive given Jandowae has 12 beds and further investigation is required prior to assessing the true future requirements for Jandowae Hospital. Modelling for future bed requirements for Jandowae Hospital should not exceed 12 beds resulting in a reduction of 26 beds in the Base Case projection for 2036/37.
Table 127 Review of excessive bed days Jandowae Hospital
Year 2013/14 2014/15 2015/16 2016/17 2021/22 2026/27 2031/32 2036/37
Separations 263 272 307 257 316 380 449 522
Bed days 2,876 2,501 3,206 5,676 6,270 7,187 8,402 9,707
Projected Bed Requirements 11 10 13 22 25 28 33 38
Source: Inpatient Projections (Base Year 2016/17) as supplied by Health Service Research, Analysis and Modelling Unit, System Planning Branch, Strategy, Policy and Planning Division (SPPD). Published by the State of Queensland (Queensland Health), 2018.
100
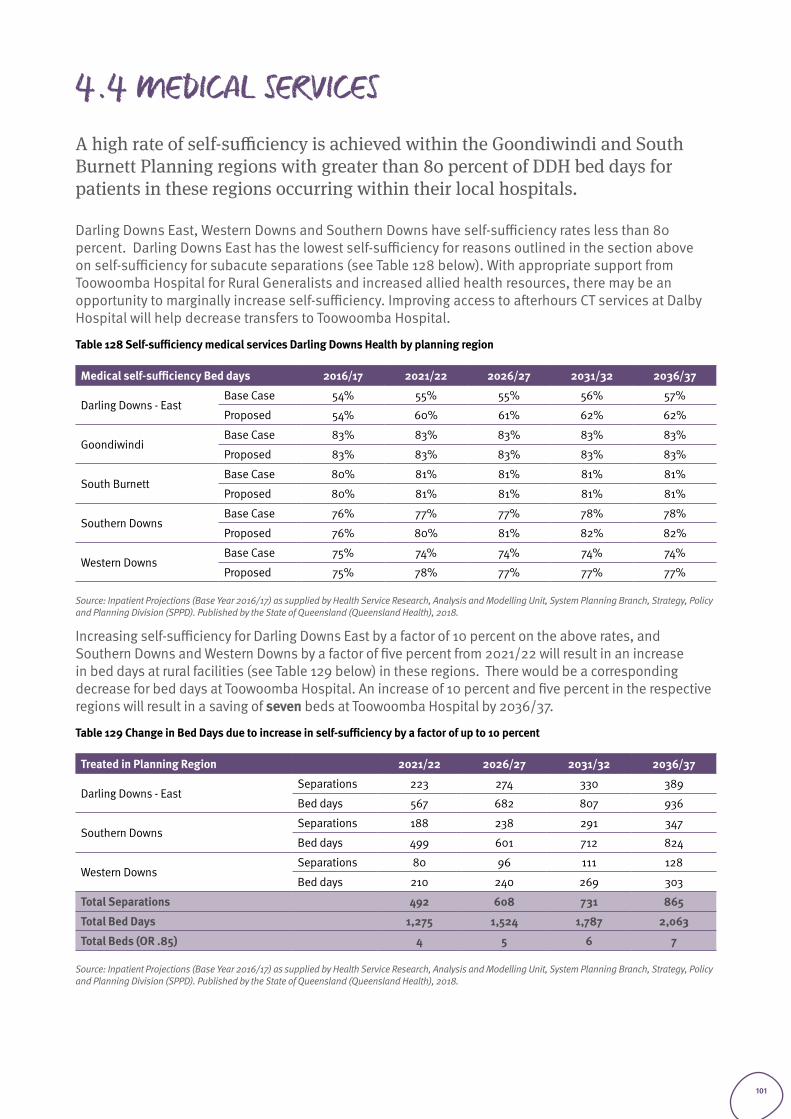
4.4 MEDICAL SERVICESA high rate of self-sufficiency is achieved within the Goondiwindi and South Burnett Planning regions with greater than 80 percent of DDH bed days for patients in these regions occurring within their local hospitals.
Darling Downs East, Western Downs and Southern Downs have self-sufficiency rates less than 80 percent. Darling Downs East has the lowest self-sufficiency for reasons outlined in the section above on self-sufficiency for subacute separations (see Table 128 below). With appropriate support from Toowoomba Hospital for Rural Generalists and increased allied health resources, there may be an opportunity to marginally increase self-sufficiency. Improving access to afterhours CT services at Dalby Hospital will help decrease transfers to Toowoomba Hospital.
Table 128 Self-sufficiency medical services Darling Downs Health by planning region
Medical self-sufficiency Bed days 2016/17 2021/22 2026/27 2031/32 2036/37
Darling Downs - East Base Case 54% 55% 55% 56% 57%
Proposed 54% 60% 61% 62% 62%
GoondiwindiBase Case 83% 83% 83% 83% 83%
Proposed 83% 83% 83% 83% 83%
South Burnett Base Case 80% 81% 81% 81% 81%
Proposed 80% 81% 81% 81% 81%
Southern Downs Base Case 76% 77% 77% 78% 78%
Proposed 76% 80% 81% 82% 82%
Western DownsBase Case 75% 74% 74% 74% 74%
Proposed 75% 78% 77% 77% 77%
Source: Inpatient Projections (Base Year 2016/17) as supplied by Health Service Research, Analysis and Modelling Unit, System Planning Branch, Strategy, Policy and Planning Division (SPPD). Published by the State of Queensland (Queensland Health), 2018.
Increasing self-sufficiency for Darling Downs East by a factor of 10 percent on the above rates, and Southern Downs and Western Downs by a factor of five percent from 2021/22 will result in an increase in bed days at rural facilities (see Table 129 below) in these regions. There would be a corresponding decrease for bed days at Toowoomba Hospital. An increase of 10 percent and five percent in the respective regions will result in a saving of seven beds at Toowoomba Hospital by 2036/37.
Table 129 Change in Bed Days due to increase in self-sufficiency by a factor of up to 10 percent
Treated in Planning Region 2021/22 2026/27 2031/32 2036/37
Darling Downs - East Separations 223 274 330 389
Bed days 567 682 807 936
Southern DownsSeparations 188 238 291 347
Bed days 499 601 712 824
Western DownsSeparations 80 96 111 128
Bed days 210 240 269 303
Total Separations 492 608 731 865
Total Bed Days 1,275 1,524 1,787 2,063
Total Beds (OR .85) 4 5 6 7
Source: Inpatient Projections (Base Year 2016/17) as supplied by Health Service Research, Analysis and Modelling Unit, System Planning Branch, Strategy, Policy and Planning Division (SPPD). Published by the State of Queensland (Queensland Health), 2018.
101
Consolidating the role of Toowoomba Hospital as a regional referral hospital
Section 5
102
5.1. INTRODUCTION TH provides approximately 62 percent (38,503 separations in 2016/17) of the total Darling Downs Health resident separations (refer Table 38 and 39: Total separations Darling Downs Health residents by place of treatment 2016/17 from the Health Service Plan Background Paper) treated in Darling Downs Health.
In addition to the services provided to Darling Downs Health residents, a further 5,764 separations were provided by TH for residents of other HHS’s in 2016/17. (Refer Table 85: Total Separations by HHS of residence Toowoomba Hospital 2016/17 from the Health Service Plan Background Paper).
Overall, Darling Downs Health is reasonably self-sufficient for the provision of public hospital services with just over 85 percent of all Darling Downs Health resident separations occurring from hospitals within Darling Downs Health (refer Table 36: Darling Downs Health self-sufficiency public hospitals only 13/14 to 16/17 from the Health Service Plan Background Paper). In 2016/17, there were 7,809 total separations for residents of Darling Downs Health provided from hospitals located in the Brisbane metropolitan area (refer Table 37: Self-Sufficiency public hospitals all stay types 2016/17 from the Health Service Plan Background Paper).
5.2. OPPORTUNITIES During consultations the following specialty areas were identified as priorities for reducing outflows and/or consolidating TH capability for the provision of adult services:
• Interventional cardiology• Radiation Oncology• Medical Imaging services - access to bone scanner and Positron Emission Tomography (PET)• Neurosurgery
When considering reversing outflows, the capacity of anaesthetics, allied health services, operating services and critical care needs to be assessed to measure impact of providing increased volumes of higher complexity services.
Potentially the Ipswich Hospital redevelopment will provide increased capacity for higher complexity services. Additionally, the building of a new hospital in the Lockyer / Gatton hospital in the next ten years will provide improved services to residents in this area. This is likely to result in reduced flows to Toowoomba Hospital for residents from this area (currently seven percent of inpatient separations or 3,036 separations).
103
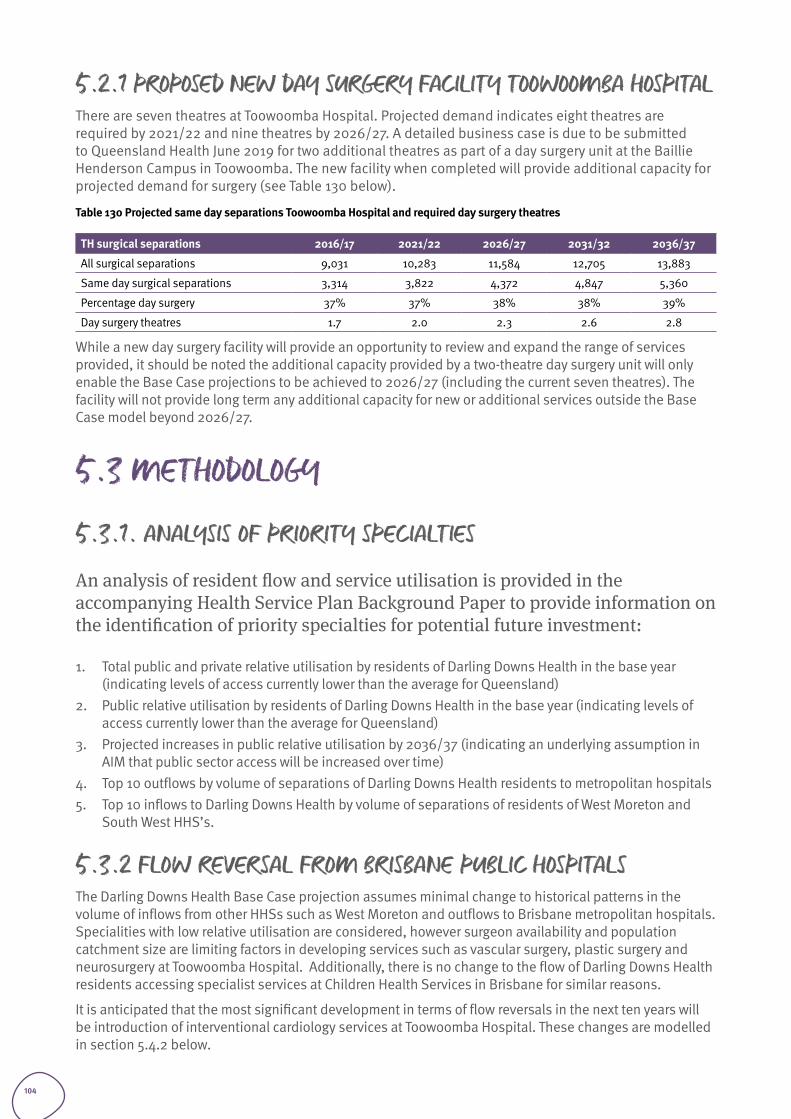
5.2.1 PROPOSED NEW DAY SURGERY FACILITY TOOWOOMBA HOSPITALThere are seven theatres at Toowoomba Hospital. Projected demand indicates eight theatres are required by 2021/22 and nine theatres by 2026/27. A detailed business case is due to be submitted to Queensland Health June 2019 for two additional theatres as part of a day surgery unit at the Baillie Henderson Campus in Toowoomba. The new facility when completed will provide additional capacity for projected demand for surgery (see Table 130 below).
Table 130 Projected same day separations Toowoomba Hospital and required day surgery theatres
TH surgical separations 2016/17 2021/22 2026/27 2031/32 2036/37
All surgical separations 9,031 10,283 11,584 12,705 13,883
Same day surgical separations 3,314 3,822 4,372 4,847 5,360
Percentage day surgery 37% 37% 38% 38% 39%
Day surgery theatres 1.7 2.0 2.3 2.6 2.8
While a new day surgery facility will provide an opportunity to review and expand the range of services provided, it should be noted the additional capacity provided by a two-theatre day surgery unit will only enable the Base Case projections to be achieved to 2026/27 (including the current seven theatres). The facility will not provide long term any additional capacity for new or additional services outside the Base Case model beyond 2026/27.
5.3 METHODOLOGY
5.3.1. ANALYSIS OF PRIORITY SPECIALTIES
An analysis of resident flow and service utilisation is provided in the accompanying Health Service Plan Background Paper to provide information on the identification of priority specialties for potential future investment:
1. Total public and private relative utilisation by residents of Darling Downs Health in the base year (indicating levels of access currently lower than the average for Queensland)
2. Public relative utilisation by residents of Darling Downs Health in the base year (indicating levels of access currently lower than the average for Queensland)
3. Projected increases in public relative utilisation by 2036/37 (indicating an underlying assumption in AIM that public sector access will be increased over time)
4. Top 10 outflows by volume of separations of Darling Downs Health residents to metropolitan hospitals 5. Top 10 inflows to Darling Downs Health by volume of separations of residents of West Moreton and
South West HHS’s.
5.3.2 FLOW REVERSAL FROM BRISBANE PUBLIC HOSPITALSThe Darling Downs Health Base Case projection assumes minimal change to historical patterns in the volume of inflows from other HHSs such as West Moreton and outflows to Brisbane metropolitan hospitals. Specialities with low relative utilisation are considered, however surgeon availability and population catchment size are limiting factors in developing services such as vascular surgery, plastic surgery and neurosurgery at Toowoomba Hospital. Additionally, there is no change to the flow of Darling Downs Health residents accessing specialist services at Children Health Services in Brisbane for similar reasons.
It is anticipated that the most significant development in terms of flow reversals in the next ten years will be introduction of interventional cardiology services at Toowoomba Hospital. These changes are modelled in section 5.4.2 below.
104
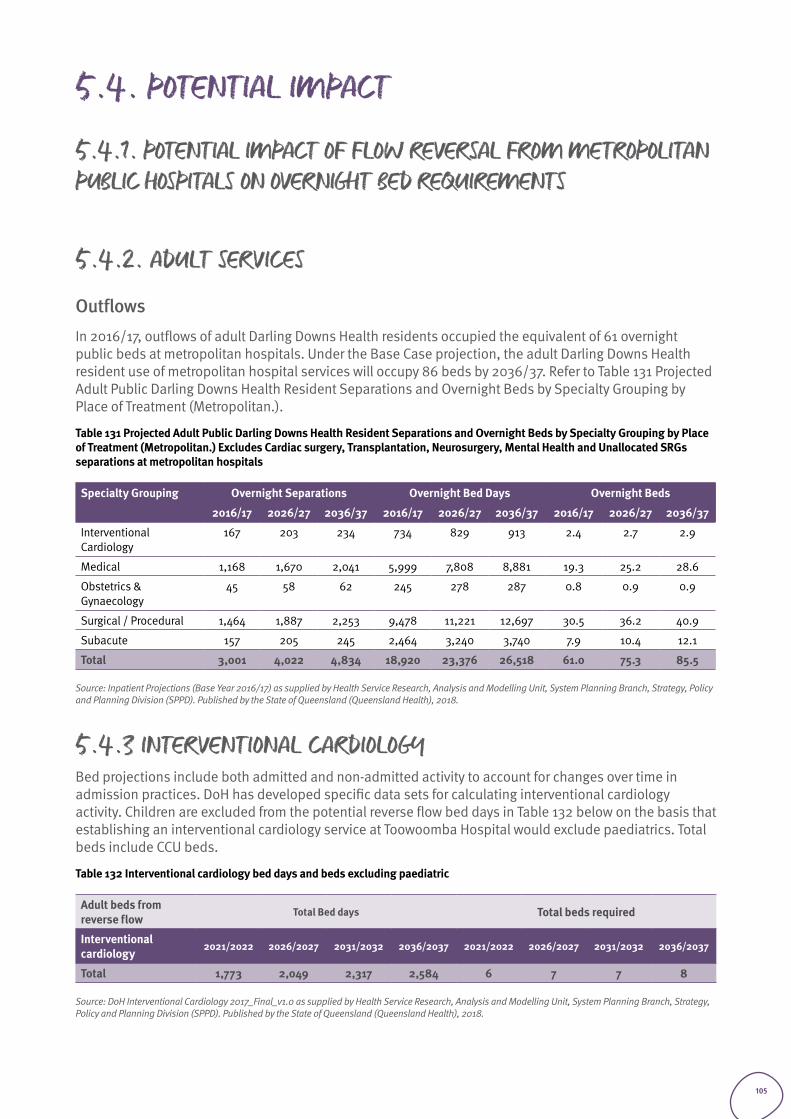
5.4. POTENTIAL IMPACT
5.4.1. POTENTIAL IMPACT OF FLOW REVERSAL FROM METROPOLITAN PUBLIC HOSPITALS ON OVERNIGHT BED REQUIREMENTS
5.4.2. ADULT SERVICES
Outflows In 2016/17, outflows of adult Darling Downs Health residents occupied the equivalent of 61 overnight public beds at metropolitan hospitals. Under the Base Case projection, the adult Darling Downs Health resident use of metropolitan hospital services will occupy 86 beds by 2036/37. Refer to Table 131 Projected Adult Public Darling Downs Health Resident Separations and Overnight Beds by Specialty Grouping by Place of Treatment (Metropolitan.).
Table 131 Projected Adult Public Darling Downs Health Resident Separations and Overnight Beds by Specialty Grouping by Place of Treatment (Metropolitan.) Excludes Cardiac surgery, Transplantation, Neurosurgery, Mental Health and Unallocated SRGs separations at metropolitan hospitals
Specialty Grouping Overnight Separations Overnight Bed Days Overnight Beds
2016/17 2026/27 2036/37 2016/17 2026/27 2036/37 2016/17 2026/27 2036/37
Interventional Cardiology
167 203 234 734 829 913 2.4 2.7 2.9
Medical 1,168 1,670 2,041 5,999 7,808 8,881 19.3 25.2 28.6
Obstetrics & Gynaecology
45 58 62 245 278 287 0.8 0.9 0.9
Surgical / Procedural 1,464 1,887 2,253 9,478 11,221 12,697 30.5 36.2 40.9
Subacute 157 205 245 2,464 3,240 3,740 7.9 10.4 12.1
Total 3,001 4,022 4,834 18,920 23,376 26,518 61.0 75.3 85.5
Source: Inpatient Projections (Base Year 2016/17) as supplied by Health Service Research, Analysis and Modelling Unit, System Planning Branch, Strategy, Policy and Planning Division (SPPD). Published by the State of Queensland (Queensland Health), 2018.
5.4.3 INTERVENTIONAL CARDIOLOGYBed projections include both admitted and non-admitted activity to account for changes over time in admission practices. DoH has developed specific data sets for calculating interventional cardiology activity. Children are excluded from the potential reverse flow bed days in Table 132 below on the basis that establishing an interventional cardiology service at Toowoomba Hospital would exclude paediatrics. Total beds include CCU beds.
Table 132 Interventional cardiology bed days and beds excluding paediatric
Adult beds from reverse flow
Total Bed days Total beds required
Interventional cardiology
2021/2022 2026/2027 2031/2032 2036/2037 2021/2022 2026/2027 2031/2032 2036/2037
Total 1,773 2,049 2,317 2,584 6 7 7 8
Source: DoH Interventional Cardiology 2017_Final_v1.0 as supplied by Health Service Research, Analysis and Modelling Unit, System Planning Branch, Strategy, Policy and Planning Division (SPPD). Published by the State of Queensland (Queensland Health), 2018.
105

Private health sector future demand and potential impact on public sector services
Section 6
106
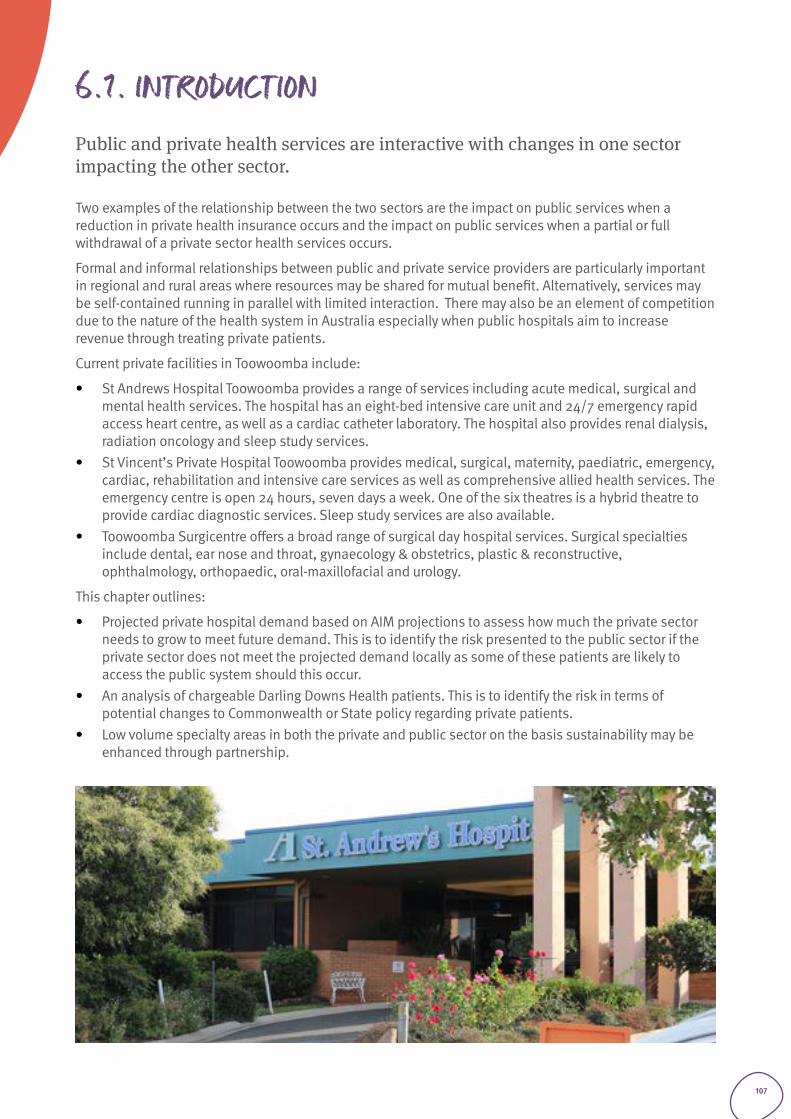
6.1. INTRODUCTION Public and private health services are interactive with changes in one sector impacting the other sector.
Two examples of the relationship between the two sectors are the impact on public services when a reduction in private health insurance occurs and the impact on public services when a partial or full withdrawal of a private sector health services occurs.
Formal and informal relationships between public and private service providers are particularly important in regional and rural areas where resources may be shared for mutual benefit. Alternatively, services may be self-contained running in parallel with limited interaction. There may also be an element of competition due to the nature of the health system in Australia especially when public hospitals aim to increase revenue through treating private patients.
Current private facilities in Toowoomba include:
• St Andrews Hospital Toowoomba provides a range of services including acute medical, surgical and mental health services. The hospital has an eight-bed intensive care unit and 24/7 emergency rapid access heart centre, as well as a cardiac catheter laboratory. The hospital also provides renal dialysis, radiation oncology and sleep study services.
• St Vincent’s Private Hospital Toowoomba provides medical, surgical, maternity, paediatric, emergency, cardiac, rehabilitation and intensive care services as well as comprehensive allied health services. The emergency centre is open 24 hours, seven days a week. One of the six theatres is a hybrid theatre to provide cardiac diagnostic services. Sleep study services are also available.
• Toowoomba Surgicentre offers a broad range of surgical day hospital services. Surgical specialties include dental, ear nose and throat, gynaecology & obstetrics, plastic & reconstructive, ophthalmology, orthopaedic, oral-maxillofacial and urology.
This chapter outlines:
• Projected private hospital demand based on AIM projections to assess how much the private sector needs to grow to meet future demand. This is to identify the risk presented to the public sector if the private sector does not meet the projected demand locally as some of these patients are likely to access the public system should this occur.
• An analysis of chargeable Darling Downs Health patients. This is to identify the risk in terms of potential changes to Commonwealth or State policy regarding private patients.
• Low volume specialty areas in both the private and public sector on the basis sustainability may be enhanced through partnership.
107
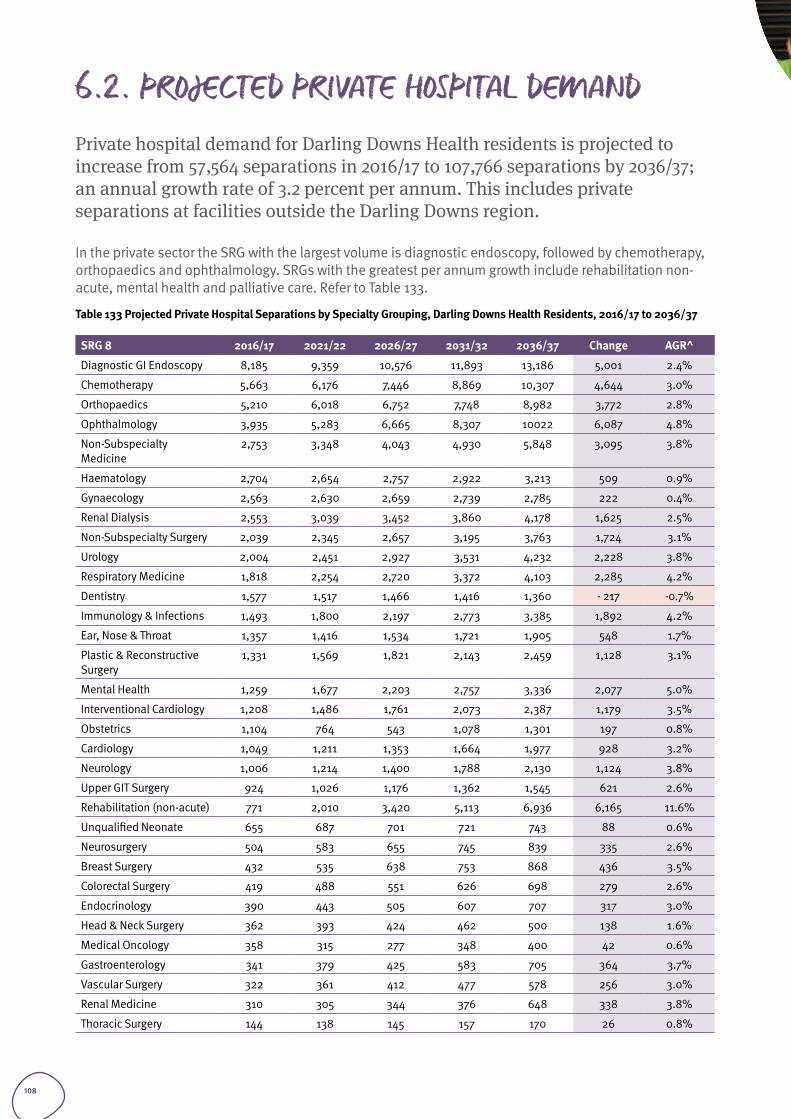
6.2. PROJECTED PRIVATE HOSPITAL DEMAND Private hospital demand for Darling Downs Health residents is projected to increase from 57,564 separations in 2016/17 to 107,766 separations by 2036/37; an annual growth rate of 3.2 percent per annum. This includes private separations at facilities outside the Darling Downs region.
In the private sector the SRG with the largest volume is diagnostic endoscopy, followed by chemotherapy, orthopaedics and ophthalmology. SRGs with the greatest per annum growth include rehabilitation non-acute, mental health and palliative care. Refer to Table 133.
Table 133 Projected Private Hospital Separations by Specialty Grouping, Darling Downs Health Residents, 2016/17 to 2036/37
SRG 8 2016/17 2021/22 2026/27 2031/32 2036/37 Change AGR^
Diagnostic GI Endoscopy 8,185 9,359 10,576 11,893 13,186 5,001 2.4%
Chemotherapy 5,663 6,176 7,446 8,869 10,307 4,644 3.0%
Orthopaedics 5,210 6,018 6,752 7,748 8,982 3,772 2.8%
Ophthalmology 3,935 5,283 6,665 8,307 10022 6,087 4.8%
Non-Subspecialty Medicine
2,753 3,348 4,043 4,930 5,848 3,095 3.8%
Haematology 2,704 2,654 2,757 2,922 3,213 509 0.9%
Gynaecology 2,563 2,630 2,659 2,739 2,785 222 0.4%
Renal Dialysis 2,553 3,039 3,452 3,860 4,178 1,625 2.5%
Non-Subspecialty Surgery 2,039 2,345 2,657 3,195 3,763 1,724 3.1%
Urology 2,004 2,451 2,927 3,531 4,232 2,228 3.8%
Respiratory Medicine 1,818 2,254 2,720 3,372 4,103 2,285 4.2%
Dentistry 1,577 1,517 1,466 1,416 1,360 - 217 -0.7%
Immunology & Infections 1,493 1,800 2,197 2,773 3,385 1,892 4.2%
Ear, Nose & Throat 1,357 1,416 1,534 1,721 1,905 548 1.7%
Plastic & Reconstructive Surgery
1,331 1,569 1,821 2,143 2,459 1,128 3.1%
Mental Health 1,259 1,677 2,203 2,757 3,336 2,077 5.0%
Interventional Cardiology 1,208 1,486 1,761 2,073 2,387 1,179 3.5%
Obstetrics 1,104 764 543 1,078 1,301 197 0.8%
Cardiology 1,049 1,211 1,353 1,664 1,977 928 3.2%
Neurology 1,006 1,214 1,400 1,788 2,130 1,124 3.8%
Upper GIT Surgery 924 1,026 1,176 1,362 1,545 621 2.6%
Rehabilitation (non-acute) 771 2,010 3,420 5,113 6,936 6,165 11.6%
Unqualified Neonate 655 687 701 721 743 88 0.6%
Neurosurgery 504 583 655 745 839 335 2.6%
Breast Surgery 432 535 638 753 868 436 3.5%
Colorectal Surgery 419 488 551 626 698 279 2.6%
Endocrinology 390 443 505 607 707 317 3.0%
Head & Neck Surgery 362 393 424 462 500 138 1.6%
Medical Oncology 358 315 277 348 400 42 0.6%
Gastroenterology 341 379 425 583 705 364 3.7%
Vascular Surgery 322 361 412 477 578 256 3.0%
Renal Medicine 310 305 344 376 648 338 3.8%
Thoracic Surgery 144 138 145 157 170 26 0.8%
108
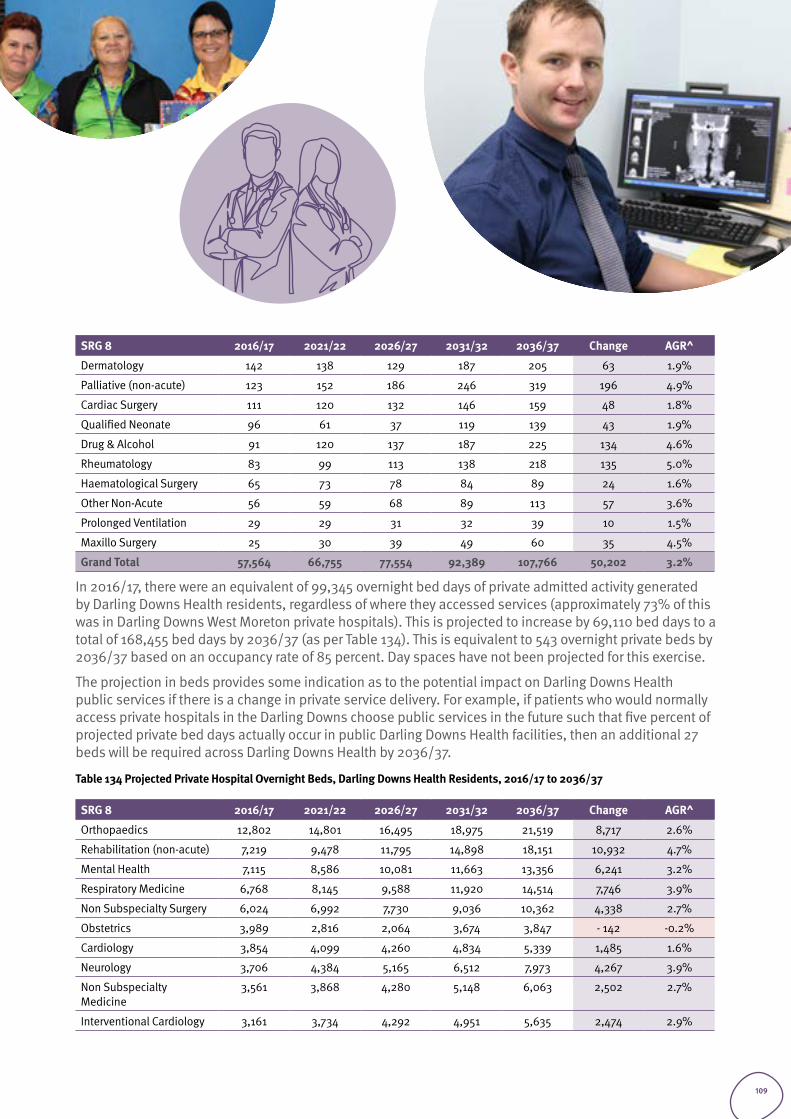
SRG 8 2016/17 2021/22 2026/27 2031/32 2036/37 Change AGR^
Dermatology 142 138 129 187 205 63 1.9%
Palliative (non-acute) 123 152 186 246 319 196 4.9%
Cardiac Surgery 111 120 132 146 159 48 1.8%
Qualified Neonate 96 61 37 119 139 43 1.9%
Drug & Alcohol 91 120 137 187 225 134 4.6%
Rheumatology 83 99 113 138 218 135 5.0%
Haematological Surgery 65 73 78 84 89 24 1.6%
Other Non-Acute 56 59 68 89 113 57 3.6%
Prolonged Ventilation 29 29 31 32 39 10 1.5%
Maxillo Surgery 25 30 39 49 60 35 4.5%
Grand Total 57,564 66,755 77,554 92,389 107,766 50,202 3.2%
In 2016/17, there were an equivalent of 99,345 overnight bed days of private admitted activity generated by Darling Downs Health residents, regardless of where they accessed services (approximately 73% of this was in Darling Downs West Moreton private hospitals). This is projected to increase by 69,110 bed days to a total of 168,455 bed days by 2036/37 (as per Table 134). This is equivalent to 543 overnight private beds by 2036/37 based on an occupancy rate of 85 percent. Day spaces have not been projected for this exercise.
The projection in beds provides some indication as to the potential impact on Darling Downs Health public services if there is a change in private service delivery. For example, if patients who would normally access private hospitals in the Darling Downs choose public services in the future such that five percent of projected private bed days actually occur in public Darling Downs Health facilities, then an additional 27 beds will be required across Darling Downs Health by 2036/37.
Table 134 Projected Private Hospital Overnight Beds, Darling Downs Health Residents, 2016/17 to 2036/37
SRG 8 2016/17 2021/22 2026/27 2031/32 2036/37 Change AGR^
Orthopaedics 12,802 14,801 16,495 18,975 21,519 8,717 2.6%
Rehabilitation (non-acute) 7,219 9,478 11,795 14,898 18,151 10,932 4.7%
Mental Health 7,115 8,586 10,081 11,663 13,356 6,241 3.2%
Respiratory Medicine 6,768 8,145 9,588 11,920 14,514 7,746 3.9%
Non Subspecialty Surgery 6,024 6,992 7,730 9,036 10,362 4,338 2.7%
Obstetrics 3,989 2,816 2,064 3,674 3,847 - 142 -0.2%
Cardiology 3,854 4,099 4,260 4,834 5,339 1,485 1.6%
Neurology 3,706 4,384 5,165 6,512 7,973 4,267 3.9%
Non Subspecialty Medicine
3,561 3,868 4,280 5,148 6,063 2,502 2.7%
Interventional Cardiology 3,161 3,734 4,292 4,951 5,635 2,474 2.9%
109
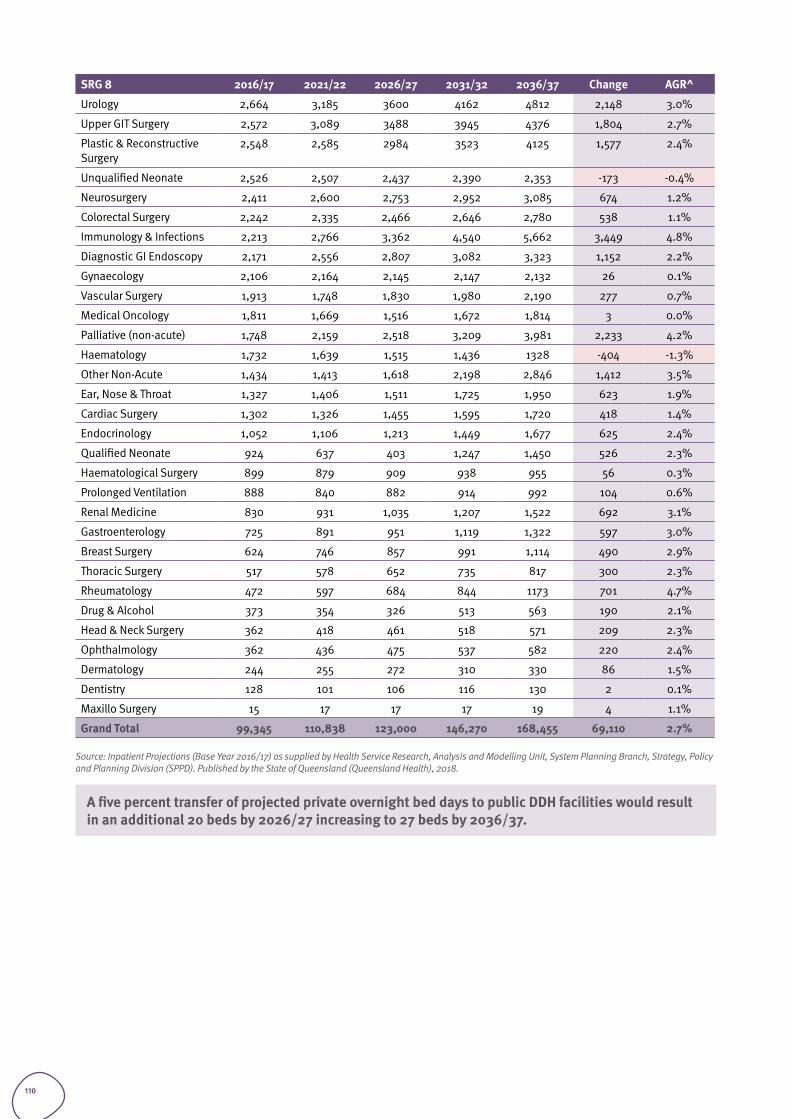
SRG 8 2016/17 2021/22 2026/27 2031/32 2036/37 Change AGR^
Urology 2,664 3,185 3600 4162 4812 2,148 3.0%
Upper GIT Surgery 2,572 3,089 3488 3945 4376 1,804 2.7%
Plastic & Reconstructive Surgery
2,548 2,585 2984 3523 4125 1,577 2.4%
Unqualified Neonate 2,526 2,507 2,437 2,390 2,353 -173 -0.4%
Neurosurgery 2,411 2,600 2,753 2,952 3,085 674 1.2%
Colorectal Surgery 2,242 2,335 2,466 2,646 2,780 538 1.1%
Immunology & Infections 2,213 2,766 3,362 4,540 5,662 3,449 4.8%
Diagnostic GI Endoscopy 2,171 2,556 2,807 3,082 3,323 1,152 2.2%
Gynaecology 2,106 2,164 2,145 2,147 2,132 26 0.1%
Vascular Surgery 1,913 1,748 1,830 1,980 2,190 277 0.7%
Medical Oncology 1,811 1,669 1,516 1,672 1,814 3 0.0%
Palliative (non-acute) 1,748 2,159 2,518 3,209 3,981 2,233 4.2%
Haematology 1,732 1,639 1,515 1,436 1328 -404 -1.3%
Other Non-Acute 1,434 1,413 1,618 2,198 2,846 1,412 3.5%
Ear, Nose & Throat 1,327 1,406 1,511 1,725 1,950 623 1.9%
Cardiac Surgery 1,302 1,326 1,455 1,595 1,720 418 1.4%
Endocrinology 1,052 1,106 1,213 1,449 1,677 625 2.4%
Qualified Neonate 924 637 403 1,247 1,450 526 2.3%
Haematological Surgery 899 879 909 938 955 56 0.3%
Prolonged Ventilation 888 840 882 914 992 104 0.6%
Renal Medicine 830 931 1,035 1,207 1,522 692 3.1%
Gastroenterology 725 891 951 1,119 1,322 597 3.0%
Breast Surgery 624 746 857 991 1,114 490 2.9%
Thoracic Surgery 517 578 652 735 817 300 2.3%
Rheumatology 472 597 684 844 1173 701 4.7%
Drug & Alcohol 373 354 326 513 563 190 2.1%
Head & Neck Surgery 362 418 461 518 571 209 2.3%
Ophthalmology 362 436 475 537 582 220 2.4%
Dermatology 244 255 272 310 330 86 1.5%
Dentistry 128 101 106 116 130 2 0.1%
Maxillo Surgery 15 17 17 17 19 4 1.1%
Grand Total 99,345 110,838 123,000 146,270 168,455 69,110 2.7%
Source: Inpatient Projections (Base Year 2016/17) as supplied by Health Service Research, Analysis and Modelling Unit, System Planning Branch, Strategy, Policy and Planning Division (SPPD). Published by the State of Queensland (Queensland Health), 2018.
A five percent transfer of projected private overnight bed days to public DDH facilities would result in an additional 20 beds by 2026/27 increasing to 27 beds by 2036/37.
110
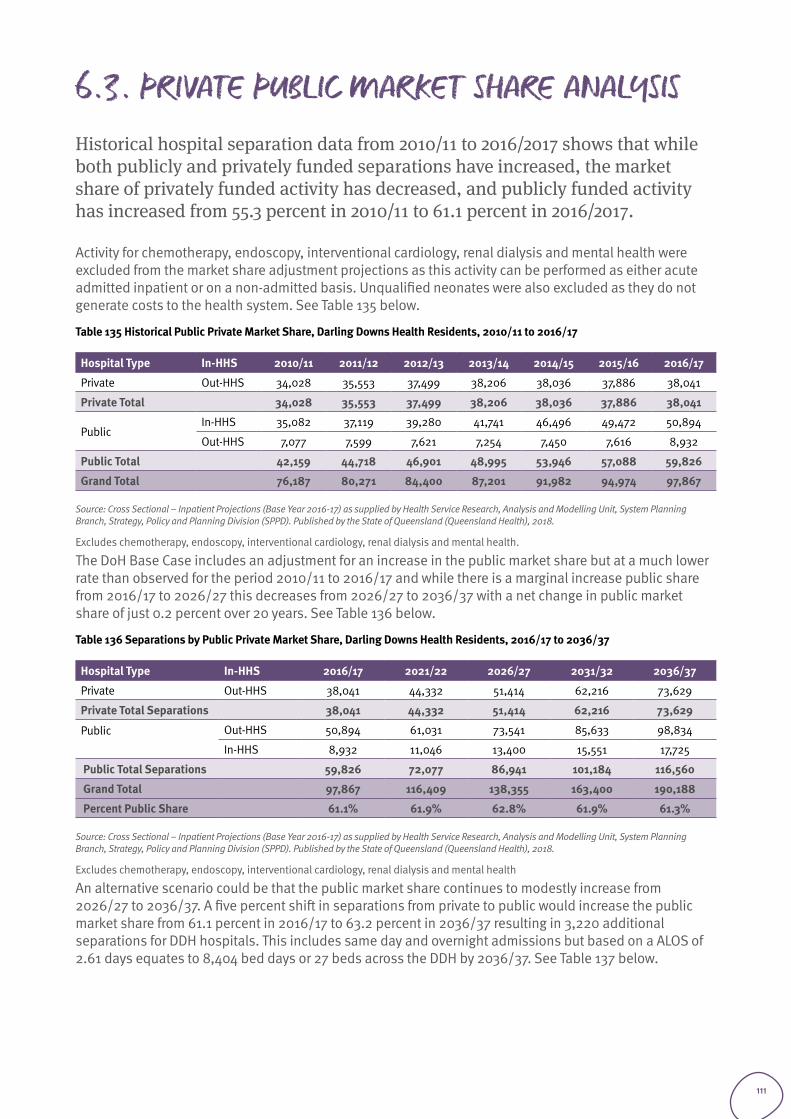
6.3. PRIVATE PUBLIC MARKET SHARE ANALYSISHistorical hospital separation data from 2010/11 to 2016/2017 shows that while both publicly and privately funded separations have increased, the market share of privately funded activity has decreased, and publicly funded activity has increased from 55.3 percent in 2010/11 to 61.1 percent in 2016/2017.
Activity for chemotherapy, endoscopy, interventional cardiology, renal dialysis and mental health were excluded from the market share adjustment projections as this activity can be performed as either acute admitted inpatient or on a non-admitted basis. Unqualified neonates were also excluded as they do not generate costs to the health system. See Table 135 below.
Table 135 Historical Public Private Market Share, Darling Downs Health Residents, 2010/11 to 2016/17
Hospital Type In-HHS 2010/11 2011/12 2012/13 2013/14 2014/15 2015/16 2016/17
Private Out-HHS 34,028 35,553 37,499 38,206 38,036 37,886 38,041
Private Total 34,028 35,553 37,499 38,206 38,036 37,886 38,041
PublicIn-HHS 35,082 37,119 39,280 41,741 46,496 49,472 50,894
Out-HHS 7,077 7,599 7,621 7,254 7,450 7,616 8,932
Public Total 42,159 44,718 46,901 48,995 53,946 57,088 59,826
Grand Total 76,187 80,271 84,400 87,201 91,982 94,974 97,867
Source: Cross Sectional – Inpatient Projections (Base Year 2016-17) as supplied by Health Service Research, Analysis and Modelling Unit, System Planning Branch, Strategy, Policy and Planning Division (SPPD). Published by the State of Queensland (Queensland Health), 2018.
Excludes chemotherapy, endoscopy, interventional cardiology, renal dialysis and mental health.
The DoH Base Case includes an adjustment for an increase in the public market share but at a much lower rate than observed for the period 2010/11 to 2016/17 and while there is a marginal increase public share from 2016/17 to 2026/27 this decreases from 2026/27 to 2036/37 with a net change in public market share of just 0.2 percent over 20 years. See Table 136 below.
Table 136 Separations by Public Private Market Share, Darling Downs Health Residents, 2016/17 to 2036/37
Hospital Type In-HHS 2016/17 2021/22 2026/27 2031/32 2036/37
Private Out-HHS 38,041 44,332 51,414 62,216 73,629
Private Total Separations 38,041 44,332 51,414 62,216 73,629
Public
Out-HHS 50,894 61,031 73,541 85,633 98,834
In-HHS 8,932 11,046 13,400 15,551 17,725
Public Total Separations 59,826 72,077 86,941 101,184 116,560
Grand Total 97,867 116,409 138,355 163,400 190,188
Percent Public Share 61.1% 61.9% 62.8% 61.9% 61.3%
Source: Cross Sectional – Inpatient Projections (Base Year 2016-17) as supplied by Health Service Research, Analysis and Modelling Unit, System Planning Branch, Strategy, Policy and Planning Division (SPPD). Published by the State of Queensland (Queensland Health), 2018.
Excludes chemotherapy, endoscopy, interventional cardiology, renal dialysis and mental health
An alternative scenario could be that the public market share continues to modestly increase from 2026/27 to 2036/37. A five percent shift in separations from private to public would increase the public market share from 61.1 percent in 2016/17 to 63.2 percent in 2036/37 resulting in 3,220 additional separations for DDH hospitals. This includes same day and overnight admissions but based on a ALOS of 2.61 days equates to 8,404 bed days or 27 beds across the DDH by 2036/37. See Table 137 below.
111
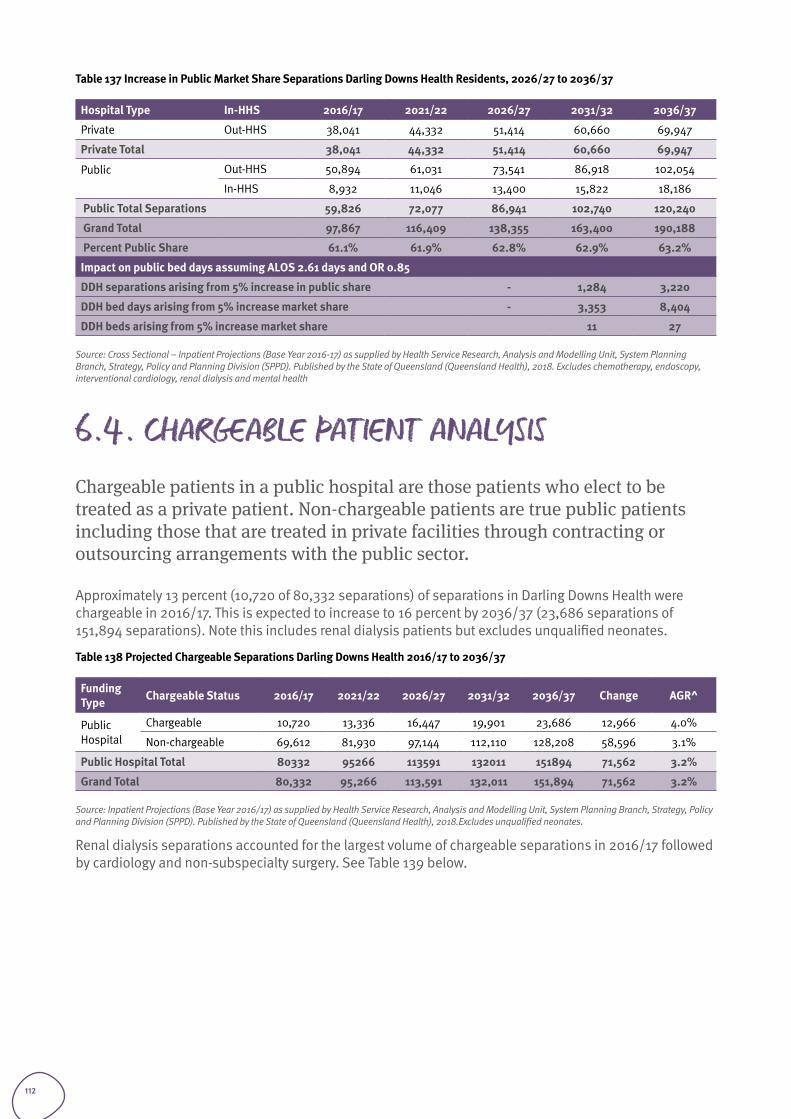
Table 137 Increase in Public Market Share Separations Darling Downs Health Residents, 2026/27 to 2036/37
Hospital Type In-HHS 2016/17 2021/22 2026/27 2031/32 2036/37
Private Out-HHS 38,041 44,332 51,414 60,660 69,947
Private Total 38,041 44,332 51,414 60,660 69,947
Public
Out-HHS 50,894 61,031 73,541 86,918 102,054
In-HHS 8,932 11,046 13,400 15,822 18,186
Public Total Separations 59,826 72,077 86,941 102,740 120,240
Grand Total 97,867 116,409 138,355 163,400 190,188
Percent Public Share 61.1% 61.9% 62.8% 62.9% 63.2%
Impact on public bed days assuming ALOS 2.61 days and OR 0.85
DDH separations arising from 5% increase in public share - 1,284 3,220
DDH bed days arising from 5% increase market share - 3,353 8,404
DDH beds arising from 5% increase market share 11 27
Source: Cross Sectional – Inpatient Projections (Base Year 2016-17) as supplied by Health Service Research, Analysis and Modelling Unit, System Planning Branch, Strategy, Policy and Planning Division (SPPD). Published by the State of Queensland (Queensland Health), 2018. Excludes chemotherapy, endoscopy, interventional cardiology, renal dialysis and mental health
6.4. CHARGEABLE PATIENT ANALYSISChargeable patients in a public hospital are those patients who elect to be treated as a private patient. Non-chargeable patients are true public patients including those that are treated in private facilities through contracting or outsourcing arrangements with the public sector.
Approximately 13 percent (10,720 of 80,332 separations) of separations in Darling Downs Health were chargeable in 2016/17. This is expected to increase to 16 percent by 2036/37 (23,686 separations of 151,894 separations). Note this includes renal dialysis patients but excludes unqualified neonates.
Table 138 Projected Chargeable Separations Darling Downs Health 2016/17 to 2036/37
Funding Type Chargeable Status 2016/17 2021/22 2026/27 2031/32 2036/37 Change AGR^
Public Hospital
Chargeable 10,720 13,336 16,447 19,901 23,686 12,966 4.0%
Non-chargeable 69,612 81,930 97,144 112,110 128,208 58,596 3.1%
Public Hospital Total 80332 95266 113591 132011 151894 71,562 3.2%
Grand Total 80,332 95,266 113,591 132,011 151,894 71,562 3.2%
Source: Inpatient Projections (Base Year 2016/17) as supplied by Health Service Research, Analysis and Modelling Unit, System Planning Branch, Strategy, Policy and Planning Division (SPPD). Published by the State of Queensland (Queensland Health), 2018.Excludes unqualified neonates.
Renal dialysis separations accounted for the largest volume of chargeable separations in 2016/17 followed by cardiology and non-subspecialty surgery. See Table 139 below.
112
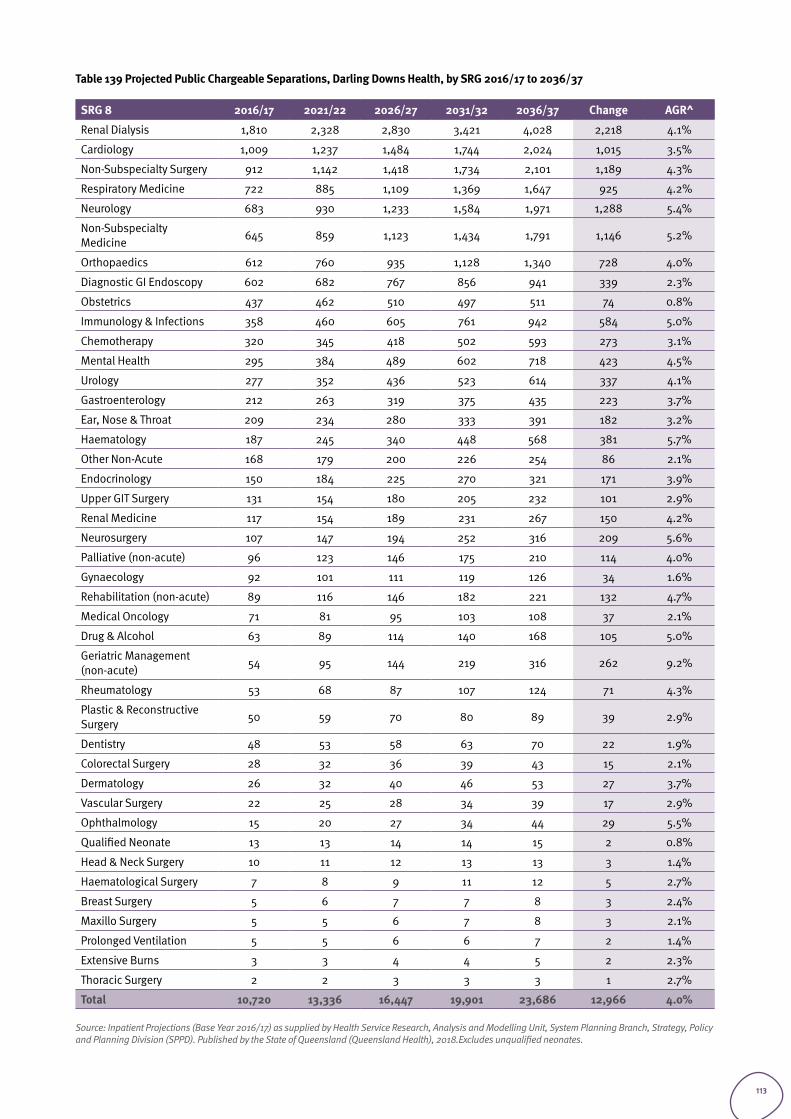
Table 139 Projected Public Chargeable Separations, Darling Downs Health, by SRG 2016/17 to 2036/37
SRG 8 2016/17 2021/22 2026/27 2031/32 2036/37 Change AGR^
Renal Dialysis 1,810 2,328 2,830 3,421 4,028 2,218 4.1%
Cardiology 1,009 1,237 1,484 1,744 2,024 1,015 3.5%
Non-Subspecialty Surgery 912 1,142 1,418 1,734 2,101 1,189 4.3%
Respiratory Medicine 722 885 1,109 1,369 1,647 925 4.2%
Neurology 683 930 1,233 1,584 1,971 1,288 5.4%
Non-Subspecialty Medicine 645 859 1,123 1,434 1,791 1,146 5.2%
Orthopaedics 612 760 935 1,128 1,340 728 4.0%
Diagnostic GI Endoscopy 602 682 767 856 941 339 2.3%
Obstetrics 437 462 510 497 511 74 0.8%
Immunology & Infections 358 460 605 761 942 584 5.0%
Chemotherapy 320 345 418 502 593 273 3.1%
Mental Health 295 384 489 602 718 423 4.5%
Urology 277 352 436 523 614 337 4.1%
Gastroenterology 212 263 319 375 435 223 3.7%
Ear, Nose & Throat 209 234 280 333 391 182 3.2%
Haematology 187 245 340 448 568 381 5.7%
Other Non-Acute 168 179 200 226 254 86 2.1%
Endocrinology 150 184 225 270 321 171 3.9%
Upper GIT Surgery 131 154 180 205 232 101 2.9%
Renal Medicine 117 154 189 231 267 150 4.2%
Neurosurgery 107 147 194 252 316 209 5.6%
Palliative (non-acute) 96 123 146 175 210 114 4.0%
Gynaecology 92 101 111 119 126 34 1.6%
Rehabilitation (non-acute) 89 116 146 182 221 132 4.7%
Medical Oncology 71 81 95 103 108 37 2.1%
Drug & Alcohol 63 89 114 140 168 105 5.0%
Geriatric Management (non-acute) 54 95 144 219 316 262 9.2%
Rheumatology 53 68 87 107 124 71 4.3%
Plastic & Reconstructive Surgery 50 59 70 80 89 39 2.9%
Dentistry 48 53 58 63 70 22 1.9%
Colorectal Surgery 28 32 36 39 43 15 2.1%
Dermatology 26 32 40 46 53 27 3.7%
Vascular Surgery 22 25 28 34 39 17 2.9%
Ophthalmology 15 20 27 34 44 29 5.5%
Qualified Neonate 13 13 14 14 15 2 0.8%
Head & Neck Surgery 10 11 12 13 13 3 1.4%
Haematological Surgery 7 8 9 11 12 5 2.7%
Breast Surgery 5 6 7 7 8 3 2.4%
Maxillo Surgery 5 5 6 7 8 3 2.1%
Prolonged Ventilation 5 5 6 6 7 2 1.4%
Extensive Burns 3 3 4 4 5 2 2.3%
Thoracic Surgery 2 2 3 3 3 1 2.7%
Total 10,720 13,336 16,447 19,901 23,686 12,966 4.0%
Source: Inpatient Projections (Base Year 2016/17) as supplied by Health Service Research, Analysis and Modelling Unit, System Planning Branch, Strategy, Policy and Planning Division (SPPD). Published by the State of Queensland (Queensland Health), 2018.Excludes unqualified neonates.
113
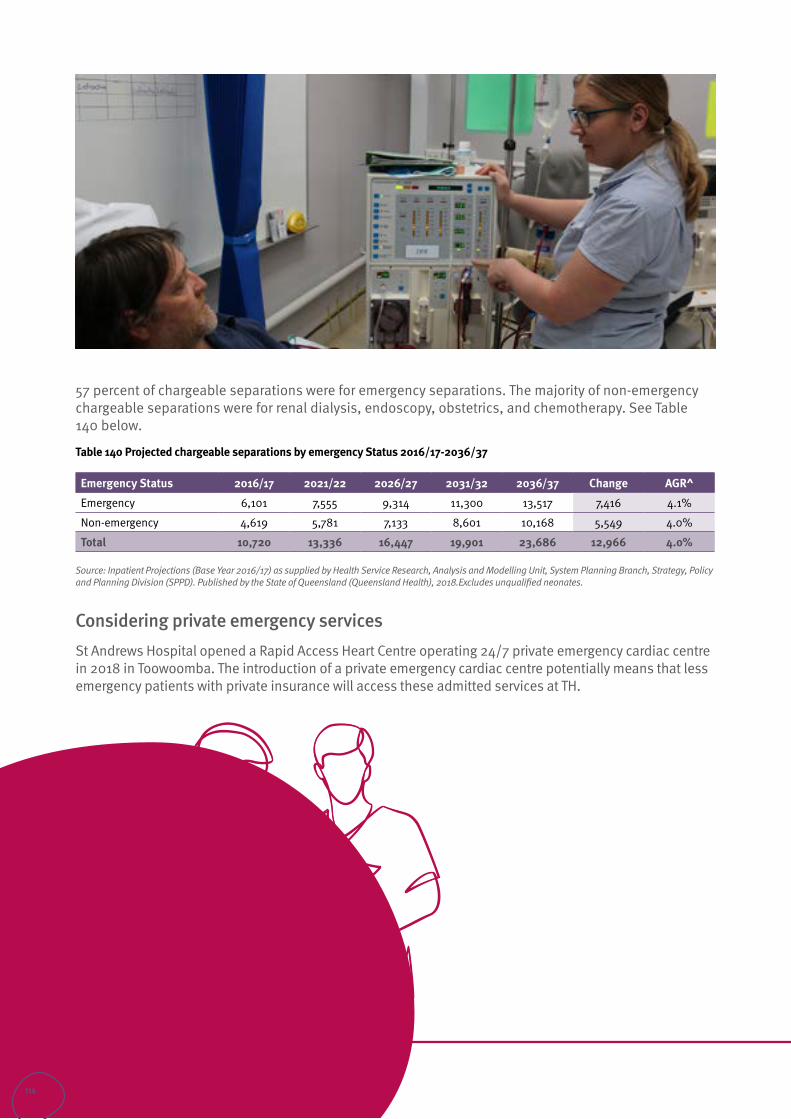
57 percent of chargeable separations were for emergency separations. The majority of non-emergency chargeable separations were for renal dialysis, endoscopy, obstetrics, and chemotherapy. See Table 140 below.
Table 140 Projected chargeable separations by emergency Status 2016/17-2036/37
Emergency Status 2016/17 2021/22 2026/27 2031/32 2036/37 Change AGR^
Emergency 6,101 7,555 9,314 11,300 13,517 7,416 4.1%
Non-emergency 4,619 5,781 7,133 8,601 10,168 5,549 4.0%
Total 10,720 13,336 16,447 19,901 23,686 12,966 4.0%
Source: Inpatient Projections (Base Year 2016/17) as supplied by Health Service Research, Analysis and Modelling Unit, System Planning Branch, Strategy, Policy and Planning Division (SPPD). Published by the State of Queensland (Queensland Health), 2018.Excludes unqualified neonates.
Considering private emergency services St Andrews Hospital opened a Rapid Access Heart Centre operating 24/7 private emergency cardiac centre in 2018 in Toowoomba. The introduction of a private emergency cardiac centre potentially means that less emergency patients with private insurance will access these admitted services at TH.
114
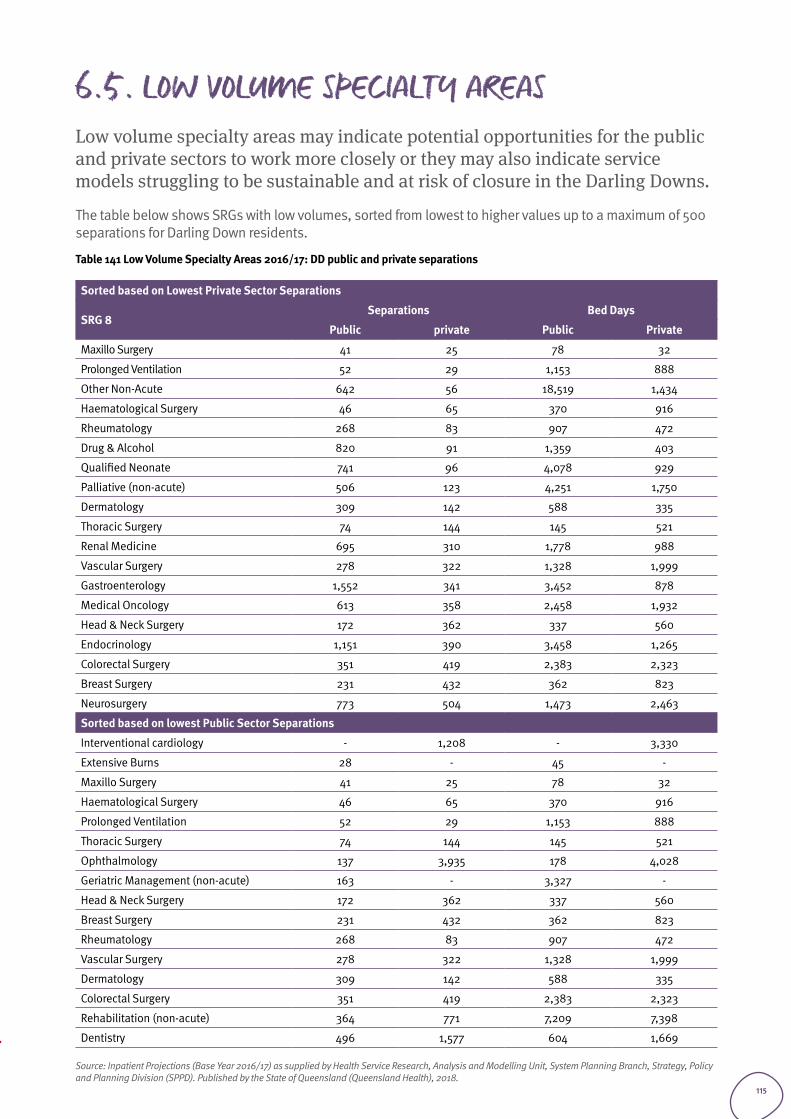
6.5. LOW VOLUME SPECIALTY AREASLow volume specialty areas may indicate potential opportunities for the public and private sectors to work more closely or they may also indicate service models struggling to be sustainable and at risk of closure in the Darling Downs.
The table below shows SRGs with low volumes, sorted from lowest to higher values up to a maximum of 500 separations for Darling Down residents.
Table 141 Low Volume Specialty Areas 2016/17: DD public and private separations
Sorted based on Lowest Private Sector Separations
SRG 8Separations Bed Days
Public private Public Private
Maxillo Surgery 41 25 78 32
Prolonged Ventilation 52 29 1,153 888
Other Non-Acute 642 56 18,519 1,434
Haematological Surgery 46 65 370 916
Rheumatology 268 83 907 472
Drug & Alcohol 820 91 1,359 403
Qualified Neonate 741 96 4,078 929
Palliative (non-acute) 506 123 4,251 1,750
Dermatology 309 142 588 335
Thoracic Surgery 74 144 145 521
Renal Medicine 695 310 1,778 988
Vascular Surgery 278 322 1,328 1,999
Gastroenterology 1,552 341 3,452 878
Medical Oncology 613 358 2,458 1,932
Head & Neck Surgery 172 362 337 560
Endocrinology 1,151 390 3,458 1,265
Colorectal Surgery 351 419 2,383 2,323
Breast Surgery 231 432 362 823
Neurosurgery 773 504 1,473 2,463
Sorted based on lowest Public Sector Separations
Interventional cardiology - 1,208 - 3,330
Extensive Burns 28 - 45 -
Maxillo Surgery 41 25 78 32
Haematological Surgery 46 65 370 916
Prolonged Ventilation 52 29 1,153 888
Thoracic Surgery 74 144 145 521
Ophthalmology 137 3,935 178 4,028
Geriatric Management (non-acute) 163 - 3,327 -
Head & Neck Surgery 172 362 337 560
Breast Surgery 231 432 362 823
Rheumatology 268 83 907 472
Vascular Surgery 278 322 1,328 1,999
Dermatology 309 142 588 335
Colorectal Surgery 351 419 2,383 2,323
Rehabilitation (non-acute) 364 771 7,209 7,398
Dentistry 496 1,577 604 1,669
Source: Inpatient Projections (Base Year 2016/17) as supplied by Health Service Research, Analysis and Modelling Unit, System Planning Branch, Strategy, Policy and Planning Division (SPPD). Published by the State of Queensland (Queensland Health), 2018.
115
Projected capacity requirements summary
Section 7
116
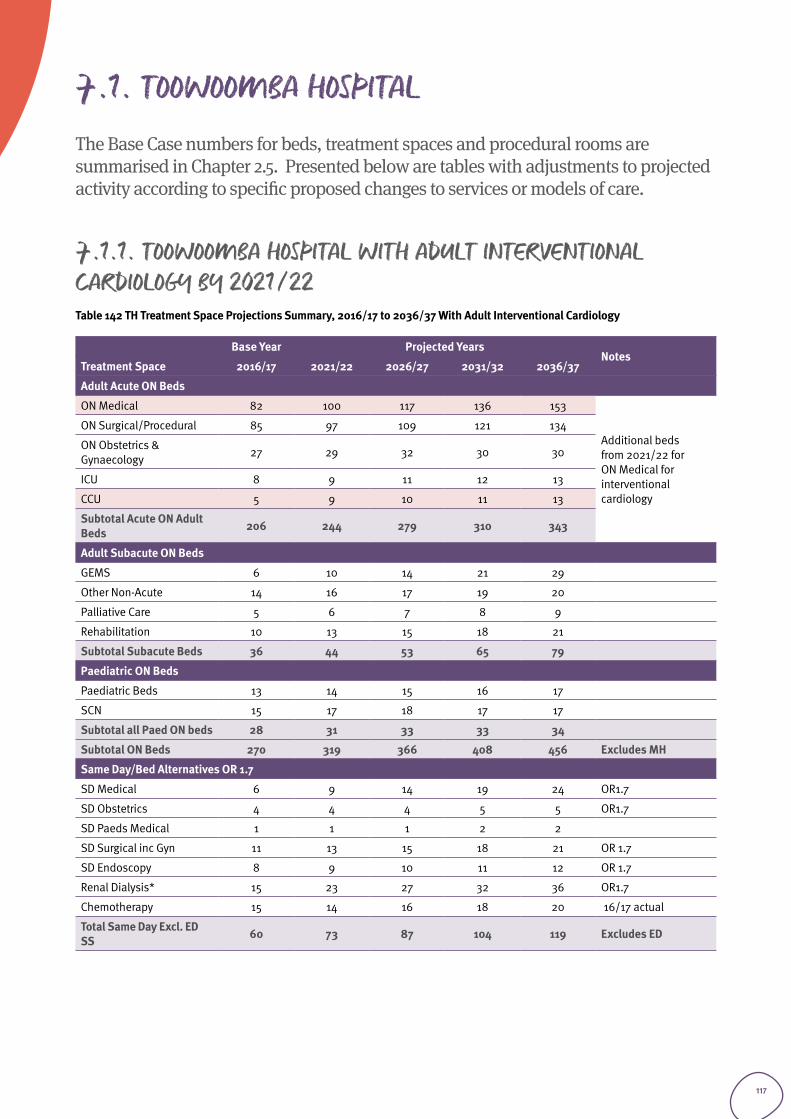
7.1. TOOWOOMBA HOSPITAL The Base Case numbers for beds, treatment spaces and procedural rooms are summarised in Chapter 2.5. Presented below are tables with adjustments to projected activity according to specific proposed changes to services or models of care.
7.1.1. TOOWOOMBA HOSPITAL WITH ADULT INTERVENTIONAL CARDIOLOGY BY 2021/22Table 142 TH Treatment Space Projections Summary, 2016/17 to 2036/37 With Adult Interventional Cardiology
Base Year Projected YearsNotes
Treatment Space 2016/17 2021/22 2026/27 2031/32 2036/37
Adult Acute ON Beds
ON Medical 82 100 117 136 153
Additional beds from 2021/22 for ON Medical for interventional cardiology
ON Surgical/Procedural 85 97 109 121 134
ON Obstetrics & Gynaecology 27 29 32 30 30
ICU 8 9 11 12 13
CCU 5 9 10 11 13
Subtotal Acute ON Adult Beds 206 244 279 310 343
Adult Subacute ON Beds
GEMS 6 10 14 21 29
Other Non-Acute 14 16 17 19 20
Palliative Care 5 6 7 8 9
Rehabilitation 10 13 15 18 21
Subtotal Subacute Beds 36 44 53 65 79
Paediatric ON Beds
Paediatric Beds 13 14 15 16 17
SCN 15 17 18 17 17
Subtotal all Paed ON beds 28 31 33 33 34
Subtotal ON Beds 270 319 366 408 456 Excludes MH
Same Day/Bed Alternatives OR 1.7
SD Medical 6 9 14 19 24 OR1.7
SD Obstetrics 4 4 4 5 5 OR1.7
SD Paeds Medical 1 1 1 2 2
SD Surgical inc Gyn 11 13 15 18 21 OR 1.7
SD Endoscopy 8 9 10 11 12 OR 1.7
Renal Dialysis* 15 23 27 32 36 OR1.7
Chemotherapy 15 14 16 18 20 16/17 actual
Total Same Day Excl. ED SS 60 73 87 104 119 Excludes ED
117
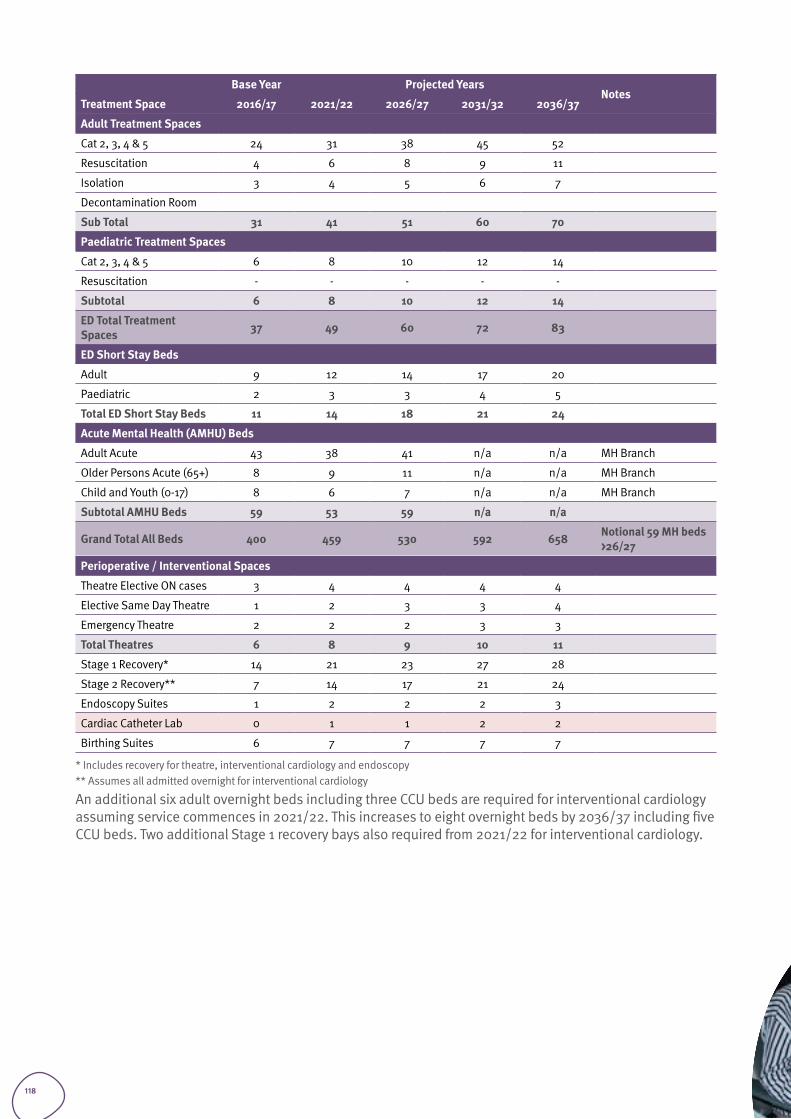
Base Year Projected YearsNotes
Treatment Space 2016/17 2021/22 2026/27 2031/32 2036/37
Adult Treatment Spaces
Cat 2, 3, 4 & 5 24 31 38 45 52
Resuscitation 4 6 8 9 11
Isolation 3 4 5 6 7
Decontamination Room
Sub Total 31 41 51 60 70
Paediatric Treatment Spaces
Cat 2, 3, 4 & 5 6 8 10 12 14
Resuscitation - - - - -
Subtotal 6 8 10 12 14
ED Total Treatment Spaces 37 49 60 72 83
ED Short Stay Beds
Adult 9 12 14 17 20
Paediatric 2 3 3 4 5
Total ED Short Stay Beds 11 14 18 21 24
Acute Mental Health (AMHU) Beds
Adult Acute 43 38 41 n/a n/a MH Branch
Older Persons Acute (65+) 8 9 11 n/a n/a MH Branch
Child and Youth (0-17) 8 6 7 n/a n/a MH Branch
Subtotal AMHU Beds 59 53 59 n/a n/a
Grand Total All Beds 400 459 530 592 658 Notional 59 MH beds >26/27
Perioperative / Interventional Spaces
Theatre Elective ON cases 3 4 4 4 4
Elective Same Day Theatre 1 2 3 3 4
Emergency Theatre 2 2 2 3 3
Total Theatres 6 8 9 10 11
Stage 1 Recovery* 14 21 23 27 28
Stage 2 Recovery** 7 14 17 21 24
Endoscopy Suites 1 2 2 2 3
Cardiac Catheter Lab 0 1 1 2 2
Birthing Suites 6 7 7 7 7
* Includes recovery for theatre, interventional cardiology and endoscopy** Assumes all admitted overnight for interventional cardiology
An additional six adult overnight beds including three CCU beds are required for interventional cardiology assuming service commences in 2021/22. This increases to eight overnight beds by 2036/37 including five CCU beds. Two additional Stage 1 recovery bays also required from 2021/22 for interventional cardiology.
118
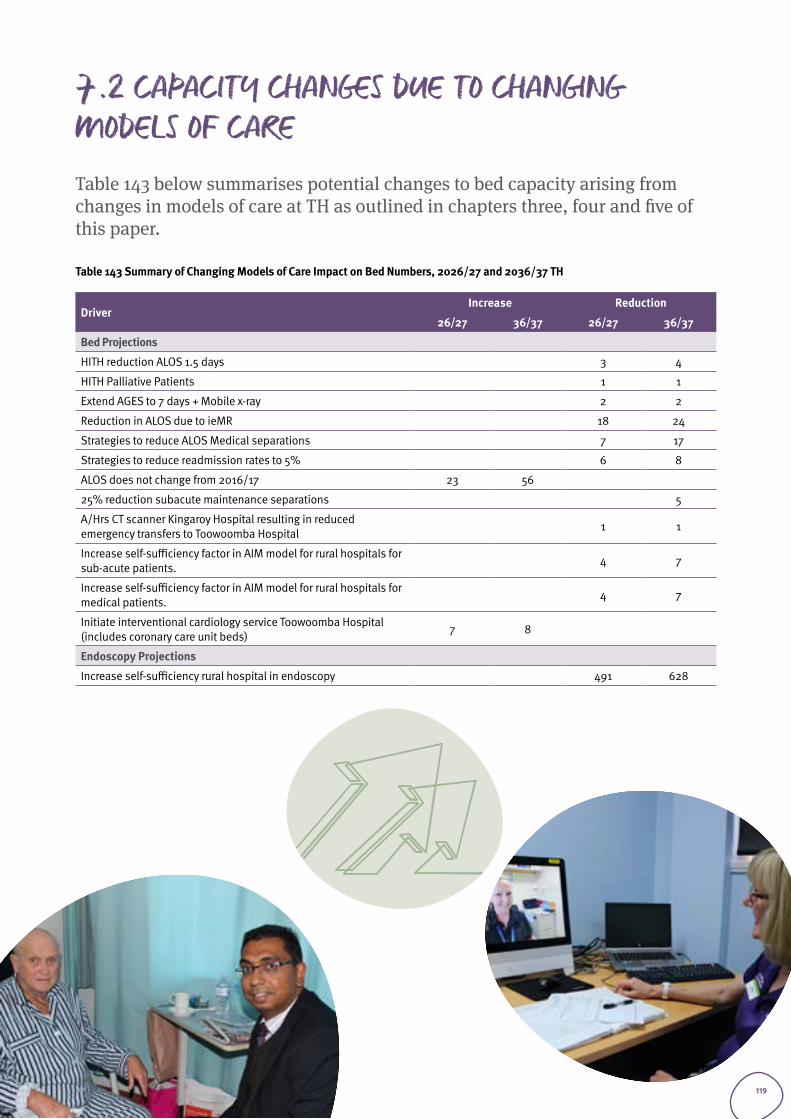
7.2 CAPACITY CHANGES DUE TO CHANGING MODELS OF CARETable 143 below summarises potential changes to bed capacity arising from changes in models of care at TH as outlined in chapters three, four and five of this paper.
Table 143 Summary of Changing Models of Care Impact on Bed Numbers, 2026/27 and 2036/37 TH
DriverIncrease Reduction
26/27 36/37 26/27 36/37
Bed Projections
HITH reduction ALOS 1.5 days 3 4
HITH Palliative Patients 1 1
Extend AGES to 7 days + Mobile x-ray 2 2
Reduction in ALOS due to ieMR 18 24
Strategies to reduce ALOS Medical separations 7 17
Strategies to reduce readmission rates to 5% 6 8
ALOS does not change from 2016/17 23 56
25% reduction subacute maintenance separations 5
A/Hrs CT scanner Kingaroy Hospital resulting in reduced emergency transfers to Toowoomba Hospital 1 1
Increase self-sufficiency factor in AIM model for rural hospitals for sub-acute patients. 4 7
Increase self-sufficiency factor in AIM model for rural hospitals for medical patients. 4 7
Initiate interventional cardiology service Toowoomba Hospital (includes coronary care unit beds) 7 8
Endoscopy Projections
Increase self-sufficiency rural hospital in endoscopy 491 628
119
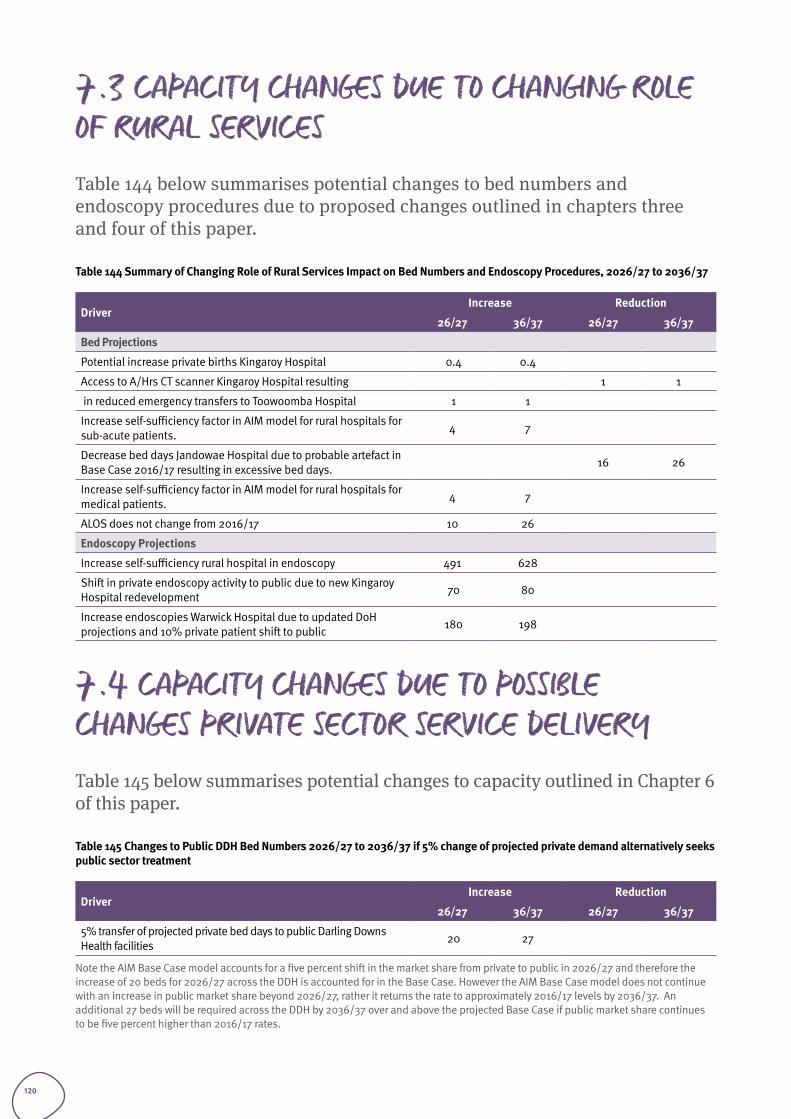
7.3 CAPACITY CHANGES DUE TO CHANGING ROLE OF RURAL SERVICESTable 144 below summarises potential changes to bed numbers and endoscopy procedures due to proposed changes outlined in chapters three and four of this paper.
Table 144 Summary of Changing Role of Rural Services Impact on Bed Numbers and Endoscopy Procedures, 2026/27 to 2036/37
DriverIncrease Reduction
26/27 36/37 26/27 36/37
Bed Projections
Potential increase private births Kingaroy Hospital 0.4 0.4
Access to A/Hrs CT scanner Kingaroy Hospital resulting 1 1
in reduced emergency transfers to Toowoomba Hospital 1 1
Increase self-sufficiency factor in AIM model for rural hospitals for sub-acute patients. 4 7
Decrease bed days Jandowae Hospital due to probable artefact in Base Case 2016/17 resulting in excessive bed days. 16 26
Increase self-sufficiency factor in AIM model for rural hospitals for medical patients. 4 7
ALOS does not change from 2016/17 10 26
Endoscopy Projections
Increase self-sufficiency rural hospital in endoscopy 491 628
Shift in private endoscopy activity to public due to new Kingaroy Hospital redevelopment 70 80
Increase endoscopies Warwick Hospital due to updated DoH projections and 10% private patient shift to public 180 198
7.4 CAPACITY CHANGES DUE TO POSSIBLE CHANGES PRIVATE SECTOR SERVICE DELIVERYTable 145 below summarises potential changes to capacity outlined in Chapter 6 of this paper.
Table 145 Changes to Public DDH Bed Numbers 2026/27 to 2036/37 if 5% change of projected private demand alternatively seeks public sector treatment
DriverIncrease Reduction
26/27 36/37 26/27 36/37
5% transfer of projected private bed days to public Darling Downs Health facilities 20 27
Note the AIM Base Case model accounts for a five percent shift in the market share from private to public in 2026/27 and therefore the increase of 20 beds for 2026/27 across the DDH is accounted for in the Base Case. However the AIM Base Case model does not continue with an increase in public market share beyond 2026/27, rather it returns the rate to approximately 2016/17 levels by 2036/37. An additional 27 beds will be required across the DDH by 2036/37 over and above the projected Base Case if public market share continues to be five percent higher than 2016/17 rates.
120
Figures and tablesTable 1 Population by Age Group, Darling Downs Health, 2011 vs 2016 Projected vs. 2016 Census ................................................ 11Table 2 Population by Local Planning Region, Darling Downs Health, 2011 vs 2016 Projected vs 2016 Census .............................. 11Table 3 Total Activity, Darling Downs Health by Adult / Child and Stay Type, 2016/17 to 2036/37 .................................................. 12Table 4 Adult Activity, Darling Downs Health by Stay Type and Specialty Grouping, 2016/17 to 2036/37 ....................................... 13Table 5 Adult Medical Activity, DDH by Stay Type and Service Related Group (SRG), 2016/17 to 2036/37 ....................................... 14Table 6 Adult Medical Activity, Darling Downs Health by Place of Treatment 2016/17 to 2036/37 .................................................. 15Table 7 Adult Surgical / Procedural Activity, Darling Downs Health by Stay Type and SRG, 2016/17 to 2036/37 ............................. 17Table 8 Relative Utilisation 2016/17 of Neurosurgery, Ophthalmology, Plastic Surgery, Urology and Vascular Surgery Public Patients Darling Downs Health residents. ..................................................................................................................................... 19Table 9 Public Services provided by hospitals outside Darling Downs Health to Darling Downs Health Residents 2016/17 for Neurosurgery, Ophthalmology, Plastic Surgery, Urology and Vascular Surgery .............................................................................. 19Table 10 Adult Surgical / Procedural Activity, Darling Downs Health by Place of Treatment and Stay Type, 2016/17 to 2036/37 (public patients) ...........................................................................................................................................................................20 Table 11 Adult Mental Health, Darling Downs Health by Stay Type 2016/17 to 2036/37 .................................................................22Table 12 Total Mental Health separations 2016/17 by Indigenous Status .......................................................................................22Table 13 Adult Mental Health, Darling Downs Health by Place of Treatment and Stay Type, 2016/17 to 2036/37 ............................ 23Table 14 Average Length of Stay (ALOS) Mental Health separations 2016/17 by place of treatment ...............................................24Table 15 Obstetrics and Gynaecology Activity, DDH by Stay Type and SRG/ESRG, 2016/17 to 2036/37 .......................................... 25Figure 1 Births by Facility 2016/17 .................................................................................................................................................26Table 16 Obstetrics and Gynaecology Activity, Darling Downs Health by Place of Treatment and Stay Type, 2016/17 to 2036/37 ....26Table 17 Obstetrics and Gynaecology Separations and Bed days, Darling Downs Health by Place of Treatment by SRG and ESRG .......28Table 18 Births Toowoomba Hospital 2016/17 by place of residence. ............................................................................................30Table 19 Adult Subacute Activity, Darling Downs Health by Stay Type and SRG/ESRG, 2016/17 to 2036/37 ................................... 31Table 20 Adult Subacute Activity, Darling Downs Health by Place of Treatment 2016/17 to 2036/37 ..............................................32Table 21 Adult ICU Bed days, Darling Downs Health by Specialty Grouping, 2016/17 to 2036/37 ...................................................34Table 22 Adult ICU Bed days, Darling Downs Health by Specialty Grouping, 2015/16 to 2036/37 ..................................................34Table 23 Paediatric Activity, Darling Downs Health by Stay Type and Specialty Grouping, 2016/17 to 2036/37 .............................. 35Table 24 Paediatric Activity, Darling Downs Health Top Overnight SRGs (>30 Seps) by SRG, 2016/17 to 2036/37 ...........................36Table 25 Paediatric Activity, Darling Downs Health Top Same Day SRGs (>30 Seps) by SRG, 2016/17 to 2036/37 ........................... 37Table 26 Paediatric Activity, Darling Downs Health by Place of Treatment and Stay Type, 2016/17 to 2036/37 ...............................38Table 27 Paediatric Activity Outflow to Metropolitan Hospitals * by Stay Type 2016/17 to 2036/37 (all SRGs) ................................39Table 28 Mental Health Patient Flow Assumptions to Darling Downs Health .................................................................................40Table 29 Adult Mental Health Bed Days, Darling Downs Health by Facility of Treatment and Primary Classification, 2021/22 to 2026/27 ....................................................................................................................................................................................... 41Table 30 Child Mental Health Bed Days and Projected Beds, Toowoomba Hospital (Yannanda) 2021/22 to 2026/27, 70% occupancy .................................................................................................................................................................................... 41Table 31 Adult Mental Health Bed Projections ............................................................................................................................... 41Table 32 Renal Dialysis Patient Flow Assumptions to Darling Downs Health .................................................................................. 43Table 33 Darling Downs Health Renal Dialysis Equivalent In-centre treatments by Facility 2021/22 to 2036/37 ............................. 43Table 34 Proportion of total Darling Downs Health renal activity by planning region population ...................................................44Table 35 Darling Downs Health Chair-Based (Assuming 40% In-Home Target) Renal Dialysis Separations / Occasions of Service Projections by Place of Residence, 2021/22 to 2036/37 ...............................................................................................................44Table 36 Darling Downs Health Chair-Based (Assuming 30% In-Home) Renal Dialysis Separations / Occasions of Service Projections by Place of Residence, 2021/22 to 2036/37 ...............................................................................................................44Table 37 Chemotherapy Patient Flow Assumptions to Darling Downs Health ................................................................................. 45Table 38 Darling Downs Health Chemotherapy Separations / Occasions of Service Projections, 2021/22 to 2036/37 ................... 45Table 39 Radiation Oncology Patient Flow Assumptions to Darling Downs Health ......................................................................... 45Table 40 TH Radiation Oncology Separations / Occasions of Service Projections, 2021/22 to 2036/37 .........................................46Table 41 Darling Downs Health Endoscopy separations / Occasions of Service Projections, 2016/17 to 2036/37 (Change and AGR based on rate between 2021-22 to 2036-37) ................................................................................................................................. 47Table 42 Darling Downs Health emergency surgical and procedural separations 2016/17 to 2036/37 including obstetrics and gynaecology .................................................................................................................................................................................48
121
Table 43 Projected Activity Toowoomba Hospital Surgical SRGs by Elective Emergency Status including Obstetrics.......................49Table 44 Projected activity Toowoomba Hospital Surgical SRGs by Elective Emergency Status including Obstetrics but excluding non-operative ESRGs. ...................................................................................................................................................................50Table 45 Historical activity Toowoomba Hospital Surgical SRGs by Elective Emergency Status including Obstetrics but excluding non-operative ESRGs. ...................................................................................................................................................................50Table 46 HHS of Treatment Interventional Cardiology for Darling Downs Health Residents ............................................................ 51Table 47 Darling Downs Health Adult Interventional Cardiology Separations / Occasions of Service Projections, 2021/22 to 2036/37 ....................................................................................................................................................................................... 51Table 48 SCN Separations Patient Flows Assumptions to Darling Downs Health 16/17 .................................................................. 52Table 49 TH SCN Separations / Occasions of Service Projections, 2016/17 to 2036/37 ................................................................. 52Table 50 Darling Downs Health Resident NICU Bed Day Projections, 2016/17 to 2036/37 ............................................................. 52Table 51 - TH Emergency Department Presentation Projections by Age Group and Triage Category, 2016/17 to 2036/37 ................ 53Table 52 Cherbourg Hospital Emergency Department Presentation Projections by Triage Category, 2016/17 to 2036/37 ............... 54Table 53 Chinchilla Hospital Emergency Department Presentation Projections by Triage Category, 2016/17 to 2036/37 ................ 54Table 54 Dalby Hospital Emergency Department Presentation Projections by Age Group and Triage Category, 2016/17 to 2036/37 ....55Table 55 Goondiwindi Hospital Emergency Department Presentations Projections by Age Group and Triage Category, 2016/17 to 2036/37 ....................................................................................................................................................................................... 55Table 56 Inglewood Hospital Emergency Department Presentation Projections by Triage Category, 2016/17 to 2036/37 ............... 55Table 57 Jandowae Hospital Emergency Department Presentation Projections by Triage Category, 2016/17 to 2036/37 ................ 56Table 58 Kingaroy Hospital Emergency Department Presentation Projections by Age Group and Triage Category, 2016/17 to 2036/37 ....................................................................................................................................................................................... 56Table 59 Miles Hospital Emergency Department Presentation Projections by Triage Category, 2016/17 to 2036/37 ....................... 56Table 60 Millmerran Hospital Emergency Department Presentation Projections by Triage Category, 2016/17 to 2036/37 .............. 57Table 61 Murgon Hospital Emergency Department Presentation Projections by Triage Category, 2016/17 to 2036/37 .................... 57Table 62 Nanango Hospital Emergency Department Presentation Projections by Triage Category, 2016/17 to 2036/37 ................. 57Table 63 Oakey Hospital Emergency Department Presentation Projections by Triage Category, 2016/17 to 2036/37...................... 57Table 64 Stanthorpe Hospital Emergency Department Presentation Projections by Triage Category, 2016/17 to 2036/37 ..............58Table 65 Tara Hospital Emergency Department Presentation Projections by Triage Category, 2016/17 to 2036/37 .........................58Table 66 Taroom Hospital Emergency Department Presentation Projections by Triage Category, 2016/17 to 2036/37....................58Table 67 Texas Hospital Emergency Department Presentation Projections by Triage Category, 2016/17 to 2036/37 .......................58Table 68 Wandoan Hospital Emergency Department Presentation Projections by Triage Category, 2016/17 to 2036/37 ................ 59Table 69 Warwick Hospital Emergency Department Presentation Projections by Age Group and Triage Category, 2016/17 to 2036/37 ....................................................................................................................................................................................... 59Table 70 Wondai Hospital Emergency Department Presentation Projections by Triage Category, 2016/17 to 2036/37 ................... 59Table 71 Projected Occasions of Service, TH by Primary Classification, 2016/17 - 2036/37 ............................................................60Figure 2 Growth in Non-admitted Activity Toowoomba Hospital ....................................................................................................60Table 72 Projected Occasions of Service Other Darling Downs Health Facilities, by Primary Classification, 2016/17 - 2036/37 ...... 61Figure 3 Growth in Non-admitted activity Other DDH Facilities....................................................................................................... 61Table 73 Non-Admitted Telehealth Occasions of Service, Darling Downs Health, by Facility, 2015/16 to 2017/18 ...........................62Table 74 Non-Admitted Telehealth Occasions of Service, Darling Downs Health, by Tier 2 Clinic Speciality, 2014/15 to 2017/18 ....63Table 75 Average number of patient attending specialist outpatients by postcode ........................................................................63Table 76 Toowoomba Hospital Base Case Projections ...................................................................................................................64Table 77 Cherbourg Hospital Base Case Projections ......................................................................................................................66Table 78 Chinchilla Hospital Base Case Projections ......................................................................................................................66Table 79 Dalby Hospital Base Case Projections ............................................................................................................................. 67Table 80 Goondiwindi Hospital Base Case Projections..................................................................................................................68Table 81 Inglewood Hospital Base Case Projections ......................................................................................................................68Table 82 Jandowae Hospital Base Case Projections ......................................................................................................................69Table 83 Kingaroy Hospital Base Case Projections ........................................................................................................................70Table 84 Miles Hospital Base Case Projections ............................................................................................................................. 71Table 85 Millmerran Hospital Base Case Projections ..................................................................................................................... 71Table 86 Murgon Hospital Base Case Projections.......................................................................................................................... 72Table 87 Nanango Hospital Base Case Projections ........................................................................................................................ 72Table 88 Oakey Hospital Base Case Projections ............................................................................................................................ 73Table 89 Stanthorpe Hospital Base Case Projections .................................................................................................................... 73
122
Table 90 Tara Hospital Base Case Projections ............................................................................................................................... 74Table 91 Taroom Hospital Base Case Projections ........................................................................................................................... 74Table 92 Texas Hospital Base Case Projections ............................................................................................................................. 75Table 93 Warwick Hospital Base Case Projections ........................................................................................................................ 75Table 94 Wondai Hospital Base Case Projections ..........................................................................................................................76Table 95 BHH Hospital (BARA-MAC) December 2018 .....................................................................................................................76Table 96 Bed numbers (BARA-MAC) as at April 2019 .....................................................................................................................76Table 97 Actual Beds Compared with Projected Bed ..................................................................................................................... 77Table 98 In-Centre Renal Dialysis Chair Projections by Facility Based on 40% Home Dialysis ........................................................78Table 99 Future requirements with six chairs capacity St Andrew’s Toowoomba Hospital and Dalby and Warwick Hospital satellite chairs assuming 40% home-based dialysis .....................................................................................................................78Table 100 Maintain 6 St Andrew’s Hospital Chairs to 2026/27 and nil by 31/32 and 2036/37 with Dalby and Warwick Chairs and 40% Home Based Dialysis .....................................................................................................................................................79Table 101 Total Darling Downs Health Renal Dialysis Chair Projections - 30% Home Based Dialysis) 2021/22 to 2036/37 ............. 79Table 102 Darling Downs Health Chemotherapy Chair Projections 2021/22 to 2036/37 ................................................................ 79Table 103 Bed days saved at TH by increasing the HITH rate from 0.4% of total admissions to 3.0% of overnight (ON) admissions excluding palliative care separations. ...........................................................................................................................................83Table 104 Bed days saved TH increasing the rate of palliative care HITH to 10.0% .........................................................................84Table 105 Bed days saved at TH by increasing the AGES program from five to seven days per week ...............................................84Table 106 Additional beds required at TH if ALOS reduction in AIM is not achieved or only partly achieved ...................................85Table 107 TH Changes to ALOS Built Into AIM Model (ieMR impact on ALOS not included) .............................................................86Table 108 Rural Hospitals Changes to ALOS Built Into AIM Model ..................................................................................................86Table 109 Reduction in beds based on reducing readmission rate at TH .......................................................................................86Table 110 TH: analysis of changes to bed numbers based on changes to AIM ALOS or readmission rates by 2036/37 ...................87Table 111 Rural: analysis of changes to bed numbers based on changes to AIM ALOS or readmission rates by 2036/37 ................87Table 112 Darling Downs Health - Length of Stay excluding mental health, chemotherapy, endoscopy, renal dialysis and unqualified neonates ...................................................................................................................................................................88Figure 4 Darling Downs Health - Length of Stay excluding mental health, chemotherapy, endoscopy, renal dialysis and unqualified neonates ......................................................................................................................................................................................88Table 113 Historical activity growth in Darling Downs Health Separations ......................................................................................89Table 114 Historical activity growth in Darling Downs Health Separations excluding SRGS Diagnostic Endoscopy and Chemotherapy ..............................................................................................................................................................................89Table 115 Historical activity growth in Darling Downs Health Bed Days excluding SRGS Diagnostic Endoscopy and Chemotherapy ....90Table 116 Darling Downs Health Comparison of bed days: static ALOS vs reducing ALOS (AIM) .....................................................90Table 117 Top 10 SRG’s with Lowest Relative Utilisation ............................................................................................................... 91Table 118 Top 10 SRG’s with Highest Relative Utilisation ...............................................................................................................92Table 119 Removing “Other Non-Acute” Patients - Potential Impact on TH .....................................................................................93Table 120 South Burnett resident separations for birthing (vaginal and caesareans) at private facilities. ......................................96Table 121 Increasing the self-sufficiency of rural facilities in endoscopy ........................................................................................97Table 122 In Flows from Other HHS for Endoscopy procedures to Toowoomba Hospital .................................................................98Table 123 Projected endoscopy procedures at Kingaroy Hospital assuming 10 percent change reverse flow of patients treated privately .......................................................................................................................................................................................98Table 124 Projected endoscopy procedures at Warwick Hospital assuming 10 percent change reverse flow of patients treated privately and using activity projections based on 2018 DoH file ....................................................................................................98Table 125 Proposed increase in self-sufficiency subacute bed days by Darling Downs Health planning region ..............................99Table 126 Change in Bed Days due ton increase in self-sufficiency by a factor of 10 percent ......................................................... 100Table 127 Review of excessive bed days Jandowae Hospital ......................................................................................................... 100Table 128 Self-sufficiency medical services Darling Downs Health by planning region ................................................................. 101Table 129 Change in Bed Days due to increase in self-sufficiency by a factor of up to 10 percent .................................................. 101Table 130 Projected same day separations Toowoomba Hospital and required day surgery theatres ............................................ 104Table 131 Projected Adult Public Darling Downs Health Resident Separations and Overnight Beds by Specialty Grouping by Place of Treatment (Metropolitan.) Excludes Cardiac surgery, Transplantation, Neurosurgery, Mental Health and Unallocated SRGs separations at metropolitan hospitals ......................................................................................................................................... 105Table 132 Interventional cardiology bed days and beds excluding paediatric .............................................................................. 105Table 133 Projected Private Hospital Separations by Specialty Grouping, Darling Downs Health Residents, 2016/17 to 2036/37 .. 108
123
Table 134 Projected Private Hospital Overnight Beds, Darling Downs Health Residents, 2016/17 to 2036/37 ............................... 109Table 135 Historical Public Private Market Share, Darling Downs Health Residents, 2010/11 to 2016/17 ........................................111Table 136 Separations by Public Private Market Share, Darling Downs Health Residents, 2016/17 to 2036/37 ..............................111Table 137 Increase in Public Market Share Separations Darling Downs Health Residents, 2026/27 to 2036/37 ............................ 112Table 138 Projected Chargeable Separations Darling Downs Health 2016/17 to 2036/37 ............................................................. 112Table 139 Projected Public Chargeable Separations, Darling Downs Health, by SRG 2016/17 to 2036/37 ......................................113Table 140 Projected chargeable separations by emergency Status 2016/17-2036/37 ................................................................... 114Table 141 Low Volume Specialty Areas 2016/17: DD public and private separations ......................................................................115Table 142 TH Treatment Space Projections Summary, 2016/17 to 2036/37 With Adult Interventional Cardiology ...........................117Table 143 Summary of Changing Models of Care Impact on Bed Numbers, 2026/27 and 2036/37 TH ........................................... 119Table 144 Summary of Changing Role of Rural Services Impact on Bed Numbers and Endoscopy Procedures, 2026/27 to 2036/37 ..120Table 145 Changes to Public DDH Bed Numbers 2026/27 to 2036/37 if 5% change of projected private demand alternatively seeks public sector treatment ...................................................................................................................................................... 120Table 146 Projected Occasions of Service, TH and Other DDH Facilities, by Tier 2 Class, 2016/17 - 2036/37 .................................. 125Table 146 Projected Occasions of Service, TH and Other DDH Facilities, by Tier 2 Class, 2016/17 - 2036/37 .................................. 126
ReferencesQueensland Health 2006 Evaluation of the Report of the Statewide Neonatal Intensive Care Services Project (2006) Summary Report to the Minister. https://www.health.qld.gov.au/__data/assets/pdf_file/0028/432469/nicu_report.pdf
Access Economics PTY LTD for Alzheimer’s Australia 2010. Caring places: planning for aged care and dementia 2010-2050, Volume 1 2010.
https://www.dementia.org.au/sites/default/files/20100700_Nat_AE_Vol1CarePlaces2010-2050.pdf
Fan, L., Lukin, B., Sun, J., Dingle, K., Purtill, R., Rapp, S., Hou, X., 2018 Cost analysis of improving emergency care for aged care residents under a Hospital in the Nursing Home program in Australia, PLOS One 13 (7)
https://journals.plos.org/plosone/article?id=10.1371/journal.pone.0199879
AMA, A plan for better health care for regional, rural, and remote Australia 2014
https://ama.com.au/system/tdf/documents/AMA%20Plan%20for%20better%20health%20care%20for%20regional%20rural%20and%20remote%20Australia.pdf?file=1&type=node&id=43997
124
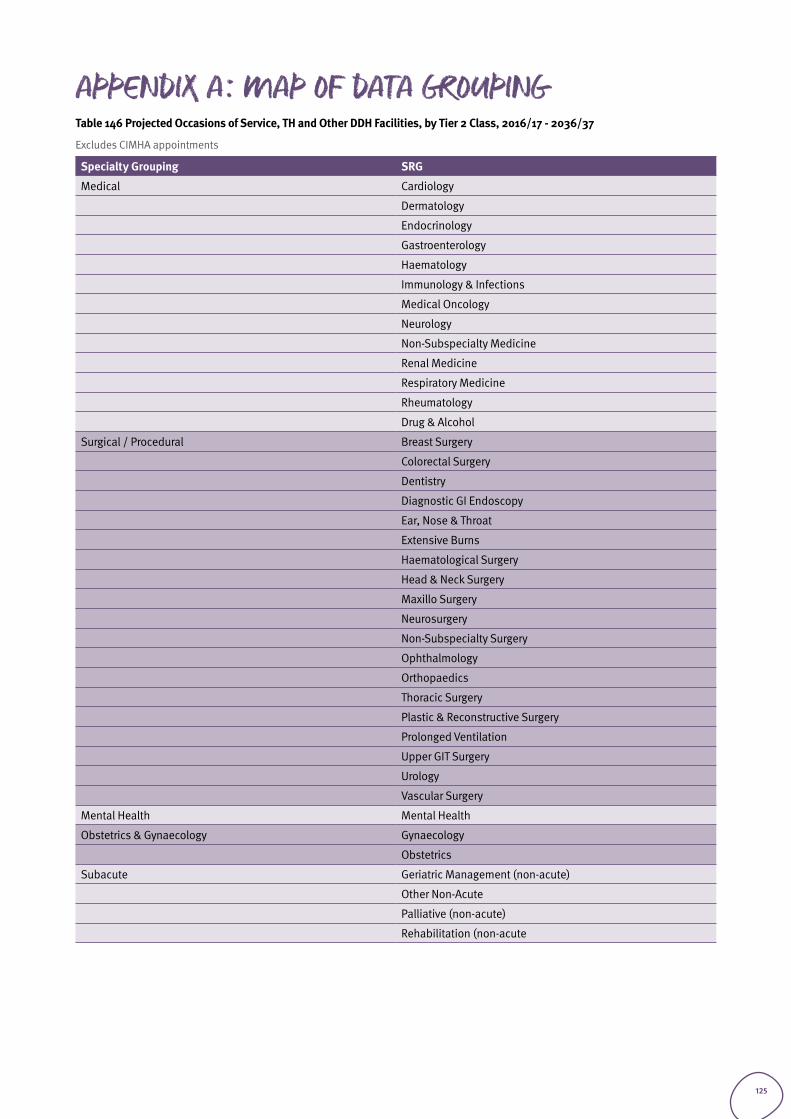
APPENDIX A: Map of data groupingTable 146 Projected Occasions of Service, TH and Other DDH Facilities, by Tier 2 Class, 2016/17 - 2036/37
Excludes CIMHA appointments
Specialty Grouping SRG
Medical Cardiology
Dermatology
Endocrinology
Gastroenterology
Haematology
Immunology & Infections
Medical Oncology
Neurology
Non-Subspecialty Medicine
Renal Medicine
Respiratory Medicine
Rheumatology
Drug & Alcohol
Surgical / Procedural Breast Surgery
Colorectal Surgery
Dentistry
Diagnostic GI Endoscopy
Ear, Nose & Throat
Extensive Burns
Haematological Surgery
Head & Neck Surgery
Maxillo Surgery
Neurosurgery
Non-Subspecialty Surgery
Ophthalmology
Orthopaedics
Thoracic Surgery
Plastic & Reconstructive Surgery
Prolonged Ventilation
Upper GIT Surgery
Urology
Vascular Surgery
Mental Health Mental Health
Obstetrics & Gynaecology Gynaecology
Obstetrics
Subacute Geriatric Management (non-acute)
Other Non-Acute
Palliative (non-acute)
Rehabilitation (non-acute
125
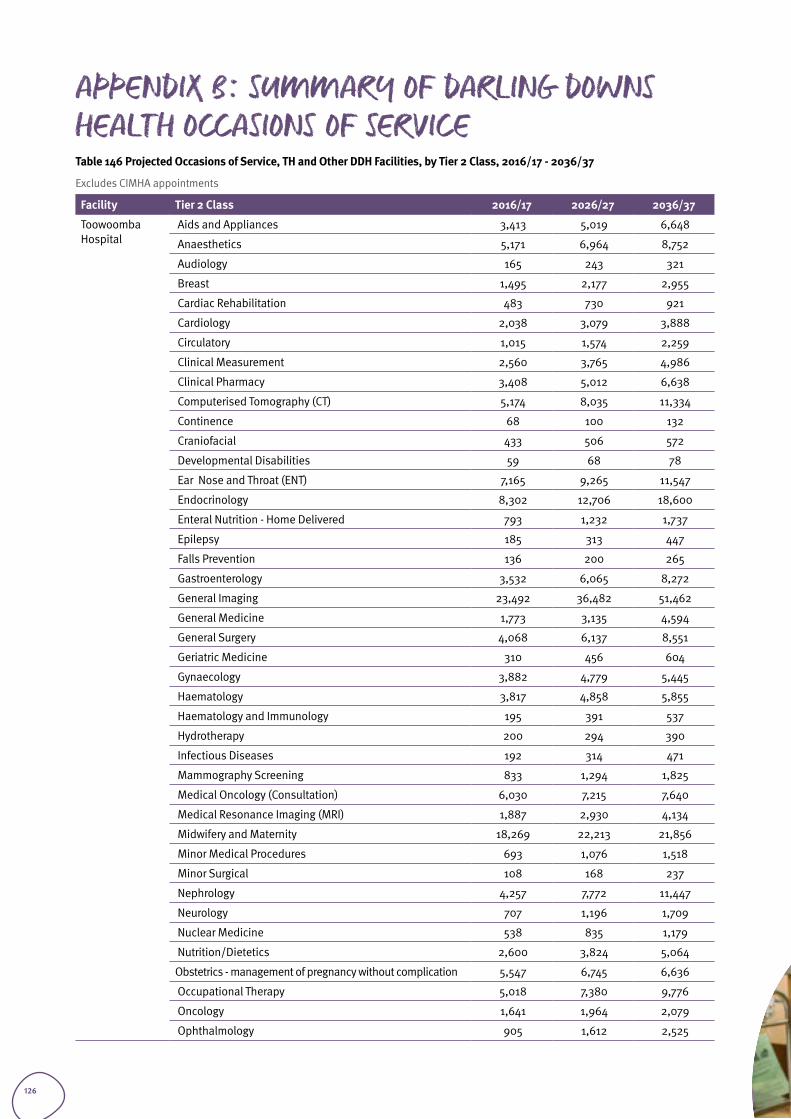
APPENDIX B: Summary of darling downs health Occasions of ServiceTable 146 Projected Occasions of Service, TH and Other DDH Facilities, by Tier 2 Class, 2016/17 - 2036/37
Excludes CIMHA appointments
Facility Tier 2 Class 2016/17 2026/27 2036/37
Toowoomba Hospital
Aids and Appliances 3,413 5,019 6,648
Anaesthetics 5,171 6,964 8,752
Audiology 165 243 321
Breast 1,495 2,177 2,955
Cardiac Rehabilitation 483 730 921
Cardiology 2,038 3,079 3,888
Circulatory 1,015 1,574 2,259
Clinical Measurement 2,560 3,765 4,986
Clinical Pharmacy 3,408 5,012 6,638
Computerised Tomography (CT) 5,174 8,035 11,334
Continence 68 100 132
Craniofacial 433 506 572
Developmental Disabilities 59 68 78
Ear Nose and Throat (ENT) 7,165 9,265 11,547
Endocrinology 8,302 12,706 18,600
Enteral Nutrition - Home Delivered 793 1,232 1,737
Epilepsy 185 313 447
Falls Prevention 136 200 265
Gastroenterology 3,532 6,065 8,272
General Imaging 23,492 36,482 51,462
General Medicine 1,773 3,135 4,594
General Surgery 4,068 6,137 8,551
Geriatric Medicine 310 456 604
Gynaecology 3,882 4,779 5,445
Haematology 3,817 4,858 5,855
Haematology and Immunology 195 391 537
Hydrotherapy 200 294 390
Infectious Diseases 192 314 471
Mammography Screening 833 1,294 1,825
Medical Oncology (Consultation) 6,030 7,215 7,640
Medical Resonance Imaging (MRI) 1,887 2,930 4,134
Midwifery and Maternity 18,269 22,213 21,856
Minor Medical Procedures 693 1,076 1,518
Minor Surgical 108 168 237
Nephrology 4,257 7,772 11,447
Neurology 707 1,196 1,709
Nuclear Medicine 538 835 1,179
Nutrition/Dietetics 2,600 3,824 5,064
Obstetrics - management of pregnancy without complication 5,547 6,745 6,636
Occupational Therapy 5,018 7,380 9,776
Oncology 1,641 1,964 2,079
Ophthalmology 905 1,612 2,525
126
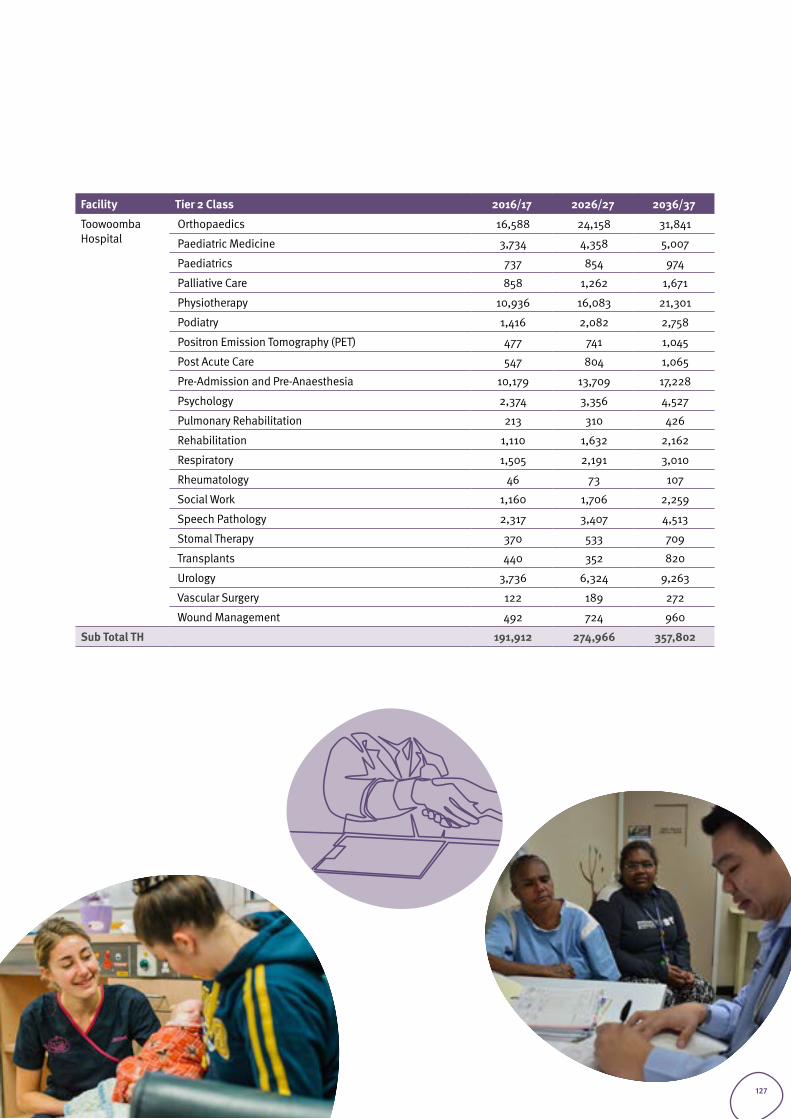
Facility Tier 2 Class 2016/17 2026/27 2036/37
Toowoomba Hospital
Orthopaedics 16,588 24,158 31,841
Paediatric Medicine 3,734 4,358 5,007
Paediatrics 737 854 974
Palliative Care 858 1,262 1,671
Physiotherapy 10,936 16,083 21,301
Podiatry 1,416 2,082 2,758
Positron Emission Tomography (PET) 477 741 1,045
Post Acute Care 547 804 1,065
Pre-Admission and Pre-Anaesthesia 10,179 13,709 17,228
Psychology 2,374 3,356 4,527
Pulmonary Rehabilitation 213 310 426
Rehabilitation 1,110 1,632 2,162
Respiratory 1,505 2,191 3,010
Rheumatology 46 73 107
Social Work 1,160 1,706 2,259
Speech Pathology 2,317 3,407 4,513
Stomal Therapy 370 533 709
Transplants 440 352 820
Urology 3,736 6,324 9,263
Vascular Surgery 122 189 272
Wound Management 492 724 960
Sub Total TH 191,912 274,966 357,802
127
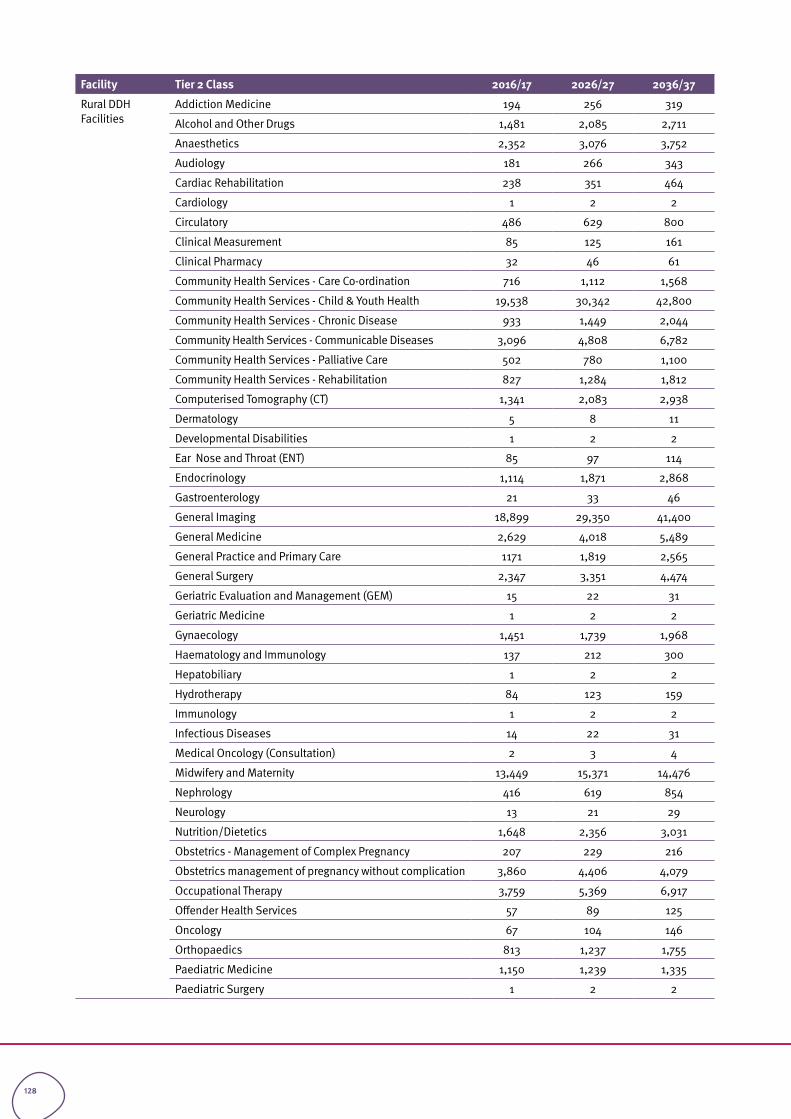
Facility Tier 2 Class 2016/17 2026/27 2036/37
Rural DDH Facilities
Addiction Medicine 194 256 319
Alcohol and Other Drugs 1,481 2,085 2,711
Anaesthetics 2,352 3,076 3,752
Audiology 181 266 343
Cardiac Rehabilitation 238 351 464
Cardiology 1 2 2
Circulatory 486 629 800
Clinical Measurement 85 125 161
Clinical Pharmacy 32 46 61
Community Health Services - Care Co-ordination 716 1,112 1,568
Community Health Services - Child & Youth Health 19,538 30,342 42,800
Community Health Services - Chronic Disease 933 1,449 2,044
Community Health Services - Communicable Diseases 3,096 4,808 6,782
Community Health Services - Palliative Care 502 780 1,100
Community Health Services - Rehabilitation 827 1,284 1,812
Computerised Tomography (CT) 1,341 2,083 2,938
Dermatology 5 8 11
Developmental Disabilities 1 2 2
Ear Nose and Throat (ENT) 85 97 114
Endocrinology 1,114 1,871 2,868
Gastroenterology 21 33 46
General Imaging 18,899 29,350 41,400
General Medicine 2,629 4,018 5,489
General Practice and Primary Care 1171 1,819 2,565
General Surgery 2,347 3,351 4,474
Geriatric Evaluation and Management (GEM) 15 22 31
Geriatric Medicine 1 2 2
Gynaecology 1,451 1,739 1,968
Haematology and Immunology 137 212 300
Hepatobiliary 1 2 2
Hydrotherapy 84 123 159
Immunology 1 2 2
Infectious Diseases 14 22 31
Medical Oncology (Consultation) 2 3 4
Midwifery and Maternity 13,449 15,371 14,476
Nephrology 416 619 854
Neurology 13 21 29
Nutrition/Dietetics 1,648 2,356 3,031
Obstetrics - Management of Complex Pregnancy 207 229 216
Obstetrics management of pregnancy without complication 3,860 4,406 4,079
Occupational Therapy 3,759 5,369 6,917
Offender Health Services 57 89 125
Oncology 67 104 146
Orthopaedics 813 1,237 1,755
Paediatric Medicine 1,150 1,239 1,335
Paediatric Surgery 1 2 2
128
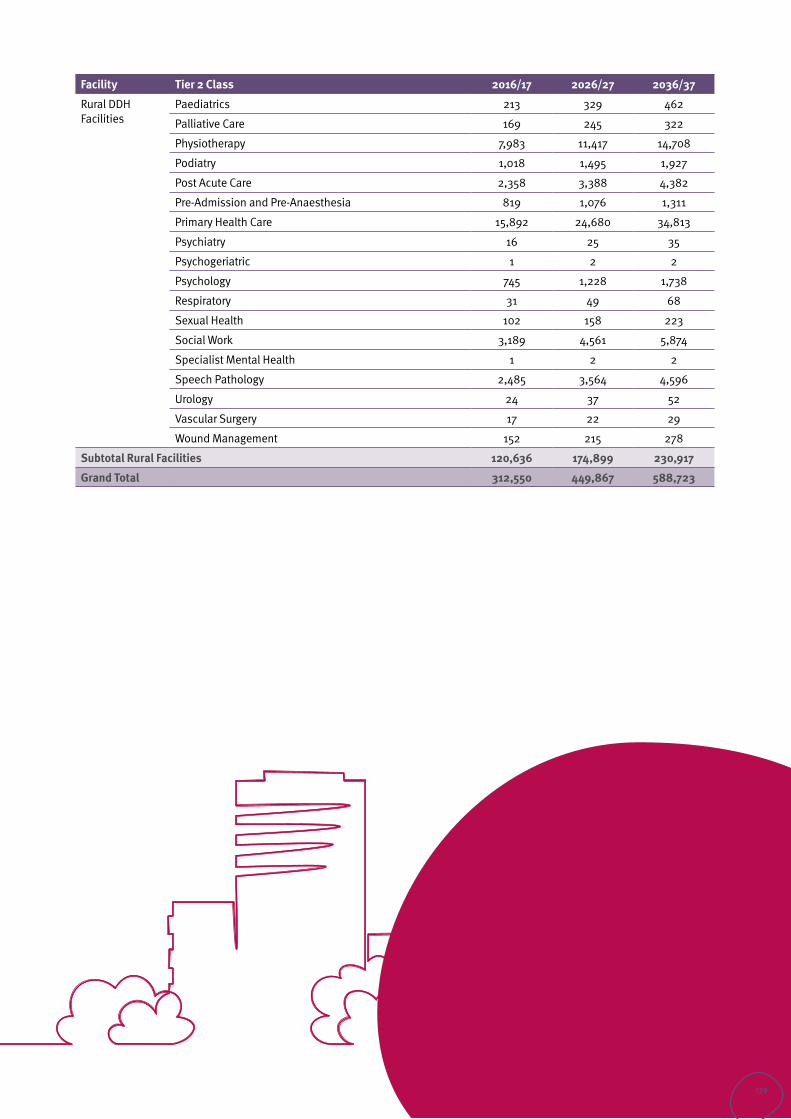
Facility Tier 2 Class 2016/17 2026/27 2036/37
Rural DDH Facilities
Paediatrics 213 329 462
Palliative Care 169 245 322
Physiotherapy 7,983 11,417 14,708
Podiatry 1,018 1,495 1,927
Post Acute Care 2,358 3,388 4,382
Pre-Admission and Pre-Anaesthesia 819 1,076 1,311
Primary Health Care 15,892 24,680 34,813
Psychiatry 16 25 35
Psychogeriatric 1 2 2
Psychology 745 1,228 1,738
Respiratory 31 49 68
Sexual Health 102 158 223
Social Work 3,189 4,561 5,874
Specialist Mental Health 1 2 2
Speech Pathology 2,485 3,564 4,596
Urology 24 37 52
Vascular Surgery 17 22 29
Wound Management 152 215 278
Subtotal Rural Facilities 120,636 174,899 230,917
Grand Total 312,550 449,867 588,723
129
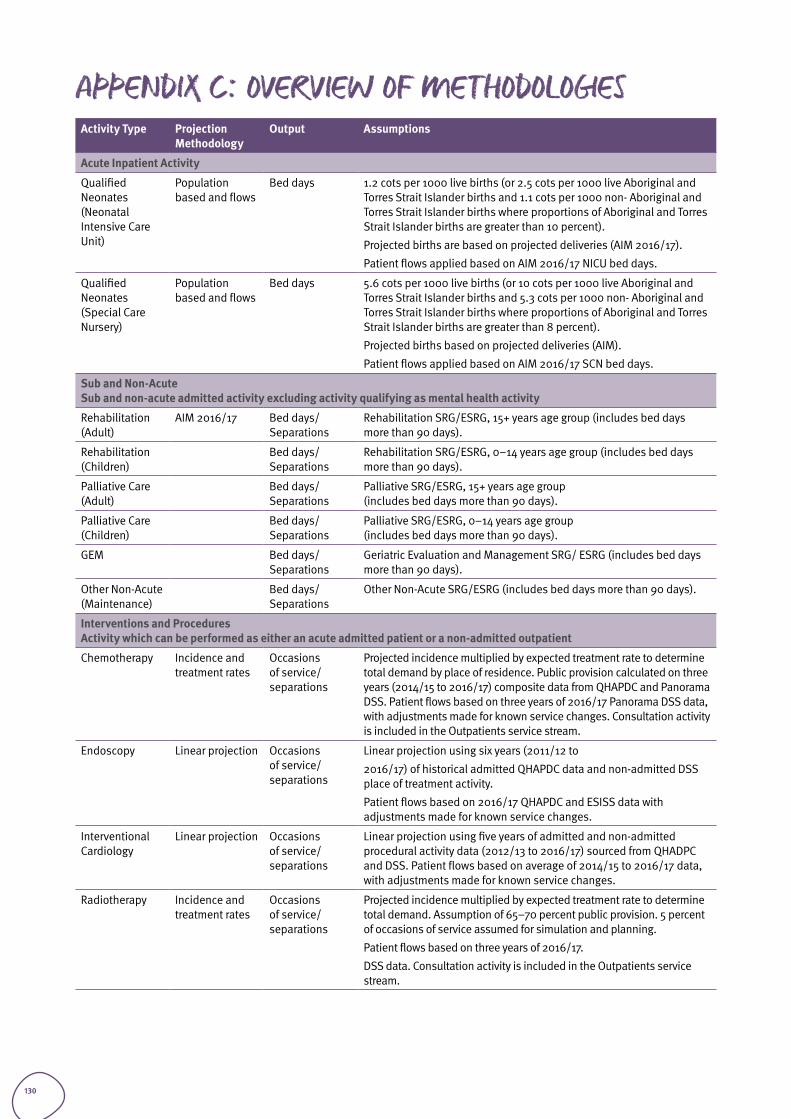
APPENDIX C: Overview of MethodologiesActivity Type Projection
Methodology Output Assumptions
Acute Inpatient Activity
Qualified Neonates (Neonatal Intensive Care Unit)
Population based and flows
Bed days 1.2 cots per 1000 live births (or 2.5 cots per 1000 live Aboriginal and Torres Strait Islander births and 1.1 cots per 1000 non- Aboriginal and Torres Strait Islander births where proportions of Aboriginal and Torres Strait Islander births are greater than 10 percent).
Projected births are based on projected deliveries (AIM 2016/17).
Patient flows applied based on AIM 2016/17 NICU bed days.
Qualified Neonates (Special Care Nursery)
Population based and flows
Bed days 5.6 cots per 1000 live births (or 10 cots per 1000 live Aboriginal and Torres Strait Islander births and 5.3 cots per 1000 non- Aboriginal and Torres Strait Islander births where proportions of Aboriginal and Torres Strait Islander births are greater than 8 percent).
Projected births based on projected deliveries (AIM).
Patient flows applied based on AIM 2016/17 SCN bed days.
Sub and Non-AcuteSub and non-acute admitted activity excluding activity qualifying as mental health activity
Rehabilitation (Adult)
AIM 2016/17 Bed days/ Separations
Rehabilitation SRG/ESRG, 15+ years age group (includes bed days more than 90 days).
Rehabilitation (Children)
Bed days/ Separations
Rehabilitation SRG/ESRG, 0–14 years age group (includes bed days more than 90 days).
Palliative Care (Adult)
Bed days/ Separations
Palliative SRG/ESRG, 15+ years age group (includes bed days more than 90 days).
Palliative Care (Children)
Bed days/ Separations
Palliative SRG/ESRG, 0–14 years age group (includes bed days more than 90 days).
GEM Bed days/ Separations
Geriatric Evaluation and Management SRG/ ESRG (includes bed days more than 90 days).
Other Non-Acute (Maintenance)
Bed days/ Separations
Other Non-Acute SRG/ESRG (includes bed days more than 90 days).
Interventions and Procedures Activity which can be performed as either an acute admitted patient or a non-admitted outpatient
Chemotherapy Incidence and treatment rates
Occasions of service/ separations
Projected incidence multiplied by expected treatment rate to determine total demand by place of residence. Public provision calculated on three years (2014/15 to 2016/17) composite data from QHAPDC and Panorama DSS. Patient flows based on three years of 2016/17 Panorama DSS data, with adjustments made for known service changes. Consultation activity is included in the Outpatients service stream.
Endoscopy Linear projection Occasions of service/ separations
Linear projection using six years (2011/12 to
2016/17) of historical admitted QHAPDC data and non-admitted DSS place of treatment activity.
Patient flows based on 2016/17 QHAPDC and ESISS data with adjustments made for known service changes.
Interventional Cardiology
Linear projection Occasions of service/ separations
Linear projection using five years of admitted and non-admitted procedural activity data (2012/13 to 2016/17) sourced from QHADPC and DSS. Patient flows based on average of 2014/15 to 2016/17 data, with adjustments made for known service changes.
Radiotherapy Incidence and treatment rates
Occasions of service/ separations
Projected incidence multiplied by expected treatment rate to determine total demand. Assumption of 65–70 percent public provision. 5 percent of occasions of service assumed for simulation and planning.
Patient flows based on three years of 2016/17.
DSS data. Consultation activity is included in the Outpatients service stream.
130
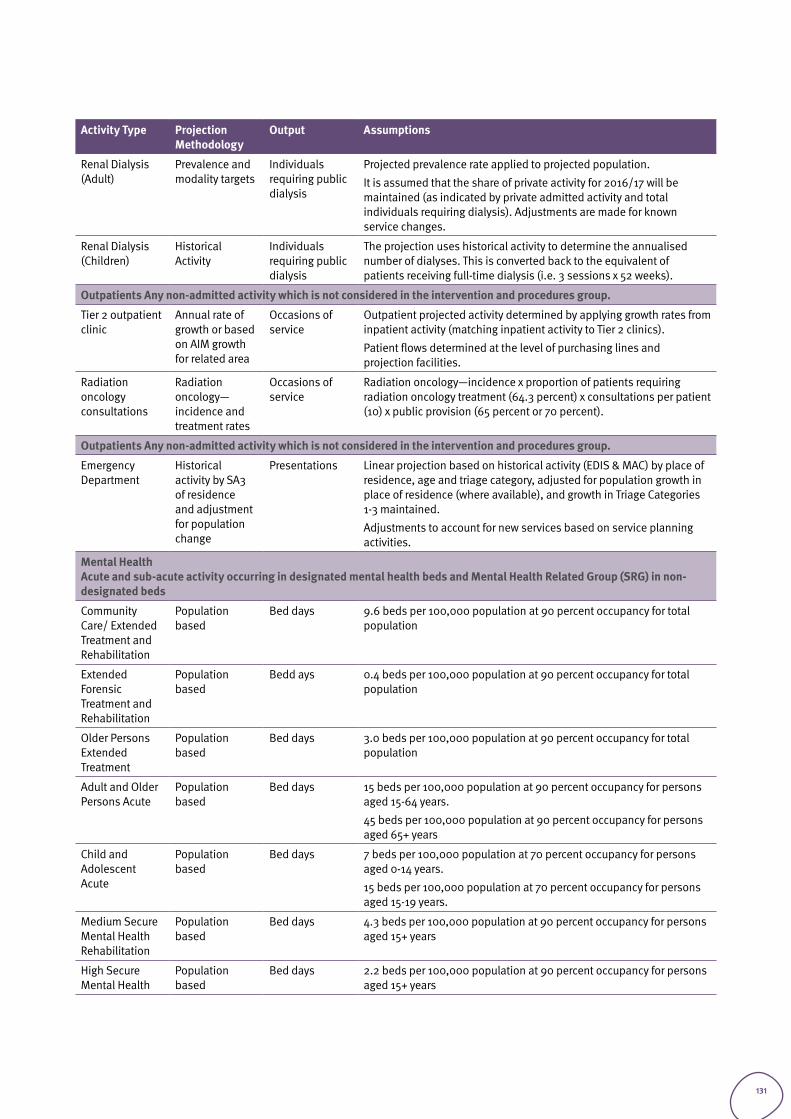
Activity Type Projection Methodology
Output Assumptions
Renal Dialysis (Adult)
Prevalence and modality targets
Individuals requiring public dialysis
Projected prevalence rate applied to projected population.
It is assumed that the share of private activity for 2016/17 will be maintained (as indicated by private admitted activity and total individuals requiring dialysis). Adjustments are made for known service changes.
Renal Dialysis (Children)
Historical Activity
Individuals requiring public dialysis
The projection uses historical activity to determine the annualised number of dialyses. This is converted back to the equivalent of patients receiving full-time dialysis (i.e. 3 sessions x 52 weeks).
Outpatients Any non-admitted activity which is not considered in the intervention and procedures group.
Tier 2 outpatient clinic
Annual rate of growth or based on AIM growth for related area
Occasions of service
Outpatient projected activity determined by applying growth rates from inpatient activity (matching inpatient activity to Tier 2 clinics).
Patient flows determined at the level of purchasing lines and projection facilities.
Radiation oncology consultations
Radiation oncology— incidence and treatment rates
Occasions of service
Radiation oncology—incidence x proportion of patients requiring radiation oncology treatment (64.3 percent) x consultations per patient (10) x public provision (65 percent or 70 percent).
Outpatients Any non-admitted activity which is not considered in the intervention and procedures group.
Emergency Department
Historical activity by SA3 of residence and adjustment for population change
Presentations Linear projection based on historical activity (EDIS & MAC) by place of residence, age and triage category, adjusted for population growth in place of residence (where available), and growth in Triage Categories 1-3 maintained.
Adjustments to account for new services based on service planning activities.
Mental HealthAcute and sub-acute activity occurring in designated mental health beds and Mental Health Related Group (SRG) in non-designated beds
Community Care/ Extended Treatment and Rehabilitation
Population based
Bed days 9.6 beds per 100,000 population at 90 percent occupancy for total population
Extended Forensic Treatment and Rehabilitation
Population based
Bedd ays 0.4 beds per 100,000 population at 90 percent occupancy for total population
Older Persons Extended Treatment
Population based
Bed days 3.0 beds per 100,000 population at 90 percent occupancy for total population
Adult and Older Persons Acute
Population based
Bed days 15 beds per 100,000 population at 90 percent occupancy for persons aged 15-64 years.
45 beds per 100,000 population at 90 percent occupancy for persons aged 65+ years
Child and Adolescent Acute
Population based
Bed days 7 beds per 100,000 population at 70 percent occupancy for persons aged 0-14 years.
15 beds per 100,000 population at 70 percent occupancy for persons aged 15-19 years.
Medium Secure Mental Health Rehabilitation
Population based
Bed days 4.3 beds per 100,000 population at 90 percent occupancy for persons aged 15+ years
High Secure Mental Health
Population based
Bed days 2.2 beds per 100,000 population at 90 percent occupancy for persons aged 15+ years
131
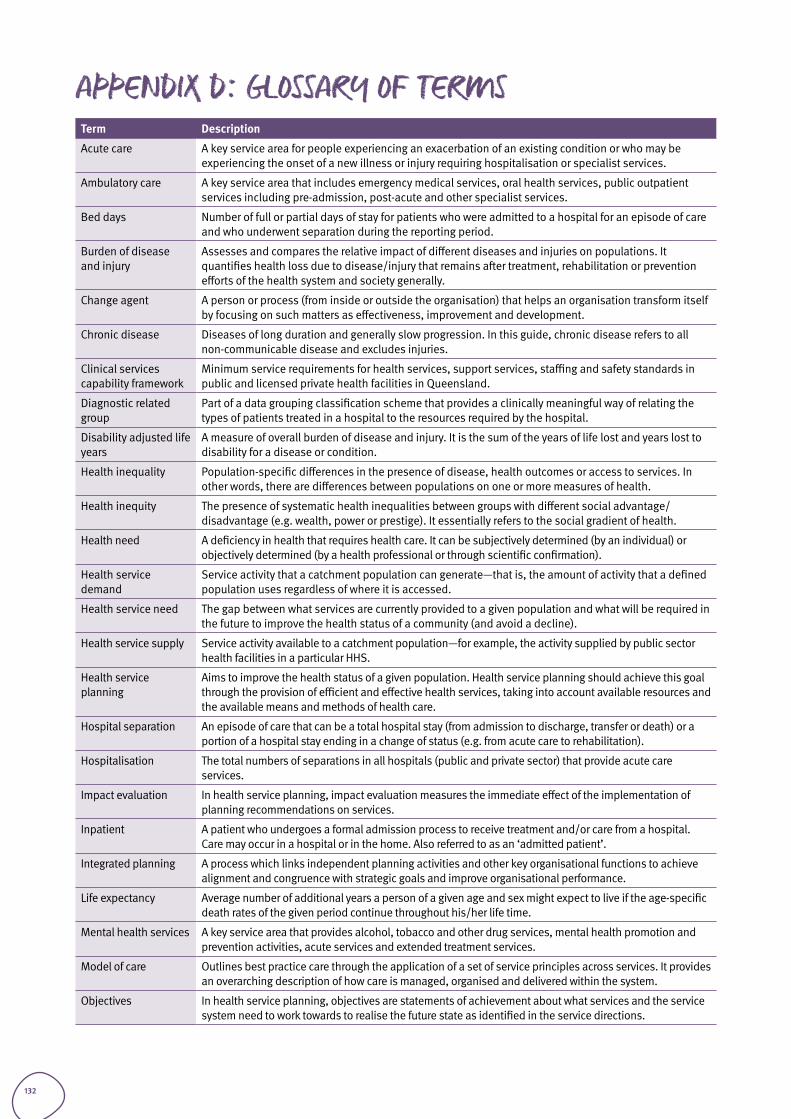
APPENDIX D: Glossary of TermsTerm Description
Acute care A key service area for people experiencing an exacerbation of an existing condition or who may be experiencing the onset of a new illness or injury requiring hospitalisation or specialist services.
Ambulatory care A key service area that includes emergency medical services, oral health services, public outpatient services including pre-admission, post-acute and other specialist services.
Bed days Number of full or partial days of stay for patients who were admitted to a hospital for an episode of care and who underwent separation during the reporting period.
Burden of disease and injury
Assesses and compares the relative impact of different diseases and injuries on populations. It quantifies health loss due to disease/injury that remains after treatment, rehabilitation or prevention efforts of the health system and society generally.
Change agent A person or process (from inside or outside the organisation) that helps an organisation transform itself by focusing on such matters as effectiveness, improvement and development.
Chronic disease Diseases of long duration and generally slow progression. In this guide, chronic disease refers to all non-communicable disease and excludes injuries.
Clinical services capability framework
Minimum service requirements for health services, support services, staffing and safety standards in public and licensed private health facilities in Queensland.
Diagnostic related group
Part of a data grouping classification scheme that provides a clinically meaningful way of relating the types of patients treated in a hospital to the resources required by the hospital.
Disability adjusted life years
A measure of overall burden of disease and injury. It is the sum of the years of life lost and years lost to disability for a disease or condition.
Health inequality Population-specific differences in the presence of disease, health outcomes or access to services. In other words, there are differences between populations on one or more measures of health.
Health inequity The presence of systematic health inequalities between groups with different social advantage/disadvantage (e.g. wealth, power or prestige). It essentially refers to the social gradient of health.
Health need A deficiency in health that requires health care. It can be subjectively determined (by an individual) or objectively determined (by a health professional or through scientific confirmation).
Health service demand
Service activity that a catchment population can generate—that is, the amount of activity that a defined population uses regardless of where it is accessed.
Health service need The gap between what services are currently provided to a given population and what will be required in the future to improve the health status of a community (and avoid a decline).
Health service supply Service activity available to a catchment population—for example, the activity supplied by public sector health facilities in a particular HHS.
Health service planning
Aims to improve the health status of a given population. Health service planning should achieve this goal through the provision of efficient and effective health services, taking into account available resources and the available means and methods of health care.
Hospital separation An episode of care that can be a total hospital stay (from admission to discharge, transfer or death) or a portion of a hospital stay ending in a change of status (e.g. from acute care to rehabilitation).
Hospitalisation The total numbers of separations in all hospitals (public and private sector) that provide acute care services.
Impact evaluation In health service planning, impact evaluation measures the immediate effect of the implementation of planning recommendations on services.
Inpatient A patient who undergoes a formal admission process to receive treatment and/or care from a hospital. Care may occur in a hospital or in the home. Also referred to as an ‘admitted patient’.
Integrated planning A process which links independent planning activities and other key organisational functions to achieve alignment and congruence with strategic goals and improve organisational performance.
Life expectancy Average number of additional years a person of a given age and sex might expect to live if the age-specific death rates of the given period continue throughout his/her life time.
Mental health services A key service area that provides alcohol, tobacco and other drug services, mental health promotion and prevention activities, acute services and extended treatment services.
Model of care Outlines best practice care through the application of a set of service principles across services. It provides an overarching description of how care is managed, organised and delivered within the system.
Objectives In health service planning, objectives are statements of achievement about what services and the service system need to work towards to realise the future state as identified in the service directions.
132
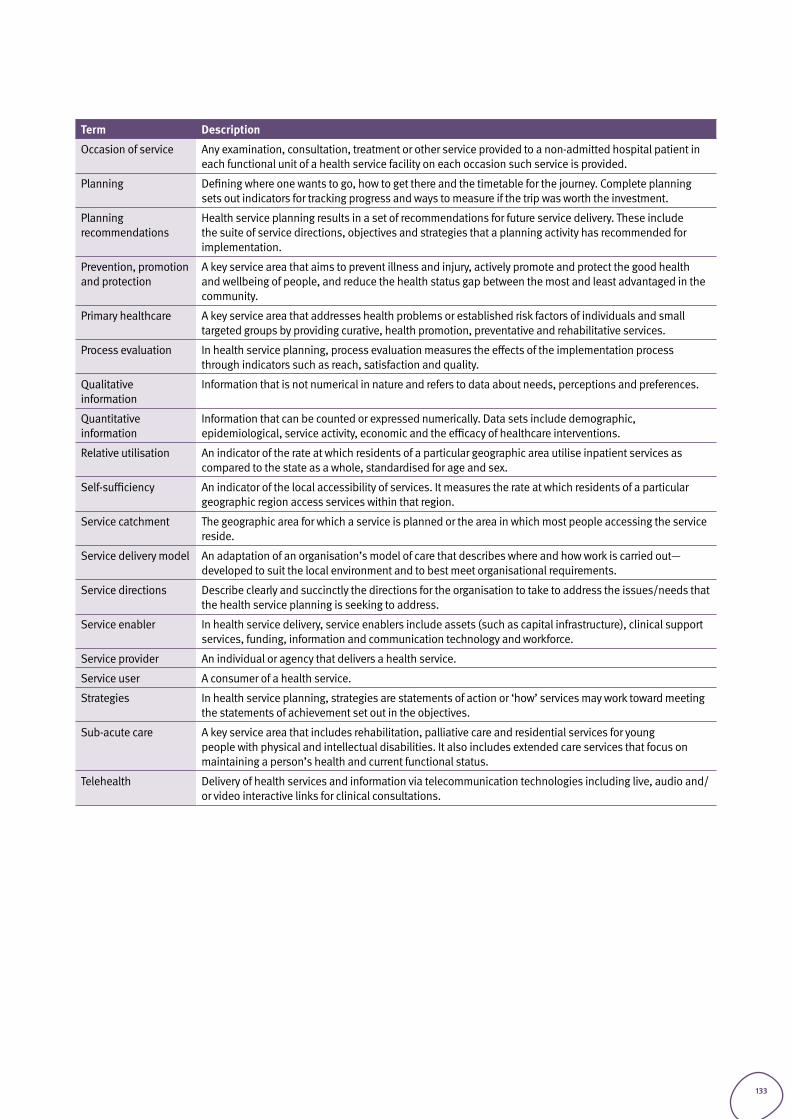
Term Description
Occasion of service Any examination, consultation, treatment or other service provided to a non-admitted hospital patient in each functional unit of a health service facility on each occasion such service is provided.
Planning Defining where one wants to go, how to get there and the timetable for the journey. Complete planning sets out indicators for tracking progress and ways to measure if the trip was worth the investment.
Planning recommendations
Health service planning results in a set of recommendations for future service delivery. These include the suite of service directions, objectives and strategies that a planning activity has recommended for implementation.
Prevention, promotion and protection
A key service area that aims to prevent illness and injury, actively promote and protect the good health and wellbeing of people, and reduce the health status gap between the most and least advantaged in the community.
Primary healthcare A key service area that addresses health problems or established risk factors of individuals and small targeted groups by providing curative, health promotion, preventative and rehabilitative services.
Process evaluation In health service planning, process evaluation measures the effects of the implementation process through indicators such as reach, satisfaction and quality.
Qualitative information
Information that is not numerical in nature and refers to data about needs, perceptions and preferences.
Quantitative information
Information that can be counted or expressed numerically. Data sets include demographic, epidemiological, service activity, economic and the efficacy of healthcare interventions.
Relative utilisation An indicator of the rate at which residents of a particular geographic area utilise inpatient services as compared to the state as a whole, standardised for age and sex.
Self-sufficiency An indicator of the local accessibility of services. It measures the rate at which residents of a particular geographic region access services within that region.
Service catchment The geographic area for which a service is planned or the area in which most people accessing the service reside.
Service delivery model An adaptation of an organisation’s model of care that describes where and how work is carried out—developed to suit the local environment and to best meet organisational requirements.
Service directions Describe clearly and succinctly the directions for the organisation to take to address the issues/needs that the health service planning is seeking to address.
Service enabler In health service delivery, service enablers include assets (such as capital infrastructure), clinical support services, funding, information and communication technology and workforce.
Service provider An individual or agency that delivers a health service.
Service user A consumer of a health service.
Strategies In health service planning, strategies are statements of action or ‘how’ services may work toward meeting the statements of achievement set out in the objectives.
Sub-acute care A key service area that includes rehabilitation, palliative care and residential services for young people with physical and intellectual disabilities. It also includes extended care services that focus on maintaining a person’s health and current functional status.
Telehealth Delivery of health services and information via telecommunication technologies including live, audio and/or video interactive links for clinical consultations.
133

#healthiertogether