Embed Size (px)
Citation preview
P a g e | 0
May 2020
BALRANALD
SHIRE
COUNCIL
2020-2021 TO 2029-2030
LONG TERM FINANCIAL PLAN
P a g e | 1
Long Term Financial Plan 2020 - 2030
Table of Contents Introduction ............................................................................................................................................ 2
What is a Long Term Financial Plan ....................................................................................................... 3
Forecasting Future Budgets ................................................................................................................... 4
Revenue Forecasts .............................................................................................................................. 4
Expenditure Forecasts ......................................................................................................................... 5
Financial Modelling ............................................................................................................................. 5
Long Term Financial Plan Assumptions ................................................................................................. 6
Market Driven Planning Assumptions ................................................................................................. 6
Revenue and Expenditure Assumptions ............................................................................................. 7
Long Term Financial Plan 2020-2030 ................................................................................................... 11
Performance Monitoring ..................................................................................................................... 12
Attachments ......................................................................................................................................... 13
Proposed Budget 2020/21 to 2029/30 – All Council ........................................................................ 14
2020/21 Budget by Function for Consolidated Council ................................................................... 17
Ratio Analysis – All Council ............................................................................................................... 18
Capital Works Program for 2020/21 ................................................................................................. 19
P a g e | 2
Introduction
The Long Term Financial Plan, hereafter referred to as LTFP, outlines how Council will deliver
on its obligations now and into the future. This plan factors in resourcing requirments,
including (but not limited to) asset utilisation, workforce needs and funding sources.
The LTFP is one document that makes up Council’s Resourcing Strategy, which provides the
link between Council’s Community Strategic Plan and Council’s Delivery Program and
Operational Plan. These plans come together to provide the community with a strategy that
focuses on how Council can deliver services that are sustainable into the future, as well as
best meet community expectations given the level of resources available to Council.
The Resourcing Strategy and the associated documents are prepared in accordance with the
requirements of the Integrated Planning and Reporting (IPR) framework, under the Local
Government Amendment (Planning & Reporting) Act 2009.
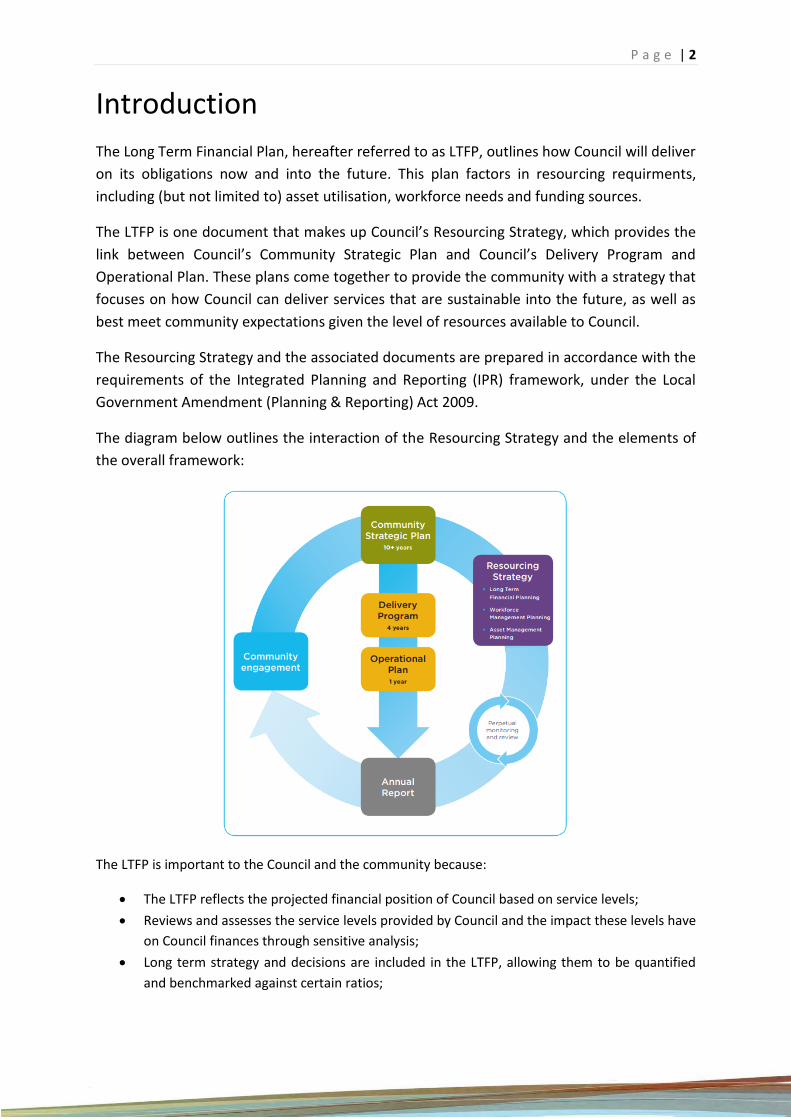
The diagram below outlines the interaction of the Resourcing Strategy and the elements of
the overall framework:
The LTFP is important to the Council and the community because:
• The LTFP reflects the projected financial position of Council based on service levels;
• Reviews and assesses the service levels provided by Council and the impact these levels have
on Council finances through sensitive analysis;
• Long term strategy and decisions are included in the LTFP, allowing them to be quantified
and benchmarked against certain ratios;
P a g e | 3
What is a Long Term Financial Plan
The Long Term Financial Plan (LTFP) covers a period of ten (10) years and it outlines, in
financial dollars, the short, medium and long term proposed actions with reference to
current and future service levels, as well as maintain future sustainability of the Council.
The LTFP is one document that can be used by various stakeholders to assess and determine
what resources Council requires to deliver the Community Strategic Plan. The LTFP is one
component of the overall Resourcing Strategy and it includes the financial information to
show how differnet sensitive scenarios can have an impact on Council’s overall resourcing
and future direction.
The LTFP includes the following:
• Proposed budget for 2020-2021 through to 2029-2030 (over ten years);
• The assumptions used to develop and deliver the plan, including how revenue is
raised;
• Assessment of financial performance against industry benchmarks;
• Review and testing of the impact of different scenarios and how they impact on
future Council budgets;
• Capital expenditure.
The LTFP is updated and adopted by Council on an annual basis, along with Council’s
Operational Plan. The Community Strategic Plan is required to be updated every 4 years
(Council’s current plan is required to be reviewed during the 2020/21 financial year).
Financial modelling within this LTFP is based on an income statement, balance sheet and
cashflow statement. Each sensitive scenario analysis also has an income statement, balance
sheet and cashflow statement, which show how that scenario will impact on the bottom line
and its impact over the long term.
P a g e | 4
Forecasting Future Budgets
When the 10 year Long Term Financial Plan (LTFP) was compiled, there have been
assumptions made on factors which are beyond Council’s control. Some of these
assumptions include wage increases, rate capping expectation and inflation.
Council’s revenue sources are made up of three main funding sources; namely, rates and
annual charges, fees and charges and grant funding. There can be a fourth source of funding
Council could utilise, and this is borrowings.
Revenue Forecasts
Rating Capacity On average, rates and annual charges make up around 25% to 30% of Council’s revenue. Annual charges include those charges for water, sewer and waste services. When assumptions are made with regards to rates and annual charges, various factors are considered and these include (but not limited to) community capacity to pay rates and the community willingness to pay rates. Council, when assessing the rates and annual charges for the 2020/21 year and beyond, has reviewed the potential limit reliance on rates through:
• Ensuring that the rate capping has been applied to rates;
• Increasing revenue from other sources like fees and charges; Special Rate Variation
In 2018/19, Council applied for, and was granted, a 10% increase in rates over the next seven years (2018/19 to 2024/25 financial years). It is Council’s intention to put these additional funds towards renewal and maintenance works relating to infrastructure. Fees and Charges A number of services provided by Council are done so on a user-pay basis. This fees include statutory like development application fees and council own fees, like private works. In preparing the LTFP, Council considers the cost-recovery approach when setting fees. In some cases, where a fee is a statutory fee, any change to the fee amount can only occur when allowed under the applicable Act or Regulation.
P a g e | 5
Grant Funding Council receives many grants each year. In some cases, these are recurring on an annual basis like the Financial Assistance Grant from the Commonwealth Government through to one-off specific grants. As an example, in the 2020/21 year, Council will receive a specific grant relating to the Bidgee Haven Hostel extension and funding relating to drought relief. In preparing the LTFP, an assumption has been made that Council will continue to receive some grant funding and where there is a high probability Council to receive a particular grant for the 2020/21 year, Council has included this as well. The grants assumed to be received on a yearly basis included:
• Financial Assistance Grant;
• Certain Roads and Maritime Grants including the block, supplementary and traffic grant;
• Roads to Recovery grant funding; and,
• NSW Rural Fire Service maintenace grant funding. Borrowings There will be one new loan borrowing of $1,000,000 for the Water Fund. The borrowing will fund Council’s 40% contribution towards renewing the Balranald water treatment plant. There is no further anticipated new borrowings over the remaining nine years period of the LTFP.
Expenditure Forecasts
In developing expenditure forecasts, new and existing expenditure items have been considered. Expenditure of an operational and capital nature are considered. Operational expenditure includes things such as maintenance, whilst capital expenditure includes infrastructure replacement. Some expenditure, like employee costs, incur both at an operational and capital level and assumptions have been applied in how these costs are applied. Consideration has been given to all types of expenditure, their impact on each year of the LTFP, their increase/ decrease over the ten year LTFP and how they are applied in terms of phasing. The LTFP is prepared on an accurals basis.
Financial Modelling
The development process for the LTFP has included financial modelling taking into acount how certains changes in the LTFP assumptions result in a different budget outcome. These changes are consdiered and presented in the sensitivity analysis section of this document.
P a g e | 6
Long Term Financial Plan Assumptions
In preparing not only the 2020/21 year budget, but also the other nine years to 2029/30 financial year, consideration was given to a range of economic factors which could impact on budget forecasting.
Market Driven Planning Assumptions
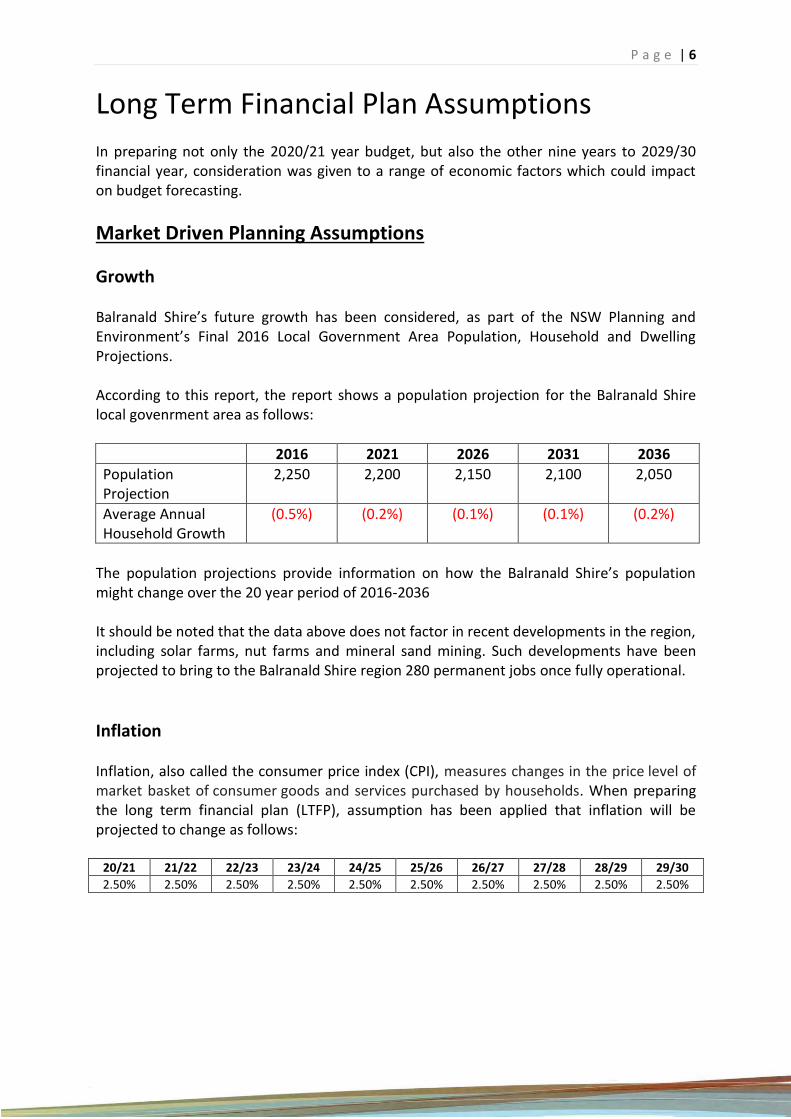
Growth Balranald Shire’s future growth has been considered, as part of the NSW Planning and Environment’s Final 2016 Local Government Area Population, Household and Dwelling Projections. According to this report, the report shows a population projection for the Balranald Shire local govenrment area as follows:
2016 2021 2026 2031 2036
Population Projection
2,250 2,200 2,150 2,100 2,050
Average Annual Household Growth
(0.5%) (0.2%) (0.1%) (0.1%) (0.2%)
The population projections provide information on how the Balranald Shire’s population might change over the 20 year period of 2016-2036 It should be noted that the data above does not factor in recent developments in the region, including solar farms, nut farms and mineral sand mining. Such developments have been projected to bring to the Balranald Shire region 280 permanent jobs once fully operational.
Inflation Inflation, also called the consumer price index (CPI), measures changes in the price level of market basket of consumer goods and services purchased by households. When preparing the long term financial plan (LTFP), assumption has been applied that inflation will be projected to change as follows:
20/21 21/22 22/23 23/24 24/25 25/26 26/27 27/28 28/29 29/30
2.50% 2.50% 2.50% 2.50% 2.50% 2.50% 2.50% 2.50% 2.50% 2.50%
P a g e | 7
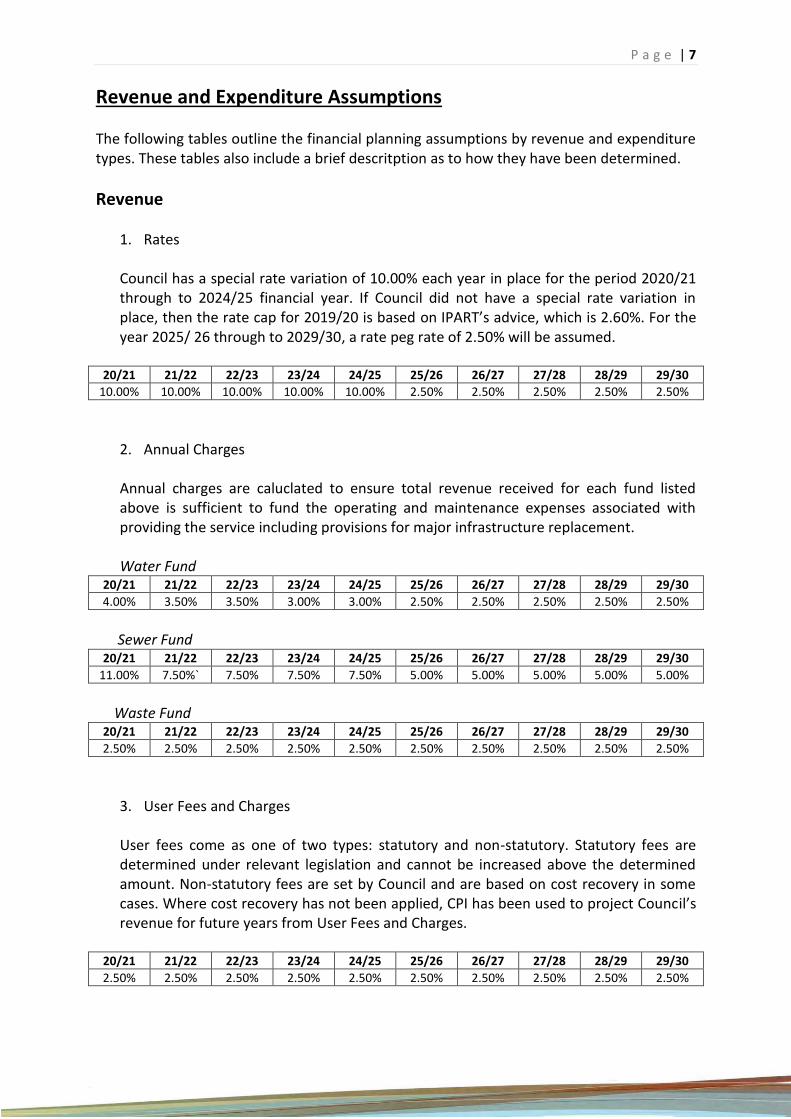
Revenue and Expenditure Assumptions The following tables outline the financial planning assumptions by revenue and expenditure types. These tables also include a brief descritption as to how they have been determined.
Revenue
1. Rates
Council has a special rate variation of 10.00% each year in place for the period 2020/21 through to 2024/25 financial year. If Council did not have a special rate variation in place, then the rate cap for 2019/20 is based on IPART’s advice, which is 2.60%. For the year 2025/ 26 through to 2029/30, a rate peg rate of 2.50% will be assumed.
20/21 21/22 22/23 23/24 24/25 25/26 26/27 27/28 28/29 29/30
10.00% 10.00% 10.00% 10.00% 10.00% 2.50% 2.50% 2.50% 2.50% 2.50%
2. Annual Charges
Annual charges are caluclated to ensure total revenue received for each fund listed above is sufficient to fund the operating and maintenance expenses associated with providing the service including provisions for major infrastructure replacement. Water Fund
20/21 21/22 22/23 23/24 24/25 25/26 26/27 27/28 28/29 29/30
4.00% 3.50% 3.50% 3.00% 3.00% 2.50% 2.50% 2.50% 2.50% 2.50%
Sewer Fund
20/21 21/22 22/23 23/24 24/25 25/26 26/27 27/28 28/29 29/30
11.00% 7.50%` 7.50% 7.50% 7.50% 5.00% 5.00% 5.00% 5.00% 5.00%
Waste Fund
20/21 21/22 22/23 23/24 24/25 25/26 26/27 27/28 28/29 29/30
2.50% 2.50% 2.50% 2.50% 2.50% 2.50% 2.50% 2.50% 2.50% 2.50%
3. User Fees and Charges
User fees come as one of two types: statutory and non-statutory. Statutory fees are determined under relevant legislation and cannot be increased above the determined amount. Non-statutory fees are set by Council and are based on cost recovery in some cases. Where cost recovery has not been applied, CPI has been used to project Council’s revenue for future years from User Fees and Charges.
20/21 21/22 22/23 23/24 24/25 25/26 26/27 27/28 28/29 29/30
2.50% 2.50% 2.50% 2.50% 2.50% 2.50% 2.50% 2.50% 2.50% 2.50%
P a g e | 8
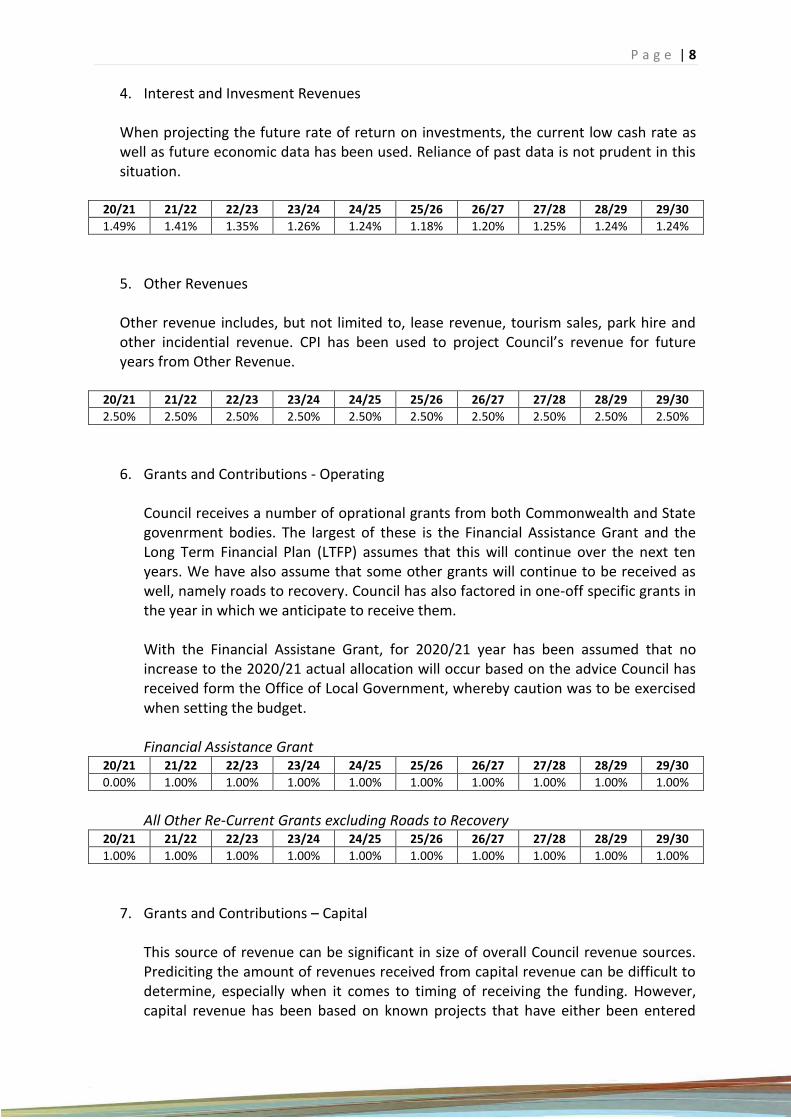
4. Interest and Invesment Revenues
When projecting the future rate of return on investments, the current low cash rate as well as future economic data has been used. Reliance of past data is not prudent in this situation.
20/21 21/22 22/23 23/24 24/25 25/26 26/27 27/28 28/29 29/30
1.49% 1.41% 1.35% 1.26% 1.24% 1.18% 1.20% 1.25% 1.24% 1.24%
5. Other Revenues
Other revenue includes, but not limited to, lease revenue, tourism sales, park hire and other incidential revenue. CPI has been used to project Council’s revenue for future years from Other Revenue.
20/21 21/22 22/23 23/24 24/25 25/26 26/27 27/28 28/29 29/30
2.50% 2.50% 2.50% 2.50% 2.50% 2.50% 2.50% 2.50% 2.50% 2.50%
6. Grants and Contributions - Operating Council receives a number of oprational grants from both Commonwealth and State govenrment bodies. The largest of these is the Financial Assistance Grant and the Long Term Financial Plan (LTFP) assumes that this will continue over the next ten years. We have also assume that some other grants will continue to be received as well, namely roads to recovery. Council has also factored in one-off specific grants in the year in which we anticipate to receive them. With the Financial Assistane Grant, for 2020/21 year has been assumed that no increase to the 2020/21 actual allocation will occur based on the advice Council has received form the Office of Local Government, whereby caution was to be exercised when setting the budget.
Financial Assistance Grant
20/21 21/22 22/23 23/24 24/25 25/26 26/27 27/28 28/29 29/30
0.00% 1.00% 1.00% 1.00% 1.00% 1.00% 1.00% 1.00% 1.00% 1.00%
All Other Re-Current Grants excluding Roads to Recovery
20/21 21/22 22/23 23/24 24/25 25/26 26/27 27/28 28/29 29/30
1.00% 1.00% 1.00% 1.00% 1.00% 1.00% 1.00% 1.00% 1.00% 1.00%
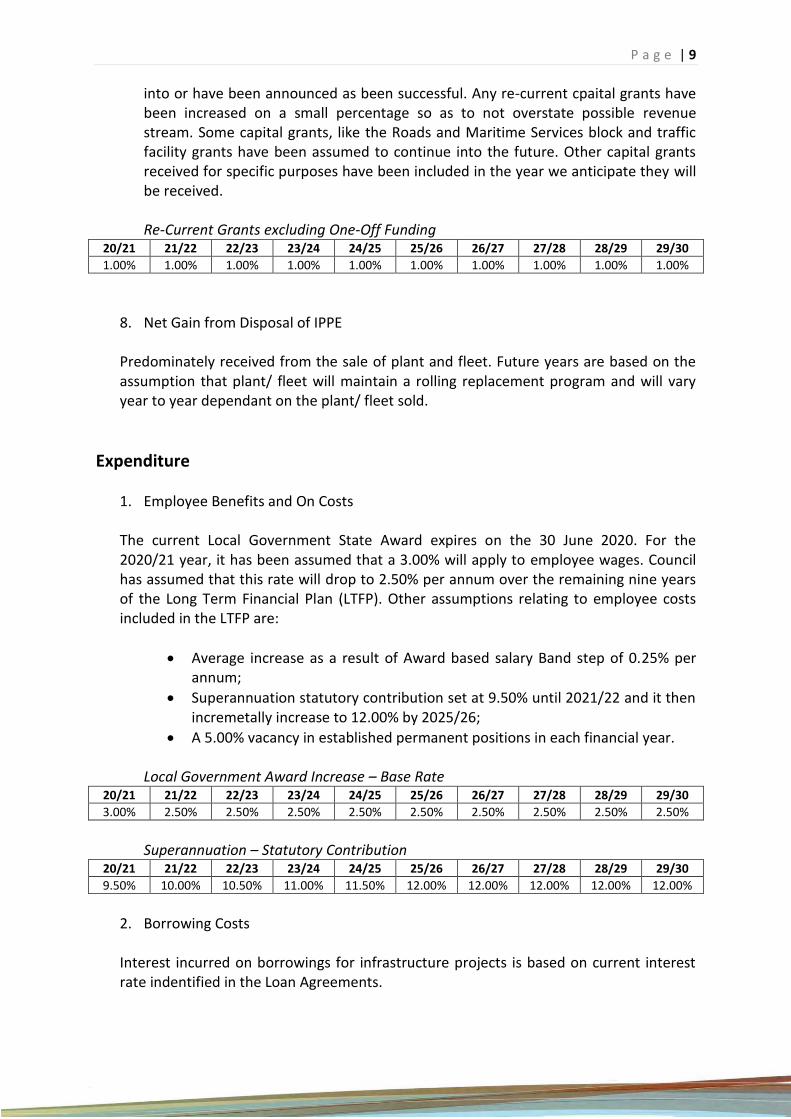
7. Grants and Contributions – Capital
This source of revenue can be significant in size of overall Council revenue sources. Prediciting the amount of revenues received from capital revenue can be difficult to determine, especially when it comes to timing of receiving the funding. However, capital revenue has been based on known projects that have either been entered
P a g e | 9
into or have been announced as been successful. Any re-current cpaital grants have been increased on a small percentage so as to not overstate possible revenue stream. Some capital grants, like the Roads and Maritime Services block and traffic facility grants have been assumed to continue into the future. Other capital grants received for specific purposes have been included in the year we anticipate they will be received. Re-Current Grants excluding One-Off Funding
20/21 21/22 22/23 23/24 24/25 25/26 26/27 27/28 28/29 29/30
1.00% 1.00% 1.00% 1.00% 1.00% 1.00% 1.00% 1.00% 1.00% 1.00%
8. Net Gain from Disposal of IPPE
Predominately received from the sale of plant and fleet. Future years are based on the assumption that plant/ fleet will maintain a rolling replacement program and will vary year to year dependant on the plant/ fleet sold.
Expenditure
1. Employee Benefits and On Costs
The current Local Government State Award expires on the 30 June 2020. For the 2020/21 year, it has been assumed that a 3.00% will apply to employee wages. Council has assumed that this rate will drop to 2.50% per annum over the remaining nine years of the Long Term Financial Plan (LTFP). Other assumptions relating to employee costs included in the LTFP are:
• Average increase as a result of Award based salary Band step of 0.25% per annum;
• Superannuation statutory contribution set at 9.50% until 2021/22 and it then incremetally increase to 12.00% by 2025/26;
• A 5.00% vacancy in established permanent positions in each financial year.
Local Government Award Increase – Base Rate 20/21 21/22 22/23 23/24 24/25 25/26 26/27 27/28 28/29 29/30
3.00% 2.50% 2.50% 2.50% 2.50% 2.50% 2.50% 2.50% 2.50% 2.50%
Superannuation – Statutory Contribution
20/21 21/22 22/23 23/24 24/25 25/26 26/27 27/28 28/29 29/30
9.50% 10.00% 10.50% 11.00% 11.50% 12.00% 12.00% 12.00% 12.00% 12.00%
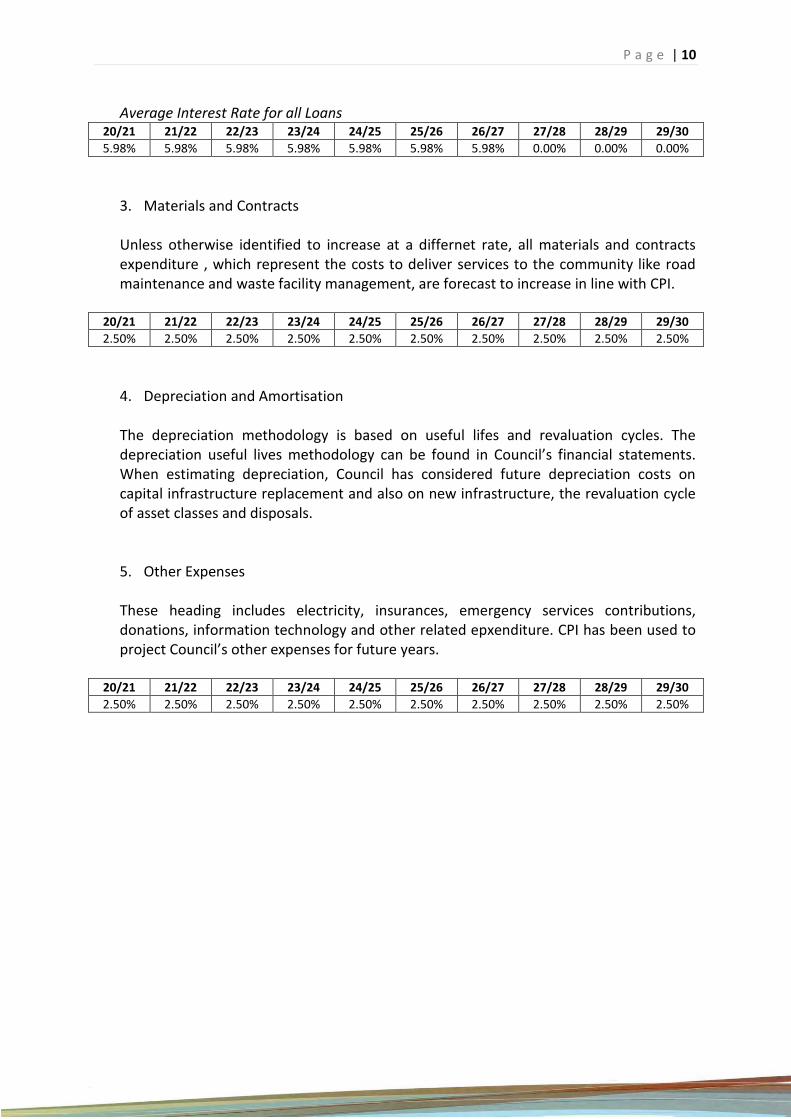
2. Borrowing Costs
Interest incurred on borrowings for infrastructure projects is based on current interest rate indentified in the Loan Agreements.
P a g e | 10
Average Interest Rate for all Loans
20/21 21/22 22/23 23/24 24/25 25/26 26/27 27/28 28/29 29/30
5.98% 5.98% 5.98% 5.98% 5.98% 5.98% 5.98% 0.00% 0.00% 0.00%
3. Materials and Contracts
Unless otherwise identified to increase at a differnet rate, all materials and contracts expenditure , which represent the costs to deliver services to the community like road maintenance and waste facility management, are forecast to increase in line with CPI.
20/21 21/22 22/23 23/24 24/25 25/26 26/27 27/28 28/29 29/30
2.50% 2.50% 2.50% 2.50% 2.50% 2.50% 2.50% 2.50% 2.50% 2.50%
4. Depreciation and Amortisation
The depreciation methodology is based on useful lifes and revaluation cycles. The depreciation useful lives methodology can be found in Council’s financial statements. When estimating depreciation, Council has considered future depreciation costs on capital infrastructure replacement and also on new infrastructure, the revaluation cycle of asset classes and disposals.
5. Other Expenses
These heading includes electricity, insurances, emergency services contributions, donations, information technology and other related epxenditure. CPI has been used to project Council’s other expenses for future years.
20/21 21/22 22/23 23/24 24/25 25/26 26/27 27/28 28/29 29/30
2.50% 2.50% 2.50% 2.50% 2.50% 2.50% 2.50% 2.50% 2.50% 2.50%
P a g e | 11
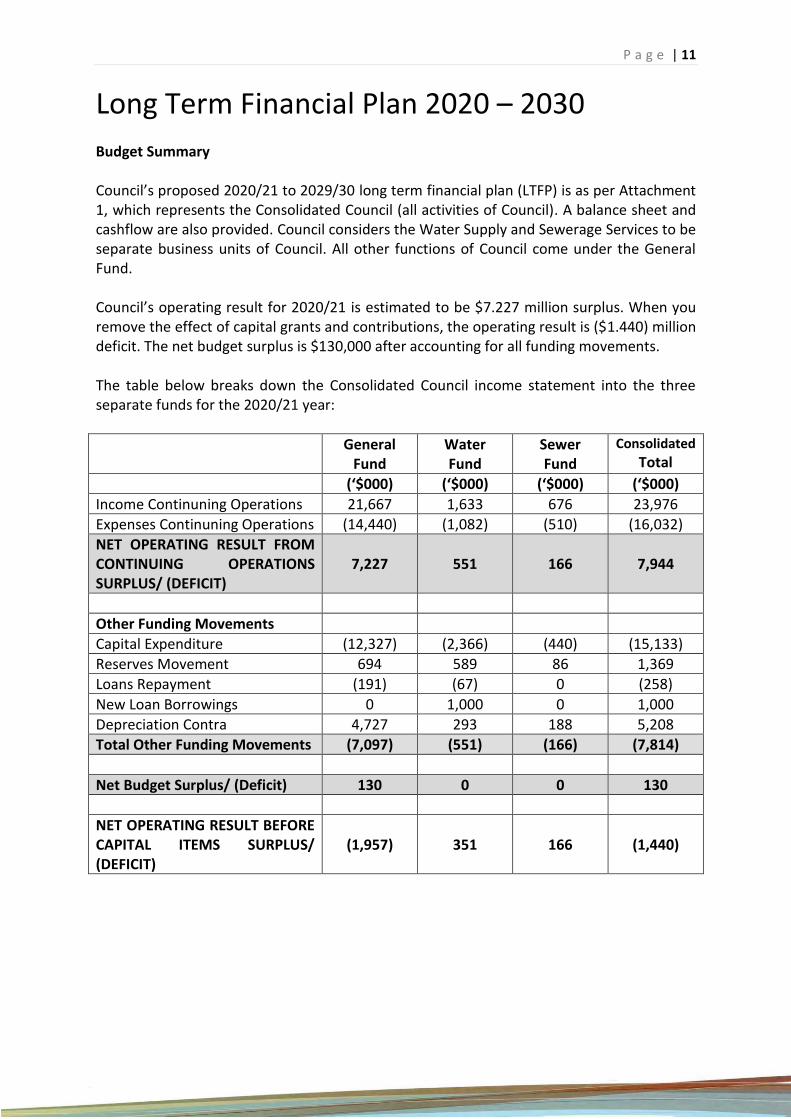
Long Term Financial Plan 2020 – 2030
Budget Summary Council’s proposed 2020/21 to 2029/30 long term financial plan (LTFP) is as per Attachment 1, which represents the Consolidated Council (all activities of Council). A balance sheet and cashflow are also provided. Council considers the Water Supply and Sewerage Services to be separate business units of Council. All other functions of Council come under the General Fund. Council’s operating result for 2020/21 is estimated to be $7.227 million surplus. When you remove the effect of capital grants and contributions, the operating result is ($1.440) million deficit. The net budget surplus is $130,000 after accounting for all funding movements. The table below breaks down the Consolidated Council income statement into the three separate funds for the 2020/21 year:
General Fund
Water Fund
Sewer Fund
Consolidated
Total
(‘$000) (‘$000) (‘$000) (‘$000)
Income Continuning Operations 21,667 1,633 676 23,976
Expenses Continuning Operations (14,440) (1,082) (510) (16,032)
NET OPERATING RESULT FROM CONTINUING OPERATIONS SURPLUS/ (DEFICIT)
7,227 551 166 7,944
Other Funding Movements
Capital Expenditure (12,327) (2,366) (440) (15,133)
Reserves Movement 694 589 86 1,369
Loans Repayment (191) (67) 0 (258)
New Loan Borrowings 0 1,000 0 1,000
Depreciation Contra 4,727 293 188 5,208
Total Other Funding Movements (7,097) (551) (166) (7,814)
Net Budget Surplus/ (Deficit) 130 0 0 130
NET OPERATING RESULT BEFORE CAPITAL ITEMS SURPLUS/ (DEFICIT)
(1,957) 351 166 (1,440)
P a g e | 12
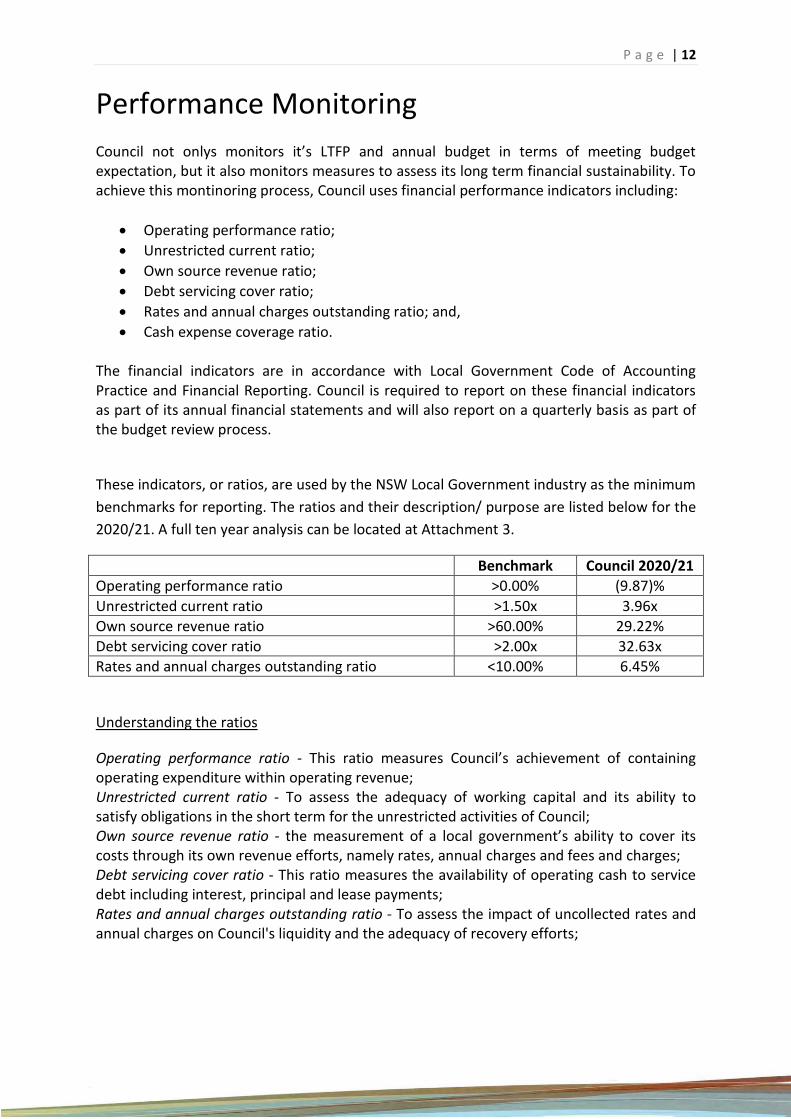
Performance Monitoring
Council not onlys monitors it’s LTFP and annual budget in terms of meeting budget expectation, but it also monitors measures to assess its long term financial sustainability. To achieve this montinoring process, Council uses financial performance indicators including:
• Operating performance ratio;
• Unrestricted current ratio;
• Own source revenue ratio;
• Debt servicing cover ratio;
• Rates and annual charges outstanding ratio; and,
• Cash expense coverage ratio. The financial indicators are in accordance with Local Government Code of Accounting Practice and Financial Reporting. Council is required to report on these financial indicators as part of its annual financial statements and will also report on a quarterly basis as part of the budget review process.
These indicators, or ratios, are used by the NSW Local Government industry as the minimum
benchmarks for reporting. The ratios and their description/ purpose are listed below for the
2020/21. A full ten year analysis can be located at Attachment 3.
Benchmark Council 2020/21
Operating performance ratio >0.00% (9.87)%
Unrestricted current ratio >1.50x 3.96x
Own source revenue ratio >60.00% 29.22%
Debt servicing cover ratio >2.00x 32.63x
Rates and annual charges outstanding ratio <10.00% 6.45%
Understanding the ratios
Operating performance ratio - This ratio measures Council’s achievement of containing operating expenditure within operating revenue; Unrestricted current ratio - To assess the adequacy of working capital and its ability to satisfy obligations in the short term for the unrestricted activities of Council; Own source revenue ratio - the measurement of a local government’s ability to cover its costs through its own revenue efforts, namely rates, annual charges and fees and charges; Debt servicing cover ratio - This ratio measures the availability of operating cash to service debt including interest, principal and lease payments; Rates and annual charges outstanding ratio - To assess the impact of uncollected rates and annual charges on Council's liquidity and the adequacy of recovery efforts;

P a g e | 13
Attachments
The following attachments form part of the Long Term Financial Plan documents:
Attachment 1 10 Year Long Term Financial Plan for Consolidated Council
Attachment 2 2020/21 Budget by Function for Consolidated Council
Attachment 3 Ratio Analysis for Consolidated Council
Attachment 4 2020/21 Capital Works Program for Consolidated Council
P a g e | 14
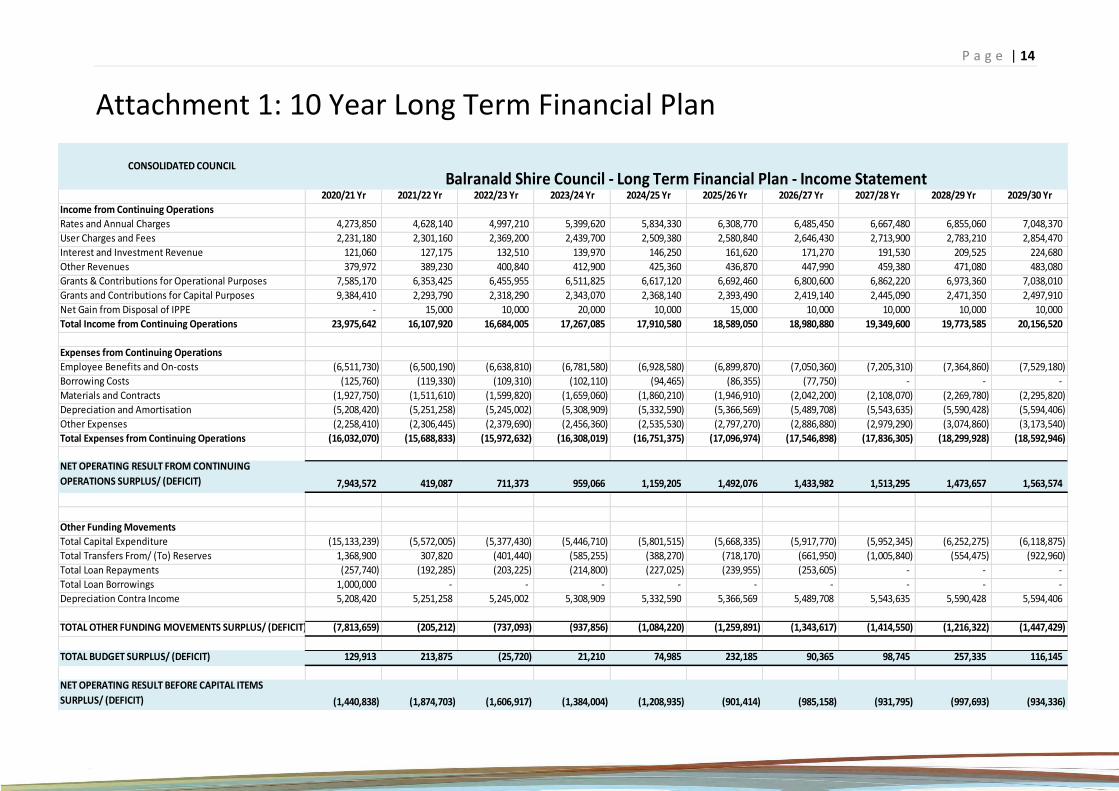
Attachment 1: 10 Year Long Term Financial Plan
2020/21 Yr 2021/22 Yr 2022/23 Yr 2023/24 Yr 2024/25 Yr 2025/26 Yr 2026/27 Yr 2027/28 Yr 2028/29 Yr 2029/30 Yr
Income from Continuing Operations
Rates and Annual Charges 4,273,850 4,628,140 4,997,210 5,399,620 5,834,330 6,308,770 6,485,450 6,667,480 6,855,060 7,048,370
User Charges and Fees 2,231,180 2,301,160 2,369,200 2,439,700 2,509,380 2,580,840 2,646,430 2,713,900 2,783,210 2,854,470
Interest and Investment Revenue 121,060 127,175 132,510 139,970 146,250 161,620 171,270 191,530 209,525 224,680
Other Revenues 379,972 389,230 400,840 412,900 425,360 436,870 447,990 459,380 471,080 483,080
Grants & Contributions for Operational Purposes 7,585,170 6,353,425 6,455,955 6,511,825 6,617,120 6,692,460 6,800,600 6,862,220 6,973,360 7,038,010
Grants and Contributions for Capital Purposes 9,384,410 2,293,790 2,318,290 2,343,070 2,368,140 2,393,490 2,419,140 2,445,090 2,471,350 2,497,910
Net Gain from Disposal of IPPE - 15,000 10,000 20,000 10,000 15,000 10,000 10,000 10,000 10,000
Total Income from Continuing Operations 23,975,642 16,107,920 16,684,005 17,267,085 17,910,580 18,589,050 18,980,880 19,349,600 19,773,585 20,156,520
Expenses from Continuing Operations
Employee Benefits and On-costs (6,511,730) (6,500,190) (6,638,810) (6,781,580) (6,928,580) (6,899,870) (7,050,360) (7,205,310) (7,364,860) (7,529,180)
Borrowing Costs (125,760) (119,330) (109,310) (102,110) (94,465) (86,355) (77,750) - - -
Materials and Contracts (1,927,750) (1,511,610) (1,599,820) (1,659,060) (1,860,210) (1,946,910) (2,042,200) (2,108,070) (2,269,780) (2,295,820)
Depreciation and Amortisation (5,208,420) (5,251,258) (5,245,002) (5,308,909) (5,332,590) (5,366,569) (5,489,708) (5,543,635) (5,590,428) (5,594,406)
Other Expenses (2,258,410) (2,306,445) (2,379,690) (2,456,360) (2,535,530) (2,797,270) (2,886,880) (2,979,290) (3,074,860) (3,173,540)
Total Expenses from Continuing Operations (16,032,070) (15,688,833) (15,972,632) (16,308,019) (16,751,375) (17,096,974) (17,546,898) (17,836,305) (18,299,928) (18,592,946)
NET OPERATING RESULT FROM CONTINUING
OPERATIONS SURPLUS/ (DEFICIT) 7,943,572 419,087 711,373 959,066 1,159,205 1,492,076 1,433,982 1,513,295 1,473,657 1,563,574
Other Funding Movements
Total Capital Expenditure (15,133,239) (5,572,005) (5,377,430) (5,446,710) (5,801,515) (5,668,335) (5,917,770) (5,952,345) (6,252,275) (6,118,875)
Total Transfers From/ (To) Reserves 1,368,900 307,820 (401,440) (585,255) (388,270) (718,170) (661,950) (1,005,840) (554,475) (922,960)
Total Loan Repayments (257,740) (192,285) (203,225) (214,800) (227,025) (239,955) (253,605) - - -
Total Loan Borrowings 1,000,000 - - - - - - - - -
Depreciation Contra Income 5,208,420 5,251,258 5,245,002 5,308,909 5,332,590 5,366,569 5,489,708 5,543,635 5,590,428 5,594,406
TOTAL OTHER FUNDING MOVEMENTS SURPLUS/ (DEFICIT) (7,813,659) (205,212) (737,093) (937,856) (1,084,220) (1,259,891) (1,343,617) (1,414,550) (1,216,322) (1,447,429)
TOTAL BUDGET SURPLUS/ (DEFICIT) 129,913 213,875 (25,720) 21,210 74,985 232,185 90,365 98,745 257,335 116,145
NET OPERATING RESULT BEFORE CAPITAL ITEMS
SURPLUS/ (DEFICIT) (1,440,838) (1,874,703) (1,606,917) (1,384,004) (1,208,935) (901,414) (985,158) (931,795) (997,693) (934,336)
CONSOLIDATED COUNCIL
Balranald Shire Council - Long Term Financial Plan - Income Statement
P a g e | 15
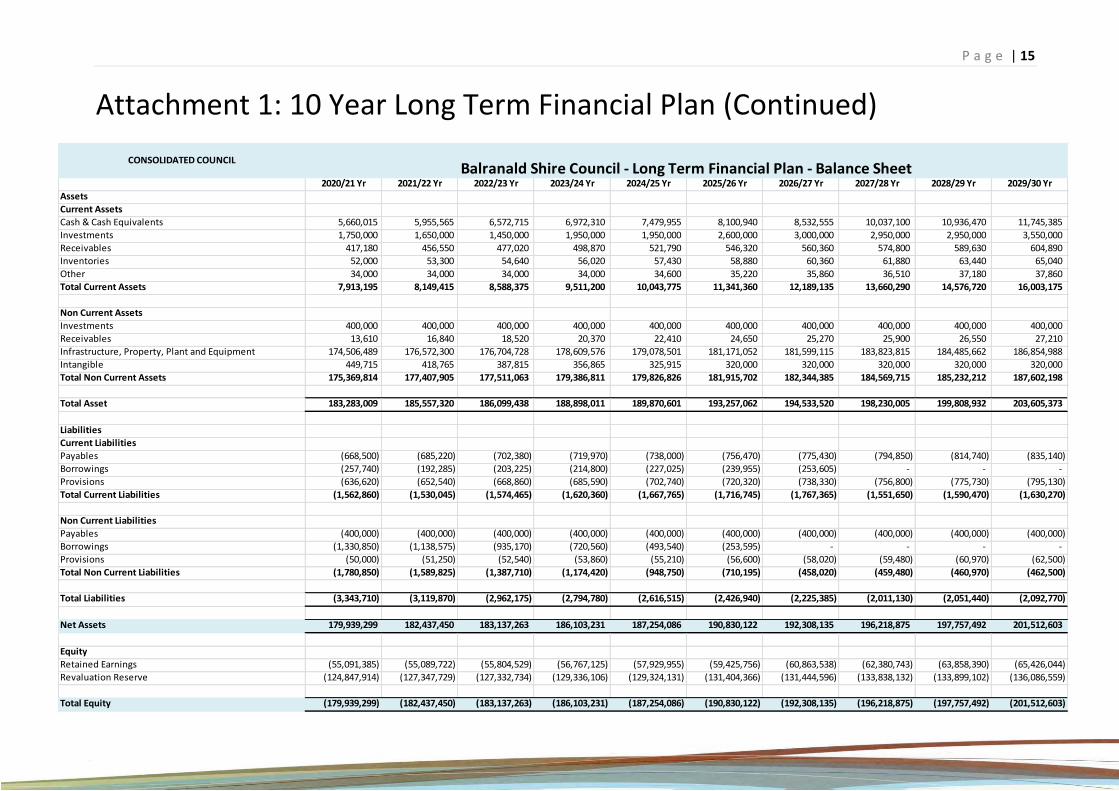
Attachment 1: 10 Year Long Term Financial Plan (Continued)
2020/21 Yr 2021/22 Yr 2022/23 Yr 2023/24 Yr 2024/25 Yr 2025/26 Yr 2026/27 Yr 2027/28 Yr 2028/29 Yr 2029/30 Yr
Assets
Current Assets
Cash & Cash Equivalents 5,660,015 5,955,565 6,572,715 6,972,310 7,479,955 8,100,940 8,532,555 10,037,100 10,936,470 11,745,385
Investments 1,750,000 1,650,000 1,450,000 1,950,000 1,950,000 2,600,000 3,000,000 2,950,000 2,950,000 3,550,000
Receivables 417,180 456,550 477,020 498,870 521,790 546,320 560,360 574,800 589,630 604,890
Inventories 52,000 53,300 54,640 56,020 57,430 58,880 60,360 61,880 63,440 65,040
Other 34,000 34,000 34,000 34,000 34,600 35,220 35,860 36,510 37,180 37,860
Total Current Assets 7,913,195 8,149,415 8,588,375 9,511,200 10,043,775 11,341,360 12,189,135 13,660,290 14,576,720 16,003,175
Non Current Assets
Investments 400,000 400,000 400,000 400,000 400,000 400,000 400,000 400,000 400,000 400,000
Receivables 13,610 16,840 18,520 20,370 22,410 24,650 25,270 25,900 26,550 27,210
Infrastructure, Property, Plant and Equipment 174,506,489 176,572,300 176,704,728 178,609,576 179,078,501 181,171,052 181,599,115 183,823,815 184,485,662 186,854,988
Intangible 449,715 418,765 387,815 356,865 325,915 320,000 320,000 320,000 320,000 320,000
Total Non Current Assets 175,369,814 177,407,905 177,511,063 179,386,811 179,826,826 181,915,702 182,344,385 184,569,715 185,232,212 187,602,198
Total Asset 183,283,009 185,557,320 186,099,438 188,898,011 189,870,601 193,257,062 194,533,520 198,230,005 199,808,932 203,605,373
Liabilities
Current Liabilities
Payables (668,500) (685,220) (702,380) (719,970) (738,000) (756,470) (775,430) (794,850) (814,740) (835,140)
Borrowings (257,740) (192,285) (203,225) (214,800) (227,025) (239,955) (253,605) - - -
Provisions (636,620) (652,540) (668,860) (685,590) (702,740) (720,320) (738,330) (756,800) (775,730) (795,130)
Total Current Liabilities (1,562,860) (1,530,045) (1,574,465) (1,620,360) (1,667,765) (1,716,745) (1,767,365) (1,551,650) (1,590,470) (1,630,270)
Non Current Liabilities
Payables (400,000) (400,000) (400,000) (400,000) (400,000) (400,000) (400,000) (400,000) (400,000) (400,000)
Borrowings (1,330,850) (1,138,575) (935,170) (720,560) (493,540) (253,595) - - - -
Provisions (50,000) (51,250) (52,540) (53,860) (55,210) (56,600) (58,020) (59,480) (60,970) (62,500)
Total Non Current Liabilities (1,780,850) (1,589,825) (1,387,710) (1,174,420) (948,750) (710,195) (458,020) (459,480) (460,970) (462,500)
Total Liabilities (3,343,710) (3,119,870) (2,962,175) (2,794,780) (2,616,515) (2,426,940) (2,225,385) (2,011,130) (2,051,440) (2,092,770)
Net Assets 179,939,299 182,437,450 183,137,263 186,103,231 187,254,086 190,830,122 192,308,135 196,218,875 197,757,492 201,512,603
Equity
Retained Earnings (55,091,385) (55,089,722) (55,804,529) (56,767,125) (57,929,955) (59,425,756) (60,863,538) (62,380,743) (63,858,390) (65,426,044)
Revaluation Reserve (124,847,914) (127,347,729) (127,332,734) (129,336,106) (129,324,131) (131,404,366) (131,444,596) (133,838,132) (133,899,102) (136,086,559)
Total Equity (179,939,299) (182,437,450) (183,137,263) (186,103,231) (187,254,086) (190,830,122) (192,308,135) (196,218,875) (197,757,492) (201,512,603)
CONSOLIDATED COUNCILBalranald Shire Council - Long Term Financial Plan - Balance Sheet
P a g e | 16
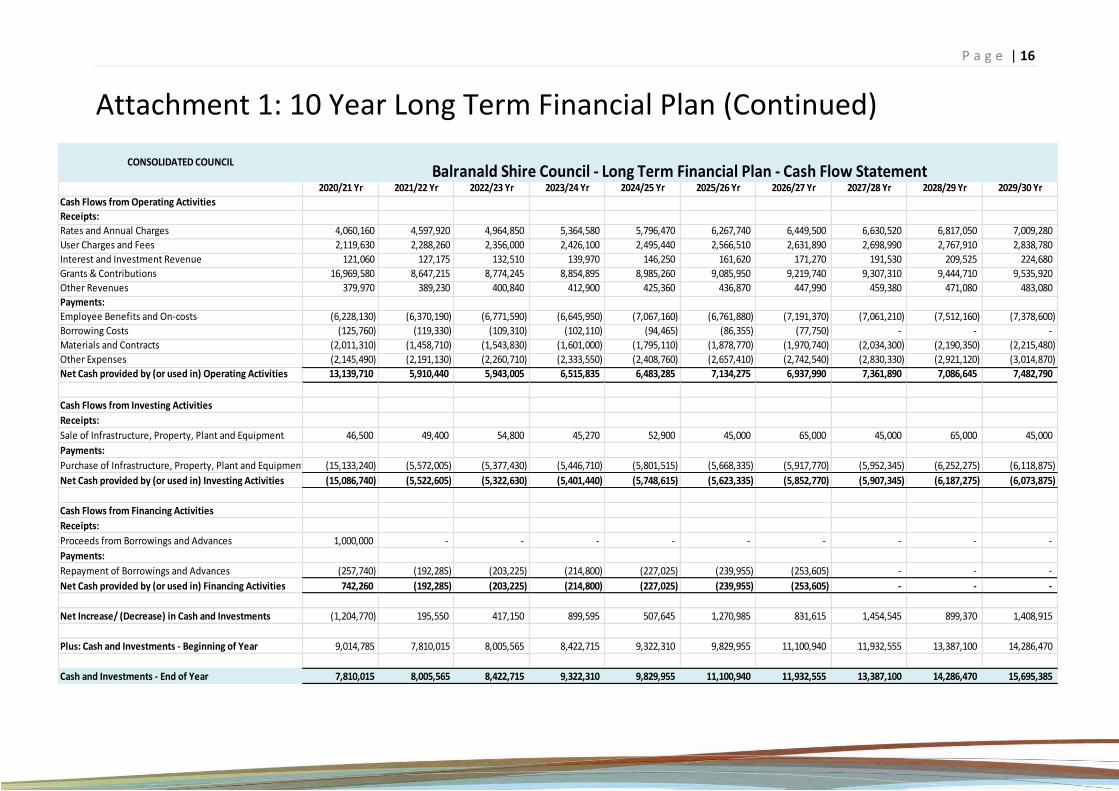
Attachment 1: 10 Year Long Term Financial Plan (Continued)
2020/21 Yr 2021/22 Yr 2022/23 Yr 2023/24 Yr 2024/25 Yr 2025/26 Yr 2026/27 Yr 2027/28 Yr 2028/29 Yr 2029/30 Yr
Cash Flows from Operating Activities
Receipts:
Rates and Annual Charges 4,060,160 4,597,920 4,964,850 5,364,580 5,796,470 6,267,740 6,449,500 6,630,520 6,817,050 7,009,280
User Charges and Fees 2,119,630 2,288,260 2,356,000 2,426,100 2,495,440 2,566,510 2,631,890 2,698,990 2,767,910 2,838,780
Interest and Investment Revenue 121,060 127,175 132,510 139,970 146,250 161,620 171,270 191,530 209,525 224,680
Grants & Contributions 16,969,580 8,647,215 8,774,245 8,854,895 8,985,260 9,085,950 9,219,740 9,307,310 9,444,710 9,535,920
Other Revenues 379,970 389,230 400,840 412,900 425,360 436,870 447,990 459,380 471,080 483,080
Payments:
Employee Benefits and On-costs (6,228,130) (6,370,190) (6,771,590) (6,645,950) (7,067,160) (6,761,880) (7,191,370) (7,061,210) (7,512,160) (7,378,600)
Borrowing Costs (125,760) (119,330) (109,310) (102,110) (94,465) (86,355) (77,750) - - -
Materials and Contracts (2,011,310) (1,458,710) (1,543,830) (1,601,000) (1,795,110) (1,878,770) (1,970,740) (2,034,300) (2,190,350) (2,215,480)
Other Expenses (2,145,490) (2,191,130) (2,260,710) (2,333,550) (2,408,760) (2,657,410) (2,742,540) (2,830,330) (2,921,120) (3,014,870)
Net Cash provided by (or used in) Operating Activities 13,139,710 5,910,440 5,943,005 6,515,835 6,483,285 7,134,275 6,937,990 7,361,890 7,086,645 7,482,790
Cash Flows from Investing Activities
Receipts:
Sale of Infrastructure, Property, Plant and Equipment 46,500 49,400 54,800 45,270 52,900 45,000 65,000 45,000 65,000 45,000
Payments:
Purchase of Infrastructure, Property, Plant and Equipment (15,133,240) (5,572,005) (5,377,430) (5,446,710) (5,801,515) (5,668,335) (5,917,770) (5,952,345) (6,252,275) (6,118,875)
Net Cash provided by (or used in) Investing Activities (15,086,740) (5,522,605) (5,322,630) (5,401,440) (5,748,615) (5,623,335) (5,852,770) (5,907,345) (6,187,275) (6,073,875)
Cash Flows from Financing Activities
Receipts:
Proceeds from Borrowings and Advances 1,000,000 - - - - - - - - -
Payments:
Repayment of Borrowings and Advances (257,740) (192,285) (203,225) (214,800) (227,025) (239,955) (253,605) - - -
Net Cash provided by (or used in) Financing Activities 742,260 (192,285) (203,225) (214,800) (227,025) (239,955) (253,605) - - -
Net Increase/ (Decrease) in Cash and Investments (1,204,770) 195,550 417,150 899,595 507,645 1,270,985 831,615 1,454,545 899,370 1,408,915
Plus: Cash and Investments - Beginning of Year 9,014,785 7,810,015 8,005,565 8,422,715 9,322,310 9,829,955 11,100,940 11,932,555 13,387,100 14,286,470
Cash and Investments - End of Year 7,810,015 8,005,565 8,422,715 9,322,310 9,829,955 11,100,940 11,932,555 13,387,100 14,286,470 15,695,385
CONSOLIDATED COUNCILBalranald Shire Council - Long Term Financial Plan - Cash Flow Statement
P a g e | 17
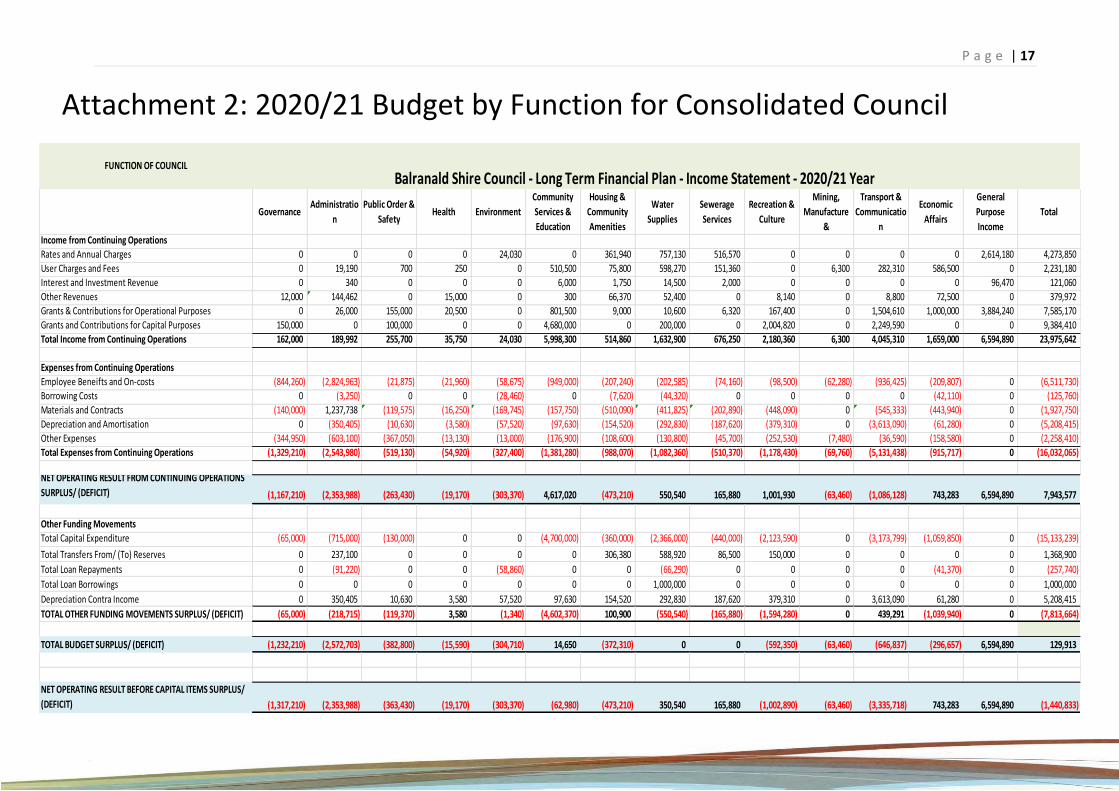
Attachment 2: 2020/21 Budget by Function for Consolidated Council
GovernanceAdministratio
n
Public Order &
SafetyHealth Environment
Community
Services &
Education
Housing &
Community
Amenities
Water
Supplies
Sewerage
Services
Recreation &
Culture
Mining,
Manufacture
&
Transport &
Communicatio
n
Economic
Affairs
General
Purpose
Income
Total
Income from Continuing Operations
Rates and Annual Charges 0 0 0 0 24,030 0 361,940 757,130 516,570 0 0 0 0 2,614,180 4,273,850
User Charges and Fees 0 19,190 700 250 0 510,500 75,800 598,270 151,360 0 6,300 282,310 586,500 0 2,231,180
Interest and Investment Revenue 0 340 0 0 0 6,000 1,750 14,500 2,000 0 0 0 0 96,470 121,060
Other Revenues 12,000 144,462 0 15,000 0 300 66,370 52,400 0 8,140 0 8,800 72,500 0 379,972
Grants & Contributions for Operational Purposes 0 26,000 155,000 20,500 0 801,500 9,000 10,600 6,320 167,400 0 1,504,610 1,000,000 3,884,240 7,585,170
Grants and Contributions for Capital Purposes 150,000 0 100,000 0 0 4,680,000 0 200,000 0 2,004,820 0 2,249,590 0 0 9,384,410
Total Income from Continuing Operations 162,000 189,992 255,700 35,750 24,030 5,998,300 514,860 1,632,900 676,250 2,180,360 6,300 4,045,310 1,659,000 6,594,890 23,975,642
Expenses from Continuing Operations
Employee Beneifts and On-costs (844,260) (2,824,963) (21,875) (21,960) (58,675) (949,000) (207,240) (202,585) (74,160) (98,500) (62,280) (936,425) (209,807) 0 (6,511,730)
Borrowing Costs 0 (3,250) 0 0 (28,460) 0 (7,620) (44,320) 0 0 0 0 (42,110) 0 (125,760)
Materials and Contracts (140,000) 1,237,738 (119,575) (16,250) (169,745) (157,750) (510,090) (411,825) (202,890) (448,090) 0 (545,333) (443,940) 0 (1,927,750)
Depreciation and Amortisation 0 (350,405) (10,630) (3,580) (57,520) (97,630) (154,520) (292,830) (187,620) (379,310) 0 (3,613,090) (61,280) 0 (5,208,415)
Other Expenses (344,950) (603,100) (367,050) (13,130) (13,000) (176,900) (108,600) (130,800) (45,700) (252,530) (7,480) (36,590) (158,580) 0 (2,258,410)
Total Expenses from Continuing Operations (1,329,210) (2,543,980) (519,130) (54,920) (327,400) (1,381,280) (988,070) (1,082,360) (510,370) (1,178,430) (69,760) (5,131,438) (915,717) 0 (16,032,065)
NET OPERATING RESULT FROM CONTINUING OPERATIONS
SURPLUS/ (DEFICIT) (1,167,210) (2,353,988) (263,430) (19,170) (303,370) 4,617,020 (473,210) 550,540 165,880 1,001,930 (63,460) (1,086,128) 743,283 6,594,890 7,943,577
Other Funding Movements
Total Capital Expenditure (65,000) (715,000) (130,000) 0 0 (4,700,000) (360,000) (2,366,000) (440,000) (2,123,590) 0 (3,173,799) (1,059,850) 0 (15,133,239)
Total Transfers From/ (To) Reserves 0 237,100 0 0 0 0 306,380 588,920 86,500 150,000 0 0 0 0 1,368,900
Total Loan Repayments 0 (91,220) 0 0 (58,860) 0 0 (66,290) 0 0 0 0 (41,370) 0 (257,740)
Total Loan Borrowings 0 0 0 0 0 0 0 1,000,000 0 0 0 0 0 0 1,000,000
Depreciation Contra Income 0 350,405 10,630 3,580 57,520 97,630 154,520 292,830 187,620 379,310 0 3,613,090 61,280 0 5,208,415
TOTAL OTHER FUNDING MOVEMENTS SURPLUS/ (DEFICIT) (65,000) (218,715) (119,370) 3,580 (1,340) (4,602,370) 100,900 (550,540) (165,880) (1,594,280) 0 439,291 (1,039,940) 0 (7,813,664)
TOTAL BUDGET SURPLUS/ (DEFICIT) (1,232,210) (2,572,703) (382,800) (15,590) (304,710) 14,650 (372,310) 0 0 (592,350) (63,460) (646,837) (296,657) 6,594,890 129,913
NET OPERATING RESULT BEFORE CAPITAL ITEMS SURPLUS/
(DEFICIT) (1,317,210) (2,353,988) (363,430) (19,170) (303,370) (62,980) (473,210) 350,540 165,880 (1,002,890) (63,460) (3,335,718) 743,283 6,594,890 (1,440,833)
FUNCTION OF COUNCIL
Balranald Shire Council - Long Term Financial Plan - Income Statement - 2020/21 Year
P a g e | 18
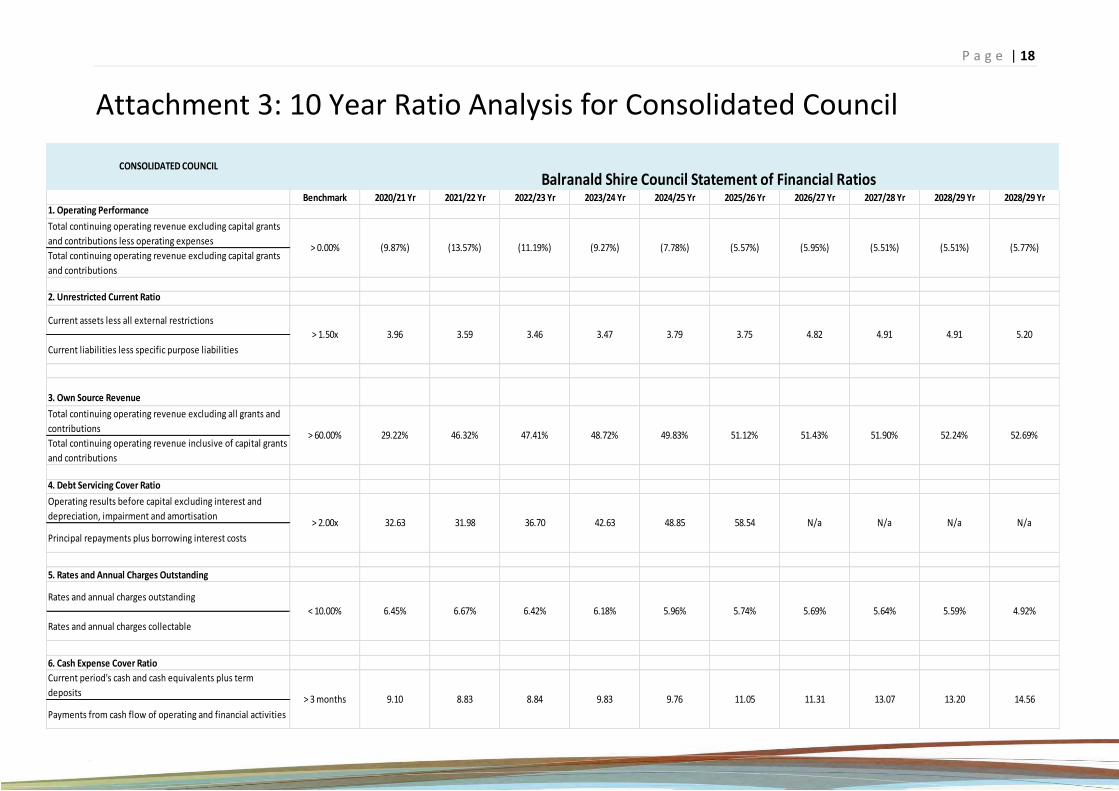
Attachment 3: 10 Year Ratio Analysis for Consolidated Council
Benchmark 2020/21 Yr 2021/22 Yr 2022/23 Yr 2023/24 Yr 2024/25 Yr 2025/26 Yr 2026/27 Yr 2027/28 Yr 2028/29 Yr 2028/29 Yr1. Operating Performance
Total continuing operating revenue excluding capital grants
and contributions less operating expenses
Total continuing operating revenue excluding capital grants
and contributions
2. Unrestricted Current Ratio
Current assets less all external restrictions
Current liabilities less specific purpose liabilities
3. Own Source Revenue
Total continuing operating revenue excluding all grants and
contributions
Total continuing operating revenue inclusive of capital grants
and contributions
4. Debt Servicing Cover Ratio
Operating results before capital excluding interest and
depreciation, impairment and amortisation
Principal repayments plus borrowing interest costs
5. Rates and Annual Charges Outstanding
Rates and annual charges outstanding
Rates and annual charges collectable
6. Cash Expense Cover Ratio
Current period's cash and cash equivalents plus term
deposits
Payments from cash flow of operating and financial activities
(9.27%)
Balranald Shire Council Statement of Financial Ratios
> 1.50x 3.96 3.59 3.46 4.91 5.20
(7.78%) (5.57%) (5.95%) (5.51%) (5.77%)(5.51%)
4.91
CONSOLIDATED COUNCIL
> 0.00% (9.87%) (13.57%) (11.19%)
48.72%
3.47 3.79 3.75 4.82
> 2.00x 32.63 31.98 36.70
> 60.00% 29.22% 46.32% 47.41%
N/a N/a
49.83% 51.12% 51.43% 51.90% 52.69%52.24%
N/a
6.18%
42.63 48.85 58.54 N/a
> 3 months 9.10 8.83 8.84
< 10.00% 6.45% 6.67% 6.42%
14.56
5.96% 5.74% 5.69% 5.64% 4.92%5.59%
13.209.83 9.76 11.05 11.31 13.07
P a g e | 26
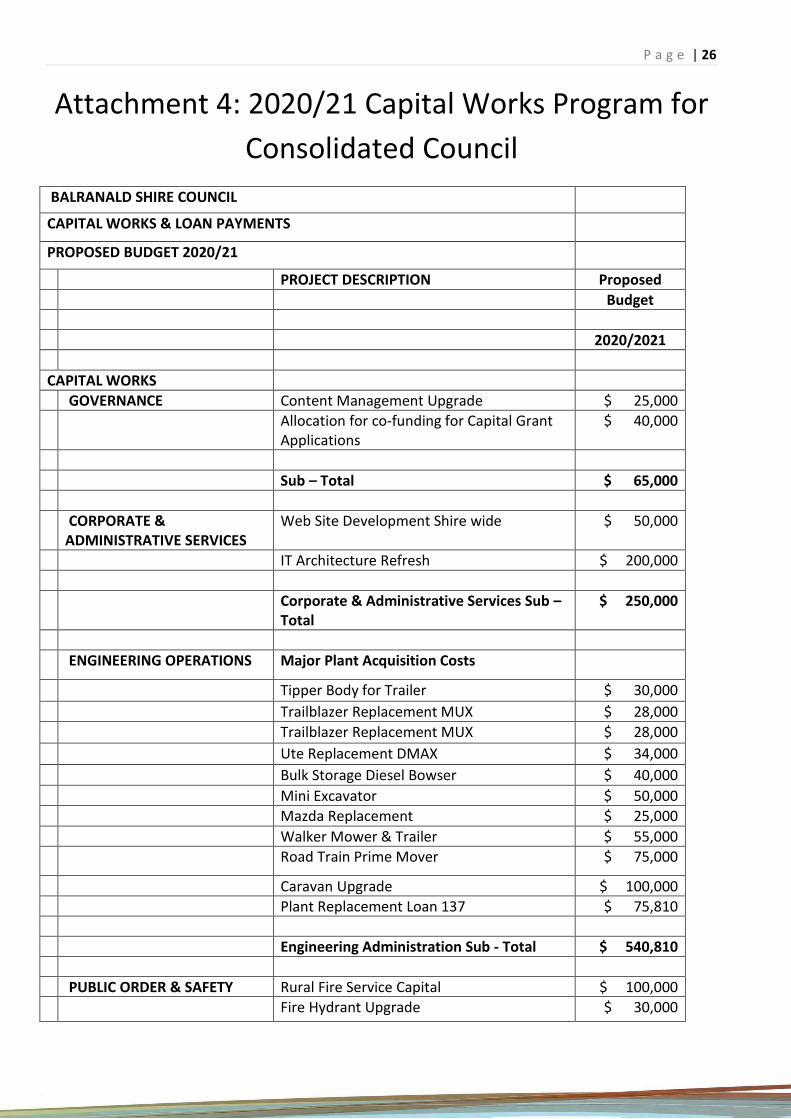
Attachment 4: 2020/21 Capital Works Program for
Consolidated Council
BALRANALD SHIRE COUNCIL
CAPITAL WORKS & LOAN PAYMENTS
PROPOSED BUDGET 2020/21
PROJECT DESCRIPTION Proposed
Budget
2020/2021
CAPITAL WORKS
GOVERNANCE Content Management Upgrade $ 25,000
Allocation for co-funding for Capital Grant Applications
$ 40,000
Sub – Total $ 65,000
CORPORATE & ADMINISTRATIVE SERVICES
Web Site Development Shire wide $ 50,000
IT Architecture Refresh $ 200,000
Corporate & Administrative Services Sub – Total
$ 250,000
ENGINEERING OPERATIONS Major Plant Acquisition Costs
Tipper Body for Trailer $ 30,000
Trailblazer Replacement MUX $ 28,000
Trailblazer Replacement MUX $ 28,000
Ute Replacement DMAX $ 34,000
Bulk Storage Diesel Bowser $ 40,000
Mini Excavator $ 50,000
Mazda Replacement $ 25,000
Walker Mower & Trailer $ 55,000
Road Train Prime Mover $ 75,000
Caravan Upgrade $ 100,000
Plant Replacement Loan 137 $ 75,810
Engineering Administration Sub - Total $ 540,810
PUBLIC ORDER & SAFETY Rural Fire Service Capital $ 100,000
Fire Hydrant Upgrade $ 30,000
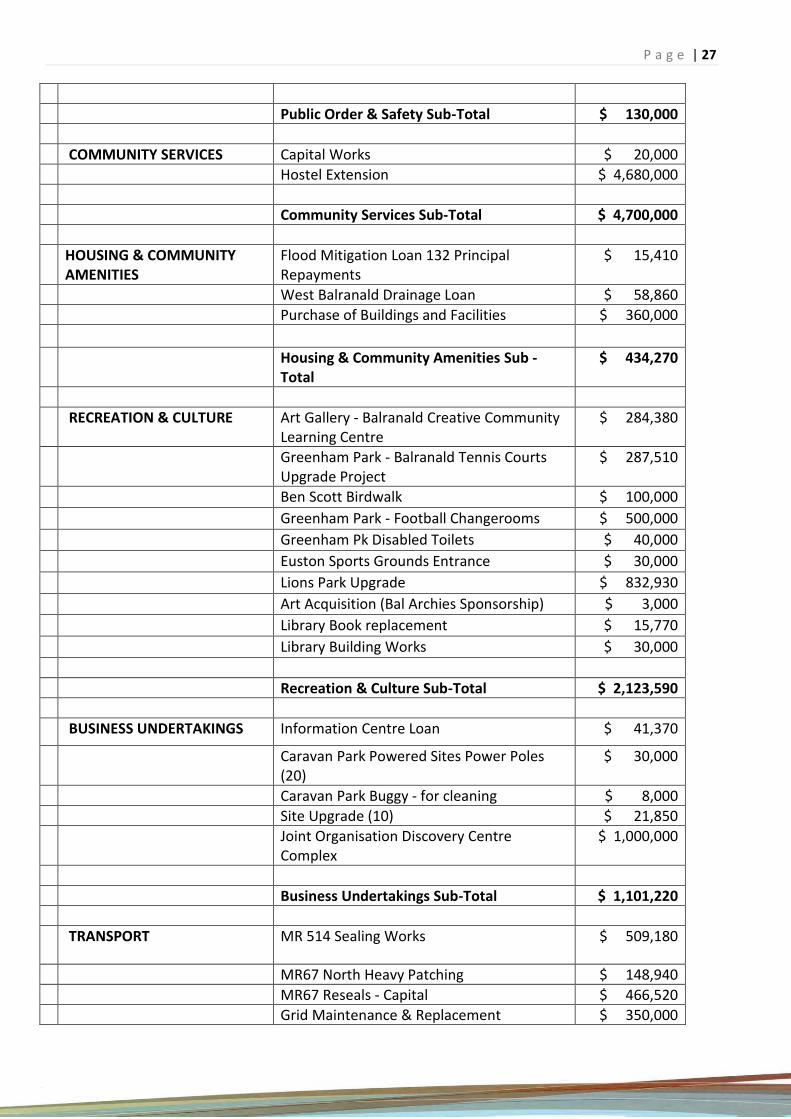
P a g e | 27
Public Order & Safety Sub-Total $ 130,000
COMMUNITY SERVICES Capital Works $ 20,000
Hostel Extension $ 4,680,000
Community Services Sub-Total $ 4,700,000
HOUSING & COMMUNITY AMENITIES
Flood Mitigation Loan 132 Principal Repayments
$ 15,410
West Balranald Drainage Loan $ 58,860
Purchase of Buildings and Facilities $ 360,000
Housing & Community Amenities Sub - Total
$ 434,270
RECREATION & CULTURE Art Gallery - Balranald Creative Community Learning Centre
$ 284,380
Greenham Park - Balranald Tennis Courts Upgrade Project
$ 287,510
Ben Scott Birdwalk $ 100,000
Greenham Park - Football Changerooms $ 500,000
Greenham Pk Disabled Toilets $ 40,000
Euston Sports Grounds Entrance $ 30,000
Lions Park Upgrade $ 832,930
Art Acquisition (Bal Archies Sponsorship) $ 3,000
Library Book replacement $ 15,770
Library Building Works $ 30,000
Recreation & Culture Sub-Total $ 2,123,590
BUSINESS UNDERTAKINGS Information Centre Loan $ 41,370
Caravan Park Powered Sites Power Poles (20)
$ 30,000
Caravan Park Buggy - for cleaning $ 8,000
Site Upgrade (10) $ 21,850
Joint Organisation Discovery Centre Complex
$ 1,000,000
Business Undertakings Sub-Total $ 1,101,220
TRANSPORT MR 514 Sealing Works $ 509,180
MR67 North Heavy Patching $ 148,940
MR67 Reseals - Capital $ 466,520
Grid Maintenance & Replacement $ 350,000
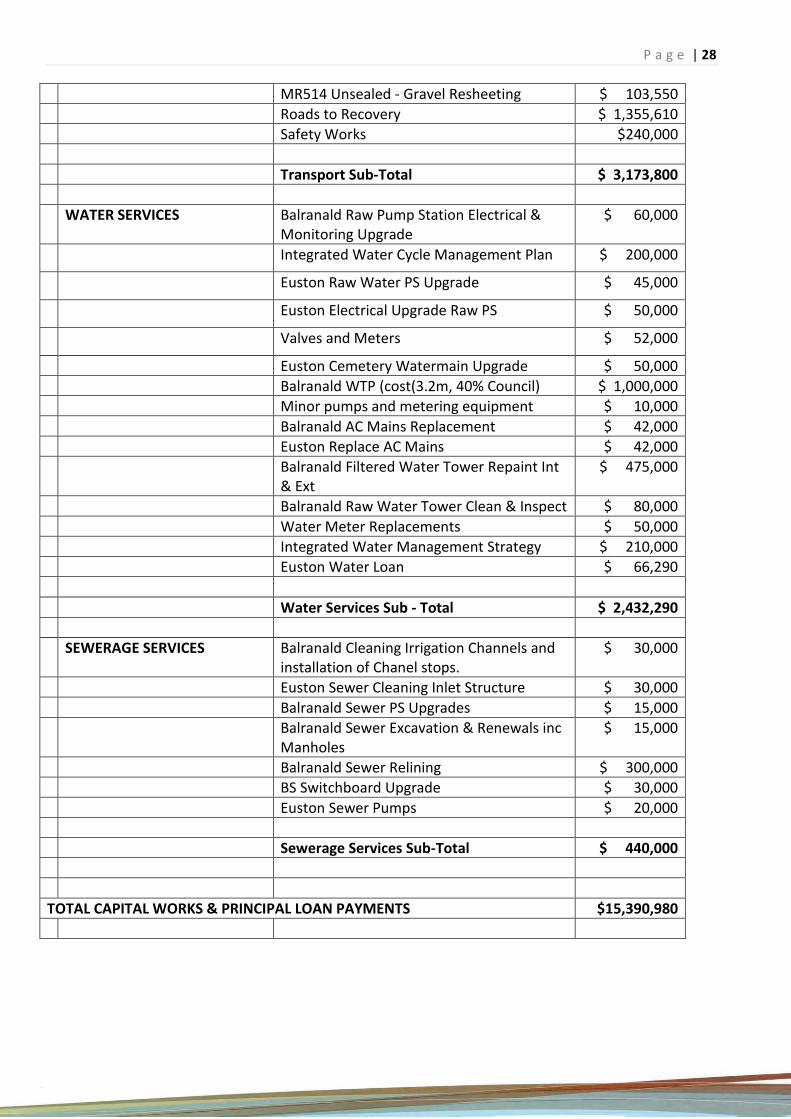
P a g e | 28
MR514 Unsealed - Gravel Resheeting $ 103,550
Roads to Recovery $ 1,355,610
Safety Works $240,000
Transport Sub-Total $ 3,173,800
WATER SERVICES Balranald Raw Pump Station Electrical & Monitoring Upgrade
$ 60,000
Integrated Water Cycle Management Plan $ 200,000
Euston Raw Water PS Upgrade $ 45,000
Euston Electrical Upgrade Raw PS $ 50,000
Valves and Meters $ 52,000
Euston Cemetery Watermain Upgrade $ 50,000
Balranald WTP (cost(3.2m, 40% Council) $ 1,000,000
Minor pumps and metering equipment $ 10,000
Balranald AC Mains Replacement $ 42,000
Euston Replace AC Mains $ 42,000
Balranald Filtered Water Tower Repaint Int & Ext
$ 475,000
Balranald Raw Water Tower Clean & Inspect $ 80,000
Water Meter Replacements $ 50,000
Integrated Water Management Strategy $ 210,000
Euston Water Loan $ 66,290
Water Services Sub - Total $ 2,432,290
SEWERAGE SERVICES Balranald Cleaning Irrigation Channels and installation of Chanel stops.
$ 30,000
Euston Sewer Cleaning Inlet Structure $ 30,000
Balranald Sewer PS Upgrades $ 15,000
Balranald Sewer Excavation & Renewals inc Manholes
$ 15,000
Balranald Sewer Relining $ 300,000
BS Switchboard Upgrade $ 30,000
Euston Sewer Pumps $ 20,000
Sewerage Services Sub-Total $ 440,000
TOTAL CAPITAL WORKS & PRINCIPAL LOAN PAYMENTS $15,390,980