Embed Size (px)
Citation preview
Loughborough UniversityInstitutional Repository
Health care processmodelling: which method
when?
This item was submitted to Loughborough University's Institutional Repositoryby the/an author.
Citation: JUN, G.T., WARD, J.R. and MORRIS, Z., 2009. Health careprocess modelling: which method when? International Journal for Quality inHealth Care, 2009, 21(3), pp. p214 - 224
Additional Information:
• This is a pre-copy-editing, author-produced PDF of an article acceptedfor publication in International Journal for Quality in Health Carefollowing peer review. The definitive publisher-authenticated version,JUN, G.T., WARD, J.R. and MORRIS, Z., 2009. Health care pro-cess modelling: which method when? International Journal for Qual-ity in Health Care, 2009, 21(3), pp. p214 - 224 is available online at:http://dx.doi.org/10.1093/intqhc/mzp016
Metadata Record: https://dspace.lboro.ac.uk/2134/9549
Version: Accepted for publication
Publisher: c© Oxford University Press
Please cite the published version.
This item was submitted to Loughborough’s Institutional Repository (https://dspace.lboro.ac.uk/) by the author and is made available under the
following Creative Commons Licence conditions.
For the full text of this licence, please go to: http://creativecommons.org/licenses/by-nc-nd/2.5/

1
Health care process modelling: which method when?
Running title: Health care process modelling
2
Title: Health care process modelling: which method when?
Running title: Health care process modelling
Objective: The role of process modelling has been widely recognised for effective
quality improvement. However, application in health care is somewhat limited since
health care lacks knowledge about a broad range of methods and their applicability to
health care. Therefore, the objectives of this paper are to present a summary
description of a limited number of distinct modelling methods and evaluate how
health care workers perceive them.
Methods: Various process modelling methods from several different disciplines were
reviewed and characterised. Case studies in three different health care scenarios were
carried out to model those processes and evaluate how health care workers perceive
the usability and utility of the process models.
Results: Eight distinct modelling methods were identified and characterised by what
the modelling elements in each explicitly represents. Flowcharts, which had been
most extensively used by the participants, were most favoured in terms of their
usability and utility. However, some alternative methods, although having been used
by a much smaller number of participants, were considered to be helpful specifically
in understanding certain aspects of complex processes e.g. communication diagrams
for understanding interactions, swim lane activity diagrams for roles and
responsibilities and state transition diagrams for a patient-centred perspective.
Discussion: We believe that it is important to make the various process modelling
methods more easily accessible to health care by providing clear guidelines or
computer-based tool support for health care-specific process modelling. These
supports can assist health care workers to apply initially unfamiliar, but eventually
more effective modelling methods.
Word count: 248 (abstract), 3,465 (main body excluding abstract, references, tables
and figure)
Keywords: Process modelling, process diagrams, quality improvement, systems
understanding
3
Health care systems around the world are under pressure to reform and to improve the
quality of service delivery. Care should be safe, effective, patient-centred, timely,
efficient and equitable [1]. There is increasing recognition that developing good
systems understanding of how the care process works is an essential step to effective
quality improvement [2, 3], but such a systems understanding is often lacking in
health care [4]. In other sectors various types of process models, i.e. process diagrams,
have been developed and applied to assist the understanding of how people and
resources interact to achieve outcomes, to redesign processes or to communicate
prescriptive actions within a complex process [5-9]. The major aims of process
modelling in the context of quality improvement can be summarised in two directions,
first, to assist understanding of a process in order to identify areas of improvement,
and second, to help document existing or planned processes to ensure a shared
understanding which can eventually assist quality improvement.
Despite this recognition of the value of modelling, applications in health care have
inclined too heavily toward flowcharts or hierarchical task analysis [10-14] or have
been made in isolated situations without understanding of various process modelling
methods or without consideration of potential users (health care practitioners) [15-18].
Therefore the need has been raised for better application of process modelling to the
planning of health care delivery [3, 4]. In England for example, developments such as
National Service Frameworks (NSFs) [19], clinical guidelines [20] and an increasing
emphasis on care pathways [21] typically use no or only a narrow range of process
modelling methods; mostly some form of flowchart.
The NHS Institute for Innovation and Improvement, which “supports the NHS to
transform health care…by rapidly developing and spreading new ways of working,
new technology and world-class leadership”, (http://www.institute.nhs.uk/), places
considerable emphasis on process modelling, including supporting a library for the
“process modelling community”. They state that because processes, especially health
care processes, are varied and complex “It is not surprising to discover that process
modelling approaches differ in their applicability to this spectrum of process types”
[22]. They add that “some diagrams are well suited to describing stable procedures,
some are focussed on processes where computers play a substantial role, others are
more suitable for modelling processes where human interaction is dominant, and a
few can reflect more complex and dynamic situations” [22]. When advising on the use
4
of modelling to address particular issues, however, they too present only flow
diagrams [23].
Given the variation in health care processes, we argue that the sole use of flow
diagrams limits the potential impact of process modelling on improving health care
provision and there are additional methods which could be usefully applied. On closer
inspection these diagram types very often differ only in their names, and are
semantically identical. Thus, we suggest that, whilst a greater range of methods than
flowcharts is potentially useful, health care workers need to be familiar with only a
limited number of distinct modelling methods to describe, and thereby improve, their
care process.
However, developing a methodology for making the most of these methods – i.e.
knowing when to use which modelling method – is not straightforward. There are a
large number of different methods used in various domains [24-26] and users in
different domains could have different experience and preference. Many researchers
in systems / software engineering developed various frameworks to categorise them:
structural and behavioural [6]; vision, process, structure and behaviour [26], data,
function, network, people, time and motivation [27], and organisation, data, control,
function and product/service [28]. We think these categorisations are too broad and
general to be readily helpful for health care workers to tell the difference between
modelling methods.
Even after understanding the differences, a degree of experimentation has been
considered often necessary to decide which modelling methods best suit users’ needs
and context [28]. However, this kind of experimentation can involve many challenges
and complexities. For example, a model's comprehensibility may very much depend
on how the model was generated (team or individual-based), the way the modeller
communicates with the users (interactively or one-sidedly) and the degree of tool
support (paper or computer-based) [29]. It could be even more so in health care where
there is very restricted access to potential users.
This paper aims to assist health care workers to understand different utility and
limitations of the limited number of distinct modelling methods so that they can select
process modelling methods which are most appropriate to their needs. To do this we
present a summary description of eight different modelling methods selected to
represent most of primary functions of process modelling. Secondly, through the

5
diagram evaluation, we describe health care workers’ perceptions of how easily
understandable and how useful each diagram type is for gaining a better
understanding of care processes.
METHODS
We reviewed the literature on process modelling methods to identify methods with
distinct differences. Multiple literature search strategies were employed to cover a
number of disciplinary boundaries such as software engineering, systems engineering,
business process modelling and operations management. This included searching
electronic databases (Pub-Med, Web of Knowledge), grey literature from either health
care or other industries and following the ‘reference trail’ provided by published
materials as well as searching multiple websites (Google/ Google Scholar). A great
number of journal articles on mathematical modelling were filtered out since they
were beyond the scope of this research. Whilst journal papers provided a great
number of variations adapted for specific contexts, printed books provided an overall
view on original, principal modelling methods rather than the adapted variations.
Various modelling methods were characterised by their main features and eight
distinct modelling methods were identified. They were applied to three health care
scenarios: a patient discharge process from a ward (from a hospital to a community
setting); a diabetic patient care process (in a general practitioner (GP) practice); and a
prostate cancer patient diagnostic process (in a hospital). The multiple case studies
were carried out to gain insights with a sufficient degree of generality to allow their
projection to other contexts. All three cases had a large number of information
interactions and patient transfers within or between departments, which are regarded
as huge potential risks to the patient [30].
Process models were generated by one researcher (GJ) in collaboration with one to
four key health care workers per scenario. Semi-structured interviews (three to four
one-hour interviews per scenario) were carried out to collect the information about the
processes. National or local policy documents were identified during the interviews
and used to build a high-level general understanding of the care processes to be
modelled. For the patient discharge scenario only, observation was additionally
carried out by attending two multidisciplinary team meetings and shadowing two
pharmacists' ward-rounds.
6
Building and validating the eight different models for each scenario, the researcher
(GJ) explained each of the models to a range of clinical and non-clinical staff (n=29).
The participants were first asked whether they have used or generated the modelling
methods before and then asked to evaluate the usability and utility of them: seventeen
participants for the patient discharge process; six for the diabetic patient care process
and six for the prostate cancer patient diagnostic process. Most of the evaluations
were carried out in one-on-one sessions using a structured interview/questionnaire and
took forty minutes to one and half hours.
During the evaluation, participants were asked to rate their agreement on a five-point
scale (strongly agree = 5 to strongly disagree = 1) with the two statements: “This
diagram is easily understandable (usability)” and “This diagram is helpful in better
understanding and communicating how the care process works (utility in better
system understanding)”. The first statement was adopted to evaluate the diagrams’
comprehensibility by asking how easily understandable each diagram was. The
second statement was adopted to evaluate the general utility of each diagram for
system understanding. The participants were also invited to comment verbally on why
they had made the particular rating, including what they thought were the strengths
and weaknesses of each diagram. Their comments were audio-recorded.
The in-depth qualitative feedback about the usability and utility of each diagram as
well as the quantitative ratings (the level of agreement with the statements) were
collected and analysed. A (3×10) mixed ANOVA (case study×diagram types) was
used to investigate the effect of the case study on the response patterns for each
statement. The response patterns were analysed and compared using percentage
agreement as a measure.
The study took place in Cambridgeshire, England with approval from the Cambridge
Local Research Ethics Committee.
RESULTS
Summary of diagram characterisation
A large range of process modelling methods has been developed by various groups of
researchers to describe different types and aspects of systems. For example, human
factors specialists have used a range of task-analysis methods with a special interest in
7
understanding interactions between physical devices and individual behaviour. These
methods include input-output diagrams, process charts, functional flow diagrams,
information flow charts, etc [31]. In the field of management science, many process
models have been developed to improve business processes on their own or in
conjunction with simulation techniques. These methods include process maps, activity
cycle diagrams, stock flow diagrams, etc [32, 33].
Various groups of software and systems engineers have also developed many types of
modelling methods since the 1970s to design and analyse complex systems. These
methods, which consist of several different individual diagram types, include
Structured Analysis and Design (SA/SD), Integrated Definitions (IDEF) and Object-
Oriented Method (OOM).
Collective efforts have been made since 1997 by software and systems engineers to
unify diverse modelling methods [25]. The efforts toward unifying modelling
languages were realised by the Unified Modeling Language (UML) for software
engineering and the Systems Modeling Language (SysML) for broader domains
including hardware, software, information, processes, personnel and facilities.
Analysing the collection of various modelling methods used across the disciplines, we
found two things. First, the majority of the modelling methods used in different
disciplines differ only in their names, but very often represent semantically identical
aspects of a system. Second, the modelling languages developed in software and
systems engineering cover most of modelling method variations used in other
disciplines. We therefore identified principal modelling methods based on SA/SD,
IDEF, UML and SysML.
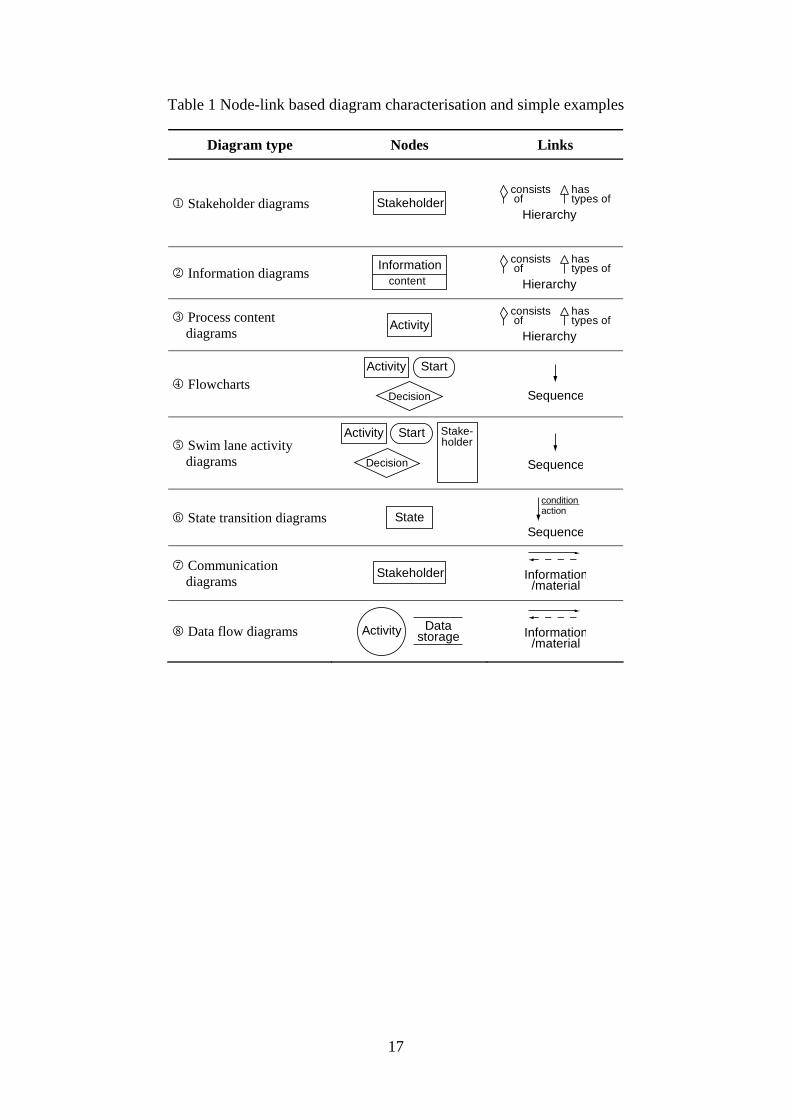
Through the comparison of what each method semantically represents, eight diagram
types with distinct differences were identified and summarised in Table 1. Nodes
(boxes and circles) mainly describe stakeholders, information, activities or states,
whereas links (connecting lines between nodes) represent hierarchy, sequence or
information/material interactions. It is the particular combination of these nodes and
links that lends each method its distinctive features and particular value.
INSERT TABLE 1 ABOUT HERE
The first three diagram types (stakeholder diagrams, information diagrams and
process content diagrams) show hierarchical links between stakeholders, information
8
and activities, respectively. These structural models are equivalent to entity relation
diagrams, IDEF1 and UML class diagrams.
The second three diagram types (flowcharts, swim lane activity diagrams and state
transition diagrams) address some limitations of the static nature of the hierarchical-
link diagrams by showing sequential links of activities or states. Flowcharts are
equivalent to IDEF3 process description diagrams and UML activity diagrams,
whereas state transition diagrams are equivalent to IDEF3 object state transition
network diagrams and UML state machine diagrams.
The last two diagram types (communication diagrams and data flow diagrams)
describe information inputs and outputs between stakeholders or activities
respectively. Communication diagrams are UML communication diagrams, whereas
data flow diagrams are equivalent to SA/SD data flow diagrams and IDEF0.
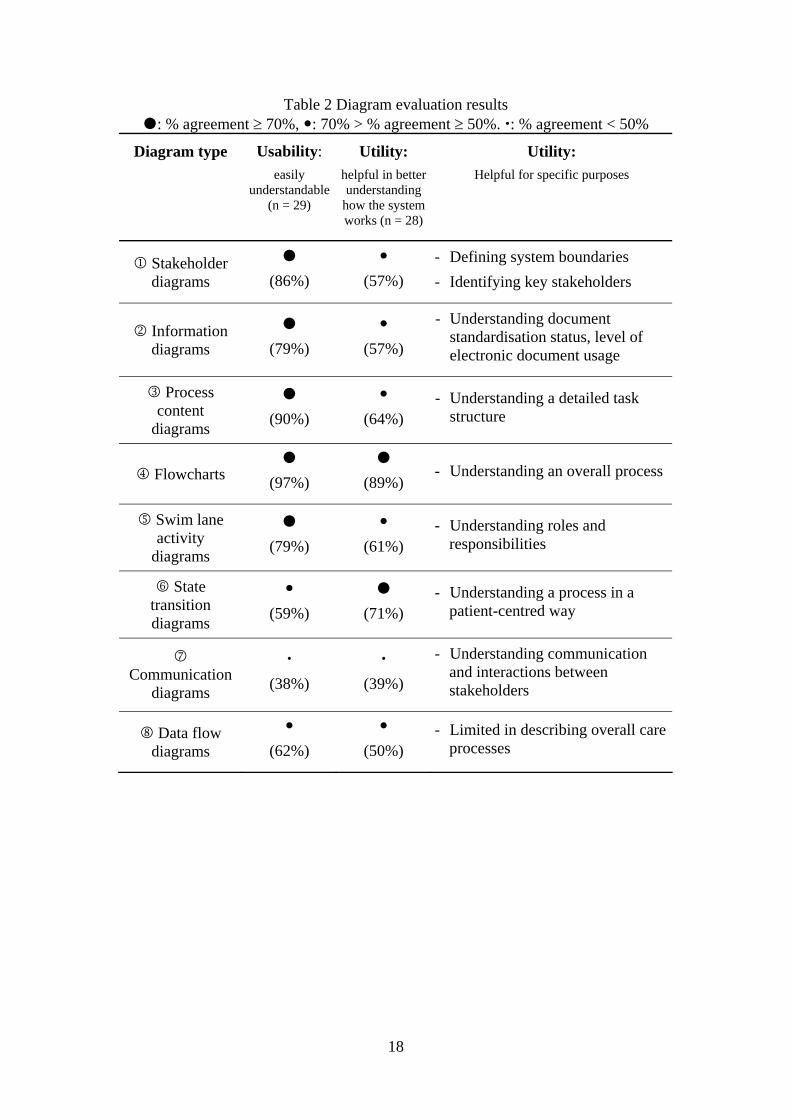
The evaluation results of the eight diagram types are reported below based on the
participants’ ratings and comments.
Summary of process modelling and evaluation The survey on the participants’ previous experience with the modelling methods
showed that flowcharts and swim lane activity diagrams had been previously used by
the largest number of the participants (76%), whereas state transition diagrams,
communication diagrams and data flow diagrams formed the least previously used
types (21%, 14% and 21% of the participants). Around half of the participants (48%)
had prior experience with the three hierarchical link diagrams (stakeholder diagrams,
information diagrams and process content diagrams).
The response patterns from the three case studies did not vary significantly
(F(2,26)=2.49, p>0.05 for usability, F(2,25) = 0.96, p>0.05 for utility) so the
aggregated responses from three cases are reported here. Table 2 shows the
percentage agreement (either ‘agreed’ or ‘strongly agreed’) with the two statements
on usability and utility along with the participants’ comments on the specific utilities.
Overall, the greatest number of participants rated flowcharts as easily understandable
(97% agreement) and helpful in understanding their processes (89% agreement).
However, other alternative methods were perceived to be more helpful in
understanding certain specific aspects of complex processes. The process models of
9
each diagram type (based on the simplified patient discharge process) are included
and further findings for each diagram type are reported below.
INSERT TABLE 2 ABOUT HERE
First, the three hierarchical-link diagrams (stakeholder diagrams, information
diagrams and process content diagrams) were generally considered to be simple
enough to be easily understandable (86%, 79% and 90% agreement respectively), but
not able to provide sufficient information to be helpful in understanding how the care
process works (57%, 57% and 64% agreement respectively).
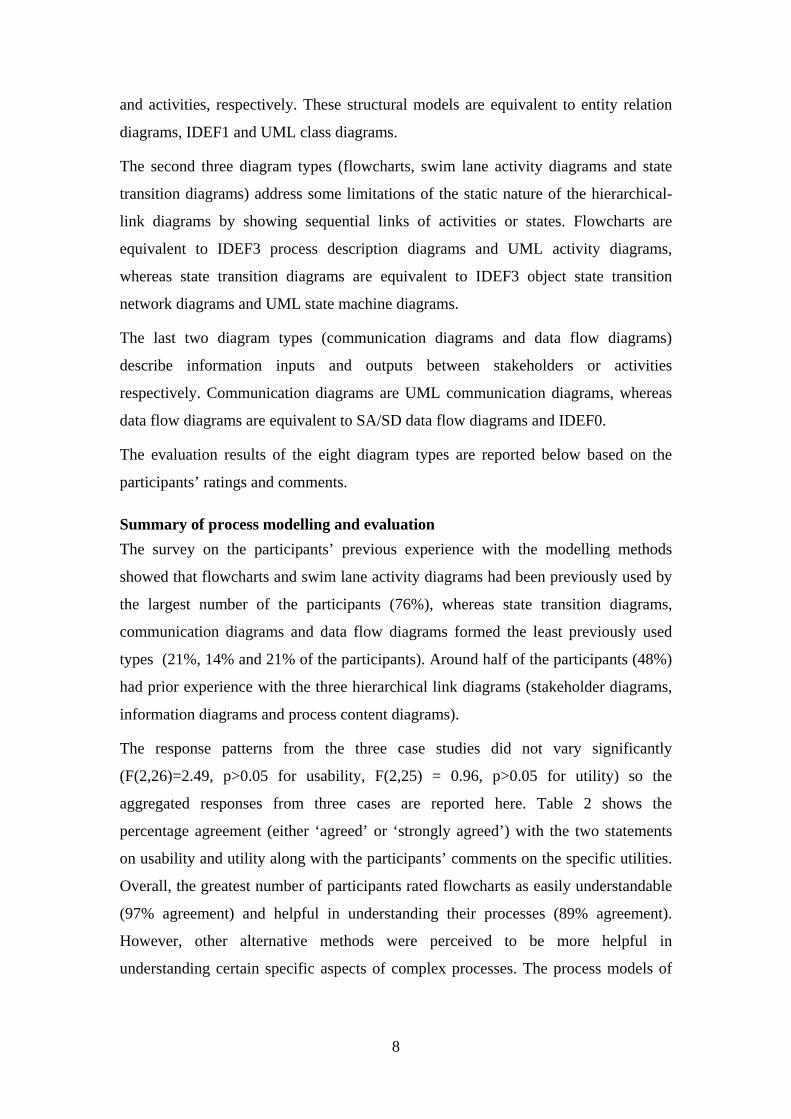
Stakeholder diagrams Stakeholder diagrams show how stakeholders are hierarchically structured like
organisation charts. Figure 1 shows who is involved in a patient discharge process and
of whom a multidisciplinary team consists. The participants saw these as helpful in
identifying key stakeholders and defining system boundaries.
INSERT FIGURE 1 ABOUT HERE
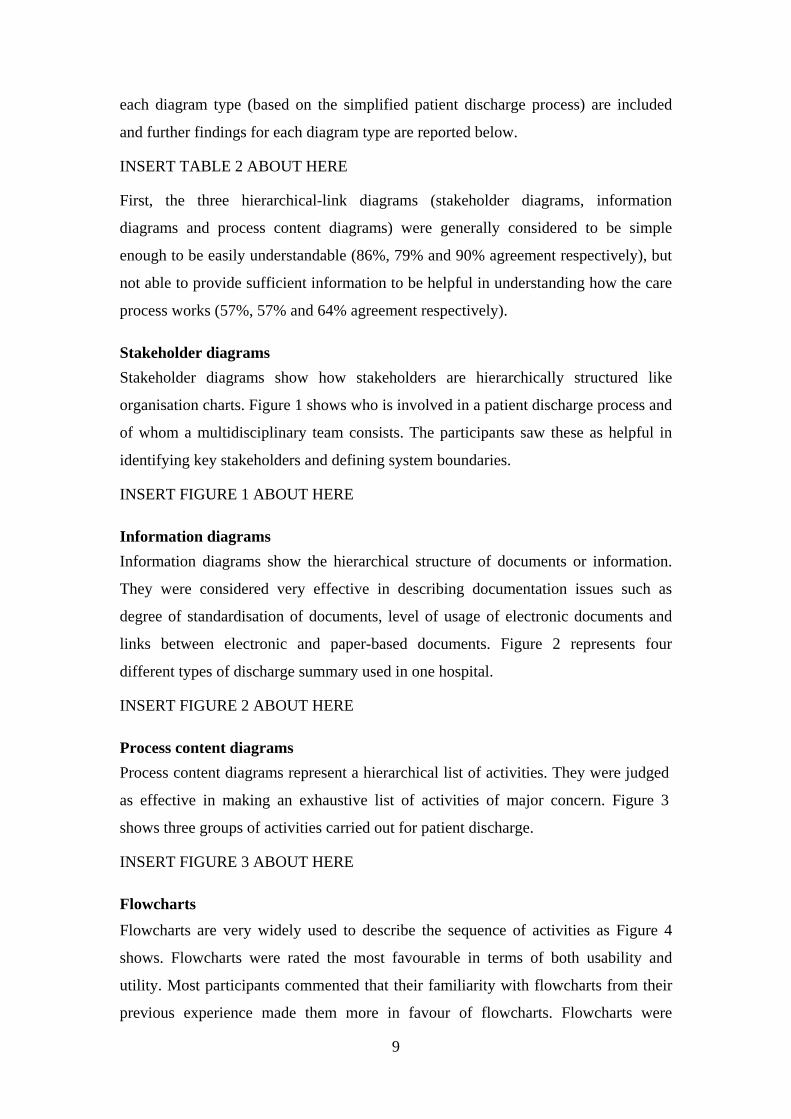
Information diagrams Information diagrams show the hierarchical structure of documents or information.
They were considered very effective in describing documentation issues such as
degree of standardisation of documents, level of usage of electronic documents and
links between electronic and paper-based documents. Figure 2 represents four
different types of discharge summary used in one hospital.
INSERT FIGURE 2 ABOUT HERE
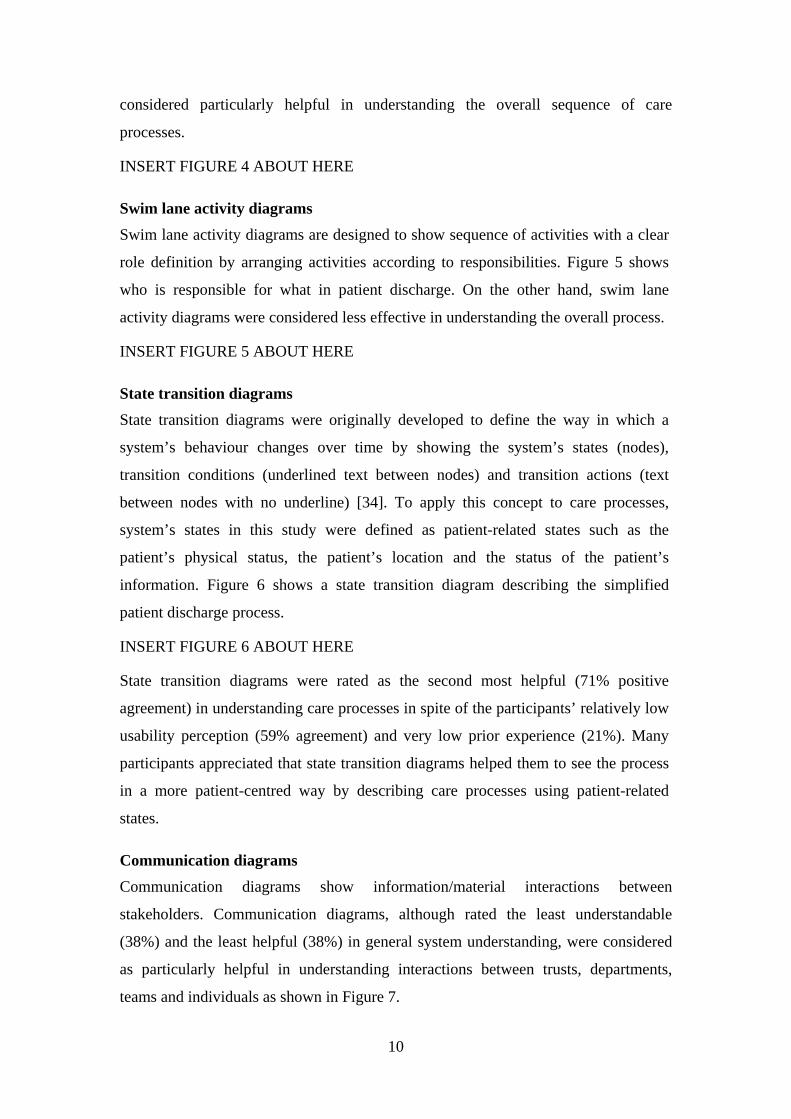
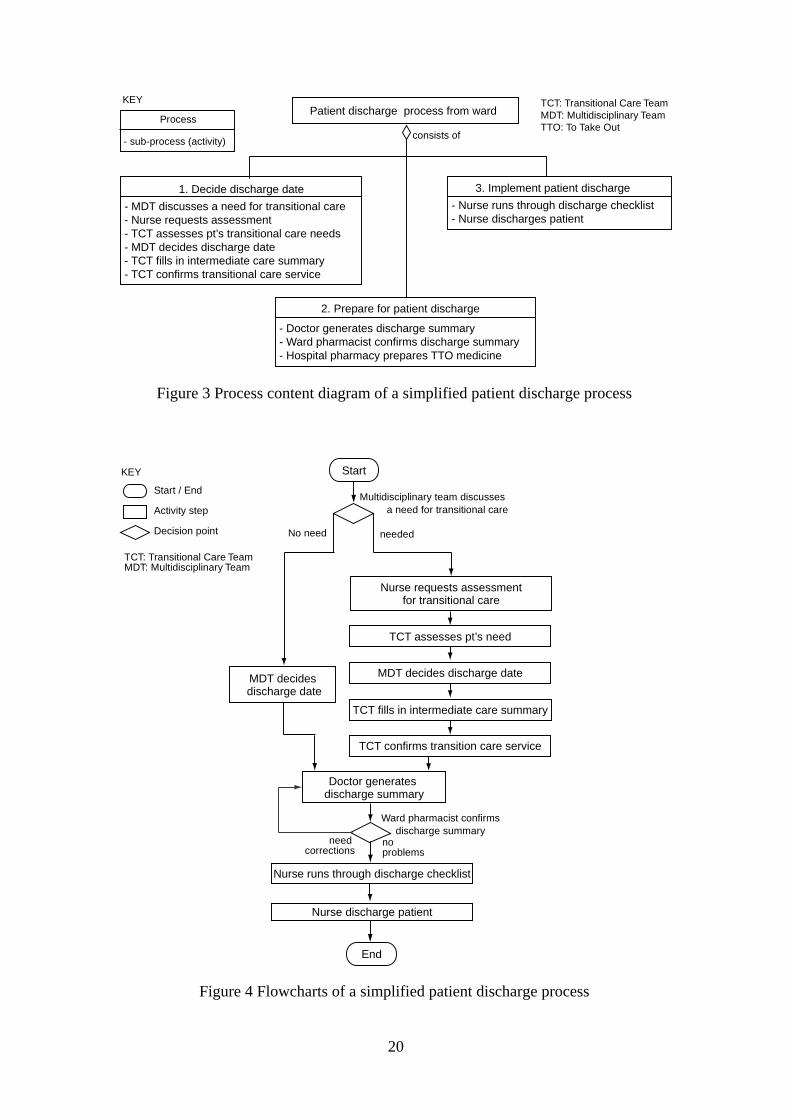
Process content diagrams Process content diagrams represent a hierarchical list of activities. They were judged
as effective in making an exhaustive list of activities of major concern. Figure 3
shows three groups of activities carried out for patient discharge.
INSERT FIGURE 3 ABOUT HERE
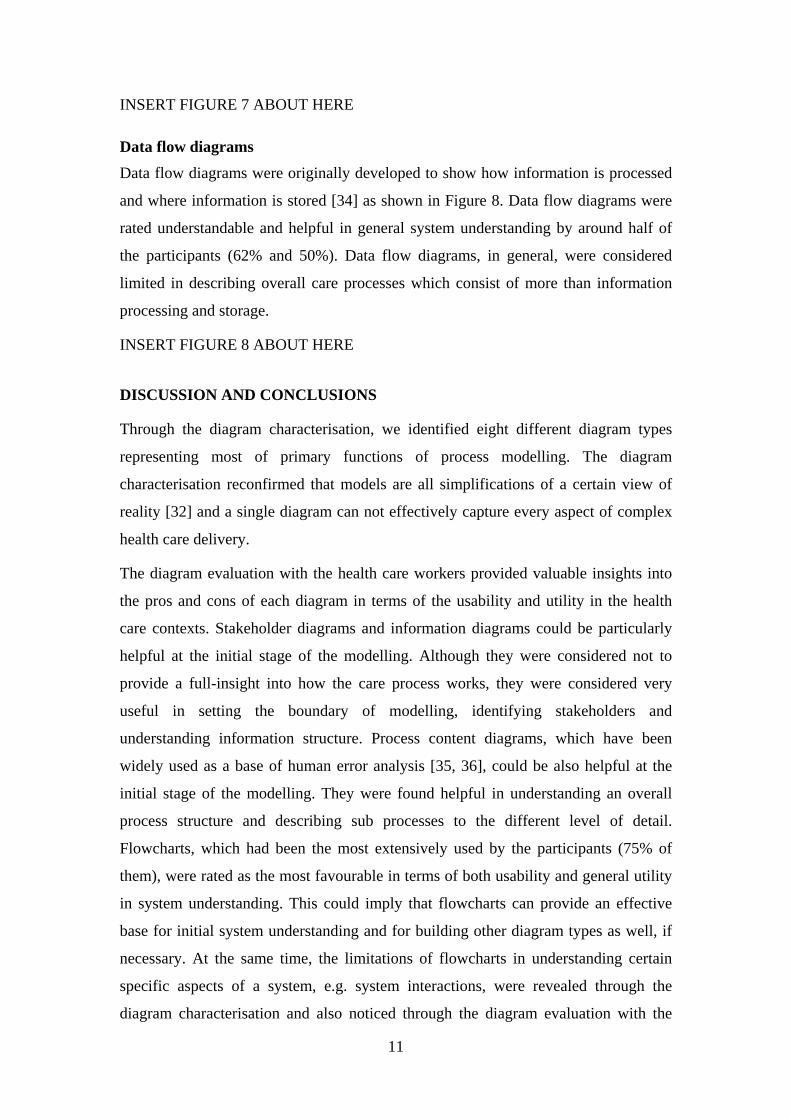
Flowcharts Flowcharts are very widely used to describe the sequence of activities as Figure 4
shows. Flowcharts were rated the most favourable in terms of both usability and
utility. Most participants commented that their familiarity with flowcharts from their
previous experience made them more in favour of flowcharts. Flowcharts were
10
considered particularly helpful in understanding the overall sequence of care
processes.
INSERT FIGURE 4 ABOUT HERE
Swim lane activity diagrams Swim lane activity diagrams are designed to show sequence of activities with a clear
role definition by arranging activities according to responsibilities. Figure 5 shows
who is responsible for what in patient discharge. On the other hand, swim lane
activity diagrams were considered less effective in understanding the overall process.
INSERT FIGURE 5 ABOUT HERE
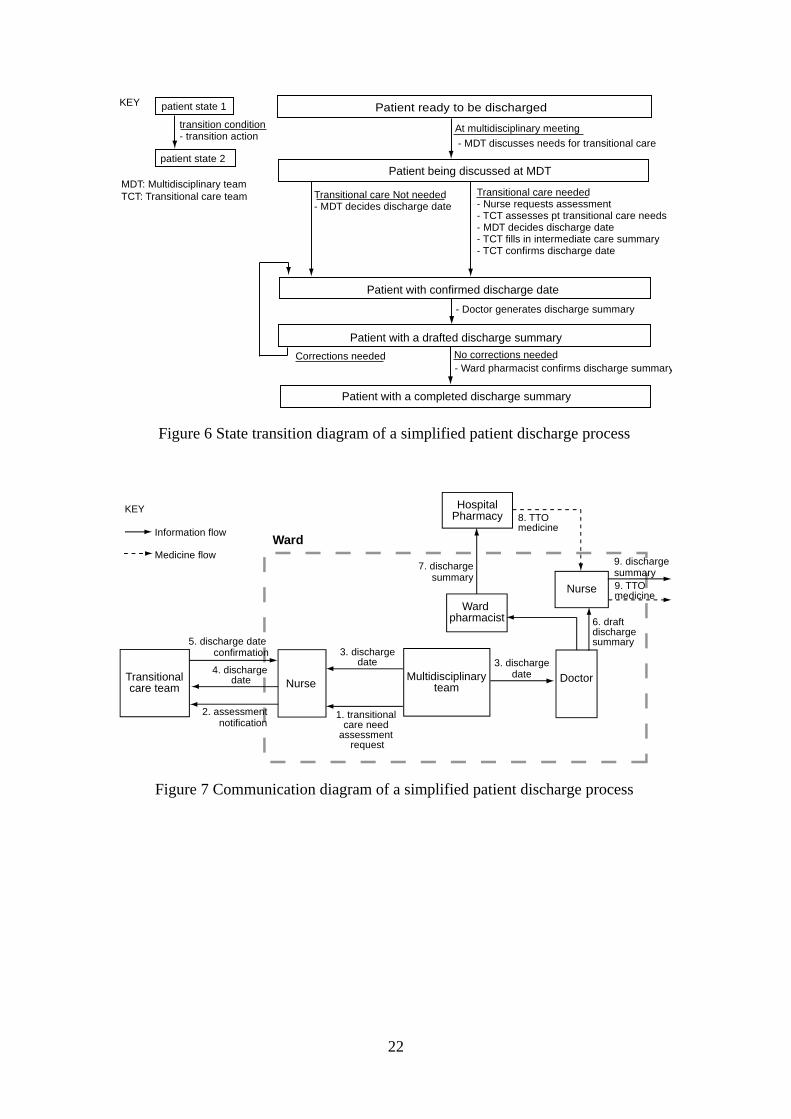
State transition diagrams State transition diagrams were originally developed to define the way in which a
system’s behaviour changes over time by showing the system’s states (nodes),
transition conditions (underlined text between nodes) and transition actions (text
between nodes with no underline) [34]. To apply this concept to care processes,
system’s states in this study were defined as patient-related states such as the
patient’s physical status, the patient’s location and the status of the patient’s
information. Figure 6 shows a state transition diagram describing the simplified
patient discharge process.
INSERT FIGURE 6 ABOUT HERE
State transition diagrams were rated as the second most helpful (71% positive
agreement) in understanding care processes in spite of the participants’ relatively low
usability perception (59% agreement) and very low prior experience (21%). Many
participants appreciated that state transition diagrams helped them to see the process
in a more patient-centred way by describing care processes using patient-related
states.
Communication diagrams Communication diagrams show information/material interactions between
stakeholders. Communication diagrams, although rated the least understandable
(38%) and the least helpful (38%) in general system understanding, were considered
as particularly helpful in understanding interactions between trusts, departments,
teams and individuals as shown in Figure 7.
11
INSERT FIGURE 7 ABOUT HERE
Data flow diagrams Data flow diagrams were originally developed to show how information is processed
and where information is stored [34] as shown in Figure 8. Data flow diagrams were
rated understandable and helpful in general system understanding by around half of
the participants (62% and 50%). Data flow diagrams, in general, were considered
limited in describing overall care processes which consist of more than information
processing and storage.
INSERT FIGURE 8 ABOUT HERE
DISCUSSION AND CONCLUSIONS
Through the diagram characterisation, we identified eight different diagram types
representing most of primary functions of process modelling. The diagram
characterisation reconfirmed that models are all simplifications of a certain view of
reality [32] and a single diagram can not effectively capture every aspect of complex
health care delivery.
The diagram evaluation with the health care workers provided valuable insights into
the pros and cons of each diagram in terms of the usability and utility in the health
care contexts. Stakeholder diagrams and information diagrams could be particularly
helpful at the initial stage of the modelling. Although they were considered not to
provide a full-insight into how the care process works, they were considered very
useful in setting the boundary of modelling, identifying stakeholders and
understanding information structure. Process content diagrams, which have been
widely used as a base of human error analysis [35, 36], could be also helpful at the
initial stage of the modelling. They were found helpful in understanding an overall
process structure and describing sub processes to the different level of detail.
Flowcharts, which had been the most extensively used by the participants (75% of
them), were rated as the most favourable in terms of both usability and general utility
in system understanding. This could imply that flowcharts can provide an effective
base for initial system understanding and for building other diagram types as well, if
necessary. At the same time, the limitations of flowcharts in understanding certain
specific aspects of a system, e.g. system interactions, were revealed through the
diagram characterisation and also noticed through the diagram evaluation with the
12
health care workers. Swim lane activity diagrams were considered especially helpful
in obtaining a clear understanding of roles in various tasks, which is essential in
effective multidisciplinary teamwork [37].
Some alternative diagram types, in spite of the participants’ much less prior
experience with them, were perceived particularly helpful in understanding certain
aspects of care processes. For example, state transition diagrams, in particular, were
considered to have great potential utility in understanding care processes in a patient-
centred way and patient-centeredness has been known to be crucial for good quality
care [38, 39]. Communication diagrams were considered to be very helpful in
understanding interaction issues between people, teams and departments, which have
been frequently one of the major causes of patient safety problems [40, 41]. Data flow
diagrams, which have primarily been used to represent human-machine interactions
[42], were considered not very helpful in understanding general care delivery
processes which are not always data-driven. Data flow diagrams, however, still can be
very useful in specifically representing human-medical device interactions in health
care, where data interactions are main drivers.
Some of the diagram types identified in this study, although considered as very
helpful for understanding certain aspects of complex care processes, were found
difficult for some health care workers, especially with limited or no prior experience
to understand and could be even more challenging to build. We believe it is important
to make such process modelling methods more accessible to health care to
accommodate the complex health care quality issues. We believe that clear guidelines
or computer-based tool supports for health care-specific process modelling could
reduce barriers in generating and understating such diagram types. There are many
modelling tools in the market from general diagramming tools to more sophisticated
business modelling tools, which allow users to generate all the eight diagram types
identified in this paper. However, we believe such various diagram types could be
best utilised in health care only when users are aware of the health care-specific utility
and usability of each diagram type and make an extra efforts to apply initially
unfamiliar, but eventually more effective diagram types.
Although there are some limitations in this study due to the challenges in having
access to health care workers (relatively small sample size and perception-based

13
evaluation), we believe that this study provide valuable insight into how health care
can make the most of process modelling methods.
ACKNOWLEDGEMENTS
We would like to thank the participants from Cambridge University Hospitals NHS
Foundation Trust, Hinchingbrooke Health Care NHS Trust, Firs House Surgery in
Cambridge UK and Cambridge Local Research Ethics Committee for their support
through this study. We also specially thank Janet Watkinson, Dr Jonathan Graffy and
Dr Melinda Lyons for their support and contributions to discussion. This study was
funded by British Council (PhD scholarship) and the Engineering Physical Science
Research Council.
Ethics approval: reference number: 05/Q0108/65
14
REFERENCES
1. Institute of Medicine, Committee on Quality of Health Care in America. Crossing the Quality Chasm: A New Health System for the 21st Century. Washington, D.C.: National Academy Press, 2001.
2. Spear SJ, Schmidhofer M. Ambiguity and workarounds as contributors to medical error. Ann Intern Med 2005; 142: 627-630.
3. Edwards N. Can quality improvement be used to change the wider healthcare system? Qual Saf Health Care 2005; 14: 75.
4. Clarkson PJ, Buckle P, Coleman R, Stubbs D, Ward J, Jarrett J, et al. Design for patient safety: a review of the effectiveness of design in the UK health service. Journal of Engineering Design 2004; 15: 123-140.
5. Hollnagel E. Barriers and Accident Prevention. Aldershot: Ashgate, 2004.
6. Holt J. UML for systems engineering: watching the wheels. London: Institution of Electrical Engineers, 2004.
7. Kletz T. HAZOP and HAZAN: identifying and assessing process industry hazards. Rugby, UK: Institution of Chemical Engineers, 1992.
8. Eriksson H-E, Penker M. Business modeling with UML: business patterns at work. New York: John Wiley & Sons, 2000.
9. Pidd M. Tools for thinking: modelling in management science. Chichester: Wiley, 1996.
10. DeRosier J, Stalhandske E, Bagian JP, Nudell T. Using health care Failure Mode and Effect Analysis. Jt Comm J Qual Improv 2002; 28: 248-267.
11. Lyons M, Adams S, Woloshynowych M, Vincent C. Human reliability analysis in healthcare: A review of techniques. International Journal of Risk & Safety in Medicine 2004; 16: 223-237.
12. Esmail R, Cummings C, Dersch D, Duchscherer G, Glowa J, Liggett G, et al. Using Healthcare Failure Mode and Effect Analysis tool to review the process of ordering and administrating potassium chloride and potassium phosphate. Healthc Q 2005; 8: 73-80.
13. Sheridan-Leos N, Schulmeister L, Hartranft S. Failure mode and effect analysis: a technique to prevent chemotherapy errors. Clin J Oncol Nurs 2006; 10: 393-398.
14. van Tilburg CM, Leistikow IP, Rademaker CM, Bierings MB, van Dijk AT. Health Care Failure Mode and Effect Analysis: a useful proactive risk analysis in a pediatric oncology ward. Qual Saf Health Care 2006; 15: 58-63.
15. Pradhan M, Edmonds M, Runciman W. Quality in Healthcare: process. Best Pract Res Clin Anaesthesiol 2001; 15: 555-571.

15
16. Beuscart-Zephir M-C, Pelayo S, Anceaux F, Maxwell D, Guerlinger S. Cognitive analysis of physicians and nurses cooperation in the medication ordering and administration process. Int J Med Inf 2007; 76: S65-S77.
17. Chahed S, Matta A, Sahin E, Dallery Y. Operations management related activities for home health care providers. Information control problems in manufacturing 2006; 621-626.
18. Pluto D, Hirshorn B. Process mapping as a tool for home health network analysis. Home Health Care Serv Q 2003; 22: 1-16.
19. Department of Health. National service framework for diabetes: standards. London: DoH, 2001.
20. National Institute for Clinical Excellence. Guidance on cancer services: improving outcomes in urological cancers. London: NICE, 2002.
21. Middleton S, Roberts A. Integrated care pathways: a practical approach to implementation. Oxford: Butterworth-Heinemann, 2000.
22. NHS Institute for Innovation and Improvement. Process Modelling Community Features: http://www.microsoft.com/uk/nhs/pages/process_modelling_community/features.aspx Accessed February 2009.
23. NHS Institute for Innovation and Improvement. Process Mapping - Alternative Convential Methods: http://www.nodelaysachiever.nhs.uk/ServiceImprovement/Tools/IT232_Process+Mapping+-+alternatives+ways+to+conventional+process+mapping.htm Accessed February 2009.
24. Mayer RJ, Menzel CP, Painter MK, deWitte PS, Blinn T, Perakath B. Information integration for concurrent engineering: IDEF3 process description capture method report: http://www.idef.com/Downloads/pdf/Idef3_fn.pdf Accessed March 2006.
25. Fowler M, Scott K. UML distilled: a brief guide to the standard object modeling language. London: Addison-Wesley, 2000.
26. Eriksson H, Penker M. Business modeling with UML: business patterns at work. New York: John Wiley & Sons, 2000.
27. Zachman J. A framework for information systems architecture. IBM Systems Journal 1987; 26: 276-292.
28. Davis R, Brabänder E. ARIS design platform: getting started with BPM. London: Springer, 2007.
29. Lindland OI, Sindre G, Solvberg A. Understanding quality in conceptual modelling. IEEE Software 1994; 11: 42-49.

16
30. Forster AJ, Murff HJ, Peterson JF, Gandhi TK, Bates DW. The incidence and severity of adverse events affecting patients after discharge from the hospital. Ann Intern Med 2003; 138: 161-167.
31. Kirwan B, Ainsworth LK. A guide to task analysis. London: Taylor & Francis, 1992.
32. Pidd M. Tools for thinking: modelling in management science. Chichester: John Wiley & Sons, 2003.
33. Bozarth CC, Handfield RB. Introduction to operations and supply chain management. Upper Saddle River, NJ: Pearson Prentice Hall, 2005.
34. Edwards K. Real-time structured methods: systems analysis. Chichester: John Wiley & Sons, 1993.
35. Lane R, Stanton NA, Harrison D. Applying hierarchical task analysis to medication administration errors. Appl Ergon 2006; 37: 669-679.
36. Stanton N. Human factors methods: a practical guide for engineering and design. Aldershot: Ashgate, 2005.
37. Jenkins VA, Fallowfield LJ, Poole K. Are members of multidisciplinary teams in breast cancer aware of each other's informational roles? Qual Saf Health Care 2001; 10: 70-75.
38. Kizer KW. Patient centred care: essential but probably not sufficient. Qual Saf Health Care 2002; 11: 117-118.
39. Smith T. Changing relationships between people and providers: making sense of patient centred health care. Qual Saf Health Care 2006; 15: 71-73.
40. Dwyer K. Communication breakdowns combine to cause system failure. Int J Qual Health Care 2001; 13: 265.
41. Dwyer K. Lack of clear channels of communication in patient transfer between care facilities leads to fragmentation in care. Int J Qual Health Care 2003; 15: 441.
42. Redmill F, Chudleigh M, Catmur J. System Safety: HAZOP and Software HAZOP. Chichester: John Wiley & Sons Ltd, 1999.
17
Table 1 Node-link based diagram characterisation and simple examples
Diagram type Nodes Links
1 Stakeholder diagrams Stakeholder consists of
hastypes of
Hierarchy
2 Information diagrams Informationcontent
consists of
hastypes of
Hierarchy
3 Process content diagrams Activity
consists of
hastypes of
Hierarchy
4 Flowcharts Decision
StartActivity
Sequence
5 Swim lane activity diagrams
Stake-holder
Decision
StartActivity
Sequence
6 State transition diagrams State conditionaction
Sequence
7 Communication diagrams Stakeholder Information
/material
8 Data flow diagrams Activity Datastorage
Information
/material
18
Table 2 Diagram evaluation results : % agreement ≥ 70%, : 70% > % agreement ≥ 50%. : % agreement < 50%
Diagram type Usability: easily
understandable (n = 29)
Utility: helpful in better understanding
how the system works (n = 28)
Utility: Helpful for specific purposes
1 Stakeholder diagrams
(86%)
(57%)
- Defining system boundaries - Identifying key stakeholders
2 Information diagrams
(79%)
(57%)
- Understanding document standardisation status, level of electronic document usage
3 Process content
diagrams
(90%)
(64%)
- Understanding a detailed task structure
4 Flowcharts
(97%)
(89%) - Understanding an overall process
5 Swim lane activity
diagrams
(79%)
(61%)
- Understanding roles and responsibilities
6 State transition diagrams
(59%)
(71%)
- Understanding a process in a patient-centred way
7 Communication
diagrams
(38%)
(39%)
- Understanding communication and interactions between stakeholders
8 Data flow diagrams
(62%)
(50%)
- Limited in describing overall care processes

19
Hospital Primary Care Trust
Transitionalcare team
Generalpractitioner
Social careteam
Social caremanager
Multidisciplinaryteam
consists of
Dischargeplanning sister
Dischargeplanning team
Stakeholder
has types of
consists of
Hospitalpharmacy
Wardpharmacist
Pharmacytechnician
Ward
Ward clerk Nurse Doctor
Figure 1 Stakeholder diagram of a simplified patient discharge process
Discharge summary
- TTO- patient information
Discharge summary(form1: hand-written)
- consultant- date admission/discharged- diagnosis- other problems- investigation- GP action needed- information to patient- follow up
Discharge summary(form2: printed)
- GP information- info. given to patient- outpatient appointment
Discharge summary(form3: hand-written)
- admission detail- diagnosis detail- non-operative treatment- operation- main investigation/results- adverse events- postscript
Discharge summary(form4: printed)
Information source
- content
has types of
KEY
Figure 2 Information diagram of a simplified patient discharge process
20
Process
- sub-process (activity)
Patient discharge process from ward
1. Decide discharge date- MDT discusses a need for transitional care- Nurse requests assessment- TCT assesses pt’s transitional care needs- MDT decides discharge date- TCT fills in intermediate care summary- TCT confirms transitional care service
2. Prepare for patient discharge
- Doctor generates discharge summary- Ward pharmacist confirms discharge summary- Hospital pharmacy prepares TTO medicine
3. Implement patient discharge- Nurse runs through discharge checklist- Nurse discharges patient
consists of
TCT: Transitional Care TeamMDT: Multidisciplinary TeamTTO: To Take Out
KEY
Figure 3 Process content diagram of a simplified patient discharge process
Start / End
Activity step
Decision point
Multidisciplinary team discussesa need for transitional care
Start
Nurse requests assessmentfor transitional care
TCT assesses pt’s need
TCT confirms transition care service
Doctor generatesdischarge summary
MDT decides discharge date
No need needed
Ward pharmacist confirmsdischarge summary
noproblems
needcorrections
Nurse runs through discharge checklist
Nurse discharge patient
End
MDT decides discharge date
TCT: Transitional Care TeamMDT: Multidisciplinary Team
KEY
TCT fills in intermediate care summary
Figure 4 Flowcharts of a simplified patient discharge process

21
discusses a need fortransitonal care
requestsassessment fortransitonal care
assessespt's need
Start
decidesdischarge date
generatesa discharge
summary
confirmsdischargesummary
runs throughdischargechecklist
dischargepatient
notransitional
care
noproblems
End
corrections
decision step
activity step
start/end
join
fork
informs TCT ofdischarge date
confirmstransitionalcare service
transitionalcare
notransitional
care
transitional care
Doctor Wardpharmacist
Multidisciplinaryteam
Nurse Transitional careteam
KEY
Figure 5 Swim lane activity diagram of a simplified patient discharge process
22
patient state 1
patient state 2
transition condition- transition action
Patient being discussed at MDT
Transitional care needed- Nurse requests assessment- TCT assesses pt transitional care needs- MDT decides discharge date- TCT fills in intermediate care summary- TCT confirms discharge date
Patient ready to be discharged
At multidisciplinary meeting
Patient with a completed discharge summary
Transitional care Not needed- MDT decides discharge date
Patient with a drafted discharge summary
- Ward pharmacist confirms discharge summaryNo corrections neededCorrections needed
Patient with confirmed discharge date- Doctor generates discharge summary
- MDT discusses needs for transitional care
KEY
MDT: Multidisciplinary teamTCT: Transitional care team
Figure 6 State transition diagram of a simplified patient discharge process
Nurse Multidisciplinaryteam
2. assessmentnotification
4. dischargedate
5. discharge dateconfirmation
Doctor
Wardpharmacist
1. transitionalcare need
assessmentrequest
3. dischargedate 3. discharge
date
6. draftdischargesummary
9. dischargesummary
Nurse 9. TTOmedicine
WardInformation flow
Medicine flow
KEY
Transitionalcare team
HospitalPharmacy
7. dischargesummary
8. TTOmedicine
Figure 7 Communication diagram of a simplified patient discharge process

23
Nurse.implementspt discharge
data/materialstore
data flow
medicineflow
activity
KEY
patientrecord
MDTdiscussesa need fortransitional
care
TCTassesses
pt’sneed
TCTconfirms
transitionalcare
servicetransitionalcare needassessmentrequest
MDTdecides
dischargedate
dischargedate
dischargesummary
Doctordrafts a
dischargesummary
Pharmacydispense
TTOmedicine
confirmeddischarge
date
assessmentresults
TTOmedicine
Figure 8 Data flow diagram of a simplified patient discharge process