Embed Size (px)
Citation preview

H.B. Fuller to Acquire Royal Adhesives & SealantsExpands H.B. Fuller’s position in highly specified adhesive segments
and strengthens platforms for long-term global growth
2
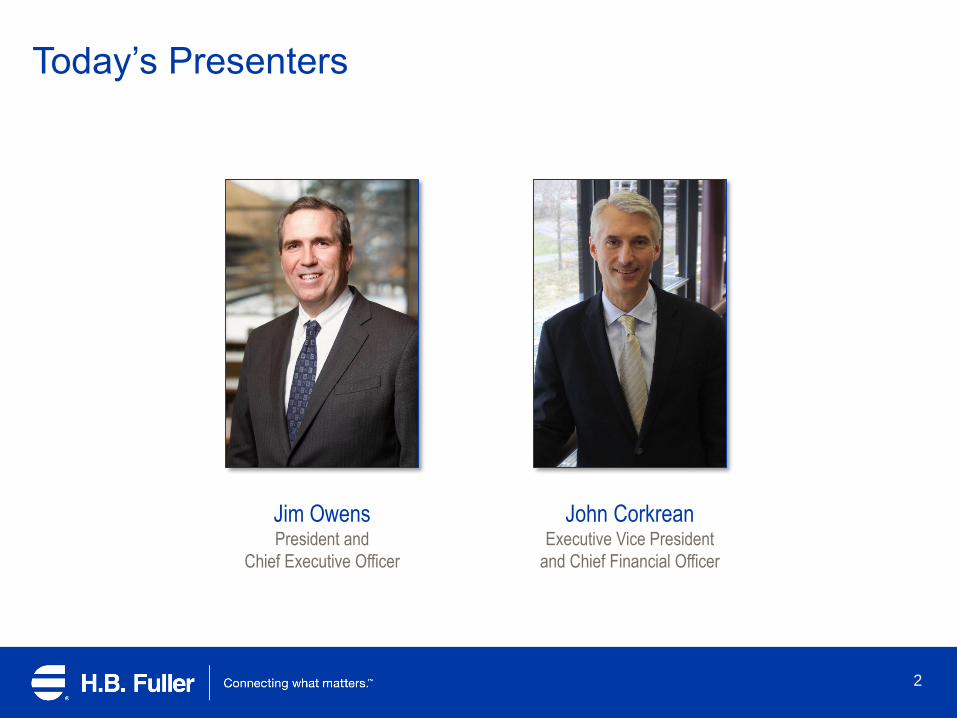
John CorkreanExecutive Vice President
and Chief Financial Officer
Jim OwensPresident and
Chief Executive Officer
Today’s Presenters
Safe Harbor for Forward-looking StatementsCertain statements in this document may be considered forward-looking statements within the meaning of the Private Securities Litigation
Reform Act of 1995. These statements are subject to various risks and uncertainties, including but not limited to the following: risks to
consummation of the transaction, including the risk that the transaction will not be consummated within the expected time period or at all, the
risk that conditions to the closing of the transaction, including receipt of required regulatory approvals, may not be satisfied, and the risk that
the transaction may be terminated in circumstances requiring us to pay the $78.75 million termination fee; the transaction may involve
unexpected costs, liabilities or delays; our business or stock price may suffer as a result of uncertainty surrounding the transaction; we may
be unable to secure the financing necessary for the transaction on favorable terms, or at all; the substantial amount of debt we would incur to
finance our acquisition of Royal, our ability to repay or refinance it or incur additional debt in the future, our need for a significant amount of
cash to service and repay the debt and to pay dividends on our common stock, and the effect of restrictions to be contained in our debt
agreements that limit the discretion of management in operating the business or ability to pay dividends; various risks to stockholders of not
receiving dividends and risks to our ability to pursue growth opportunities if we continue to pay dividends according to the current dividend
policy; we may be unable to achieve expected synergies and operating efficiencies from the transaction within the expected time frames or at
all; we may be unable to successfully integrate Royal’s operations into our own, or such integration may be more difficult, time consuming or
costly than expected; following the transaction, revenues may be lower than expected, and operating costs, customer loss and business
disruption (including, without limitation, difficulties in maintaining relationships with employees, customers, clients or suppliers) may be
greater than expected; the outcome of any legal proceedings related to the transaction; risks that the pending transaction disrupts current
plans and operations and the potential difficulties in employee retention as a result of the pending transaction; the ability to effectively
implement Project ONE; political and economic conditions; product demand; competitive products and pricing; costs of and savings from
restructuring initiatives; geographic and product mix; availability and price of raw materials; the Company’s relationships with its major
customers and suppliers; changes in tax laws and tariffs; devaluations and other foreign exchange rate fluctuations; the impact of litigation
and environmental matters; the effect of new accounting pronouncements and accounting charges and credits; and similar matters.
All forward-looking information represents management’s best judgment as of this date based on information currently available that in the
future may prove to have been inaccurate. Additionally, the variety of products sold by the Company and the regions where the Company
does business make it difficult to determine with certainty the increases or decreases in net revenue resulting from changes in the volume of
products sold, currency impact, changes in product mix, and selling prices. However, management’s best estimates of these changes as well
as changes in other factors have been included.
Additional Information
Further information about the various risks and uncertainties can be found in the Company’s SEC 10-K filing for the fiscal year ended
December 3, 2016.
3
4
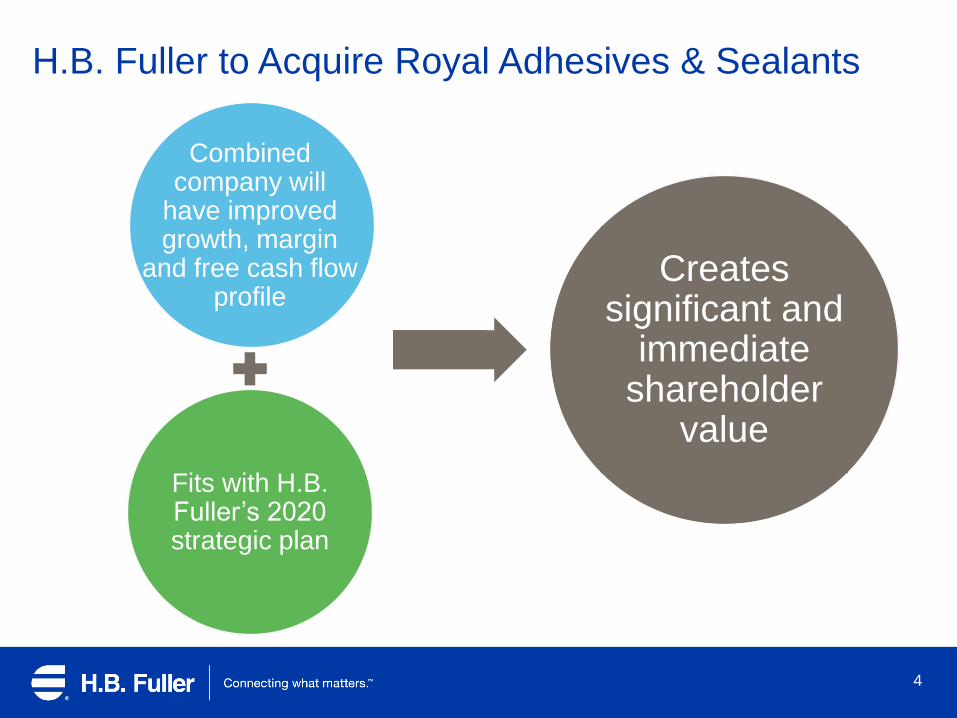
H.B. Fuller to Acquire Royal Adhesives & Sealants
Combined company will
have improved growth, margin
and free cash flow profile
Fits with H.B. Fuller’s 2020 strategic plan
Creates significant and
immediate shareholder
value
5
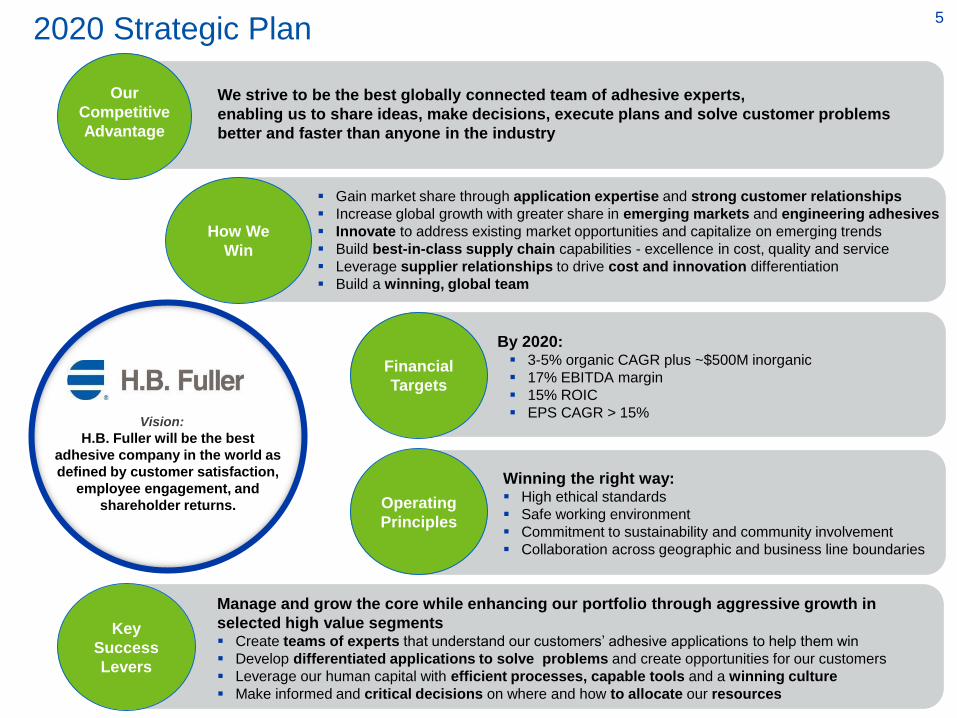
Gain market share through application expertise and strong customer relationships
Increase global growth with greater share in emerging markets and engineering adhesives
Innovate to address existing market opportunities and capitalize on emerging trends
Build best-in-class supply chain capabilities - excellence in cost, quality and service
Leverage supplier relationships to drive cost and innovation differentiation
Build a winning, global team
How We
Win
By 2020: 3-5% organic CAGR plus ~$500M inorganic
17% EBITDA margin
15% ROIC
EPS CAGR > 15%
Financial
Targets
Manage and grow the core while enhancing our portfolio through aggressive growth in
selected high value segments Create teams of experts that understand our customers’ adhesive applications to help them win
Develop differentiated applications to solve problems and create opportunities for our customers
Leverage our human capital with efficient processes, capable tools and a winning culture
Make informed and critical decisions on where and how to allocate our resources
Key
Success
Levers
H.B. Fuller will be the best
adhesive company in the world as
defined by customer satisfaction,
employee engagement, and
shareholder returns.
Vision:
2020 Strategic Plan
Operating
Principles
Winning the right way: High ethical standards
Safe working environment
Commitment to sustainability and community involvement
Collaboration across geographic and business line boundaries
Our
Competitive
Advantage
We strive to be the best globally connected team of adhesive experts,
enabling us to share ideas, make decisions, execute plans and solve customer problems
better and faster than anyone in the industry
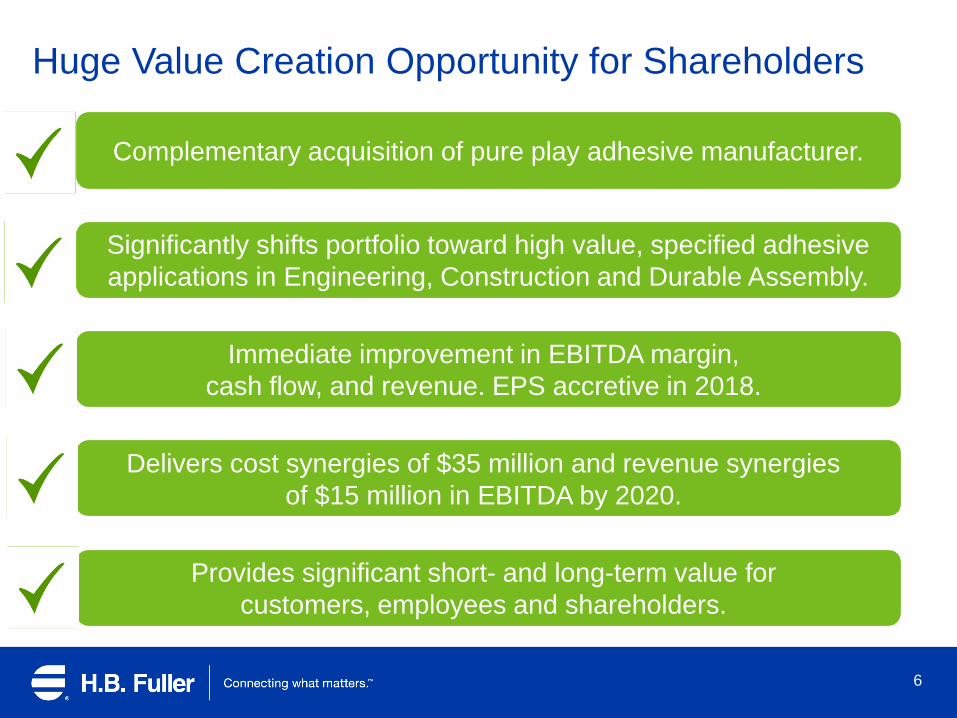
Huge Value Creation Opportunity for Shareholders
6
Significantly shifts portfolio toward high value, specified adhesive
applications in Engineering, Construction and Durable Assembly.
Immediate improvement in EBITDA margin,
cash flow, and revenue. EPS accretive in 2018.
Delivers cost synergies of $35 million and revenue synergies
of $15 million in EBITDA by 2020.
Provides significant short- and long-term value for
customers, employees and shareholders.
Complementary acquisition of pure play adhesive manufacturer.
7
Agenda
1 Introduction and Royal Overview
2
3
Impact on H.B. Fuller and Transaction Overview
Summary and Q&A
8
16
1821 21
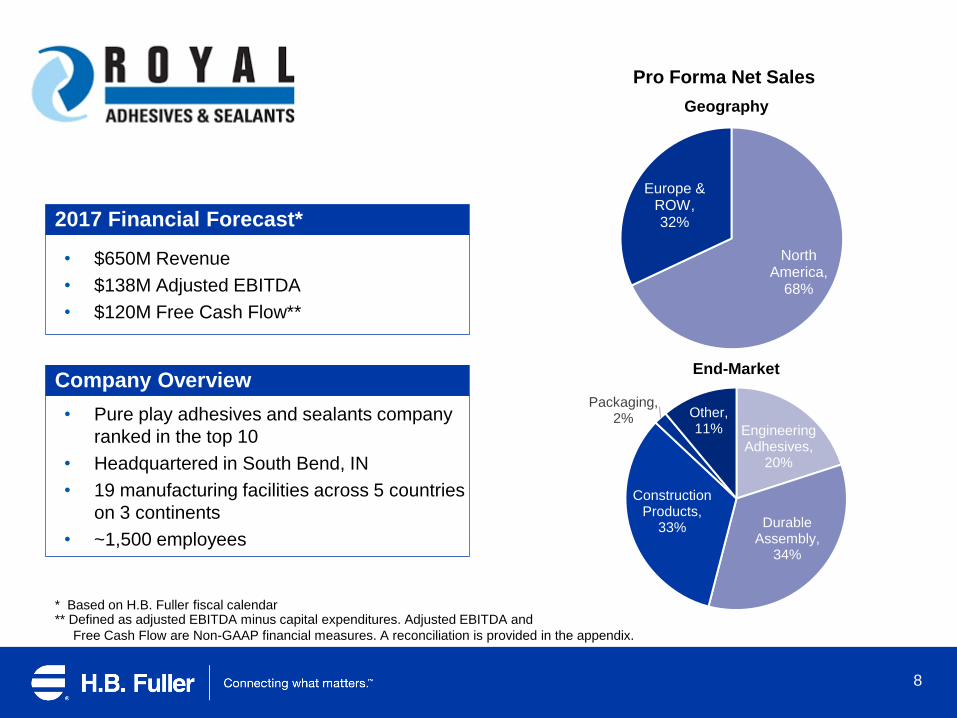
2017 Financial Forecast*
• $650M Revenue
• $138M Adjusted EBITDA
• $120M Free Cash Flow**
Pro Forma Net Sales
Company Overview
• Pure play adhesives and sealants company
ranked in the top 10
• Headquartered in South Bend, IN
• 19 manufacturing facilities across 5 countries
on 3 continents
• ~1,500 employees
70%
North America,
68%
Europe & ROW, 32%
Engineering Adhesives,
20%
Durable Assembly,
34%
Construction Products,
33%
Packaging, 2% Other,
11%
Geography
End-Market
** Defined as adjusted EBITDA minus capital expenditures. Adjusted EBITDA and
Free Cash Flow are Non-GAAP financial measures. A reconciliation is provided in the appendix.
* Based on H.B. Fuller fiscal calendar
9
Opera
ting S
egm
ents
Geogra
phie
s
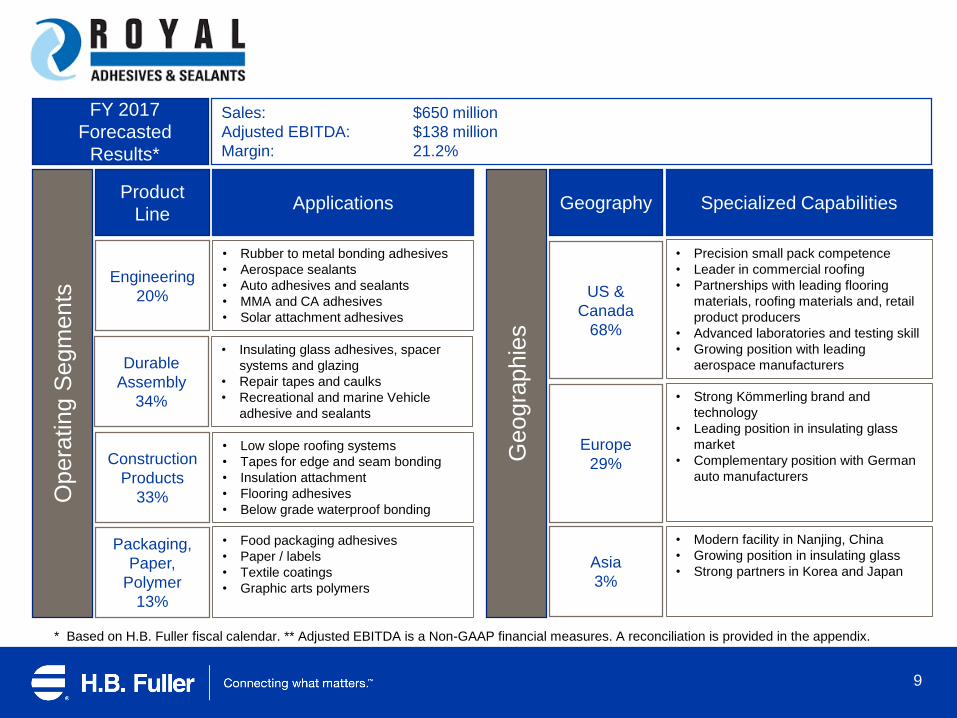
FY 2017
Forecasted
Results*
Sales: $650 million
Adjusted EBITDA: $138 million
Margin: 21.2%
Product
LineApplications
Engineering
20%
Construction
Products
33%
Durable
Assembly
34%
Packaging,
Paper,
Polymer
13%
• Rubber to metal bonding adhesives
• Aerospace sealants
• Auto adhesives and sealants
• MMA and CA adhesives
• Solar attachment adhesives
• Insulating glass adhesives, spacer
systems and glazing
• Repair tapes and caulks
• Recreational and marine Vehicle
adhesive and sealants
• Low slope roofing systems
• Tapes for edge and seam bonding
• Insulation attachment
• Flooring adhesives
• Below grade waterproof bonding
• Food packaging adhesives
• Paper / labels
• Textile coatings
• Graphic arts polymers
Geography Specialized Capabilities
Asia
3%
• Precision small pack competence
• Leader in commercial roofing
• Partnerships with leading flooring
materials, roofing materials and, retail
product producers
• Advanced laboratories and testing skill
• Growing position with leading
aerospace manufacturers
• Strong Kömmerling brand and
technology
• Leading position in insulating glass
market
• Complementary position with German
auto manufacturers
• Modern facility in Nanjing, China
• Growing position in insulating glass
• Strong partners in Korea and Japan
US &
Canada
68%
Europe
29%
* Based on H.B. Fuller fiscal calendar. ** Adjusted EBITDA is a Non-GAAP financial measures. A reconciliation is provided in the appendix.
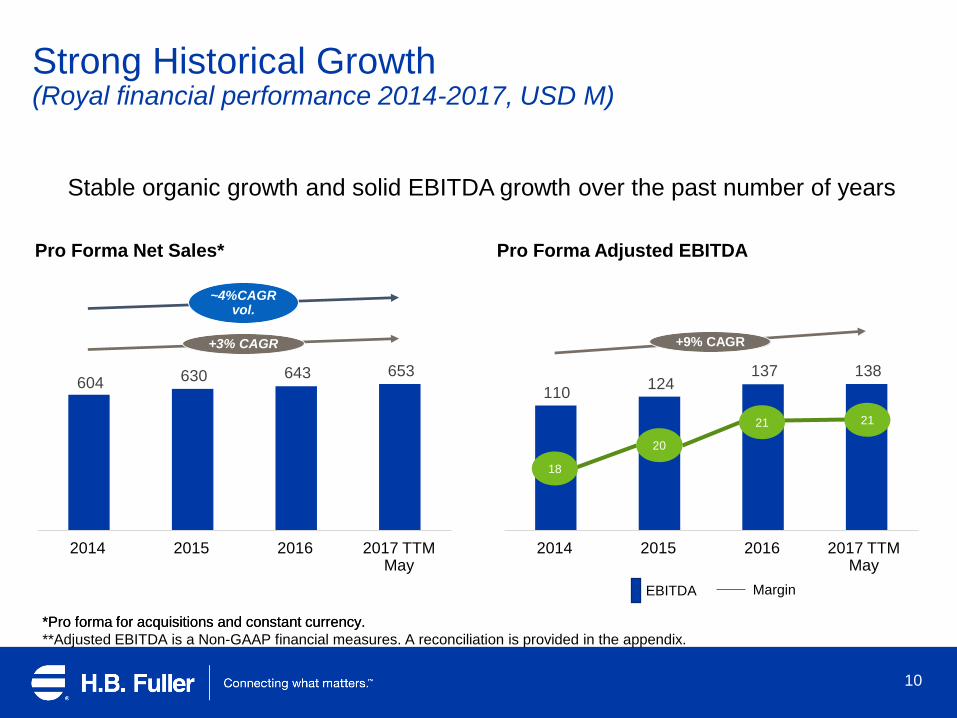
Strong Historical Growth(Royal financial performance 2014-2017, USD M)
Stable organic growth and solid EBITDA growth over the past number of years
10
*Pro forma for acquisitions and constant currency.
Pro Forma Adjusted EBITDA
110124
137 138
2016
+9% CAGR
2017 TTM May
2014 2015
Pro Forma Net Sales*
604 630 643 653
2014
~4%CAGRvol.
2017 TTMMay
2015
+3% CAGR
2016
EBITDA Margin
*Pro forma for acquisitions and constant currency.
**Adjusted EBITDA is a Non-GAAP financial measures. A reconciliation is provided in the appendix.
20
18
21 21
11
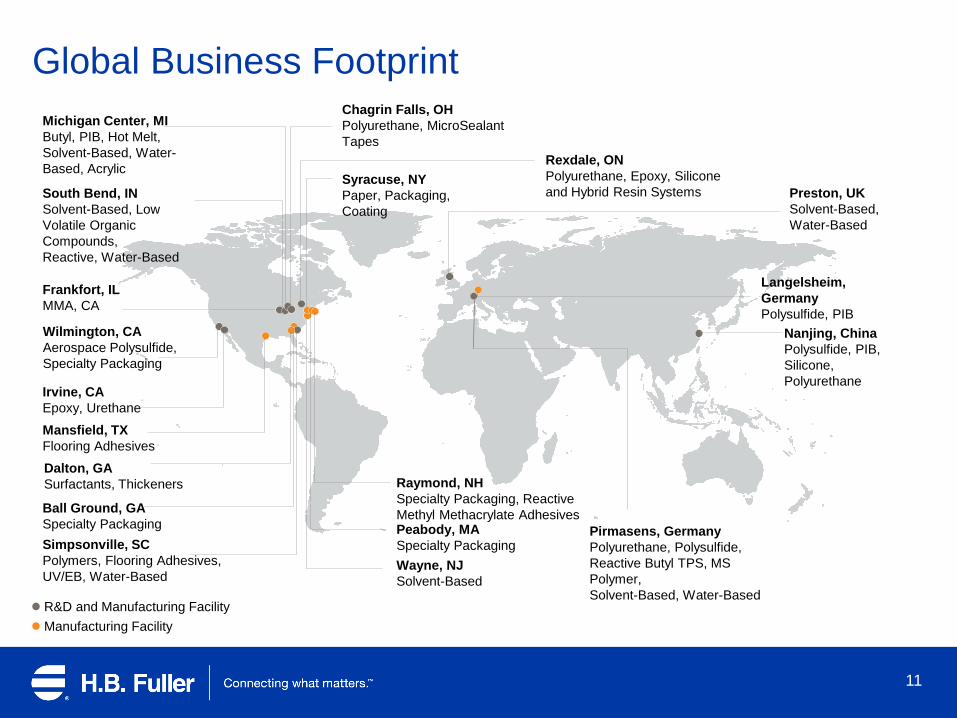
Global Business Footprint
R&D and Manufacturing Facility
Manufacturing Facility
Michigan Center, MI
Butyl, PIB, Hot Melt,
Solvent-Based, Water-
Based, Acrylic
South Bend, IN
Solvent-Based, Low
Volatile Organic
Compounds,
Reactive, Water-Based
Chagrin Falls, OH
Polyurethane, MicroSealant
Tapes
Wilmington, CA
Aerospace Polysulfide,
Specialty Packaging
Simpsonville, SC
Polymers, Flooring Adhesives,
UV/EB, Water-Based
Mansfield, TX
Flooring Adhesives
Dalton, GA
Surfactants, Thickeners Raymond, NH
Specialty Packaging, Reactive
Methyl Methacrylate AdhesivesPeabody, MA
Specialty Packaging
Wayne, NJ
Solvent-Based
Pirmasens, Germany
Polyurethane, Polysulfide,
Reactive Butyl TPS, MS
Polymer,
Solvent-Based, Water-Based
Langelsheim,
Germany
Polysulfide, PIB
Nanjing, China
Polysulfide, PIB,
Silicone,
Polyurethane
Rexdale, ON
Polyurethane, Epoxy, Silicone
and Hybrid Resin SystemsSyracuse, NY
Paper, Packaging,
Coating
Preston, UK
Solvent-Based,
Water-Based
Ball Ground, GA
Specialty Packaging
Irvine, CA
Epoxy, Urethane
Frankfort, IL
MMA, CA
Agenda
12
1 Introduction and Royal Overview
2
3
Impact on H.B. Fuller and Transaction Overview
Summary and Q&A
13
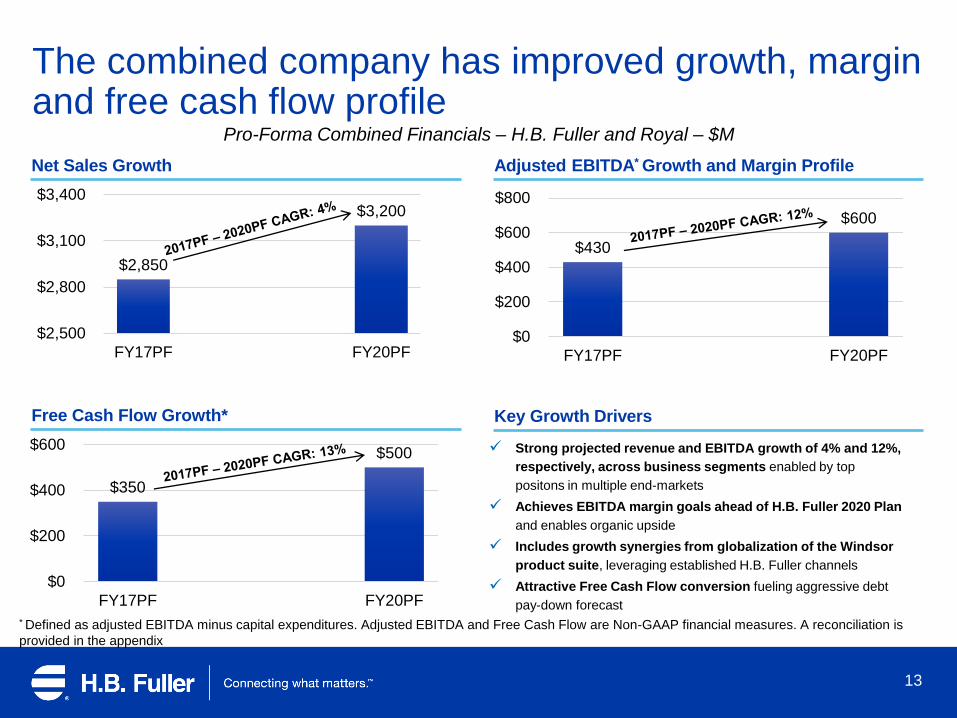
The combined company has improved growth, margin and free cash flow profile
Pro-Forma Combined Financials – H.B. Fuller and Royal – $M
$350
$500
$0
$200
$400
$600
FY17PF FY18PF FY19PF FY20PF
Strong projected revenue and EBITDA growth of 4% and 12%,
respectively, across business segments enabled by top
positons in multiple end-markets
Achieves EBITDA margin goals ahead of H.B. Fuller 2020 Plan
and enables organic upside
Includes growth synergies from globalization of the Windsor
product suite, leveraging established H.B. Fuller channels
Attractive Free Cash Flow conversion fueling aggressive debt
pay-down forecast
$430
$600
$0
$200
$400
$600
$800
FY17PF FY18PF FY19PF FY20PF
Adjusted EBITDA* Growth and Margin Profile
Key Growth Drivers
Net Sales Growth
Free Cash Flow Growth*
$2,850
$3,200
$2,500
$2,800
$3,100
$3,400
FY17PF FY18PF FY19PF FY20PF
* Defined as adjusted EBITDA minus capital expenditures. Adjusted EBITDA and Free Cash Flow are Non-GAAP financial measures. A reconciliation is
provided in the appendix
14
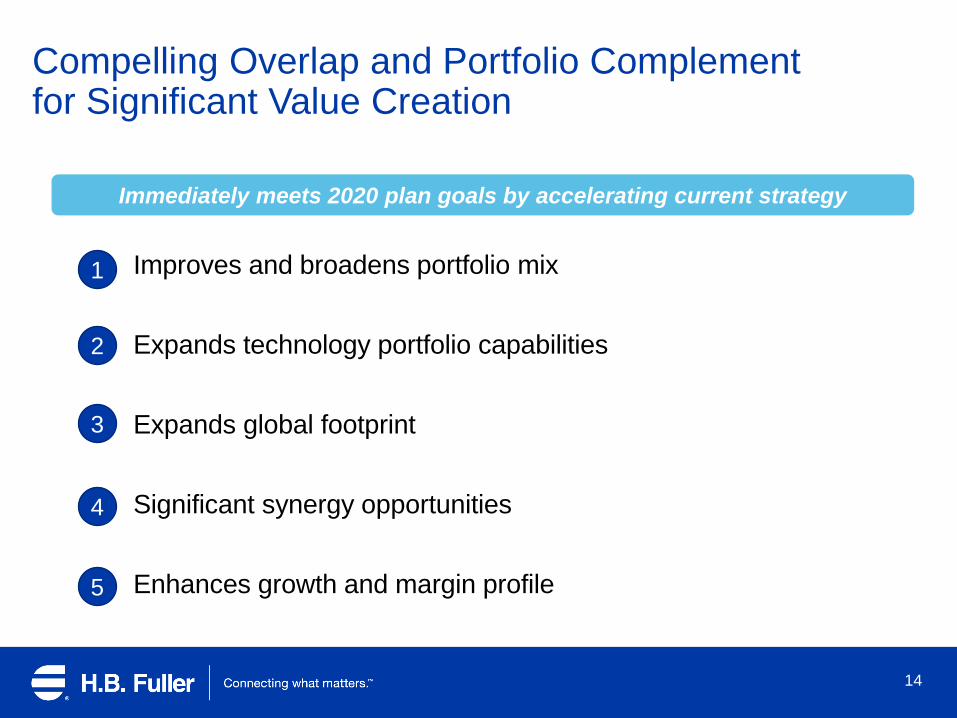
Compelling Overlap and Portfolio Complement for Significant Value Creation
Improves and broadens portfolio mix
Expands technology portfolio capabilities
Expands global footprint
Significant synergy opportunities
Enhances growth and margin profile
1
2
3
4
5
Immediately meets 2020 plan goals by accelerating current strategy
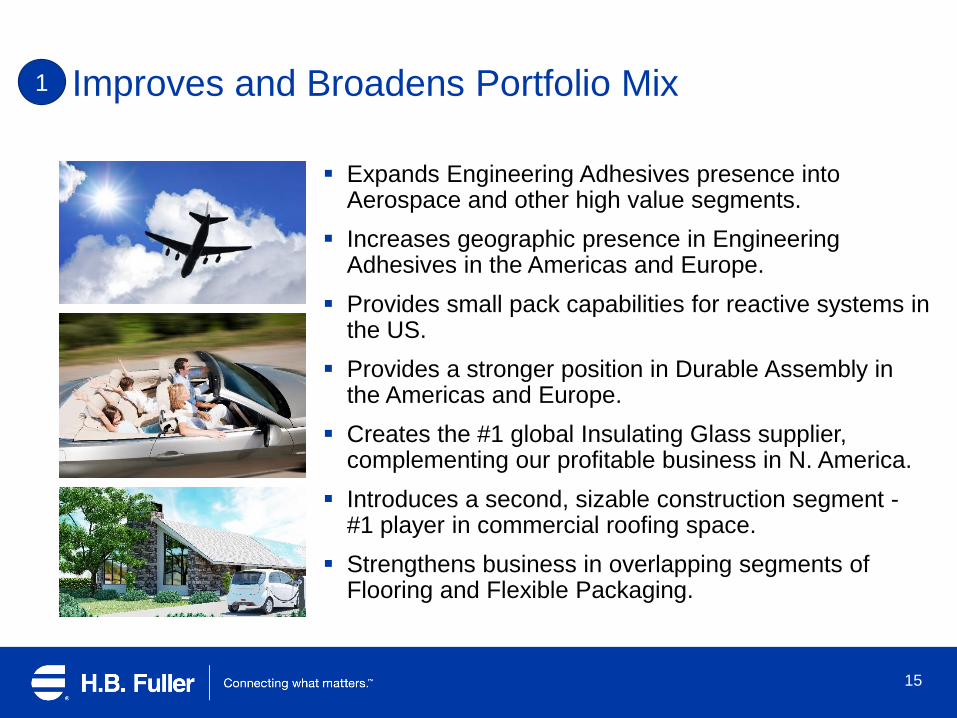
Expands Engineering Adhesives presence into Aerospace and other high value segments.
Increases geographic presence in Engineering Adhesives in the Americas and Europe.
Provides small pack capabilities for reactive systems in the US.
Provides a stronger position in Durable Assembly in the Americas and Europe.
Creates the #1 global Insulating Glass supplier, complementing our profitable business in N. America.
Introduces a second, sizable construction segment -#1 player in commercial roofing space.
Strengthens business in overlapping segments of Flooring and Flexible Packaging.
15
Improves and Broadens Portfolio Mix1
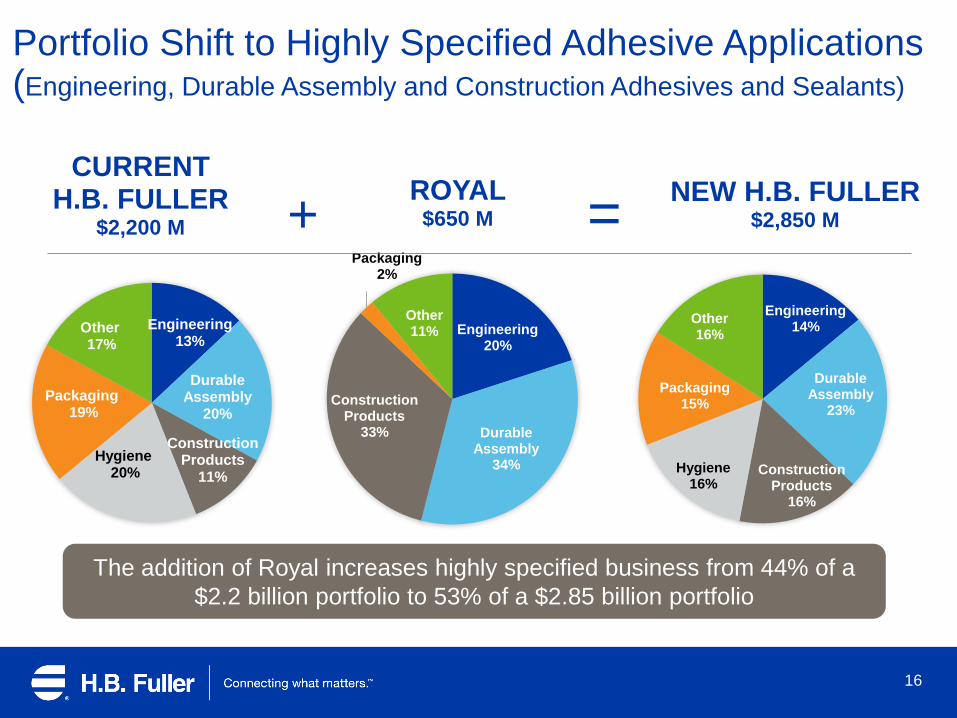
Engineering13%
Durable Assembly
20%
Construction Products
11%
Hygiene20%
Packaging19%
Other17%
CURRENT H.B. FULLER
$2,200 M
Portfolio Shift to Highly Specified Adhesive Applications (Engineering, Durable Assembly and Construction Adhesives and Sealants)
Engineering20%
Durable Assembly
34%
Construction Products
33%
Packaging2%
Other11%
ROYAL$650 M
16
Engineering14%
Durable Assembly
23%
Construction Products
16%
Hygiene16%
Packaging15%
Other16%
NEW H.B. FULLER$2,850 M+ =
The addition of Royal increases highly specified business from 44% of a
$2.2 billion portfolio to 53% of a $2.85 billion portfolio
17
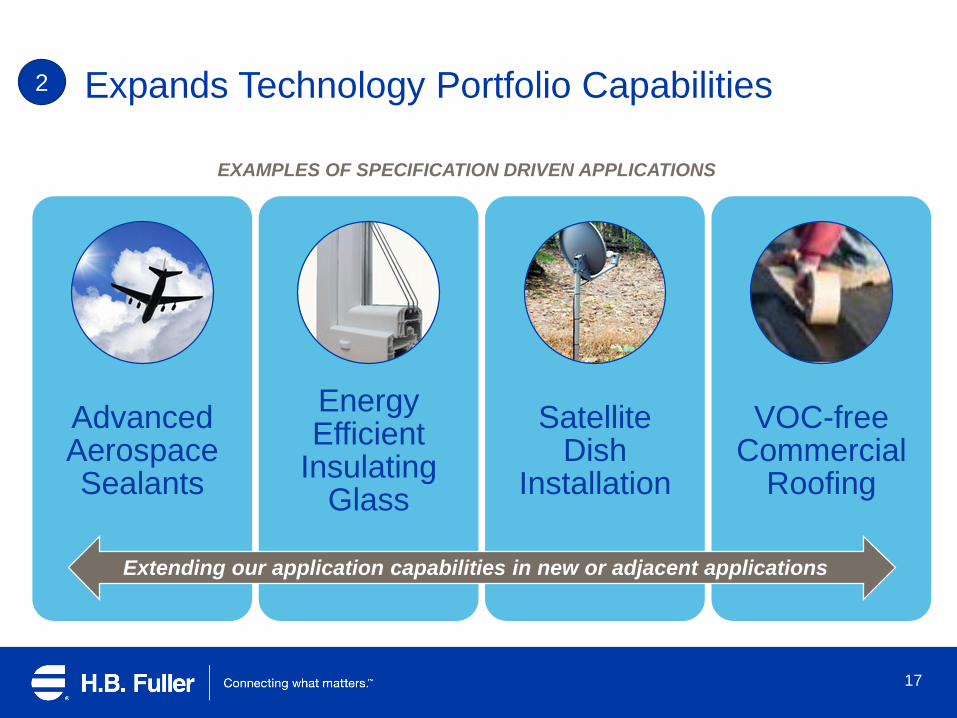
Advanced Aerospace Sealants
Energy Efficient
Insulating Glass
Satellite Dish
Installation
VOC-free Commercial
Roofing
Expands Technology Portfolio Capabilities2
Extending our application capabilities in new or adjacent applications
EXAMPLES OF SPECIFICATION DRIVEN APPLICATIONS
18
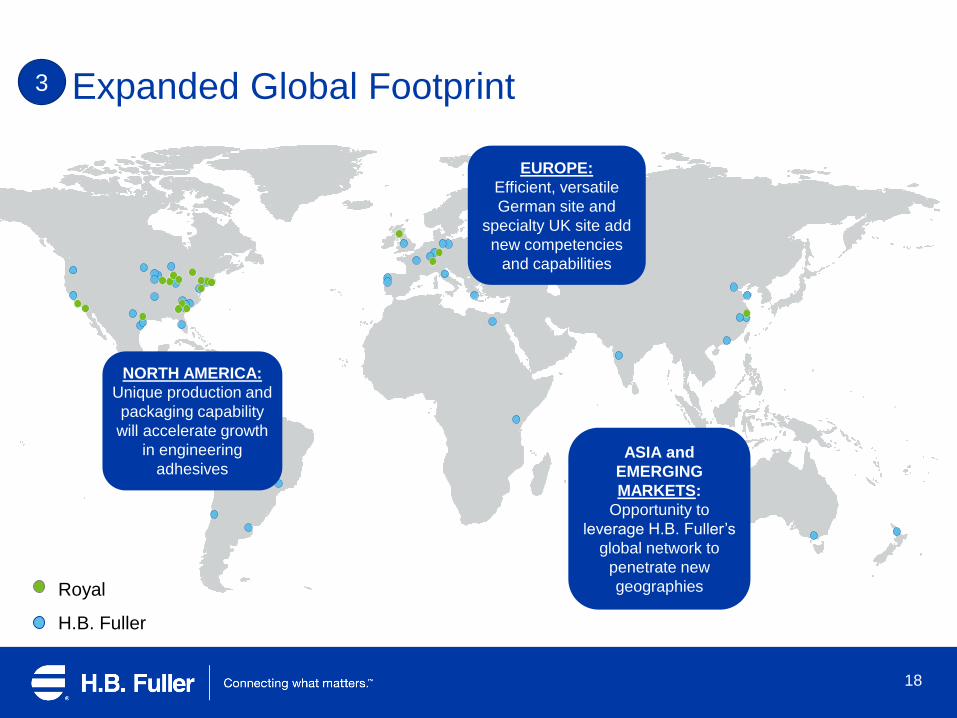
Royal
H.B. Fuller
Expanded Global Footprint3
EUROPE:
Efficient, versatile
German site and
specialty UK site add
new competencies
and capabilities
NORTH AMERICA:
Unique production and
packaging capability
will accelerate growth
in engineering
adhesivesASIA and
EMERGING
MARKETS:
Opportunity to
leverage H.B. Fuller’s
global network to
penetrate new
geographies
19
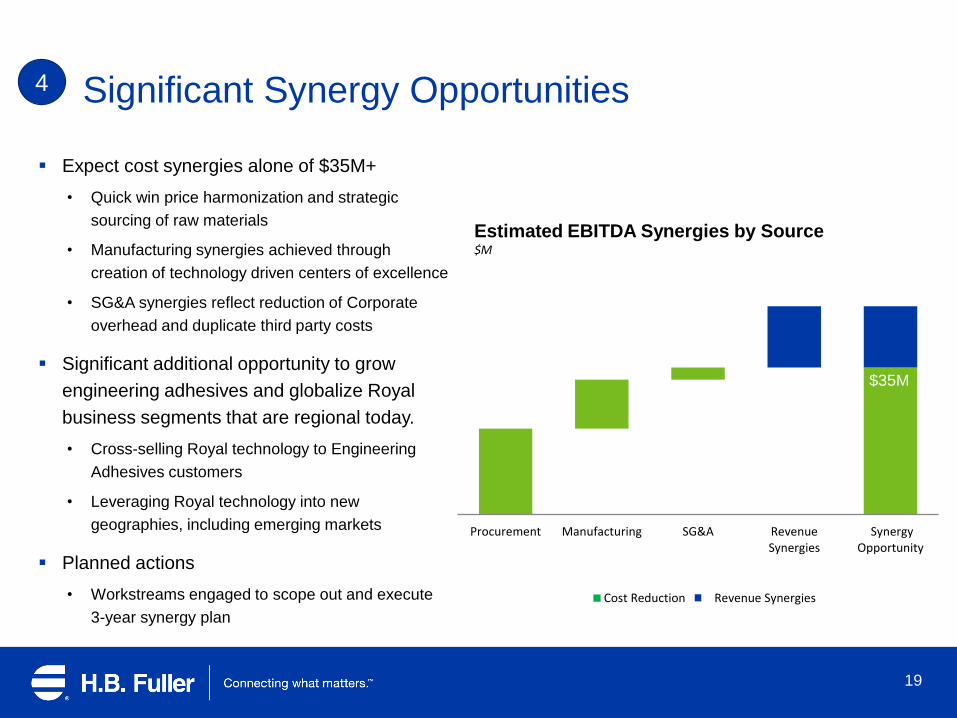
$35M
Procurement Manufacturing SG&A RevenueSynergies
SynergyOpportunity
Cost Reduction Revenue Synergies
Estimated EBITDA Synergies by Source $M
Significant Synergy Opportunities
Expect cost synergies alone of $35M+
• Quick win price harmonization and strategic
sourcing of raw materials
• Manufacturing synergies achieved through
creation of technology driven centers of excellence
• SG&A synergies reflect reduction of Corporate
overhead and duplicate third party costs
Significant additional opportunity to grow
engineering adhesives and globalize Royal
business segments that are regional today.
• Cross-selling Royal technology to Engineering
Adhesives customers
• Leveraging Royal technology into new
geographies, including emerging markets
Planned actions
• Workstreams engaged to scope out and execute
3-year synergy plan
4
$35M
20
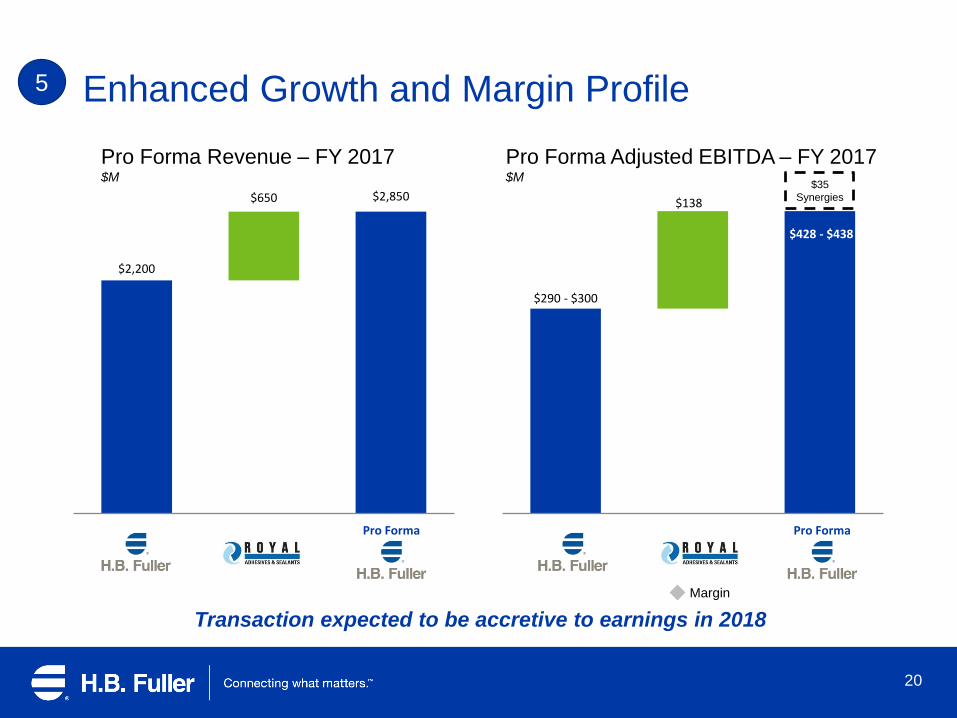
$2,200
$650 $2,850
$290 - $300
$138
$428 - $438
Pro Forma Pro Forma
Pro Forma Revenue – FY 2017 $M
Pro Forma Adjusted EBITDA – FY 2017$M
Margin
Transaction expected to be accretive to earnings in 2018
Enhanced Growth and Margin Profile5
$35
Synergies
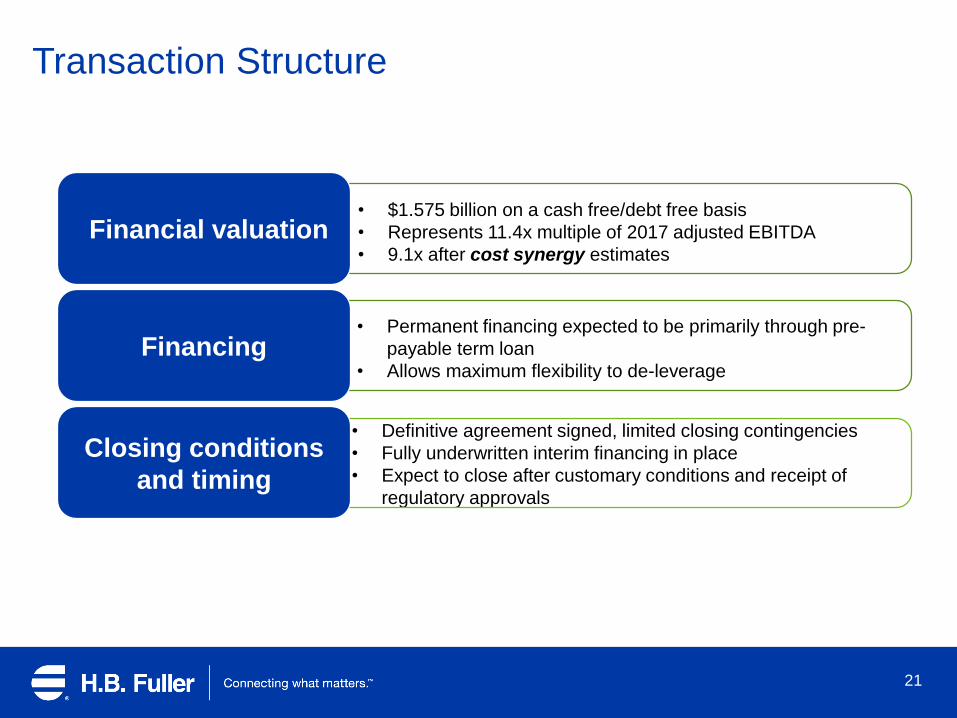
• Definitive agreement signed, limited closing contingencies
• Fully underwritten interim financing in place
• Expect to close after customary conditions and receipt of
regulatory approvals
Transaction Structure
21
Financial valuation
Financing
Closing conditions
and timing
• $1.575 billion on a cash free/debt free basis
• Represents 11.4x multiple of 2017 adjusted EBITDA
• 9.1x after cost synergy estimates
• Permanent financing expected to be primarily through pre-
payable term loan
• Allows maximum flexibility to de-leverage
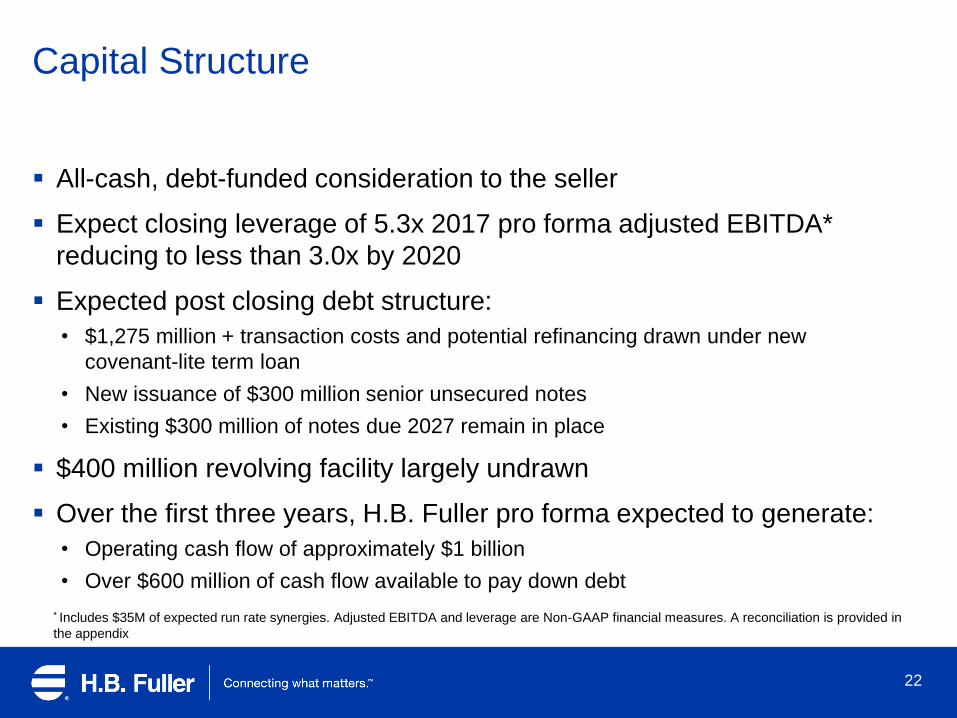
Capital Structure
All-cash, debt-funded consideration to the seller
Expect closing leverage of 5.3x 2017 pro forma adjusted EBITDA*
reducing to less than 3.0x by 2020
Expected post closing debt structure:
• $1,275 million + transaction costs and potential refinancing drawn under new
covenant-lite term loan
• New issuance of $300 million senior unsecured notes
• Existing $300 million of notes due 2027 remain in place
$400 million revolving facility largely undrawn
Over the first three years, H.B. Fuller pro forma expected to generate:
• Operating cash flow of approximately $1 billion
• Over $600 million of cash flow available to pay down debt
22
* Includes $35M of expected run rate synergies. Adjusted EBITDA and leverage are Non-GAAP financial measures. A reconciliation is provided in
the appendix
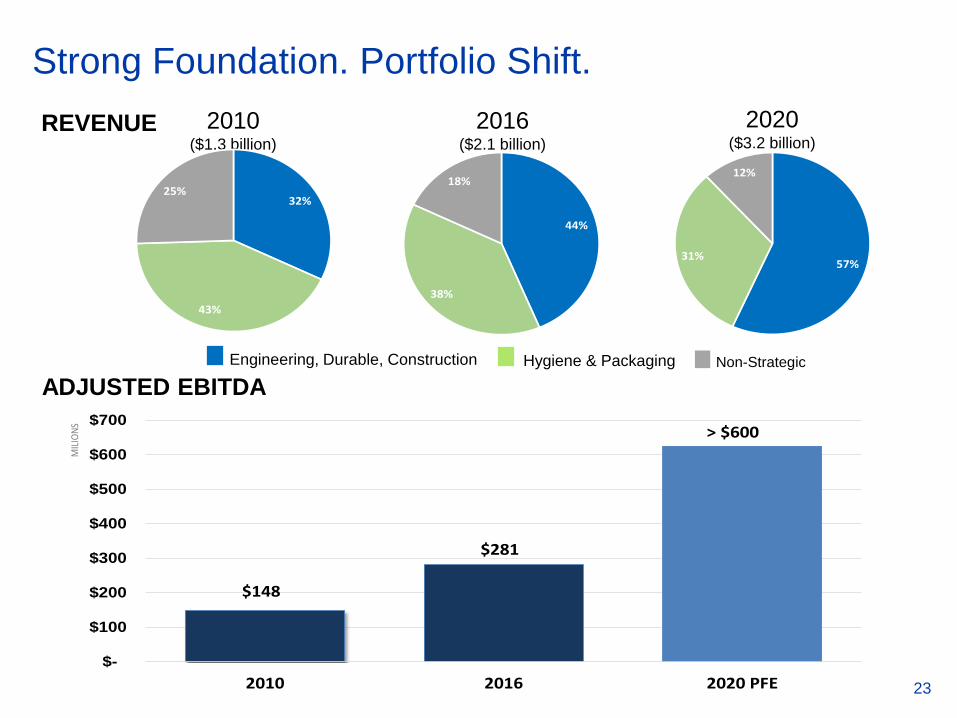
23
Strong Foundation. Portfolio Shift.
ADJUSTED EBITDA
REVENUE
44%
38%
18%
57%31%
12%
2010($1.3 billion)
2016($2.1 billion)
2020($3.2 billion)
32%
43%
25%
Non-StrategicEngineering, Durable, Construction Hygiene & Packaging
$148
$281
> $600
$-
$100
$200
$300
$400
$500
$600
$700
2010 2016 2020 PFE
MIL
ION
S
23
2
Agenda
24
1 Introduction and Royal Overview
Impact on H.B. Fuller and Transaction Overview
3 Summary and Q&A
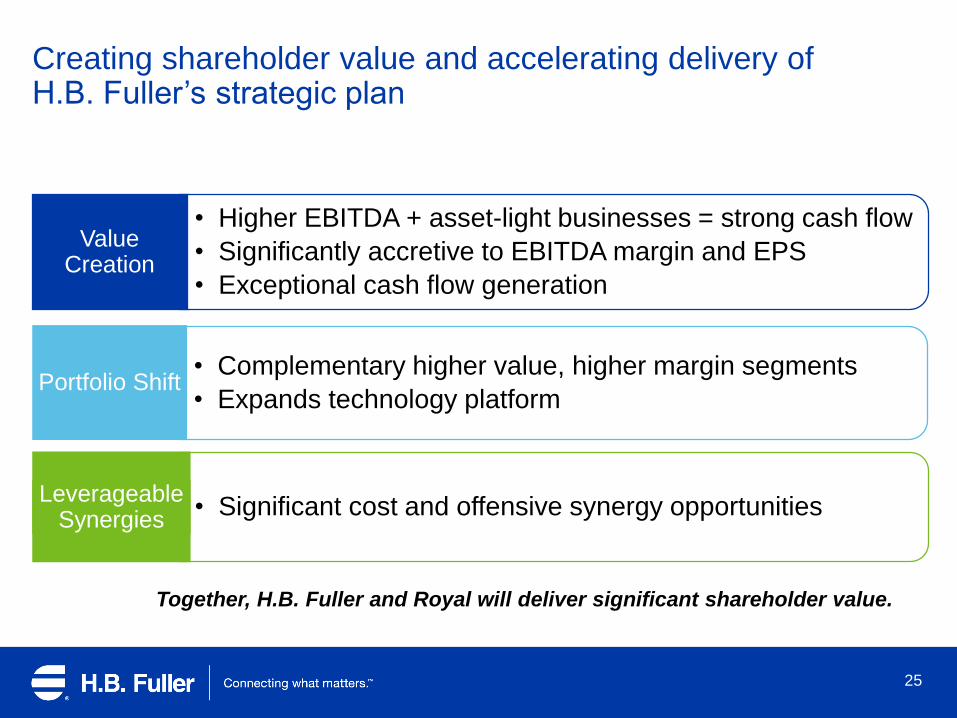
• Complementary higher value, higher margin segments
• Expands technology platform
• Significant cost and offensive synergy opportunities
• Higher EBITDA + asset-light businesses = strong cash flow
• Significantly accretive to EBITDA margin and EPS
• Exceptional cash flow generation
Creating shareholder value and accelerating delivery of H.B. Fuller’s strategic plan
25
Together, H.B. Fuller and Royal will deliver significant shareholder value.
Portfolio Shift
Leverageable Synergies
Value Creation
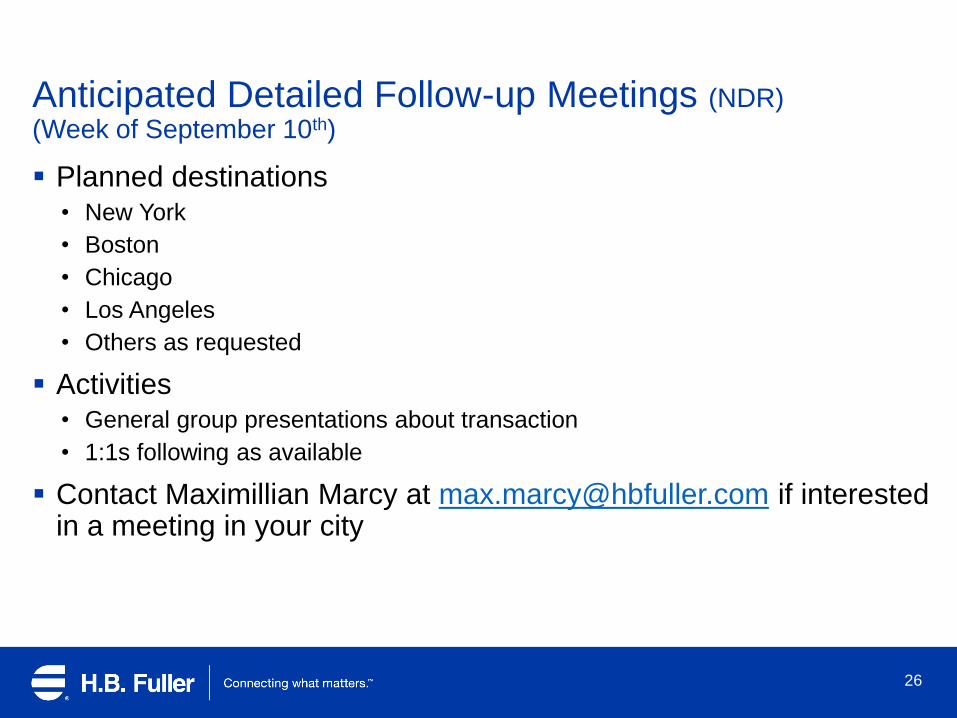
Anticipated Detailed Follow-up Meetings (NDR)(Week of September 10th)
Planned destinations• New York
• Boston
• Chicago
• Los Angeles
• Others as requested
Activities• General group presentations about transaction
• 1:1s following as available
Contact Maximillian Marcy at [email protected] if interested in a meeting in your city
26
Appendix
27
28
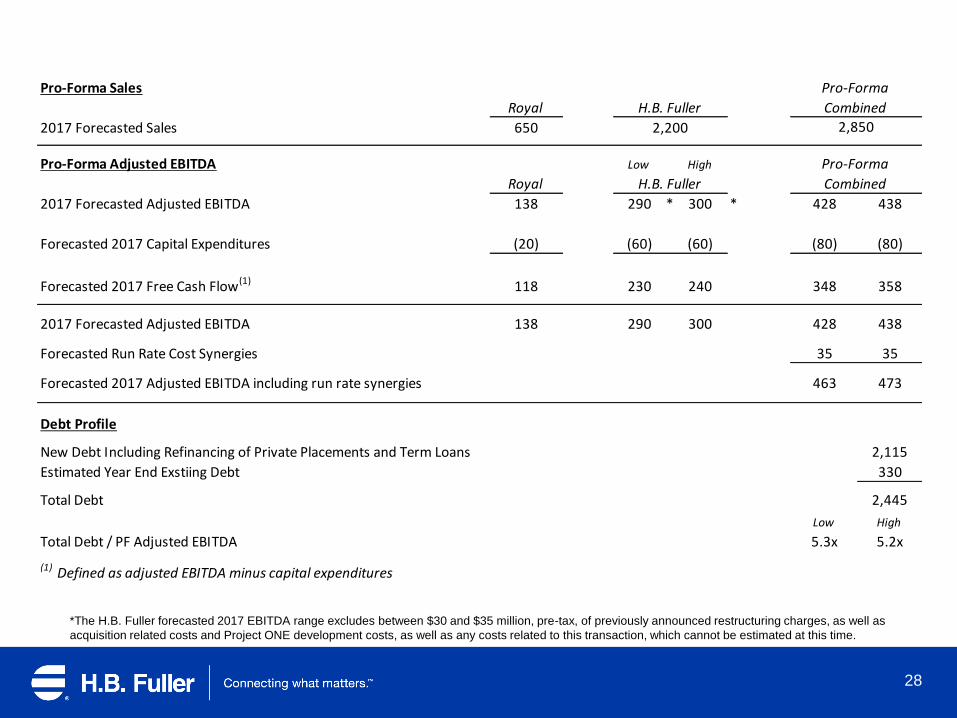
*The H.B. Fuller forecasted 2017 EBITDA range excludes between $30 and $35 million, pre-tax, of previously announced restructuring charges, as well as
acquisition related costs and Project ONE development costs, as well as any costs related to this transaction, which cannot be estimated at this time.
Pro-Forma Sales
Royal
2017 Forecasted Sales 650
Pro-Forma Adjusted EBITDA Low High
Royal
2017 Forecasted Adjusted EBITDA 138 290 * 300 * 428 438
Forecasted 2017 Capital Expenditures (20) (60) (60) (80) (80)
Forecasted 2017 Free Cash Flow(1) 118 230 240 348 358
2017 Forecasted Adjusted EBITDA 138 290 300 428 438
Forecasted Run Rate Cost Synergies 35 35
Forecasted 2017 Adjusted EBITDA including run rate synergies 463 473
Debt Profile
New Debt Including Refinancing of Private Placements and Term Loans 2,115
Estimated Year End Exstiing Debt 330
Total Debt 2,445
Low High
Total Debt / PF Adjusted EBITDA 5.3x 5.2x
(1) Defined as adjusted EBITDA minus capital expenditures
H.B. Fuller Combined
Pro-Forma
CombinedH.B. Fuller
Pro-Forma
2,200 2,850