Embed Size (px)
Citation preview

Worldwide manufacturer of adhesives, sealants, coatings, paints and other specialty chemicals
Annual Report
®
’98
H.B. Fuller Company
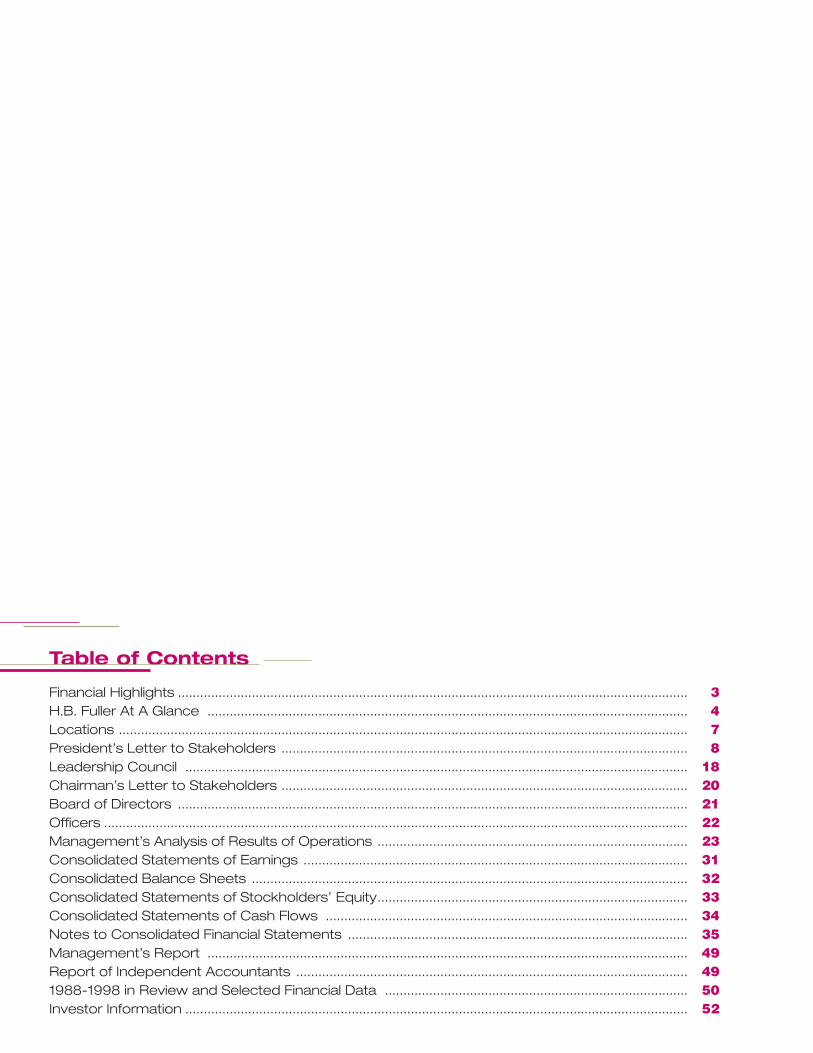
Table of Contents
Financial Highlights .......................................................................................................................................... 3H.B. Fuller At A Glance .................................................................................................................................. 4Locations .......................................................................................................................................................... 7President’s Letter to Stakeholders .............................................................................................................. 8Leadership Council ........................................................................................................................................ 18Chairman’s Letter to Stakeholders .............................................................................................................. 20Board of Directors .......................................................................................................................................... 21Officers .............................................................................................................................................................. 22Management’s Analysis of Results of Operations .................................................................................... 23Consolidated Statements of Earnings ........................................................................................................ 31Consolidated Balance Sheets ...................................................................................................................... 32Consolidated Statements of Stockholders’ Equity.................................................................................... 33Consolidated Statements of Cash Flows .................................................................................................. 34Notes to Consolidated Financial Statements ............................................................................................ 35Management’s Report .................................................................................................................................. 49Report of Independent Accountants .......................................................................................................... 491988-1998 in Review and Selected Financial Data .................................................................................. 50Investor Information ........................................................................................................................................ 52
H.B. Fuller Company and Subsidiaries
H.B. Fuller 1998 Annual Report 3
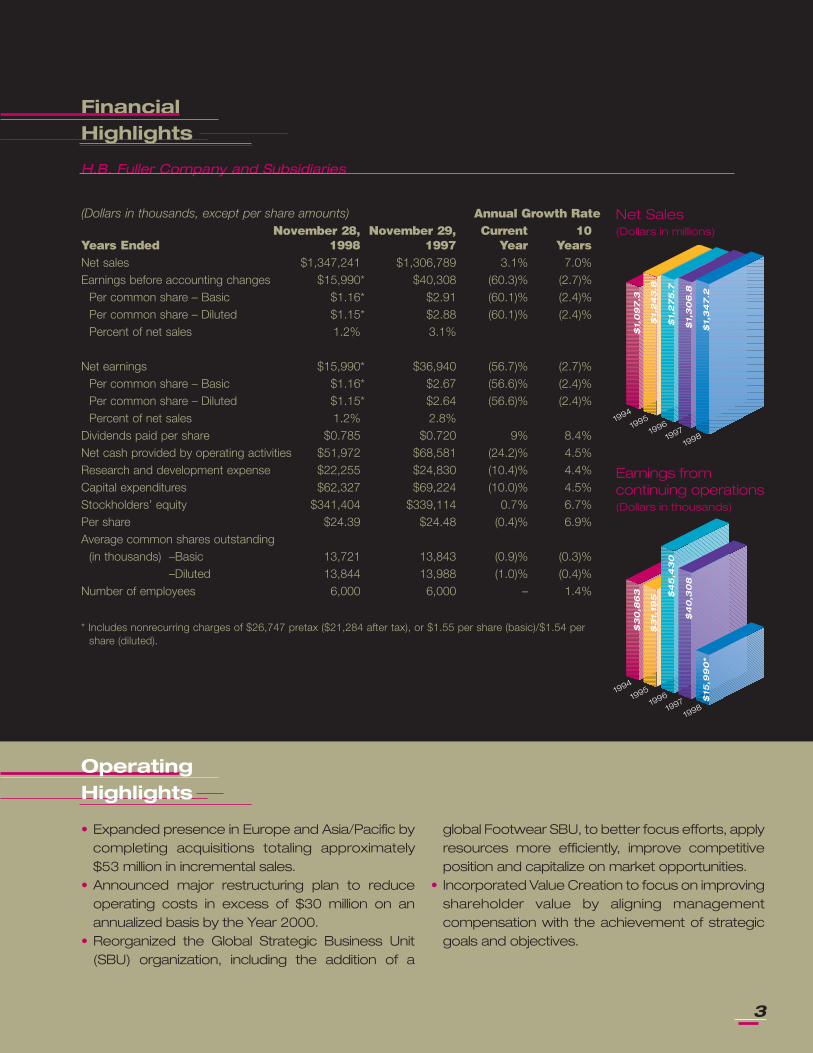
(Dollars in thousands, except per share amounts) Annual Growth RateNovember 28, November 29, Current 10
Years Ended 1998 1997 Year YearsNet sales $1,347,241 $1,306,789 3.1% 7.0%Earnings before accounting changes $15,990* $40,308 (60.3)% (2.7)%
Per common share – Basic $1.16* $2.91 (60.1)% (2.4)%Per common share – Diluted $1.15* $2.88 (60.1)% (2.4)%Percent of net sales 1.2% 3.1%
Net earnings $15,990* $36,940 (56.7)% (2.7)%Per common share – Basic $1.16* $2.67 (56.6)% (2.4)%Per common share – Diluted $1.15* $2.64 (56.6)% (2.4)%Percent of net sales 1.2% 2.8%
Dividends paid per share $0.785 $0.720 9% 8.4%Net cash provided by operating activities $51,972 $68,581 (24.2)% 4.5%Research and development expense $22,255 $24,830 (10.4)% 4.4%Capital expenditures $62,327 $69,224 (10.0)% 4.5%Stockholders’ equity $341,404 $339,114 0.7% 6.7%Per share $24.39 $24.48 (0.4)% 6.9%Average common shares outstanding
(in thousands) –Basic 13,721 13,843 (0.9)% (0.3)%–Diluted 13,844 13,988 (1.0)% (0.4)%
Number of employees 6,000 6,000 – 1.4%
FinancialHighlights
• Expanded presence in Europe and Asia/Pacific bycompleting acquisitions totaling approximately$53 million in incremental sales.
• Announced major restructuring plan to reduceoperating costs in excess of $30 million on anannualized basis by the Year 2000.
• Reorganized the Global Strategic Business Unit(SBU) organization, including the addition of a
global Footwear SBU, to better focus efforts, applyresources more efficiently, improve competitiveposition and capitalize on market opportunities.
• Incorporated Value Creation to focus on improvingshareholder value by aligning managementcompensation with the achievement of strategicgoals and objectives.
OperatingHighlights
Earnings from continuing operations(Dollars in thousands)
Net Sales(Dollars in millions)
1994
1995
1996
1997
1998
1994
1995
1996
1997
1998
$1,
09
7.3
$1,
24
3.8
$1,
27
5.7
$1,
30
6.8
$1,
34
7.2
$3
0,8
63
$3
1,19
5 $4
5,4
30
$4
0,3
08
$15
,99
0*
* Includes nonrecurring charges of $26,747 pretax ($21,284 after tax), or $1.55 per share (basic)/$1.54 pershare (diluted).

Specialty Group
H.B. Fuller has five specialized business units that serve unique markets.
This section features brief profiles of each of these businesses.
AutomotiveBusiness: Body-shop sealants usedto fill gaps between body sections.Paint-shop sealants used in criticalpainting operations. Trim adhesivesused for structural and nonstructuralapplications.
Developments: Direct glazing technology – polyurethane
adhesive systems used for affixing and sealing windshields in
vehicles.
Engineered SystemsBusiness: Adhesives and sealantsbond and seal appliances, filters, elec-tronics, sporting goods, HVAC, marine,medical devices, abrasives, paint rollersand brushes.
Developments: Hot melt filter pleating adhesives for UL
Class I and II high efficiency air filters found in industrial and
home heating, ventilation and air conditioning systems.
Rapidex® hot melt moisture-cure adhesives for the lamination
of fabric for the activewear market.
Foster ProductsCorporationBusiness: The global leader in themanufacture and sale of mastics,coatings, sealants, and adhesives forthe thermal insulation, indoor air quality,and HVAC markets.
Developments: Hot melt resin technology, which makes
it possible to produce solvent-free adhesives for customers
in the heating, ventilating, and air conditioning markets.
New technology to replace lead curing systems, resulting in 100
percent lead-free products used in the industrial insulation
market.
ConvertingBusiness: Water-based and hot meltadhesives, used in corrugated, tissueand towel, envelope, tubewinding,laminating, bag, folding carton, tape andlabel industries.
Developments: High-performance polymers that improvemachine stability and application performance for adhesivesused in manufacturing folding cartons and film laminating.
New technology to replace natural latex-based adhesives invarious medical applications.
4
H.B. Fuller At A Glance
Adhesives, Sealants and CoatingsH.B. Fuller Company’s largest worldwide business category is adhesives, sealants
and coatings. These products, in thousands of formulations, are sold to customers
in a wide range of industries. The black section contains brief profiles of our primary
markets.

Developments: From toluene-free to completely solvent-free adhesive alternatives that help satisfy today’s increasinglystringent environmental regulations while employing newmanufacturing techniques for faster, easier footwearproduction.
Developments: ADVANTRA™ hot melt adhesives, whichoffer flexible film laminating products that allow perfectbound books to lay flat for easier reading.
New polymers for difficult-to-bond book components,providing improved adhesion and performance.
FootwearBusiness: Moisture-curing andconventional hot melts, water-basedand toluene-free adhesive systems forthe diverse adhesive applicationsrequired in the footwear industry.
Graphic ArtsBusiness: Adhesives used to bindhardcover and paperback books,magazines, trade journals, technicalmanuals, phone books, puzzles andgame boards.
Nonwoven/HygienicBusiness: Primarily hot meltadhesives used in the construction andassembly of disposable diapers,feminine care and adult incontinenceproducts and disposable medicalgarments.
Developments: New technology for elastic attachmentadhesives offering improved performance while allowing thecustomer to use less product.
Next-generation construction adhesives based on newpolymers offering enhanced product characteristics.
Global CoatingsDivisionBusiness: Powder coatings are usedby the architectural, automotive, officefurniture, lawn and garden equipmentand other metal fabricating industries.
Developments: KOOLKOTE™ product line offers the highheat performance of liquid coatings, while enjoying the environ-mentally friendly benefits associated with powder coatings.
Engineered Wood Coating - A powder coating system thatcan be applied to man-made wood products such asmedium density fiberboard used in office furniture, desk topsand kitchen cabinets.
Linear Products, Inc.Business: Worldwide leader inreinforcement and easy-open featuresfor corrugated and folding cartonpackaging, plus hot melt adhesives andtape products for veneer composing.
Developments: Cutting Edge™ tape used to form thecutting edge on corrugated boxes and folding cartons ofrolled aluminum foil, waxed paper and plastic wrap, whichprovides a more efficient, economical and value-addedalternative to the traditional metal serrated edge.
PackagingBusiness: Water-based and hotmelt adhesives used to close, seal,label, wrap, reinforce, palletize andprepare boxed, bottled and cannedproducts for shipping and use.
Developments: ADVANTRA™ hot melt adhesives helpmanufacturers achieve better performance at a lower totalcost for case and carton sealing, tray forming, and otherpackaging applications. ADVANTRA hot melts boast newtechnology that improves and enhances all aspects of thepackaging process.
5

TEC Specialty Products, Inc.Business: Manufacturer and marketerof ceramic tile installation products,flooring adhesives, surface preparationproducts, exterior insulation finishsystems and epoxy terrazzo flooring.
Developments: Introduced AccuColor® sanded andunsanded caulks, for a complete color-matched tileinstallation.
Made significant investments to upgrade manufacturingcapabilities at all facilities in response to TEC’s growingmarket share in worldwide ceramic tile, flooring and exteriorfinish markets.
PolymerBusiness: Polymers manufacturedfor use in adhesives, sealants andcoatings, used internally andmarketed externally.
Developments: New polymer products improve machinestability and application performance for the Packaging/Converting, Graphic Arts, Woodworking and FosterProducts markets.
Expanded Blue Ash, Ohio, manufacturing facility, adding twonew reactors and significantly increasing polymer productioncapacity.
TobaccoBusiness: Adhesives used tomanufacture and package cigarettes,cigars, snuff, chewing tobacco and pipetobacco.
Developments: Enhanced Greensboro, N.C., manu-facturing facility to meet more rigorous industry standards.
New water-based products keep pace with the extremelyhigh production speeds.
WindowBusiness: Sealants, thermal barriersand a revolutionary new hot meltdesiccant used for window andinsulated glass assembly.
Developments: INSUL-CURE™ insulating glass sealant
combines the speed of handling of a hot melt with the high-
performance of a thermoset. The one-component
INSUL-CURE alleviates meter/mix and handling issues of the
traditional two-part thermosets.
WoodworkingBusiness: Adhesives for laminatingedgebanding, cabinet and furnitureassembly, flush door construction and arange of millwork operations.
Developments: New high-performance hot melt
moisture-cure products used in the manufacturing of
various panel products such as office partitions, doors and
wall panels.
PaintsBusiness: Protecto® paints – theleading brand in Central America –used for interior and exterior con-sumer and industrial applications, andGlidden® paints, sold in Costa Rica,Panama, and Ecuador.
Developments: High Standard™, by Protecto, the onlyline in the market offering four latex finishes: flat, eggshell,satin and high gloss.
Sellatec™, by Protecto, protects cement and concretesurfaces against stain and provides alkaline resistance.
6
7
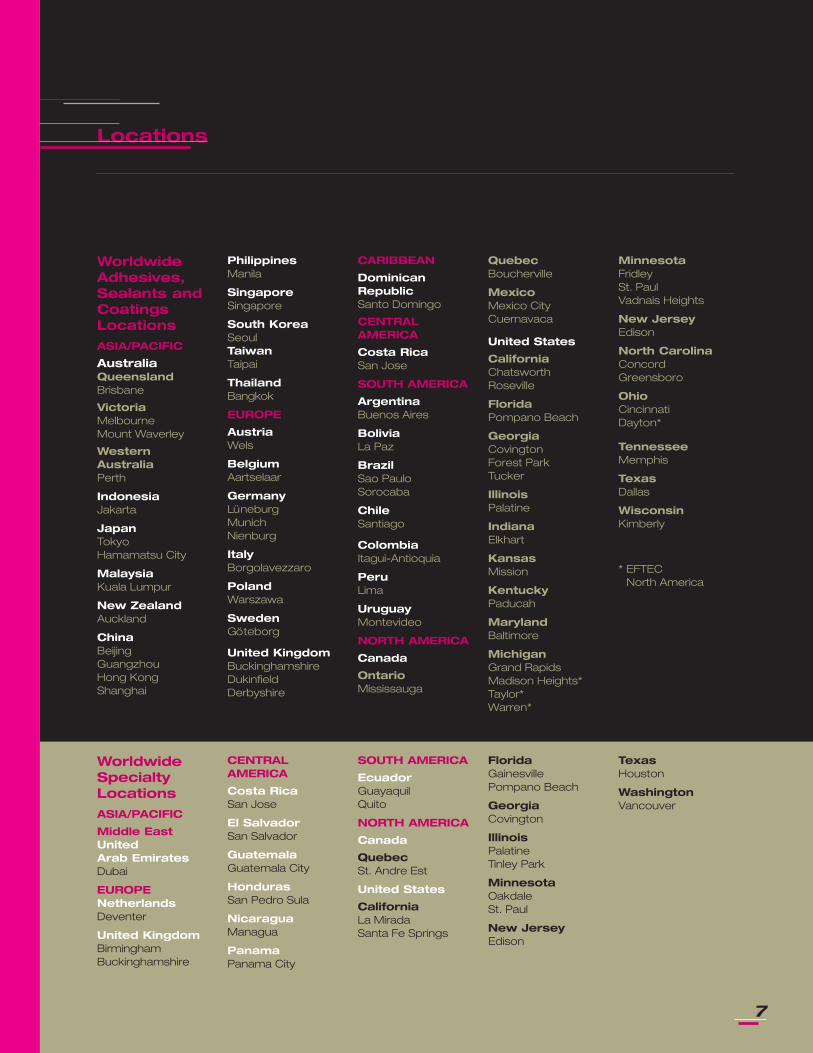
WorldwideAdhesives,Sealants andCoatingsLocations
ASIA/PACIFIC
AustraliaQueenslandBrisbane
VictoriaMelbourneMount Waverley
WesternAustraliaPerth
IndonesiaJakarta
JapanTokyoHamamatsu City
MalaysiaKuala Lumpur
New ZealandAuckland
ChinaBeijingGuangzhouHong KongShanghai
PhilippinesManila
SingaporeSingapore
South KoreaSeoulTaiwanTaipai
ThailandBangkok
EUROPE
AustriaWels
BelgiumAartselaar
GermanyLüneburg MunichNienburg
ItalyBorgolavezzaro
PolandWarszawa
SwedenGöteborg
United KingdomBuckinghamshireDukinfieldDerbyshire
CARIBBEAN
DominicanRepublicSanto Domingo
CENTRALAMERICA
Costa RicaSan Jose
SOUTH AMERICA
ArgentinaBuenos Aires
BoliviaLa Paz
BrazilSao PauloSorocaba
ChileSantiago
ColombiaItagui-Antioquia
PeruLima
UruguayMontevideo
NORTH AMERICA
Canada
OntarioMississauga
QuebecBoucherville
MexicoMexico CityCuernavaca
United States
CaliforniaChatsworthRoseville
FloridaPompano Beach
GeorgiaCovingtonForest ParkTucker
IllinoisPalatine
IndianaElkhart
KansasMission
KentuckyPaducah
MarylandBaltimore
MichiganGrand RapidsMadison Heights*Taylor*Warren*
MinnesotaFridleySt. PaulVadnais Heights
New JerseyEdison
North CarolinaConcordGreensboro
OhioCincinnatiDayton*
TennesseeMemphis
TexasDallas
WisconsinKimberly
* EFTEC North America
Locations
WorldwideSpecialtyLocations
ASIA/PACIFIC
Middle EastUnited Arab EmiratesDubai
EUROPENetherlandsDeventer
United KingdomBirminghamBuckinghamshire
CENTRALAMERICA
Costa RicaSan Jose
El SalvadorSan Salvador
GuatemalaGuatemala City
HondurasSan Pedro Sula
NicaraguaManagua
PanamaPanama City
SOUTH AMERICA
EcuadorGuayaquilQuito
NORTH AMERICA
Canada
QuebecSt. Andre Est
United States
CaliforniaLa MiradaSanta Fe Springs
FloridaGainesvillePompano Beach
GeorgiaCovington
IllinoisPalatineTinley Park
MinnesotaOakdaleSt. Paul
New JerseyEdison
TexasHouston
WashingtonVancouver
H.B. Fuller 1998 Annual Report8
President’s Letter to Stakeholders
Decisive. Determined. Dynamic. These three words
best define H.B. Fuller Company today. If you have
followed us closely, you know that 1998 was a
watershed year for our company, as we began
redefining H.B. Fuller. Among the changes we
experienced was a transition in leadership. President and C.E.O. Walter
Kissling retired after 41 years of service to the company. I joined
H.B. Fuller in mid-April, following a 29-year career with Bayer A.G.
Leading H.B. Fuller into the next millennium is an exciting opportunity.
Our company is rich with history, rich with enthusiastic and energetic
employees, and rich with ideas. These assets are essential as we
position H.B. Fuller to thrive in an increasingly competitive, global
operating environment.
In fiscal ’98, we faced some of the tough challenges inherent in
performing under such conditions. Our business, like that of other global
manufacturers, was impacted by the economic crisis in Asia. Initially, only
our regional business was affected, but as financial turmoil continued,
exports of goods from the United States and Europe slowed, resulting in
a secondary effect – the slowing of our largest adhesives market,
packaging. Elsewhere, slowdowns in Brazil and Chile also affected our
results, and the two-month General Motors strike in midyear impacted
our North American automotive-related businesses. Finally, we faced
pricing pressures due to the general economic downturn.
Despite these significant challenges, we modestly grew our business
and continued to reduce costs. We increased sales 3.1 percent to
$1.347 billion. Operating expenses as a percent of sales declined 0.1
percent. Net earnings and net earnings per share (basic) of $37.3
million and $2.72, respectively, were only slightly better than 1997
results, prior to a restructuring charge of $21.3 million (after tax),
Albert P.L. Stroucken
Today’s H.B. Fuller
Decisive.Determined.Dynamic.
H.B. Fuller 1998 Annual Report 9
taken in the third and fourth quarters.
Clearly, we’re not happy with our results. Throughout the company, we
have a strong desire to significantly grow our sales and earnings while
enhancing our position in specialty chemical markets – and are
committed to doing so. This resolve led us to develop and implement a
more aggressive strategic plan in 1998. Executing this plan was the
driving force behind our activity in the second half of the year, and will
continue to be a dominant focus in 1999. The remainder of this report is
devoted to reviewing the plan and our progress.
As we move forward, I am confident we will be successful in
implementing our plan and improving results, largely because of the
three attributes cited above: our organization today is decisive,
determined and dynamic.
• First, today’s H.B. Fuller is decisive. I believe that when you know what
must be done, you should act quickly. At H.B. Fuller, we understand
the “need for speed.” We also know how to strengthen our company
and position it for the future, and have developed and introduced a
solid plan to address both short-and long-term needs. Furthermore,
we are not afraid to make tough choices.
• Second, today’s H.B. Fuller is determined. We have in place many of
the ingredients essential to success: a world-class research facility,
many excellent product lines, renowned customer service, and most
importantly, knowledgeable, dedicated employees who want to win.
• Finally, today’s H.B. Fuller is dynamic. One of the characteristics that
most impresses me about our company is its ability to transform itself.
H.B. Fuller employees are truly energized. They possess the zeal and
enthusiasm needed to turn challenges into opportunities, and are
actively doing so.
To be truly valuable, a missionstatement must be regarded as aliving document. In this spirit, asH.B. Fuller Company refined itsstrategic direction in 1998, it alsorevised its mission statement.Most notably, the changes maderepresent the organization’scurrent thinking: that allconstituents are equallyimportant, and that obligations tothem must be balanced if thecompany is to be successful inthe future.
The new statement now reads:
“The H.B. Fuller CorporateMission is to serve its customersas a leading worldwide formulator,manufacturer and marketer oftechnology-driven specialtychemicals and other productsrelated to its area of expertise.H.B. Fuller is committed to thebalanced interests of itscustomers, employees,shareholders and communities;and accordingly, H.B. Fuller willconduct business ethically andprofitably, support the activities ofits employees in theircommunities, and exerciseleadership as a responsiblecorporate citizen.”
OurMissionStatement
Energized to Meet Tomorrow’s Opportunities
H.B. Fuller 1998 Annual Report10
DecisiveOur plan
Beginning in May, the leadership team, composed of the
company’s key managers and myself, engaged in an
intensive strategic planning process. H.B. Fuller had taken
a number of steps throughout the past several years to
improve results and competitiveness. These included
initiatives reported on in 1997, notably efforts to
streamline procurement processes, a far-reaching review of corporate
functions and the related allocation of resources, and expansion of our
strategic business unit concept. These were an excellent start. We built on
this groundwork, developing a comprehensive plan, approved by the
board of directors in July.
The plan contains both operational objectives and strategic initiatives. Short-
term in nature, the operational objectives are, in essence, actions we are
taking now to become more competitive, cost-effective and responsive.
Results should become visible in 1999. Operational objectives include:
• Flattening the organizational structure
• Reducing overall operating costs throughout our organization
• Globalizing supply chain management
• Selling or closing underperforming assets and divesting nonstrategic
businesses
While our objectives reflect our commitment to immediately improve
results, our strategic initiatives are dedicated to building an organization
that is strategically focused and positioned for sustainable long-term
growth and profitability.
Strategic initiatives include:
• Setting aggressive growth goals for our core adhesives business in
Today’s H.B. Fuller
Decisive.Determined.Dynamic.
Jim ConatyPresident and Chief Executive Officer
EFTEC North America
“We continue to build our EFTECglobal franchise by capitalizing onthe strengths of each of ourregional businesses. Internalbenchmarking has helped usidentify best practices andprocedures throughout the jointventure, and transfer these toother parts of our worldwideoperations. For instance, in NorthAmerica, we are aggressivelypursuing market opportunities forour European-developedWindshield Bonding Adhesivetechnology, while in Europe andAsia, our U.S.-based Body ShopAdhesive and Sealant expertise isbeing transferred.”
H.B. Fuller 1998 Annual Report 11
North America, key European markets, South
American growth markets (Brazil, Argentina, Chile),
and established Asia/Pacific markets.
• Strengthening our proven strategic business unit
(SBU) organization, to fully exploit its potential.
• Building and expanding our Specialty portfolio, to
capitalize on opportunities presented by these
entrepreneurial, niche businesses.
• Realigning our Research and Development
organization to increase speed of commercialization
for new products and technologies, and to fully support our strategic
objectives.
• Strategically aligning compensation with corporate goals and
objectives.
DeterminedOur progress
We have made solid progress in implementing the plan. To meet the
operational objectives, we have taken numerous actions, including the
following:
• Flattened organizational layers throughout the company, increasing
spans of responsibility where appropriate. We have reduced layers to
no more than six layers in the reporting chain. I firmly believe that
organizations with less hierarchy are more on top of their challenges
and better able to quickly surmount them and exploit future
opportunities.
• Reduced our administrative workforce corporately, divisionally and
regionally.
• Streamlined our European operations, reducing the workforce at our
Lüneburg, and Nienburg, Germany, and Wels, Austria, production
facilities. We also announced the planned closing of manufacturing
Matthew CritchleyGroup President and General Manager
Asia/Pacific ASC
Energized to Meet Tomorrow’s Opportunities
“In Asia/Pacific’s ever-changingenvironment, the opportunities forH.B. Fuller are immense. Thechallenge is to identify the correctones, and to move quickly anddecisively. The company’s recentrestructuring and focus on globalstrategic business units allowsthis to occur. As a result, excitingnew business has developed infootwear, graphic arts andwoodworking, which togetherwith several acquisitions, areexamples of how we are growingour business.”
H.B. Fuller 1998 Annual Report12
facilities in France and the Netherlands. Since the end
of fiscal ’98 we have announced additional closings in
Spain and Switzerland.
• Began consolidating and centralizing manufacturing
operations in Latin America, announcing plant
closings in Venezuela, Puerto Rico and Honduras,
and expansions in Costa Rica and Colombia.
• Began converting direct sales offices to third-party
distributors, many of whom are former employees,
enabling us to reduce costs without sacrificing
customer service. This is occurring in Ecuador, El Salvador, Guatemala,
Honduras, Panama and Puerto Rico.
• Closed, consolidated and relocated a number of offices and services
in our Asia/Pacific region to operate more cost effectively. For instance:
we relocated our group office from Hong Kong to Melbourne,
Australia; closed our production facility in Taiwan; downsized sales
offices in Japan; consolidated order entry services in Japan as well as
in Australia; and closed several warehouses in Australia.
• Hired a corporate vice president and manager of supply chain
management to lead the transformation of our procurement and
logistics functions, enacting a truly global strategy.
• Sold our North American glue stick and gun adhesives business to
Bostik Inc., and subsequently closed our Wilmington, Mass., plant.
We also divested our European specialty wax business to Paramelt
B.V. of the Netherlands, and announced our intent to sell our ink
business in Latin America.
By the time we complete the short-term portion of our plan in 1999, we
anticipate reducing employment levels by approximately 10 percent
worldwide (excluding acquisitions), and closing one-fourth of our
adhesives manufacturing facilities. Our restructuring efforts should
ultimately reduce operating costs in excess of $30 million on an
annualized basis. To cover expenses incurred in implementing the plan,
such as asset write-offs and severance, we announced an estimated
Today’s H.B. Fuller
Decisive.Determined.Dynamic.
“Tremendous changes are takingplace in Europe, as countries arecoming together as a strong,homogeneous unit to bettercompete in the global economy.At H.B. Fuller, we are determinedto follow the same trend, andhave refocused and streamlinedour resources on the continent tobecome a unified, strong anddynamic team that can satisfy theneeds in our markets today andtomorrow. We remain committedto our leadership role, and willcontinue to focus on technology,innovation and customer serviceto secure further growth.”
Peter KoxholtGroup President and General Manager
Europe ASC
H.B. Fuller 1998 Annual Report 13
$40 - $45 million (pre-tax) restructuring charge. As
previously noted, $21.3 million (after tax) of this charge
was taken in 1998, and the remainder will be taken by
the end of fiscal ’99.
Our strategic initiatives have progressed concurrently
with our operational activities. In 1998, we made the
following progress:
• Strengthened our position in core adhesives markets
in New Zealand and Australia by acquiring the adhesives business of
Peterson Chemicals from Ecolab Inc. and select assets from Croda
PLC. We likewise bolstered our presence in the United Kingdom with
the acquisition of Industrial Adhesives Limited (IAL), previously a
subsidiary of Burmah Castrol, and the Datac Group, a privately owned
business.
• Restructured our global SBU organization, giving our global SBU
managers full responsibility for setting strategic market direction, and
aligning all support resources, including marketing, sales, technical
and operational support. This enables us to better focus our efforts,
apply resources more efficiently and effectively, and ultimately, places
us in a superb competitive position.
• Added a global footwear SBU, to capitalize on growth opportunities in
the footwear adhesives market.
• Realigned our Research and Development organization to better
address strategic priorities.
• Developed a compensation system based on Value Creation,
aligned with our strategic plan. It is being implemented in fiscal ’99.
We will use this business metric, defined as adjusted net operating
profit after tax minus the cost of average net invested capital, as a
key component of our senior management incentive plans.
Incentive bonuses will be paid in a combination of cash and stock
options. Value Creation will be driven throughout the organization, to
focus employees’ attention on our central purpose: creating value
Tony LoboVice President and General Manager
Latin America ASC
Energized to Meet Tomorrow’s Opportunities
“In Latin America, H.B. Fuller’sadhesives business is undergoinga dramatic change, with theconsolidation of manufacturinginto fewer plants, the adoption ofa more efficient distribution modelfor the smaller countries, and arenewed focus on marketopportunities through our SBUs.A great deal of effort has goneinto the design of the neworganization, which will becomefully functional during 1999. Afterthis intense change process, wewill be more efficient, morecustomer-responsive and moreproductive.”
H.B. Fuller 1998 Annual Report14
for all of our constituencies. In addition, we are
replacing our Profit Share Plus plan with a cash bonus
plan based on business unit performance.
I am proud of the significant progress our associates have
made in such a brief time, a sign of their determination.
Their accomplishments are particularly impressive when
you consider the challenging operating conditions
H.B. Fuller, like other specialty chemical companies —
indeed, like all global manufacturers — faced in 1998.
Again, we are convinced we are on the right track, and that our efforts
will begin to be reflected in our financial results in 1999.
DynamicOur people
Upbeat. Powerful. Vigorous. Active. These are but a few adjectives that
describe the H.B. Fuller spirit. For, in addition to implementing our plan,
which required intensive participation at all levels of the organization, our
employees continue to strive for excellence — successfully — in their
day-to-day duties. Consider the following 1998 accomplishments:
• Introduced ADVANTRA™ hot melt adhesives based upon a new
polymer technology. Customers applauded the line for its high
performance and trouble-free application. Initial target markets
include packaging, graphic arts and nonwoven. ADVANTRA hot melts
have aggressive bonding properties, are odorless, boast a true clear
color and deliver a cleaner application.
• Purchased technology from NiTech Corporation that will be used to
produce free-flowing pressure sensitive adhesives (PSAs) in pelletized
form. This is the ideal way to handle PSAs, used primarily in the tape
and label market, and represents the first time such pellets will be
available on a wide-scale basis.
Al LongstreetSenior Vice President
Global Strategic Business Units
Today’s H.B. Fuller
Decisive.Determined.Dynamic.
“We have positioned ourselves tomaximize our global capabilitiesand meet the strategic needs ofour key markets by reorganizingour global strategic business units(SBUs). The new structure ismarket-and technology-driven,and will facilitate decision-makingand fuel growth. Ultimately, it willenhance our global coverage andexpand our ability to rapidlyrespond to market changes.”
H.B. Fuller 1998 Annual Report 15
• Developed and introduced both water-based and hot
melt moisture cure technologies for the footwear
market. These offer the advantages of being solvent-
free, and in the case of hot melt moisture cure, a
speedier bond. Top footwear manufacturers
worldwide are testing our products.
• Introduced Cutting Edge™ tape, used to form the
cutting edge on corrugated boxes and folding
cartons of rolled aluminum foil, waxed paper and
plastic wrap. Linear Products, Inc., is marketing it as a more efficient,
economical and value-added alternative to the traditional metal
serrated edge.
• Opened a state-of-the-art manufacturing plant in Covington, Ga., to
meet the need for increased capacity in our Global Coatings
business. The facility is designed to efficiently handle large powder
coating production runs.
• Began transferring direct glazing technology from our EFTEC joint
venture partner, to increase our market presence in the North
American automotive industry.
• Continued implementation of our Progress 2000 initiative, a
comprehensive, multi-year effort to develop a standard information
technology infrastructure throughout the company by the year 2000.
The PRISM component (incorporating customer order entry,
manufacturing and finance) has now been implemented in nearly all
Specialty businesses (Global Coatings; TEC Specialty Products, Inc.;
Linear Products, Inc.; and Foster Products Incorporated); select ASC
locations (Canada, Europe and Australia), and EFTEC operations.
Remaining North American and Japanese operations plan to
implement PRISM in 1999.
• Built introductory modules of our Technical Knowledge System (TKS),
the second part of our Progress 2000 initiative. TKS is a global
knowledge management system with two key components: a central
database, which will be used to capture, distill and globally distribute
technical knowledge throughout H.B. Fuller; and a laboratory project
Walter NussbaumerChief Technology Officer
Energized to Meet Tomorrow’s Opportunities
“Our future success will stronglydepend on deploying allavailable tools and resourceswith focus and diligence, tosignificantly speed up thedevelopment process for newtechnologies and products. Anin-depth understanding ofmaterial properties, theirinteractions, and how theyaffect and are impacted by theenvironment, are importantdifferentiating factors in the racefor success. Interaction andcooperation with suppliers andcustomers are likewiseessential.”
H.B. Fuller 1998 Annual Report16
management system, which will enable us to
document, prioritize, track, and evaluate laboratory
projects. TKS is currently being implemented, with
completion targeted for the end of the year 2000.
• Continued preparations to retrofit and update
information systems in anticipation of the upcoming
Year 2000 date change. Completed assessments
throughout all regions and began upgrading core
business applications, as necessary. Most “mission
critical” systems will be compliant by April 1999; we
anticipate the majority of applications will be compliant by mid-year.
Also established a Year 2000 project office and cross-functional task
force to identify business risks and develop contingency plans and other
strategies to minimize or avoid business disruption.
• Achieved ISO certification at facilities in Roseville, Calif.; Palatine, Ill.;
Fridley, Minn.; Greensboro, N.C.; Memphis, Tenn.; and Mississauga,
Ontario, Canada; re-certification in Paducah, Ky., and Houston, and
QS9000 registration (a comparable standard with requirements
specific to the automotive industry) at our Mesquite, Texas, facility.
Our Taylor, Mich., facility, part of our EFTEC automotive joint venture,
also became compliant in 1998. Including joint venture sites, 27
H.B. Fuller facilities have now attained this standard.
• Received Environmental Protection Agency certification for
completing Green Lights, a voluntary program that promotes the use
of energy-efficient lighting technologies, while reducing the
company’s energy costs.
• Continued to play an active role in many of our communities, both
through employee volunteerism and corporate contributions,
celebrating 25 years of commitment to our communities in 1998.
• Responded on a worldwide basis to hurricane-devastated Central
America, as employees made personal contributions, matched two-for-
one by the company, and helped locally with clean-up and relief efforts.
John RaySenior Vice President and
General Manager, North America ASC
Today’s H.B. Fuller
“Our greatest strength stemsfrom a single, successful formula– one combining industry focus,innovative technology, and mostimportantly, responsivecustomer service. For more thana century, H.B. Fuller hasdifferentiated itself with a higherlevel of commitment andexpertise. Our relationship withcustomers is based oncontinuing communication,practical problem-solving,speedy response, and a solid,long-term confidence earned bya history of successes. Servingthe customer continues to beour top priority. It’s a strategythat brought us success in thepast, and it will continue toenergize us in the future.”
Decisive.Determined.Dynamic.
H.B. Fuller 1998 Annual Report 17
Energized to meet tomorrow’s opportunitiesOur future
Looking ahead to 1999, we expect to be challenged by
similar market conditions — global slowdowns,
unfavorable currency trends, and stiff competition. These
are simply the facts of commerce today. At H.B. Fuller
Company, we view these as challenging opportunities to
build a better business, creating value for all of you who
have a stake in our company.
Today’s H.B. Fuller is a decisive, determined and dynamic organization.
We are excited about the future, and are boldly confident that our
capabilities, plans and actions will lead us to success. Indeed: we are
energized to turn tomorrow’s challenges into opportunities.
Albert P.L. Stroucken
President and Chief Executive Officer
Energized to Meet Tomorrow’s Opportunities
Linda Welty Group President and
General Manager, Specialty
“By functioning autonomously,the Specialty Group’s fivedivisions have been able to actdecisively, identifying andresponding quickly to marketneeds, subsequently growingtheir respective businessesswiftly, in an entrepreneurialfashion. As a result, Specialtyhas become a significantcontributor to H.B. Fuller’sportfolio. We look forward tobecoming an even moredynamic part of the companyas we move toward the nextmillennium, by continuing tocultivate the uniqueopportunities presented to ourniche businesses.”

In 1998, H.B. Fuller Company formed a Leadership Council, guided by
Al Stroucken and comprised of the senior managers in charge of
operations and administrative functions. The Leadership Council is
responsible for developing, implementing and regularly reviewing the
company’s strategic plan. In addition to Al Stroucken, it includes several
executives new to H.B. Fuller in 1998. Linda Welty, previously with
Clariant International, joined H.B. Fuller Company as head of the
Specialty Division in September, succeeding Sarah Coffin, who accepted
a position outside the company. Peter Koxholt, formerly of Bayer A.G.,
succeeded the retiring Hermann Lagally in Europe, effective Jan. 1, 1999.
Walter Nussbaumer, director of Research and Development, was
promoted to vice president and chief technology officer, as Rolf
Schubert retired from that position after 37 years of service to
H.B. Fuller. Matthew Critchley was promoted to group president
and general manager of the Asia/Pacific Adhesives Sealants and
Coatings business, succeeding Al Longstreet, who took on the
new assignment of group manager for global SBUs.
Leadership Council
Also serving on the Leadership Council in 1998 were Jerry Scott, who
retired from his position as senior vice president, Operations, in October,
after 36 years with the company, and Joe Pellish, vice president of
Environment, Health and Safety, who will retire early this year. We welcome
the talent and expertise of those new to our team, and extend our
gratitude and best wishes to those moving on to a new facet of life.
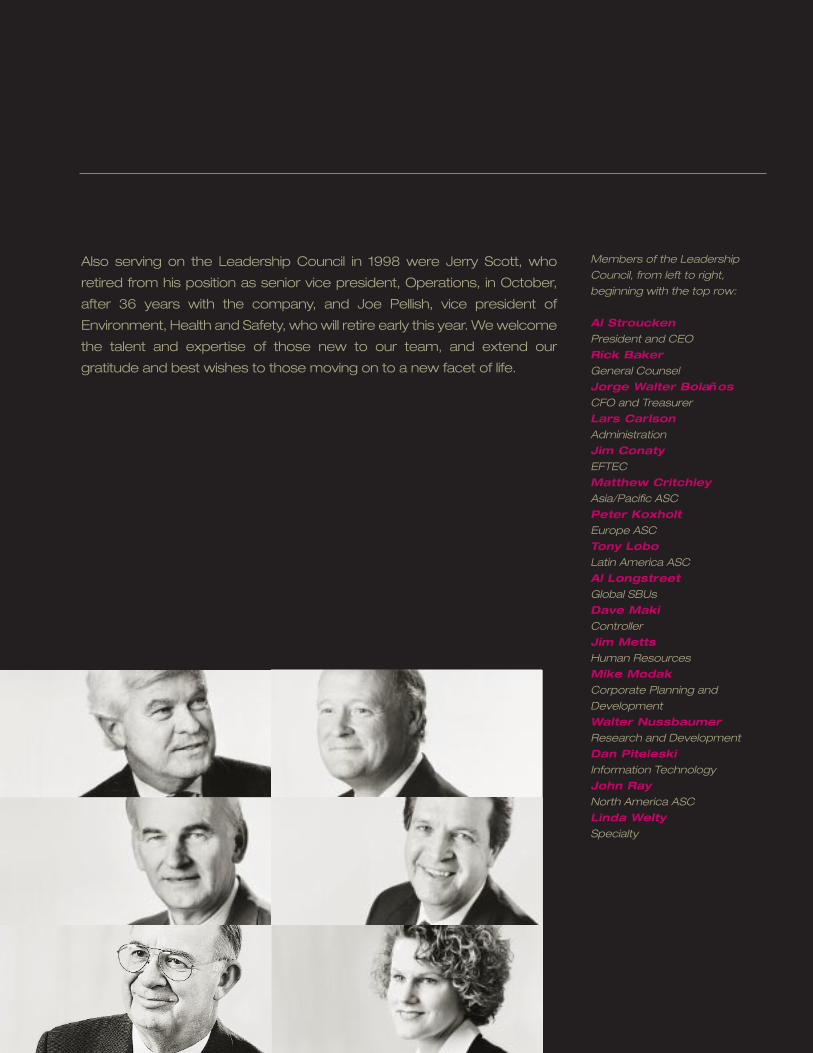
Members of the Leadership
Council, from left to right,
beginning with the top row:
Al StrouckenPresident and CEO
Rick Baker General Counsel
Jorge Walter BolañosCFO and Treasurer
Lars CarlsonAdministration
Jim Conaty EFTEC
Matthew CritchleyAsia/Pacific ASC
Peter KoxholtEurope ASC
Tony LoboLatin America ASC
Al LongstreetGlobal SBUs
Dave MakiController
Jim MettsHuman Resources
Mike ModakCorporate Planning and
Development
Walter Nussbaumer Research and Development
Dan Piteleski Information Technology
John RayNorth America ASC
Linda WeltySpecialty
H.B. Fuller 1998 Annual Report20
I started my career with H.B. Fuller Company morethan 40 years ago, as a field sales representativebased in Omaha, Neb. At the time, H.B. Fuller was acluster of regional companies, operating across theUnited States, generating sales of approximately$8 million. Today, we do business on a global basis,reaching customers in more than 100 countries.
As we grew in size, we evolved, adapting ouroperations to meet the changing needs of ourcustomers. Guiding us at each major juncture wereour core values – responsibility, honesty andrespect – and they remain our guideposts today.
In Al Stroucken’s letter, you read of thetransformation H.B. Fuller is currently undergoingas we prepare our company for the next century.This is, no doubt, one of the most intense periodsof change our company has experienced. Al hastold us it is necessary if we are to remain acompetitive force, one capable of serving all itsconstituencies well.
Such change, however, doesn’t mean that weare losing sight of what has consistently made H.B. Fuller a great company. Indeed, quite thecontrary. It could be said the art of progress is topreserve sound values amid change and toencourage change while maintaining the sound
values. More than ever, in this fast-paced world,we need our values and principles to guide us aswe make decisions that affect our customers,our employees, our shareholders/owners andour communities.
Throughout my association with H.B. Fuller, I havebeen proud of the dedication we have shown ourconstituencies: customers, employees, share-holders/owners and communities. While wemake changes in our operations, our commit-ment to each must remain steadfast.
Today’s H.B. Fuller is an exciting company. Inaddition to Al and his leadership team, H.B. Fullerhas a strong group of associates determined tohelp ensure the company’s future success. Ouremployees are the core strength of ourcompany. They have the values, know-how,experience and energy to build the company.
Though we have a 112-year history, it was nearly 60years ago...1941...when Elmer Andersen acquiredthe majority of shares from Mr. Harvey Fullerfollowing Mr. Fuller’s heart attack. Elmer put thecompany on the growth track with solid values,beliefs, and principles. As he approaches his 90thbirthday in June 1999, we can say thank you forwhat you did for H.B. Fuller Company and have ahappy 90th!
As always, we appreciate your support of H.B. Fuller, and look forward to the year ahead.
Tony Andersen
Chair, Board of Directors
Anthony L. Andersen
Chair - Board of Directors (A,d,f,g)
Chairman’s Letter to Stakeholders

H.B. Fuller 1998 Annual Report 21
Norbert R. Berg
Retired Deputy
Chairman of the Board
Control Data Corporation
Minneapolis, Minnesota (C,d)
Edward L. Bronstien, Jr.
President, Rybovich Spencer
West Palm Beach, Florida (a,c,D)
Robert J. Carlson
Retired Chairman of the Board
Advanced Aerospace Design Corp.
Scottsdale, Arizona (f)
Freeman A. Ford
Chairman and Chief Executive Officer
Fafco, Inc.
Menlo Park, California (b,F)
Gail D. Fosler
Vice President, Chief Economist
The Conference Board
New York, New York (f)
Reatha Clark King
President, Executive Director
General Mills Foundation
Minneapolis, Minnesota (b,G)
Walter Kissling
Retired President and
Chief Executive Officer
H.B. Fuller Company
St. Paul, Minnesota (e)
John J. Mauriel, Jr.
Faculty, Carlson School
of Management
University of Minnesota
Minneapolis, Minnesota (B,e)
Lee R. Mitau
Executive Vice President
General Counsel and Secretary
U.S. Bancorp
Minneapolis, Minnesota (c,d)
Rolf Schubert
Former Chief Technology Officer
H.B. Fuller Company
St Paul, Minnesota (e,g)
Albert P.L. Stroucken
President and
Chief Executive Officer
H.B. Fuller Company
St. Paul, Minnesota (a,f)
Lorne C. Webster
Chairman and
Chief Executive Officer
Prenor Group, Ltd.
Montreal, Quebec, Canada (E)
Committees of the Board — Upper-case letter indicatescommittee chairA = ExecutiveB = AuditC = CompensationD = Corporate GovernanceE = Retirement PlansF = FinanceG = Corporate Responsibility
Officers are shown in alphabetical order, from left to right, beginning with the top row.
Board of Directors

Albert P.L. StrouckenPresident andChief Executive Officer
Jorge Walter BolañosSenior Vice President Chief Financial Officer and Treasurer
Lars T. CarlsonSenior Vice PresidentAdministration
Alan R. LongstreetSenior Vice PresidentGlobal Strategic Business Units
John T. Ray, Jr.Senior Vice PresidentGeneral ManagerNorth American ASC
Richard C. BakerVice PresidentGeneral Counsel and Secretary
Evelyn M. BorsheimAssistant Corporate Secretary
Peter ButenschönVice PresidentGroup Controller Europe
James R. ConatyPresident andChief Executive OfficerEFTEC North America
Matthew CritchleyGroup President General ManagerAsia/Pacific ASC
Paul DorwartVice PresidentGeneral ManagerLinear Products, Inc.
Peter KoxholtGroup PresidentGeneral ManagerEurope ASC
Antonio LoboVice PresidentGeneral ManagerLatin America ASC
David J. MakiVice PresidentCorporate Controller
Gerald K. McGintyVice PresidentGlobal Packaging/Converting SBU
James A. MettsVice PresidentHuman Resources
Walter NussbaumerChief Technology Officer
Wendell W. OstlieVice PresidentProduct Development ASC
William H. PalmataryVice PresidentOperationsNorth American ASC
Joseph M. PellishVice PresidentEnvironment, Health & Safety
Dan PiteleskiVice PresidentInformation Technology
Armin PreussVice PresidentEurope ASC
Gerald J. RudolphVice PresidentManager, Supply Chain Management
Helmut SchweigerVice PresidentEurope ASC
Linda J. WeltyGroup President and General ManagerSpecialty
As of January 1, 1999
Officers
H.B. Fuller 1998 Annual Report22
The following discussion includes comments and data relating tothe Company’s financial condition and results of operations forthe three fiscal years ended November 28, 1998. This sectionshould be read in conjunction with the Consolidated FinancialStatements and related Notes as they contain importantinformation for evaluation of the Company’s comparativefinancial condition and operating results.
Results of Operations:1998 Compared to 1997
Worldwide sales for 1998 were a record $1,347,241, an increaseof $40,452 or 3.1 percent over 1997 sales of $1,306,789. Thesales increase was the result of 2.5 percentage points fromincreased volume and product mix, a net increase of 3.3percentage points from acquisitions and divestitures, a negative1.0 percentage point from reduced pricing and a negative 1.7percentage points due to the strengthening of the U.S. dollar.
Sales changes by geographic area were as follows:
Area Increase/(Decrease)North America $7,395 1%Latin America 5,047 3%Europe 38,454 16%Asia/Pacific (10,444) (11%)Total $40,452 3%
Net earnings for the year decreased from $36,940 in 1997 to$15,990 in 1998. The earnings in 1998 were impacted by$26,747 ($21,284 after tax) of non-recurring charges. 1997 netearnings included a ($3,368) accounting change.
During 1998, the Company incurred non-recurring charges of$26,747 related to a restructuring plan (See Note 3 toConsolidated Financial Statements). The restructuring chargesfor the year included $16,453 of net severance related costs(609 employees), $17,108 for the write-down of assets due tothe restructuring plan, $845 for contract and lease chargesimpacted by the restructuring and $1,322 in other restructuringexpenses. These charges were offset by $8,981 of gains on thesale of two businesses divested as a part of the plan. Therestructuring plan actually generated $2,511 in cash in 1998,with the proceeds of the businesses sold exceeding the cashexpended. At the end of 1998, the balance of the restructuringreserve was as follows:
H.B. Fuller 1998 Annual Report 23
(Dollars in thousands, except per share amounts)
Management’s Analysis of Results of Operations and Financial Condition
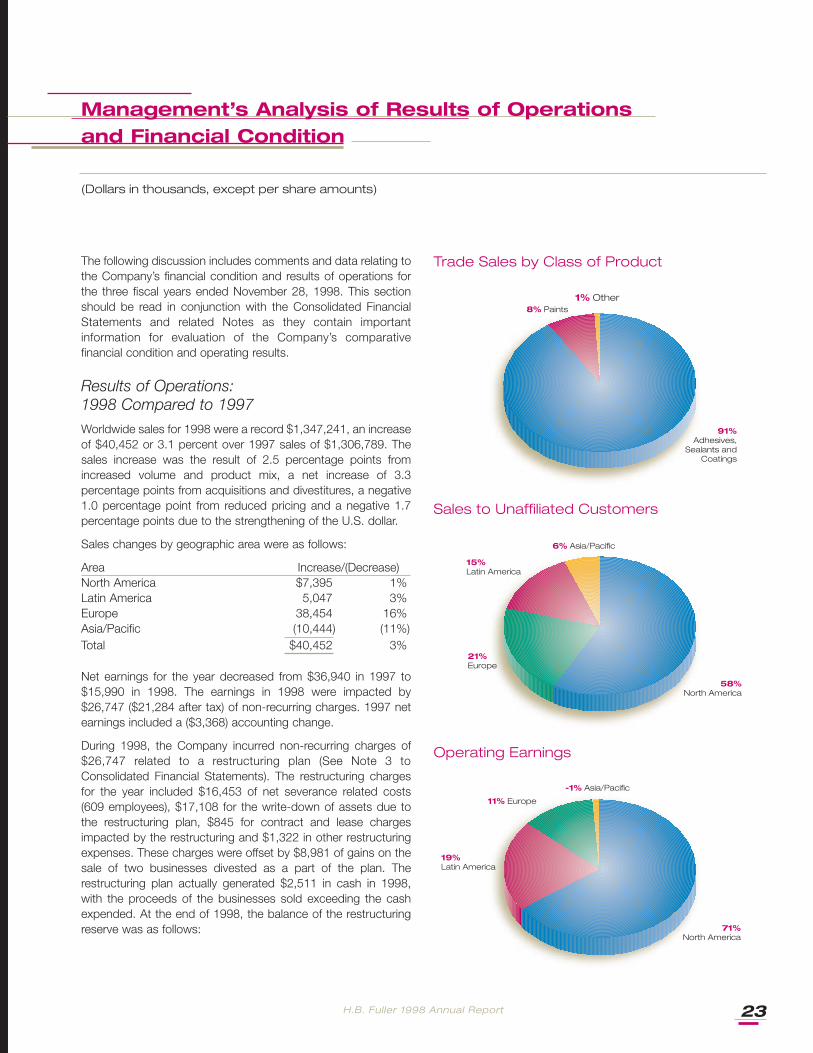
Trade Sales by Class of Product
Sales to Unaffiliated Customers
Operating Earnings
91%Adhesives,
Sealants and Coatings
58%North America
71%North America
21%Europe
15%Latin America
19%Latin America
11% Europe
6% Asia/Pacific
-1% Asia/Pacific
8% Paints1% Other
North Latin Asia/America Europe America Pacific Total
BalanceNovember 29,1997 $ – $ – $ – $ – $ –
Accruals in 1998:Severance 4,749 8,726 3,765 278 17,518Contracts/leases 526 266 – 53 845Consulting 121 764 12 2 899Other 193 – 126 104 423
Payments in 1998:Severance (2,757) (998) (624) (190) (4,569)Contracts/leases (526) – – (53) (579)Consulting (121) (764) (12) (2) (899)Other (193) – (126) (104) (423)
BalanceNovember 28, 1998 $1,992 $7,994 $3,141 $88 $13,215
The restructuring plan anticipated a non-recurring charge of$40,000 to $45,000 (before tax) over six quarters, a reduction ofemployee census of more than 600 and a reduction of costs inexcess of $30,000 (before tax) annually, when completed. Cashrequirements of this plan were estimated to be $29,000 to$30,000 and will primarily by expended in fiscal 1999. As a resultof selling two business units in the fourth quarter of 1998, thetotal amount of the charge is now estimated to be from $35,000to $40,000 (before tax) with approximately $8,000 to $13,000 tobe incurred in fiscal 1999. The cash requirements are nowestimated to be $24,000 to $25,000. The Company hasadequate lines of credit to fund these payments.
In North America, the one percent sales increase was composedof 2 percentage points related to increased volume and changesin product mix and a negative one percentage point impact frompricing and currency. The Adhesives, Sealants and CoatingsGroup had a 2 percent decrease in sales compared to 1997primarily due to a reduction in paper converting sales. TheAutomotive Group (EFTEC) had a 7 percent increase in salescompared to the prior year with 5 percentage points of theincrease the result of the 1997 Automotive acquisitions for thefull year. The General Motors strike during the third quarter of1998 had an approximate 5 percentage point negative impact on1998 EFTEC annual sales. In the Specialty Group, salesincreased 5 percent. Strong increases in TEC SpecialtyProducts, Inc. and Foster Products Corporation sales wereoffset by reduced Linear Products Inc. sales. North Americanoperating earnings decreased from $59,940 to $56,507, before
the $12,879 non-recurring charge. The primary reasons for thisdecrease were the impact of the General Motors strike and theimpact of reduced paper converting sales.
In Latin America, 1998 sales increased 3 percent from 1997. Theincrease in sales was composed of 5 percentage points relatingto increased volume and changes in product mix partially offsetby a 2 percentage point decrease in pricing. Latin Americanoperating earnings decreased 10 percent when compared to1997, decreasing from $15,659 to $14,111, before the $7,406non-recurring charge. Low volumes, economic pressure withinthe region and the impact of Hurricane Mitch were the primaryreasons for the reduction in operating earnings.
In Europe, the 16 percent 1998 sales increase was composed of4 percentage points due to increased volume and changes in
H.B. Fuller 1998 Annual Report24
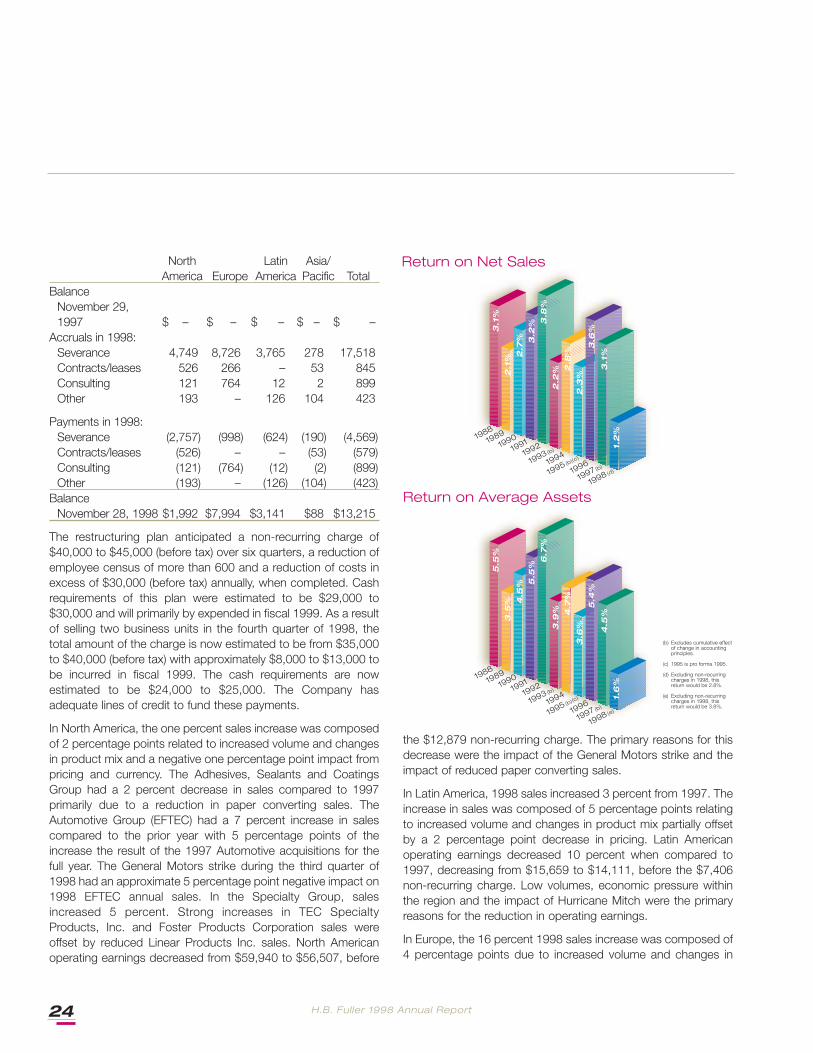
Return on Net Sales
Return on Average Assets
19881989
19901991
1992
1993(b)
1994
1995(b)(c)
1996
1997(b)
1998(d)
19881989
19901991
1992
1993(b)
1994
1995(b)(c)
1996
1997(b)
1998(e)
3.1
%2
.1% 2
.7% 3.2
% 3.8
%2
.2% 2
.8%
2.3
%3
.6%
3.1
%1.
2%
5.5
%3
.5% 4
.5% 5
.5%
6.7
%3
.9% 4.7
%3
.6%
5.4
%
4.5
%1.
6%
(b) Excludes cumulative effectof change in accountingprinciples.
(c) 1995 is pro forma 1995.
(d) Excluding non-recurringcharges in 1998, thisreturn would be 2.8%.
(e) Excluding non-recurringcharges in 1998, thisreturn would be 3.8%.
product mix, a net 16 percentage point increase related to two1998 United Kingdom (U.K.) acquisitions and the divestiture ofthe construction business in 1997 and the wax business in 1998,and a negative 4 percentage points from pricing andstrengthening of the U.S. dollar. Operating earnings increasedfrom $11,112 in 1997 to $17,627 in 1998, before the $6,025non-recurring charge, with operating earnings from the U.K.acquisitions and control of operating expenses being the primaryreasons for the increase.
Asia/Pacific sales decreased 11 percent from sales in 1997. Thestrengthening of the U.S. dollar, compared to local currencies,caused a 15 percentage point decrease. The remaining changeswere a positive 6 percentage point increase due to increasedvolume and changes in product mix, offset by a net negative 2percentage points resulting from a divestiture and an acquisitionin New Zealand in 1998 and an acquisition in Australia late in1997. Operating earnings decreased from $541 in 1997 tooperating losses of $286 in 1998, before the non-recurringcharge of $437, with all of the change resulting from the NewZealand divestiture.
The Company continues to develop its organization andimplement strategies to effectively serve large global customers,recognizing that, along with significant opportunities for salesgrowth, such an approach also carries the usual risks ofincreasing dependence on fewer large customers. In 1998, nosingle customer accounted for over 5 percent of Companywidesales. Increasing globalization of corporate functions such asinformation technology, purchasing, research and development,manufacturing, engineering and quality programs should result inimproved productivity and customer service.
Consolidated gross margin for the Company, as a percent ofsales, decreased from 31.6 percent in 1997 to 31.3 percent in1998. During 1998, the Company overall experienced stable rawmaterial costs. Gross margins for Europe improved from 1997levels. The primary cause for the overall decrease in grossmargins were economic pressures in Latin America andAsia/Pacific.
Consolidated selling, administrative and other expenses for theCompany, excluding non-recurring charges (See Note 3 toConsolidated Financial Statements), increased $8,210 or 2.5percent from 1997, and as a percent of sales, decreased from24.9 percent in 1997 to 24.8 percent in 1998. This decrease wasprimarily the result of employee census control, cost controlefforts and continued globalization of the Company. The year-
end 1998 employee census decreased one percent to 6,000 inspite of the fact that 1998 acquisitions and divestitures addedapproximately 200 employees.
Interest expense was $26,989 in 1998, up $7,153 or 36.1percent from the prior year. Total Company borrowings at year-end 1998 were above that at year-end 1997, primarily as a resultof borrowings to fund acquisitions. Capitalized interest costsassociated with major property and equipment projectsdecreased from $1,245 in 1997 to $822 in 1998.
Other income/expense, net, changed from $7,295 expense in1997 to $4,674 expense in 1998, primarily as a result of 1997consulting costs and the 1997 costs associated with pursuing alarge acquisition. (See Notes 1 and 2 to the ConsolidatedFinancial Statements).
H.B. Fuller 1998 Annual Report 25
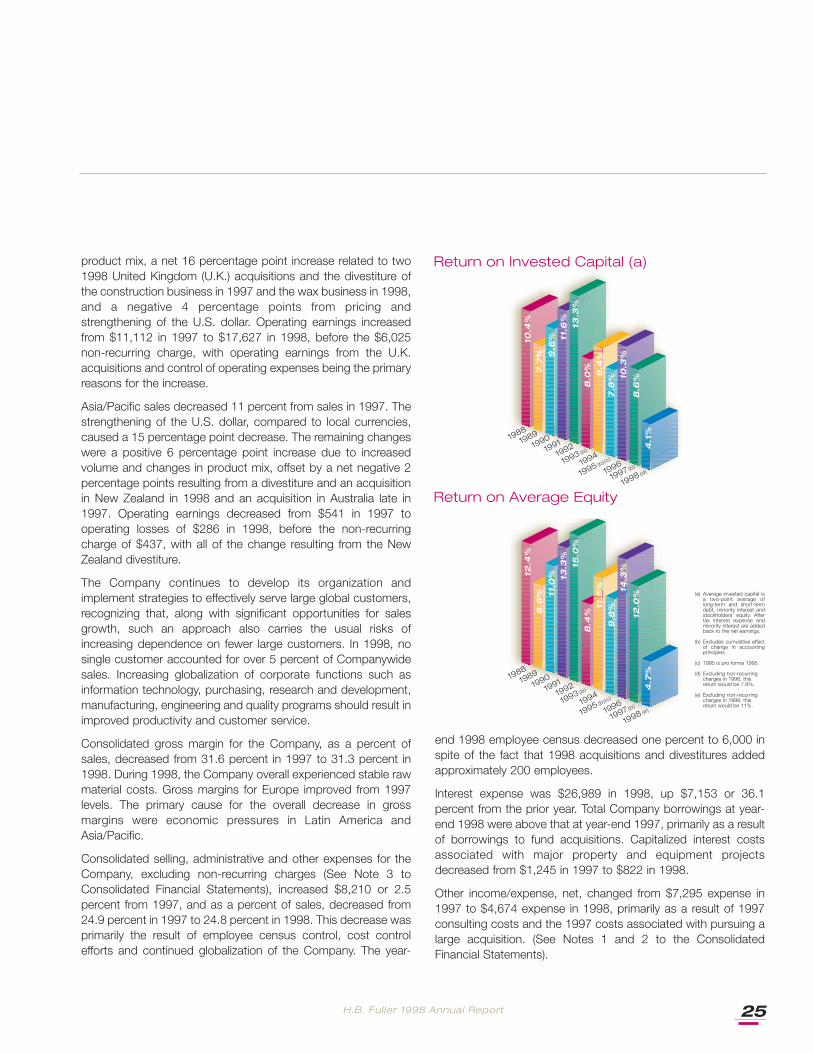
Return on Invested Capital (a)
Return on Average Equity
19881989
19901991
1992
1993(b)
1994
1995(b)(c)
1996
1997(b)
1998(d)
19881989
19901991
1992
1993(b)
1994
1995(b)(c)
1996
1997(b)
1998(e)
10.4
%7
.7% 9
.6% 11
.6%
13.3
%8
.0% 9.4
%7
.8% 10
.3%
8.6
%4
.1%
12.4
%8
.6% 11
.0% 13
.3%
15.0
%8
.4%
11.5
%9
.8%
14.3
%
12.0
%4
.7%
(a) Average invested capital isa two-point average oflong-term and short-termdebt, minority interest andstockholders’ equity. Aftertax interest expense andminority interest are addedback to the net earnings.
(b) Excludes cumulative effectof change in accountingprinciples.
(c) 1995 is pro forma 1995.
(d) Excluding non-recurringcharges in 1998, thisreturn would be 7.9%.
(e) Excluding non-recurringcharges in 1998, thisreturn would be 11%.
Gains on the sale of assets decreased from $5,199 or $0.22 pershare (basic) in 1997 to $3,237 or $0.14 per share (basic) in1998, excluding the sale of businesses as part of therestructuring plan.
Income taxes totaled $18,826 in 1998, a 29.4 percent decreasefrom $26,651 in 1997. The effective tax rate in 1998 equaled the40.8 percent in 1997, after the consideration of the low taxbenefit provided for a portion of the non-recurring chargesincurred in countries where no tax benefit is available.
Results of Operations:1997 Compared to 1996
Worldwide sales for 1997 were $1,306,789, an increase of$31,073 or 2.4 percent over 1996 sales of $1,275,716.
Sales changes by geographic area were as follows:
Area Increase/(Decrease)North America $38,421 5%Latin America 8,322 5%Europe (24,165) (9%)Asia/Pacific 8,495 10%Total $31,073 2%
In North America, the 5 percent increase in sales is composed ofa 6 percentage point increase due to volume and change inproduct mix and a negative one percentage point related topricing and strengthening of the U.S. dollar. North Americanoperating earnings increased 4.3 percent compared to 1996.Some bonuses were not paid in 1996. On a comparable basis,adjusting for these bonuses, operating earnings increased 12.5percent year over year.
Within North America, the Adhesives, Sealants and Coatings(ASC) Group produced a 7 percent sales increase over 1996with 5 percentage points of the increase a result of expandedsales within core industrial markets and moderate sales growthby the ASC structural group, especially in the engineeredsystems and window markets. ASC Group operating earningshad a strong increase over 1996, supported by relatively stableraw material costs and lower operating expenses resulting fromcontinuing cost containment programs.
North American automotive sales experienced a 9 percentincrease over 1996 automotive sales and was composed of 13percentage points resulting from EFTEC and a 1996 acquisition,offset by 4 percentage points of negative pricing. Operating
earnings decreased substantially as a result of low unit growth inthe base business, negative pricing, competitive pressures in theautomotive market, and costs of merging and integrating theautomotive business.
The North American Specialty Group, adjusted for the sale of theMonarch Division in the third quarter of 1996, experienced an 11percent sales increase and a substantial operating earningsincrease in 1997 compared to 1996. Global Coatings Divisionhad a significant increase in sales, TEC Specialty Products Inc.had a strong sales increase and Foster Products Corporationand Linear Products Inc. had moderate increases in sales.
Sales by the Company’s Latin American operations increased 5percent compared to the sales of the prior year, with a 6percentage point increase resulting from volume and product mix
H.B. Fuller 1998 Annual Report26
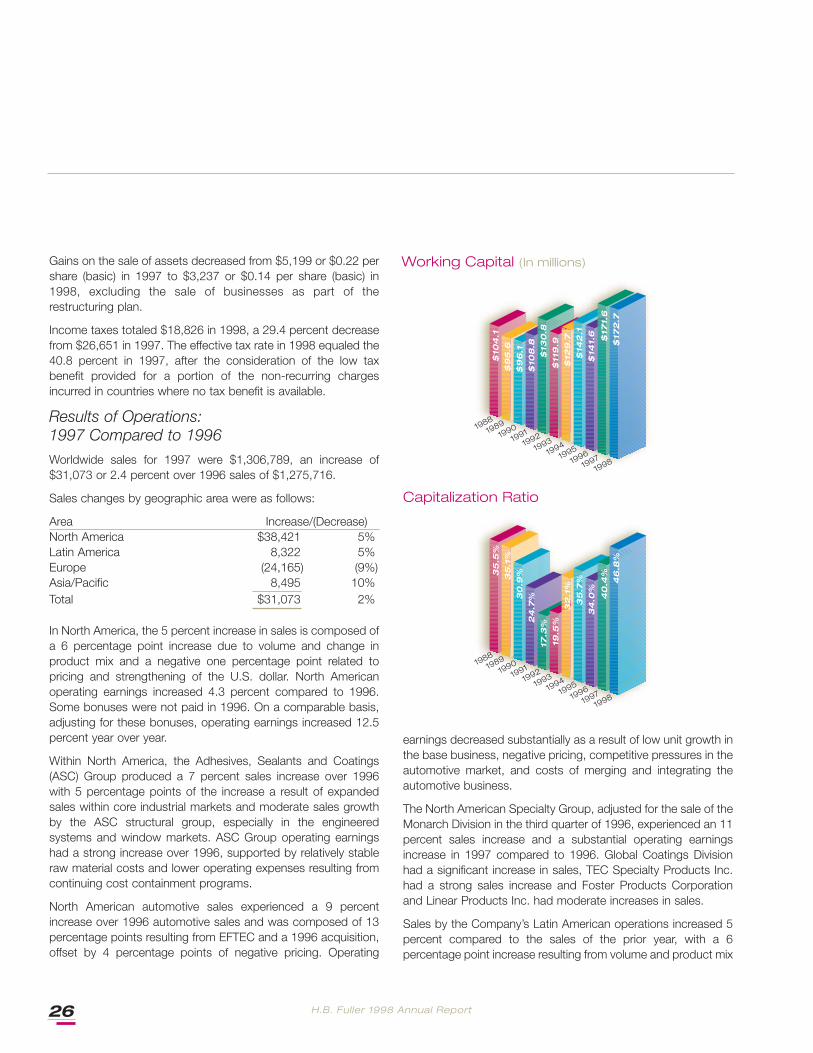
Working Capital (In millions)
Capitalization Ratio
19881989
19901991
19921993
19941995
19961997
1998
19881989
19901991
19921993
19941995
19961997
1998
$10
4.1
$9
5.6
$9
6.1
$10
8.8
$13
0.8
$11
9.9
$12
9.7
$14
2.1
$14
1.6 $17
1.6
$17
2.7
35
.5%
35
.1%
30
.9%
24
.7%
17.3
%19
.5%
32
.1%
35
.7%
34
.0%
40
.4%
46
.8%
and a negative one percentage point resulting from decreasedpricing. Operating earnings for Latin America increased 19.2percent compared to 1996. On a comparative basis, adjusting forbonuses not paid in 1996, operating earnings increased 29.3percent. The increase in operating earnings resulted fromimproved unit volume growth and increased gross margins.
Sales in Europe decreased 9 percent in 1997 compared to 1996,with the strengthening of the U.S. dollar negatively affecting thesales by 10 percentage points. The one percentage point increasein local currency sales was primarily from an 8 percentage pointimprovement in volume and change in product mix, which waspartially offset by 7 percentage points from negative pricing andthe impact of the sale of the construction business. Operatingearnings decreased 6.3 percent in 1997 compared to the prioryear. On a comparable basis, excluding the benefit of not payingbonuses in 1996, operating income increased 25.5 percent.
Sales in Asia/Pacific increased 10 percent in 1997 from 1996. Thestrengthening of the U.S. dollar accounted for a decrease of 8percentage points. The 18 percentage point increase in localcurrency sales included 19 percentage points from increasedvolume and change in product mix which was partially offset byone percentage point of negative pricing. Operating losses in theregion in 1996 were replaced with a slight operating gain in 1997.
Consolidated gross margin for the Company, as a percent ofsales, decreased from 31.7 percent in 1996 to 31.6 percent in1997. On a comparable basis, excluding the favorable impact ofnot paying bonuses in 1996, gross margins, as a percent ofsales, improved from 31.3 percent in 1996 to 31.6 percent in1997. During 1997, the Company overall experienced relativelystable raw material costs. Gross margins for North AmericanASC and Specialty Group, Latin America and Asia/Pacificimproved from 1996 levels.
Consolidated selling, administrative and other expenses for theCompany increased $2,241 or 0.7 percent from 1996, and as apercent of sales, decreased from 25.4 percent in 1996 to 24.9percent in 1997. This was primarily the result of employee censuscontrol, cost control efforts and continued globalization of theCompany. The year-end 1997 number of employees increased 2percent, to 6,000, with virtually all of the added census resultingfrom the 1997 acquisitions. Excluding the favorable bonusnonpayment in 1996, operating expenses decreased $1,749 or 0.5percent and the 1996 percent to sales increased to 25.7 percent.
Interest expense was $19,836 in 1997, up $955 or 5.1 percentfrom the prior year. Total Company borrowing at year-end 1997
was above that at year-end 1996, primarily as a result ofborrowing to fund benefit plans and the repurchase of 300,000shares of Company stock. Capitalized interest costsassociated with major property and equipment projectsdecreased from $2,518 in 1996 to $1,245 in 1997.
Other income/expense, net, changed from $1,995 expense in1996 to $7,295 expense in 1997, primarily as a result ofincreased currency losses in Asia/ Pacific, 1997 consultingcosts and the costs associated with pursuing a largeacquisition which was not consummated. (See Notes 1 and 2to the Consolidated Financial Statements.)
Gain on sale of assets decreased from $16,673 or $0.71 pershare (basic) in 1996 to $5,199 or $0.22 per share (basic) in1997. The gain in 1996 was primarily the result of the sale of
H.B. Fuller 1998 Annual Report 27
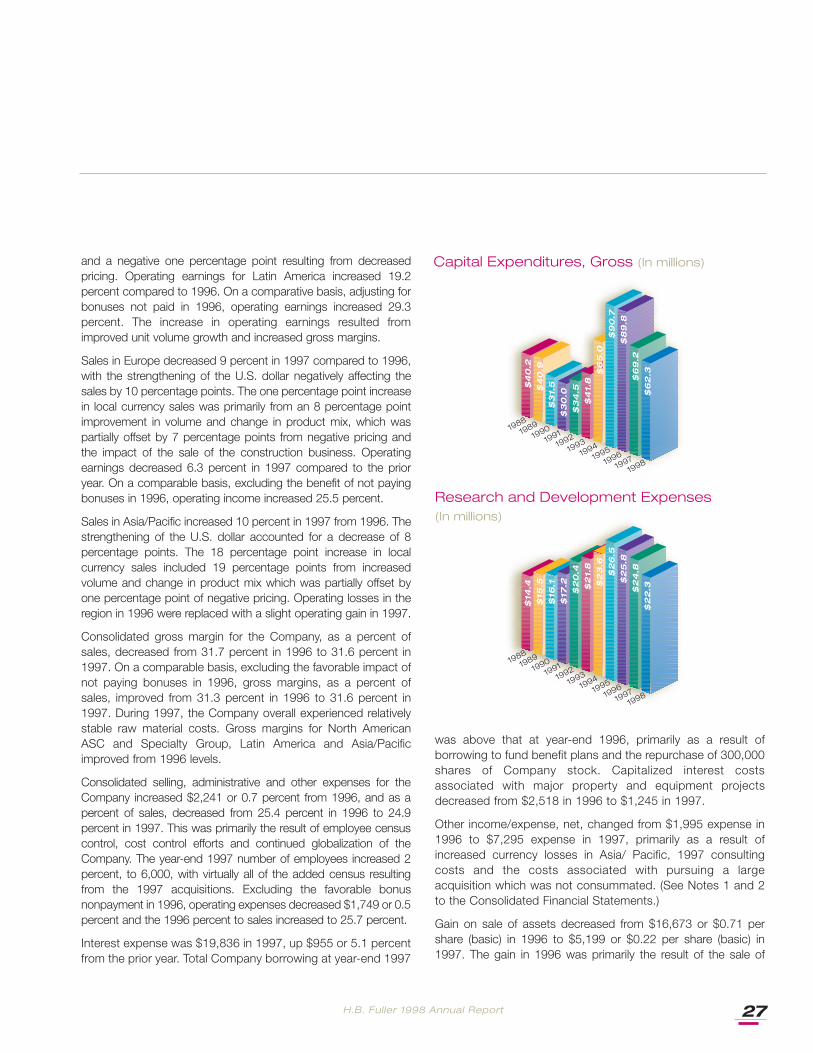
Capital Expenditures, Gross (In millions)
Research and Development Expenses(In millions)
19881989
19901991
19921993
19941995
19961997
1998
19881989
19901991
19921993
19941995
19961997
1998
$4
0.2
$4
0.9
$3
1.5
$3
0.0
$3
4.5
$4
1.8
$6
5.0
$9
0.7
$8
9.8
$6
9.2
$6
2.3
$14
.4$
15.5
$16
.1$
17.2
$2
0.4
$2
1.8
$2
3.6
$2
6.5
$2
5.8
$2
4.8
$2
2.3
H.B. Fuller 1998 Annual Report28
Monarch sanitation chemicals.
Income taxes totaled $26,651 in 1997, a 14.7 percent decreasefrom $31,233 in 1996. The effective tax rate was 40.8 percent inboth 1997 and 1996.
Net earnings for 1997 were $36,940, a decrease of $8,490 or18.7 percent from 1996 earnings of $45,430. 1997 net earningswere adversely affected by an accounting change charge of$3,368. As discussed in Note 1 to the Consolidated FinancialStatements, the Company changed its accounting for certaininformation technology transformation costs to conform withissue No. 97-13 of the Emerging Issues Task Force.
Liquidity and Capital Resources
The Company generated $51,972 in cash from operations in1998 compared to $68,581 in 1997 and $81,261 in 1996. Thedecrease in 1998 resulted primarily from increased cashrequired to fund working capital, excluding the non-recurringcharges. The Company also generated cash from divestituresand the sale of assets. (See Note 5 to the ConsolidatedFinancial Statements.) Major other uses of cash during 1998were capital expenditures, purchase of businesses andpayment of dividends. Cash was $4,605 at November 28,1998, compared to $2,710 at November 29,1997. The $4,605cash balance and unused lines of credit at November 28, 1998are considered adequate to meet Company obligations over thenext year.
Working capital was $172,740 at November 28, 1998,compared to $171,607 at November 29, 1997. A primary reasonfor the increase in working capital is increased working capitalrequired to support businesses purchased in 1998. The currentratio at year-end 1998 was 1.6. The number of days sales intrade accounts receivable was 60 at November 28,1998, anincrease of seven days sales from 53 at November 29, 1997.The average days sales in inventory on hand was 63 in 1998compared to 62 in 1997.
Management believes that the Company will continue to haveaccess to short-term and long-term credit markets to fund itsworking capital requirements, capital expenditure programs andfuture acquisitions. The Company's ratio of long-term debt tototal capitalization was 46.8 percent at November 28, 1998,compared to 40.4 percent at November 29,1997. At year-end1998, the Company had short-term and long-term lines of creditof $372,636 of which $260,000 was committed. The unusedportion of these lines of credit was $266,307.
Capital expenditures for property, plant and equipment of$62,327 in 1998 were primarily for completion of construction ofa manufacturing plant in Georgia, an information systemsproject, general improvements in manufacturing productivity andoperating efficiency and various environmental projects.Environmental capital expenditures are less than 10 percent oftotal expenditures and are not a material portion of overallCompany expenditures. Future commitments related to 1998capital projects are estimated to be approximately $25,000.
Over the recent past, approximately 50 percent of theCompany’s sales have come from its foreign subsidiaries.Swings in exchange rates, particularly the deutsche mark andJapanese yen, can have an impact on the Company’s results.(See Note 1 to Consolidated Financial Statements.) TheCompany will continue to monitor changing economic conditionsin the South American countries, specifically Brazil where theCompany has an investment of $4,100. The Company'soperations in Europe use forward foreign exchange contracts tohedge foreign currency denominated accounts receivable/payable and inter-company loans.
Impact of the Year 2000 Issue
The Year 2000 Issue is the result of computer programs beingwritten using two digits rather than four to define the applicableyear. As a result of this issue, computer programs that havedate-sensitive software may recognize a date using "00" as theyear 1900 rather than the year 2000. The Year 2000 Issue couldresult in system failures or miscalculations causing disruption ofoperations, including, among other things, a temporary inabilityto process transactions involving the recording of sales,manufacture of products, management of inventory anddistribution, preparation of invoices and collection of accountsreceivable.
The Company's Year 2000 Project Office (consisting ofinformation technology ("IT") personnel) has established a three-phase program to address the Year 2000 Issue. The threephases consist of (a) an assessment phase, (b) an analysis andresolution strategy phase and (c) a remediation and testingphase. The compliance program focuses on the Company's ITas well as non-lT systems (which systems contain embeddedtechnology in manufacturing or process control equipmentcontaining microprocessors or similar circuitry).
The assessment phase, during which the Year 2000 ProjectOffice attempted to identify all hardware and software that affectthe Company's operations, has been completed with respect to
H.B. Fuller 1998 Annual Report 29
most of the Company's operations. Based on the results of theassessment phase, the Company has determined that itsprimary hardware and operating system software used in NorthAmerican operations is Year 2000 compliant. In addition, theCompany's internal laboratory and regulatory systems, as wellas the Company's financial and enterprise resource planningsystems for most division locations in North America, England,Australia, Brazil, Argentina, and Chile are compliant. TheCompany's Year 2000 Project Office has determined that theCompany will need to update or replace certain other hardwareand software so that its computer systems will properly utilizedates after December 31, 1999.
The Company is currently in the remediation and testing phaseof the program with respect to most non-compliant systemsused in its North American operations. Outside the UnitedStates, the Company is addressing compliance issues on aregion-by-region basis. The Company is in the analysis andresolution strategy phase in certain locations, and in theremediation and testing phase in other locations. The Companyhas a timeline for completing all internal Year 2000 remediationprojects. The Company currently anticipates these projects willbe completed prior to June 30, 1999.
The Company has also begun assessing Year 2000 complianceissues relating to companies with which it has third-partyoutsourcing relationships on a global basis, such as a financialinstitution administering employee benefit plans, tele-communications providers and health care providers. TheCompany has requested assurances from its significantsuppliers that they are addressing the Year 2000 Issue and thatproducts purchased by the Company from such suppliers willfunction properly in the Year 2000. The Company will continue toassess supplier compliance issues. In addition, the Company iscommunicating with its major customers regarding theCompany's Year 2000 compliance efforts. However, it isimpossible to fully assess the potential consequences in theevent service interruptions from suppliers occur or in the eventthat there are disruptions in such infrastructure areas as utilities,communications, transportation, banking and government.
In October 1998, the Company formed a Year 2000 Task Force(consisting of representatives from its financial, IT, legal and riskmanagement departments and from its key business units) tofurther address internal and external Year 2000 Issues.
The Company incurred Year 2000 compliance costs ofapproximately $2,000 over a two-year period ending
November 28, 1998. The current total estimated cost tocomplete Year 2000 compliance efforts over the next year is$1,200 to $1,500. In recent years, the Company has replacedcertain of its financial and operating systems. These systemshave not required modification to address the Year 2000 Issue,and, as a result, the Company’s Year 2000 costs have beenrelatively low. Estimates of Year 2000 costs are based onnumerous assumptions, and there can be no assurance thatthe estimates are correct or that the actual costs will not begreater than anticipated.
The Company’s most reasonably likely worst case Year 2000Issue scenario is a potential inability to obtain raw materials fromsuppliers in a timely manner, due either to a supplier’s inability tomanufacture the product or ship it. In such event, the Companymay experience a delay in its ability to manufacture and deliverproducts when ordered by customers. The Company is currentlyevaluating its alternatives to mitigate the effect of such scenario,if it occurs.
The Company has developed preliminary contingency plansaddressing the potential failure of its manufacturing equipmentand order entry telephone system due to Year 2000 problems.The Company is developing contingency plans to address otherpotential failures or delays due to the Year 2000 Issue.
Based on its assessments and current knowledge, the Companybelieves it will not, as a result of the Year 2000 Issue, experienceany material disruptions in internal manufacturing processes,information processing or interfaces with major customers, orwith processing orders and billing. However, if certain third-partyproviders, such as providers of electricity, water or telephoneservice, experience difficulties resulting in disruption of service tothe Company, a shutdown of the Company's operations atindividual facilities could occur for the duration of the disruption.Assuming no major disruption in service from utility companies orother critical third-party providers, the Company believes that itwill be able to manage its total Year 2000 transition without anymaterial effect on the Company's results of operations orfinancial condition.
Safe Harbor Statement Under the PrivateSecurities Litigation Act of 1995
Certain statements in this Annual Report are forward-lookingstatements within the meaning of the Private Securities LitigationReform Act of 1995. These statements are subject to variousrisks and uncertainties, including but not limited to the following:
H.B. Fuller 1998 Annual Report30
the Asian economic crises and other political economicconditions; product demand and industry capacity; competitiveproducts and pricing; manufacturing efficiencies; new productdevelopment; product mix; availability and price of raw materialsand critical manufacturing equipment; new plant startups;accounts receivable collection; the Company’s relationships withits major customers and suppliers; changes in tax laws andtariffs; patent rights that could provide significant advantage to acompetitor; foreign exchange rate fluctuations (particularly withrespect to the German mark and the Japanese yen); theregulatory and trade environment; the Year 2000 computerissue; the conversion to the euro currency by EuropeanCommunity member states; and other risks as indicated fromtime to time in the Company’s filings with the Securities andExchange Commission. All forward-looking informationrepresents management’s best judgment as of this date basedon information currently available that in the future may prove tohave been inaccurate.
H.B. Fuller 1998 Annual Report 31
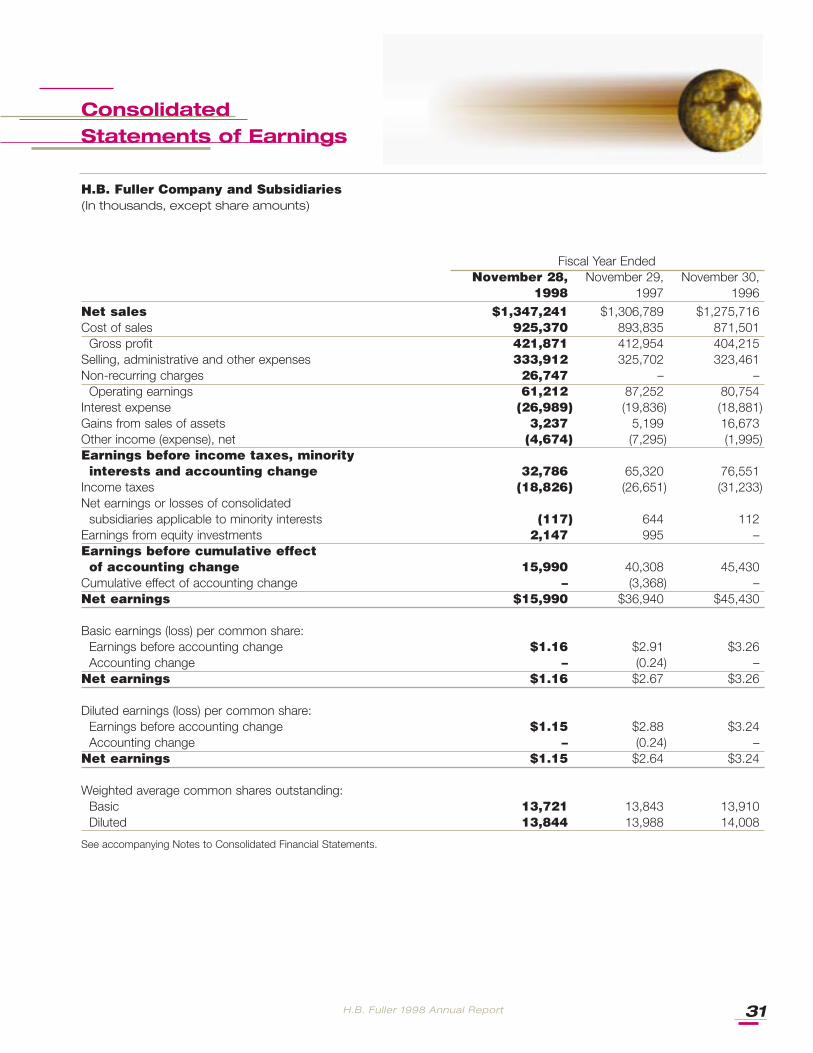
Consolidated Statements of Earnings
Fiscal Year EndedNovember 28, November 29, November 30,
1998 1997 1996Net sales $1,347,241 $1,306,789 $1,275,716Cost of sales 925,370 893,835 871,501
Gross profit 421,871 412,954 404,215Selling, administrative and other expenses 333,912 325,702 323,461Non-recurring charges 26,747 – –
Operating earnings 61,212 87,252 80,754Interest expense (26,989) (19,836) (18,881)Gains from sales of assets 3,237 5,199 16,673Other income (expense), net (4,674) (7,295) (1,995)Earnings before income taxes, minorityinterests and accounting change 32,786 65,320 76,551
Income taxes (18,826) (26,651) (31,233)Net earnings or losses of consolidated
subsidiaries applicable to minority interests (117) 644 112Earnings from equity investments 2,147 995 –Earnings before cumulative effect of accounting change 15,990 40,308 45,430
Cumulative effect of accounting change – (3,368) –Net earnings $15,990 $36,940 $45,430
Basic earnings (loss) per common share:Earnings before accounting change $1.16 $2.91 $3.26Accounting change – (0.24) –
Net earnings $1.16 $2.67 $3.26
Diluted earnings (loss) per common share:Earnings before accounting change $1.15 $2.88 $3.24Accounting change – (0.24) –
Net earnings $1.15 $2.64 $3.24
Weighted average common shares outstanding:Basic 13,721 13,843 13,910Diluted 13,844 13,988 14,008
See accompanying Notes to Consolidated Financial Statements.
H.B. Fuller Company and Subsidiaries(In thousands, except share amounts)
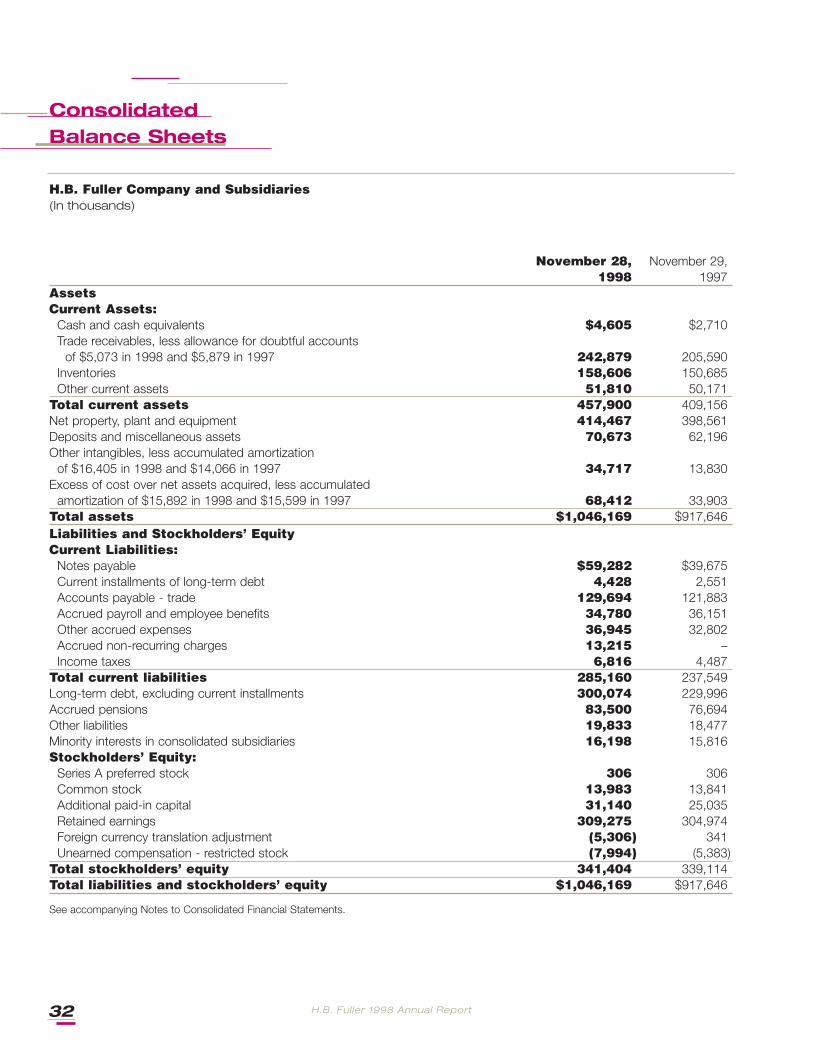
H.B. Fuller 1998 Annual Report32
Consolidated Balance Sheets
November 28, November 29,1998 1997
AssetsCurrent Assets:
Cash and cash equivalents $4,605 $2,710Trade receivables, less allowance for doubtful accounts
of $5,073 in 1998 and $5,879 in 1997 242,879 205,590Inventories 158,606 150,685Other current assets 51,810 50,171
Total current assets 457,900 409,156Net property, plant and equipment 414,467 398,561Deposits and miscellaneous assets 70,673 62,196Other intangibles, less accumulated amortization
of $16,405 in 1998 and $14,066 in 1997 34,717 13,830Excess of cost over net assets acquired, less accumulated
amortization of $15,892 in 1998 and $15,599 in 1997 68,412 33,903Total assets $1,046,169 $917,646Liabilities and Stockholders’ EquityCurrent Liabilities:
Notes payable $59,282 $39,675Current installments of long-term debt 4,428 2,551Accounts payable - trade 129,694 121,883Accrued payroll and employee benefits 34,780 36,151Other accrued expenses 36,945 32,802Accrued non-recurring charges 13,215 –Income taxes 6,816 4,487
Total current liabilities 285,160 237,549Long-term debt, excluding current installments 300,074 229,996Accrued pensions 83,500 76,694Other liabilities 19,833 18,477Minority interests in consolidated subsidiaries 16,198 15,816Stockholders’ Equity:
Series A preferred stock 306 306Common stock 13,983 13,841Additional paid-in capital 31,140 25,035Retained earnings 309,275 304,974Foreign currency translation adjustment (5,306) 341Unearned compensation - restricted stock (7,994) (5,383)
Total stockholders’ equity 341,404 339,114Total liabilities and stockholders’ equity $1,046,169 $917,646
See accompanying Notes to Consolidated Financial Statements.
H.B. Fuller Company and Subsidiaries(In thousands)
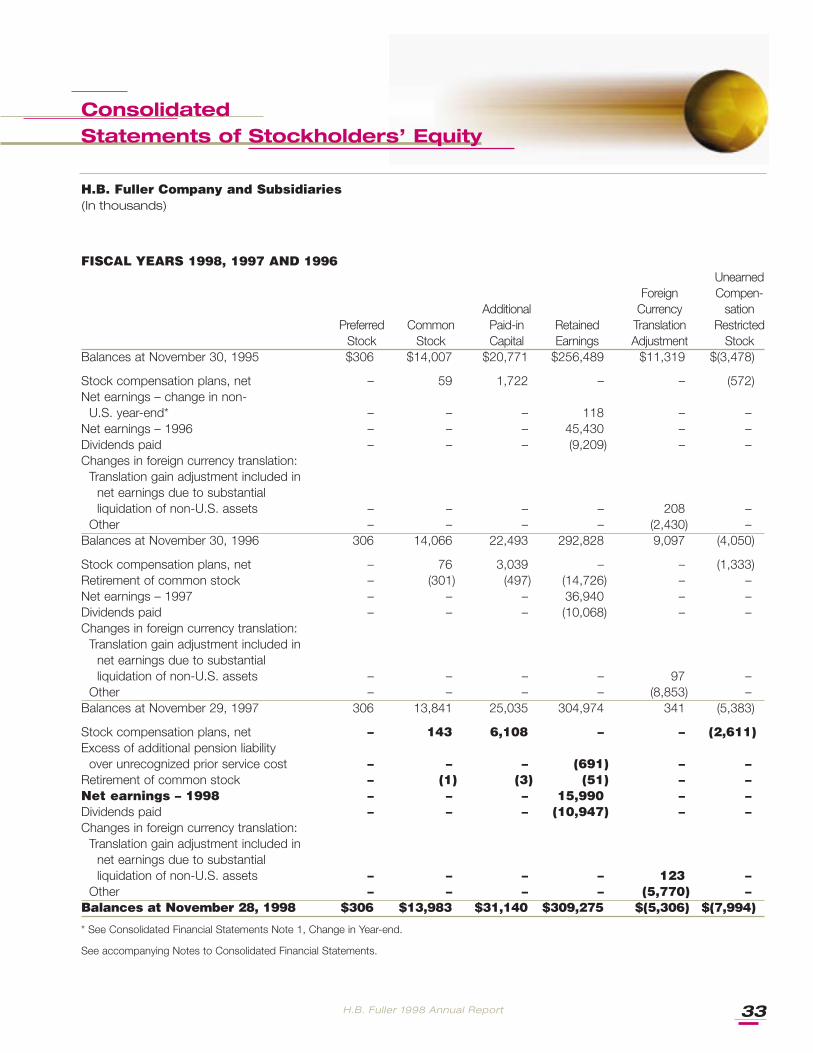
H.B. Fuller 1998 Annual Report 33
FISCAL YEARS 1998, 1997 AND 1996Unearned
Foreign Compen-Additional Currency sation
Preferred Common Paid-in Retained Translation RestrictedStock Stock Capital Earnings Adjustment Stock
Balances at November 30, 1995 $306 $14,007 $20,771 $256,489 $11,319 $(3,478)
Stock compensation plans, net – 59 1,722 – – (572)Net earnings – change in non-
U.S. year-end* – – – 118 – –Net earnings – 1996 – – – 45,430 – –Dividends paid – – – (9,209) – –Changes in foreign currency translation:
Translation gain adjustment included innet earnings due to substantial liquidation of non-U.S. assets – – – – 208 –
Other – – – – (2,430) –Balances at November 30, 1996 306 14,066 22,493 292,828 9,097 (4,050)
Stock compensation plans, net – 76 3,039 – – (1,333)Retirement of common stock – (301) (497) (14,726) – –Net earnings – 1997 – – – 36,940 – –Dividends paid – – – (10,068) – –Changes in foreign currency translation:
Translation gain adjustment included in net earnings due to substantial liquidation of non-U.S. assets – – – – 97 –
Other – – – – (8,853) –Balances at November 29, 1997 306 13,841 25,035 304,974 341 (5,383)
Stock compensation plans, net – 143 6,108 – – (2,611)Excess of additional pension liability
over unrecognized prior service cost – – – (691) – –Retirement of common stock – (1) (3) (51) – –Net earnings – 1998 – – – 15,990 – –Dividends paid – – – (10,947) – –Changes in foreign currency translation:
Translation gain adjustment included in net earnings due to substantial liquidation of non-U.S. assets – – – – 123 –
Other – – – – (5,770) –Balances at November 28, 1998 $306 $13,983 $31,140 $309,275 $(5,306) $(7,994)
* See Consolidated Financial Statements Note 1, Change in Year-end.
See accompanying Notes to Consolidated Financial Statements.
H.B. Fuller Company and Subsidiaries(In thousands)
Consolidated Statements of Stockholders’ Equity
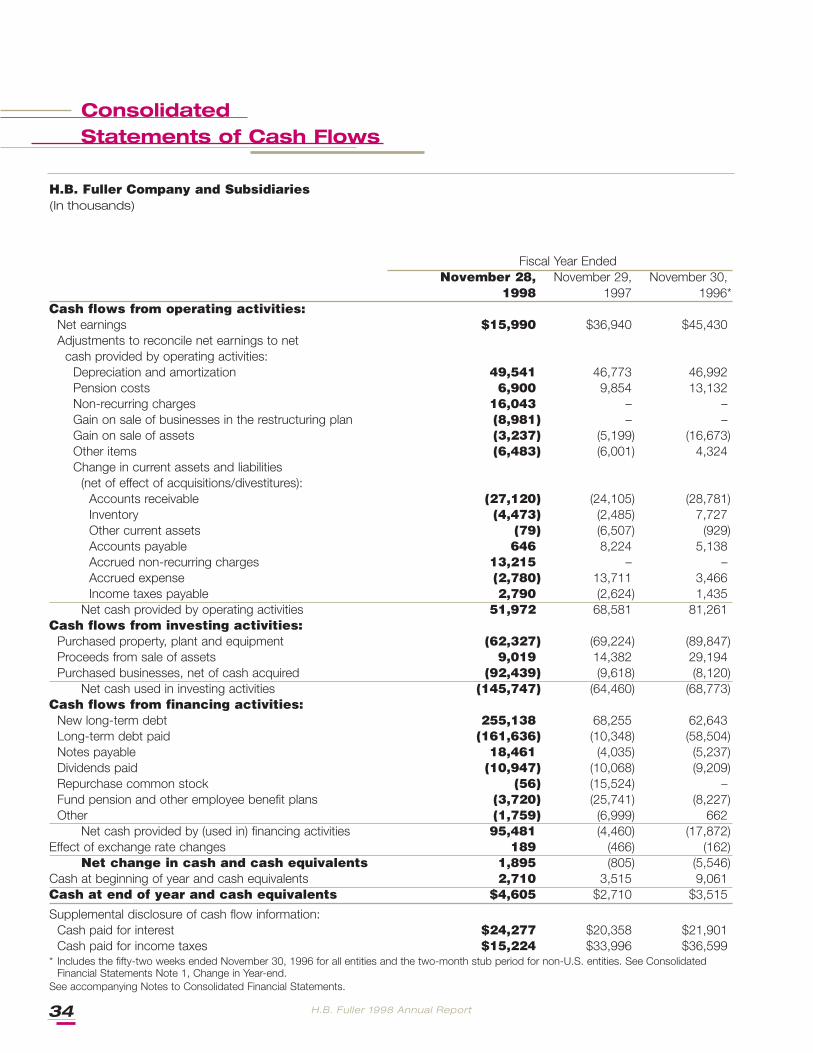
H.B. Fuller 1998 Annual Report34
ConsolidatedStatements of Cash Flows
Fiscal Year EndedNovember 28, November 29, November 30,
1998 1997 1996*Cash flows from operating activities:
Net earnings $15,990 $36,940 $45,430Adjustments to reconcile net earnings to net
cash provided by operating activities:Depreciation and amortization 49,541 46,773 46,992Pension costs 6,900 9,854 13,132Non-recurring charges 16,043 – –Gain on sale of businesses in the restructuring plan (8,981) – –Gain on sale of assets (3,237) (5,199) (16,673)Other items (6,483) (6,001) 4,324Change in current assets and liabilities
(net of effect of acquisitions/divestitures):Accounts receivable (27,120) (24,105) (28,781)Inventory (4,473) (2,485) 7,727Other current assets (79) (6,507) (929)Accounts payable 646 8,224 5,138Accrued non-recurring charges 13,215 – –Accrued expense (2,780) 13,711 3,466Income taxes payable 2,790 (2,624) 1,435
Net cash provided by operating activities 51,972 68,581 81,261Cash flows from investing activities:
Purchased property, plant and equipment (62,327) (69,224) (89,847)Proceeds from sale of assets 9,019 14,382 29,194Purchased businesses, net of cash acquired (92,439) (9,618) (8,120)
Net cash used in investing activities (145,747) (64,460) (68,773)Cash flows from financing activities:
New long-term debt 255,138 68,255 62,643Long-term debt paid (161,636) (10,348) (58,504)Notes payable 18,461 (4,035) (5,237)Dividends paid (10,947) (10,068) (9,209)Repurchase common stock (56) (15,524) –Fund pension and other employee benefit plans (3,720) (25,741) (8,227)Other (1,759) (6,999) 662
Net cash provided by (used in) financing activities 95,481 (4,460) (17,872)Effect of exchange rate changes 189 (466) (162)
Net change in cash and cash equivalents 1,895 (805) (5,546)Cash at beginning of year and cash equivalents 2,710 3,515 9,061Cash at end of year and cash equivalents $4,605 $2,710 $3,515
Supplemental disclosure of cash flow information:Cash paid for interest $24,277 $20,358 $21,901Cash paid for income taxes $15,224 $33,996 $36,599
* Includes the fifty-two weeks ended November 30, 1996 for all entities and the two-month stub period for non-U.S. entities. See ConsolidatedFinancial Statements Note 1, Change in Year-end.
See accompanying Notes to Consolidated Financial Statements.
H.B. Fuller Company and Subsidiaries(In thousands)
H.B. Fuller 1998 Annual Report 35
1/Summary of SignificantAccounting PoliciesThe following information is presented to explain the accountingpolicies used to prepare H.B. Fuller Company’s ConsolidatedFinancial Statements.
Nature of Operations: H.B. Fuller Company (“The Company”)operates as one of the world’s leading manufacturers andmarketers of adhesives, sealants, coatings, paints and otherspecialty chemical products. The Company has operations in 42countries in North America, Europe, Latin America and theAsia/Pacific region. The Company’s largest business category isspecialty chemicals and related products (adhesives, sealants andcoatings). These products, in thousands of formulations, are soldto customers in a wide range of industries, including packaging,woodworking, automotive, aerospace, graphic arts (books/magazines), appliances, filtration, windows, sporting goods,nonwovens, shoes and ceramic tile. The Company generallymarkets its products through a direct sales force and independentdistributors in some markets.
Principles of Consolidation: The Consolidated FinancialStatements include the accounts of the Company and allsubsidiaries. Beginning with 1996, the Company’s fiscal year endson the Saturday closest to November 30th. All significant inter-company items have been eliminated in consolidation.
Change in Year-end: Effective December 1, 1995, in the firstquarter of the Company’s 1996 fiscal year, the Company’s non-U.S. subsidiaries that previously reported on a fiscal year endingSeptember 30, changed their reporting period to a Companywide52-week fiscal year ending on the Saturday closest to November30. This change was made to reflect the results of operations andfinancial position of these subsidiaries on a more timely basis andto increase operating and planning efficiency. The results ofoperations of these subsidiaries for the period October 1 throughNovember 30, 1995, income of $118 or $0.01 per share (basic),have been reflected as an adjustment to retained earnings. Salesfor the period were $104,811 and cost of sales was $73,341. TheCompany also changed to thirteen-week quarters. The three fiscalyears ended November 28, 1998 represent 52-week years,respectively.
Use of Estimates: Generally accepted accounting principlesrequire management to make estimates and assumptions thataffect the amounts reported in the financial statements andaccompanying notes. Actual results could differ from thoseestimates.
Foreign Currency Translation: The financial statements ofnon-U.S. operations are translated into U.S. dollars for inclusion inthe Consolidated Financial Statements.
Translation gains or losses resulting from the process of translatingforeign currency financial statements are reported as a separatecomponent of stockholders’ equity for businesses not consideredto be operating in highly inflationary economies. Translation effectof subsidiaries operating in highly inflationary economies andsubsidiaries using the dollar as the functional currency are includedin determining net earnings.
Transaction losses included in determining earnings before incometaxes and minority interests were as follows:
1998 1997 1996Currency translation
gains, net $837 $216 $2,182
Flow-througheffect of inventoryvaluation, net (2,370) (1,479) (246)
(1,533) (1,263) 1,936Currency exchange
losses, net (2,961) (2,739) (3,090)Total $(4,494) $(4,002) $(1,154)
The net loss from the flow-through effects of inventory valuationresults from differences between translation of cost of sales athistoric rates versus average exchange rates. H.B. FullerCompany’s Latin American operations, whenever possible, raiselocal selling prices on their products to offset this loss. The resultof these efforts to keep pace with inflation appears in the salesrevenue of each operation.
Cash: The Company considers all highly liquid debt instrumentspurchased with a maturity of three months or less to be cashequivalents.
Inventories: Inventories in the United States, representingapproximately 39% of consolidated inventories, are recorded atcost (not in excess of market value) as determined primarily by thelast-in, first-out method (LIFO). Inventories of non-U.S. operationsare valued at the lower of cost (mainly average cost) or market.Inventories at year-end are summarized as follows:
1998 1997Raw materials $73,126 $71,234Finished goods 95,862 90,634LIFO reserve (10,382) (11,183)Total $158,606 $150,685
H.B. Fuller Company and Subsidiaries(In thousands, except share amounts)
Notes to ConsolidatedFinancial Statements
H.B. Fuller 1998 Annual Report36
Property, Plant and Equipment: The major classes are:
DepreciableLives
(in years) 1998 1997Land $56,737 $49,400Buildings and
improvements 20-40 226,174 204,782Machinery and
equipment 5-15 433,407 374,747Construction in
progress 41,663 68,988Total, at cost 757,981 697,917Accumulated
depreciation (343,514) (299,356)Net property, plant
and equipment $414,467 $398,561
Depreciation is generally computed on a straight-line basis over theuseful lives, noted above, of the assets, including assets acquiredby capital leases. Accelerated depreciation is used for income taxpurposes where permitted.
Amortization: Other intangible assets, primarily technology,are amortized over the estimated lives of 3 to 15 years. Theexcess of cost over net assets of businesses acquired is chargedagainst earnings over periods of 15 to 25 years. Therecoverability of unamortized intangible assets is assessed on anongoing basis by comparing anticipated undiscounted futurecash flows from operations to net book value.
Capitalized Interest Costs: Interest costs associated withmajor construction of property and equipment are capitalized.Interest expense for each year includes the following components:
1998 1997 1996Interest costs
incurred $27,811 $21,081 $21,399Capitalized
interest costs (822) (1,245) (2,518)Interest expense $26,989 $19,836 $18,881
Non-U.S. Operations: Net earnings and equity of non-U.S.operations for each year are:
1998 1997 1996Net earnings $(5,854) $8,571 $1,984Equity $190,880 $174,220 $147,439
Financial Instruments: The Company generally enters intoforward foreign currency exchange contracts to hedge certainforeign currency denominated intercompany receivables, payablesand debt. Gains and losses on forward foreign currency exchangecontracts qualifying for hedges of firm commitment foreigncurrency intercompany receivables, payables or debt arerecognized as the contract is adjusted to fair market value whilethe resulting credit or debit offsets foreign exchange gains orlosses on the hedged receivable, payable or debt amount.
Changes in the fair value of contracts not qualifying for hedgeaccounting are recognized in other income (expense).
At November 28, 1998 and November 29, 1997, the Companyhad outstanding forward foreign currency exchange contractsaccounted for as hedges aggregating $17,097 and $12,075,respectively. Forward foreign currency exchange contactsmature between December 31, 1998 and November 20, 2000and relate primarily to major Western European currencies.Counterparties to the forward foreign currency exchangecontracts are major financial institutions. Credit loss fromcounterparty nonperformance is not anticipated.
The carrying amounts and estimated fair values of theCompany’s significant other financial instruments at year-end areas follows:
Carrying FairAmount Value
1998:Cash and cash equivalents $4,605 $4,605Notes payable $59,282 $59,282Long-term debt $304,502 $314,613
1997:Cash and cash equivalents $2,710 $2,710Notes payable $39,675 $39,675Long-term debt $232,547 $242,741
Fair values of short-term financial instruments approximate theircarrying values due to their short maturity.
The fair value of long-term debt is based on quoted marketprices for the same or similar issues or on the current ratesoffered to the Company for debt of similar maturities. Theestimates presented above on long-term financial instrumentsare not necessarily indicative of the amounts that would berealized in a current market exchange.
H.B. Fuller 1998 Annual Report 37
Concentrations of credit risk with respect to trade accountsreceivable are limited due to the large number of entitiescomprising the Company’s customer base and their dispersionacross many different industries and countries. As of November28, 1998 and November 29, 1997, the Company had nosignificant concentrations of credit risk.
Environmental Costs: Environmental expenditures thatrelate to current operations are expensed or capitalized asappropriate. Expenditures that relate to an existing conditioncaused by past operations, and which do not contribute tocurrent or future revenue generation, are expensed. Liabilities arerecorded when environmental assessments are made orremedial efforts are probable and the costs can be reasonablyestimated. The timing of these accruals is generally no later thanthe completion of feasibility studies. The liabilities forenvironmental costs at November 28, 1998 and November 29,1997 were $4,312 and $4,288, respectively. For furtherinformation on environmental matters, see Item 3 of theCompany’s 1998 Annual Report on Form 10-K.
Income Taxes: The Company uses the asset and liabilitymethod of accounting for income taxes. Under the asset andliability method, deferred income taxes are recognized for the taxconsequences of temporary differences by applying enactedstatutory tax rates applicable to future years to differencesbetween the financial statement carrying amounts and the taxbasis of existing assets and liabilities. The effect on deferredtaxes of a change in tax rates is recognized in income in theperiod that includes the enactment date.
Other Postretirement Benefits: The Company providesmedical benefits for eligible retired employees, employee’sbeneficiaries and covered dependents. These costs are accruedduring the years the employee renders the necessary service.
Postemployment Benefits: The Company providespostemployment benefits to inactive and former employees,employee’s beneficiaries and covered dependents afteremployment, but prior to retirement. The cost of providing thesebenefits is accrued during the years the employee renders thenecessary service.
Accounting Change: In 1997, an accounting changeimpacted fourth quarter earnings by $3,368, or $0.24 per share(basic), net of $2,321 income taxes. The Financial AccountingStandards Board (FASB) Emerging Issues Task Force (EITF) onIssue No. 97-13, “Accounting for Costs Incurred in Connectionwith a Consulting Contract or an Internal Project That Combines
Business Process Reengineering and Information TechnologyTransformation,” issued November 20, 1997, required theCompany to expense some costs that were previouslycapitalizable before this pronouncement.
Earnings Per Common Share: In February 1997, the FASBissued Statement of Financial Accounting Standards (SFAS) No.128, “Earnings Per Share”. SFAS No. 128 is effective for financialstatements for periods ending after December 15, 1997. UnderSFAS No. 128, the previous presentation of earnings per share isreplaced with dual presentation of basic earnings per share anddiluted earnings per share. Basic earnings per share includes nodilution and is computed by dividing net earnings available tocommon shareholders by the weighted average number ofcommon shares outstanding for the period. Diluted earnings pershare reflects the potential dilution of stock options and restrictedstock grants that could share in the earnings. The Companyadopted SFAS No. 128 in fiscal year 1998 and has restated prioryears net earnings per share data presented to conform to theprovisions of this statement. The difference between basic anddiluted earnings per share data as presented is due to the dilutiveimpact of stock options and restricted stock grants whoseexercise price or grant price was below the average commonstock price for the respective period presented. Earnings used inthe calculation are reduced by the dividends paid to the preferredstockholder.
Purchase of Company Common Stock: Under theMinnesota Business Corporation Act, repurchased stock isincluded in the authorized shares of the Company, but is notincluded in shares outstanding. The excess of cost over par valueis charged proportionally to the Additional Paid-In Capital and tothe Retained Earnings. During 1996 the Board of Directorsauthorized a stock repurchase program under which up to300,000 shares of H.B. Fuller Company common stock could berepurchased by the Company. The shares of common stockrepurchased would be available for compensation plans of theCompany. During 1997 the Company repurchased 300,000shares of common stock.
New Accounting Standards: In June 1997, the FASBissued SFAS No. 130 “Reporting Comprehensive Income.” Thisstatement, which is required to be adopted for financialstatements issued for annual periods beginning after December15, 1997, establishes standards for reporting and display ofcomprehensive income and its components in a full set ofgeneral-purpose financial statements. At that time, the Companywill be required to report total comprehensive income, an amount
H.B. Fuller 1998 Annual Report38
that will include net income as well as other comprehensiveincome. Other comprehensive income refers to revenues,expenses, gains and losses that under generally acceptedaccounting principles have previously been reported as separatecomponents of equity in the Company’s consolidated financialstatements. The Company will implement this statement in fiscalyear 1999 as required.
In June 1997, the FASB issued SFAS No. 131 “Disclosures aboutSegments of an Enterprise and Related Information.” Thisstatement, which is required to be adopted for financialstatements issued for annual periods beginning after December15, 1997, establishes standards for the way that public businessenterprises report information about operating segments infinancial reports issued to shareholders. The Company willimplement this statement in fiscal year 1999 as required.
In February 1998, FASB issued SFAS No. 132 “EmployersDisclosures about Pensions and Other Postretirement Benefits.”This statement, which is required for years beginning afterDecember 15, 1997 revises employer’s disclosures aboutpensions and other postretirement benefit plans. The Companywill implement this statement in fiscal year 1999.
In June 1998, the FASB issued SFAS No. 133 “Accounting forDerivative Instruments and Hedging Activities.” This statement,which is required to be adopted for annual periods beginning afterJune 15, 1999, establishes standards for recognition andmeasurement of derivatives and hedging activities. The Companywill implement this statement in fiscal year 2000 as required.
The impact of adopting the aforementioned accounting standardsis not expected to have a material effect on the Company’s financialposition or results of operations.
Reclassification: Certain prior years’ amounts have beenreclassified to conform to the 1998 presentation.
2/Other Income (Expense), NetOther income (expense), net in 1998 included $2,490 inconsulting costs and costs associated with the change of theCompany’s Chief Executive Officer which was partially offset by a$1,221 increase in investment income. Other income (expense),net in 1997 included $4,349 in costs associated with anacquisition pursued but not consummated and consulting costs.Other income (expense), net in 1996 included a $1,496 gain onthe sale of equity investments. All years include foreign currencylosses. (See Note 1 to the Consolidated Financial Statements.)
3/Non-recurring ChargesIn the third quarter of 1998, the Company's Board of Directorsapproved and the Company announced a restructuring plan thatwill streamline the organizational structure worldwide. Over thelast two quarters of 1998 and continuing into 1999, twelveadhesive manufacturing facilities will be closed, primarily inEurope, Latin America and Asia/Pacific, sales offices andwarehouses will be consolidated and layers of managementreduced. This plan anticipated a non-recurring charge of$40,000 to $45,000 (before tax) over six quarters, a reduction ofemployee census of more than 600 (including 142 of actualemployee reductions in 1998) and a reduction of costs in excessof $30,000 (before tax) annually, when completed. Cashrequirements of this plan are estimated to be $29,000 to$30,000 and will primarily be expended in fiscal year 1999. As aresult of selling two business units in the fourth quarter of 1998,the total amount of the charge is now estimated to be from$35,000 to $40,000 (before tax) with approximately $8,000 to$13,000 to be incurred in 1999. The cash requirements are nowestimated to be $24,000 to $25,000. The Company hasadequate lines of credit to fund these payments.
Reorganization and restructuring costs include costs directlyrelated to the Company's plan of reorganization. EITF No. 94-3provides specific requirements as to the appropriate recognitionof costs associated with employee termination benefits andother exit costs.
Employee termination costs are recognized when benefitarrangements are communicated to affected employees insufficient detail to enable the employees to determine theamount of benefits to be received upon termination.
Other exit costs resulting from an exit plan that are notassociated with or that do not benefit activities that will becontinued are recognized at the date of commitment to an exitplan subject to certain conditions. For the cost to be accrued,the cost must not be associated with or incurred to generaterevenues after the commitment date, and it must be either i)incremental to other costs incurred prior to the commitmentdate, or ii) represent amounts under a contractual obligation thatexisted prior to the commitment date that will either continueafter the exit plan is completed with no economic benefit orwhich will result in a penalty to cancel the obligation.
Other costs directly related to the reorganization of theCompany which are not eligible for recognition at thecommitment date, such as relocation and other integration
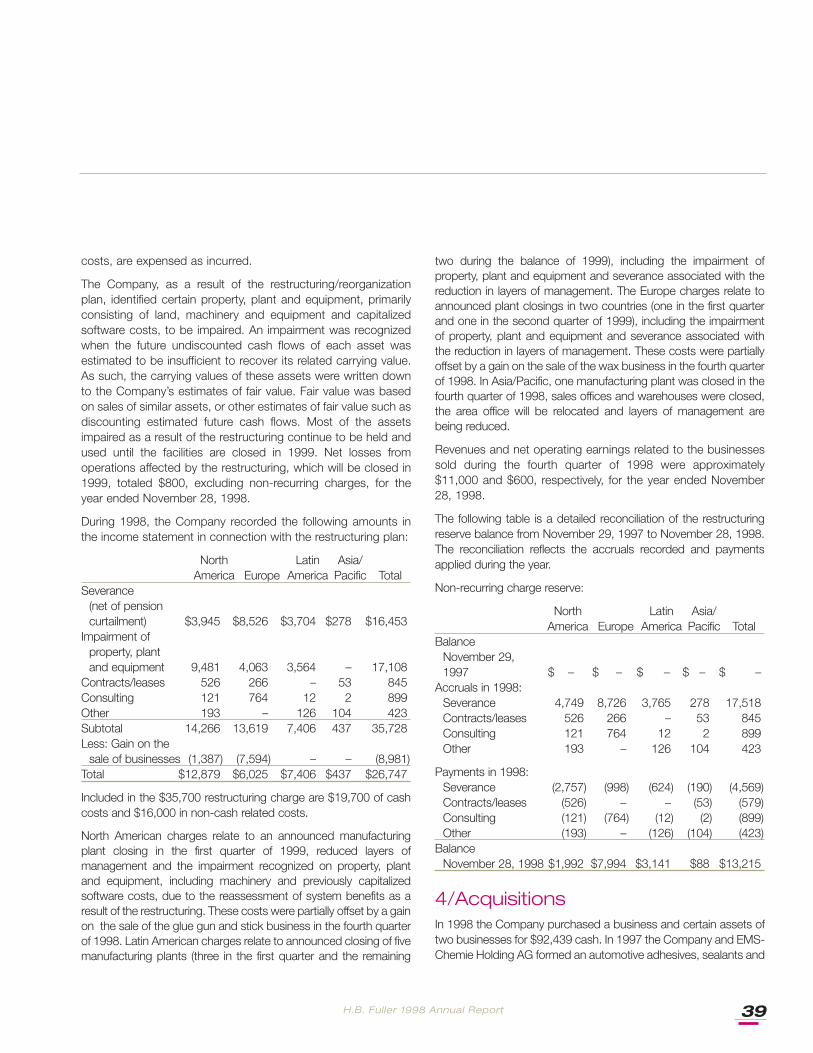
H.B. Fuller 1998 Annual Report 39
costs, are expensed as incurred.
The Company, as a result of the restructuring/reorganizationplan, identified certain property, plant and equipment, primarilyconsisting of land, machinery and equipment and capitalizedsoftware costs, to be impaired. An impairment was recognizedwhen the future undiscounted cash flows of each asset wasestimated to be insufficient to recover its related carrying value.As such, the carrying values of these assets were written downto the Company’s estimates of fair value. Fair value was basedon sales of similar assets, or other estimates of fair value such asdiscounting estimated future cash flows. Most of the assetsimpaired as a result of the restructuring continue to be held andused until the facilities are closed in 1999. Net losses fromoperations affected by the restructuring, which will be closed in1999, totaled $800, excluding non-recurring charges, for theyear ended November 28, 1998.
During 1998, the Company recorded the following amounts inthe income statement in connection with the restructuring plan:
North Latin Asia/America Europe America Pacific Total
Severance(net of pensioncurtailment) $3,945 $8,526 $3,704 $278 $16,453
Impairment of property, plant and equipment 9,481 4,063 3,564 – 17,108
Contracts/leases 526 266 – 53 845Consulting 121 764 12 2 899Other 193 – 126 104 423Subtotal 14,266 13,619 7,406 437 35,728Less: Gain on the
sale of businesses (1,387) (7,594) – – (8,981)Total $12,879 $6,025 $7,406 $437 $26,747
Included in the $35,700 restructuring charge are $19,700 of cashcosts and $16,000 in non-cash related costs.
North American charges relate to an announced manufacturingplant closing in the first quarter of 1999, reduced layers ofmanagement and the impairment recognized on property, plantand equipment, including machinery and previously capitalizedsoftware costs, due to the reassessment of system benefits as aresult of the restructuring. These costs were partially offset by a gainon the sale of the glue gun and stick business in the fourth quarterof 1998. Latin American charges relate to announced closing of fivemanufacturing plants (three in the first quarter and the remaining
two during the balance of 1999), including the impairment ofproperty, plant and equipment and severance associated with thereduction in layers of management. The Europe charges relate toannounced plant closings in two countries (one in the first quarterand one in the second quarter of 1999), including the impairmentof property, plant and equipment and severance associated withthe reduction in layers of management. These costs were partiallyoffset by a gain on the sale of the wax business in the fourth quarterof 1998. In Asia/Pacific, one manufacturing plant was closed in thefourth quarter of 1998, sales offices and warehouses were closed,the area office will be relocated and layers of management arebeing reduced.
Revenues and net operating earnings related to the businessessold during the fourth quarter of 1998 were approximately$11,000 and $600, respectively, for the year ended November28, 1998.
The following table is a detailed reconciliation of the restructuringreserve balance from November 29, 1997 to November 28, 1998.The reconciliation reflects the accruals recorded and paymentsapplied during the year.
Non-recurring charge reserve:
North Latin Asia/America Europe America Pacific Total
BalanceNovember 29,1997 $ – $ – $ – $ – $ –
Accruals in 1998:Severance 4,749 8,726 3,765 278 17,518Contracts/leases 526 266 – 53 845Consulting 121 764 12 2 899Other 193 – 126 104 423
Payments in 1998:Severance (2,757) (998) (624) (190) (4,569)Contracts/leases (526) – – (53) (579)Consulting (121) (764) (12) (2) (899)Other (193) – (126) (104) (423)
BalanceNovember 28, 1998 $1,992 $7,994 $3,141 $88 $13,215
4/AcquisitionsIn 1998 the Company purchased a business and certain assets oftwo businesses for $92,439 cash. In 1997 the Company and EMS-Chemie Holding AG formed an automotive adhesives, sealants and
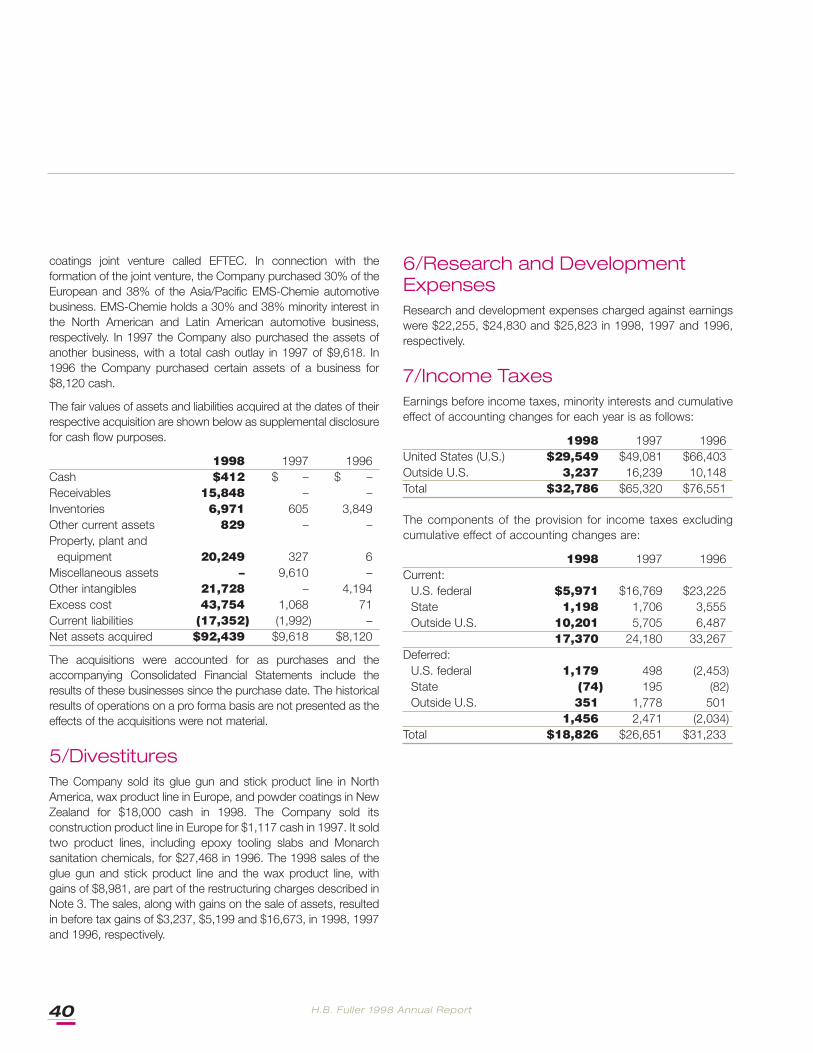
H.B. Fuller 1998 Annual Report40
coatings joint venture called EFTEC. In connection with theformation of the joint venture, the Company purchased 30% of theEuropean and 38% of the Asia/Pacific EMS-Chemie automotivebusiness. EMS-Chemie holds a 30% and 38% minority interest inthe North American and Latin American automotive business,respectively. In 1997 the Company also purchased the assets ofanother business, with a total cash outlay in 1997 of $9,618. In1996 the Company purchased certain assets of a business for$8,120 cash.
The fair values of assets and liabilities acquired at the dates of theirrespective acquisition are shown below as supplemental disclosurefor cash flow purposes.
1998 1997 1996Cash $412 $ – $ –Receivables 15,848 – –Inventories 6,971 605 3,849Other current assets 829 – –Property, plant and
equipment 20,249 327 6Miscellaneous assets – 9,610 –Other intangibles 21,728 – 4,194Excess cost 43,754 1,068 71Current liabilities (17,352) (1,992) –Net assets acquired $92,439 $9,618 $8,120
The acquisitions were accounted for as purchases and theaccompanying Consolidated Financial Statements include theresults of these businesses since the purchase date. The historicalresults of operations on a pro forma basis are not presented as theeffects of the acquisitions were not material.
5/DivestituresThe Company sold its glue gun and stick product line in NorthAmerica, wax product line in Europe, and powder coatings in NewZealand for $18,000 cash in 1998. The Company sold itsconstruction product line in Europe for $1,117 cash in 1997. It soldtwo product lines, including epoxy tooling slabs and Monarchsanitation chemicals, for $27,468 in 1996. The 1998 sales of theglue gun and stick product line and the wax product line, withgains of $8,981, are part of the restructuring charges described inNote 3. The sales, along with gains on the sale of assets, resultedin before tax gains of $3,237, $5,199 and $16,673, in 1998, 1997and 1996, respectively.
6/Research and DevelopmentExpensesResearch and development expenses charged against earningswere $22,255, $24,830 and $25,823 in 1998, 1997 and 1996,respectively.
7/Income TaxesEarnings before income taxes, minority interests and cumulativeeffect of accounting changes for each year is as follows:
1998 1997 1996United States (U.S.) $29,549 $49,081 $66,403Outside U.S. 3,237 16,239 10,148Total $32,786 $65,320 $76,551
The components of the provision for income taxes excludingcumulative effect of accounting changes are:
1998 1997 1996Current:
U.S. federal $5,971 $16,769 $23,225State 1,198 1,706 3,555Outside U.S. 10,201 5,705 6,487
17,370 24,180 33,267Deferred:
U.S. federal 1,179 498 (2,453)State (74) 195 (82)Outside U.S. 351 1,778 501
1,456 2,471 (2,034)Total $18,826 $26,651 $31,233
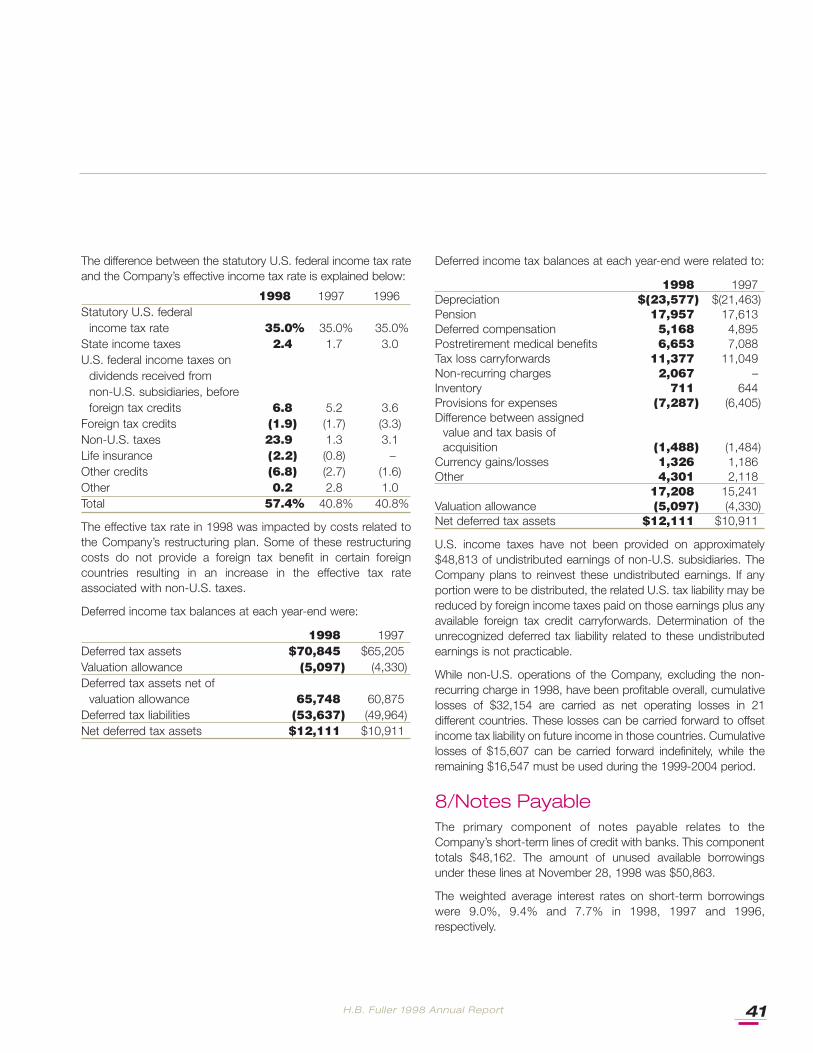
H.B. Fuller 1998 Annual Report 41
The difference between the statutory U.S. federal income tax rateand the Company’s effective income tax rate is explained below:
1998 1997 1996Statutory U.S. federal
income tax rate 35.0% 35.0% 35.0%State income taxes 2.4 1.7 3.0U.S. federal income taxes on
dividends received fromnon-U.S. subsidiaries, beforeforeign tax credits 6.8 5.2 3.6
Foreign tax credits (1.9) (1.7) (3.3)Non-U.S. taxes 23.9 1.3 3.1Life insurance (2.2) (0.8) –Other credits (6.8) (2.7) (1.6)Other 0.2 2.8 1.0Total 57.4% 40.8% 40.8%
The effective tax rate in 1998 was impacted by costs related tothe Company’s restructuring plan. Some of these restructuringcosts do not provide a foreign tax benefit in certain foreigncountries resulting in an increase in the effective tax rateassociated with non-U.S. taxes.
Deferred income tax balances at each year-end were:
1998 1997Deferred tax assets $70,845 $65,205Valuation allowance (5,097) (4,330)Deferred tax assets net of
valuation allowance 65,748 60,875Deferred tax liabilities (53,637) (49,964)Net deferred tax assets $12,111 $10,911
Deferred income tax balances at each year-end were related to:
1998 1997Depreciation $(23,577) $(21,463)Pension 17,957 17,613Deferred compensation 5,168 4,895Postretirement medical benefits 6,653 7,088Tax loss carryforwards 11,377 11,049Non-recurring charges 2,067 –Inventory 711 644Provisions for expenses (7,287) (6,405)Difference between assigned
value and tax basis ofacquisition (1,488) (1,484)
Currency gains/losses 1,326 1,186Other 4,301 2,118
17,208 15,241Valuation allowance (5,097) (4,330)Net deferred tax assets $12,111 $10,911
U.S. income taxes have not been provided on approximately$48,813 of undistributed earnings of non-U.S. subsidiaries. TheCompany plans to reinvest these undistributed earnings. If anyportion were to be distributed, the related U.S. tax liability may bereduced by foreign income taxes paid on those earnings plus anyavailable foreign tax credit carryforwards. Determination of theunrecognized deferred tax liability related to these undistributedearnings is not practicable.
While non-U.S. operations of the Company, excluding the non-recurring charge in 1998, have been profitable overall, cumulativelosses of $32,154 are carried as net operating losses in 21different countries. These losses can be carried forward to offsetincome tax liability on future income in those countries. Cumulativelosses of $15,607 can be carried forward indefinitely, while theremaining $16,547 must be used during the 1999-2004 period.
8/Notes PayableThe primary component of notes payable relates to theCompany’s short-term lines of credit with banks. This componenttotals $48,162. The amount of unused available borrowingsunder these lines at November 28, 1998 was $50,863.
The weighted average interest rates on short-term borrowingswere 9.0%, 9.4% and 7.7% in 1998, 1997 and 1996,respectively.
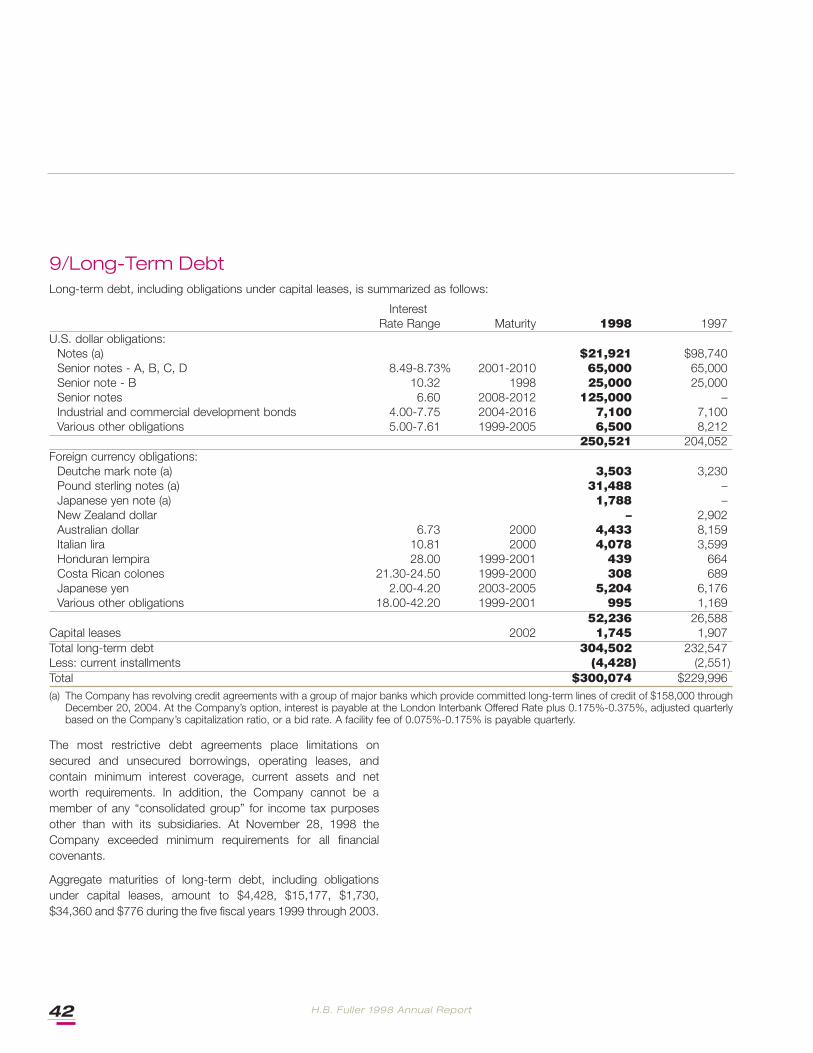
H.B. Fuller 1998 Annual Report42
The most restrictive debt agreements place limitations onsecured and unsecured borrowings, operating leases, andcontain minimum interest coverage, current assets and networth requirements. In addition, the Company cannot be amember of any “consolidated group” for income tax purposesother than with its subsidiaries. At November 28, 1998 theCompany exceeded minimum requirements for all financialcovenants.
Aggregate maturities of long-term debt, including obligationsunder capital leases, amount to $4,428, $15,177, $1,730,$34,360 and $776 during the five fiscal years 1999 through 2003.
9/Long-Term DebtLong-term debt, including obligations under capital leases, is summarized as follows:
InterestRate Range Maturity 1998 1997
U.S. dollar obligations:Notes (a) $21,921 $98,740Senior notes - A, B, C, D 8.49-8.73% 2001-2010 65,000 65,000Senior note - B 10.32 1998 25,000 25,000Senior notes 6.60 2008-2012 125,000 –Industrial and commercial development bonds 4.00-7.75 2004-2016 7,100 7,100Various other obligations 5.00-7.61 1999-2005 6,500 8,212
250,521 204,052Foreign currency obligations:
Deutche mark note (a) 3,503 3,230Pound sterling notes (a) 31,488 –Japanese yen note (a) 1,788 –New Zealand dollar – 2,902Australian dollar 6.73 2000 4,433 8,159Italian lira 10.81 2000 4,078 3,599Honduran lempira 28.00 1999-2001 439 664Costa Rican colones 21.30-24.50 1999-2000 308 689Japanese yen 2.00-4.20 2003-2005 5,204 6,176Various other obligations 18.00-42.20 1999-2001 995 1,169
52,236 26,588Capital leases 2002 1,745 1,907Total long-term debt 304,502 232,547Less: current installments (4,428) (2,551)Total $300,074 $229,996(a) The Company has revolving credit agreements with a group of major banks which provide committed long-term lines of credit of $158,000 through
December 20, 2004. At the Company’s option, interest is payable at the London Interbank Offered Rate plus 0.175%-0.375%, adjusted quarterlybased on the Company’s capitalization ratio, or a bid rate. A facility fee of 0.075%-0.175% is payable quarterly.
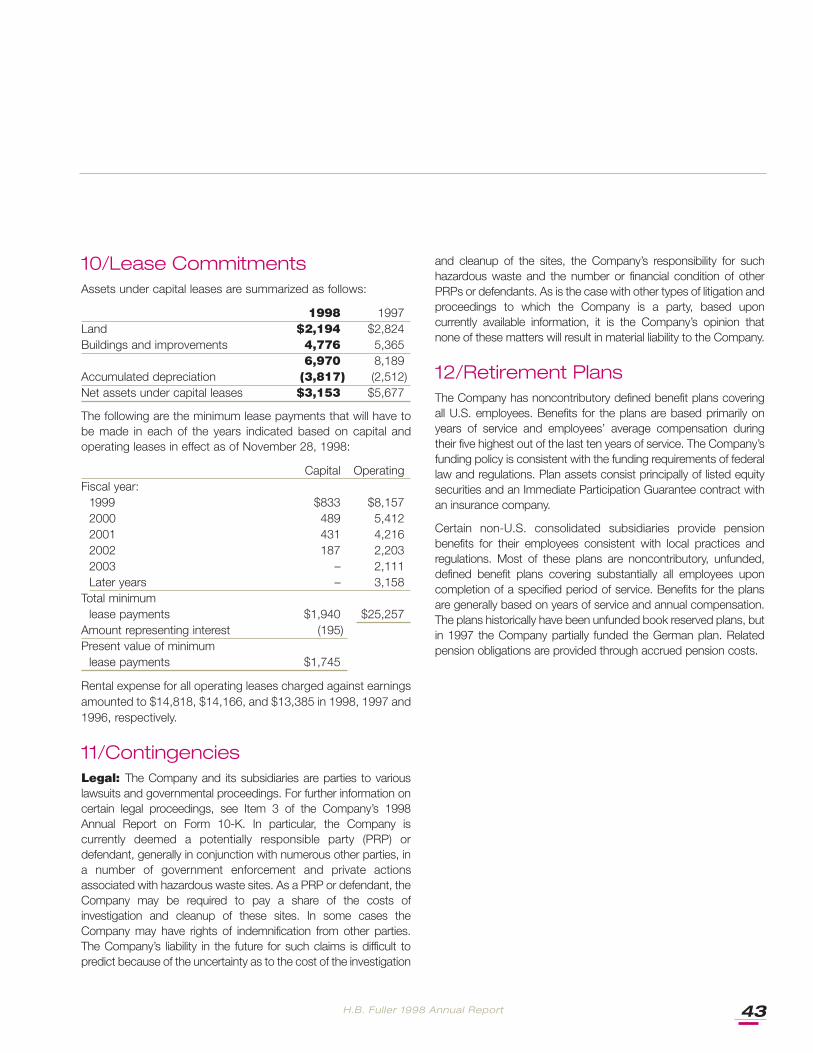
H.B. Fuller 1998 Annual Report 43
10/Lease CommitmentsAssets under capital leases are summarized as follows:
1998 1997Land $2,194 $2,824Buildings and improvements 4,776 5,365
6,970 8,189Accumulated depreciation (3,817) (2,512)Net assets under capital leases $3,153 $5,677
The following are the minimum lease payments that will have tobe made in each of the years indicated based on capital andoperating leases in effect as of November 28, 1998:
Capital OperatingFiscal year:
1999 $833 $8,1572000 489 5,4122001 431 4,2162002 187 2,2032003 – 2,111Later years – 3,158
Total minimum lease payments $1,940 $25,257
Amount representing interest (195)Present value of minimum
lease payments $1,745
Rental expense for all operating leases charged against earningsamounted to $14,818, $14,166, and $13,385 in 1998, 1997 and1996, respectively.
11/ContingenciesLegal: The Company and its subsidiaries are parties to variouslawsuits and governmental proceedings. For further information oncertain legal proceedings, see Item 3 of the Company’s 1998Annual Report on Form 10-K. In particular, the Company iscurrently deemed a potentially responsible party (PRP) ordefendant, generally in conjunction with numerous other parties, ina number of government enforcement and private actionsassociated with hazardous waste sites. As a PRP or defendant, theCompany may be required to pay a share of the costs ofinvestigation and cleanup of these sites. In some cases theCompany may have rights of indemnification from other parties.The Company’s liability in the future for such claims is difficult topredict because of the uncertainty as to the cost of the investigation
and cleanup of the sites, the Company’s responsibility for suchhazardous waste and the number or financial condition of otherPRPs or defendants. As is the case with other types of litigation andproceedings to which the Company is a party, based uponcurrently available information, it is the Company’s opinion thatnone of these matters will result in material liability to the Company.
12/Retirement PlansThe Company has noncontributory defined benefit plans coveringall U.S. employees. Benefits for the plans are based primarily onyears of service and employees’ average compensation duringtheir five highest out of the last ten years of service. The Company’sfunding policy is consistent with the funding requirements of federallaw and regulations. Plan assets consist principally of listed equitysecurities and an Immediate Participation Guarantee contract withan insurance company.
Certain non-U.S. consolidated subsidiaries provide pensionbenefits for their employees consistent with local practices andregulations. Most of these plans are noncontributory, unfunded,defined benefit plans covering substantially all employees uponcompletion of a specified period of service. Benefits for the plansare generally based on years of service and annual compensation.The plans historically have been unfunded book reserved plans, butin 1997 the Company partially funded the German plan. Relatedpension obligations are provided through accrued pension costs.
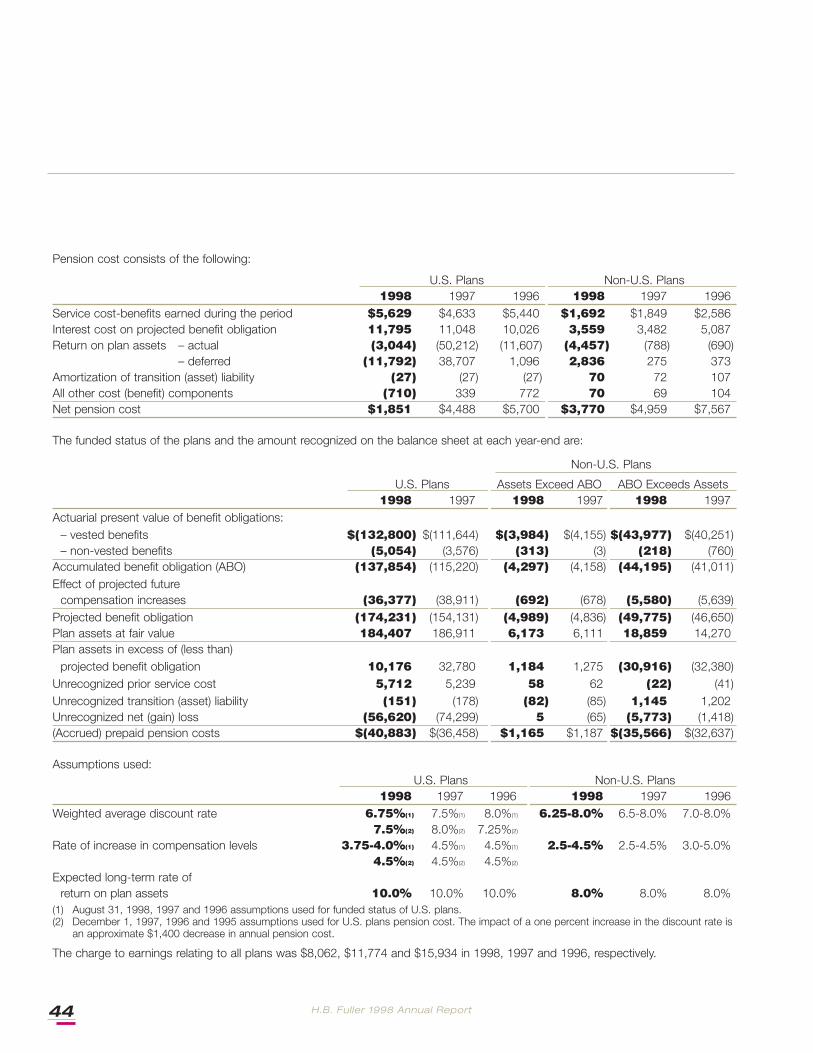
H.B. Fuller 1998 Annual Report44
Pension cost consists of the following:
U.S. Plans Non-U.S. Plans1998 1997 1996 1998 1997 1996
Service cost-benefits earned during the period $5,629 $4,633 $5,440 $1,692 $1,849 $2,586Interest cost on projected benefit obligation 11,795 11,048 10,026 3,559 3,482 5,087Return on plan assets – actual (3,044) (50,212) (11,607) (4,457) (788) (690)
– deferred (11,792) 38,707 1,096 2,836 275 373Amortization of transition (asset) liability (27) (27) (27) 70 72 107All other cost (benefit) components (710) 339 772 70 69 104Net pension cost $1,851 $4,488 $5,700 $3,770 $4,959 $7,567
The funded status of the plans and the amount recognized on the balance sheet at each year-end are:
Non-U.S. Plans
U.S. Plans Assets Exceed ABO ABO Exceeds Assets1998 1997 1998 1997 1998 1997
Actuarial present value of benefit obligations:– vested benefits $(132,800) $(111,644) $(3,984) $(4,155) $(43,977) $(40,251)– non-vested benefits (5,054) (3,576) (313) (3) (218) (760)
Accumulated benefit obligation (ABO) (137,854) (115,220) (4,297) (4,158) (44,195) (41,011)Effect of projected future
compensation increases (36,377) (38,911) (692) (678) (5,580) (5,639)Projected benefit obligation (174,231) (154,131) (4,989) (4,836) (49,775) (46,650)Plan assets at fair value 184,407 186,911 6,173 6,111 18,859 14,270Plan assets in excess of (less than)
projected benefit obligation 10,176 32,780 1,184 1,275 (30,916) (32,380)Unrecognized prior service cost 5,712 5,239 58 62 (22) (41)Unrecognized transition (asset) liability (151) (178) (82) (85) 1,145 1,202Unrecognized net (gain) loss (56,620) (74,299) 5 (65) (5,773) (1,418)(Accrued) prepaid pension costs $(40,883) $(36,458) $1,165 $1,187 $(35,566) $(32,637)
Assumptions used:U.S. Plans Non-U.S. Plans
1998 1997 1996 1998 1997 1996Weighted average discount rate 6.75%(1) 7.5%(1) 8.0%(1) 6.25-8.0% 6.5-8.0% 7.0-8.0%
7.5%(2) 8.0%(2) 7.25%(2)
Rate of increase in compensation levels 3.75-4.0%(1) 4.5%(1) 4.5%(1) 2.5-4.5% 2.5-4.5% 3.0-5.0%4.5%(2) 4.5%(2) 4.5%(2)
Expected long-term rate of return on plan assets 10.0% 10.0% 10.0% 8.0% 8.0% 8.0%
(1) August 31, 1998, 1997 and 1996 assumptions used for funded status of U.S. plans.(2) December 1, 1997, 1996 and 1995 assumptions used for U.S. plans pension cost. The impact of a one percent increase in the discount rate is
an approximate $1,400 decrease in annual pension cost.
The charge to earnings relating to all plans was $8,062, $11,774 and $15,934 in 1998, 1997 and 1996, respectively.
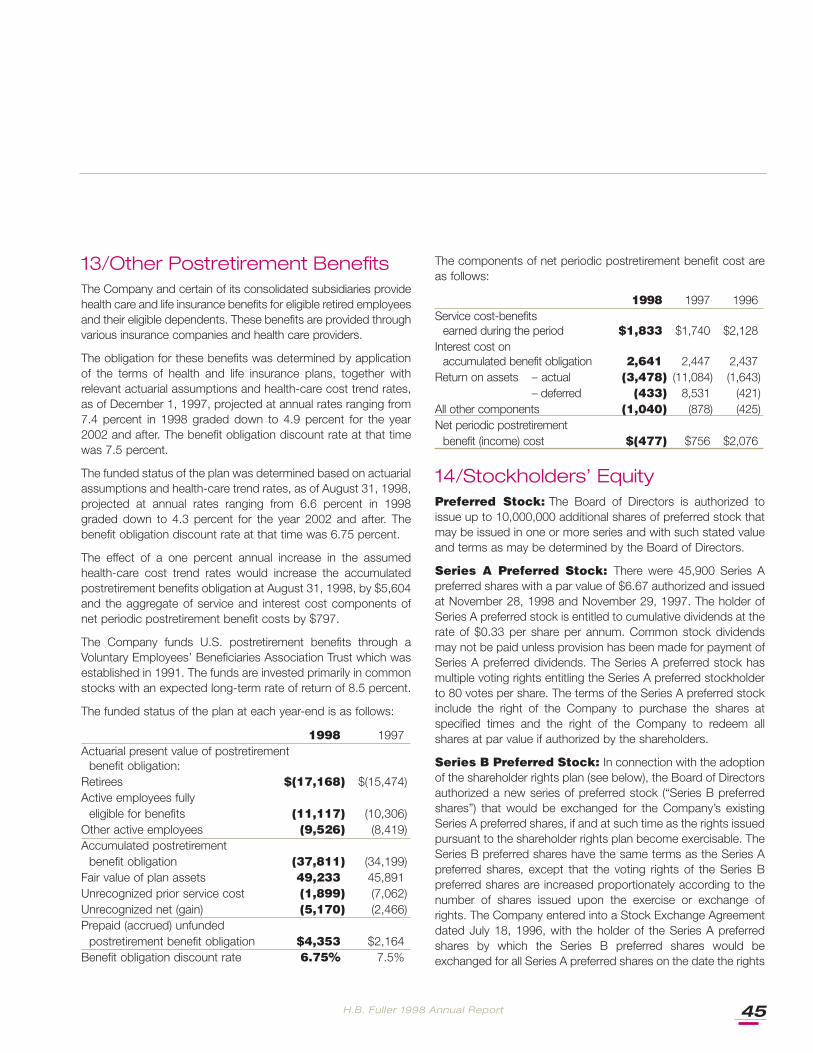
H.B. Fuller 1998 Annual Report 45
13/Other Postretirement BenefitsThe Company and certain of its consolidated subsidiaries providehealth care and life insurance benefits for eligible retired employeesand their eligible dependents. These benefits are provided throughvarious insurance companies and health care providers.
The obligation for these benefits was determined by applicationof the terms of health and life insurance plans, together withrelevant actuarial assumptions and health-care cost trend rates,as of December 1, 1997, projected at annual rates ranging from7.4 percent in 1998 graded down to 4.9 percent for the year2002 and after. The benefit obligation discount rate at that timewas 7.5 percent.
The funded status of the plan was determined based on actuarialassumptions and health-care trend rates, as of August 31, 1998,projected at annual rates ranging from 6.6 percent in 1998graded down to 4.3 percent for the year 2002 and after. Thebenefit obligation discount rate at that time was 6.75 percent.
The effect of a one percent annual increase in the assumedhealth-care cost trend rates would increase the accumulatedpostretirement benefits obligation at August 31, 1998, by $5,604and the aggregate of service and interest cost components ofnet periodic postretirement benefit costs by $797.
The Company funds U.S. postretirement benefits through aVoluntary Employees’ Beneficiaries Association Trust which wasestablished in 1991. The funds are invested primarily in commonstocks with an expected long-term rate of return of 8.5 percent.
The funded status of the plan at each year-end is as follows:
1998 1997Actuarial present value of postretirement
benefit obligation:Retirees $(17,168) $(15,474)Active employees fully
eligible for benefits (11,117) (10,306)Other active employees (9,526) (8,419)Accumulated postretirement
benefit obligation (37,811) (34,199)Fair value of plan assets 49,233 45,891Unrecognized prior service cost (1,899) (7,062)Unrecognized net (gain) (5,170) (2,466)Prepaid (accrued) unfunded
postretirement benefit obligation $4,353 $2,164Benefit obligation discount rate 6.75% 7.5%
The components of net periodic postretirement benefit cost areas follows:
1998 1997 1996Service cost-benefits
earned during the period $1,833 $1,740 $2,128Interest cost on
accumulated benefit obligation 2,641 2,447 2,437Return on assets – actual (3,478) (11,084) (1,643)
– deferred (433) 8,531 (421)All other components (1,040) (878) (425)Net periodic postretirement
benefit (income) cost $(477) $756 $2,076
14/Stockholders’ EquityPreferred Stock: The Board of Directors is authorized toissue up to 10,000,000 additional shares of preferred stock thatmay be issued in one or more series and with such stated valueand terms as may be determined by the Board of Directors.
Series A Preferred Stock: There were 45,900 Series Apreferred shares with a par value of $6.67 authorized and issuedat November 28, 1998 and November 29, 1997. The holder ofSeries A preferred stock is entitled to cumulative dividends at therate of $0.33 per share per annum. Common stock dividendsmay not be paid unless provision has been made for payment ofSeries A preferred dividends. The Series A preferred stock hasmultiple voting rights entitling the Series A preferred stockholderto 80 votes per share. The terms of the Series A preferred stockinclude the right of the Company to purchase the shares atspecified times and the right of the Company to redeem allshares at par value if authorized by the shareholders.
Series B Preferred Stock: In connection with the adoptionof the shareholder rights plan (see below), the Board of Directorsauthorized a new series of preferred stock (“Series B preferredshares”) that would be exchanged for the Company’s existingSeries A preferred shares, if and at such time as the rights issuedpursuant to the shareholder rights plan become exercisable. TheSeries B preferred shares have the same terms as the Series Apreferred shares, except that the voting rights of the Series Bpreferred shares are increased proportionately according to thenumber of shares issued upon the exercise or exchange ofrights. The Company entered into a Stock Exchange Agreementdated July 18, 1996, with the holder of the Series A preferredshares by which the Series B preferred shares would beexchanged for all Series A preferred shares on the date the rights
H.B. Fuller 1998 Annual Report46
under the shareholder rights plan become exercisable. Theexchange of the Series A preferred shares for the new Series Bpreferred shares is intended to preserve the holder’s votingpower, in the event any rights are exercised. No event hasoccurred which would cause the exchange to be effected.
Common Stock: There were 40,000,000 par value $1.00common shares authorized and 13,982,649 and 13,840,773shares issued at November 28, 1998 and November 29, 1997,respectively.
Shareholder Rights Plan: The Company has a shareholderrights plan under which each holder of a share of common stockalso has one right to purchase one share of common stock for$180. The rights are not presently exercisable. Upon theoccurrence of certain “flip-in” events, each right becomesexercisable and then entitles its holder to purchase $180 worthof common stock at one-half of its then market value. Uponcertain “flip-over” events, each right entitles its holder topurchase $180 worth of stock of another party at one-half of itsthen market value. One flip-in event is when a person or group(an “acquiring person”) acquires 15 percent or more of theCompany’s outstanding common stock. Rights held by anacquiring person or an adverse person are void. The Companymay redeem the rights for one cent per share, but theredemption right expires upon the occurrence of a flip-in event.In addition, at any time after a person or group acquires 15percent or more of the Company’s outstanding common stock,but less than 50 percent, the Board of Directors may, at itsoption, exchange all or part of the rights (other than rights heldby the acquiring person) for shares of the Company’s commonstock at a rate of one share of common stock for every right. Therights expire on July 30, 2006.
Directors’ Stock Plan: The Directors’ Stock Plan reserves75,000 shares of common stock for allocation as payment ofretainer fees. Directors, who are not employees, can choose toreceive all or a portion of the payment of their retainer andmeeting fees in shares of Company common stock when theyleave the Board rather than cash payments each year. AtNovember 28, 1998, 33,334 shares remained available for futureallocation.
1998 Directors’ Stock Incentive Plan: The 1998Directors’ Stock Incentive Plan reserves 200,000 shares ofcommon stock to offer nonemployee directors incentives to putforth maximum efforts for the success of the Company’s businessand to afford nonemployee directors an opportunity to acquire a
proprietary interest in the Company. In 1998, 7,017 restrictedshares were awarded with a market value of $441 being chargedto expense over the vesting periods. At November 28, 1998,192,983 shares remained available for future award.
1992 Stock Incentive Plan: Under the 1992 StockIncentive Plan a total of 900,000 shares of the Company’scommon stock are available for the granting of awards during aperiod of up to ten years from April 16, 1992. The StockIncentive Plan permits the granting of (a) stock options; (b) stockappreciation rights; (c) restricted stock and restricted stock units;(d) performance awards; (e) dividend equivalents; and (f) otherawards valued in whole or in part by reference to or otherwisebased upon the Company’s stock.
A total of 64,755, 38,736 and 38,900 restricted shares of theCompany’s common stock were granted to certain employees in1998, 1997 and 1996, respectively. The market value of sharesawarded $3,734, $2,108 and $1,352 has been recorded asunearned compensation – restricted stock in 1998, 1997 and1996, respectively and is shown as a separate component ofstockholders’ equity. Unearned compensation is beingamortized to expense over the vesting periods and amounted to$993, $548 and $473 in 1998, 1997 and 1996, respectively.
A total of 19,900, 21,850 and 25,500 restricted share units of theCompany’s common stock were allocated to certain employeesin 1998, 1997 and 1996, respectively. The market value of unitsallocated of $1,104, $1,191 and $886 in 1998, 1997 and 1996,respectively, is generally being charged to expense over the ten-year vesting period.
At November 28, 1998, 509,870 shares remained available forfuture grants or allocations.
Stock-Based Compensation: In October 1995, the FASBissued SFAS No. 123, “Accounting for Stock-BasedCompensation.” As permitted by this Standard, the Companywill continue to measure compensation cost using the intrinsicvalue-based method of accounting prescribed by theAccounting Principles Board Opinion No. 25. Since theCompany has not granted stock options after the effective dateof SFAS No. 123, there is no pro forma impact to disclose.
1987 Stock Option Plan: 110,991 options were out-standing at November 28, 1998, under the Company’s 1987non-qualified plan. Options are exercisable until April 27, 2000.At November 28, 1998, no shares remained available for grantsunder this plan.
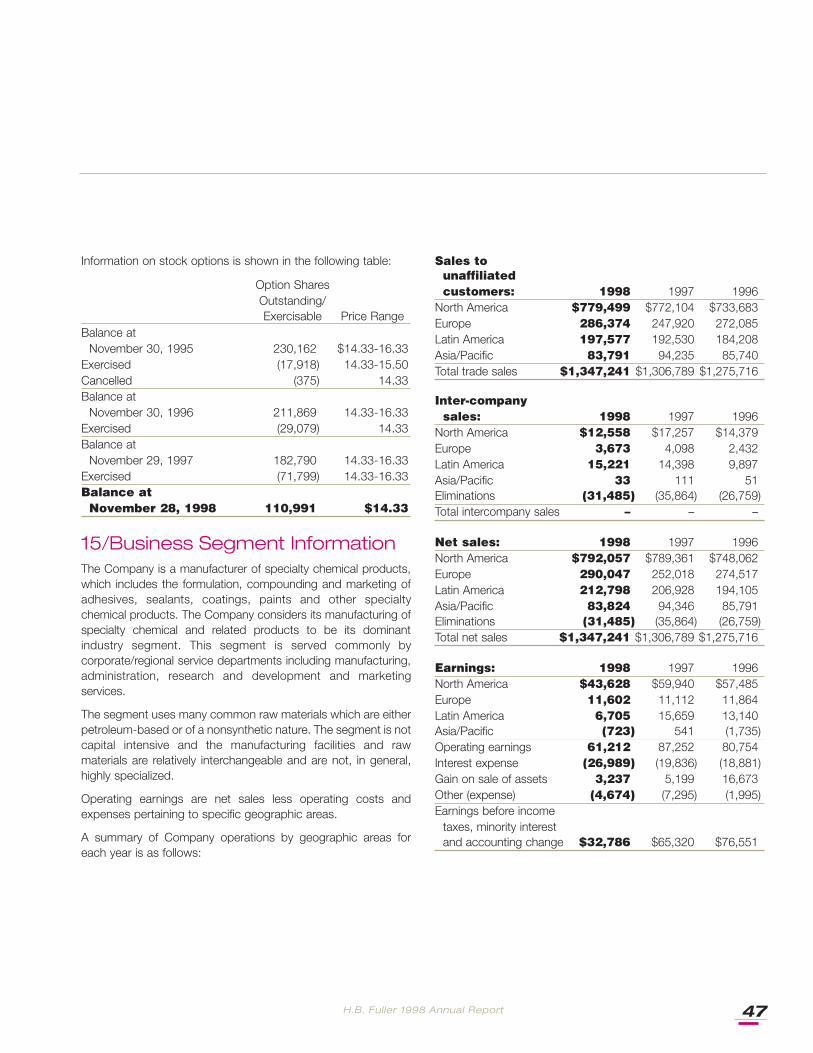
H.B. Fuller 1998 Annual Report 47
Information on stock options is shown in the following table:
Option SharesOutstanding/Exercisable Price Range
Balance atNovember 30, 1995 230,162 $14.33-16.33
Exercised (17,918) 14.33-15.50Cancelled (375) 14.33Balance at
November 30, 1996 211,869 14.33-16.33Exercised (29,079) 14.33Balance at
November 29, 1997 182,790 14.33-16.33Exercised (71,799) 14.33-16.33Balance at
November 28, 1998 110,991 $14.33
15/Business Segment Information The Company is a manufacturer of specialty chemical products,which includes the formulation, compounding and marketing ofadhesives, sealants, coatings, paints and other specialtychemical products. The Company considers its manufacturing ofspecialty chemical and related products to be its dominantindustry segment. This segment is served commonly bycorporate/regional service departments including manufacturing,administration, research and development and marketingservices.
The segment uses many common raw materials which are eitherpetroleum-based or of a nonsynthetic nature. The segment is notcapital intensive and the manufacturing facilities and rawmaterials are relatively interchangeable and are not, in general,highly specialized.
Operating earnings are net sales less operating costs andexpenses pertaining to specific geographic areas.
A summary of Company operations by geographic areas foreach year is as follows:
Sales tounaffiliated customers: 1998 1997 1996
North America $779,499 $772,104 $733,683Europe 286,374 247,920 272,085Latin America 197,577 192,530 184,208Asia/Pacific 83,791 94,235 85,740Total trade sales $1,347,241 $1,306,789 $1,275,716
Inter-companysales: 1998 1997 1996
North America $12,558 $17,257 $14,379Europe 3,673 4,098 2,432Latin America 15,221 14,398 9,897Asia/Pacific 33 111 51Eliminations (31,485) (35,864) (26,759)Total intercompany sales – – –
Net sales: 1998 1997 1996North America $792,057 $789,361 $748,062Europe 290,047 252,018 274,517Latin America 212,798 206,928 194,105Asia/Pacific 83,824 94,346 85,791Eliminations (31,485) (35,864) (26,759)Total net sales $1,347,241 $1,306,789 $1,275,716
Earnings: 1998 1997 1996North America $43,628 $59,940 $57,485Europe 11,602 11,112 11,864Latin America 6,705 15,659 13,140Asia/Pacific (723) 541 (1,735)Operating earnings 61,212 87,252 80,754Interest expense (26,989) (19,836) (18,881)Gain on sale of assets 3,237 5,199 16,673Other (expense) (4,674) (7,295) (1,995)Earnings before income
taxes, minority interestand accounting change $32,786 $65,320 $76,551
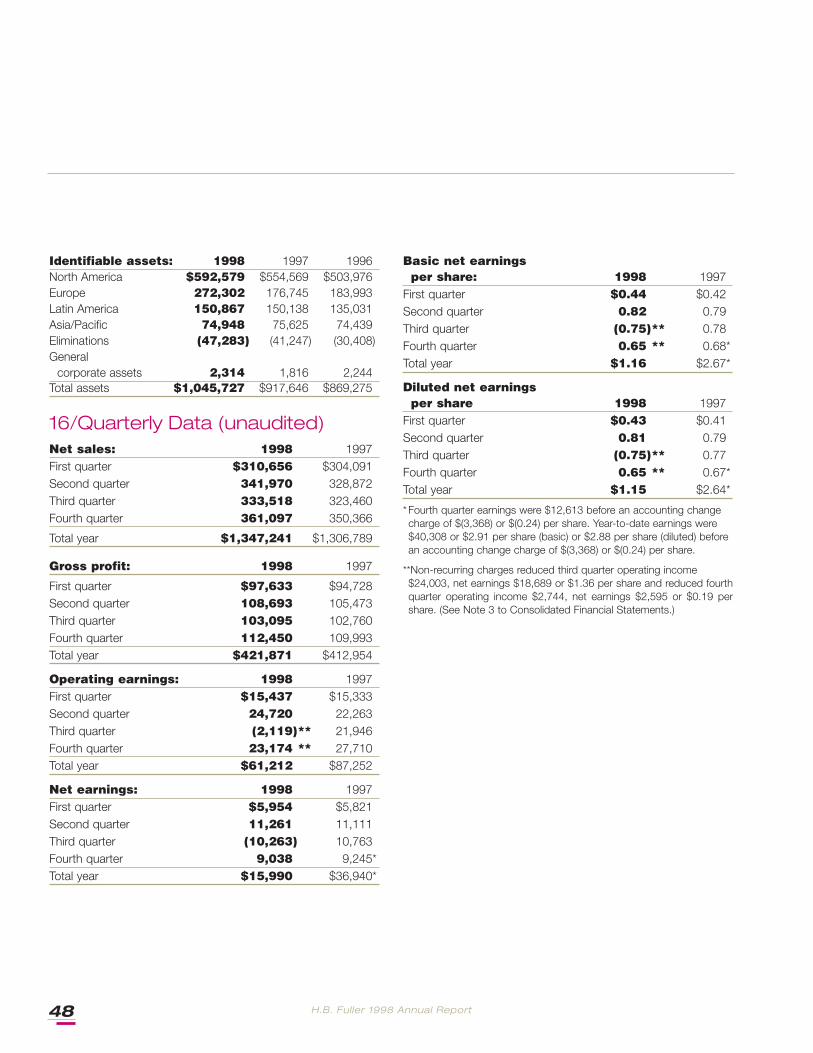
H.B. Fuller 1998 Annual Report48
Identifiable assets: 1998 1997 1996North America $592,579 $554,569 $503,976Europe 272,302 176,745 183,993Latin America 150,867 150,138 135,031Asia/Pacific 74,948 75,625 74,439Eliminations (47,283) (41,247) (30,408)General
corporate assets 2,314 1,816 2,244Total assets $1,045,727 $917,646 $869,275
16/Quarterly Data (unaudited)Net sales: 1998 1997First quarter $310,656 $304,091Second quarter 341,970 328,872Third quarter 333,518 323,460Fourth quarter 361,097 350,366
Total year $1,347,241 $1,306,789
Gross profit: 1998 1997
First quarter $97,633 $94,728Second quarter 108,693 105,473Third quarter 103,095 102,760Fourth quarter 112,450 109,993Total year $421,871 $412,954
Operating earnings: 1998 1997First quarter $15,437 $15,333Second quarter 24,720 22,263Third quarter (2,119)** 21,946Fourth quarter 23,174 ** 27,710Total year $61,212 $87,252
Net earnings: 1998 1997First quarter $5,954 $5,821Second quarter 11,261 11,111Third quarter (10,263) 10,763Fourth quarter 9,038 9,245*Total year $15,990 $36,940*
Basic net earnings per share: 1998 1997
First quarter $0.44 $0.42Second quarter 0.82 0.79Third quarter (0.75)** 0.78Fourth quarter 0.65 ** 0.68*Total year $1.16 $2.67*
Diluted net earningsper share 1998 1997
First quarter $0.43 $0.41Second quarter 0.81 0.79Third quarter (0.75)** 0.77Fourth quarter 0.65 ** 0.67*Total year $1.15 $2.64*
* Fourth quarter earnings were $12,613 before an accounting changecharge of $(3,368) or $(0.24) per share. Year-to-date earnings were$40,308 or $2.91 per share (basic) or $2.88 per share (diluted) beforean accounting change charge of $(3,368) or $(0.24) per share.
**Non-recurring charges reduced third quarter operating income$24,003, net earnings $18,689 or $1.36 per share and reduced fourthquarter operating income $2,744, net earnings $2,595 or $0.19 pershare. (See Note 3 to Consolidated Financial Statements.)
H.B. Fuller 1998 Annual Report 49
The management of H.B. Fuller Company is responsible for theintegrity, objectivity and accuracy of the financial statements ofthe Company and its subsidiaries. The accompanying financialstatements, including the notes, were prepared in conformitywith generally accepted accounting principles appropriate in thecircumstances and include amounts based on the bestjudgment of management.
Management is also responsible for maintaining a system ofinternal accounting control to provide reasonable assurance thatestablished policies and procedures are followed, that the recordsproperly reflect all transactions of the Company and that assetsare safeguarded against material loss from unauthorized use ordisposition. Management believes that the Company’s accountingcontrols provide reasonable assurance that errors or irregularitiesthat could be material to the financial statements are prevented orwould be detected within a timely period by employees in thenormal course of performing their assigned duties.
To the Board of Directors andStockholders of H.B. Fuller Company
In our opinion, the accompanying consolidated balance sheetsand the related consolidated statements of earnings,stockholders’ equity and of cash flows present fairly, in allmaterial respects, the financial position of H.B. Fuller Companyand its subsidiaries at November 28, 1998 and November 29,1997, and the results of their operations and their cash flows foreach of the three years in the period ended November 28, 1998,in conformity with generally accepted accounting principles.These financial statements are the responsibility of theCompany’s management; our responsibility is to express anopinion on these financial statements based on our audits. Weconducted our audits of these statements in accordance withgenerally accepted auditing standards which require that weplan and perform the audit to obtain reasonable assuranceabout whether the financial statements are free of materialmisstatement. An audit includes examining, on a test basis,evidence supporting the amounts and disclosures in thefinancial statements, assessing the accounting principles usedand significant estimates made by management, and evaluatingthe overall financial statement presentation. We believe that ouraudits provide a reasonable basis for the opinion expressedabove.
As discussed in Note 1, in 1997 the Company changed itsaccounting for certain information technology transformation coststo conform with issue 97-13 of the Emerging Issues Task Force.
PricewaterhouseCoopers LLPMinneapolis, MinnesotaJanuary 8, 1999
Jorge Walter BolañosSenior Vice President, Chief Financial Officer and Treasurer
Albert P.L. StrouckenPresident and Chief Executive Officer
Management’s ReportReport of Independent Accountants
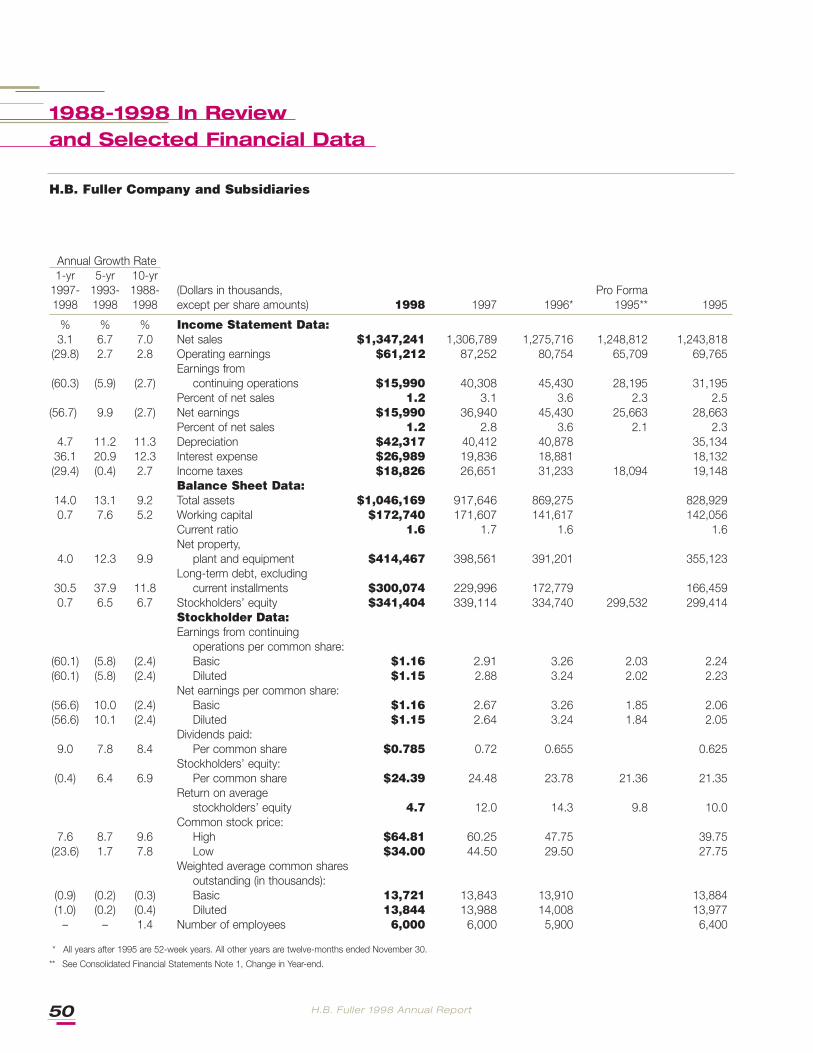
H.B. Fuller 1998 Annual Report50
1988-1998 In Reviewand Selected Financial Data
Annual Growth Rate1-yr 5-yr 10-yr
1997- 1993- 1988- (Dollars in thousands, Pro Forma1998 1998 1998 except per share amounts) 1998 1997 1996* 1995** 1995
% % % Income Statement Data:3.1 6.7 7.0 Net sales $1,347,241 1,306,789 1,275,716 1,248,812 1,243,818
(29.8) 2.7 2.8 Operating earnings $61,212 87,252 80,754 65,709 69,765Earnings from
(60.3) (5.9) (2.7) continuing operations $15,990 40,308 45,430 28,195 31,195Percent of net sales 1.2 3.1 3.6 2.3 2.5
(56.7) 9.9 (2.7) Net earnings $15,990 36,940 45,430 25,663 28,663Percent of net sales 1.2 2.8 3.6 2.1 2.3
4.7 11.2 11.3 Depreciation $42,317 40,412 40,878 35,13436.1 20.9 12.3 Interest expense $26,989 19,836 18,881 18,132(29.4) (0.4) 2.7 Income taxes $18,826 26,651 31,233 18,094 19,148
Balance Sheet Data:14.0 13.1 9.2 Total assets $1,046,169 917,646 869,275 828,9290.7 7.6 5.2 Working capital $172,740 171,607 141,617 142,056
Current ratio 1.6 1.7 1.6 1.6Net property,
4.0 12.3 9.9 plant and equipment $414,467 398,561 391,201 355,123Long-term debt, excluding
30.5 37.9 11.8 current installments $300,074 229,996 172,779 166,4590.7 6.5 6.7 Stockholders’ equity $341,404 339,114 334,740 299,532 299,414
Stockholder Data:Earnings from continuing
operations per common share:(60.1) (5.8) (2.4) Basic $1.16 2.91 3.26 2.03 2.24(60.1) (5.8) (2.4) Diluted $1.15 2.88 3.24 2.02 2.23
Net earnings per common share:(56.6) 10.0 (2.4) Basic $1.16 2.67 3.26 1.85 2.06(56.6) 10.1 (2.4) Diluted $1.15 2.64 3.24 1.84 2.05
Dividends paid:9.0 7.8 8.4 Per common share $0.785 0.72 0.655 0.625
Stockholders’ equity:(0.4) 6.4 6.9 Per common share $24.39 24.48 23.78 21.36 21.35
Return on average stockholders’ equity 4.7 12.0 14.3 9.8 10.0
Common stock price:7.6 8.7 9.6 High $64.81 60.25 47.75 39.75
(23.6) 1.7 7.8 Low $34.00 44.50 29.50 27.75Weighted average common shares
outstanding (in thousands):(0.9) (0.2) (0.3) Basic 13,721 13,843 13,910 13,884(1.0) (0.2) (0.4) Diluted 13,844 13,988 14,008 13,977
– – 1.4 Number of employees 6,000 6,000 5,900 6,400
* All years after 1995 are 52-week years. All other years are twelve-months ended November 30.
** See Consolidated Financial Statements Note 1, Change in Year-end.
H.B. Fuller Company and Subsidiaries
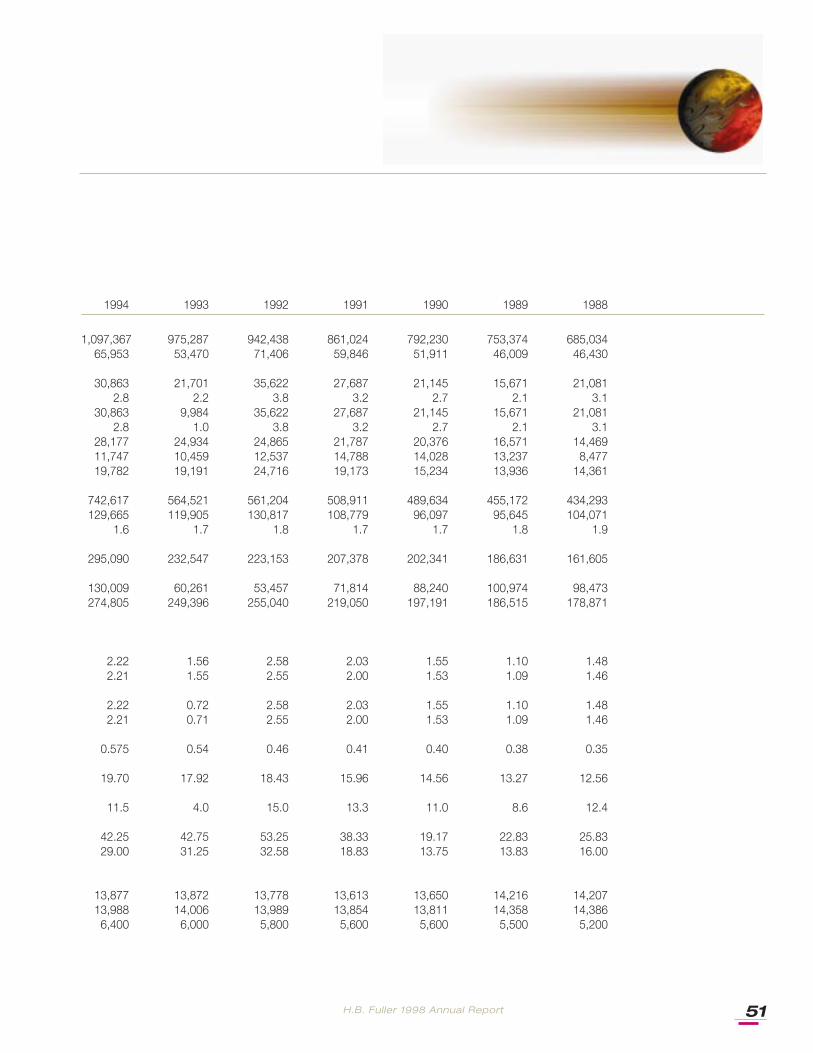
H.B. Fuller 1998 Annual Report 51
1994 1993 1992 1991 1990 1989 1988
1,097,367 975,287 942,438 861,024 792,230 753,374 685,03465,953 53,470 71,406 59,846 51,911 46,009 46,430
30,863 21,701 35,622 27,687 21,145 15,671 21,0812.8 2.2 3.8 3.2 2.7 2.1 3.1
30,863 9,984 35,622 27,687 21,145 15,671 21,0812.8 1.0 3.8 3.2 2.7 2.1 3.1
28,177 24,934 24,865 21,787 20,376 16,571 14,46911,747 10,459 12,537 14,788 14,028 13,237 8,47719,782 19,191 24,716 19,173 15,234 13,936 14,361
742,617 564,521 561,204 508,911 489,634 455,172 434,293129,665 119,905 130,817 108,779 96,097 95,645 104,071
1.6 1.7 1.8 1.7 1.7 1.8 1.9
295,090 232,547 223,153 207,378 202,341 186,631 161,605
130,009 60,261 53,457 71,814 88,240 100,974 98,473274,805 249,396 255,040 219,050 197,191 186,515 178,871
2.22 1.56 2.58 2.03 1.55 1.10 1.482.21 1.55 2.55 2.00 1.53 1.09 1.46
2.22 0.72 2.58 2.03 1.55 1.10 1.482.21 0.71 2.55 2.00 1.53 1.09 1.46
0.575 0.54 0.46 0.41 0.40 0.38 0.35
19.70 17.92 18.43 15.96 14.56 13.27 12.56
11.5 4.0 15.0 13.3 11.0 8.6 12.4
42.25 42.75 53.25 38.33 19.17 22.83 25.8329.00 31.25 32.58 18.83 13.75 13.83 16.00
13,877 13,872 13,778 13,613 13,650 14,216 14,20713,988 14,006 13,989 13,854 13,811 14,358 14,3866,400 6,000 5,800 5,600 5,600 5,500 5,200

H.B. Fuller 1998 Annual Report52
Annual MeetingThe annual meeting of shareholders will be held on Thursday,April 15, 1999, at 3 p.m. at the RiverCentre, 175 West KelloggBoulevard, St. Paul, Minnesota. All shareholders are cordiallyinvited to attend.
Form 10-KH.B. Fuller Company’s Form 10-K annual report for the yearended November 28, 1998, filed with the Securities andExchange Commission, Washington, D.C., is available uponrequest at no charge. Exhibits to the Form 10-K are available ata charge sufficient to cover postage and handling. This materialmay be obtained by writing to: Corporate Secretary, H.B. FullerCompany, P.O. Box 64683, St. Paul, MN 55164-0683.
Independent AccountantsPricewaterhouseCoopers LLP, Minneapolis, Minnesota.
Investor Contact Richard EdwardsDirector of Investor Relations
To receive shareholder material through the mail, or if you’d liketo be added to our mailing list, call our Shareholder Services Lineat 1-800-214-2523.
Number of Common ShareholdersAs of November 28, 1998, there were approximately 4,522common shareholders of record.
Transfer Agent and RegistrarNorwest Bank Minnesota, N.A., P.O. Box 64856, St. Paul, MN55164-0856, 1-800-468-9716 or 651-450-4064 (in Minnesota).
Web Sitehttp://www.hbfuller.com18%
Individuals
13%Employees
7% Directors
62%Institutions
InvestorInformation
Stock PriceCommon Stock* (Intraday Price High/Low)
Dividends(Per Share)
1997 1998 1997 1998 1997 1998 1997 1998
First Quarter
First Quarter
Second Quarter
Second Quarter
ThirdQuarter
Fourth Quarter
Third Quarter
Fourth Quarter
$5
1.2
5$
44
.50 $
58
.00
$4
6.5
0 $5
6.1
3$
46
.50
$6
4.8
1$
54
.50
$6
0.2
5$
46
.88
$6
3.0
6$
47
.38 $5
9.5
0$
45
.38
$5
0.6
3$
34
.00
1997 High 1998 High 1998 Low1997 Low
1997 1998
$0
.16
5
$0
.18
5
$0
.18
5
$0
.18
5
$0
.18
5
$0
.20
$0
.20
$0
.20
Shareholder Composition

Designed by: deRuyter Nelson Publications, Inc.Printed by: Watt/Peterson, inc.

H.B. Fuller Company
World Headquarters1200 Willow Lake BoulevardSt. Paul, MN 55110-5101
Send all correspondence to:H.B. Fuller Company World HeadquartersP.O. Box 64683St. Paul, MN 55164-0683
a