Embed Size (px)
Citation preview
Hawai‘i Injury Prevention Plan2012-2017Injury Prevention Advisory CommitteeInjury Prevention and Control Section
Hawai‘i State Department of Health
Emergency Medical Services and Injury Prevention System Branch

1Hawai‘i Injury Prevention Plan 2012-2017
Hawai‘i Injury Prevention Plan 2012-2017
Dear Community Colleagues,
We are pleased to present you with the Hawai‘i Injury Prevention Plan 2012-2017 that serves as a guide
for reducing the eight leading causes of injury in Hawai‘i. This document builds on the previous Hawai‘i
Injury Prevention Plan 2005-2010 and is the result of a collaborative effort between the Hawai‘i State
Department of Health (DOH), Emergency Medical Services and Injury Prevention System Branch
(EMSIPSB); the Injury Prevention Advisory Committee (IPAC); and other community partners. In the
gap period between the end of the previous plan and inception of the new plan, the initial plan continued
to guide the work of the DOH Injury Prevention and Control Section and community partners.
Here in Hawai‘i, we have made great strides in preventing injuries through the cooperative efforts of
government agencies, voluntary and professional organizations, and numerous other community
partners. There is much more we must do, however, to further reduce the burden of injury.
Injury prevention remains an under-recognized and under-funded area of public health. Now more than
ever, we must leverage our resources to join the best knowledge and practices with strong partnerships to
effectively prevent injuries, thereby reducing pain and suffering, and saving Hawai‘i millions of dollars
each year. We must work together to raise public awareness, build community capacity for injury
prevention efforts, make changes to the physical environment, and implement policy and organizational
practices that prevent injuries.
On behalf of the Injury Prevention Advisory Committee and the Hawai‘i State Department of Health,
we invite you to join us in achieving the recommendations set forth in this plan. Please contact us through
www.nogethurthawaii.gov or call the Injury Prevention and Control Section on O‘ahu at (808)733-9320.
Working together, we can accomplish what none of us can do alone.
Bruce McEwan, PhD Loretta J. Fuddy, ACSW, MPHChair Director of HealthInjury Prevention Advisory Committee Hawai‘i State Department of Health

2 Hawai‘i Injury Prevention Plan 2012-2017
Introduction
Injury Prevention is a Public Health Priority in Hawai‘i 3
Core Capacity
Core Capacity to Sustain Injury Prevention 8
Injury Specific Recommendations
Drowning Prevention 14
Preventing Falls Among Older Adults 19
Poisoning Prevention 25
Suicide Prevention 31
Traffic Safety 36
Violence and Abuse Prevention 48
Appendices
A. Hawai‘i Injury Prevention Plan 2005-2010 Status Report 53
B. Data Sources and Methods 58
C. Acronyms 60
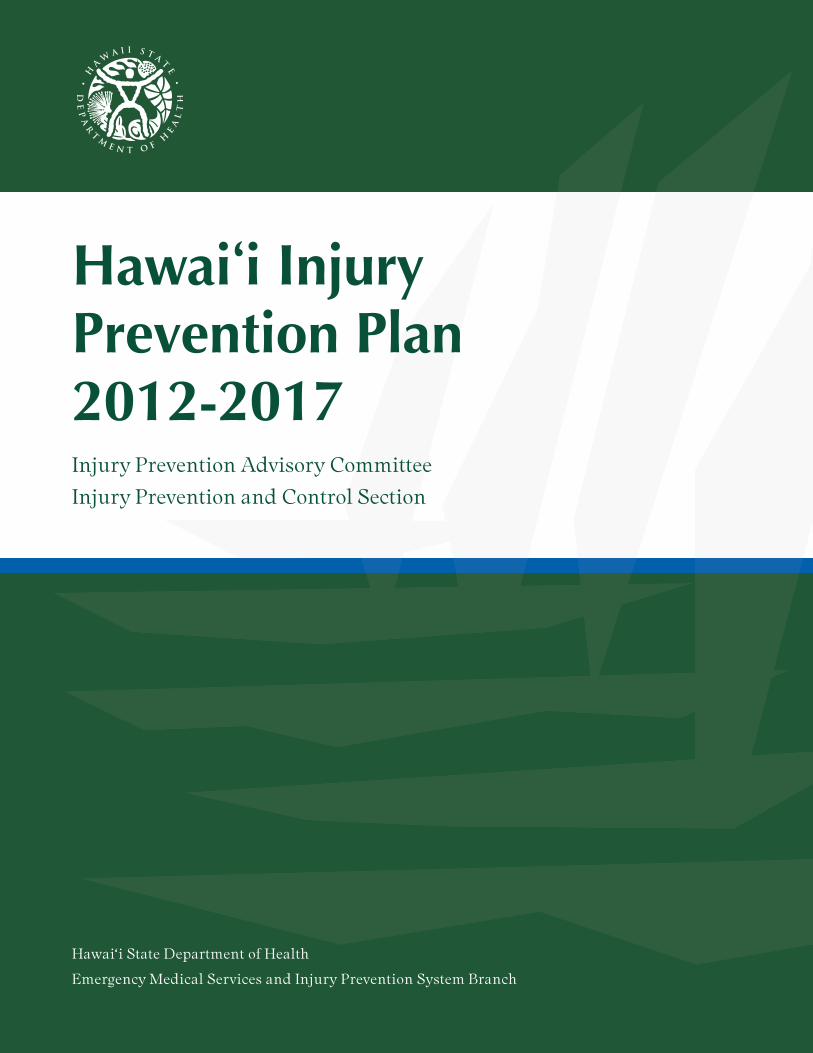
D. References 61
E. Spectrum of Prevention 63
Acknowledgements 64
Table of Contents

3Introduction
Injuries in Hawai‘i are responsible for more deaths from the first year of life through age 39 than all othercauses combined, including heart disease, stroke, and cancer. Among residents of all ages, injury is thefourth leading cause of death and disability. The vast majority of injuries, however, are non-fatal andcan lead to a range of outcomes, including temporary pain and inconvenience, disability, chronic pain,or a complete change in lifestyle.
During an average week in Hawai‘i:
�13 residents die from an injury�115 are hospitalized�Nearly 1,530 are treated in emergency departments
While the greatest impact of injury is in human suffering, the financial cost is staggering. In Hawai‘i, injury-related hospitalizations cost an estimated $364 million annually.
Injury Prevention is a Public Health Priority in Hawai‘i
Perinatal conditions
292
Unintentional injuries
52
Unintentionalinjuries
212
Unintentionalinjuries
196
Unintentionalinjuries
257
Malignantneoplasm
923
Malignantneoplasm
2,081
Heart disease8,911
Heart disease11,170
<1 1-14y 15-24y 25-34y 35-44y 45-54y 55-64y 65+y all ages
Congenitalanomalies
70
Malignantneoplasm
23
Suicide125
Suicide124
Malignantneoplasm
246
Heart disease
687
Heart disease1,236
Malignantneoplasm
7,531
Malignantneoplasm
10,936
Unintentionalinjuries
38
Congenitalanomalies
15
Malignantneoplasm
46
Malignantneoplasm
84
Heart disease
234
Unintentionalinjuries
366
CVD*310
CVD*2,589
CVD*3,111
Unintentionalinjuries
27
Homicide8
Heart disease
27
Heart disease
68
Suicide138
Suicide161
Unintentionalinjuries
250
Chronic lowerresp. diseases
1,276
Unintentionalinjuries
2,159
Other resp.diseases
10
Suicide5
Injuries ofunk. intent
18
Injuries ofunk. intent
33
CVD*53
CVD*137
Diabetes mellitus
229
Influenza andpneumonia
1,183
Chronic lowerresp. diseases
1,483
Influenza andpneumonia
8
Influenza andpneumonia
5
Homicide12
Homicide22
Injuries ofunk. intent
46
Liver diseaseand cirrhosis
135
Liver diseaseand cirrhosis
178
Alzheimer’sdisease1,081
Diabetes mellitus
1,402
Septicemia8
Septicemia5
Congenitalanomalies
6
CVD*14
Liver diseaseand cirrhosis
32
Injuries ofunk. intent
107
Chronic lowerresp. diseases
138
Diabetes mellitus
1,040
Influenza andpneumonia
1,349
Other acutelower resp.
4
Other resp.diseases
5
Influenza andpneumonia
4
Influenza andpneumonia
9
Homicide25
Diabetes mellitus
100
Suicide130
Nephritis,nephrotic synd.
833
Alzheimer’sdisease1,085
Injuries ofunk. intent
3
Heart disease4
Pneumonitis3
Chronic lowerresp. diseases
7
Diabetes mellitus
25
Viral hepatitis
55
Nephritis,nephrotic synd.
95
Unintentionalinjuries
800
Nephritis,nephrotic synd.
990
Heart disease
3
Perinatal conditions
3
Septicemia3
Congenitalanomalies
7
Other circ. diseases
25
Chronic lowerresp. diseases
47
Viral hepatitis
81
Septicemia466
Suicide795
1
2
3
4
5
6
7
8
9
10
*CVD – cerebrovascular diseases, including stroke
Deaths grouped as recommended by National Center for Health Statistics http://www.cdc.gov/nchs/data/nvsr/nvsr53/nvsr53_15.pdf).
Note: The terms “intentional” and “unintentional” are used in this plan to indicate whether or not the act or event was intended to harm a person. Unintentional injuries are commonly referred to as “accidents” (e.g., falls, drownings, poisonings, and motor vehicle-related injuries). Intentional injuries are purposefully inflictedon others (assaults) or oneself (suicide attempts).
Ten leading causes of death among Hawai‘i residents, by age group, 2007-2011

4 Introduction
Leading Causes of Injury Mortality and Morbidity among Hawai‘i residents1
Injury Prevention is a Public Health Priority in Hawai‘i
1 Non-residents comprised 9% of the victims killed by injuries in the state, 9% of those hospitalized, and 10% of those treated in emergency departments. 2 Annual number of deaths, from 2007-2011 death certificates. For underlying cause of death in the ICD-10 code series: V01-Y36, Y85-Y87, Y89,
and U01-U03. 3 Annual number of injury-related hospitalizations, from 2004-2008 records. For principle diagnosis in ICD-9CM code series: 800-909.2, 909.4, 909.9,
910-994.9, 995.5-995.59, 995.80-995.85. 4 Annual number of injury-related hospitalizations, from 2004-2008 records. For principle diagnosis in ICD-9CM code series: 800-909.2, 909.4, 909.9,
910-994.9, 995.5-995.59, 995.80-995.85. 5 Most (92%) of these patients were “struck accidentally by objects or persons”; the rest (9%) were “struck accidentally by falling object”. Of the former,
the most commonly specified causes were “striking…in sports” (20%), and “striking against…furniture” (4%). For the 30% of 2010 and 2011 recordswith specific coding, most (79%) of these injuries were sports-related, most commonly “surfing, windsurfing and boogie boarding” (16%), “american tacklefootball” (15%), basketball (10%), baseball (9%), and soccer (7%).
6 Most (95%) of these injuries were related to “Overexertion and strenuous movements”, with no further specificity. Subcategories include overexertionfrom sudden strenuous movements (39%), and trauma from repetitive motion, loads or impacts (17%). For the 30% of 2010 and 2011 records with specific coding, about half (44%) of these injuries were sports-related, including basketball (14%), and baseball, soccer and volleyball (5% each). Another13% were due to “walking, marching and hiking”, and 6% to running.
7 Most (98%) of these visits were related to the bites or venom of animals, most specifically dog bites (36%), bee and wasp stings (11%), centipedes (11%)and venomous marine animals (6%).
Suicide 159 24% Falls 2,705 45% Falls 20,920 26%
Falls 108 16% Car occupant 414 7% Striking5 11,572 15%
Poisoning 98 15% 361 6% Cut/pierce 7,563 10%
Car occupant 58 9% Assault 307 5% Overexertion6 6,618 8%
Drowning 35 5% Motorcyclist 276 5% Car occupant 4,204 5%
Suffocation 30 4% Poisoning 207 3% Assault 3,936 5%
Motorcyclist 29 4% Striking5 191 3% 3,549 4%
Pedestrian 26 4% Pedestrian 137 2% Bicyclist 1,133 1%
Assault 22 3% Overexertion6 106 2% Motorcyclist 1,044 1%
Fire/burn 4 1% Bicyclist 105 2% Fire/burn 988 1%
Cause #2 % Cause #3 % Cause #4 %
Death Certificates (fatal)Hospital Admission Records (non-fatal)
Emergency DepartmentRecords (non-fatal)
1
2
3
4
5
6
7
8
9
10
all other 102 15% all other 603 10% all other 10,892 14%
Annual total 671 Annual total 5,980 Annual total 79,576
Suicide attempt/self inflicted
Natural/environmental7

5Introduction
The Hawai‘i State Department of Health, Injury Prevention and Control Section (IPCS), with strongsupport from the Injury Prevention Advisory Committee (IPAC), completed the Hawai‘i Injury PreventionPlan (HIPP) with funding from a Public Health Injury Surveillance and Prevention Program capacitybuilding grant and a Core Violence and Injury Prevention Program grant, both from the Centers forDisease Control and Prevention (CDC).
The Hawai‘i Injury Prevention Plan 2012-2017, is a plan for injury prevention activities during the nextfive years. Developed in collaboration with partners from across the state, the plan provides:
�Overall direction and focus of IPCS and IPAC-led efforts
�Stimulus for organizations, agencies and community groups to collaborate on reducing or preventing injuries in Hawai‘i
This report builds on the earlier, Hawai‘i Injury Prevention Plan 2005-2010 (available online: www.nogethurt.hawaii.gov). Details about the state’s progress toward meeting the objectives outlined in the 2005-2010 report can be found in the Appendix A.
HIPP is a collaborative effort that reflects the current thinking of public health professionals andcommunity partners in the following areas:
�Core capacity to sustain injury prevention policy and program activities
�Drowning
�Falls among older adults
�Poisoning
�Traffic-related injuries
�Suicide
�Violence and abuse
IPCS worked closely with experts and stakeholders in each area to review accomplishments, conductneeds assessments, and develop recommendations for the next five years. Additional information aboutthe processes used to generate these recommendations are included in the individual chapters.
Hawai‘i Injury Prevention Plan

6 Introduction
The Injury Prevention and Control Section is part of the Emergency Medical Services and InjuryPrevention System Branch at the Hawai‘i State Department of Health. IPCS is the focal point in theDepartment of Health for injury prevention throughout the state for all age groups.
IPCS is responsible for coordinating, planning, conducting, and evaluating injury prevention programs;developing policy and coordinating advocacy; collecting, analyzing and disseminating injury data; andproviding technical support and training. Much of their work is achieved through community coalitionsand partnerships in order to increase and focus community resources, minimize duplication of effort,and support the injury prevention activities of local agencies and community organizations. The Spectrumof Prevention is used as a guiding model for IPCS’s work to prevent injuries in Hawai‘i (see Appendix E).IPCS also provides staff support to IPAC.
Relationship between Department of Health, IPAC, EMSIPSB and IPCS
Injury Prevention and Control Section
Hawai‘i Department of Health(DOH)
Emergency Medical Services andInjury Prevention System Branch
(EMSIPSB)
Injury Prevention and Control Section
(IPCS)
Public health perspective
Injury Prevention Advisory Committee
(IPAC)
Multidisciplinary and community-based

7Introduction
Mission: A safe Hawai ‘i from the mountains to the sea.
The Injury Prevention Advisory Committee is a volunteer network of professionals and communitymembers committed to working together to prevent injuries in Hawai‘i.
IPAC Members:
�Advise the Injury Prevention and Control Section
�Educate the public about injury prevention
�Advocate for injury prevention policies and legislation
�Serve as a liaison between IPAC and individual organizations
�Help identify and secure resources to support injury prevention
Injury Prevention Advisory Committee
The Hawai‘i Injury Prevention Plan (HIPP) can be used in a variety of ways by local agencies, businesses, community organizations, advocacy groups, planners, decision-makers, researchers, and others interested in preventing injuries. Examples include:
�CollaborationGroups and individuals interested in addressing a particular injury area can use HIPP to assess the current thinking, get an understanding of the key players involved, and build consensus for implementing priority activities.
�Policy makingAdvocacy groups working in injury prevention can use HIPP to support and act on prioritized areasof concern and identify key partners to collaborate with.
�Program planningOrganizations and individuals interested in addressing a particular injury area can use HIPP forpriority setting and action planning.
�ResearchResearchers, including graduate and medical students, can use HIPP to develop studies to adapt and evaluate evidence-based practices for Hawai‘i.
How the Hawai ‘i Injury Prevention Plan Can Be Used

8 Core Capacity
Policy and Program Activities
Background and AccomplishmentsSince the Hawai‘i Injury Prevention Plan 2005-2010 was released, the Hawai‘i State Department of Health, Injury Prevention and Control Section (IPCS) has worked closely with partners in the community to build and strengthen the infrastructure to support injury prevention policy, research,surveillance and programs in Hawai‘i.
�With the support of IPAC, IPCS added a suicide prevention coordinator to their staff and now has three permanent state-funded positions.
�Complete and accurate data are critical to assessing and understanding the injury problem, and also to developing and evaluating prevention programs. E-codes capture how an injury happened (cause), the intent (unintentional or intentional, such as suicide or assault), and the place where the event occurred. IPCS led efforts to establish new standards for external cause of injury coding (e-coding) for hospitals to achieve and maintain. Currently, 90% of all emergency department and hospital admission records meet the new standards, up from 51% in 2003.
�In collaboration with Kapiolani Community College, Emergency Services Department, IPCShelped to develop, implement and evaluate injury prevention training modules for the emergencymedical technician (EMT) program and mobile intensive care technician (MICT) program, and a continuing education module for emergency medical services personnel.
�Aiming to develop a cadre of individuals and organizations who are injury literate, articulate,and active, IPCS conducted public health competency building workshops and worked with affiliated injury prevention groups to coordinate conferences specific to certain injuries.
�In 2008, IPCS produced the Injuries in Hawai‘i 2001-2006, and disseminated the data report tostate legislators. In partnership with IPAC, IPCS has worked to increase awareness among policymakers and residents of Hawai‘i about injuries as a major public health problem.
�In 2008, IPCS released a series of “No Get Hurt” radio, television, and print ads with preventionmessages focused on different types of injuries that IPAC members helped to disseminate.
�Recognizing the significant percentage of Hawai‘i residents that are affiliated with the armedforces, IPCS has fostered partnerships with all five branches. There are military representativeson the Injury Prevention Advisory Committee (IPAC) and the Prevent Suicide Hawai‘i SteeringCommittee, and the military actively participates in the annual “Click It or Ticket” traffic safety campaign.
Core Capacity to Sustain Injury Prevention

9Core Capacity
RecommendationsBuilding on work completed for the Hawai‘i Injury Prevention Plan 2005-2010, IPCS and the IPAC steering committee developed the following recommendations. They are based on the core components of a state injury prevention program as identified by the Safe States Alliance (2003):
�Build a solid infrastructure for injury and violence prevention
�Collect and analyze injury and violence data
�Design, implement, and evaluate programs
�Provide technical support and training
�Affect public policy
Recommendation 1: Build and sustain infrastructure to provide leadership, data, technical assistance, and to support policy and evaluation for advancing injury prevention
Hawai‘i needs a strong, stable, and comprehensive program to systematically address the many causes of injury in coordination with multiple partners. “CDC recommends that states adopt a comprehensiveinjury prevention program to provide consistent, reliable and comprehensive data for policymakers;ensure high-risk populations are identified and helped; lead state efforts among programs with variousinjury prevention goals; and provide continuity amid changing administrations and budget priorities”(Foreman, 2009).
The enactment of the Trauma System Special Fund by the Hawai‘i State Legislature in 2007 provided for the development of a comprehensive statewide trauma system by the Department ofHealth. A comprehensive trauma system addresses the problem of injury along the full continuum from primary prevention through acute care and rehabilitation.
As a core component of this system, injury prevention will be more closely integrated with otherstrategies that can reduce the severity and outcomes of injuries and IPCS will have access to resources to support positions and injury prevention initiatives. The new hospital trauma centers that are alsopart of the trauma system can play a critical role in injury prevention activities by coordinating andsupporting injury prevention interventions in their communities.
Some hospitals have already instituted injury prevention interventions (e.g., policies that requirestaff to follow safe sleep recommendations with infants and ensure that newborns leave hospitals inappropriate safety seats). The establishment of trauma centers would allow hospitals to expand theirroles in injury prevention within their organizations and the community.
Core Capacity to Sustain Injury Prevention

10 Core Capacity
Recommended Next Steps
�Secure core IPCS positions under the Trauma System Special Fund.
�Build professional capacity of Neighbor Island community partners to coordinatecommunity-based injury prevention interventions through conference trainings and distance-based learning.
�Implement county level injury prevention interventions in coordination with trauma center staff and community stakeholders.
Recommendation 2: Serve as a clearinghouse for data, and incorporate other injury data sources tostrengthen analyses and further injury prevention efforts
The Safe States Alliance recommends injury prevention programs maintain a strong data componentwith access to major data sources that define the injury problem (2003). Complete, accurate, andtimely data are critical to informing public policies, guiding the selection, design and evaluation of interventions, and directing use of limited resources.
Hawai‘i needs to build on its impressive achievements by maintaining and further enhancing the collection and distribution of injury prevention data.
Recommended Next Steps
�Maintain and increase use of standards for e-coding by emergency departments and hospitals, and evaluate the completeness of collected data.
�Ensure continued access to currently used databases.
�Expand access to data sources.
• Work with the Medical Examiner's Office to institutionalize access to autopsy records.
• Access and use data from the statewide Trauma Registry.
�Improve accessibility of reliable and timely injury data to partners.
• Provide partners Hawai‘i Emergency Medical Services Information System (HEMSIS) dataabout risk factors such as seat belt use, alcohol and drug use, and helmet use.
• Utilize internet to increase accessibility of data to partners, decision makers, and the public.
• Improve ability to respond to data requests quickly and effectively.
Core Capacity to Sustain Injury Prevention

11Core Capacity
Recommendation 3: Provide training and technical assistance to increase and enhance knowledgeand skills among injury prevention practitioners and partners
In order to effectively address injuries in Hawai‘i, it will be essential to build injury prevention core competencies among practitioners in related fields. Core competencies include the ability to(Runyan & Stephens Stidham, 2009):
�Describe injury and violence as a public health problem
�Access, interpret, use, and present injury and violence data
�Design, implement, and evaluate injury prevention activities
�Disseminate injury prevention information to the community and key policy makers
�Affect change through policy and education
Recommended Next Steps
�Conduct a needs assessment to understand the training needs of professionals and partners, including practitioners and organizations working in related fields (e.g., first responders ) or specific content areas (e.g., water safety), as well as interested members of the community. At the same time, determine where and how the different groups prefer to receive training.
�Based on results from the assessment, develop trainings to strengthen injury prevention and public health core competencies.
�Explore opportunities to provide these trainings in settings that maximize available resources.
• Use existing venues (e.g., IPAC meetings, injury specific and public health conferences).
• Provide annual training to trauma center staff.
�Identify and prioritize professionals and organizations that can have the greatest impact in reducing injuries, and develop tailored trainings that address their needs and interests.
�Provide partners specific training in applying evidence-based practices to help integrate injuryprevention into their work.
�Support and pursue resources for professional development of injury prevention staff.
Recommendation 4: Cultivate awareness among decision makers and the public to elevate injuryand violence as a major public health problem in Hawai ‘i
Injury prevention researchers, practitioners and advocates understand that injuries are a leading cause of death and disability that can be prevented. Many decision makers and members of the public, however, continue to think of injuries as accidents that are unavoidable.
It is imperative to communicate the personal and financial costs of injury as well as the potential solutions in order to inform policies, secure resources, change behaviors, and affect injury rates inHawai‘i. Injury prevention advocates need to work with partners and the media to reach target audiences with carefully developed and tested messages.
Core Capacity to Sustain Injury Prevention

12 Core Capacity
Recommended Next Steps
�Develop, test and disseminate injury prevention messages that are tailored to specific, prioritized audiences.
• Disseminate messages developed by IPCS and the Fall Prevention Consortium (with trainingand support from CDC's Injury Center Communications Initiative). Identify and use commu-nication channels most frequently accessed and trusted by target audiences.
• Apply this message development process to other injury areas to create, test and disseminate additional messages.
�Develop materials that educate specific audiences, such as policy makers or employers, about priority injury areas.
�Seek opportunities to communicate with the media about current issues, using relevant data andconsistent prevention messages.
�Facilitate partners’ ability to effectively communicate about injury by regularly providing current data and information about evidence-based prevention strategies.
• Use existing communication channels such as IPAC meetings and newsletters.
Recommendation 5: Inform injury prevention policy at all levels
Evidence-based policies implemented at national, state, local, and agency or organizational levels can dramatically reduce the burden of injury. State legislation that requires children to ride in safety seats, local ordinances that require pool fencing, and health care provider policies that recommend fall risk assessments for all older clients are examples of policies that can help reduce injuries.
Recommended Next Steps
�With leadership from IPAC and staff support from IPCS, develop and implement a comprehensive plan (with measurable goals and objectives) to work with partners and inform injury prevention policy at multiple levels.
�Mobilize coalitions and networks to build a support base and advocate for evidence-based policy solutions.
�Continue to identify, track, and share information about annual legislative injury prevention priorities.
Core Capacity to Sustain Injury Prevention

13Injury Specific Recommendations
Core Capacity to Sustain Injury Prevention
Recommendation 6: Increase opportunities for collaborative injury prevention efforts in all priority injury prevention areas
Working collaboratively with partners from diverse disciplines, organizations, and perspectives inside and outside of state government is critical to success. To optimize the best use of limited resources, injury prevention partners need to coordinate efforts and address critical concerns without duplicating their efforts.
Partnerships have been essential to the work of IPCS, as evidenced throughout this report. They arecritical to directing priorities, communicating messages, and sustaining programs.
Recommended Next Steps
�Work with existing and new partners to implement recommendations outlined in this report.
�Invite new partners to join current injury prevention taskforces and committees:
• Injury Prevention Advisory Committee
• Keiki Injury Prevention Coalition
• Prevent Suicide Hawai‘i Task Force
• Fall Prevention Consortium

14 Injury Specific Recommendations
Drowning Prevention
Background and AccomplishmentsDrowning prevention has been a priority issue for the Hawai‘i State Department of Health, Injury Prevention and Control Section (IPCS) since 1991. Hawai‘i has accomplished much in the area ofdrowning prevention with the benefits of highly engaged experts, exceptional ocean safety officers across the state, active involvement from the visitor industry, and strong collaborative partnerships in the community.
�The Hawai‘i Beach Safety website (www.hawaiibeachsafety.org) was developed in 2006 and provides beach ratings based on comprehensive risk assessments that were conducted on allguarded and unguarded beaches in the state. The site also features safety information about hazards (e.g., rip currents, dangerous shore breaks), prevention tips, surf reports, special alerts(e.g., box jelly fish notices), and warnings. Information on the website is updated several timeseach day. Partners on this project include the Ocean Safety and Lifeguard Services Division at the City and County of Honolulu, the Hawaiian Lifeguard Association, ocean safety and lifeguard partners on neighbor islands, the University of Hawai‘i School of Ocean and Earth Science and Technology, the Hawai‘i Tourism Authority, and the Hawai‘i State Department of Health.
�In collaboration with the Hawai‘i Association of Independent Schools, IPCS co-produced thevideo, “Be Ocean Minded” about the Junior Lifeguard Program. Lifeguards from all islands were interviewed to talk about ocean safety, prevention tips, and the value of the Junior Lifeguard Program. The county-based Junior Lifeguard Program runs during the summer and trains teenagers (13-17 years of age) in ocean skills, beach condition assessment, and lifesaving techniques. The video serves as a recruitment tool for the program and copies have been distributed across the state.
�In 2009, IPCS surveyed over 500 beach goers on O‘ahu, both residents and visitors, to assess the impact of four types of beach warning signs: strong current, high surf, dangerous shorebreak, and waves breaking on ledge. Results showed that about half of those surveyed saw the signs, and among those, 66% thought the signs would influence their behavior.
�IPCS worked with the Swimming Pool Association of Hawai‘i in 2009 to conduct a survey of1,300 residential pool owners on O‘ahu. The impetus for this project was to inform pool ownersabout a federal law designed to protect children against entrapment from the suction of pooldrains and pumps. This 2009 law, the Virginia Graeme-Baker Pool and Spa Safety Act, ismandatory for commercial pools but not for residential pools. The survey asked about drain covers and pumps as well as fencing, safety latches on gates, whether there were kids in theirhome and if so, whether the kids participated in swimming lessons. Pool owners also were provided with pool safety and entrapment prevention information. A follow-up survey determined what safety changes pool owners made. During the survey, 163 swimming pools or spas were identified as having potentially dangerous equipment; 65 pool owners voluntarily upgraded their pumps and drains.

15Injury Specific Recommendations
Drowning Prevention
RecommendationsIn 2010, IPCS led a statewide needs assessment that included a review of best practices for drowning prevention, in-depthtelephone interviews with ten key stakeholders (i.e., represen-tatives of organizations involved in prevention efforts, and potential partners), and two strategic planning sessions withpartners from the community and the visitor industry. IPCSused the information gathered through this process to developand prioritize the following recommendations.
Recommendation 1: Establish a task force to develop astatewide approach to drowning prevention
Each week in Hawai‘i, at least one person fatally drowns. As anisland state, it is essential that we create a safer environmentand provide residents and tourists with information they needto have a safe and enjoyable experience in and around the water.A statewide task force for drowning prevention would bring keypartners together to coordinate drowning prevention efforts,and provide guidance to IPCS moving forward. Partners in thecommunity, including the visitor industry should be broadlyrepresented on the task force, and efforts should be made to engage educators.
Recommended Next Steps
�Work with existing groups, including the Hawai‘i Department of Land and Natural Resources and theHawaiian Lifeguard Association to create a task force, build membership and define a clear mission.
Recommendation 2: Implement a statewide educational campaign to increase ocean safety awareness among residentsand visitors
The majority of drownings in Hawai‘i are ocean-related, and half of those fatalities are among tourists. Clear and effectivemessages for residents and visitors of Hawai‘i need to be developed, tested, implemented, and evaluated. Messages may be communicated through existing communication channels, including the Hawai‘i Beach Safety website and the Hawai‘iTourism Authority’s Travel Smart Hawai‘i website. Effortsshould be made to engage partners throughout the message development and dissemination process.
PARTNERS
American Red Cross - Hawai‘i State Chapter
City and County of Honolulu Department of Parks and Recreation
City and County of HonoluluOcean Safety and Lifeguard Services Division
County of Hawai‘i Department of Research and Development
County of Hawai‘i Fire Department
County of Hawai‘i Ocean Safety
County of Kaua‘i Ocean Safety
County of Kaua‘i Office of Economic Development
County of Maui Office of Economic Development
County of Maui Aquatics Division
Hale Koa Hotel
Hawaiian Lifeguard Association
Hawai‘i State Department of Landand Natural Resources
Hawai‘i Tourism Authority
Injury Prevention Advisory Committee
Kama‘aina Kids
Kaua‘i Lifeguard Association
Kaua‘i Visitor Bureau
O‘ahu YMCA
Resorts and adventure tourism companies
Swimming Pool Association of Hawai‘i
University of Hawai‘i School of Ocean and Earth Science and Technology
YMCA of Honolulu

16 Injury Specific Recommendations
Drowning Prevention
Attention also must be paid to visitors’ sources of information. Hawai‘i guidebooks are of particular concern as they often direct visitors who are less familiar with ocean swimming and conditions to unguarded locations without explaining the potential dangers.
Recommended Next Steps
�Solicit partner input to develop and test clear, consistent prevention messages for visitors and residents.
�Engage partners in message dissemination and evaluation.
�Educate writers and publishers of guidebooks about drownings in Hawai‘i and encourage them to include accurate information in their publications about safety conditions.
Recommendation 3: Evaluate current drowning prevention efforts and disseminate information aboutbest practices
Drowning prevention is a complex public health concern. There are numerous factors including theage and ability of the individual, the body of water (e.g., swimming pool, ocean, stream), and currentconditions (Quan, et al, 2007). More information is needed about what works to prevent drowning in Hawai‘i.
Currently, there aren’t many evidence-based strategies or best practices to prevent drowning. Thereare several promising practices that have strong behavioral elements, and very few environmental orlegislative interventions. More research is needed to evaluate the effectiveness of interventions andeducation materials currently in use (Quan, et al, 2007). Results from such research would help solicitsupport from partners and policy makers, and inform decisions about resource allocation.
Equally important to completing the research will be disseminating information about best and promisingpractices to key audiences in the state as well as the broader drowning prevention community.
Recommended Next Steps
�Evaluate the Hawai‘i Beach Safety website, www.hawaiibeachsafety.org, to determine effectiveness and useof the site.
�Provide data support and technical assistance to practitioners that need assistance evaluating theirown drowning prevention programs.
�Evaluate effectiveness of safety efforts, including the provision of rescue tubes, at unguarded beaches across the state.
�Disseminate information about effective safety efforts in Hawai‘i through partner organizations.

17Injury Specific Recommendations
Drowning Prevention
Injury Data for Drownings (residents and non-residents)
Fatal injuriesThere was no clear trend in the annual number of drownings, although the 79 deaths in 2011 was the highest total since at least 1993. Most of the high total in 2011 was due to drownings on Honoluluand Maui counties. About half (53%) of the victims were Hawai‘i residents, 36% from the U.S. mainland,and 12% from foreign countries. The ages of the victims were widely distributed, although only 8%were under 18 years of age. Almost all (83%) were males. About half (47%) of all the victims drownedon O‘ahu . If only drownings among Hawai‘i residents were considered, O‘ahu residents had the lowest rates, significantly lower than rates for Neighbor Island residents as a whole. If non-residentsare also included, the highest (unadjusted) rate was computed for Kaua‘i, approximately twice ashigh as rates for Hawai‘i County and more than 3 times the rates for Honolulu County (the island of O‘ahu).
Most (78%, or 259) of the victims drowned in the ocean or saltwater environments, almost all of whom (96%) were 18 years or older. Unintentional immersions led to 13% of these drownings, including 31 victims who fell in or were swept into the ocean. Other common activities were swimming (29% of victims), snorkeling (22%), and free diving (9%). According to autopsy records, intrinsic or personal factors contributed to over half (61%) of the saltwater drownings in HonoluluCounty from 2007 to 2010. The most common intrinsic factor was circulatory diseases, presentamong 46% of the victims of all ages, and 69% of those aged 50 years and older. Only 13% of the victims tested positive for alcohol, and only 7% had BAC (blood alcohol content) levels of 0.08% orgreater. Illicit drug use was considered a contribution to 12% of the drownings. Apart from oceandrownings, there were 36 drownings in swimming pools, 21 in rivers and streams, and 12 in bathtubs. Only 3 (8%) of the 36 victims who drowned in swimming pools were under 5 years of age, as victim age was widely distributed in this environment.
Trend: no trendTotal: 332
Ave: 66/year
Age groups:45-64y = 42%
Gender:83% M17% F
County totals and 5-year rate (deaths/100,000):
COUNTY NUM. RATE
Hawaii 39 19.0Honolulu 101 10.7Kauai 13 18.8Maui 22 14.659 62
79
63
69
45
65
85
07 08 09 10 11
118
32 41 39
140
34 27
0
40
80
120
160
01-14
15-24
25-34
35-44
45-65
65-74
75+
MF

18 Injury Specific Recommendations
Drowning Prevention
Nonfatal injuries (near drownings)There was no clear trend in the annual number of near drownings, which averaged 235 per year.Hawai‘i residents comprised a slight majority (55%) of all patients treated for near drownings, butonly 41% of those who were hospitalized. ED (emergency department) patients were significantlyyounger on average than those who were hospitalized (31 vs. 40 years of age), with more than half(56%) in the 15 to 44 year age group. Among Hawai‘i residents, county-specific rate estimates weregenerally comparable except for Hawai‘i and Maui county residents.
Hospitalizations were of a relatively short number of days (4.1, on average), but because each hospitalization incurred over $28,000 in charges, they comprised most (91%) of the total $2.3 millionin annual medical charges related to drowning. Swimming (40%) and “surfing, windsurfing andboogie boarding” (32%) were the most common activities for the patients overall, although swimmingwas a more likely cause among non-residents (45%), while the latter activities were more commonamong residents (39%).
EMS dataAlmost all (94%) of the incidents EMS responded to occurred during day time hours, including 80%between 9:31 a.m. and 5:29 p.m. More than half (59%) of the patients were Hawai‘i residents. About43% of the near drownings occurred in bodies of water, which could include both freshwater andsaltwater environments. About one-third (30%) were in patient residences (10%), public buildings(12%), hotels (5%), and health care facilities (3%). Most (77%) of the patients were either transportedin “serious” (46%) or “critical” (32%) condition, with no significant differences in the distribution ofpatient condition between residents and non-residents. Probable alcohol use was noted for only 4%of the patients. Near drownings that occurred during night time hours were significantly morelikely to involve alcohol consumption than day time incidents, however (21% vs. 3%).
Hawai‘i Trauma Registry (toxicology data)Only 8% of the adult-aged (18 years and older) Hawai‘i Trauma Registry near drowning patientswere positive for alcohol, and only 9% tested positive for illicit drugs, although there was no toxico-logical testing for about two-thirds of the patients. Substance use was somewhat higher among resident patients, although this comparison is limited by the small sample sizes and the lack of testing.
Trend: no trendAve: 235/year
Age groups:1-24y = 39%
Treatment:163 ED73 hosp.
Hawai‘i residents only:County totals, annual numberand rate (/100,000):
COUNTY NUM. RATE
Hawaii 23 12.5Honolulu 88 9.6Kauai 10 16.4Maui 9 6.0
251
221
234
210
261
200
240
280
07 08 09 10 11
1
46 4736
28
60
126
0
25
50
75
01-14
15-24
25-34
35-44
45-65
65-74
75+
ED(69%)
hosp.(31%)

19Injury Specific Recommendations
Preventing Falls Among Older Adults
Background and AccomplishmentsThe Hawai‘i State Department of Health, Injury Prevention and Control Section (IPCS) has beenworking with partners in the community to prevent falls among older adults for nearly a decade.
�In 2003, IPCS supported the establishment of the Hawai‘i Fall Prevention Consortium which provides a forum for information sharing, collaboration on fall prevention activities, and promotion of best practices for reducing falls among older adults. Members represent government agencies, professional associations, non-profit organizations, hospitals, care facilities, and senior organizations.
�Statewide conferences on fall prevention, held in 2005 and 2007, featured nationally recognizedleaders in the field.
�In 2009, a Tai Chi for Health intervention was successfully piloted at Pohai Nani Care Facility.IPCS sponsored a similar intervention at Leahi Hospital in 2011.
�Educational materials were developed and distributed to raise awareness about fall preventionand fall prevention information, including a fall prevention directory of services and resources,was added to the state injury prevention website www.nogethurt.hawaii.gov.
�In partnership with the Fall Prevention Consortium, IPCS facilitated fall prevention screening for balance by physical and occupational therapists and medication reviews by pharmacistsstatewide as part of annual fall prevention awareness activities.
�The State Executive Office on Aging and county Area Agencies on Aging used data collected byIPCS to inform their 2011-2015 State and Area Plans on Aging.
�In 2011, the Executive Office on Aging and IPCS partnered to establish the Hawai‘i State Fall Prevention Task Force. This short-term, volunteer Task Force comprised of key stakeholders isdeveloping a comprehensive statewide approach to fall prevention by December 2012 that willaddress recommendations in this report.
�The Centers for Disease Control and Prevention (CDC) selected IPCS as one of three states to participate in an injury prevention message development and framing initiative. In 2010, IPCS,members of the Fall Prevention Consortium, and other community partners engaged in training to develop a coordinated communication strategy for fall prevention. Participants developed messages for independent older adults that IPCS tested, and the Fall Prevention Consortium is coordinating final revisions and dissemination.

20 Injury Specific Recommendations
Preventing Falls Among Older Adults
RecommendationsIn 2010, a statewide needs assessment was conducted that included a literature review, an online survey of more than 200 fall prevention professionals and community members,and follow-up telephone interviews with 58 key informants.IPCS, together with the Fall Prevention Consortium and other partners, used the results from this needs assessment as thebasis for the following recommendations.
Recommendation 1: Raise awareness about fall preventionamong older adults, caregivers, and providers
Enhance awareness among the public, older adults, caregivers,and providers that falls can be prevented and promote adoptionof four key prevention behaviors:
�Beginning a regular exercise program
�Having one’s health care provider review medicines
�Having one’s vision checked
�Making one's home safer
The scientific literature and the June 2010 survey of key informants in Hawai‘i confirmed that many older adults areunaware of their increased risk of falling or the simple stepsthey can take to reduce their risk (World Health Organization(WHO), 2007).
Recommended Next Steps
�Disseminate previously developed and tested messages for older adults.
�Develop and test additional clear, audience-specific mes-sages for care givers, pharmacists, and physicians.
�Identify and use appropriate communication channels toreach key audiences.
�Distribute messages through community partners, including Fall Prevention Consortium members.
�Develop a packet of fall prevention educational materials tobe distributed through partners.
PARTNERS
AARP Hawai‘i
Catholic Charities of Hawai‘i
Child and Family Service Gerontology Program
City and County of Honolulu Area Agency on Aging
Comforting Hands Hawai‘i
Executive Office on Aging
Fall Prevention Consortium
Hawai‘i Community Pharmacists Association
Hawai‘i County Fire Department
Hawai‘i County Office on Aging
Hawai‘i Optometric Association
Hilo Medical Center
HMSA Health Ways Corporation
Injury Prevention Advisory Committee
Kaua‘i Agency on Elder Affairs
Kaiser Permanente
Kapi‘olani Community CollegeKupuna Education Center
Kuakini Health Systems
Kupuna Caucus
Maui County Office on Aging
Ohana Pacific Rehab, Inc.
Project Dana
Rehabilitation Hospital of the Pacific
Straub Medical Center, Physical Therapy Division
Tai Chi for Health Institute
The Queen’s Medical Center
United States Veterans Administration
University of Hawai‘i Center on Aging
University of Hawai‘i John A. Burns School of Medicine
University of Hawai‘i Office of Public Health Studies

21Injury Specific Recommendations
Preventing Falls Among Older Adults
Recommendation 2: Increase availability and accessibility of fall prevention programs statewide
Fall prevention programs can help older adults:
�Assess balance and strength
�Exercise to increase their strength and balance
�Get their medications reviewed and adjusted at least annually
�Assess and modify their homes to reduce fall hazards
�Check for and correct vision impairments
The scientific literature has shown these activities can reduce the risk of falling, and there are variousfall prevention programs available in the state (WHO, 2007). These programs are not, however, availableacross all islands and in all communities. In addition, these services are not always covered by insurance;for example, Medicare does not pay for eye glasses.
Recommended Next Steps
�Expand exercise programs tailored to increase balance and strength such as Enhanced Fitness, Tai Chi, and No Fear of Falling.
�Increase the availability and use of successful home safety assessment programs.
�Develop strategies to coordinate services among venues where older adults gather, such as community clinics, senior centers, meal sites, senior housing, assisted living facilities, care homes, day health centers, shopping centers, schools, and churches.
�Develop and disseminate an updated fall prevention resource guide to supplement current materialsproduced by the Area Agencies on Aging and the Adult Disability Resources Centers (ADRC).
�Explore resources to print translations of educational materials. Languages might include Ilocano,Tagalog, Mandarin Chinese, and Korean.
Recommendation 3: Engage professionals and community members in fall prevention activities
Develop fall prevention activities that engage:
�Public workers (e.g., paramedics, fire fighters, public health nurses, Area Agency on Aging staff)
�Health care providers, elder care providers, ADRC staff members, program trainers (e.g., physicians,nurses, social workers, physical and occupational therapists, pharmacists)
�Coalitions (e.g., Fall Prevention Consortium, the Hawai‘i Healthy Aging Program)
�Non-profit organizations (e.g., AARP, YMCA)
�Interested individuals (e.g., retired workers, volunteers)
Many individuals and organizations must join together to prevent falls in Hawai‘i. Already, paramedicsand some pharmacists provide medication reviews, and many hospitals and rehabilitation programs assist with home assessments and modifications. But more individuals and organizations can, andshould be enlisted in the cause.

22 Injury Specific Recommendations
Preventing Falls Among Older Adults
Recommended Next Steps
Develop mutually beneficial partnerships with groups to facilitate fall prevention activities, for example:
�Encourage community partners, such as fire departments and EMS providers to assist with home assessments.
�Enable more pharmacists and other qualified professionals to provide free annual medication reviews.
�Encourage medical professionals to provide fall risk assessments.
�Train care home providers to lead exercise programs for their residents.
�Engage and support students in professional schools by:
• Training occupational and physical therapy assistants to certify eldercare providers in senior-friendly exercise programs.
• Enlisting medical and pharmacy students to assist with medication reviews.
• Training nurses, certified nurse aid students, and certified medical assistants in home assessment.
�Work with partners to develop and implement a training program and tool kit to educate all healthcare providers about the special needs of older adults and fall prevention strategies.
�Engage new and current members of the Fall Prevention Consortium, including representativesfrom the Aging Network, to achieve identified priorities.
Injury Data for Falls
Fatal injuriesFalls were the most common type of fatal unintentional injury in the state, with the 541 deaths accounting for 25% of the total. More than three-quarters (79%) of the victims were aged 65 years orolder, and the risk of fatal falls increased dramatically across the senior age range. Males comprisedthe majority (78%) of victims under 65 years of age, while gender was more equally distributed forthe senior-aged victims. Honolulu County residentscomprised most of the victims of all ages (77%)and those who were 65 years or older (81%). The fall fatality rate estimate for senior-aged residentsof Honolulu County was significantly higher than the rates for residents of Kaua‘i or Maui counties,and 45% higher than for Neighbor Island residents considered as a whole.
Trend: no trendTotal: 541
Ave: 108/year
Age groups:65y or older = 79%
Gender:57% M43% F
County totals and 5-year rate (deaths/100,000):
COUNTY NUM. RATE
Hawaii 57 29.9Honolulu 423 35.9Kauai 18 22.2Maui 43 27.599 94
128123
97
80
100
120
140
07 08 09 10 11
0 3 4 12 2963 53
377
0
100
200
300
400
01-14
15-24
25-34
35-44
45-65
65-74
75+
MF

23Injury Specific Recommendations
Preventing Falls Among Older Adults
Death certificates provided little information on the causes of falls, as most were coded as “falls on thesame level” with no further description (48%), or “unspecified” causes (32%). Falls from stairs or stepswere the most specifically coded cause, but comprised only 4% of the total. More than half (61%) of thefalls occurred at the residence of the victim, including 68% of the senior-aged victims.
Nonfatal injuriesFalls were the leading cause of nonfatal injuries among Hawai‘i residents, with nearly 21,000 ED(emergency department) visits and over 2,700 hospitalizations each year. The annual number of injuries generally increased. Children aged 1 to 14 years comprised 27% of all patients, but abouttwo-thirds (68%) of those who were hospitalized were 65 years or older. Gender was equally distributedamong patients treated in EDs, but females comprised 59% of the patients that were hospitalized.
Residents of Hawai‘i and Kaua‘i counties had significantly higher rates of nonfatal injuries from fallsthan residents of Honolulu and Maui counties. The residents of Honolulu County had the lowestrates of hospitalizations. Among the more specifically coded injuries, the most common causes werefalls from stairs, steps and escalators (5.3% of the total), beds (3.7%), skateboards (3.5%), and chairs,playground equipment, and ladders (about 2% for each). At least half (53%) of the falls that causedhospitalizations in seniors occurred in home environments. This proportion increases to 84% if onlyrecords with specific information on location are considered. The most common activity related tothe falls was “walking, marching and hiking”, accounting for 30% of the total. Skateboarding, running,tackle football, and bathing and showering were also prominent activities. Hospitalizations averagednearly 1 week in duration, resulted in over $31,000 in medical charges, and accounted for 72% ($84million) of the total annual charges of $116.6 million related to falls. Fractures were present innearly three-fourths (74%) of the hospitalized patients, including 29% with hip fractures.
Trend: increasing trendAve: 23,625/year
Age groups:1-14y = 27%
Treatment:20,920 ED2,705 hosp.
County totals, annual number and rate (/100,000):
COUNTY NUM. RATE
Hawaii 4289 2390.8Honolulu 15209 1584.7Kauai 1750 2635.6Maui 2377 1627.8
23026
24156
24634
22269
24041
22000
24000
26000
07 08 09 10 11
489
6308
21201568 1520
4349
1744
5523
0
2000
4000
6000
8000
01-14
15-24
25-34
35-44
45-65
65-74
75+
ED(89%)
hosp.(11%)

EMS dataMore than half (57%) of the EMS-attended falls occurred in the home or residence of the patient, andthis proportion was significantly higher among the seniors (71%) compared to younger aged patients(41%). More than half (54%) of the patients were 65 years or older, including 22% who were 85 yearsor older. Senior-aged patients had worse dispositions, as they were more likely to be transported inserious condition (49%, compared to 40% of younger age patients) and less likely to be released at thescene (12% vs 19%, respectively). Probable alcohol use was noted 8% of the patients, and male patients were more than twice as likely to have used alcohol compared to females (12% vs. 5%).
Hawai‘i Trauma Registry (toxicology data)Only 11% of the adult-aged (18 years and older) Hawai‘i Trauma Registry resident patients who wereinjured by falls were positive for alcohol, with 4 times higher use among patients in the 18 to 64 yearage group (19%), compared to senior-aged patients (5%). Fifteen percent of the patients tested positivefor illicit drugs, most commonly narcotics (11%). Considered together, about one-quarter (24%, or587) of the patients tested positive for either alcohol or drugs, although that proportion was muchlower among the senior-aged patients (13%), compared to younger patients (36%).
24 Injury Specific Recommendations
Preventing Falls Among Older Adults

25Injury Specific Recommendations
Poisoning Prevention
Background and AccomplishmentsThe Hawai‘i State Department of Health, Injury Prevention and Control Section (IPCS) has collaboratedwith partners to address different types of poisonings among different populations.
�IPCS strongly supports the Keiki Injury Prevention Coalition (KIPC) in their ongoing efforts to prevent poisoning.
• In 2009, KIPC received a grant from the Hawai‘i Department of Agriculture related to the recognition and management of pesticide-related injuries. KIPC has conducted poisoning prevention education and outreach activities for the public to increase awareness of householdpesticide exposures and reduce exposures in and around households.
• KIPC works to raise public awareness about, and increase use of, the 24 hour Hawai‘i poison control hotline for information about potential poisonings and medications.
�In 2010, IPCS began serving as a clearinghouse to disseminate poisoning prevention materials tocommunity partners. Materials disseminated to pediatricians, preschools, hospitals, and health care clinics on all islands include magnets and stickers to promote the Hawai‘i poison control hotline, poisoning prevention information fact sheets, “No Get Hurt” poisoning prevention posters,and information on the correct use of pesticides from the Department of Agriculture.
• As part of the “No Get Hurt” campaign, IPCS printed poisoning prevention posters in 2010 for use by the Department of Health Women Infant and Children (WIC) Services Branch and othercommunity partners.
�IPCS collaborated with a community partner to analyze data about poisonings from opioids inHonolulu County between 2004-2008. The results of this analysis showed the most common way to access opiates was through a personal prescription (46% of the victims). Only a minority of victimsaccessed opiates through prescriptions written for other people (4%), or purchased drugs illicitly(4%). However, access to opiates was not known for a large proportion (41%) of the victims, limitingthe reliability of this data source.
�In 1992, the Department of Public Safety (DPS) established Hawai‘i’s Prescription Drug Monitoring System (PDM) - one of the best practices for determining misuse and abuse of controlled substances. In 2012, improvements were made to the program to ensure the PDM database is effectively used and maintained. In addition to maintaining the PDM system, DPS is required to “carry out educational programs designed to prevent and determine misuse and abuse of controlled substances” (HRS 329-58).
�In 2011, IPCS began collaborating with state and community organizations working on STD/AIDS and substance abuse prevention in an effort to understand and address the increase in prescription drug overdoses.

26 Injury Specific Recommendations
Poisoning Prevention
RecommendationsWhile poisoning among children has decreased with interventions such as childproof caps, the past fewyears have revealed dramatic increases in prescription drug overdoses (CDC, 2011b). IPCS analyzedtrend data for poisoning fatalities and injuries, including prescription drug overdoses, and conducted a comprehensive review of current best practices. Results from this analysis formed the basis for the recommendations below.
IPCS first presented results of the analysis to the Department of Health, STD/AIDS PreventionBranch and the CHOW Project (The Community Health Outreach Work to Prevent AIDS Project), which were subsequently shared with the Hawai‘i Advisory Commission on Drug Abuse and Controlled Substances (HACDACS). As set forth by the Legislature, HACDACS is the primary advisory body to the Departments of Public Safety and Health and to the Legislature, and an appropriate partner to support in developing policy changes for the prevention of prescription drug overdoses.
Partners from public and private sectors (e.g., public safety, insurance, medicine, pharmacology, substance abuse treatment, law enforcement) can all help reduce poisonings, especially prescriptiondrug overdoses, in Hawai‘i.
Recommendation 1: Enhance use of data resources to understand the problem of prescription drugoverdoses in Hawai ‘i and facilitate prevention efforts
To better address the issue of prescription drug overdoses, more data and analyses are necessary.Death certificates describe an overall increasing trend but provide limited data on the type of drugscausing deaths. Autopsy data provides more information about deaths due to prescription drugs, including the specific substances involved and whether victims accessed drugs through legal or illegal means, although information about access is missing from a significant proportion of autopsyrecords. Therefore, linking autopsy data with the PDM database would help describe access to thespecific substances involved in overdoses and provide a clearer picture of drug overdose fatalities in Hawai‘i.
Additional data sources such as survey-based data and fatality reviews that go beyond informationgathered for autopsy reviews, would add to the body of knowledge about prescription drug use andpractices, and help identify risk factors and effective prevention measures.
Recommended Next Steps
�Determine ability to gain access to the Department of Public Safety’s PDM database and other stateagencies' data related to drug poisoning (Medicaid, workers’ compensation data).
�Link death certificate and autopsy records with the PDM database to learn more about decedents’ access to drugs.
�Use additional data sources to describe general drug use and poisoning in the population and indicate areas for further research (i.e., Hawai‘i Health Information Center, Trauma Registry, Poison Center Data, Behavioral Risk Factor System Survey, Youth Risk Behavior Survey).

27Injury Specific Recommendations
Poisoning Prevention
�Provide comprehensive data and injury prevention expertise to support partnerships and strategiesfor addressing prescription drug overdoses. Key partners include:
• The Hawai‘i Advisory Commission on Drug Abuse and Controlled Substances
• Hawai‘i State Department of Health Alcohol and Drug Abuse Division
• Hawai‘i State Department of Health STD/AIDs Branch
• The CHOW Project (The Community Health Outreach Work to Prevent AIDS Project)
• Hawai‘i Substance Abuse Coalition
• Hawai‘i State Department of Public Safety
• Hospitals and trauma centers
• First responders
• County police departments
• Physicians and pharmacists
• Insurance companies
• Community organizations
Recommendation 2: Identify and support enactment of policies and practices that reduce both inappropriate and illegal prescribing, and evaluate their effectiveness
Promising policies and practices target the prescribing practices of health care providers to help preventprescription drug abuses and overdoses while allowing safe and effective pain management. These include prescription drug monitoring programs, patient review and restriction programs, health careprovider accountability, laws and education to prevent prescription drug abuse and diversion, and better access to substance abuse treatment, including risk reduction strategies and education. Increasing capacity of pharmacists and other prescribers to educate patients about overdose can alsoleverage prevention efforts. These interventions need to be evaluated locally to determine their effectiveness in reducing prescription drug overdose deaths (CDC, 2011b).
States play key roles in regulating the use of prescription drugs and the practices of prescribers and pharmacists, and in financing and regulating health care for people with Medicaid - a group at greater risk for overdose (CDC, 2011a).
State agencies need to work in partnership with organizations in the private sector from health care andrelated fields to bring about changes in organizational practices. Implementing screening and briefintervention and referral and treatment protocols in state-funded trauma centers, and adding screeningfor potential misuse and abuse of prescription drugs can serve as a model practice for other hospitals andhealth care systems to adopt. As important potential users of the PDM database, emergency physiciansare one of the key partners in prescription drug overdose prevention efforts.

28 Injury Specific Recommendations
Poisoning Prevention
Recommended Next Steps
�Collaborate with the Department of Public Safety to support and evaluate use of the Hawai‘i Prescription Drug Monitoring System.
�Work with organizations such as the American College of Emergency Physicians, the Hawai‘i Medical Association, Hawai‘i pharmacy associations, health care systems, and legislators to developand enact policies that support prescribing practices to reduce prescription drug misuse and abuse.
�Collaborate with state-funded trauma centers across the state to adapt screening and brief intervention practices that identify potential prescription misuse and abuse problems. Developpolicies to support the intervention and share them with other health care settings as a model for implementing similar interventions (Ohio Injury Prevention Partnership, 2010).
�Collaborate with the Hawai‘i Board of Pharmacy, the Hawai‘i Pharmacists Association, and theHawai‘i Community Pharmacists Association to identify and promote educational strategies forpharmacists to help regulate the use of prescription drugs.
�Partner with insurance companies, and physician and pharmacy associations to educate the publicon the potential misuse of drugs received from friends and family.
�Support risk reduction training for first responders, health care providers, and other serviceproviders to reduce the risk of death from opioid overdoses.
Recommendation 3: Support primary poisoning prevention education and maintenance of the poison information hotline
Poisoning prevention education and the poison information hotline encourage appropriate actions thatcan reduce poisoning injuries, fatalities, and their associated hospital and health care costs. In additionto responding to calls for diagnostic or treatment recommendations on poison exposure for which callerswould otherwise go to the emergency department, health care providers rely on the hotline for toxicologyexpertise in handling severe overdoses. The poison hotline also identifies and alerts the public to poisoningtrends, and provides a drug identification service to callers that reduces drug errors from improper useof medications.
Recommended Next Steps
�Continue collaborating with KIPC to provide educational materials and promote the poison information hotline.
�Use data collected from the poison information hotline to identify trends and problem areas and inform prevention strategies.
�Help secure continued funding for the poison information hotline.

29Injury Specific Recommendations
Poisoning Prevention
Injury Data for Poisonings
Fatal injuriesThere was an increasing trend in the annual number of unintentional poisonings. (There was noconsistent trend in the number of poisonings of undetermined intent over this period.) Victim agewas narrowly distributed, as 58% were in the 45 to 64 year age range. Males comprised 78% of the victims. Most (82%) of the victims were poisoned on O‘ahu, and the highest fatality rates were computed for Honolulu County residents. Inclusion of poisonings of undetermined intent resulted in significantly lower rates among O‘ahu residents compared to Hawai‘i or Maui county residents, so these comparisons are unreliable. Drugs caused almost all (93%) of the poisonings, including 32% from “narcotics and hallucinogens” and 34% from “sedative-hypnotic and psychotropic drugs”.
Trend: increasing trendTotal: 490
Ave: 98/year
Age groups:45 to 64 = 58%
Gender:78% M22% F
County totals and 5-year rate (deaths/100,000):
COUNTY NUM. RATE
Hawaii 37 21.8Honolulu 400 43.4Kauai 16 22.3Maui 37 24.4
91 96
120
8697
75
95
115
135
07 08 09 10 11
0 141
86169
483
36 130
100
200
300
400
500
01-14
15-24
25-34
35-44
45-65
65-74
75+
MF

30 Injury Specific Recommendations
Nonfatal injuriesThere was an increasing trend in the number of nonfatal poisonings, but this was evident only for ED (emergency department) visits among Honolulu and Maui county residents. Gender was nearlyequally distributed with 53% male patients. Patient age was broadly distributed, although one-quarter (26%) were 1 to 14 years of age. Seniors comprised only 13% of all patients, but (23%) ofthose who were hospitalized. Rates of ED visits were highest by far for residents under 5 years of age, nearly 5 times higher than the rate for all other age groups. Residents of Honolulu and Mauicounties had comparable injury rates, significantly lower than the rates for residents of Hawai‘i and Kaua‘i counties.
Patients were hospitalized for slightly over 3 days on average, with nearly $18,000 in medical charges related to poisoning. Most (76%) of the poisonings were caused by drugs or medicinal substances,including 92% of those that required hospitalization. Narcotics caused 21% of the hospitalizations,tranquilizers 13%, aromatic analgesics (which include acetaminophen, or Tylenol) 8%, and cardiovascular agents 8%.
Poisoning Prevention
Trend: increasing trendAve: 1011/year
Age groups:1-14y = 26%
Treatment:805 ED
207 hosp.
County totals, annual number and rate (/100,000):
COUNTY NUM. RATE
Hawaii 193 109.7Honolulu 643 69.4Kauai 72 112.6Maui 103 69.5950
10371064
978
1028
900
1000
1100
07 08 09 10 11
28
264
132111 104
249
5172
0
100
200
300
01-14
15-24
25-34
35-44
45-65
65-74
75+
ED(80%)
hosp.(20%)

31Injury Specific Recommendations
Background and AccomplishmentsThe Injury Prevention and Control Section (IPCS) has led suicide prevention activities within theHawai‘i State Department of Health since 2005 with support from the Child and Adolescent MentalHealth Division, the Adult Mental Health Division, and the Alcohol and Drug Abuse Division.
�The Prevent Suicide Hawai‘i Task Force (PSHTF) has chapters in each county and includes morethan 100 members representing a broad network of agencies and stakeholders. PSHTF providesguidance to IPCS related to suicide prevention programming and activities. PSHTF grew out of theSuicide Prevention Task Force that was initiated in 2000 by the Department of Health, Maternal and Child Health Branch.
�In 2006, IPCS secured funds for a permanent suicide prevention coordinator to lead and implementinitiatives based on the National Strategy for Suicide Prevention and the Hawai‘i State Plan for Suicide Prevention.
�With an established PSHTF and suicide prevention coordinator, suicide prevention gatekeepertrainings began to be offered statewide to representatives from health and human services, education,emergency services, faith-based organizations and the general public. Trainings included:
• ASIST (Applied Suicide Intervention Skills Training) – a two-day intensive training program to help participants identify and assess the risk of individuals in crisis and provideearly intervention and referral to reduce the risk.
• safeTALK – a three hour suicide intervention training that prepares participants to identify persons with thoughts of suicide and connect them to suicide prevention first aid resources.
�In 2007, legislation was passed to support a youth prevention program with $100,000 annually.IPCS used these funds, in collaboration with PSHTF, to build a statewide network of public andcommunity partnerships with task forces on each island, to build public awareness and to increaseprofessional and community capacity for responding to individuals at risk for suicide through gatekeeper training.
�In 2008, the Substance Abuse and Mental Health Services Administration awarded IPCS fundingthrough the Garrett Lee Smith grant. The 3-year federal award provided $500,000 annually tosupport continued implementation and evaluation of ASIST and safeTALK trainings and a pilot ofthe Signs of Suicide training for teachers and students. These gatekeeper trainings focused on youth,partnering with three agencies: Honolulu Police Department; Department of Education; Departmentof Health, Alcohol and Drug Abuse Division.
�In 2011, the Sustainability Plan for Suicide Prevention Training in Hawai‘i was developed to address gatekeeper training needs for the future. The plan was built on previous efforts and community partnerships.
RecommendationsThe following recommendations were informed by a needs assessment of 500 key stakeholders, includingPSHTF members, ASIST trainers and other partners, and additional input was provided by PSHTF sub-committee chairs. IPCS, together with the PSHTF and other partners, agreed to continue expanding effortshighlighted in the Hawai‘i Injury Prevention Plan 2005-2010. The national Suicide Prevention ResourceCenter supports these recommendations.
Suicide Prevention

32 Injury Specific Recommendations
Suicide Prevention
Recommendation 1: Enhance ongoing suicide prevention trainings for gatekeepers
A “gatekeeper” can be any individual who interacts with others at work, in schools, at play, at home, or in community settings (i.e., other than clinical settings). Gatekeepers trained in suicide prevention andintervention learn to:
�Recognize early signs of suicidal behavior
�Implement timely and effective intervention strategies
�Identify opportunities to reinforce protective factors
�Intervene in crisis situations
�Refer people to appropriate professionals, or “open the gate” to mental health services
Training gatekeepers is considered a best practice among suicide prevention professionals. Evaluation ofASIST trainings has described positive gains in trainees’ self-rated capacity to identify, assess, and referpotentially suicidal people, both immediately after the ASIST training, and approximately one year after.
Recommended Next Steps
�Continue evaluation of gatekeeper training programs to determine which approaches are most effective across different settings.
�Continue providing culturally competent trainings to increase the number of gatekeepers in thecommunity.
• Specific attention should be paid to training gatekeepers that reach underserved populations, including youth, seniors, the homeless, those who are incarcerated, adults with mental healthchallenges, and individuals who are lesbian, gay, bisexual or transgendered.
Chaminade University
CHOW Project
Coalition for a Drug-Free Hawai‘i
Equality Hawai‘i
Harm Reduction Hawai‘i
Hawai‘i National Guard
Hawai‘i Pacific University
Hawai‘i Police Department
Hawai‘i State Department
of Education
Hawai‘i State Department of Health
Adult Mental Health Division
Hawai‘i State Department of Health
Alcohol and Drug Abuse Division
Hawai‘i State Department of Health
Child and Adolescent Mental
Health Division
Hawai‘i Veterans’ Administration
Hawai‘i Youth Services Network
Honolulu Community College
Honolulu Police Department
Hawai‘i SPEAR (Suicide Prevention
Education Awareness Research)
Injury Prevention Advisory
Committee
Kapi‘olani Community College
Kapi‘olani Medical Center
Kaua‘i Police Department
Life Foundation
Life’s Bridges Hawai‘i
Maui Police Department
Mental Health America of Hawai‘i
Prevent Suicide Hawai‘i Task Force
Queen Liliuokalani
Children's Center
Queen’s Medical Center
Tripler Army Medical Center
United States Armed Services
University of Hawai‘i,
John A. Burns School of Medicine,
Department of Psychiatry
University of Hawai‘i, Social Science
Research Institute
PARTNERS

33Injury Specific Recommendations
Suicide Prevention
• Recommended participants include law enforcement officers, school personnel, medical first responders, clinicians, community members with access to persons at-risk for suicide, andhealth education students.
�Use the Sustainability Plan for Suicide Prevention Training in Hawai‘i to continue to build community access to trained gatekeepers.
Recommendation 2: Develop and implement a public awareness campaign
The stigma associated with suicide has been recognized as a barrier to treatment for many people who are having suicidal thoughts or who have made previous suicide attempts. Lives can be savedthrough public understanding that suicides are preventable and that individuals and groups can play a significant role in suicide prevention.
A statewide public awareness campaign would aim to increase awareness about suicide as a seriouspublic health problem, dispel myths, and decrease stigma related to suicide. Messages and materialswould support a shift in beliefs, promote help-seeking behavior, and publicize available prevention, intervention, and aftercare services in the community.
Recommended Next Steps
�Solicit input from community partners to develop and test clear, audience-specific messages to promote help-seeking behaviors.
�Work with partners to develop a dissemination plan and get messages out to the community.
Recommendation 3: Develop and promote effective clinical and professional practices and policies
Barriers to effective and appropriate services for individuals at risk for suicide include a shortage of culturally sensitive preventive services and treatment options for mental illness and substance abusethat promote help-seeking behaviors.
The health services system should be strengthened to: �Raise awareness of services available.
�Ensure statewide access to screening and appropriate care.
�Provide culturally sensitive services that target underserved populations, including youth, seniors, the homeless, those who are incarcerated, adults with mental health challenges, individuals who are lesbian, gay, bisexual or transgendered, and others.
�Offer flexibility in health insurance reimbursements for mental health services.

34 Injury Specific Recommendations
Suicide Prevention
Recommended Next Steps
�PSHTF should provide leadership and coordination to:
• Enhance collaboration with allied health areas to address the need for culturally sensitive prevention services.
• Increase communication among health providers to improve the responsiveness of the system.
�Make trainings accessible to clinicians and provide continuing education credits as incentives.
�Continue providing culturally competent gatekeeper trainings to increase the number of gatekeepers in the community.
Injury Data for Suicides and suicide attempts
Fatal injuriesThere was a generally increasing trend in the number of suicides in the state, and the 195 deaths in 2010was by far the highest total in the 21-year period (1991-2011) for which data was available. Victimage was widely distributed, although almost all (95%) were 19 years or older. The highest fatalityrates were computed for residents aged 45 to 54 years and those 85 years and older. Male victimsoutnumbered females by approximately 3-to-1. More than half (58%) of the victims were residents ofO‘ahu, but the fatality rate for O‘ahu (58/100,000 residents) was significantly lower than the rate for thecombined Neighbor Islands (94/100,000).
The most common mechanism was by hanging or suffocation (49% of the suicides), followed byfirearm use (20%). Most (65%) of the O‘ahu victims had a documented history of mental illness (asvariously defined), according to autopsy records from 2007 to 2010. The most common negative lifeevents for the victims were related to intimate relationship problems (34%), usually a break-up or divorce (12%), or serious illness or medical issues (26%). The latter was documented for 60% of thesenior-aged victims. Over one-third (37%) had a history of substance abuse, 19% had a BAC (bloodalcohol content) level over 0.08%, and 34% tested positive for illicit drugs. Nearly one-third (32%) ofthe victims had a previous suicide attempt documented in the record, and more than half (56%) hadverbally threatened suicide.
Trend: increasingTotal: 795
Ave: 159/year
Age groups:20 to 60y = 74%
Gender:76% M24% F
County totals and 5-year rate (deaths/100,000):
COUNTY NUM. RATE
Hawaii 150 98.6Honolulu 465 57.5Kauai 50 85.5Maui 130 94.9
131
195169
129
171
115
135
155
175
195
215
07 08 09 10 11
0 5
125 124 138
291
55 57
0
100
200
300
01-14
15-24
25-34
35-44
45-65
65-74
75+
MF

35Injury Specific Recommendations
Suicide Prevention
Nonfatal injuriesThere was an increasing trend in the number of nonfatal suicide attempts, which was only evident in the annual number of injuries that were treated in EDs (emergency departments). Slightly morethan half (56%) of the injuries were treated in EDs, unlike most types of injuries. Most (58%) of thepatients were under 35 years of age, and residents aged 15 to 19 years had the highest rates of hospital-izations and especially ED visits. The gender distribution of patients was similar for both settings, withfemales comprising 57% of the total.
Residents of Kaua‘i and Hawai‘i counties had significantly higher rates of nonfatal self-inflicted injuries compared to residents of Honolulu and Maui counties. Over half (58%) of the ED visits andmost (85%) of the hospitalizations were caused by poisonings from drugs or medicinal substances,most commonly from the “analgesics, antipyretics, and antirheumatics” class (22% of ED visits, 33% of hospitalizations), which includes both narcotics (heroin, and other opiates), as well as aspirin and acetaminophen. Female patients were more likely to attempt by drug or medicinal poisonings(76%, vs. 62% for male patients).
Trend: increasing trendAve: 826/year
Age groups:15-24y = 33%
Treatment:465 ED
361 hosp.
County totals, annual number and rate (/100,000):
COUNTY NUM. RATE
Hawaii 166 98.8Honolulu 525 58.1Kauai 61 102.3Maui 74 51.5781
825
908
776840
700
800
900
1000
07 08 09 10 11
042
425
284
195
297
27 180
100
200
300
400
500
01-14
15-24
25-34
35-44
45-65
65-74
75+
ED(56%)
hosp.(44%)

36 Injury Specific Recommendations
Traffic Safety
Background and AccomplishmentsThe Hawai‘i State Department of Health, Injury Prevention and Control Section (IPCS) has worked intraffic safety for more than twenty years. Since 2005, IPCS has strengthened relationships with state,county and community traffic safety partners through its commitment to the development, implementationand evaluation of the Department of Transportation’s Hawai‘i Strategic Highway Safety Plan.
�IPCS supported and evaluated the Graduated Driver’s Licensing (GDL) legislation that was enacted in 2006. In 2010, data from the evaluation led to removal of the sunset clause, making GDL permanent in Hawai‘i .
�With support and testimony provided by IPCS and traffic safety partners, Hawai‘i passed an ignitioninterlock law in 2008 that took effect January 2010. The use of ignition interlocks, an evidence-based strategy to prevent alcohol-impaired driving, has been proven to reduce re-arrest rates.
�In partnership with the Department of Transportation (DOT), IPCS annually supports the nationwide “Click It or Ticket” Campaign – an enhanced enforcement program shown to increasesafety belt use.
�IPCS assists with quality assurance of the traffic safety data collected in real time from EmergencyMedical Services (EMS) personnel across the state in the Hawai‘i Emergency Medical Services Information System (HEMSIS). HEMSIS is an integral part of the statewide trauma system that theDepartment of Health EMS Branch established.
�With the support of the DOT, the Keiki Injury Prevention Coalition (KIPC) has established regularsafety check up sites and a network of trained technicians, including child passenger services forchildren with special health needs.
�IPCS provides data and technical support to numerous traffic safety partners across the state.
RecommendationsThe following recommendations were prioritized based on results from a statewide survey of 45 state,county and community traffic safety partners. This survey included a list of evidence-based program andpolicy recommendations, many of which are in the Hawai‘i Strategic Highway Safety Plan.
Motorcycle and Moped Safety
Recommendation 1: Increase helmet use among motorcycle and moped riders by supporting a universal moped and motorcycle helmet law
Properly worn helmets prevent deaths and brain injuries. In the event of a crash, helmets reduce the risk of death by 42% and the risk of a head injury by 69% (Liu, et al. 2008). States that have enacteduniversal helmet laws have seen significant reductions in fatality rates, head injuries and overall medical expenses related to motorcycle injuries (NHTSA 2011).
In 1968, Hawai‘i enacted a universal helmet law under a federal mandate; it was repealed in 1977. Between 1968-1976, motorcycle fatalities in Hawai‘i decreased by 57% (6 per 10,000 registered motorcycles between 1968-1976 vs. 14 per 10,000 registered motorcycles prior to 1968 and after the repeal in 1977; NHTSA, 2012).

37Injury Specific Recommendations
Traffic Safety
Hawai‘i currently has a partial helmet statute that requires ridersunder the age of 18 to wear a helmet. States with universal helmetlaws have motorcycle rider fatality rates that were 20-40% lowerthan states with partial helmet laws (Ulmer & Preusser, 2003).
In Hawai‘i from 2005-2009, more than two thirds (67%) of fatally injured motorcycle riders and almost all (96%) of fatallyinjured moped riders were not wearing a helmet at the time ofthe crash; and nearly half (47%) of motorcycle riders and 86% ofmoped riders were not wearing a helmet in non-fatal crashes(NHTSA 2012). Medical costs of helmeted riders average 67%lower than that of un-helmeted riders (Queen’s Hospital Financial System data, 2005-2007). Currently Medicaid,Medicare, and Quest pay 22.5% of the medical costs for headinjuries associated with motorcycle or moped crashes (Hawai‘iHealth Information Corporation, 2008).
Recommended Next Steps
�Establish a working group comprised of traffic safety advocates to work on helmet legislation.
�Enhance awareness among decision makers and the publicabout the benefits of motorcycle and moped helmet laws.
• Develop and disseminate messages to key decision makers and the public that emphasize the effects of helmet laws on health care costs.
• Partner with trauma centers to publicize how helmets can prevent traumatic brain injuries and reduce healthcare costs.
�Continue to provide data to traffic safety partners to highlightthe effectiveness of helmets and their cost saving benefits.
Impaired Driving
Recommendation 1: Reduce impaired driving by increasingthe use of screening and brief interventions in hospitals andprimary health centers across the state
Driving under the influence (DUI) of alcohol or drugs is commonin fatal crashes nationally, and especially in Hawai‘i. Comparedto other states, Hawai‘i has a higher proportion of fatal crashesthat involve impaired driving (NHTSA, 2012).
Impairment from alcohol or drugs is represented in all types oftraffic related injuries as well as non-traffic related injuries. It isimportant to address penalties and sanctions to deter impaired
PARTNERS
AARP Hawai‘i
City and County of Honolulu,
Department of Transportation
Services
Hawai‘i Bicycling League
Hawai‘i Traffic Commanders
Hawai‘i State Department of
Health, Healthy Hawai‘i Initiative
Hawai‘i State Department
of Transportation
Injury Prevention
Advisory Committee
Kaua‘i Path
Keiki Injury Prevention Coalition
Mothers Against Drunk Driving
North Hawai‘i Motor Vehicle
Crash Reduction Group
O‘ahu Metropolitan
Planning Organization
One Voice for Livable Islands
Peoples Advocacy for
Trails Hawai‘i
State Highway Safety Council
(formerly Governor’s Highway
Safety Council)
Strategic Highway Safety
Planning Committee

38 Injury Specific Recommendations38 Injury Specific Recommendations
Traffic Safety
driving and also create opportunities within the medical system to direct high-risk substance users tomethods of reducing substance misuse or treatment. Consistent and swift penalties serve as a deterrent,and access to treatment helps reduce future incidents.
Research has shown that screening and brief interventions can reduce recidivism of alcohol-relatedtrauma by up to 50%, which can help reduce DUI arrests and health care costs (Dill, et al., 2004).Screening and brief interventions are practices that help to identify a real or potential alcohol problemand motivate an individual to do something about it. According to NHTSA’s 2011 report, Counter-measures that Work: A Highway Safety Countermeasure Guide for State Highway Safety Offices, the use of screening and brief interventions is a best practice strategy for reducing and preventing impaired driving.
Recommended Next Steps
�Use data about impaired driving injuries and fatalities to raise awareness about the problem amongkey decision makers.
�Raise awareness among key decision makers about the effectiveness of screening and brief interventions to prevent impaired driving.
�Provide technical assistance to hospitals and primary health centers interested in implementing ascreening and brief intervention program.
Occupant Protection
Recommendation 1: Increase restraint use by supporting a universal safety belt law for all vehicle passengers
The safety belt law in Hawai‘i does not require a seat belt to be worn by passengers over the age of 17 whoare riding in the back seat. A comprehensive safety belt law would cover all seating positions equippedwith a seat belt, in all passenger vehicles. Between 2006-2009, nearly 75% of unrestrained passengersinvolved in fatal crashes were unbelted in the back seat of a motor vehicle (NHTSA, 2012).
Recommended Next Steps
�Raise public awareness about injuries and fatalities among unbelted passengers in the back seats of vehicles.
�Educate key decision makers about the benefits of a universal safety belt law.
�Continue to provide data and technical assistance to traffic safety partners about seat belt usage.

39Injury Specific Recommendations
Traffic Safety
Recommendation 2: Increase promotion of “high visibility enforcement efforts” for all traffic safety laws
Effective, high-visibility communications and outreach are essential components of successful safety beltlaw enforcement programs (Solomon, et al., 2003). According to NHTSA, strong advertising around the“Click It or Ticket” campaign has been shown to increase safety belt use by 8.6% (Solomon, et al., 2002).
IPCS maintains a database of traffic safety partners, including programs within the Department ofHealth, county fire departments, county police departments, and local hospitals. During the annual“Click It or Ticket” campaign, IPCS disseminates materials provided by the Hawai‘i Department ofTransportation to partners who have expressed an interest and willingness to participate. The same dissemination methods could be used to promote other national traffic campaigns aimed at reducing impaired or distracted driving.
Recommended Next Steps
�Maintain and continuously update IPCS’s partnership database.
�Seek new partners to help promote national traffic safety campaigns.
Pedestrian and Bicycle Safety
Recommendation 1: Decrease pedestrian and bicycle-related injuries and fatalities by supporting“complete streets” policies in each county
“Instituting a complete streets policy ensures that transportation planners and engineers consistently design and operate the entire roadway with all users in mind - including bicyclists, public transportationvehicles and riders, and pedestrians of all ages and abilities.” (National Complete Streets Coalition)
Since 2005, there has been an increased effort among traffic safety partners and advocates to reduce bicycle-related injuries and fatalities. In conjunction with engineering improvements, improvedplanning and design policies, targeted enforcement and public education efforts, and reductions in theaverage number of vehicle miles traveled, bicycle-related deaths in 2009 were nearly half of what theywere in 2005 (NHTSA, 2012).
In 2009, the Hawai‘i State Legislature passed Act 54 to support complete streets. Act 54 requires the Department of Transportation and county transportation departments to adopt a complete streets policywhen planning future transportation projects.
Currently, Hawai‘i still has the highest pedestrian fatality rate in the nation for older adults, and 16 out of 17 bicycle fatalities over the past 5 years involved a motor vehicle. Implementing completestreets design policies and Safe Routes to School programs will encourage infrastructural, behavioral,and educational changes to improve the safety and transportation equity for all road users.

40 Injury Specific Recommendations
Traffic Safety
Recommended Next Steps
�Provide pedestrian and bicycle injury data to traffic safety partners to support implementation of complete streets policies and Safe Routes to School programs in each county.
�Support complete streets training and continuing education opportunities for engineers, planners, transportation agency heads and elected officials.
Injury Data for Motor vehicle crashes, occupants (excluding motorcyclists)
Fatal injuriesThis category was the 4th leading cause of fatal injuries to Hawai‘i residents, averaging 58 deaths peryear. About one-third (32%) of the victims were 15 to 24 years of age. Most (73%) of the victims weremales. Fatality rates were significantly higher among Neighbor Island residents, compared to O‘ahuresidents. The rates for residents of Hawai‘i and Kaua‘i counties were particularly high, more than 4times higher than that computed for Honolulu County.
More than half (57%) of the fatal crashes occurred during nighttime hours (7:29 p.m. to 5:31 a.m.), and61% involved only a single vehicle. Lack of restraint use was a major risk factor for occupant fatalities,as less than half of the victims (47%) were wearing seat belts at the time of the crash. Restraint use wasespecially low among back seat passengers (25%). Speeding was the most common contributing factor,noted for 41% of the drivers. Substance use was also an important contributing factor, as 40% of thedrivers involved in fatal car crashes tested positive for alcohol, almost one-quarter (23%) tested positive for drugs, and nearly half (49%) tested positive for either alcohol or drugs. The peak age of alcohol use among drivers was 21 to 24 years of age, as 56% tested positive for alcohol. More thanhalf (56%) of the fatalities from car crashes were related to alcohol consumption by at least one driver involved in the crash.
Trend: decreasingTotal: 290
Ave: 58/year
Age groups:15-24y = 31%
Gender:73% M27% F
County totals and 5-year rate (deaths/100,000):
COUNTY NUM. RATE
Hawaii 94 55.6Honolulu 115 12.3Kauai 35 54.5Maui 46 32.658
57
48
69 58
40
60
80
07 08 09 10 11
111
91
5540
53
17 22
0
20
40
60
80
100
01-14
15-24
25-34
35-44
45-65
65-74
75+
MF

41Injury Specific Recommendations
Traffic Safety
Nonfatal injuriesThere were more than 4000 nonfatal injuries among car occupants each year in Hawai‘i, with a decreasing annual trend. Most (91%) of the injuries were treated in EDs (emergency departments).Patient age was widely distributed, although 27% were 15 to 24 years of age, and this age group alsohad by far the highest rate of injury. There were nearly equal numbers of female (52%) and male(48%) patients.
The nonfatal injury rate for residents of Hawai‘i County was significantly higher than the rate forresidents of any other county, while the rate for Honolulu County residents was significantly lowerthan that for residents of any other county. Almost all (95%) of the injuries were coded as “traffic”, or occurring on public roads. Patients were hospitalized for an average of nearly 1 week, with nearly$46,000 in average medical charges per patient.
EMS data and 2007 linked data (EMS, DOT, HHIC, FARS, death certificates)Most (86%) of the injured occupants treated by EMS were wearing seatbelts. Restraint use wasstrongly associated with EMS patient disposition, including a 7-fold increase in mortality rateamong unrestrained occupants (4.5%) compared to those who wore seatbelts (0.6%). Probable alcohol use was noted for about 10% of the patients, and drinkers were significantly less likely to use seatbelts (71%, vs. 88% for other occupants). Linked data from 2007 showed unrestrained EMS patients had more than twice (2.3) the odds of an injury that required hospitalization or resulted in death, compared to restrained occupants, and more than triple (3.2) the odds of a fatal injury. These excess risks were statistically independent of patient age, gender, or the county of the crash.
Hawai‘i Trauma Registry (toxicology data)About one-third of the injured resident occupants in the Hawai‘i Trauma Registry tested positive for alcohol (32%) or illicit drugs (35%). Considered together, more than half (52%, or 626) of the occupantstested positive for either alcohol or drugs. Occupants who were drinking were significantly youngerthan those who tested negative for alcohol (32 vs. 41 years, on average), more likely to be male (75% vs.56%), and less likely to have used seat belts (46% vs. 63%).
Trend: decreasingAve: 4618/year
Age groups:15-24y = 27%
Treatment4204 ED414 hosp.
County totals, annual number and rate (/100,000):
COUNTY NUM. RATE
Hawaii 1133 636Honolulu 2606 285Kauai 358 554Maui 521 355
5029
4097
4131
5612
42193500
4000
4500
5000
5500
6000
07 08 09 10 11
11
323
1232
847667
1097
214 226
0
500
1000
1500
01-14
15-24
25-34
35-44
45-65
65-74
75+
ED(91%)
hosp.(9%)

42 Injury Specific Recommendations
Traffic Safety
Injury Data for Motor vehicle crashes, motorcyclists
Fatal injuriesDeaths among motorcyclists were the 6th leading cause of fatal unintentional injuries in the state, accounting for 146 total deaths from 2007 to 2011. Nearly half (45%) of the victims were adult males20 to 40 years of age. Most (73%) of the decedents were riding motorcycles; there were also 27 mopedriders who were killed, including 16 over the 2010 to 2011 period. The 5-year fatality rates were significantly higher for residents of Hawai‘i and Maui counties compared to Honolulu County.
Almost half (46%) of the fatal crashes did not involve another vehicle, although that proportion waslower (26%) among the fatally injured moped riders. Only about one-fourth (27%) of all riders werewearing a helmet at the time of the crash, including only 7% of the moped riders. Nearly half (47%) of the decedents tested positive for alcohol, and 29% for illicit drugs. Alcohol use was most commonamong drivers who crashed during nighttime (66%) and among those in crashes without another motorvehicle (69%). About half (51%) of the fatally injured drivers did not have a valid motorcyclist license,and that proportion was significantly higher among those who had consumed alcohol (58%, vs. 44%among other drivers). More than one-half (58%) of the riders were noted to have been speeding atthe time of the crash, a proportion that was higher among motorcyclists (62%) and those who crashedon O‘ahu (66%).
Trend: no trendTotal: 146
Ave: 29/year
Age groups:20-34y = 41%
Gender:94% M6% F
County totals and 5-year rate (deaths/100,000):
COUNTY NUM. RATE
Hawaii 37 19.2Honolulu 77 8.2Kauai 7 -Maui 25 18.023
2828
30
37
15
25
35
45
07 08 09 10 11
0 2
3237
19
45
6 5
0
10
20
30
40
50
01-14
15-24
25-34
35-44
45-65
65-74
75+
MF

43Injury Specific Recommendations
Traffic Safety
Nonfatal injuriesThere was a decreasing trend in the annual number of nonfatal injuries among motorcyclists over the2007 to 2010 period, but an increase in 2011. More than 1000 were treated in EDs each year and another 276 were hospitalized. Patient age was narrowly distributed, with 51% between 15 and 34 yearsof age. The peak age for rates of both ED visits and hospitalizations was among 20 to 24 year olds.Most (83%) of the patients were males.
Although about half (54%) of the patients were residents of Honolulu County, residents there had significantly lower rates of nonfatal injuries than residents of any other county. Injury rates were approximately twice as high among residents of Neighbor Islands. Forty-four percent of the crashes did not involve a collision, but were due to loss of control by the rider. Three-fourths (75%) of the nonfatal injuries were coded as “traffic” related, or occurring on a public roadway, while 25% were in“non-traffic” environments, including off-road crashes. Nearly one-fifth (19%) of the patients who were injured in non-traffic crashes were 5 to 14 years of age. The average hospitalization was nearly 1 week in duration and resulted in over $51,000 in medical charges. About two-thirds (64%) of thehospitalized patients and one-quarter (23%) of those treated in EDs had fractures.
EMS data and 2007 linked data (EMS, DOT, HHIC, FARS, death certificates)About 55% of the EMS Patients were riding motorcycles (55%), and 40% were riding mopeds (status unknown for 5%). About two-thirds (65%) of all riders were wearing a helmet. The proportion not wearing helmets was significantly higher, nearly doubled, among the moped riders (68%), compared to motorcycle riders (38%). Patient condition differed by helmet usage, as helmeted riders were significantly more likely to be transported with minor or moderate injuries (23%, compared to 19% forunhlemeted riders), and significantly less likely to be transported in critical condition (1.9% vs. 3.7%).The mortality rate among helmeted riders (2.5%, or 31 of 1249) was also significantly less than thatamong unhelmeted riders (4.6%, or 86 of 1879). Probable alcohol use was noted for about 12% of the patients, and alcohol users were significantly less likely to have worn helmets (14%, vs 41% amongthose with no alcohol use).
Linked data from 2007 showed the odds of sustaining an injury that required hospitalization or resulted in death were 40% higher among unhelmeted rides compared to helmeted riders, and the former also had more than twice the odds (2.2) of a fatal injury. The protective effects of helmet usewere magnified if only motorcycle riders were considered. Unhelmeted motorcycle riders had twice the odds of an injury that required hospitalization or resulted in death, more than 3 times the odds of a fatal injury, and 3 times the odds of a TBI (traumatic brain injury).
Trend: no trendAve: 1287/year
Age groups:15-34y = 51%
Treatment:1044 ED276 hosp.
County totals, annual number and rate (/100,000):
COUNTY NUM. RATE
Hawaii 265 157Honolulu 713 78Kauai 106 181Maui 236 166
13251238
1355
1434
1247
1000
1200
1400
1600
07 08 09 10 11
1
102
368
299
230280
29 110
100
200
300
400
01-14
15-24
25-34
35-44
45-65
65-74
75+
ED(79%)
hosp.(21%)

44 Injury Specific Recommendations
Traffic Safety
Hawai‘i Trauma Registry (toxicology data)About one-fourth (26%) of the injured resident motorcycle/moped riders in the Hawai‘i Trauma Registrytested positive for alcohol, including 21% (178) with BAC (blood alcohol content) levels of 0.08 or greater,and 14% (117) with BAC levels of 0.16% or greater. Moped riders were significantly more likely thanmotorcyclists to have been drinking (31% vs 24%, respectively). More than half (54%, or 464) of the riders tested positive for either alcohol or drugs, including most (78%) of the 285 moped riders. Alcoholusage was 4 times more common among those who crashed during night time (54%) compared to thosewho crashed between 6:30 a.m. and 7:29 p.m. (14%).
Motor vehicle crashes, pedestrians
Fatal injuriesThere was no statistically significant trend in the annual number of pedestrian fatalities, although the highest total occurred in 2007 (37 deaths). Senior-aged residents comprised 47% of the victims, and the fatality rates increased dramatically across the oldest age groups. Most (69%) of the victims were hit on O‘ahu, but there were no significant differences in county-specific fatality rates. Almost all (80%) of the victims who were 65 years or older were hit on O‘ahu, and the fatality rate for O‘ahu seniors was statistically comparable to that for seniors living on Neighbor Islands (36 vs. 22 deaths/100,000, respectively).
There were 2 peak times for pedestrian fatalities: 27 crashes (21% of the total) occurred between 5:31 a.m.and 9:29 a.m., and 40 (31%) took place between 5:31 p.m. and 11:29 p.m. Only 34% of the victims were ina crosswalk at the time of the crash; a nearly equal proportion (35%) were hit on open stretches of roadway.The most common speed zone was 25 miles per hour (45% of crashes). Almost two-thirds than half(63%) of the senior-aged victims were hit in 25 mph or slower zones, compared to 33% of pedestriansunder the age of 65 years. According to FARS data from 2007 to 2010, more than one-quarter (26%) of the 84 fatally injured pedestrians tested positive for alcohol, and 25% had BAC levels of 0.08% orhigher. Alcohol use was significantly higher among male victims (42%) compared to females (6%). Thehighest prevalence of alcohol use was seen among victims in the 21 to 34 year age group (70%, or 7 of 10),and the 35 to 54 year age group (52%, or 11 of 21). According to FARS data, 39% (33) of the pedestrianvictims were in the roadway erroneously, most commonly by “improper crossing of roadway or intersection”, including jaywalking (21%, or 18 victims). Including the victims who tested positive for alcohol or drugs, 54% (or 45) of the pedestrians made an error that contributed to the crash. Morethan half (59%, or 52) of the 88 drivers made an error which contributed to the crash. Most commonly,they were described as “inattentive” (38%), failed to yield the right of way (25%), or were speeding (18%).
Trend: no trendTotal: 130
Ave: 26/year
Age groups:65y and older = 47%
Gender:58% M42% F
County totals and 5-year rate (deaths/100,000):
COUNTY NUM. RATE
Hawaii 21 11.4Honolulu 90 8.8Kauai 4 -Maui 15 10.5
21
31
25
37
1610
20
30
40
07 08 09 10 11
0
913
713
2722
39
0
20
40
01-14
15-24
25-34
35-44
45-65
65-74
75+
MF
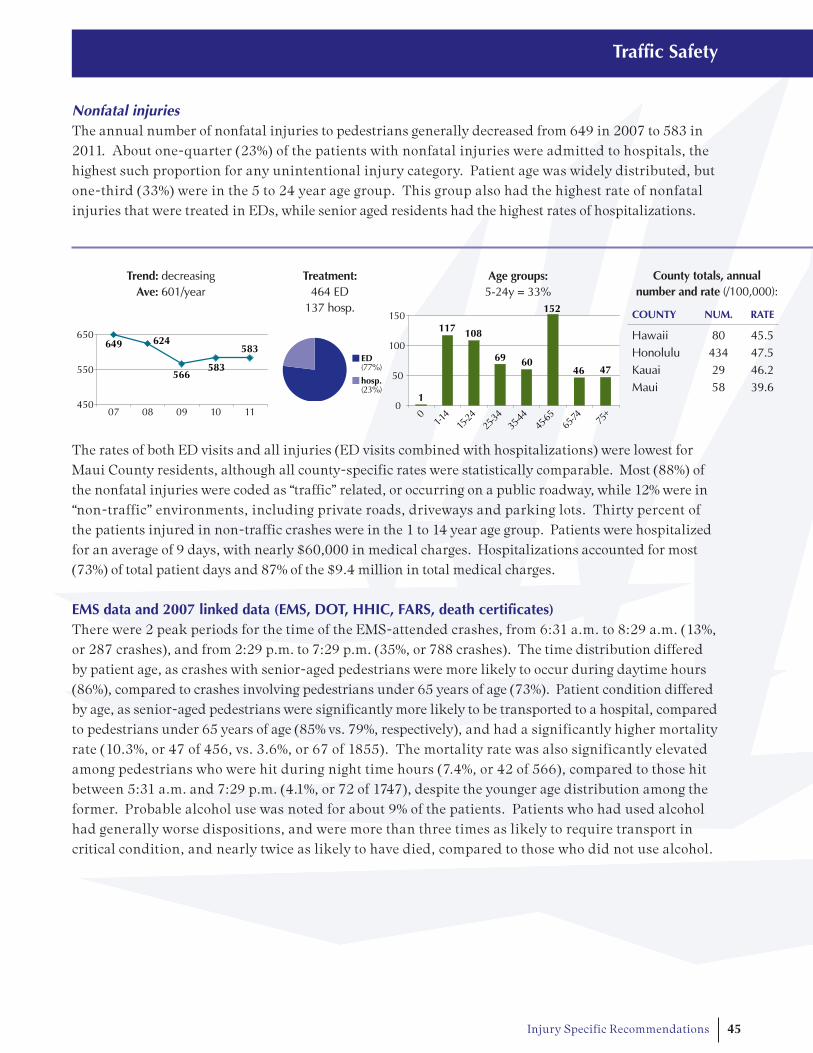
45Injury Specific Recommendations
Traffic Safety
Nonfatal injuriesThe annual number of nonfatal injuries to pedestrians generally decreased from 649 in 2007 to 583 in2011. About one-quarter (23%) of the patients with nonfatal injuries were admitted to hospitals, thehighest such proportion for any unintentional injury category. Patient age was widely distributed, butone-third (33%) were in the 5 to 24 year age group. This group also had the highest rate of nonfatal injuries that were treated in EDs, while senior aged residents had the highest rates of hospitalizations.
The rates of both ED visits and all injuries (ED visits combined with hospitalizations) were lowest forMaui County residents, although all county-specific rates were statistically comparable. Most (88%) ofthe nonfatal injuries were coded as “traffic” related, or occurring on a public roadway, while 12% were in“non-traffic” environments, including private roads, driveways and parking lots. Thirty percent ofthe patients injured in non-traffic crashes were in the 1 to 14 year age group. Patients were hospitalizedfor an average of 9 days, with nearly $60,000 in medical charges. Hospitalizations accounted for most(73%) of total patient days and 87% of the $9.4 million in total medical charges.
EMS data and 2007 linked data (EMS, DOT, HHIC, FARS, death certificates)There were 2 peak periods for the time of the EMS-attended crashes, from 6:31 a.m. to 8:29 a.m. (13%,or 287 crashes), and from 2:29 p.m. to 7:29 p.m. (35%, or 788 crashes). The time distribution differedby patient age, as crashes with senior-aged pedestrians were more likely to occur during daytime hours(86%), compared to crashes involving pedestrians under 65 years of age (73%). Patient condition differedby age, as senior-aged pedestrians were significantly more likely to be transported to a hospital, comparedto pedestrians under 65 years of age (85% vs. 79%, respectively), and had a significantly higher mortalityrate (10.3%, or 47 of 456, vs. 3.6%, or 67 of 1855). The mortality rate was also significantly elevatedamong pedestrians who were hit during night time hours (7.4%, or 42 of 566), compared to those hitbetween 5:31 a.m. and 7:29 p.m. (4.1%, or 72 of 1747), despite the younger age distribution among theformer. Probable alcohol use was noted for about 9% of the patients. Patients who had used alcoholhad generally worse dispositions, and were more than three times as likely to require transport incritical condition, and nearly twice as likely to have died, compared to those who did not use alcohol.
Trend: decreasingAve: 601/year
Age groups:5-24y = 33%
Treatment:464 ED
137 hosp.
County totals, annual number and rate (/100,000):
COUNTY NUM. RATE
Hawaii 80 45.5Honolulu 434 47.5Kauai 29 46.2Maui 58 39.6
624
583
583649
566
450
550
650
07 08 09 10 11
1
117 108
69 60
152
46 47
0
50
100
150
01-14
15-24
25-34
35-44
45-65
65-74
75+
ED(77%)
hosp.(23%)

46 Injury Specific Recommendations
Traffic Safety
Hawai‘i Trauma Registry (toxicology data)Only 16% of the injured pedestrians in the Hawai‘i Trauma Registry had been drinking at the time theywere hit. This percentage was significantly higher among those under 65 years of age (22%), as only 2%(3) of the 138 senior-aged pedestrians tested positive for alcohol. Illicit drug usage was documented for25% of the patients, including 30% of those who were under 65 years of age. Alcohol use was nearly 8 times likely among pedestrians hit during night time hours (41%) than among those hit between 6:30a.m. and 7:29 p.m. (5%).
Injury Data for Motor Vehicle Crashes, Bicyclists
Fatal injuriesThere were between 2 and 4 bicyclists killed in Hawai‘i each year, and 80% (12) of the 15 deaths occurredon O‘ahu. There was no apparent high-risk age group. Almost all (87%, or 13) of the bicyclists killedover the 5-year period were males. Most (87%, or 13) of the victims were hit by a car; 2 others died afterfalling off their bicycles. Only 2 of the victims were wearing helmets at the time of the crash (statusunknown for 2 others). There was no notable peak time of the day for the crashes; most (64%, or 9)occurred between during daylight hours between 7:31 a.m. and 7:00 p.m.
Almost all (91%, or 10) of the 11 traffic-related crashes (from 2007 to 2010) involved cars travelingstraight on the road; only 1 crash was due to a car making a turn. Two (18%) of the 11 bicyclists testedpositive for alcohol, and 4 (36%) tested positive for drugs. Overall, about half (54%, or 6) of the victimstested positive for either alcohol or drugs. Besides substance use 2 bicyclists were traveling against traffic at the time of the crash and another failed to yield the right-of-way. Four (36%) of the 11 driversmade an error which contributed to the crash, most commonly substance use and speeding (2 instances each).
Nonfatal injuriesThere were more than 1200 nonfatal injuries to bicyclists each year, with a generally increasing trend.Most (92%) of the injuries were treated in EDs (emergency departments). Males comprised 75% of thepatients, including 80% of those who were hospitalized. Nearly one-third (31%) of the patients were 5 to14 years of age, and the injury rate for 5 to 14 year-olds (244 injuries/100,000 residents) were more than3 times higher than the rate for residents of other ages (74/100,000).
Trend: no trendTotal: 15
Ave: 3/year
Age groups:widely distributed
Gender:87% M13% F
County totals and 5-year rate (deaths/100,000):
COUNTY NUM. RATE
Hawaii 0 -Honolulu 12 1.3Kauai 0 -Maui 3 -2
334 3
0
2
4
6
07 08 09 10 11
0 0
4
0
2
6
12
0
2
4
6
8
01-14
15-24
25-34
35-44
45-65
65-74
75+
MF

47Injury Specific Recommendations
Traffic Safety
The injury rate for Kaua‘i County residents was significantly higher than the rates for any other county,and approximately double the rate estimates for residents of Honolulu or Maui counties. Almost all(85%) of the injuries were coded as “non-traffic”, or occurring on private roads, driveways, or off-roadenvironments. Most of the injuries treated in EDs (88%) and requiring hospitalization (71%) were coded toindicate crashes that did not involve a collision with another vehicle or object, but were probably due tothe patient falling off of the bicycle. Although 92% of the patients were treated in EDs, hospitalizationscomprised 32% of the treatment days and 66% of the total medical charges of $5.8 million/year. Most(63%) of the hospitalized patients had fractures, including 15% with skull fractures and 20% with legfractures. More than one-third (38%) of these patients had a traumatic brain injury.
EMS data and 2007 linked data (EMS, DOT, HHIC, FARS, death certificates)Most (73%) of the EMS-attended bicyclist crashes were distributed over the 11-hour period of 7:31 a.m. to6:29 p.m., with a peak from 4:31 p.m. to 6:29 p.m. (17%). About half (53%) of the injuries involved motorvehicles and 47% did not. Only 27% of the injured bicyclists wore helmets. Unhelmeted riders had asignificantly higher proportion of “critical” or fatal injuries (2.1%, or 22 of 1031), compared to helmetedriders (0.7%, or 3 of 458). These differences were accentuated among crashes that involved motor vehicles,as the proportion of unhelmeted bicyclists with critical or fatal injuries was 3.1% (17 of 540), compared to0.9% (2 of 214) among helmeted riders. Probable alcohol use was noted for about 9% of the patients.If only the bicyclists with known alcohol and helmet status were considered, helmet use was 5 timeshigher among those who did not consume alcohol (35%), compared to the drinkers (5%).
Linked data from 2007 showed odds of sustaining an injury that required hospitalization or resulted in death were 80% higher among unhelmeted rides compared to helmeted riders, although this estimatewas only of “borderline” statistical significance (p=0.11).
Hawai‘i Trauma Registry (toxicology data)Only 11% of the injured bicyclists in the Hawai‘i Trauma Registry had been drinking at the time theywere injured. This percentage was nearly three times higher among those hurt in crashes that did notinvolve a motor vehicle compared to those who were hit by motor vehicles (15% vs. 6%, respectively).About one-quarter of the bicyclists tested positive for illicit drugs, most commonly narcotics (17%),and this proportion did not differ by the type of crash. Overall, one-third (33%, or 89) of the 271 patients tested positive for either alcohol or drugs. None of the 28 bicyclists who had been drinking werewearing a helmet at the time of the crash, compared to 27% usage among those who tested negative for alcohol, and 31% among those who were not tested.
Trend: increasing trendAve: 1237/year
Age groups:1-14y = 38%
Treatment:1133 ED105 hosp.
County totals, annual number and rate (/100,000):
COUNTY NUM. RATE
Hawaii 201 120.4Honolulu 779 90.7Kauai 109 182.8Maui 148 102.9
1169
1257 1381
1197 1182
1000
1200
1400
07 08 09 10 11
0
466
176140 144
268
33 100
100
200
300
400
500
01-14
15-24
25-34
35-44
45-65
65-74
75+
ED(92%)
hosp.(8%)

48 Injury Specific Recommendations
Violence and Abuse Prevention
Background and AccomplishmentsThe Hawai‘i State Department of Health, Maternal and Child Health Branch (MCHB) leads activities in the state to prevent intimate partner violence, sexual assault, and child maltreatment, with supportfrom the Injury Prevention and Control Section (IPCS) and other partners in the community. IPCS hasbeen specifically involved with bullying prevention and also leads activities in the state to prevent suicide prevention.
�Beginning in 2009, IPCS and community partners worked with MCHB to identify Title V bullyingprevention and child abuse and neglect prevention performance measures. With technical support from the national Children’s Safety Network, MCHB and IPCS collaborated to conduct the first statewide cross-program integration training in November 2009 for bullying and childabuse and neglect prevention. The training strengthened collaborative efforts between IPCS, MCHB,and community partners on program and policy initiatives related to violence prevention.
�The Safe Schools Community Advisory Committee developed 33 recommendations for policies andstrategies to address bullying and harassment in public schools. Members are currently working toget these recommendations adopted by the Board of Education and Department of Education.
�The Maui County Ho‘oikaika Partnership is a group of agencies working together since 2008 toimplement best practices and policies as they strengthen violence prevention services for childrenand their caregivers. This collaborative initiative serveS as a model for similar partnerships acrossthe state.
�The Asian/Pacific Islander Youth Violence Prevention Center was established in 2000 as one of tenNational Academic Centers of Excellence on Youth Violence Prevention funded by CDC. Sincethen, the Center has partnered with IPCS and other organizations to conduct research on youth violence and develop, implement and evaluate violence prevention programs.
�IPCS helped establish a non-profit coalition to promote primary prevention of violence, Prevent Violence Hawai‘i. IPCS funded the University of Hawai‘i Social Science Research Institute to produce, Ending Violence: A 2004 Status Report on Violence Prevention in Hawai‘i. The report’srecommendations were based on the World Health Organization’s approach to addressing riskfactors and solutions common to all areas of violence. Concerns about sustaining efforts in individualareas of violence hampered the organization’s ability to take a unified approach to violence prevention, and the non-profit dissolved in 2010.
RecommendationsIn 2010, a statewide needs assessment was conducted that included an online survey of 149 people representing government agencies, law enforcement, schools and universities, medical centers, non-profit organizations, private businesses, and grassroots organizations; and qualitative interviews with 21 key informants from state agencies and universities. A cross-disciplinary stakeholder group was convened to review the results and recommendations, and assess whether they reflected the potential for measurable progress and impact over the next five years.
The resulting recommendations outlined here build on Ending Violence: A 2004 Status Report on Violence Prevention in Hawai‘i and the Hawai‘i Injury Prevention Plan 2005-2010. They reflectstakeholders’ renewed readiness to collaborate. Effectively preventing violence will take the concerted efforts of individuals and organizations from all sectors working together across all areas of violence.

49Injury Specific Recommendations
Violence and Abuse Prevention
Recommendation 1: Establish and promote forums for collaboration and information sharing to helpintegrate violence and abuse prevention efforts statewide
While different types of violence share common risk factors and prevention strategies, prevention efforts are often independent. Forums that encourage organizations that serve different populations and address different types of violence to share information about effective strategies would facilitatecollaboration and coordination of efforts (Saul, et al, 2008).
Efforts should be comprehensive and address the different types of violence, encourage the use of evidence-based program and policy practices, and account for primary, secondary, and tertiary prevention as appropriate.
Recommended Next Steps
�Facilitate opportunities for inter-agency collaboration and coordination among organizations serving different populations and addressing various sub-forms of violence.
�Expand the use of new and existing channels of communication such as newsletters, listservs, websites, clearinghouses, and other means of technology to facilitate the exchange of informationand resources among partners at all levels and in all areas of violence.
Recommendation 2: Collaborate with professionals and community workers to develop a publicawareness campaign about violence and abuse prevention.
Current partners represent all levels of prevention and include community and non-profit socialservice organizations, primary health care centers, law enforcement, and selected policymakers. But there are additional partners who may not be aware of their potential role in violence prevention or understand the value of their programs to violence prevention efforts.
Engaging partners in the development, implementation and evaluation of a communications campaignto raise public awareness will increase likelihood of success at all levels (e.g., developing messages, producing materials, identifying appropriate channels for dissemination).
Child Death Review Council
Domestic Violence Fatality Review
Hawai‘i Children’s Trust Fund Advisory Council
Hawai‘i Coalition Against Sexual Assault
Hawai‘i Community Foundation
Hawai‘i Youth Services Network
Hawai‘i State Department of Education, School Based Behavioral Health
Hawai‘i State Department of Health, Family Health Services Division, Maternal and ChildHealth Branch
Hawai‘i State Department of Human Services
Hawai‘i State Department of the Attorney General
Hawai‘i State Judiciary, Children’s Justice Center and First Circuit Court
Ho‘oikaika Partnership
Injury Prevention Advisory Committee
Maui County Domestic Violence Task Force
University of Hawai‘i, John A. Burns School of Medicine, Department of Psychiatry
University of Hawai‘i, Social Science Research Institute
PARTNERS

50 Injury Specific Recommendations
Violence and Abuse Prevention
Recommended Next Steps
�Identify and reach out to potential partners that may not perceive their work as being related to violence prevention.
�Work with existing and new partners to develop and implement a public education campaign usingclear, consistent, tested messages.
�Partner with representatives from the media to enhance efforts and increase reach for messaging.
Recommendation 3: Promote training that enhances knowledge and skills of community workersand professionals working in violence prevention and related fields
There should be continued training among providers and organizations, and audiences should extendbeyond those working directly in the violence and abuse prevention fields. For example, teachers andcounselors could receive related information as part of their academic training. Organizations couldadopt violence prevention modules as part of their new employee orientation protocols.
Recommended Next Steps
�Identify training opportunities and resources available to community workers in the violence andabuse prevention fields to enhance their knowledge and skills in primary prevention.
�Identify training opportunities and resources for other professionals and community members toenhance their knowledge and skills in primary prevention.
Recommendation 4: Enhance the use of data to understand common risk and protective factors for violence prevention
Data are crucial to understanding the complex issue of violence. Data help programs develop priorities,guide interventions and policies, and mobilize support (World Health Organization, 2002). Barriers tocollecting and sharing information across agencies need to be removed so that data are accessible toeveryone. There also are additional data sources (i.e., on different types of violence) that would help illustrate trends and better guide research and intervention efforts.
Recommended Next Steps
�Facilitate data and information sharing across state agencies.
�Identify and acquire new data sources to develop an annual report on child maltreatment that willenhance understanding of violence and abuse.

51Injury Specific Recommendations
Violence and Abuse Prevention
Injury Data for Homicides and Assaults
Fatal injuriesThere were 112 victims of homicide over the 5-year period, with a decreasing trend from 29 in 2008 to 17 in 2011. More than half (58%) of the victims were in the 25 to 54 year age range, but there were also 6 victims (5%) who were under 5 years of age. Males comprised 59% of the victims. The fatality ratefor residents of O‘ahu (8.8 deaths/100,000 residents) was statistically comparable to the rate for allNeighbor Island residents (8.4/100,000).
The most common method was the use of firearms (35%), followed by stabbings (28%), and physicalforce or unarmed beatings (25%). According to Uniform Crime Reports from 2007 to 2009, most (73%)of the homicide victims knew their assailant, and only a minority (19%) were killed by strangers. Femalevictims were most likely to be killed by their intimate partner (37%, vs. 5% of male victims), while maleswere most likely to be killed by extra-familial acquaintances (40%) or strangers (25%).
Nonfatal injuriesThere were over 4200 nonfatal injuries from assaults among Hawai‘i residents each year, with noclear trend over time. Males comprised two-thirds (67%) of the patients treated in EDs (emergencydepartments) and an even greater proportion (89%) of those who were hospitalized. More than half(58%) of the patients were 15 to 34 years of age; few (5%) were under 15 years of age, or over 65 yearsof age (1%). The peak age for rates of both ED visits and hospitalizations was the 15 to 29 year agegroup, particularly 20 to 24 year-olds.
Trend: decreasing trendTotal: 112
Ave: 22/year
Age groups:25 to 54y = 58%
Gender:59% M41% F
County totals and 5-year rate (deaths/100,000):
COUNTY NUM. RATE
Hawaii 17 -Honolulu 81 8.8Kauai 7 -Maui 7 -
29
21
1722
23
10
20
30
40
07 08 09 10 11
28
12
2225
34
4 5
0
20
40
01-14
15-24
25-34
35-44
45-65
65-74
75+
MF
Trend: no trendAve: 4243/year
Age groups:15-24y = 33%
Treatment3936 ED307 hosp.
County totals, annual number and rate (/100,000):
COUNTY NUM. RATE
Hawaii 771 466.3Honolulu 2735 302.4Kauai 226 384.0Maui 511 363.24097 4148
425242704449
3500
4000
4500
5000
07 08 09 10 11
6231
1394
1050
715 781
44 220
500
1000
1500
01-14
15-24
25-34
35-44
45-65
65-74
75+
ED(93%)
hosp.(7%)

52 Injury Specific Recommendations
The injury rate for residents of Hawai‘i County was significantly higher than for any other county, whilethe rate for residents of Honolulu County was significantly lower than any other county. Patients werehospitalized for nearly 5 days on average, with over $31,000 in charges for each admission. Unarmedbeatings caused 70% of all injuries, and 61% of those that required hospitalization. Fractures were themost common type of injury (53%) that required hospitalization, including 44% of patients admittedwith a skull fracture.
EMS dataThe number of EMS-attended incidents generally increased over the course of the day (starting at 6 a.m.),reaching a broad peak during the 7:31 p.m. to 2:29 a.m. period (48% of the total). The home or residenceof the patient was the most common location for the assault (40%), followed by other indoor location orbuildings (17%), most commonly “public buildings” (7%), and bars and restaurants (6%). One-fifth (20%)of the patients were transported in serious or critical condition. That proportion was highest among thesenior-aged victims (29%). Probable alcohol use was noted for 29% of the patients. Patients who had consumed alcohol were significantly less likely to be released at the scene (34%, vs. 52% for other patients),and twice as likely to be transported in serious condition (31% vs. 15%, respectively).
Hawai‘i Trauma Registry (toxicology data)Nearly half (46%) of the adult-aged (18 years and older) Hawai‘i Trauma Registry resident patientswho were injured by assaults were positive for alcohol, and more than one-third (38%) tested positive forillicit drugs. About three-fourths (76%, or 286) of the 375 drinkers had BAC (blood alcohol content)levels of 0.08% or greater. THC (marijuana) was the most commonly documented drug (19% of thepatients), followed by amphetamines (15%) and narcotics (15%). Considered together, about two-thirds(67%) of the patients tested positive for either alcohol or drugs. Alcohol use was significantly morelikely among the male patients (49%) compared to females (27%), among those injured on weekends(54% vs. 41% for those assaulted on weekdays), and among those assaulted during night time hours(54%, vs. 30% for those injured between 6:31 a.m. and 7:29 p.m.).
Violence and Abuse Prevention

53Appendices
RECOMMENDATIONS STATUS* CURRENT COMMENTSEFFORT**
Stabilize IPCS funding and support expansion of injury prevention services to all counties throughout the state.�Stabilize funding for Core IPCS positions Progress Made ��Establish suicide prevention Objective Met
coordinator position�Establish Neighbor Island positions Progress Made �
Establish standards for completeness and Objective Metaccuracy of external cause of injury coding (e-coding) for hospitals to achieve and maintain.
Produce and disseminate annual and Objective Metspecialized injury reports.
Incorporate injury prevention into Progress MadeHawai‘i’s Health Education Standards for grades K through 12.
Develop a cadre of individuals and Progress Made �organizations who are injury literate, articulate, and active.
Cultivate awareness and advocacy among Progress Made �policy makers and the public in recognizing and addressing injuries as a major public health problem in Hawai‘i.
Foster partnerships with the military to Progress Made �address injury prevention issues in which the military can have impact.
Appendix A: Hawai‘i Injury Prevention Plan 2005-2010 Status Report
IPCS has 3 permanent state funded positions– Program Manager, Planner, and SuicidePrevention Coordinator. In 2012, the Hawai‘iState Legislature approved potential fundingfor injury prevention positions with TraumaSpecial Funds. Trauma coordinator programmanager positions at trauma centers acrossthe state are funded through DOH EmergencyMedical Services Injury Prevention SystemBranch and are required to incorporate injury prevention into their work.
E-coding is at 90% for emergency department and hospital admissionrecords.
Injuries in Hawai‘i 2001-2006 was published in 2008. IPCS developed an injury data overview for the IPAC orientation packet. Injury specific dataoverviews are updated each year and shared with IPAC and other partners.
The Hawai‘i Health standards-based playground safety curriculum and unintentional injury curriculum were developed for public elementary schools.
An injury prevention module was developedfor emergency medical and mobile intensivecare technician classes at Kapi‘olani Commu-nity College, and the course was taught acrossthe state. IPCS coordinated injury preventionintegration training with Department ofHealth Family Health Services Division, Maternal and Child Health Branch as well asseveral injury specific conferencesand publichealth core competency workshops.
IPCS distributed Injuries in Hawai‘i to 2008Legislators; provided testimony for injury-related legislation; developed and disseminatedmaterials for the injury prevention “No GetHurt Hawai‘i” campaign with prevention tips;and developed IPAC packet.
IPAC and Prevent Suicide Hawai‘i SteeringCommittees include representatives from themilitary. Members of the military are involvedin the Department of Transportation’s “Click Itor Ticket” campaign as well as Prevent SuicideHawai‘i Task Force suicide prevention efforts.
INFRASTRUCTURE
54 Appendices
Appendix A: Hawai‘i Injury Prevention Plan 2005-2010 Status Report
RECOMMENDATIONS STATUS* CURRENT COMMENTSEFFORT**
Develop a beach rating system that includes Objective Metcomprehensive risk assessments for all beaches in the state.
Evaluate existing and promising programs, Progress Made �
curriculum, and activities to determine their effectiveness in preventing drownings and other water-related injuries, and to appropriately allocate limited resources.
Support mandatory 4-sided isolation On Holdfencing for residential pools.
Conduct a coordinated educational campaign Objective Mettargeting residential pool owners and pool service providers to promote pool safety and the adoption of safety devices.
RECOMMENDATIONS STATUS* CURRENT COMMENTSEFFORT**
Enhance public awareness that falls Progress Made �
are preventable and promote actions that reduce the risk of injury.
Increase availability and accessibility of fall Progress Made �
prevention programs statewide for caregivers and older adults on how to prevent falls and effectively use community resources.
Expand the role of medical and health Progress Made �
care professionals in screening, educating, and referring older adults to fall prevention programs.
RECOMMENDATIONS STATUS* CURRENT COMMENTSEFFORT**
Advocate for a mandatory universal Progress Made �
helmet use law.
Enhance and expand training of county police On Holdofficers to recognize impaired motorcyclists.
The rating system and beach safety websitewere developed (www.hawaiibeachsafety.org).
Conducted an evaluation of beach warningsigns in 2009.
IPCS not currently involved.
Worked with Swimming Pool Association of Hawai‘i to develop a pool safety awarenesscampaign; conducted a pool safety survey of pool owners.
IPCS participated with partners, includingFall Prevention Consortium members, inannual campaign for fall prevention aware-ness. Fall prevention questions were addedto statewide health survey in 2008.
Fall Prevention Resource Guide developedand posted online, will be revised in 2012.Needs assessment conducted in 2010. Piloted two Tai Chi for Health projects.
IPCS participated with partners in annualcampaign for fall prevention awarenessworking with physical therapists and pharmacists.
IPCS continues to work on this throughStrategic Highway Safety Plan committee.
IPCS not currently involved.
FALLS
DROWNING
MOTORCYCLE

55Appendices
Appendix A: Hawai‘i Injury Prevention Plan 2005-2010 Status Report
MOTOR VEHICLE OCCUPANT
RECOMMENDATIONS STATUS* CURRENT COMMENTSEFFORT**
Increase “high visibility enforcement efforts” Progress Made �
of traffic safety laws and publicity of those efforts as a combined strategy.
Develop a statewide task force for Objective Mettraffic safety advocacy.
***Support a statewide task force for traffic Progress Made �
safety advocacy.
Advocate for a Graduated Driver’s Objective MetLicense System for Hawaii.
***Evaluate the Graduate Driver’s Objective MetLicense System for Hawai‘i.
***Reduce impaired driving. Progress Made �
RECOMMENDATIONS STATUS* CURRENT COMMENTSEFFORT**
Maintain and upgrade existing crosswalks Progress Made �
and walkways; develop new crosswalks and walkways based on pedestrian safety factors such as location and condition.
Conduct a media awareness campaign aimed Progress Madeat changing attitudes and behaviors of drivers and pedestrians to improve road sharing.
Incorporate pedestrian safety in the health Progress Madeeducation standards of the Department of Education’s K-12 curriculum.
IPCS works with DOT Safe CommunitiesOffices to distribute “Click It or Ticket” annual campaign materials to traffic safety partners.
The Strategic Highway Safety Plan (SHSP)was developed. See partner list in TrafficSafety chapter.
IPCS involved in on-going SHSP implementation of efforts.
Act 72 (2005) established a 3-stage graduated driver licensing program for persons under the age of 18. Departmentof Health and Department of Transporta-tion were required to conduct yearly evaluations.
IPCS completed evaluations from 2007-2010, when the law became permanent
Ignition interlock bill was passed in 2008 and became effective in 2010. IPCS continues to be involved, specifically in evaluating of the law.
IPCS has on-going involvement with pedestrian and bicycle safety efforts. Since 2005, Complete Streets state legislation and an O‘ahu Complete Streets ordinance have passed.
“No Get Hurt” TV PSA includes pedestrian safety.
The Hawai‘i Health standards-based unintentional injury curriculum, which includes pedestrian safety, was developedfor public elementary schools.
PEDESTRIAN

56 Appendices
Appendix A: Hawai‘i Injury Prevention Plan 2005-2010 Status Report
RECOMMENDATIONS STATUS* CURRENT COMMENTSEFFORT**
Through legislation, improve labeling on On Holdprescription drugs to include:�Diagnosis and instructions to patients�Physical description
Expand age-appropriate education efforts Progress Madein poison prevention.
Maximize use of the 24-hour Hawai‘i Progress Made �
Poison Hotline for poison AND medication/drug information.
RECOMMENDATIONS STATUS* CURRENT COMMENTSEFFORT**
Develop and implement suicide prevention Objective Mettraining for “gatekeepers.”
***Maintain and evaluate suicide prevention Progress Made �
training for “gatekeepers.”
Launch a public awareness campaign. Progress Made �
Promote and support research on Progress Madesuicide and suicide prevention.
Develop and promote effective clinical and Progress Made �
professional practices and policies.
IPCS worked with community partner on analyses of unintentional poisoning of prescription narcotics which may haveimplications on future legislation.
Keiki Injury Prevention Coalition (KIPC)distributed poisoning prevention materialsacross the state. “No Get Hurt” poisoningprevention poster distributed through DOH.
Distribution of poisoning prevention materials included information on theHawaii Poison Hotline.
Gatekeepers were trained from all counties.IPCS coordinated workshops statewide. Asof 2012, there are 37 ASIST (Applied SuicideIntervention Skills Training) trainers andmore than 2,500 gatekeepers trained.
IPCS evaluated gatekeeper trainings and worked with partners to develop a sustainability plan for suicide preventiontraining efforts.
IPCS worked with Visionary Related Entertainment (VRE) Hawai‘i to develop a radio spot in 2009. The “No Get Hurt” TV PSA aired on Olelo in 2009, and the “No Get Hurt” suicide prevention posterswere distributed statewide. IPCScoordinated two statewide suicide prevention conferences and co-sponsored“Survivors of Suicide” conferences withHawai‘i SPEAR (Suicide Prevention Education Awareness Research).
IPCS evaluated gatekeeper training.
The Prevent Suicide Hawai‘i Task Force(PSHTF) and IPCS coordinated conferencesfor clinicians and professionals.
SUICIDE
UNINTENTIONAL POISONING

57Appendices
Appendix A: Hawai‘i Injury Prevention Plan 2005-2010 Status Report
RECOMMENDATIONS STATUS* CURRENT COMMENTSEFFORT**
Promote and support the development of On Hold“full-service” schools.
Identify approaches used in local and Progress Madenational programs that effectively reduce community violence.
Conduct research to better understand Progress Madeviolence in Hawai‘i.
HIPP 2005-2010 was revised in 2009 to include additional recommendations in traffic and suicide that reflect on-going efforts. These are noted with ***
*Objective met – IPCS and partners completed the recommendation
Progress made – IPCS and partners accomplished a portion of the recommendation
On-Hold – IPCS was unable to make progress on recommendation due to a lack of resources (time, personnel, etc) or
other reasons
** Current Efforts – a check mark in this column reflects on-going efforts.
IPCS not currently involved.
The Asian/Pacific Islander Youth Violence Prevention Center worked on this recommendation. This Center is represented on IPAC.
The Asian/Pacific Islander Youth Violence Prevention Center worked on this recommendation. This Center is represented on IPAC.
VIOLENCE AND ABUSE

58 Appendices
With the exception of the chapter on drowning, the data presented in this plan refers only to injuryamong residents of Hawai‘i. This is consistent with national reporting conventions of injury mortalityand allows for the comparison of fatal injury rates in Hawai‘i with rates for the remainder of the country.Also, other population estimates (e.g. age, ethnicity, county, etc.) were available only for residents, sothe inclusion of injuries among non-residents would result in an over-estimation of injury rates. Theexclusion of non-residents reduces the amount of fatal injuries by about 9%, hospitalizations by 9%, andemergency department visits by 9%. (Non-residents comprised 47% of the drowning victims in Hawai‘i,so they are included in some of the data in the drowning section.)
The calculation of injury mortality rates necessitates the definition of “at risk” populations for the denominator. This data was obtained from the web site for the U.S. Census Bureau (2012). Rate estimates used the average annual population estimate over the 2007 to 2010, since 2011 estimates were not available when preparation of this report began.
The primary source of injury mortality data in Hawai‘i is the death certificate database of the Hawai‘iDepartment of Health. The ICD-10 underlying cause of death codes were grouped as recommended bythe Centers for Disease Control and Prevention, with some exceptions (CDC, 2002). For some types ofinjuries, the open text information on how the injury occurred was reviewed to extract information notcaptured by the cause of death code. Supplemental data was also used for certain injury categories.Data from the Fatal Analysis Reporting System (FARS) of the National Highway Traffic Safety Administration (NHTSA) was linked to death certificate data for deaths from traffic crashes(NHTSA, n.d.). Supplemental data on homicides was abstracted from the Uniform Crime Reports(UCR), maintained by the National Archive of Criminal Justice data (2010). The autopsy records of O‘ahu suicide and drowning victims were also reviewed for the 2007 to 2010 period.
The main source of data on nonfatal injuries was the Hawai‘i Health Information Corporation (HHIC),which receives abstracted data from the medical records of patients treated in all hospital-basedemergency departments (EDs) and hospitals in the state, with the exception of ED records from TriplerArmy Medical Center. A record was defined as injury-related if the principle diagnosis was within theICD-9CM series 800-995.85, with the following exclusions: 909.3, 909.5, 995.0-995.4, 995.6-995.7(Injury Surveillance Workgroup, 2003). Patients who died in the hospitals or who were discharged tohospice facilities were excluded from these analyses. To prevent double-counting of injuries, patientswho were transferred to another hospital at discharge were excluded. Injuries resulting from “adverse effects”, as indicated by external cause of injury codes (E-codes) were also excluded (CDC, 2007).E-codes were used to group nonfatal injuries into mechanisms that corresponded to the groupings forfatal injuries (CDC, 2007). In this report, all nonfatal self-inflicted injuries are described as “suicide attempts”, although this is not actually discernible through E-codes. This may have resulted in an overestimation of suicide attempts, but it is also possible that self-inflicted injuries in generalare underreported.
It is important to note that the extent of E-coding varied across the counties patients reside in, and overtime within those counties. The records for residents of Neighbor Islands were significantly more likelyto have E-codes than records for residents of Honolulu County (on average 97.4% vs. 87.5%, respectively).There were also decreasing trends in the proportion of inpatient records with E-codes for all countiesexcept Maui, although these were most meaningful for O‘ahu hospitals. These variations in E-coding needto be considered when interpreting comparisons between counties and examining trends within a county
Appendix B: Data Sources and Methods

59Appendices
over time. Most statistics in this report are based only on E-coded records, and therefore underestimatethe real magnitude of injuries by about 9% for both those treated at EDs and for those injuries requiringhospitalizations. There was some inconsistency in the contribution to the HHIC database from certainindividual hospitals. One O‘ahu hospital began contributing ED records in November, 2008, althoughthis hospital accounted for only 1.4% of ED records. Two other O‘ahu hospitals closed operations in mid-December of 2011.
EMS data is included in certain chapters (motor vehicle crashes, falls and assaults) for which there werediscreet injury codes in the EMS data collection system. EMS personnel document the use of protectiveequipment (seat belts and helmets) and the approximate time and location of the injury, elements whichare lacking from the more population-based HHIC data. Patient use of alcohol and drugs is also noted in EMS data, either by patient admission, the smell of alcohol on the breath, or physical evidence (e.g.bottles, drug paraphernalia, etc.) at the scene. However, since use of “drugs” is not specific, only the EMScharacterization of patient alcohol use is examined. To avoid double-counting of individual patients,those who were transferred to another EMS unit were excluded from analyses. Patients who refusedtransport to hospitals (or released at the scene) and those who were dead upon EMS arrival or who diedwhile in EMS care were included, however, to provide a full description of the effects of protective factorsor alcohol use.
A grant from the Hawai‘i Department of Transportation (DOT) enabled the linkage of 2007 EMS recordsrelated to motor vehicle crashes to DOT, HHIC, and FARS, and death certificate records. EMS recordswere linked to DOT, FARS and death certificate records probabilistically, on the basis of time, date, andlocation of the crash, and patient age, gender and seating position. This product was then linked toHHIC records by deterministic methods using patient identifiers, including name and date of birth.This linked dataset provided examination of the effect of protective devices (as described by EMS, DOTand FARS) with the ultimate medical disposition of the patients (as described by HHIC records anddeath certificates).
More complete and test-based results of toxicology were available from the Hawai‘i Trauma Registry (HTR).The HTR includes data from the 7 main trauma centers in the state. Data was available for the 2008 to2011 period, but 6 of the trauma centers did not begin contributing data until 2009. HTR data was included to provide a description of substance use among patients who had nonfatal (although serious)injuries from a variety of mechanisms. To avoid double-counting, the results of HTR patients who weretransferred at discharge were excluded. Patients who died, either in the ED or after hospitalization, were included, to examine associations between substance use and mortality for injuries where these relationships are not better described through other data systems (e.g. motor vehicle deaths and FARS).
Most of the injury rates have been standardized for age distribution, by the direct method, using the U.S. 2000 standard population (Anderson & Rosenberg, 1998). Sixteen age groups were used for standardization across all ages, although certain calculations were restricted to more narrow age ranges.Statistical tests were conducted with t-tests for continuously distributed variables (e.g. patient age) andchi-squared tests for categorical variables (e.g. patient gender). Some trends (described as “significant”or “non-significant”) were formally assessed using Poisson regression (Clayton & Hills, 1993). Rate differences were tested using different techniques, depending on sample size and use of age standardiza-tion (Dever, 1984). All statistical significance testing was conducted at the 95% confidence level.
Appendix B: Data Sources and Methods

60 Appendices
ADRC – Adult Disability Resources Centers
ASIST – Applied Suicide Intervention Skills Training
BRFSS – Behavioral Risk Factor Surveillance System
CDC – Centers for Disease Control and Prevention
CHOW Project – Community Health Outreach Work to Prevent AIDS project
DOH – Hawai‘i State Department of Health
DPS – Department of Public Safety
DOT – Hawai‘i State Department of Transportation
DUI – Driving under the influence (alcohol or drugs)
E-code – External cause of injury codes within the ICD-9 system
ED – Emergency Department
EMS – Emergency Medical Services
EMSIPSB – Emergency Medical Services and Injury Prevention Systems Branch, within DOH
FARS – Fatal Analysis Reporting System
GDL – Graduated Driver’s Licensing
HACDAC –Hawai‘i Advisory Commission on Drug Abuse and Controlled Substances
HEMSIS – Hawai‘i Emergency Medical Services Information System
HHIC – Hawai‘i Health Information Corporation
HIPP – Hawai‘i Injury Prevention Plan
HMSA – Hawai‘i Medical Service Association (Hawai‘i’s Blue Cross Blue Shield)
ICD-9-CM – International Classification of Diseases, 9th Revision, Clinical Modifications
ICD-10 – International Classification of Diseases, 10th Revision
IOM – Institute of Medicine
IPAC – Injury Prevention Advisory Committee
IPCS – Injury Prevention and Control Section, within DOH EMSIPS Branch
KIPC – Keiki (childhood) Injury Prevention Coalition
LGBT – Lesbian, Gay, Bisexual and Transgendered
MCHB – Maternal and Child Health Branch, within DOH
NHTSA – National Highway Traffic Safety Administration
PDMP – Prescription Drug Monitoring Program
PSHTF – Prevent Suicide Hawai‘i Task Force
SAMHSA – Substance Abuse and Mental Health Services Administration
STD/AIDS – STD/AIDS Prevention Branch, within DOH
WIC – Women, Infant and Children Services Branch, within DOH
YRBSS – Youth Risk Behavior Surveillance System
Appendix C: Acronyms

61Appendices
Anderson, R.N. & Rosenberg, H.M. (1998). Age standardization of death rates: Implementation of the year 2000 standard. National vital statistics reports; 47(3). Hyattsville, MD: National Center forHealth Statistics.
Centers for Disease Control and Prevention (2002). External cause of injury mortality matrix. Retrieved from: http://www.cdc.gov/nchs/data/ice/icd10_transcode.pdf
Centers for Disease Control and Prevention. (2011a). Policy Impact: Prescription painkiller overdoses.Atlanta, GA: Centers for Disease Control and Prevention, National Center for Injury Prevention and Control.
Centers for Disease Control and Prevention (2007, February 1). Recommended framework of E-code groupings for presenting injury mortality and morbidity data. Retrieved from:http://www.cdc.gov/ncipc/whatsnew/matrix2.htm
Centers for Disease Control and Prevention. (2011b). Vital Signs: Overdoses of prescription opioid pain relievers—United States, 1999-2008. Morbidity and Mortality Weekly Report (MMWR), 60, 1-6.
Clayton, D. & Hills, M. (1993). Statistical Models in Epidemiology. New York: Oxford University Press.
Dever G.E.A. (1984). Epidemiology in Health Services Management. Rockville, MD: Aspen Systems Corporation.
Dill, D.L., Wells-Parker E., & Soderstrom CA. (2004). The emergency care setting for screening and intervention for alcohol use problems among injured and high-risk driver: A review. Traffic SafetyPrevention, 5, 278-291.
Foreman, M. (2009). Preventable injuries burden state budgets. National Conference of State Legislatures Legisbrief, 17(3). Denver, CO: National Conference of State Legislatures.
Injury Surveillance Workgroup (2003). Consensus Recommendations for Using Hospital Discharge Data for Injury Surveillance. Atlanta, GA: State and Territorial Injury Prevention Directors Association.
Liu, B.C., Ivers, R., Norton ,R., Boufous, S., Blows S., & Lo, S.K. (2008). Helmets for preventing injury in motorcycle riders. The Cochrane Database of Systematic Reviews: Issue 1.
National Archive of Criminal Justice. (2010). Uniform Crime Reporting Data: Supplementary homicide reports. Retrieved from: http://www.icpsr.umich.edu/cocoon/NACJD/STUDY/27650.xml
National Highway Traffic Safety Administration. (2011). Countermeasures that work: A highway safety countermeasure guide for state highway safety offices. 6th Edition. Washington, DC: US Departmentof Transportation, National Highway Traffic Safety Administration.
National Highway Traffic Safety Administration (n.d.). Fatal analysis reporting system web-based encyclopedia [database on the Internet]. Retrieved from: http://www-fars.nhtsa.dot.gov/
National Highway Traffic Safety Administration. (2012a). Fatality Analysis Reporting System. Retrieved from: http://www.nhtsa.gov/FARS.
National Highway Traffic Safety Administration. (2012b). Traffic Safety Facts 2010 Data. Washington DC: US Department of Transportation, National Center for Statistics and Analysis.
Appendix D: References
62 Appendices
Ohio Injury Prevention Partnership (2010). Ohio Recommendations for the Prevention of Prescription Drug Misuse, Abuse, and Overdose. Prescription Drug Abuse Action Group. Retrieved from: http://www.healthyohioprogram.org/vipp/drug/~/media/9CCCF5BCF8CA4AA494CF1FDE325441C0.ashx
Quan, L., Bennett E., & Branche C. (2007). Interventions to prevent drowning. In L. Doll, S. Bonzo, J. Mercy, D. Sleet (Eds.), Handbook of Injury and Violence Prevention. Atlanta, GA: Centers for Disease Control and Prevention, National Center for Injury Prevention and Control.
Runyan C.W., & Stephens Stidham, S. (2009) Core Competencies for Injury and Violence Prevention. Injury Prevention, 15,141.
Safe States Alliance. (2003). Safe States, 2003 Edition. Atlanta, GA: State and Territorial Injury Prevention Directors Association.
Safe States Alliance. (2009). Injury and violence prevention are essential to US health reform. http://www.safestates.org/associations/5805/files/IVP%20and%20Health%20Reform%20%20Safe%20States%206%2009%20update%206%2010.pdf
Saul, J., Duffy, J., Noonan, R., Lubell, K., Wandersman, A., Flaspohler, P., Stillman, L., Blachman, M., & Dunville, R. (2008). Bridging science and practice in violence prevention: Addressing ten key challenges. American Journal of Community Psychology, 41, 197-205.
Solomon, M.G., Chaudchary, N.K, & Cosgrove, L.A. (2003). May 2003 Click It or Ticket Safety Belt Mobilization Evaluation Final Report. Washington, DC: US Department of Transportation, National Highway Traffic Safety Administration.
Solomon, M.G., Ulmer, R.G., & Preusser, D.F. (2002). Evaluation of Click It or Ticket Model Programs. Washington DC: US Department of Transportation, National Highway Traffic Safety Administration.
Ulmer, R.G. & Preusser D.F. (2003). Evaluation of the repeal of motorcycle helmet laws in Kentucky and Louisiana. Publication No. DOT HS 809 530. Washington, DC: US Department of Transportation,National Highway Safety Administration.
US Census Bureau. (2012). Population estimates datasets [database on the Internet]. Retrieved from: http://www.census.gov/popest/data/datasets.html
World Health Organization (2007). WHO report on falls prevention in older age. Geneva, Switzerland: World Health Organization Press.
World Health Organization (2002). World report on violence and health. Geneva, Switzerland: World Health Organization Press.
Appendix D: References
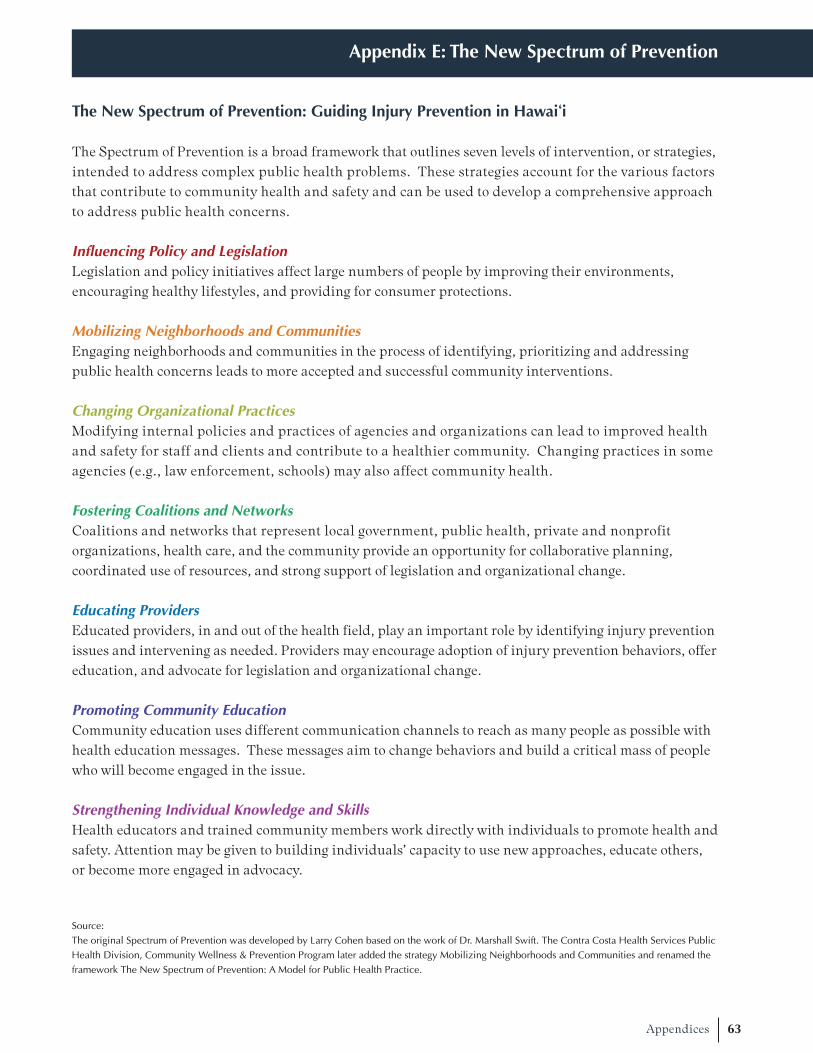
63Appendices
The New Spectrum of Prevention: Guiding Injury Prevention in Hawai‘i
The Spectrum of Prevention is a broad framework that outlines seven levels of intervention, or strategies,intended to address complex public health problems. These strategies account for the various factorsthat contribute to community health and safety and can be used to develop a comprehensive approachto address public health concerns.
Influencing Policy and LegislationLegislation and policy initiatives affect large numbers of people by improving their environments, encouraging healthy lifestyles, and providing for consumer protections.
Mobilizing Neighborhoods and CommunitiesEngaging neighborhoods and communities in the process of identifying, prioritizing and addressingpublic health concerns leads to more accepted and successful community interventions.
Changing Organizational PracticesModifying internal policies and practices of agencies and organizations can lead to improved healthand safety for staff and clients and contribute to a healthier community. Changing practices in someagencies (e.g., law enforcement, schools) may also affect community health.
Fostering Coalitions and NetworksCoalitions and networks that represent local government, public health, private and nonprofitorganizations, health care, and the community provide an opportunity for collaborative planning, coordinated use of resources, and strong support of legislation and organizational change.
Educating ProvidersEducated providers, in and out of the health field, play an important role by identifying injury preventionissues and intervening as needed. Providers may encourage adoption of injury prevention behaviors, offereducation, and advocate for legislation and organizational change.
Promoting Community EducationCommunity education uses different communication channels to reach as many people as possible withhealth education messages. These messages aim to change behaviors and build a critical mass of peoplewho will become engaged in the issue.
Strengthening Individual Knowledge and SkillsHealth educators and trained community members work directly with individuals to promote health andsafety. Attention may be given to building individuals’ capacity to use new approaches, educate others,or become more engaged in advocacy.
Source:The original Spectrum of Prevention was developed by Larry Cohen based on the work of Dr. Marshall Swift. The Contra Costa Health Services PublicHealth Division, Community Wellness & Prevention Program later added the strategy Mobilizing Neighborhoods and Communities and renamed theframework The New Spectrum of Prevention: A Model for Public Health Practice.
Appendix E: The New Spectrum of Prevention
64 Acknowledgements
The Hawai‘i State Department of Health, Injury Prevention and Control Section (IPCS) would like tothank the hundreds of individuals and organizations who have contributed to the development of theHawai‘i Injury Prevention Plan, 2012-2017. IPCS would especially like to thank the Injury PreventionAdvisory Committee (IPAC) and the IPAC Steering Committee for their continued feedback and supportthroughout the development process.
Several groups were instrumental to this process, including the: Strategic Highway Safety Core andSteering Committees, Fall Prevention Consortium, Prevent Suicide Hawai‘i Task Force, and HawaiianLifeguard Association. IPCS also worked with several public health professionals, including facilitators,researchers, writers and an editor who helped refine these recommendations and chapters. IPCS extendsits sincere appreciation to the following individuals for their expertise and assistance: Kathryn Braun,Valerie Yontz, Lily Bloom Domingo, Jeanelle Sugimoto-Matsuda, Jane Chung-Do, Deborah Goebert,Dan Yahata, and Krista Hopkins Cole.
Please note that partner organizations are acknowledged in each injury chapter.
IPAC membersAaron ArakakiKathleen BakerJeny BissellDavid ChengEvan ChingKrista Hopkins ColeTim DaytonPatricia DukesGeila FukumitsuDeborah Goebert*Ralph Goto*Robyn HasegawaLarissa HickokAudrey InabaPatricia Jones
Sally JonesElzy Kaina*Robert Kane**Pua Kaninau-SantosDavid KingdonGerald KosakiSusan LaFountaineSherry LauerBruce McEwan*Lee NaganoDavid NakamaejoLisa NakaoPamela NeffCarly PetersenKaren Peterson
Susan SakaiMaggie SamsonCora SpeckAlicia StewartCheryl StiglmeierEric Tash*Wendy Van de WaalJeanne VaveSharon VitousekMyra Williams*Stephanie YeeCharlene Young**
*Current IPAC Steering Committee member**Former IPAC Steering Committee member
DOH EMSIPSB and IPCS staffLinda RosenTherese Argoud Kari BenesRobin Argue DerbesDaniel GalanisNancy KernStanley MichaelsRose OlaivarDebra Sanders
Acknowledgements
Neil AbercrombieGovernor, State of Hawai‘i
Loretta J. Fuddy, ACSW, MPH Director of Health, Hawai‘i State Department of Health
Published by:Hawai‘i State Department of HealthEmergency Medical Services & Injury Prevention System BranchInjury Prevention and Control Section
For more information:Phone: 808-733-9320Website: www.nogethurt.hawaii.gov
Funded by:The U.S. Centers for Disease Control and Prevention (CDC)
This publication was produced by the Injury Prevention and Control Section and supported by the U.S. Centers for Disease Control and Prevention (CDC) through the Public Health Injury Surveillance and Prevention Program Grant (Cooperative Agreement #U17CE924764), Core Violence and Injury Prevention Program Grant (Cooperative Agreement #U17CE002025) and the Preventive Health and Health Services Block Grant.
August 2012