Embed Size (px)
Citation preview

HAS THE WORLD TRADE ORGANIZATION PROMOTED
SUCCESSFUL REGIONAL TRADE AGREEMENTS?
Jason H. Granta,* , Christopher F. Parmetera
a Dept. of Agricultural & Applied Economics, Virginia Polytechnic Institute and State University, Blacksburg, VA, USA
Abstract The Committee on Regional Trade Agreements (CRTA) of the World Trade Organization (WTO) is charged with monitoring, examining, and ensuring the compliance of notified RTAs. Our comprehensive dataset on regional integration reveals that almost half (44%) of all agreements in existence (up to 2005) are neither notified nor accounted for in the RTA database published by the WTO. We exploit variation in the notification status of an RTA to test whether the WTO has fostered successful RTAs. After an extensive empirical search, we find very little evidence that notified RTAs, which are subject to conformity reviews and compliance standards, trade more than non-notified agreements. In fact, we find just the opposite. Non-notified RTAs significantly outperform their notified counterparts. This surprising result is robust to a number of empirical specifications and various subsets of the data. The results are not particularly encouraging because they suggest that current WTO rules and compliance standards may actually impede the effectiveness of regional integration.
September 17, 2008
* Tel.: +1 540 231 7559; fax: +1 540 231 7417. E-mail address: [email protected]

1
1. Introduction
Andrew Rose’s (2004) finding that the General Agreement on Tariffs and Trade (GATT)
and its successor, the World Trade Organization (WTO), has not promoted trade among its
signatories came as a big surprise given that increased global trade is one of the great success
stories since the GATT entered into force more than 50 years ago. The fact that Rose (2004)
found an insignificant (and even negative) impact on trade between countries that are party to the
WTO across a number of empirical specifications was puzzling. Why would the leaders of the
global economy (both developed and developing) promote membership into an organization that
failed to deliver on the promise of freer trade? Indeed, Rose (2004, page 112) concludes that this
result is “... an interesting mystery.”
A growing body of literature has developed to explain or overturn this result (Subramian
and Wei 2007; Tomz, Goldstein, and Rivers 2006; Felbermayr and Kohler 2006; Herz and
Wagner 2006; Chang and Lee 2007; Li 2007; Engelbrecht and Pearce 2004). A few insights are
worth noting. First, a positive and significant trade flow effect of the GATT/WTO can be found
if we ignore developing and least-developed countries. Subramian and Wei (2007) exclude
developing and least-developed countries from the analysis because these countries undertook
smaller trade liberalization commitments and did not participate fully in the GATT/WTO rounds.
Second, Rose’s result can be overturned if we alter the control group by which WTO
membership is judged. Tomz, Goldstein, and Rivers (2006) find a positive trade flow effect of
the GATT/WTO by considering countries that participated informally. Finally, the GATT/WTO
can produce positive results if one excludes heavily protected sectors such as agriculture and
textiles (Engelbrecht and Pearce 2004).
2
Clearly, the GATT/WTO can clearly deliver positive effects on trade. However, it
appears that we have to select on certain commodity sectors, developed countries, or alternative
membership status. Yet we know a priori where the GATT/WTO has worked well and where it
has not, so conditioning on these factors is not the most convincing argument to promote the
overall success of the institution. Indeed, Rose (2006) notes succinctly that “…the GATT/WTO
has worked well if you ignore its failures” (i.e. developing countries or agricultural trade) (p.9).
While the question of whether the GATT/WTO facilitates members’ multilateral trade
continues to be debated, it might be worthwhile to consider whether the GATT/WTO has
successfully promoted trade through other channels. One such channel is to consider trade on a
regional scale, that is, within regional trade agreements (RTAs). Rules governing the formation
and implementation of RTAs fall under the purview of Article XXIV of the GATT/WTO,
whereas the task of verifying compliance and assessing the effectiveness of RTAs is entrusted to
the Committee on Regional Trade Agreements.1 Growth in the number of RTAs over the last 15
years has exploded. The latest numbers from the WTO indicate some 205 agreements in force as
of July 2007. For this reason the WTO created the CRTA in 1996, to help monitor, evaluate, and
ensure the compliance of RTAs with Article XXIV.2
The GATT/WTO recognizes that expanding world trade may be considerably easier
through regional integration and may complement the multilateral process.3 RTAs tend to have
deeper coverage, extending into areas such as investment, services, domestic policy, and non-
1 The majority of RTAs are notified under GATT Article XXIV covering trade in goods, but there are other Articles that apply to the formation of regional trade agreements. RTAs encompassing trade in services can be established under Article V of the General Agreement on Trade in Services (GATS), and RTAs incorporating developing countries can be notified under the Enabling Clause of Article XXIV. 2 By monitoring, evaluating and compliance, we mean the CRTA works to promote increased trade by ensuring that policy barriers are reduced or eliminated on “substantially” all trade within the RTA and that RTA implementation (i.e. phase-in) periods are being met (exceeding 10 years only under exceptional circumstances). 3 The preamble to GATT Article XXIV which governs the formation and implementation of regional trade agreements for trade in goods states: "…the expansion of world trade that may be made by closer integration between the economies of the parties to such agreements.”

3
tariff issues compared to simple tariff concessions negotiated within the WTO (Crawford and
Laird 2000). Moreover, regional integration typically occurs much faster than the multilateral
process because it involves fewer negotiating parties.
In this article we ask an alternative policy question related to the GATT/WTO: has the
GATT/WTO promoted successful regional trade agreements? We develop an original dataset
covering some 290 RTAs that have entered into force since 1960. A remarkable feature of the
data reveals that 43 percent of all regional agreements in existence up to 2005 (customs unions,
free trade areas, partial scope agreements, and accession free trade agreements), are neither
notified, nor accounted for in the RTA database published by the WTO. Yet the capacity of the
GATT/WTO to foster successful RTAs is limited to those agreements that are actually notified to
the CRTA. Thus, we exploit variation in the notification status of an RTA to test
econometrically whether the GATT/WTO has cultivated successful RTAs through CRTA
compliance reviews and implementation procedures enshrined in Article XXIV.4
We expect notified RTAs to be more successful than non-notified agreements for several
reasons. First, the data shows that non-notified RTAs tend to be partial scope in nature whereas
most notified agreements are free trade areas (and customs unions).5 Second, the CRTA believes
that non-notified agreements exist because of: (i) difficulties in reducing or eliminating trade
barriers on “substantially” all trade as spelled out in Article XXIV; (ii) protracted negotiations
covering politically sensitive sectors; and (iii) prolonged implementation and transitional periods
4 Article XXIV is the main GATT agreement that covers customs unions and free trade areas and the associated rules for reducing or eliminating trade barriers, the timeframe from which to do so, and the treatment of trade barriers affecting nonmember countries. 5 It is difficult to find an exact definition of partial scope agreements. However, just as its name suggests, partial scope agreements involve only “partial” commitments among members to reduce and harmonize border policies within the RTA.
4
of trade liberalization that are inconsistent with Article XXIV.6 Third, notified RTAs must
undergo a mandatory compliance review by the CRTA. The committee then makes
recommendations if RTAs are inconsistent with Article XXIV. Non-notified RTAs are under no
obligations and there are no provisions within the WTO rules to counter non-notification of
RTAs.
From the WTO’s perspective, the success of a growing list of complicated and far-
reaching RTAs hinges on two factors: (i) whether the agreement complies with the rules of
implementation enshrined in Article XXIV; and (ii) whether the agreement is notified so that the
CRTA can conduct mandatory reviews to ensure conformity. All RTAs involving WTO
members require notification (WTO 2000). Yet as the CRTA notes in its “Synopsis” relating to
systematic issues of regional trading arrangements (WTO 2000): “… a large number of RTAs
today in force have not been notified to the WTO. This hinders any comprehensive and precise
evaluation of RTAs,” (p. 9). The examination of RTAs by the CRTA serves three purposes.
First, RTA members submit documentation describing the implementation process and this is
viewed as promoting greater transparency and facilitates a better understanding of RTAs.
Second, RTA examination ensures the RTA’s consistency with the relevant rules of the
GATT/WTO. Finally, RTA examination allows the CRTA to generate appropriate
recommendations to the parties involved (WTO 2000).7
If CRTA is correct in its assessment, then we would expect to see notified RTAs
significantly outperforming their non-notified counterparts. After an extensive empirical search
however, we find very little evidence that the trade flow effects of notified RTAs is greater than
6 The CRTA recently confirmed this (non-notification) as one of its “Systematic Issues Relating to Regional Trade Agreements” (WTO 2007). The committee is well aware that there are numerous RTAs in existence that have never been notified to the WTO. 7 It is useful to note that RTA examinations can not be launched until the RTA is formally notified to the CRTA of the GATT/WTO.

5
non-notified RTAs. In fact, we find just the opposite which begs the following question: what is
the WTO doing wrong?
The remainder of the paper is laid out as follows. Section two summarizes the emergence
and trends of notified and non-notified RTAs since 1960. Section three develops the econometric
model. Section four discusses the data used in this study and section five presents the results.
Section six concludes and provides two possible explanations for our results.
2. Trends in RTAs by Notification Status
Regional Trade Agreements are now a ubiquitous feature of global trade. In July of
2007, the CRTA recognized 205 regional trade agreements in force.8 This is up from 180
agreements in 2003, less than 100 agreements in 1995, and just 40 agreements in 1990. Since the
advent of the WTO in 1995, the CRTA has received an average of 11 notifications per year -
almost one per month - and many WTO Members are participating in multiple RTAs (Crawford
and Fiorentino 2005).
A careful review of the empirical literature estimating the trade flow effects of RTAs
reveals that trade increases among RTA members can hardly be taken for granted. In fact, the
simple question of whether RTAs stimulate trade among members has motivated an explosion in
the number of ex post econometric analyses using the gravity equation (Frankel 1997; Wei and
Frankel 1996; Soloaga and Winters 1999; Krueger 2000; BB; Grant and Lambert 2008).
Conflicting reports abound as highlighted in recent studies by Baier and Bergstrand (B&B 2007),
Ghosh and Yamarik (2004) and Grant and Lambert (2008). Thus, an important policy question
is not whether RTAs have created or diverted trade categorically (i.e., the EU, NAFTA, ASEAN,
8 Of the 205 RTAs currently in force, 128 agreements have been notified under GATT Article XXIV as either free trade areas or customs unions; 25 agreements are notified under the Enabling Clause and an additional 52 agreements cover trade in services under GATS Article V.

6
etc.), but can we identify factors that have ensured successful RTAs? A natural starting point is
the WTO since it oversees the formation and implementation regional integration.
Both the number of RTAs and the share of global trade occurring within RTAs have
increased steadily since the first wave of regionalism began in the 1960’s. To see this, figure 1
plots the share of (real) international trade occurring within RTAs. In 1960, just 13 percent of
world trade occurred within RTAs. Sixty-nine percent of this share occurred between the
original EU member countries; 23 percent occurred between the original EFTA members; and
the remaining eight percent occurred between the non-notified Canada-Australia preferential
agreement. By 1980, 21 percent of international trade occurred within RTAs. Again, the EU,
which is now composed of nine members, makes up 71 percent of this total. By 2005, the share
of RTA trade more than doubled with over half of all trade (52%) taking place within RTAs.9
The EU, now encompassing 25 member countries, accounts for 40 percent of this share. For
comparison purposes, in 2005, 82 percent of all trade occurs between WTO members.
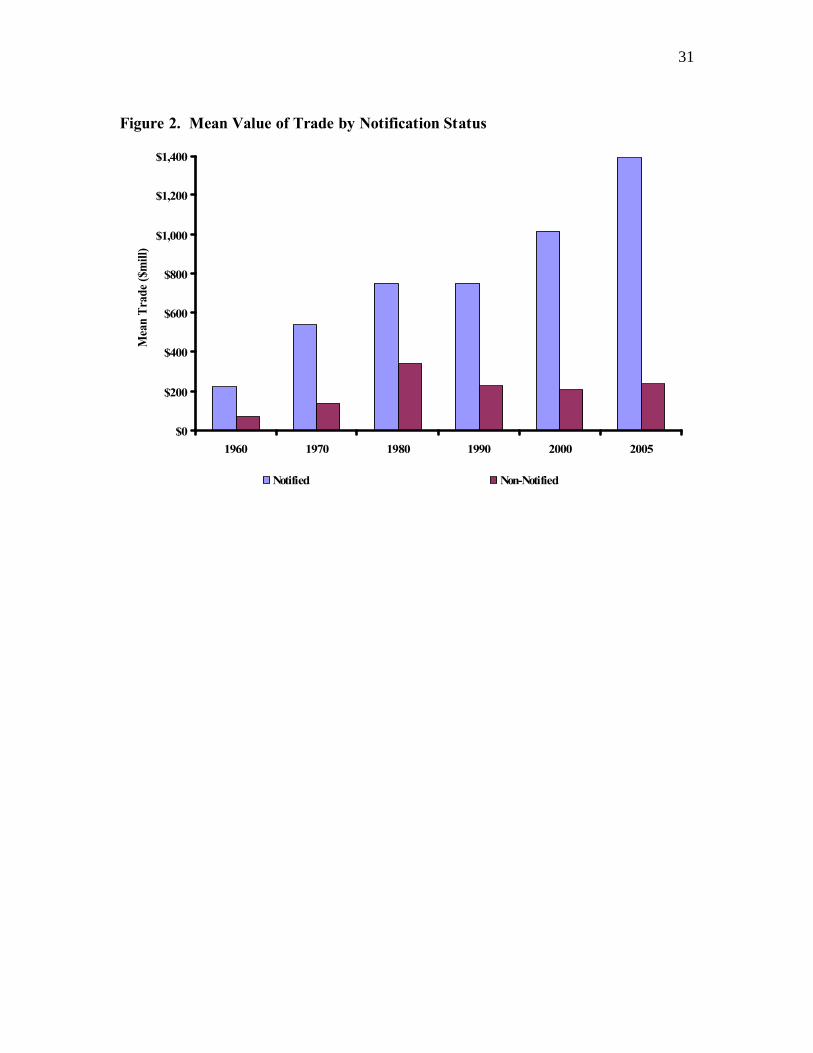
In figure 2, we report the mean value of trade by notification status and year. This is the
first indication of how notified RTAs have performed compared to their non-notified
counterparts. What is interesting about figure 2 is that in every year the mean value of trade
between members of an RTA that is notified to the WTO is significantly greater than the mean
value of trade between members of a non-notified agreement. However reporting mean trade
flows across categories can be problematic. First, simple averages do not control for country
size or trade barriers, nor does it control for cultural affinities and geographic characteristics that
may promote or impede trade flows. To address this question formally we need an empirical
model of trade flows which we develop shortly. Second, the mean value of notified and non-
9 The share of world trade occurring within RTAs reported in this study (i.e., in 2005) may differ from that of the WTO because a large number of non-notified RTAs are incorporated into the analysis.

7
notified trade could reflect a difference in the scale of these RTAs. Notified RTAs may cosist of
larger regional blocs (> 3 members) whereas non-notified RTAs could be bilateral agreements
with only two members. Third, there could be a “WTO effect” whereby more countries chose to
notify their RTA just prior to and after the advent of the WTO in 1995 so that the share of RTA
trade taking place inside non-notified RTAs declined in the 1990’s (Figure 2). Non-notified
RTA trade increased during the period 1960-1980, but fell thereafter. Finally, the decline in
non-notified RTA trade could be due to the fact that many of these agreements are only partial
scope in nature.
To gain additional insight into these factors, figure 3 reports the number of RTAs by
notification status and year in our database. Also plotted on the secondary vertical axis is the
number of bilateral RTAs in force, defined as those RTAs encompassing only two members.
The recent proliferation in the number of RTAs is evident. In 1960, only three RTAs existed,
two of which, the European Free Trade Agreement (EFTA) and the original European Union
(EU), were notified to the GATT/WTO. The only non-notified RTA in existence in 1960 was
the partial scope (bilateral) agreement between Canada and Australia.10 By 1990, 50 regional
trade agreements were in existence. However, only 21 of these agreements were notified to the
GATT/WTO. For notified RTAs, our database is consistent with the 21 notified RTAs
recognized by the WTO in 1990 (see Fiorentino, Verdeja, and Toqueboeuf 2006). In 2005, the
last year for which we have data, there were 160 notified RTAs and 126 non-notified RTAs.
Compared with 1990, the increase in the total number of RTAs is 272 percent. Remarkably
however, the number of notified RTAs increased by a factor of almost eight, while non-notified
agreements increased more than four-fold.
10 Details on the Canada-Australia trade agreement can be found on the Australian Customs Service website: http://www.customs.gov.au/site/page.cfm?u=4401
8
What is also evident in Figure 3 is the surge in the number of bilateral RTAs. For
example, in 1990, there were 25 bilateral RTAs in force (i.e., those agreements involving only
two members), or roughly 50 percent of the total number of RTAs (25/50). By 2005, the number
of bilateral RTAs increased seven-fold from 25 bilateral agreements to 178. Moreover, bilateral
RTAs now make up the largest share -- 61 percent (178/290) -- of the total number of notified
and non-notified RTAs in world trade.
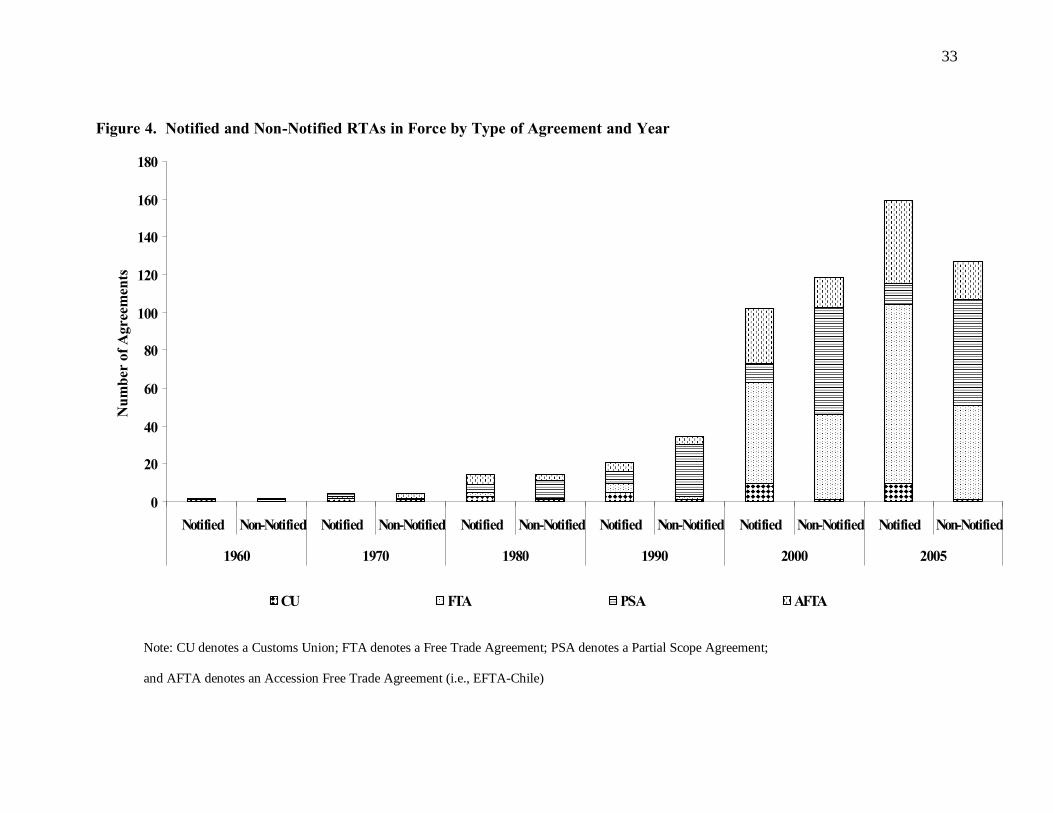
Finally, figure 4 illustrates the structure of notified and non-notified RTAs by year and
type of RTA (customs unions (CU), free trade agreements (FTA), partial scope agreements
(PSA) and accession free trade agreements (AFTA)). A few important trends are worth noting.
First, very few CUs are signed and entered into force over the sample period 1960-2005,
reflecting the fact the CUs are far more difficult to negotiate both politically and economically.
In 2005, a total of eleven different CUs existed in world trade – ten of which are notified to the
WTO and one that is not notified (South African Customs Union (SACU)). Second, for notified
RTAs, the majority of agreements in world trade are FTAs, whereas non-notified agreements are
dominated by PSAs. In 2005 for example, 94 of the notified RTAs are FTAs compared to just
eleven for notified PSAs (figure 4). For non-notified RTAs in 2005, 56 agreements were PSAs
compared to 50 FTAs and 20 AFTAs, while in 1990, non-notified PSAs totaled 27 compared to
just two FTAs and 4 AFTAs. Thus, although PSAs make up the largest share of non-notified
RTAs, non-notified FTAs and AFTAs are becoming more prevalent.
This section has illustrated some important trends in the total number and trade shares of
all RTAs in existence since 1960. The WTO notifications summarizing RTA formation include
only those RTAs that are notified to the CRTA. Our database considers 290 RTAs. In 2005, the
final year of our sample, 126 RTAs are classified as non-notified implying that almost half

9
(126/290=43%) of all RTAs are neither notified nor accounted for in the RTA database
published by the WTO.11 This is a significant improvement over previous studies and the RTA
database published by the WTO.12 . However, this qualitative summary is limited because it
can not answer the central question in this article: has the WTO cultivated successful RTAs? In
what follows, we develop a formal model of trade flows to answer this question. On the surface
however, the CRTA examination and compliance standards appear to be working well.
3. Gravity Econometrics
The gravity equation has become the workhorse for empirical econometric studies of
trade flows. Developed by Tinbergen (1962), the gravity model is akin to Newton’s law of
universal gravitation, whereby larger and closer countries trade more with one another than
smaller and more distant countries. In its basic form, the gravity model predicts that trade flows
from country i to country j are proportional to the multiplicative interaction (in levels) of each
country’s size, often measured by GDP, and inversely proportional to the distance between them.
Denoting trade flows from i to j as Tij , GDP of country i (j) as Yi (Yj) and the distance between
country i and j as Dij, the gravity model for trade is formalized as:
(1) 3210
ββββ ijjiij DYYT =
where, β0, β1, β2, and β3 are unknown parameters.
While the theory assumes a physical relationship for trade between countries, economic
forces may prohibit a universal set of coefficients for which the relationship holds. To
11 Our findings are consistent with Medvedev (2006) in a recent World Bank survey of RTAs. 12 For example, B&B (2007) provide the most comprehensive analysis of the effects of RTAs on trade to date. However, their analysis incorporated 60 RTAs, all of which are notified to the GATT/WTO. Similarly, Grant and Lambert (2008) accounted for 64 agreements notified to the GATT/WTO. Interestingly, Rose (2004) included just ten regional trade agreements in his study of the effects of the GATT/WTO on trade.
10
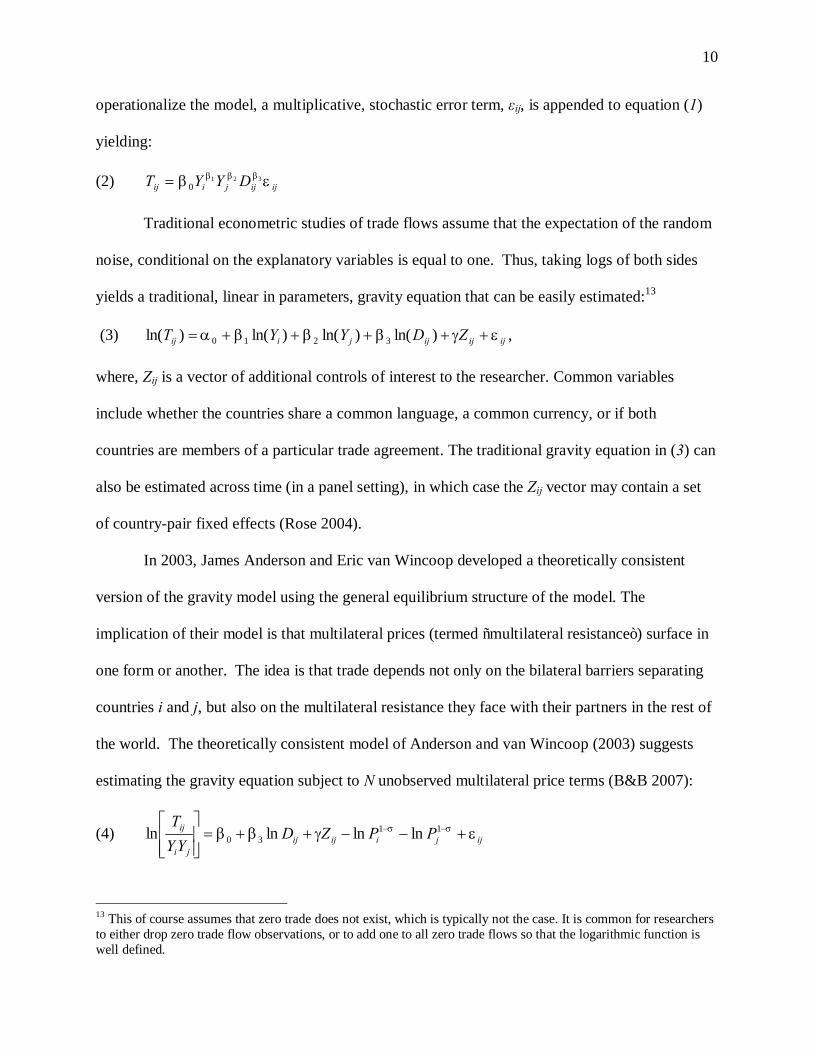
operationalize the model, a multiplicative, stochastic error term, εij, is appended to equation (1)
yielding:
(2) ijijjiij DYYT εβ βββ 3210=
Traditional econometric studies of trade flows assume that the expectation of the random
noise, conditional on the explanatory variables is equal to one. Thus, taking logs of both sides
yields a traditional, linear in parameters, gravity equation that can be easily estimated:13
(3) ijijijjiij ZDYYT εγβββα +++++= )ln()ln()ln()ln( 3210 ,
where, Zij is a vector of additional controls of interest to the researcher. Common variables
include whether the countries share a common language, a common currency, or if both
countries are members of a particular trade agreement. The traditional gravity equation in (3) can
also be estimated across time (in a panel setting), in which case the Zij vector may contain a set
of country-pair fixed effects (Rose 2004).
In 2003, James Anderson and Eric van Wincoop developed a theoretically consistent
version of the gravity model using the general equilibrium structure of the model. The
implication of their model is that multilateral prices (termed “multilateral resistance”) surface in
one form or another. The idea is that trade depends not only on the bilateral barriers separating
countries i and j, but also on the multilateral resistance they face with their partners in the rest of
the world. The theoretically consistent model of Anderson and van Wincoop (2003) suggests
estimating the gravity equation subject to N unobserved multilateral price terms (B&B 2007):
(4) ijjiijijji
ij PPZDYY
Tεγββ σσ +−−++=
−− 11
30 lnlnlnln
13 This of course assumes that zero trade does not exist, which is typically not the case. It is common for researchers to either drop zero trade flow observations, or to add one to all zero trade flows so that the logarithmic function is well defined.

11
subject to i = 1…N equilibrium conditions:
(5) ∑=
+−− ⋅
=
N
i
ZD
W
iii
ijijeYYPP
1
ln11 3 γβσσ
where, YW denotes world GDP (constant across countries); σ−1iP and σ−1
jP are exporter and
importer price indices (i.e., the multilateral resistance terms), respectively; and σ is the elasticity
of substitution between varieties (i.e., countries).
The general equilibrium structure of Anderson and van Wincoop’s (2003) model is
different from the traditional gravity equation in (3) due to the explicit role for σ−1iP and σ−1
jP , and
the restriction of the income coefficients to unity. Because the multilateral price terms are largely
unobservable, the authors use a nonlinear least squares procedure to recover unbiased estimates
of model’s parameters. However, a computationally easier method to control for the multilateral
resistance terms in the cross-section is to estimate equation (4) using exporter (i) and importer (j)
fixed effects (Anderson and van Wincoop 2003; Feenstra 2004).14 In a panel data setting, the
multilateral price terms are potentially time varying so the use of country-by-time (it, jt) fixed
effects is more appropriate (B&B 2007). This is the approach applied here.
4. Data
The data sources for the majority of our gravity equation variables are standard. The
dependent variable is the natural log of bilateral import flows from country i (the exporter) to
country j (the importer). Bilateral trade flows (Tijt) at five-year intervals in U.S. dollars from
1950-2005 are taken from the International Monetary Fund’s (IMF’s) Direction of Trade
Statistics (DOTS). The IMF’s DOTS covers 206 reporting and partner countries. This type of
14 Note that the inclusion of importer and exporter fixed effects in the cross-section mean that one can drop those variables that are specific to each importer (i.e. GDPi and GDPj ). Thus, we are left with all country-pair specific effects that are of interest.

12
country coverage is essential because it allows us to incorporate a large number of non-notified
RTAs. Real trade flows (Tijt) in ($1000) U.S. dollars are calculated by deflating bilateral trade
flows by the American Consumer Price Index (CPI) available from the Bureau of Labor
Statistics.15
Gross Domestic Product (GDP) data (in US dollars) are obtained from two primary
sources: the World Bank (WB) Development Indicators database; and the United Nations (UN)
National Accounts. GDP data from the International Monetary Fund’s (IMF) Financial
Statistics Yearbook and the Penn World Tables are used to supplement WB and UN data when it
is incomplete or missing (IMF 2005).16
Distance, contiguity and common language indicators are taken from the Centre
d’Etudes Prospectives et d’Informations Internationales (CEPII) geo-distance dataset (Mayer
and Zignago 2006).17 CEPII uses the great circle formula to calculate the geographic distance
between countries, referenced by latitudes and longitudes of the largest urban agglomerations in
terms of population.
Beyond the construction of a database with standard gravity equation covariates, an
important contribution of this study is the development of a comprehensive database of RTAs
spanning over 45 years (1960-2005). Some 290 bilateral and regional trading agreements
(counting the numerous European Union expansions as a single RTA) that were signed and
entered into force up to 2005 are accounted for in the database.18 This is a critical feature of this
15 http://data.bls.gov/cgi-bin/surveymost?cu 16 WB Development Indicators Data can be accessed (with subscription) at: http://ddp-ext.worldbank.org/ext/DDPQQ/member.do?method=getMembers&userid=1&queryId=135, and UN GDP data can be retrieved at: http://unstats.un.org/unsd/snaama/dnllist.asp. Penn World Tables can be accessed at the Center for International Comparisons at the University of Pennsylvania’s website: http://pwt.econ.upenn.edu/ 17 CEPII is an independent European research institute on the international economy stationed in Paris, France. CEPII’s research program and datasets can be accessed at www.cepii.com. 18 We actually have 296 RTAs in the database. However, six of these concern the numerous expansions of the original EU agreement.
13
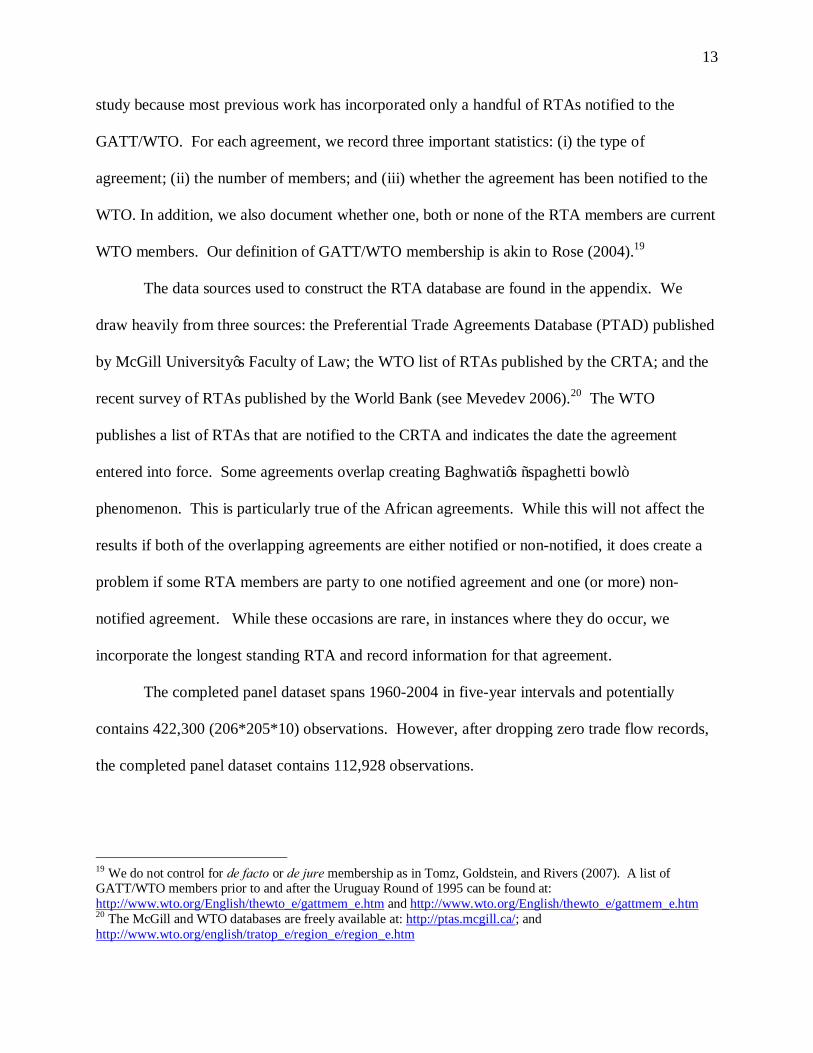
study because most previous work has incorporated only a handful of RTAs notified to the
GATT/WTO. For each agreement, we record three important statistics: (i) the type of
agreement; (ii) the number of members; and (iii) whether the agreement has been notified to the
WTO. In addition, we also document whether one, both or none of the RTA members are current
WTO members. Our definition of GATT/WTO membership is akin to Rose (2004).19
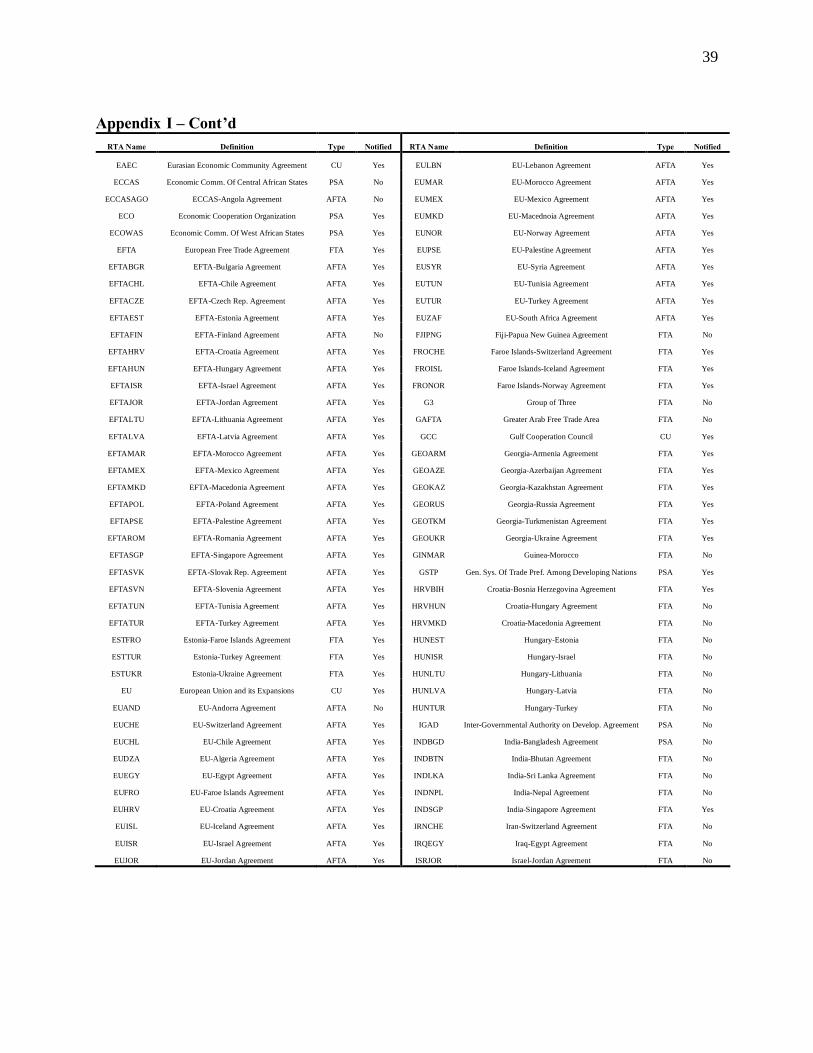
The data sources used to construct the RTA database are found in the appendix. We
draw heavily from three sources: the Preferential Trade Agreements Database (PTAD) published
by McGill University’s Faculty of Law; the WTO list of RTAs published by the CRTA; and the
recent survey of RTAs published by the World Bank (see Mevedev 2006).20 The WTO
publishes a list of RTAs that are notified to the CRTA and indicates the date the agreement
entered into force. Some agreements overlap creating Baghwati’s “spaghetti bowl”
phenomenon. This is particularly true of the African agreements. While this will not affect the
results if both of the overlapping agreements are either notified or non-notified, it does create a
problem if some RTA members are party to one notified agreement and one (or more) non-
notified agreement. While these occasions are rare, in instances where they do occur, we
incorporate the longest standing RTA and record information for that agreement.
The completed panel dataset spans 1960-2004 in five-year intervals and potentially
contains 422,300 (206*205*10) observations. However, after dropping zero trade flow records,
the completed panel dataset contains 112,928 observations.
19 We do not control for de facto or de jure membership as in Tomz, Goldstein, and Rivers (2007). A list of GATT/WTO members prior to and after the Uruguay Round of 1995 can be found at: http://www.wto.org/English/thewto_e/gattmem_e.htm and http://www.wto.org/English/thewto_e/gattmem_e.htm 20 The McGill and WTO databases are freely available at: http://ptas.mcgill.ca/; and http://www.wto.org/english/tratop_e/region_e/region_e.htm

14
5. Results
The results are organized in two main sections. In section one we test whether the
GATT/WTO has cultivated successful RTAs using cross-section and panel data methods and
allowing for separate effects based on the notification status of an RTA. Cross-section
regressions are estimated at five-year intervals from 1950-2005. In the panel regressions, we test
the same hypothesis using log level data but include additional controls for the implementation
and phase-in period of an RTA (Grant and Lambert 2008; B&B 2007). This is particularly
important since almost all RTAs are phased-in over 10 to 15 year time periods. Moreover, if the
CRTA is correct in its assessment that non-notified RTAs are not reporting their agreements to
the WTO because of difficulties with implementation or reductions in trade barriers, then it
seems reasonable to gauge how these agreements are progressing relative to those RTAs which
are notified to the WTO. Section two provides a set of robustness checks by conditioning on the
development level of RTA members (i.e., North-North, North-South, South-South) and the size
of the agreement (i.e., the number of members).
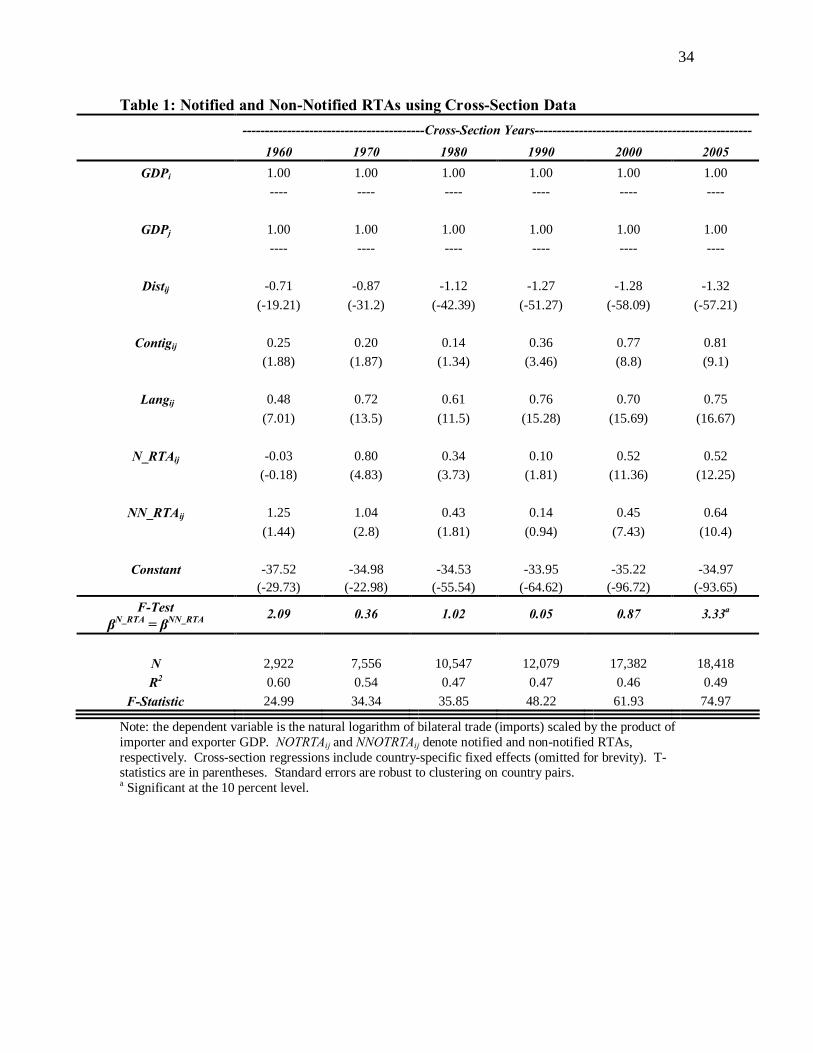
RTA Notification Using Cross-Sectional Data
Table 1 contains our cross-section results. The default specification is theoretically
consistent gravity equation that uses country-specific fixed effects and scales trade flows by the
product of importer and exporter GDPs (Feenstra 2004; Anderson and van Wincoop 2003). The
cross-section gravity model is estimated at five-year intervals from 1960-2005 using ordinary
least squares and standard errors that are robust to clustering on country pairs. In each regression
we allow for separate coefficients for notified (N_RTAij) and non-notified (NN_RTAij) RTAs and
test for any significant differences between the two. If the WTO’s committee on regional trade
15
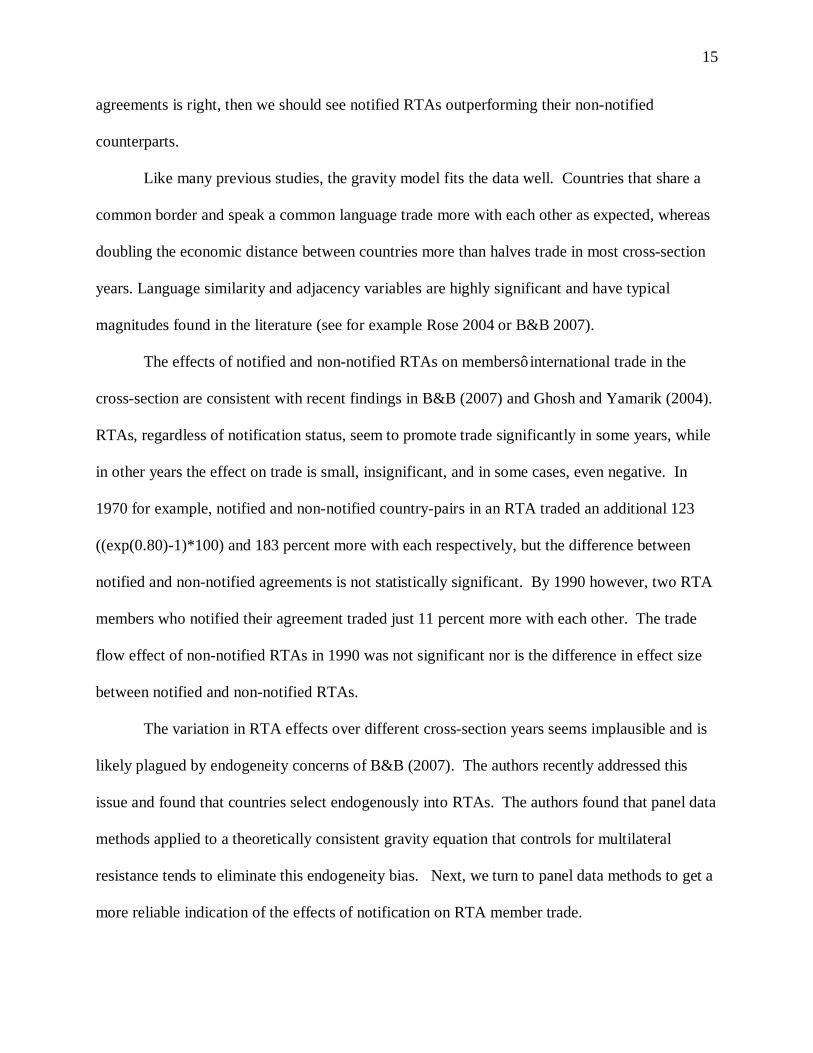
agreements is right, then we should see notified RTAs outperforming their non-notified
counterparts.
Like many previous studies, the gravity model fits the data well. Countries that share a
common border and speak a common language trade more with each other as expected, whereas
doubling the economic distance between countries more than halves trade in most cross-section
years. Language similarity and adjacency variables are highly significant and have typical
magnitudes found in the literature (see for example Rose 2004 or B&B 2007).
The effects of notified and non-notified RTAs on members’ international trade in the
cross-section are consistent with recent findings in B&B (2007) and Ghosh and Yamarik (2004).
RTAs, regardless of notification status, seem to promote trade significantly in some years, while
in other years the effect on trade is small, insignificant, and in some cases, even negative. In
1970 for example, notified and non-notified country-pairs in an RTA traded an additional 123
((exp(0.80)-1)*100) and 183 percent more with each respectively, but the difference between
notified and non-notified agreements is not statistically significant. By 1990 however, two RTA
members who notified their agreement traded just 11 percent more with each other. The trade
flow effect of non-notified RTAs in 1990 was not significant nor is the difference in effect size
between notified and non-notified RTAs.
The variation in RTA effects over different cross-section years seems implausible and is
likely plagued by endogeneity concerns of B&B (2007). The authors recently addressed this
issue and found that countries select endogenously into RTAs. The authors found that panel data
methods applied to a theoretically consistent gravity equation that controls for multilateral
resistance tends to eliminate this endogeneity bias. Next, we turn to panel data methods to get a
more reliable indication of the effects of notification on RTA member trade.
16
RTA Notification using Panel Data Methods
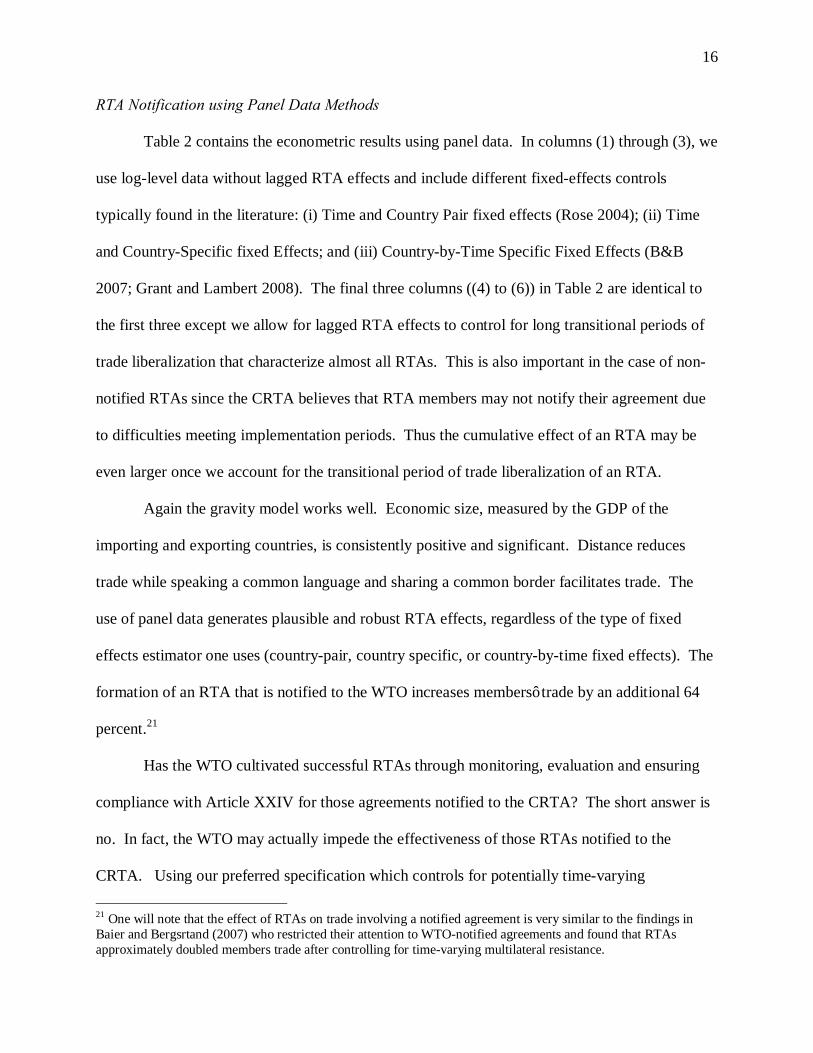
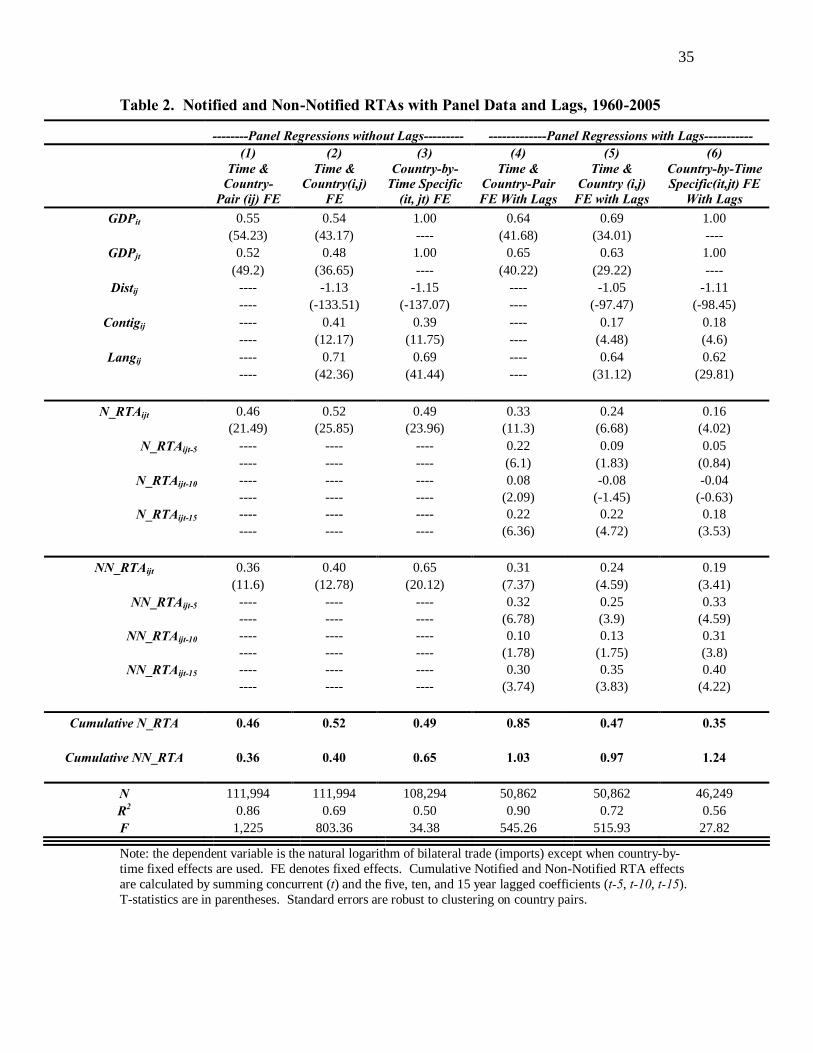
Table 2 contains the econometric results using panel data. In columns (1) through (3), we
use log-level data without lagged RTA effects and include different fixed-effects controls
typically found in the literature: (i) Time and Country Pair fixed effects (Rose 2004); (ii) Time
and Country-Specific fixed Effects; and (iii) Country-by-Time Specific Fixed Effects (B&B
2007; Grant and Lambert 2008). The final three columns ((4) to (6)) in Table 2 are identical to
the first three except we allow for lagged RTA effects to control for long transitional periods of
trade liberalization that characterize almost all RTAs. This is also important in the case of non-
notified RTAs since the CRTA believes that RTA members may not notify their agreement due
to difficulties meeting implementation periods. Thus the cumulative effect of an RTA may be
even larger once we account for the transitional period of trade liberalization of an RTA.
Again the gravity model works well. Economic size, measured by the GDP of the
importing and exporting countries, is consistently positive and significant. Distance reduces
trade while speaking a common language and sharing a common border facilitates trade. The
use of panel data generates plausible and robust RTA effects, regardless of the type of fixed
effects estimator one uses (country-pair, country specific, or country-by-time fixed effects). The
formation of an RTA that is notified to the WTO increases members’ trade by an additional 64
percent.21
Has the WTO cultivated successful RTAs through monitoring, evaluation and ensuring
compliance with Article XXIV for those agreements notified to the CRTA? The short answer is
no. In fact, the WTO may actually impede the effectiveness of those RTAs notified to the
CRTA. Using our preferred specification which controls for potentially time-varying
21 One will note that the effect of RTAs on trade involving a notified agreement is very similar to the findings in Baier and Bergsrtand (2007) who restricted their attention to WTO-notified agreements and found that RTAs approximately doubled members trade after controlling for time-varying multilateral resistance.

17
multilateral resistance using country-by-time fixed effects and no lags (column (3)), the effect of
notified RTAs is to increase members’ trade by 64 percent. However, the trade flow effect of a
non-notified RTA is to increase members’ trade by 92 percent – an increase of almost 30
percentage points over RTAs notified to the WTO. This difference is also statistically
significant.
While the above result provides some initial insight on how WTO-notified RTAs
compare to non-notified RTAs, it does not account for the phase-in period of an RTA (B&B
2007). It may take several years, or even longer than a decade before the trade flow effects of
RTAs are measurable. Moreover, the CRTA believes that members of non-notified RTAs are
choosing not to notify their agreements to the WTO for fear of being incompliant with
GATT/WTO rules relating to trade liberalization commitments and implementation periods
stretching well beyond ten years. This is also one of the main reasons why the majority of non-
notified RTAs are categorized as partial scope agreements as figure 4 illustrated.
Columns (4) through (6) estimate identical fixed effects gravity models but control for 15
years of RTA phase-in using three dummy variable lags for notified and non-notified
agreements. The results are striking. After 15 years of RTA phase-in, two RTA members of a
non-notified agreement increased trade by an average of 245 percent compared to just 28 percent
for notified agreements when we specify a country-by-time fixed effects gravity model (column
(6)). In other words, non-notified RTAs which are presumably struggling with implementation
and trade liberalization issues exceeded WTO-notified agreements by a factor of more than
eight! Moreover, a test of equality of notified and non-notified RTA effects is strongly rejected
in all three specifications that control for implementation and phase-in (columns (4)-(6)).
18
This surprising result is also robust. Estimating a traditional panel data gravity equation
with time and country-pair fixed effects (column (4)) as in Rose (2004), or a smaller version of
the model that controls for time-invariant multilateral resistance using country specific fixed
effects delivers the same basic result. For example, with time invariant country-specific fixed
effects (column (5)) non-notified RTAs increased members’ trade by 164 percent compared to
60 percent for notified agreements. This is a difference of more than 100 percentage points and is
highly significant at all conventional levels.
RTA Notification by Development Status
Why would non-notified RTAs, many of which are partial scope in nature, appear to be
outperforming their notified counterparts which are predominantly free trade agreements? In this
section we test the robustness of this puzzling result by conditioning on the level of development
of the country-pairs in notified and non-notified RTAs. Subramanian and Wei (2006) found a
large positive WTO effect when restricting their sample to developed countries because these
countries participated more actively in the WTO negotiations. A simialr story may hold in the
formation and implementation of an RTA. Developed countries may participate more actively in
the trade liberalization and implementation commitments of an RTA since these provisions are
monitored by the WTO (i.e., the CRTA). Table 3 reports the results after sub-setting on three
levels of development: (i) North-North trade; (ii) North-South trade; and (iii) South-South trade.
Again our preferred specification of the gravity model uses country-by-time fixed effects and
separate RTA coefficients for notification status. Each regression is estimated twice, once with
phase-ins and once without.
Aside from the typical gravity equation estimates, does the level of development of the
country-pair affect the degree to which RTA notification impacts trade flows? The answer is a

19
resounding no. In all but one development category (South-South, no phase-ins), RTAs that
have never been notified to the WTO, have not been subject to compliance standards of GATT
Article XXIV, and are generally partial scope in nature, appear to increase members’ trade on a
scale that is not seen in notified RTAs (typically free trade areas). What is also interesting is
that non-notified RTAs outperform notified agreements even when we do not account for
implementation and phase-in. In the log-level panel data scenario above, notified and non-
notified agreements performed similarly in terms of increasing members’ trade when we did not
account for implementation and phase-in periods. However, when we condition on the
development status of country pairs, notifying the RTA to the WTO actually impedes the
performance of the RTA.
For Trade involving industrial countries (North-North), the numbers suggest that notified
RTAs increase members’ trade by a modest 14 percent in the concurrent period (i.e., no phase-
ins) and actually decreases slightly to a nine ((exp(0.09)-1)*100) percent increase after
controlling for implementation (Table 3). For non-notified regional agreements the respective
trade increases are 70 ((exp(0.53)-1)*100) and 73 ((exp(0.55)-1)*100) percent. Moreover, the
difference in effect sizes between notified and non-notified agreements are significant with and
without phase-ins. Similar magnitudes appear when we slice the data according to North-South
trade flows. Interestingly, the difference between notified and non-notified agreements
decreases when RTA member trade flows between low-income countries (South-South). In the
concurrent period (no phase-ins) the formation of an RTA that is notified to the WTO and
involves trade between two lower-income countries increased trade by 125 percent ((exp(0.81)-
1)*100) compare to 84 percent for non-notified RTAs involving lower-income countries.
RTA Notification and the Scale of the Agreement

20
Are there any notified RTAs that are seeing the trade increases found in non-notified
agreements? Figure 4 illustrated that many of the non-notified agreements are simple bilateral
RTAs involving two members. It may be much easier to negotiate the trade increases we’ve
witnessed among non-notified agreements if the RTA involves just two members. As we’ve
seen with the WTO negotiations, its much harder to get consensus on trade liberalization and
implementation issues with 151 members as it is with just two members. To be absolutely sure
that the results are not driven by the scale of the RTA, we estimate several additional regressions
that condition on the size of the RTA (in terms of the number of negotiating members). That is,
given the comprehensiveness of our RTA database, we have enough RTAs (and therefore trade
flow variation) to identify the trade flow effects of notified and non-notified RTAs by the
number of RTA members.
Table 4 presents the results after estimating a gravity model that distinguishes between
the sizes of an RTA as measured by the number of members. Five different RTA sizes are
evaluated: (i) RTAs with two members; (ii) RTAs with three to five members; (iii) RTAs with
six to ten members; (iv) RTAs with 11 to 20 members; and (v) RTAs with greater than 20
members. Again we run each regression twice, once using a concurrent RTA dummy variable
for notified and non-notified agreements, and once with lagged RTA effects to control for
implementation and phase-in.
We also report the results from a regression that drops all bilateral RTAs. This is
important because if the majority of non-notified RTAs involve just two members, whereas
notified RTAs tend to include blocs of three or more members, then we might expect non-
notified RTAs to do a better job of increasing members’ trade if there are significant
coordination costs as membership increases. To be absolutely sure that the large trade increases

21
of non-notified RTAs compared to notified agreements discussed above is not driven by any
scale effects with respect to RTA size, we estimate a regression that excludes all bilateral RTAs,
both notified and non-notified. The final column in Table 4 drops small (and potentially
insignificant), as Subramanian and Wei (2007) did. Following these authors, we exclude trade
flows less than $500,000 from the analysis as a final robustness check.
The results are robust. It appears that non-notified RTAs are significantly outperforming
notified agreements despite monitoring and examination efforts of notified RTAs by the WTO to
ensure RTA compliance. Moreover, this finding is unrelated to the size of the RTA. Ignoring
the final column in Table 4 which drops small trade values, the simple average effect sizes across
all 12 regressions (two for each subset of RTA size) regarding the number of members in the
RTA reveals that non-notified agreements have increased members’ trade by an average of 209
((exp(1.13)-1)*100) percent. This compares to an increase of just 47 ((exp(0.38)-1)*100)
percent for notified agreements. The only case in which we find an effect size for notified RTAs
that is slightly greater than non-notified agreements is for RTAs that include three to five
members. However, when we control for implementation and phase-in using RTA lags, a simple
test of the difference between notified and non-notified agreements for RTAs encompassing
three to five members can not be rejected.
In all other cases, including the exclusion of all bilateral RTAs column, non-notified
agreements significantly outperform their notified counterparts. Moreover, there are large and
statistically significant differences between notified and non-notified agreements across RTA
sizes. If coordination and RTA implementation is costly to negotiate, then we might expect
RTAs involving two members to have the largest effect on members’ trade. However, our
results suggest this is not the case. Notified bilateral RTAs (two members) increased members’

22
trade by 25 ((exp(0.22)-1)*100) percent in the concurrent period but this effect falls to nearly
zero after 15 years of phase-in. Similarly, non-notified RTAs involving just two members
increased trade by 86 ((exp(0.62)-1)*100) percent in the concurrent period before falling to an
increase of 63 percent after 15 years of implementation. While this may suggest that bilateral
RTAs are having difficulties with implementation compared to larger RTA blocs, it may also
reflect the fact that the increase in trade within bilateral RTAs is more immediate. In other
words, controlling for RTA phase-in may not be as important with bilateral agreements.
Interestingly, trade within larger, non-notified RTA blocs of six to ten members or 11 to
20 members seems to generate the largest increase in members’ trade. RTA members belonging
to a non-notified regional bloc with six to ten members traded an astonishing 18 times
(exp(2.94)) more with each other holding other factors constant. In contrast to bilateral RTAs,
most of the increase (over 80 percent) in non-notified RTA trade occurred during the final five
years of a 15 year implementation period. What is puzzling is that the trade flow effect of
notified RTA blocs with six to ten members is negative and significant in the ten and 15 year
implementation period (N_RTAijt-10 and N_RTAijt-15). It wouldn’t be that much of a concern if
notified RTA blocs increased trade during the concurrent or five-year lagged period, but this is
not the case. There is no trade flow increase during the first five years of implementation and
negative and significant decreases in trade during the ten and 15 year period of implementation
results in a negative cumulative effect for notified agreements with six to ten members (Table 4).
Similarly large trade increases are obtained when we look at non-notified agreements that
encompass 11 to 20 members, even when we do not control for RTA phase-in. Again however,
non-notified RTAs are significantly outperforming notified agreements. This is not to say that
there is no trade flow effect of notifying an agreement to the WTO because as the results show,

23
notified RTAs are performing reasonably well such as RTAs with 11 to 20 members. The effect
on trade of a notified agreement that encompasses 11 to 20 members is 118 ((exp(0.78)-1)*100)
percent without adjusting for phase-ins. However, this compares to 180 percent effect for non-
notified agreements.
Even when we drop small trade flows less than $0.5 million, the results are robust.
6. Conclusions
Despite all the hype about the successfulness of the GATT/WTO in facilitating global
trade, Rose (2004) claims that most of the increase in world trade can be explained by various
natural factors with little role for the GATT/WTO. A growing body of literature soon followed.
Remarkably however, the 14 or so studies that attempt to overturn Rose (2004) have relied on
various subsets of the data, more elaborate econometric specifications, or more disaggregated
commodity sectors.22 It turns out that the GATT/WTO can deliver positive results if one is
willing to select on certain commodity sectors, developed countries, or alternative membership
status. Yet we know a priori where the GATT/WTO has not worked well, so conditioning on
these areas to generate a positive ‘WTO effect’ is not the most convincing argument to promote
the overall success of the institution.
For these reasons, we set out to determine whether there are other areas in which the
GATT/WTO has worked well (without conditioning on its failures). One area is through
regional trade agreements. In other words, has the GATT/WTO fostered successful regional
trade agreements? This issue is particularly important because RTAs are receiving an
unprecedented amount of attention from international trade economists and are demanding a
growing amount of political resources. There are now more RTAs in existence than there are
22 Andrew Rose’s website documents the studies that have attempted to explain or overturn his original finding (see http://faculty.haas.berkeley.edu/arose/RecRes.htm#GATTWTO)
24
WTO members and the recent collapse of the WTO negotiations, now in its eighth year of
negotiations, will only increase the impetus for countries to negotiate regionally. Moreover,
RTAs are an attractive policy tool because they often address a much wider range of topics
concerning trade liberalization and usually involve fewer negotiating parties compared to the
multilateral process of the WTO.
We exploited variation in the notification status of an RTA to determine whether Article
XXIV and CRTA compliance mechanisms have promoted successful RTAs. However, the
ability of the CRTA to promote effective RTAs is limited to those agreements which are notified
to the WTO. We claim that RTa members may chose not to notify their agreement fro three
reasons. First, non-notification may be a strategic choice. RTA members may know a priori
that the agreement is incongruent with the rules of Article XXIV. Second, not notifying the
RTA may be a pragmatic choice. RTA members may need additional time to address complex
issues that are politically sensitive to at least some members. This is particularly relevant in the
case of large “plurilateral” agreements, or RTAs that attempt to provide deeper integration by
liberalizing non-tariff barriers including technical standards, food safety concerns, investment
and competition policy; areas where the WTO has made very little progress. Finally, RTA
members may choose not to notify for fear that some provisions governing the multilateral
framework may trump RTA rules.
Remarkably our dataset covering an exhaustive list of RTAs in existence up to 2005
reveals that almost half (43%) of these agreements have never been notified to the CRTA, nor
are they recognized in the WTO database of RTAs. The CRTA is charged with monitoring and
ensuring the compliance of notified RTAs with Article XXIV governing trade in goods. Regional
trade agreements are not an exception to the GATT/WTO rules. Just as the GATT/WTO works
25
to ensure Members are meeting the provisions of nearly 40 Articles under its purview, the
institution also works to ensure that RTAs are meeting the provisions of Article XXIV.
However, the effectiveness of the GATT/WTO in ensuring successful RTAs is limited to those
agreements that are actually notified to the CRTA.
After several empirical exercises using the gravity model, we find very little evidence
that notified RTAs, which are subject to CRTA examination and compliance standards, have
increased trade more than non-notified agreements. Whether WTO members chose to notify
their agreement to the WTO may be a strategic choice. The CRTA believes that RTA members
chose not to notify their agreement because of difficulties meeting implementation periods, and
more importantly, reducing barriers to trade on substantially all trade within the agreement.
Moreover, we show that many of the non-notified agreements are partial scope in nature
compared to notified agreements which tend to be free trade areas. If the CRTA’s assessment is
right, then one might expect that notified agreements outperform non-notified agreements.
Has the GATT/WTO cultivated successful RTAs? Our results suggest that the answer to
this question is a resounding no! In almost every empirical specification, we find that non-
notified agreements increase members’ trade more than notified agreements. In fact, current
WTO examination and compliance standards may actually impede the effectiveness of notified
agreements. This is not to say that RTAs that are notified to the WTO are not liberalizing and
increasing members’ trade. In many of our panel specifications, notified RTAs expand
members’ trade by an average of 63 percent (without phase-in periods). However, the trade flow
effect of a non-notified RTA is 92 percent. When we add phase-in periods to the panel data
analysis, the difference is eve larger. Controlling for 15 years of RTA implementation and

26
phase-in periods, notified RTAs increased members’ trade by an average of 42 percent compared
to an increase of 245 percent for non-notified agreements.
The obvious question is: why? If notified RTAs are subject to examination and
compliance standards that ensure aggressive trade liberalization, then what is the hold up? There
are at least two reasons why non-notified RTAs may do a much better job of increasing RTA
member trade; the first relates to CRTA examination process and the second relates to the
multilateral process of the WTO. The CRTA has been plagued by continued disagreement about
the interpretation of the rules governing RTAs enshrined in Article XXIV. Clem Boonekamp,
Director of the Trade Policies Review Division of the WTO notes: “... keeping track of the
number, type, scope and more importantly, the effectiveness and compliance of RTAs remains
an elusive task” (WTO 2007). Specifically, there is no consensus among Members and the
CRTA of the meaning of “substantially all trade” when referring to trade barrier reductions
within an RTA. There is also no consensus on what a “reasonable length of time” means when
referring to implementation periods of an RTA. The CRTA
The second reason why non-notified RTAs increase members’ trade more than notified
agreements relates to pre-existing distortions. Non-notified agreements may include a larger
proportion of non-WTO members with relatively high trade barriers. If non-notified RTAs are
successful in eliminating or significantly reducing these large pre-existing distortions, this could
generate a large trade response. Another way of stating this is the multilateral trade liberalization
process of the GATT/WTO may work well. If notified agreements contain a large number of
WTO members whose trade barriers have been reduced over time, then further reductions in
trade barriers through regional integration may not impact trade flows to the degree we see in
non-notified RTAs. However, our results suggest that there is considerable scope for
27
strengthening GATT/WTO rules that govern RTAs or developing more effective CRTA
compliance mechanisms to ensure that future RTAs are in fact successful.
References
Aitken, N.D. 1973. “The Effect of the EEC and EFTA on European Trade: A Temporal Cross-Section Analysis.” American Economic Review 63(5): 881-892.
Anderson, J.E., and E. van Wincoop. 2003. “Gravity with Gravitas: A Solution to the Border
Puzzle.” American Economic Review 93(1): 170-92. Baier, S.L., and J.H. Bergstrand. 2007. “Do Free Trade Agreements Actually Increase
Members’ International Trade?” Journal of International Economics 71(1): 72-95. Brada, J.C., and J.A. Mendez. 1985. “Economic Integration among Developed, Developing and
Centrally Planned Economies: A Comparative Analysis.” Review of Economics and Statistics 67(4): 549-56.
Crawford, J., and R. Fiorentino. 2005. “The Changing Landscape of Regional Trade
Agreements,” WTO Discussion Paper No.8, World Trade Organization, Geneva. Crawford, J.A. and S. Laird. 2000. “Regional Trade Agreements and the WTO,” CREDIT
Research Paper No. 00/3, CREDIT School of Economics, University of Nottingham, Nottingham, UK, March.
28
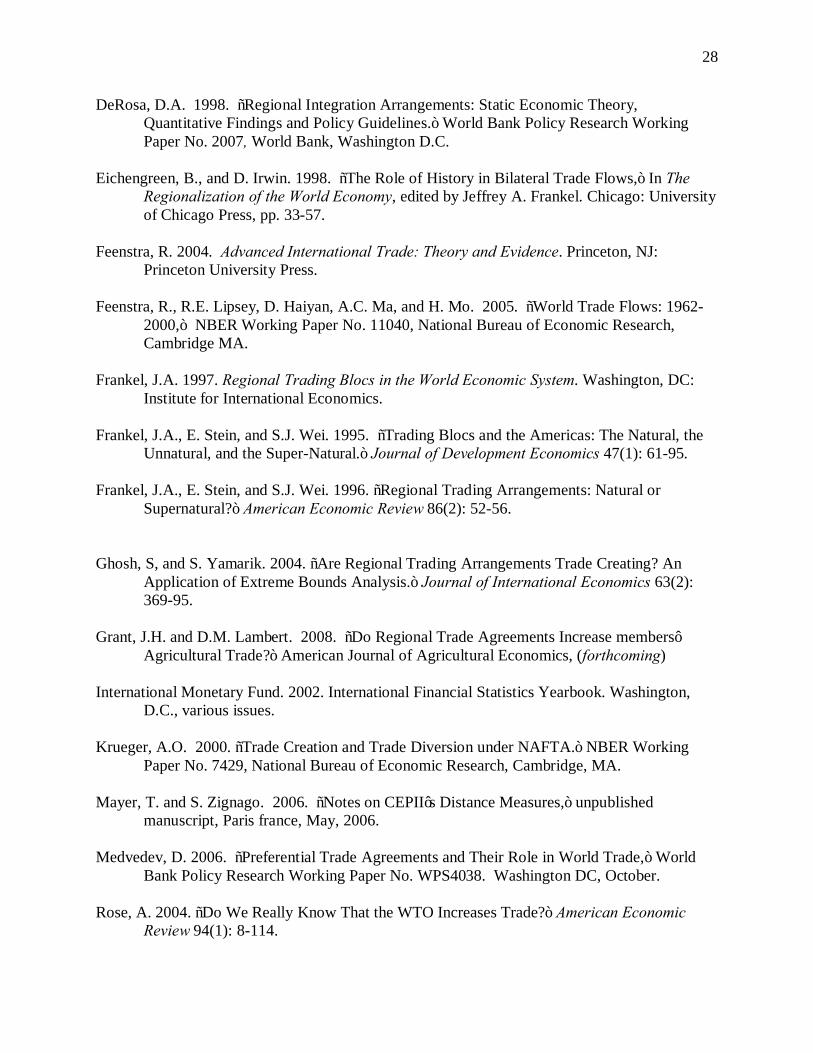
DeRosa, D.A. 1998. “Regional Integration Arrangements: Static Economic Theory, Quantitative Findings and Policy Guidelines.” World Bank Policy Research Working Paper No. 2007, World Bank, Washington D.C.
Eichengreen, B., and D. Irwin. 1998. “The Role of History in Bilateral Trade Flows,” In The
Regionalization of the World Economy, edited by Jeffrey A. Frankel. Chicago: University of Chicago Press, pp. 33-57.
Feenstra, R. 2004. Advanced International Trade: Theory and Evidence. Princeton, NJ:
Princeton University Press. Feenstra, R., R.E. Lipsey, D. Haiyan, A.C. Ma, and H. Mo. 2005. “World Trade Flows: 1962-
2000,” NBER Working Paper No. 11040, National Bureau of Economic Research, Cambridge MA.
Frankel, J.A. 1997. Regional Trading Blocs in the World Economic System. Washington, DC:
Institute for International Economics. Frankel, J.A., E. Stein, and S.J. Wei. 1995. “Trading Blocs and the Americas: The Natural, the
Unnatural, and the Super-Natural.” Journal of Development Economics 47(1): 61-95. Frankel, J.A., E. Stein, and S.J. Wei. 1996. “Regional Trading Arrangements: Natural or
Supernatural?” American Economic Review 86(2): 52-56. Ghosh, S, and S. Yamarik. 2004. “Are Regional Trading Arrangements Trade Creating? An
Application of Extreme Bounds Analysis.” Journal of International Economics 63(2): 369-95.
Grant, J.H. and D.M. Lambert. 2008. “Do Regional Trade Agreements Increase members’
Agricultural Trade?” American Journal of Agricultural Economics, (forthcoming) International Monetary Fund. 2002. International Financial Statistics Yearbook. Washington,
D.C., various issues. Krueger, A.O. 2000. “Trade Creation and Trade Diversion under NAFTA.” NBER Working
Paper No. 7429, National Bureau of Economic Research, Cambridge, MA. Mayer, T. and S. Zignago. 2006. “Notes on CEPII’s Distance Measures,” unpublished
manuscript, Paris france, May, 2006. Medvedev, D. 2006. “Preferential Trade Agreements and Their Role in World Trade,” World
Bank Policy Research Working Paper No. WPS4038. Washington DC, October. Rose, A. 2004. “Do We Really Know That the WTO Increases Trade?” American Economic
Review 94(1): 8-114.

29
Soloaga, I. and A.L. Winters. 1999. “How has regionalism in the 1990s Affected Trade?” World
Bank Policy Research Working Paper No. 2156, Washington, D.C. Tinbergen, J. 1962. Shaping the World Economy. New York: The Twentieth Century Fund. World Bank. World Development Indicators, CD-ROM. Washington, DC: World Bank, 2001.

30
Figure 1. Share of International Trade Occurring under RTAs
0%
10%
20%
30%
40%
50%
60%
70%
80%
90%
100%
1950 1955 1960 1965 1970 1975 1980 1985 1990 1995 2000 2005
Shar
e of R
TA T
rade
'
Share of Trade Occuring Under RTAs
31
Figure 2. Mean Value of Trade by Notification Status
$0
$200
$400
$600
$800
$1,000
$1,200
$1,400
1960 1970 1980 1990 2000 2005
Mea
n Tr
ade (
$mill
)
'
Notified Non-Notified

32
Figure 3. Notified and Non-Notified RTAs in Force and Bilateral Agreements
0
50
100
150
200
250
300
1960 1970 1980 1990 2000 2005
Num
ber o
f RTA
s
'
0
10
20
30
40
50
60
70
80
90
100
Num
ber o
f Bila
teral
RTAs
'
Notified Non-Notified Bilaterals Notified Bilaterals Non-Notified
Note: the term “Bilaterals” refers to regional trade agreements that involve only two members
33
Figure 4. Notified and Non-Notified RTAs in Force by Type of Agreement and Year
0
20
40
60
80
100
120
140
160
180
Notified Non-Notified Notified Non-Notified Notified Non-Notified Notified Non-Notified Notified Non-Notified Notified Non-Notified
1960 1970 1980 1990 2000 2005
Num
ber
of A
gree
men
ts
'
CU FTA PSA AFTA
Note: CU denotes a Customs Union; FTA denotes a Free Trade Agreement; PSA denotes a Partial Scope Agreement;
and AFTA denotes an Accession Free Trade Agreement (i.e., EFTA-Chile)
34
Table 1: Notified and Non-Notified RTAs using Cross-Section Data -----------------------------------------Cross-Section Years------------------------------------------------- 1960 1970 1980 1990 2000 2005
GDPi 1.00 1.00 1.00 1.00 1.00 1.00 ---- ---- ---- ---- ---- ----
GDPj 1.00 1.00 1.00 1.00 1.00 1.00 ---- ---- ---- ---- ---- ----
Distij -0.71 -0.87 -1.12 -1.27 -1.28 -1.32 (-19.21) (-31.2) (-42.39) (-51.27) (-58.09) (-57.21)
Contigij 0.25 0.20 0.14 0.36 0.77 0.81 (1.88) (1.87) (1.34) (3.46) (8.8) (9.1)
Langij 0.48 0.72 0.61 0.76 0.70 0.75 (7.01) (13.5) (11.5) (15.28) (15.69) (16.67)
N_RTAij -0.03 0.80 0.34 0.10 0.52 0.52 (-0.18) (4.83) (3.73) (1.81) (11.36) (12.25)
NN_RTAij 1.25 1.04 0.43 0.14 0.45 0.64 (1.44) (2.8) (1.81) (0.94) (7.43) (10.4)
Constant -37.52 -34.98 -34.53 -33.95 -35.22 -34.97 (-29.73) (-22.98) (-55.54) (-64.62) (-96.72) (-93.65)
F-Test βN_RTA = βNN_RTA
2.09 0.36 1.02 0.05 0.87 3.33a
N 2,922 7,556 10,547 12,079 17,382 18,418 R2 0.60 0.54 0.47 0.47 0.46 0.49
F-Statistic 24.99 34.34 35.85 48.22 61.93 74.97
Note: the dependent variable is the natural logarithm of bilateral trade (imports) scaled by the product of importer and exporter GDP. NOTRTAij and NNOTRTAij denote notified and non-notified RTAs, respectively. Cross-section regressions include country-specific fixed effects (omitted for brevity). T-statistics are in parentheses. Standard errors are robust to clustering on country pairs. a Significant at the 10 percent level.
35
Table 2. Notified and Non-Notified RTAs with Panel Data and Lags, 1960-2005
Note: the dependent variable is the natural logarithm of bilateral trade (imports) except when country-by-time fixed effects are used. FE denotes fixed effects. Cumulative Notified and Non-Notified RTA effects are calculated by summing concurrent (t) and the five, ten, and 15 year lagged coefficients (t-5, t-10, t-15). T-statistics are in parentheses. Standard errors are robust to clustering on country pairs.
--------Panel Regressions without Lags--------- -------------Panel Regressions with Lags----------- (1) (2) (3) (4) (5) (6)
Time & Country-
Pair (ij) FE
Time & Country(i,j)
FE
Country-by-Time Specific
(it, jt) FE
Time & Country-Pair FE With Lags
Time & Country (i,j)
FE with Lags
Country-by-Time Specific(it,jt) FE
With Lags GDPit 0.55 0.54 1.00 0.64 0.69 1.00
(54.23) (43.17) ---- (41.68) (34.01) ---- GDPjt 0.52 0.48 1.00 0.65 0.63 1.00
(49.2) (36.65) ---- (40.22) (29.22) ---- Distij ---- -1.13 -1.15 ---- -1.05 -1.11
---- (-133.51) (-137.07) ---- (-97.47) (-98.45) Contigij ---- 0.41 0.39 ---- 0.17 0.18
---- (12.17) (11.75) ---- (4.48) (4.6) Langij ---- 0.71 0.69 ---- 0.64 0.62
---- (42.36) (41.44) ---- (31.12) (29.81)
N_RTAijt 0.46 0.52 0.49 0.33 0.24 0.16 (21.49) (25.85) (23.96) (11.3) (6.68) (4.02)
N_RTAijt-5 ---- ---- ---- 0.22 0.09 0.05 ---- ---- ---- (6.1) (1.83) (0.84)
N_RTAijt-10 ---- ---- ---- 0.08 -0.08 -0.04 ---- ---- ---- (2.09) (-1.45) (-0.63)
N_RTAijt-15 ---- ---- ---- 0.22 0.22 0.18 ---- ---- ---- (6.36) (4.72) (3.53)
NN_RTAijt 0.36 0.40 0.65 0.31 0.24 0.19
(11.6) (12.78) (20.12) (7.37) (4.59) (3.41) NN_RTAijt-5 ---- ---- ---- 0.32 0.25 0.33
---- ---- ---- (6.78) (3.9) (4.59) NN_RTAijt-10 ---- ---- ---- 0.10 0.13 0.31
---- ---- ---- (1.78) (1.75) (3.8) NN_RTAijt-15 ---- ---- ---- 0.30 0.35 0.40
---- ---- ---- (3.74) (3.83) (4.22)
Cumulative N_RTA 0.46 0.52 0.49 0.85 0.47 0.35
Cumulative NN_RTA 0.36 0.40 0.65 1.03 0.97 1.24
N 111,994 111,994 108,294 50,862 50,862 46,249 R2 0.86 0.69 0.50 0.90 0.72 0.56 F 1,225 803.36 34.38 545.26 515.93 27.82

36
Table 3: Notified and Non-Notified RTAs by Development Status, 1960-2005
---North-North-Trade--- ---North-South-Trade--- ---South-South-Trade---
No
Phase-ins With
Phase-ins No
Phase-ins With
Phase-ins No
Phase-ins With
Phase-ins GDPit 1.00 1.00 1.00 1.00 1.00 1.00
---- ---- ---- ---- ---- ---- GDPjt 1.00 1.00 1.00 1.00 1.00 1.00
---- ---- ---- ---- ---- ---- Distij -0.88 -0.87 -1.35 -1.23 -1.18 -1.12
(-45.69) (-39.16) (-98.73) (-69.56) (-87.19) (-50.5) Contigij -0.04 -0.02 0.13 0.24 0.54 0.26
(-0.69) (-0.3) (1.56) (2.49) (12.23) (4.27) Langij 0.54 0.52 0.75 0.68 0.67 0.57
(13.65) (11.94) (31.95) (23.78) (25.17) (13.64)
N_RTAijt 0.13 0.02 0.17 0.08 0.81 0.27 (3.33) (0.31) (4.18) (1.09) (25.23) (3.48)
N_RTAijt-5 ---- 0.11 ---- 0.08 ---- 0.03 ---- (1.43) ---- (0.66) ---- (0.27)
N_RTAijt-10 ---- 0.01 ---- 0.00 ---- 0.07 ---- (0.13) ---- (0) ---- (0.69)
N_RTAijt-15 ---- -0.04 ---- -0.29 ---- 0.51 ---- (-0.63) ---- (-2.5) ---- (5.64)
NN_RTAijt 0.53 -0.08 0.50 0.28 0.61 0.13
(4.79) (-0.33) (4.68) (1.97) (14.26) (1.46) NN_RTAijt-5 ---- 0.41 ---- 0.11 ---- 0.26
---- (1.36) ---- (0.63) ---- (2.27) NN_RTAijt-10 ---- 0.14 ---- 0.39 ---- 0.19
---- (0.52) ---- (1.06) ---- (1.56) NN_RTAijt-15 ---- 0.07 ---- 0.00 ---- 0.38
---- (0.42) ---- (-0.01) ---- (2.61)
Cumulative N_RTA 0.13 0.09 0.17 -0.13 0.81 0.87
Cumulative NN_RTA 0.53 0.55 0.50 0.79 0.61 0.95
N 7,923 5,196 52,239 26,435 48,132 14,618 R2 0.67 0.70 0.53 0.54 0.55 0.65
F-Statistic 25.33 27.2 18.45 14.38 22.87 15.45
Note: dependent variable is the natural logarithm of bilateral imports scaled by importer and exporter GDP. All regressions include country-by-time fixed effects (FE). Cumulative Notified and Non-Notified RTA effects are calculated by summing concurrent (t) and five, ten, and 15 year lagged coefficients (t-5, t-10, t-15). T-statistics are in parentheses. Standard errors are robust to clustering on country pairs.

37
Table 6. Further Robustness Checks using Panel Data, 1960-2005
2 RTA
Members 3 to 5
RTA Members 6 to 10
RTA Members 11 to 20
RTA Members Greater than 20 RTA Members
Excluding Bilateral RTAs
Trade Values Greater than $0.5 Mill.
No
Phase-ins Phase-ins No
Phase-ins Phase-ins No
Phase-ins Phase-ins No
Phase-ins Phase-ins No
Phase-ins Phase-ins No
Phase-ins Phase-
ins No
Phase-ins Phase-ins
Distij -1.23 -1.19 -1.23 -1.18 -1.24 -1.21 -1.20 -1.16 -1.24 -1.17 -1.15 -1.07 -0.92 -0.96 (-152.42) (-112.53) (-154.58) (-114.3) (-154.05) (-114.46) (-148.16) (-121.41) (-155.52) (-112.73) (-136.56) (-101.1) (-125.01) (-105.56)
Contigij 0.41 0.22 0.33 0.15 0.40 0.21 0.41 0.22 0.41 0.22 0.39 0.13 0.33 0.18 (12.49) (5.54) (9.95) (3.66) (12.10) (5.05) (12.25) (6.10) (12.25) (5.55) (11.84) (3.39) (12.41) (5.80)
Langij 0.71 0.62 0.68 0.59 0.72 0.63 0.71 0.68 0.72 0.66 0.68 0.62 0.50 0.54 (43.16) (29.58) (40.88) (27.90) (43.46) (30.15) (42.73) (35.47) (43.42) (31.74) (41.02) (31.27) (33.94) (31.38)
N_RTAijt 0.22 -0.08 1.52 0.53 -0.04 0.04 0.78 0.14 0.00 0.16 0.48 0.19 0.38 0.17 (4.90) (-1.32) (16.90) (2.23) (-0.76) (0.46) (23.97) (2.25) (-0.03) (2.58) (22.93) (4.67) (22.34) (5.13) N_RTAijt-5 ----- 0.22 ----- 0.66 ----- 0.09 ----- 0.02 ----- -0.33 ----- 0.04 ----- 0.06
----- (2.11) ----- (2.08) ----- (0.83) ----- (0.19) ----- (-3.61) ----- (0.69) ----- (1.31)
N_RTAijt-10 ----- 0.03 ----- -0.38 ----- -0.32 ----- 0.53 ----- -0.03 ----- -0.06 ----- -0.07 ----- (0.22) ----- (-1.3) ----- (-2.88) ----- (7.52) ----- (-0.32) ----- (-1.1) ----- (-1.49)
N_RTAijt-15 ----- -0.16 ----- 0.40 ----- -0.30 ----- ----- ----- 0.04 ----- 0.22 ----- 0.20 ----- (-1.09) ----- (1.68) ----- (-3.17) ----- ----- ----- (0.45) ----- (4.32) ----- (4.76)
NN_RTAijt 0.62 0.18 0.80 0.31 0.40 -0.31 1.03 0.68 0.03 0.01 0.61 0.25 0.54 0.18 (10.60) (2.16) (9.66) (2.16) (2.36) (-1.36) (13.24) (5.81) (0.58) (0.08) (18.09) (4.48) (18.30) (3.71) NN_RTAijt-5 ----- 0.08 ----- 0.41 ----- 0.50 ----- 0.28 ----- 0.25 ----- 0.35 ----- 0.33
----- (0.75) ----- (2.14) ----- (2.12) ----- (2.24) ----- (2.03) ----- (4.84) ----- (5.41)
NN_RTAijt-10 ----- -0.15 ----- 0.03 ----- 0.67 ----- 1.76 ----- 0.17 ----- 0.32 ----- 0.25 ----- (-0.91) ----- (0.10) ----- (2.76) ----- (13.15) ----- (1.47) ----- (3.90) ----- (3.54)
NN_RTAijt-15 ----- 0.38 ----- 0.49 ----- 2.08 ----- ----- ----- 0.83 ----- 0.48 ----- 0.44 ----- (2.28) ----- (1.47) ----- (4.70) ----- ----- ----- (5.53) ----- (4.74) ----- (5.31)
Cumulative N_RTA 0.22 0.01 1.52 1.21 -0.04 -0.49 0.78 0.69 0.00 -0.16 0.48 0.39 0.38 0.36
Cumulative NN_RTA 0.62 0.49 0.80 1.24 0.40 2.94 1.03 2.72 0.03 1.26 0.61 1.40 0.54 1.20
N 108,294 46,511 108,294 46,511 108,294 46,511 108,294 61,735 108,294 46,249 108,294 50,614 77,033 46,024 R2 0.49 0.75 0.49 0.76 0.49 0.75 0.49 0.54 0.49 0.55 0.49 0.56 0.63 0.64
Note: dependent variable is the natural logarithm of bilateral imports scaled by importer and exporter GDP. All regressions include country-by-time fixed effects (FE) omitted for brevity. Cumulative Notified and Non-Notified RTA effects are calculated by summing concurrent (t) and five, ten, and 15 year lagged coefficients (t-5, t-10, t-15). T-statistics are in parentheses. Standard errors are robust to clustering on country pairs.

38
Appendix I. RTA Database
RTA Name Definition Type Notified RTA Name Definition Type Notified
ACC Arab Coop. Council PSA No CANAUS Canada-Australia (CANATA) Agreement PSA No
ACS Assoc. of Caribb. States PSA No CANCHL Canada-Chile Agreement FTA Yes
AEC African Economic Community PSA No CANCRI Canada-Costa Rica Agreement FTA Yes
ALBMKD Albania-Macedonia Trade Agreement FTA Yes CANISR Canada-Israel Agreement FTA Yes
AMU Arab Maghreb Union PSA No CARICOM Caribbean Communities Agreement CU Yes
AND Andean Community CU Yes CARICOMCOL CARICOM-Columbia Agreement AFTA No
ANDARG Andean Argentina Agreement AFTA No CARICOMDOM CARICOM-Dominican Rep. Agreement AFTA No
ANDBRA Andean Brazil Agreement AFTA No CARICOMVEN CARICOM-Venezuela Agreement AFTA No
ARGCHL Argentina-Chile Agreement PSA No CBI Cross Border Initiative Agreement FTA No
ARGCRI Argentina-Costa Rica Agreement PSA No CEFTA Central European Free Trade Agreement FTA Yes
ARGCUB Argentina-Cuba Agreement PSA No CEFTABGR CEFTA-Bulgaria Agreement AFTA Yes
ARGECU Argentina-Ecuador Agreement PSA No CEFTAHRV CEFTA-Croatia Agreement AFTA Yes
ARMRUS Armenia-Russia Agreement FTA No CEFTAROM CEFTA-Romania Agreement AFTA Yes
ARMTKM Armenia-Turkmenistan Agreement FTA Yes CEMAC Economic and Monetary Comm. Of Central Africa CU Yes
ASEAN Assoc. of South East Asian Nations FTA Yes CENSAD Comm. Of Sahel-Saharan States PSA No
ASEANCHN ASEAN-China Agreement AFTA Yes CEPGL Ec. Comm. Of Great Lakes Countries PSA No
BAFTA Baltic Free Trade Agreement FTA Yes CER Closer Economic Relations Agreement FTA Yes
BANK/APTA Bangkok/Asia Pacific Agreement (APTA) PSA Yes CHLCOL Chile-Columbia Agreement PSA No
BANKCHN Bangkok-China Agreement AFTA Yes CHLCRI Chile-Costa Rica Agreement FTA Yes
BFACUB Burkina Faso-Cuba Agreement PSA No CHLECU Chile-Ecuador Agreement PSA No
BFAIND Burkina Faso-India Agreement PSA No CHLKOR Chile-Korea Agreement FTA Yes
BFAKOR Burkina Faso-Korea Agreement PSA No CHLMEX Chile-Mexico Agreement FTA Yes
BFATUN Burkina Faso-Tunisia Agreement PSA No CHLPER Chile-Peru Agreement PSA No
BGREST Bulgaria-Estonia Agreement FTA Yes CHLVEN Chile-Venezuela Agreement PSA Yes
BGRHRV Bulgaria-Croatia Agreement FTA No CHNHKG China-Hong Kong Agreement FTA Yes
BGRISR Bulgaria-Israel Agreement FTA Yes CHNMAC China-Macau Agreement FTA Yes
BGRLTU Bulgaria-Lithuania Agreement FTA Yes CIS Common Wealth of Indep. States Agreement FTA Yes
BGRLVA Bulgaria-Latvia Agreement FTA Yes COLCUB Columbia-Cuba Agreement PSA No
BGRMKD Bulgaria-Macedonia Agreement FTA Yes COLPAN Columbia-Panama Agreement PSA No
BGRTUR Bulgaria-Turkey Agreement FTA Yes COMESA Common Market for East. & South Africa FTA Yes
BIHMKD Bosnia-Herzegovina-Macedonia Agreement FTA No CUBCHL Cuba-Chile Agreement PSA No
BIHZWE Bosnia-Herzegovina-Zimbabwe Agreement FTA No CUBECU Cuba-Ecuador Agreement PSA No
BLRUKR Belarus-Ukraine Agreement FTA No CUBURY Cuba-Uruguay Agreement PSA No
BOLCHL Bolivia-Chile Agreement PSA No CUSTA Canada-USA Free Trade Agreement FTA Yes
BOLCUB Bolivia-Cuba Agreement PSA No CZEEST Czech Republic-Estonia Agreement FTA Yes
BOLMEX Bolivia-Mexico Agreement FTA No CZEISR Czech Republic-Israel Agreement FTA Yes
BRACUB Brazil-Cuba Agreement PSA No CZELTU Czech Republic-Lithuania Agreement FTA Yes
CACM Central American Common Market CU Yes CZELVA Czech Republic-Latvia Agreement FTA Yes
CACMCHL CACM-Chile Agreement AFTA No CZEMKD Czech Republic-Macednoia Agreement FTA No
CACMCOL CACM-Columbia Agreement AFTA No CZESVK Czech Republic-Slovak Republic FTA Yes
CACMDOM CACM-Dominican Rep. Agreement AFTA No CZETUR Czech Republic-Turkey Republic FTA Yes
CACMVEN CACM-Venezuela Agreement AFTA No EAC East African Community Agreement CU Yes
39
Appendix I – Cont’d
RTA Name Definition Type Notified RTA Name Definition Type Notified
EAEC Eurasian Economic Community Agreement CU Yes EULBN EU-Lebanon Agreement AFTA Yes
ECCAS Economic Comm. Of Central African States PSA No EUMAR EU-Morocco Agreement AFTA Yes
ECCASAGO ECCAS-Angola Agreement AFTA No EUMEX EU-Mexico Agreement AFTA Yes
ECO Economic Cooperation Organization PSA Yes EUMKD EU-Macednoia Agreement AFTA Yes
ECOWAS Economic Comm. Of West African States PSA Yes EUNOR EU-Norway Agreement AFTA Yes
EFTA European Free Trade Agreement FTA Yes EUPSE EU-Palestine Agreement AFTA Yes
EFTABGR EFTA-Bulgaria Agreement AFTA Yes EUSYR EU-Syria Agreement AFTA Yes
EFTACHL EFTA-Chile Agreement AFTA Yes EUTUN EU-Tunisia Agreement AFTA Yes
EFTACZE EFTA-Czech Rep. Agreement AFTA Yes EUTUR EU-Turkey Agreement AFTA Yes
EFTAEST EFTA-Estonia Agreement AFTA Yes EUZAF EU-South Africa Agreement AFTA Yes
EFTAFIN EFTA-Finland Agreement AFTA No FJIPNG Fiji-Papua New Guinea Agreement FTA No
EFTAHRV EFTA-Croatia Agreement AFTA Yes FROCHE Faroe Islands-Switzerland Agreement FTA Yes
EFTAHUN EFTA-Hungary Agreement AFTA Yes FROISL Faroe Islands-Iceland Agreement FTA Yes
EFTAISR EFTA-Israel Agreement AFTA Yes FRONOR Faroe Islands-Norway Agreement FTA Yes
EFTAJOR EFTA-Jordan Agreement AFTA Yes G3 Group of Three FTA No
EFTALTU EFTA-Lithuania Agreement AFTA Yes GAFTA Greater Arab Free Trade Area FTA No
EFTALVA EFTA-Latvia Agreement AFTA Yes GCC Gulf Cooperation Council CU Yes
EFTAMAR EFTA-Morocco Agreement AFTA Yes GEOARM Georgia-Armenia Agreement FTA Yes
EFTAMEX EFTA-Mexico Agreement AFTA Yes GEOAZE Georgia-Azerbaijan Agreement FTA Yes
EFTAMKD EFTA-Macedonia Agreement AFTA Yes GEOKAZ Georgia-Kazakhstan Agreement FTA Yes
EFTAPOL EFTA-Poland Agreement AFTA Yes GEORUS Georgia-Russia Agreement FTA Yes
EFTAPSE EFTA-Palestine Agreement AFTA Yes GEOTKM Georgia-Turkmenistan Agreement FTA Yes
EFTAROM EFTA-Romania Agreement AFTA Yes GEOUKR Georgia-Ukraine Agreement FTA Yes
EFTASGP EFTA-Singapore Agreement AFTA Yes GINMAR Guinea-Morocco FTA No
EFTASVK EFTA-Slovak Rep. Agreement AFTA Yes GSTP Gen. Sys. Of Trade Pref. Among Developing Nations PSA Yes
EFTASVN EFTA-Slovenia Agreement AFTA Yes HRVBIH Croatia-Bosnia Herzegovina Agreement FTA Yes
EFTATUN EFTA-Tunisia Agreement AFTA Yes HRVHUN Croatia-Hungary Agreement FTA No
EFTATUR EFTA-Turkey Agreement AFTA Yes HRVMKD Croatia-Macedonia Agreement FTA No
ESTFRO Estonia-Faroe Islands Agreement FTA Yes HUNEST Hungary-Estonia FTA No
ESTTUR Estonia-Turkey Agreement FTA Yes HUNISR Hungary-Israel FTA No
ESTUKR Estonia-Ukraine Agreement FTA Yes HUNLTU Hungary-Lithuania FTA No
EU European Union and its Expansions CU Yes HUNLVA Hungary-Latvia FTA No
EUAND EU-Andorra Agreement AFTA No HUNTUR Hungary-Turkey FTA No
EUCHE EU-Switzerland Agreement AFTA Yes IGAD Inter-Governmental Authority on Develop. Agreement PSA No
EUCHL EU-Chile Agreement AFTA Yes INDBGD India-Bangladesh Agreement PSA No
EUDZA EU-Algeria Agreement AFTA Yes INDBTN India-Bhutan Agreement FTA No
EUEGY EU-Egypt Agreement AFTA Yes INDLKA India-Sri Lanka Agreement FTA No
EUFRO EU-Faroe Islands Agreement AFTA Yes INDNPL India-Nepal Agreement FTA No
EUHRV EU-Croatia Agreement AFTA Yes INDSGP India-Singapore Agreement FTA Yes
EUISL EU-Iceland Agreement AFTA Yes IRNCHE Iran-Switzerland Agreement FTA No
EUISR EU-Israel Agreement AFTA Yes IRQEGY Iraq-Egypt Agreement FTA No
EUJOR EU-Jordan Agreement AFTA Yes ISRJOR Israel-Jordan Agreement FTA No

40
Appendix I – Cont’d
RTA Name Definition Type Notified RTA Name Definition Type Notified
ISRTUR Israel-Turkey Agreement FTA Yes MEXNIC Mexico-Nicaragua Agreement FTA Yes
JORMAR Jordan-Morocco Agreement PSA No MEXURY Mexico-Uruguay Agreement FTA No
JORSGP Jordan-Singapore Agreement FTA Yes MRU Mano River Union PSA No
JORSYR Jordan-Syria Agreement FTA No MSG Melanesian Spearhead Group PSA Yes
JPNMEX Japan-Mexico Agreement FTA Yes NAFTA North American Free Trade Agreement FTA Yes
JPNSGP Japan-Singapore Agreement FTA Yes NAMZWE Namibia-Zimbabwe Agreement PSA No
KGZARM Kyrgyzstan-Armenia Agreement FTA Yes NICCOL Nicaragua-Columbia Agreement PSA No
KGZKAZ Kyrgyzstan-Kazakhstan Agreement FTA Yes NTR Northern Triangle Agreement FTA No
KGZMDA Kyrgyzstan-Moldova Agreement FTA Yes NTRMEX NTR-Mexico Agreement FTA No
KGZRUS Kyrgyzstan-Russia Agreement FTA No NZLSGP New Zealand-Singapore Agreement FTA No
KGZUKR Kyrgyzstan-Ukraine Agreement FTA Yes PANARAB The Pan Arab Free Trade Agreement FTA No
KGZUZB Kyrgyzstan-Uzbekistan Agreement FTA Yes PANCRI Panama-Costa Rica Agreement PSA No
LAIA Latin American Integration Agreement PSA Yes PANDOM Panama-Dominican Rep. Agreement PSA No
LAOTHA Laos-Thailand Agreement PSA Yes PANGTM Panama-Guatemala Agreement PSA No
LBNARE Lebanon-United Arab Emirates Agreement FTA No PANHND Panama-Honduras Agreement PSA No
LBNKWT Lebanon-Kuwait Agreement FTA No PANMEX Panama-Mexico Agreement PSA No
LBNSYR Lebanon-Syria Agreement FTA No PANNIC Panama-Nicaragua Agreement PSA No
LTUTUR Lithuania-Turkey Agreement FTA No PANSLV Panama-El Salvador Agreement FTA Yes
LVATUR Latvia-Turkey Agreement FTA Yes PATCRA Australia-Papua New Guinea Agreement FTA Yes
MAFTA Aghadir Agreement (Med-Arab FTA) FTA No PERCUB Peru-Cuba Agreement PSA No
MARTUN Morocco-Tunisia Agreement FTA No POLFRO Poland-Faroe Islands Agreement FTA Yes
MDAARM Moldova-Armenia Agreement FTA Yes POLISR Poland-Israel Agreement FTA Yes
MDAAZE Moldova-Azerbaijan Agreement FTA No POLLTU Poland-Lithuania Agreement FTA Yes
MDABLR Moldova-Belarus Agreement FTA No POLLVA Poland-Latvia Agreement FTA Yes
MDAKAZ Moldova-Kazakhstan Agreement FTA No POLTUR Poland-Turkey Agreement FTA Yes
MDARUS Moldova-Russia Agreement FTA No PSEEGY Palestine-Egypt Agreement FTA No
MDATKM Moldova-Turkmenistan Agreement FTA No PSEJOR Palestine-Jordan Agreement PSA No
MDAUKR Moldova-Ukraine Agreement FTA No PSETUR Palestine-Turkey Agreement FTA Yes
MDAUZB Moldova-Uzbekistan Agreement FTA No PTAES Preferential Trade Area for Eastern & Southern Africa PSA No
MERC Mercado Común del Sur (Mercosur) CU Yes PTN Protocol of Trade Relations Among Developing Countries PSA Yes
MERCBOL MERC-Bolivia Agreement AFTA No ROMMDA Romania-Moldova Agreement FTA Yes
MERCCHL MERC-Chile Agreement AFTA No ROMTUR Romania-Turkey Agreement FTA Yes
MERCCOL MERC-Columbia Agreement AFTA No RUSAZE Russia-Azerbaijan Agreement PSA No
MERCECU MERC-Ecuador Agreement AFTA No RUSBLR Russia-Belarus Agreement PSA No
MERCIND MERC-India Agreement AFTA No RUSTJK Russia-Tajikistan Agreement PSA No
MERCMEX MERC-Mexico Agreement AFTA No RUSTKM Russia-Turkmenistan Agreement PSA No
MERCPER MERC-Peru Agreement AFTA No RUSUKR Russia-Ukraine Agreement PSA No
MERCVEN MERC-Venezuela Agreement AFTA No RUSUZB Russia-Uzbekistan Agreement PSA No
MEXBRA MERC-Brazil Agreement FTA No SACU South African Customs Union CU No
MEXCRI MERC-Costa Rica Agreement FTA No SADC South African Development Community FTA Yes
MEXCUB MERC-Cuba Rica Agreement PSA No SADCZAF SADC-South Africa Agreement AFTA No
MEXISR Mexico-Israel Agreement FTA Yes SAPTA South Asian Pref. Trade Agreement PSA Yes
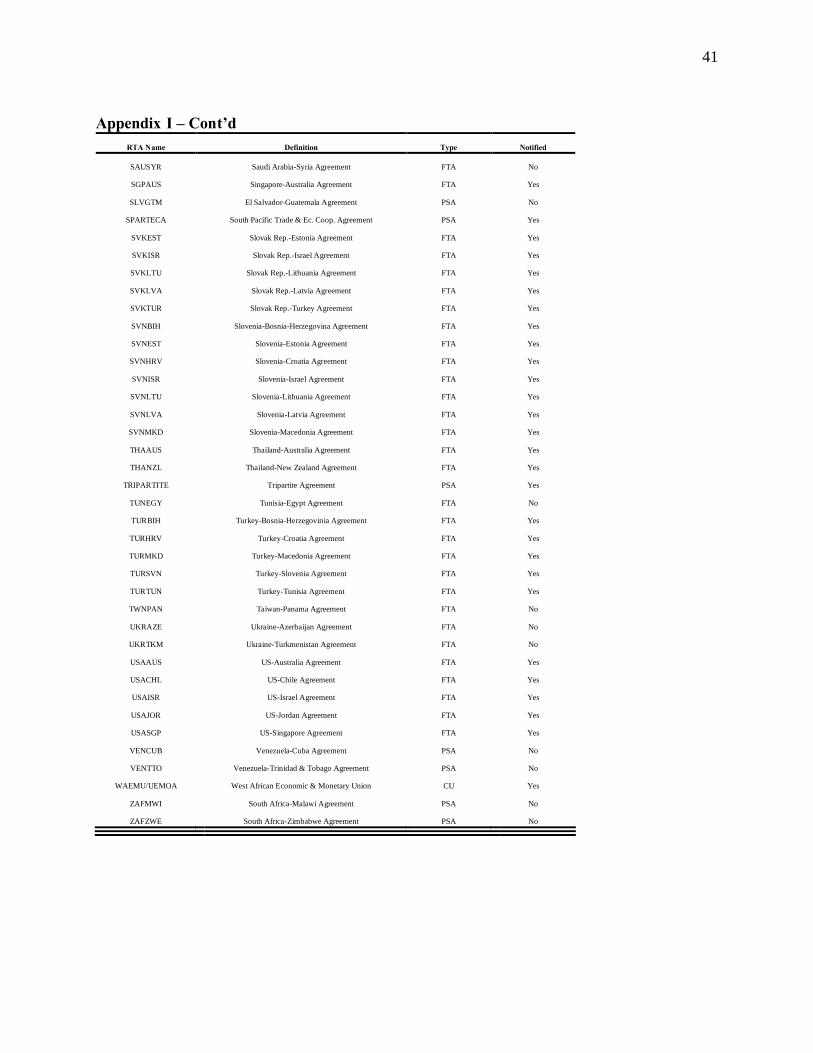
41
Appendix I – Cont’d
RTA Name Definition Type Notified
SAUSYR Saudi Arabia-Syria Agreement FTA No
SGPAUS Singapore-Australia Agreement FTA Yes
SLVGTM El Salvador-Guatemala Agreement PSA No
SPARTECA South Pacific Trade & Ec. Coop. Agreement PSA Yes
SVKEST Slovak Rep.-Estonia Agreement FTA Yes
SVKISR Slovak Rep.-Israel Agreement FTA Yes
SVKLTU Slovak Rep.-Lithuania Agreement FTA Yes
SVKLVA Slovak Rep.-Latvia Agreement FTA Yes
SVKTUR Slovak Rep.-Turkey Agreement FTA Yes
SVNBIH Slovenia-Bosnia-Herzegovina Agreement FTA Yes
SVNEST Slovenia-Estonia Agreement FTA Yes
SVNHRV Slovenia-Croatia Agreement FTA Yes
SVNISR Slovenia-Israel Agreement FTA Yes
SVNLTU Slovenia-Lithuania Agreement FTA Yes
SVNLVA Slovenia-Latvia Agreement FTA Yes
SVNMKD Slovenia-Macedonia Agreement FTA Yes
THAAUS Thailand-Australia Agreement FTA Yes
THANZL Thailand-New Zealand Agreement FTA Yes
TRIPARTITE Tripartite Agreement PSA Yes
TUNEGY Tunisia-Egypt Agreement FTA No
TURBIH Turkey-Bosnia-Herzegovinia Agreement FTA Yes
TURHRV Turkey-Croatia Agreement FTA Yes
TURMKD Turkey-Macedonia Agreement FTA Yes
TURSVN Turkey-Slovenia Agreement FTA Yes
TURTUN Turkey-Tunisia Agreement FTA Yes
TWNPAN Taiwan-Panama Agreement FTA No
UKRAZE Ukraine-Azerbaijan Agreement FTA No
UKRTKM Ukraine-Turkmenistan Agreement FTA No
USAAUS US-Australia Agreement FTA Yes
USACHL US-Chile Agreement FTA Yes
USAISR US-Israel Agreement FTA Yes
USAJOR US-Jordan Agreement FTA Yes
USASGP US-Singapore Agreement FTA Yes
VENCUB Venezuela-Cuba Agreement PSA No
VENTTO Venezuela-Trinidad & Tobago Agreement PSA No
WAEMU/UEMOA West African Economic & Monetary Union CU Yes
ZAFMWI South Africa-Malawi Agreement PSA No
ZAFZWE South Africa-Zimbabwe Agreement PSA No
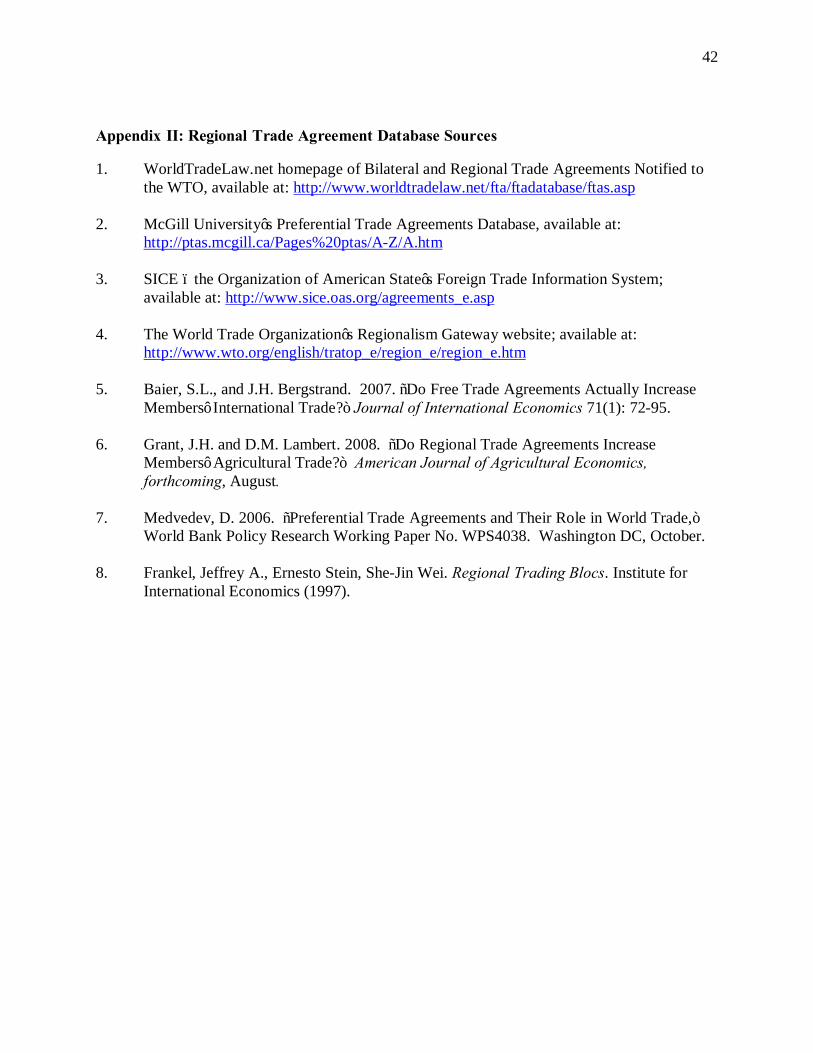
42
Appendix II: Regional Trade Agreement Database Sources 1. WorldTradeLaw.net homepage of Bilateral and Regional Trade Agreements Notified to
the WTO, available at: http://www.worldtradelaw.net/fta/ftadatabase/ftas.asp 2. McGill University’s Preferential Trade Agreements Database, available at:
http://ptas.mcgill.ca/Pages%20ptas/A-Z/A.htm 3. SICE – the Organization of American State’s Foreign Trade Information System;
available at: http://www.sice.oas.org/agreements_e.asp 4. The World Trade Organization’s Regionalism Gateway website; available at:
http://www.wto.org/english/tratop_e/region_e/region_e.htm 5. Baier, S.L., and J.H. Bergstrand. 2007. “Do Free Trade Agreements Actually Increase
Members’ International Trade?” Journal of International Economics 71(1): 72-95. 6. Grant, J.H. and D.M. Lambert. 2008. “Do Regional Trade Agreements Increase
Members’ Agricultural Trade?” American Journal of Agricultural Economics, forthcoming, August.
7. Medvedev, D. 2006. “Preferential Trade Agreements and Their Role in World Trade,”
World Bank Policy Research Working Paper No. WPS4038. Washington DC, October. 8. Frankel, Jeffrey A., Ernesto Stein, She-Jin Wei. Regional Trading Blocs. Institute for
International Economics (1997).