Embed Size (px)
Citation preview

HRHARVEY NASH
SURVEY2016

2
Foreword 3Infographic 4Executive Summary 6
Global ResultsAbout the Respondents 10Board HR Priorities 12Perception of HR 14HR Reporting & Performance 17Labour Market Trends 18Recruitment 21HR Disruption and the Future 22Employee Engagement 24Talent Management 25Diversity 28Diversity Opinion: HR Versus Technology Leaders 29HR Career 30HR Salaries 34
Regional ProfilesAsia-Pacific (APAC) 38Germany 40Hong Kong 42Ireland 44Netherlands 46Norway 48Poland 50Sweden 52Switzerland 54United Kingdom 56Vietnam 58
PLEASE NOTE: GLOBAL RESULTS include charts that define trends across regions in addition to global averages. The ‘Europe’ data set includes EU member countries, Switzerland and Norway. Asia-Pacific (APAC) includes Australia, China, Japan, Singapore and Vietnam. Some countries or regions – for example the UK and the Nordics – are also examined independently of their regional group in some charts, specifically where evidence of divergent trends exists.
2
3HARVEY NASH HR SURVEY 2016
3
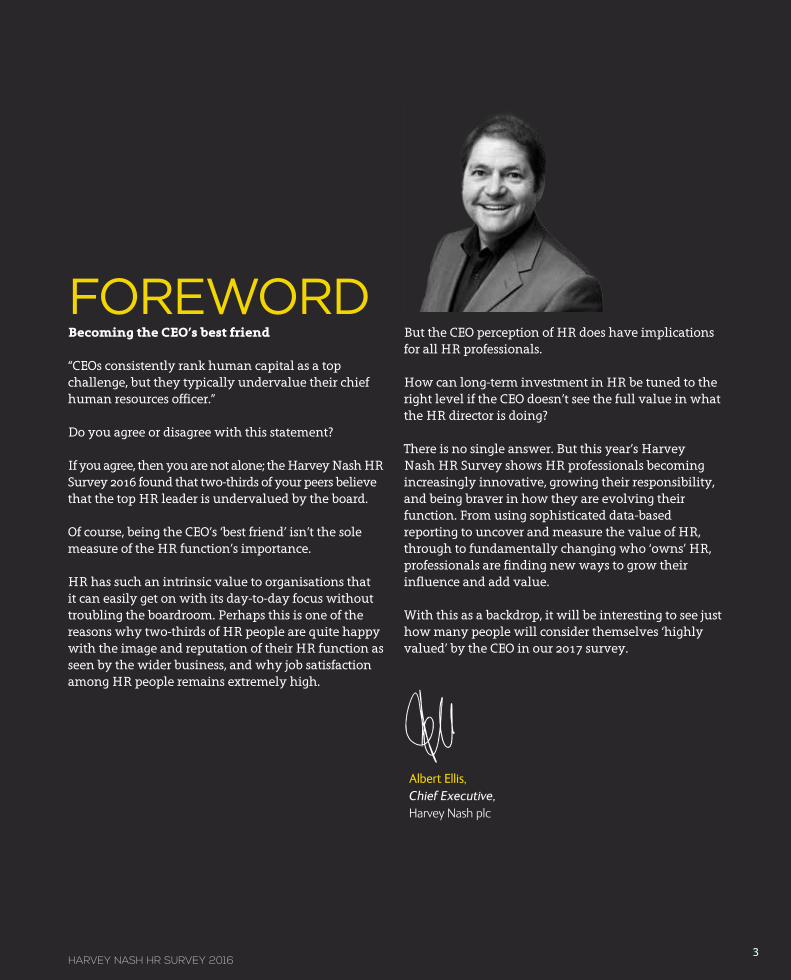
Becoming the CEO’s best friend
“CEOs consistently rank human capital as a top challenge, but they typically undervalue their chief human resources officer.”
Do you agree or disagree with this statement?
If you agree, then you are not alone; the Harvey Nash HR Survey 2016 found that two-thirds of your peers believe that the top HR leader is undervalued by the board.
Of course, being the CEO’s ‘best friend’ isn’t the sole measure of the HR function’s importance.
HR has such an intrinsic value to organisations that it can easily get on with its day-to-day focus without troubling the boardroom. Perhaps this is one of the reasons why two-thirds of HR people are quite happy with the image and reputation of their HR function as seen by the wider business, and why job satisfaction among HR people remains extremely high.
But the CEO perception of HR does have implications for all HR professionals.
How can long-term investment in HR be tuned to the right level if the CEO doesn’t see the full value in what the HR director is doing?
There is no single answer. But this year’s Harvey Nash HR Survey shows HR professionals becoming increasingly innovative, growing their responsibility, and being braver in how they are evolving their function. From using sophisticated data-based reporting to uncover and measure the value of HR, through to fundamentally changing who ‘owns’ HR, professionals are finding new ways to grow their influence and add value.
With this as a backdrop, it will be interesting to see just how many people will consider themselves ‘highly valued’ by the CEO in our 2017 survey.
FOREWORD
Albert Ellis,Chief Executive,Harvey Nash plc
3

ABOUT THE RESPONDENTS
BOARD HR PRIORITIES
Total number of respondents:
1,250+
HARVEY NASH HR SURVEY 2016 KEY FINDINGS
ARE FEMALE(up 3% onlast year)
BOARD PRIORITIES: TOP THREEtalent managementrecruitmentemployee engagement
BOARD PRIORITIES: FASTEST GROWINGrecruitment (up 7%)retention (up 5%)training (up 4%)
BOARD PRIORITIES: FASTEST FALLINGchange management (down 8%)leadership development (down 5%)management development (down 4%)
ARE 50+YEARS OLD
(down 6%)
ARE MEMBERS OF THE
OPERATIONAL BOARD (up 4%)
64+36+T65% 22+78+T22% 54+46+T54%
1
1
1
2
2
2
3
3
3
HRREPORTING AND PERFORMANCE
Only 6% believe management information systems are not important to improving the
perception of HR
PERCEPTION OF HR
think CEO undervalues the top HR leader
… but 65% are happy with the perception of HR in the wider business
think HR should do more for the business
… while 53% think the business should do more HR itself
66+34+T66%
47+53+T47%
4

5
49% use online job boards (up 7% on last year)
49% use a corporate website (down 5%)
44% use external recruiters (up 5%)
43% use LinkedIn (up 6%)
HARVEY NASH HR SURVEY 2016 KEY FINDINGSDIVERSITY AND INCLUSION
of HR professionals have implemented all or most of their diversity programme
But 67% are happy with diversity progress!53+47+T53%
LABOUR MARKET TRENDS
report recruitment challenges in local economic region (up 3% on last year)
report tight labour supply and skill shortages generally(up 1%)
report demographic shift /ageing workforce(down 8%)
report growing demand by employees for flexible work options(unchanged)
58+42+T58% 42+58+T42%
44+56+T44% 33+67+T33%
85%of HR professionals are now directly engaged in the
recruitment process
RECRUITMENT
The only sectors where implementation exceeds satisfaction:
Financial Services (by 10%)
Government (8%)
Technology (3%)
Transport (3%)
5

HARVEY NASH HR SURVEY 20166
EXECUTIVE SUMMARY
About the respondentsWhile the majority of respondents continue to have 20–30 years’ HR experience, there is a shift towards younger respondents this year. Despite reflecting a younger demographic, a majority of respondents (68 per cent) have a management position within the HR function. In line with trends seen previously, almost two-thirds (65 per cent) of the respondents are female, and four in ten respondents are global or international in outlook.
Board HR priorities The top three HR priorities – talent management, recruitment and employee engagement – represent a healthy outlook for growth: companies are recruiting (7 per cent more important this year), and leadership teams are managing their talent to ensure that the workforce is engaged and therefore retained. Employee retention, training and motivation are all more important this year. In other words, companies are investing in and protecting their greatest asset: their people.
Perception of HRIn one of the most significant findings this year, two-thirds of HR leaders believe that while the people agenda is valued very highly by the CEO and board, the HR professionals entrusted to look after that agenda are often seen quite differently.
Rarely do we see HR directors lined up as the successor to the CEO. HR leaders are often seen as the ‘eyes and ears’ or ‘conscience’ of the CEO, rather than as an organisational leader in waiting. HR professionals are split as to how to address the perception of HR in the business. A slight minority (47 per cent) want to grasp the issue and proactively
engage HR in the business, while 53 per cent believe their role is to encourage and influence the business to take more responsibility for elements of HR.
HR reporting and performanceMany HR professionals have previously stated that to improve relationships with the business HR needs to do better at gathering and reporting metrics. Only 6 per cent of respondents disagree, and six in ten believe management information systems (MIS) are already critically important to improving the perception of HR. There has been much investment in HR technology but in many cases additional progress is needed before the HR function can be labelled ‘up to date’. By charting meaningful data, HR can show how it is making improvements to the bottom line of a business.
Labour market trendsRecruitment challenges remain the most significant labour market concern for HR professionals. Almost six in ten (58 per cent) say they will be responding to local recruitment challenges in 2016, up 3 per cent from last year. There is also a growing unease among HR professionals that their education system is not aligned with their hiring needs; three in ten (31 per cent) see this as an issue, up 6 per cent on last year.
Employers must think far more creatively about how they attract talent, what their employee proposition is, and how their employer brand compares with their competitors. We can only take this as a positive indicator of market confidence. However, the ongoing issues of lack of local talent and the misalignment between education systems and hiring needs remain problems with no imminent solutions.

HARVEY NASH HR SURVEY 20167
RecruitmentMore than 85 per cent of HR professionals are now directly engaged in the recruitment activity of their organisation. A wide range of recruitment techniques have been adopted to deliver competitive talent acquisition programmes. When it comes to recruitment, relationships remain key. As the saying goes, “it’s not what you know, it’s who you know”. Personal networks of recruiters therefore remain ‘very important’.
Digital platforms are more popular this year with one notable exception: the use of corporate websites as a recruiting tool has dropped 5 per cent this year while the use of online job boards has increased 7 per cent. It is clear that a varied approach to recruitment remains strong.
Employee engagementDuring the height of the recession, employee engagement was the number one challenge and a priority for HR professionals. It is therefore encouraging to see that five years on, HR professionals feel more optimistic about how engaged employees are. Half (50 per cent) believe engagement has improved, compared with only 20 per cent who think employee engagement has deteriorated since 2010.
Opinion surveys remain, by far, the most used tool for measuring engagement (82 per cent). A sizeable proportion still do not measure employee engagement at all, despite the board making it a priority for the HR function. Six in ten HR professionals (61 per cent) have a talent management programme in place. This is essentially unchanged from last year (63 per cent).
DiversityProgress with the implementation of diversity programmes varies greatly between sectors, and for a number of sectors satisfaction with their diversity programme outpaces the actual implementation progress. In Retail, for example, although only 53 per cent of HR professionals have implemented all or most of their diversity programme, 67 per cent are happy with this apparent progress. The only sectors where implementation exceeds satisfaction are Financial Services (by 10 per cent), Government (8 per cent), Technology (3 per cent) and Transport (3 per cent).
HR careerThe top career indicators all reflect the proactive, involved and necessary nature of the modern-day HR professional. Demand for HR professionals is buoyant and more HR professionals moved job in 2015 (21 per cent) compared with 16 per cent in 2014 and 17 per cent in 2013.
Job satisfaction has stabilised within the HR professional community, with approximately eight in ten reporting to be fulfilled or very fulfilled in their role. Financial considerations play a bigger role in job satisfaction this year. Having a financially secure organisation is important for 18 per cent (up 4 per cent) and a good salary is important for 27 per cent (up 5 per cent).
Therefore it is interesting to note that, based on the analysis of HR professionals who provided salary information, the average remuneration for HR professionals who responded to the survey is €99,715 per year.

JOIN THE CONVERSATION...
WWW.HARVEYNASH.COM/HRSURVEY

9
1. GLOBAL RESULTS

GLOBAL RESULTS
HARVEY NASH HR SURVEY 201610
More than 1,250 HR professionals participated in the 2016 Harvey Nash HR Survey and the audience is becoming increasingly senior. Thirteen per cent of respondents are C-level executives compared with 10 per cent last year. A total of 68 per cent of respondents have a management position within the HR function.
Respondents reflect insight on HR from a wide range of sectors. Technology remains the most represented sector (by 16 per cent, up from 14 per cent last year). Manufacturing and Retail also contribute more respondents this year (up 3 per cent and 1 per cent respectively). There are marginally fewer respondents from Financial Services, Government, Transport and Healthcare this year.
ABOUT THE RESPONDENTS
Proportion of C-level and Head of HR respondents growing
Wide range of sectors represented
Chart 1. Which of the following best describes your job title?
Chart 2. In which sector is your organisation primarily engaged?
13+20+15+20+13+19+A n C-Leveln Head of HRn VP/Director HRn (Senior) Manager HRn Other HRn Other (non HR)
13%
13%
19%
20%
20% 15%
960= 16%840= 14%
50= 201550= 2014
780= 13%600= 10%
600= 10%540= 9%
540= 9%600= 10%
480= 8%480= 8%
420= 7%420= 7%
300= 5%360= 6%
240= 4%300= 5%
180= 3%360= 6%
120= 2%240= 4%
Technology
Manufacturing
Retail
Financial Services
Professional Services
Construction
Transport
Healthcare
Government
Non profit

GLOBAL RESULTS
HARVEY NASH HR SURVEY 201611
While the majority of respondents continue to have 20–30 years’ HR experience, there is a shift towards younger respondents this year with each of the categories below 40 years old generating more responses.
In line with trends seen previously, almost two-thirds (65 per cent) of the respondents are female, compared with 63 per cent last year. Approximately four in ten respondents are global or international in outlook, again in line with results from previous years. There has been a shift from local to national respondents, probably a result of more C-level respondents with responsibility for HR.
Respondents are trending younger, although a majority still have 20+ years’ experience
More HR respondents have a national outlook, while four in ten are international in focus
Chart 3. How old are you?
Chart 4. Please indicate the geographical spread of your responsibility.
120= 3%0= 0%
360= 18%320= 16%
800= 40%880= 44%
460= 23%460= 23%
340= 17%340= 17%
320= 8%160= 4%
560= 14%400= 10%
760= 19%600= 15%
840= 21%920= 23%
520= 13%800= 20%
480= 12%600= 15%
280= 7%360= 9%
80= 2%120= 3%
40= 1%40= 1%
18-24
25-29
30-34
35-39
40-44
45-49
50-54
55-59
60-64
65+
Local region only
National
Multi-national (but not global)
Global
50= 201550= 2014
50= 201550= 2014
GLOBAL RESULTS
HARVEY NASH HR SURVEY 201612
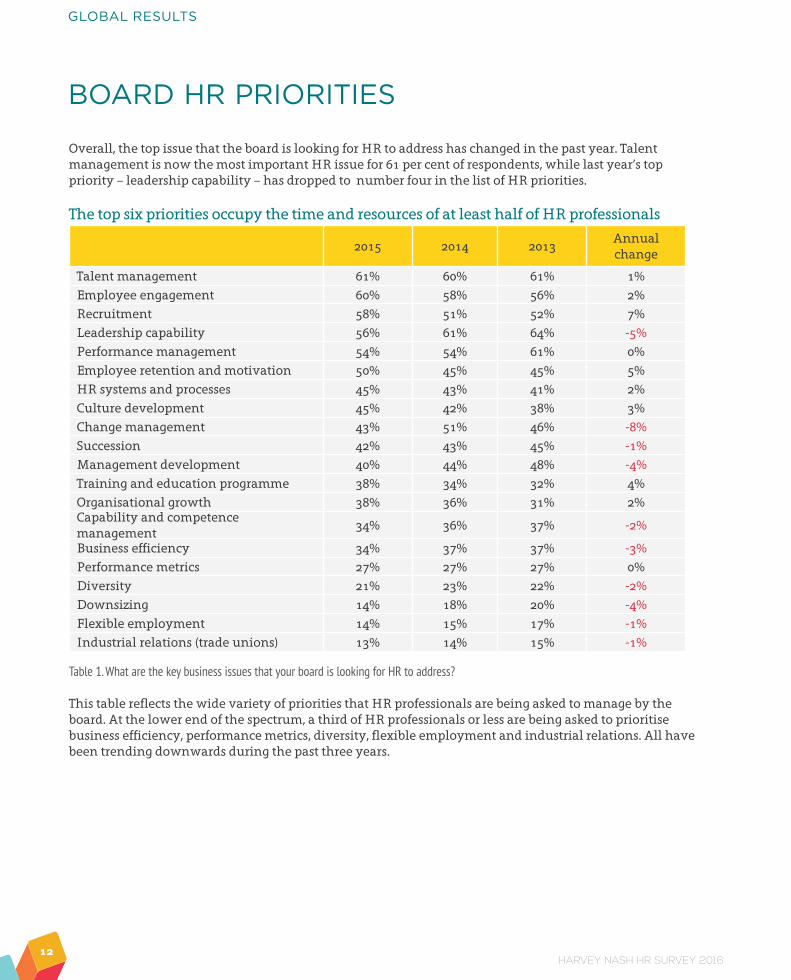
Overall, the top issue that the board is looking for HR to address has changed in the past year. Talent management is now the most important HR issue for 61 per cent of respondents, while last year’s top priority – leadership capability – has dropped to number four in the list of HR priorities.
The top six priorities occupy the time and resources of at least half of HR professionals
2015 2014 2013Annual change
Talent management 61% 60% 61% 1%Employee engagement 60% 58% 56% 2%Recruitment 58% 51% 52% 7%Leadership capability 56% 61% 64% -5%Performance management 54% 54% 61% 0%Employee retention and motivation 50% 45% 45% 5%HR systems and processes 45% 43% 41% 2%Culture development 45% 42% 38% 3%Change management 43% 51% 46% -8%Succession 42% 43% 45% -1%Management development 40% 44% 48% -4%Training and education programme 38% 34% 32% 4%Organisational growth 38% 36% 31% 2%Capability and competence management
34% 36% 37% -2%
Business efficiency 34% 37% 37% -3%Performance metrics 27% 27% 27% 0%Diversity 21% 23% 22% -2%Downsizing 14% 18% 20% -4%Flexible employment 14% 15% 17% -1%Industrial relations (trade unions) 13% 14% 15% -1%
Table 1. What are the key business issues that your board is looking for HR to address?
This table reflects the wide variety of priorities that HR professionals are being asked to manage by the board. At the lower end of the spectrum, a third of HR professionals or less are being asked to prioritise business efficiency, performance metrics, diversity, flexible employment and industrial relations. All have been trending downwards during the past three years.
BOARD HR PRIORITIES

GLOBAL RESULTS
HARVEY NASH HR SURVEY 201613
Board priorities for HR are changing. As can be seen in the chart opposite, the board is increasingly asking HR to focus on recruitment: up 7 per cent in the past 12 months. Employee retention, training and motivation are all more important this year compared with last year. During the years of economic turbulence, change management was a critical HR focus, but respondents now report it is a significantly lower priority, alongside the need to downsize.
A significant shift in HR priorities has occurred in the past 12 months
Chart 5 2014 vs 2015. What are the key business issues that your board is looking for HR to address?
-8% 800=-5% 500=
-4% 400=-4% 400=
-3% 300=-2% 200=-2% 200=
-1% 100=-1% 100=-1% 100=
0%0%100= 1%200= 2%200= 2%200= 2%300= 3%400= 4%500= 5%700= 7%
Change managementLeadership capability
Management developmentDownsizing
Business efficiencyCapability & competence management
DiversitySuccession
Flexible employmentIndustrial relations (Trade Unions)
Performance managementPerformance metrics
Talent managementEmployee engagement
HR systems & processesOrganisational growth
Culture developmentTraining & education programmeEmployee retention & motivation
Recruitment

GLOBAL RESULTS
HARVEY NASH HR SURVEY 201614
PERCEPTION OF HR
Almost two-thirds of HR professionals (65 per cent) are happy with the perception of HR in the business.
However, almost the same proportion (66 per cent) believe that “CEOs consistently rank human capital as a top challenge, but they typically undervalue their chief human resources officer.”
When asking only the C-level respondents, a majority (59 per cent) admitted that the CEO undervalues their HR leader. Similarly, when HR professionals are asked how the most senior HR figure compares with the top financial person in their organisation, only 7 per cent rated HR higher, while 47 per cent (or seven times as many HR professionals) believe the board rates Finance higher than HR.
65+35+A66+34+A
7+46+47+A
n Yesn No
n Agreen Disagree
n Moren Samen Less
35%
65%
66%
46%
34%
47%
7%
One in three HR professionals not satisfied with image of HR (as seen by rest of business)
A majority of HR professionals believe the CEO undervalues their senior HR leader
Far fewer HR professionals believe their function is respected more than Finance by the board
Chart 6. Are you satisfied with the image of the HR department as seen by the rest of the business?
Chart 7. Do you agree or disagree with this statement: “CEOs consistently rank human capital as a top challenge, but they typically undervalue their chief human resources officer”?
Chart 8. In comparison with the top financial person in your company (e.g. CFO) how important is the top HR person perceived to be by the board?

GLOBAL RESULTS
HARVEY NASH HR SURVEY 201615
Taken together these trends beg the question: Are HR professionals resigned that their function will sit on the margins of the business?
The answer is no, or rather not entirely. HR professionals are equally split as to how to address the perception of HR in the business. A slight minority (47 per cent) want to take direct control and deliver more for the business, while 53 per cent believe that HR’s focus should be to influence and advise, but ultimately that the business should take more direct control.
Strong relationships will be required between HR and other business functions if the perception of HR within the business is to improve. Currently HR’s best relationships are with Operations (rated ‘very strong’ by 54 per cent of respondents) and Finance (43 per cent). However, the functions with the most relationship-building work to do are Sales, Marketing and IT, where only three in ten HR professionals rate the existing relationship ‘very strong’.
The HR priorities rated most important to the success of the department are promoting organisational culture and values (24 per cent) and employee engagement (23 per cent). One in ten HR professionals will focus on talent management (12 per cent), recruitment (10 per cent) or HR policies (9 per cent) to promote HR value within the business. However, no HR professionals believe inclusion and diversity to be rated by the business.
65+35+A n Getting HR to do more for the businessn Getting the business to take more responsibility for HR
47%
53%
HR professionals split on best approach to improving perception of their function
Operations and Finance teams best placed to help improve perception of HR
Most important elements of HR function to the business – inclusion and diversity not rated
Chart 9. Which of the following is more important?
Table 2. How strong would you rate your department’s relationship with the following business functions?
Chart 10. In your view, which is the single most important element of the HR function?
Not strong Quite strong Very strong
Operations 5% 39% 56%Finance 12% 44% 44%Legal / Compliance 11% 42% 47%Sales 18% 45% 37%Marketing 19% 47% 34%IT 18% 53% 29%
Culture & valuesEmployee engagement
Talent managementRecruitment
HR policiesLearning & development
Reward & benefitsIndustrial relations
Internal communicationsEmployer branding
HR reportingInclusion & diversity
720= 24%690= 23%360= 12%300= 10%270= 9%210= 7%120= 4%90= 3%90= 3%90= 3%90= 3%0= 0%
GLOBAL RESULTS
HARVEY NASH HR SURVEY 201616
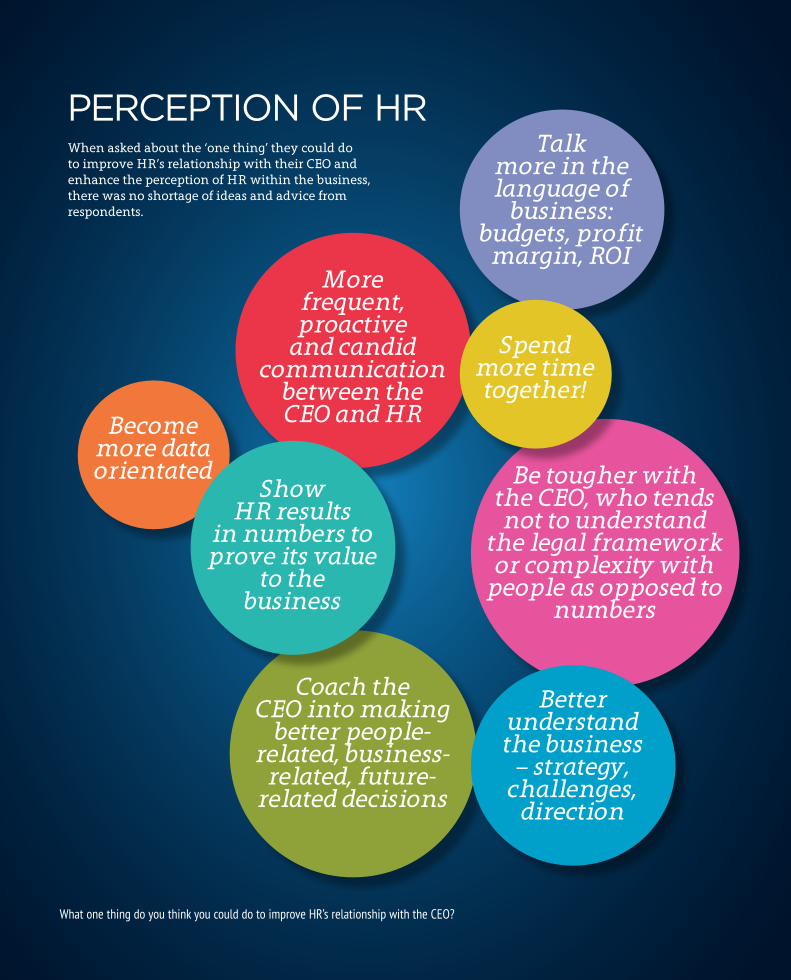
What one thing do you think you could do to improve HR’s relationship with the CEO?
More frequent, proactive
and candid communication
between the CEO and HR
Be tougher with the CEO, who tends not to understand
the legal framework or complexity with
people as opposed to numbers
Coach the CEO into making
better people-related, business-
related, future-related decisions
Talk more in the language of
business: budgets, profit
margin, ROI
Better understand the business
– strategy, challenges,
direction
Spend more time together!
Become more data orientated
Show HR results
in numbers to prove its value
to the business
When asked about the ‘one thing’ they could do to improve HR’s relationship with their CEO and enhance the perception of HR within the business, there was no shortage of ideas and advice from respondents.
PERCEPTION OF HR

GLOBAL RESULTS
HARVEY NASH HR SURVEY 201617
Many HR professionals have previously stated that to improve relationships with the business HR needs to do better at gathering and reporting metrics. Ninety-four per cent of respondents believe management information systems (MIS) and data are important to improving the perception of HR.
Perhaps even more importantly, six out of ten (60 per cent) HR professionals expect MIS to become even more significant in future.
Almost six in ten HR professionals recognise MIS as ‘very important’
A large majority of HR professionals see the role of data and MIS becoming essential
Chart 11. How important are management information systems (MIS) or data in measuring HR performance/ROI?
Chart 12. How has the importance of using MIS/data changed in the past year?
HR REPORTING AND PERFORMANCE
56+38+6+A
60+39+1+A
n Very importantn Quite importantn Not important
n Increasedn Stayed the samen Decreased
56%
60%
38%
39%
6%
1%

GLOBAL RESULTS
HARVEY NASH HR SURVEY 201618
2015 2014 2013 Change in past
year
Recruitment challenges in local economic region 58% 55% 52% 3%
Tight labour supply and skill shortages generally 44% 43% 51% 1%
Demographic shift/ageing workforce 42% 50% 39% -8%
Growing demand for flexible contract employment options – employee
33% 33% 26% 0%
Education system not aligned with hiring needs 31% 25% 20% 6%
Growing demand for flexible contract employment options – employer
23% 28% 26% -5%
Talent immigration 19% 12% 14% 7%
Talent emigration 16% 13% 10% 3%
Widespread unemployment 5% 4% 8% 1%
Recruitment challenges remain the most significant labour market concern for HR professionals. Almost six in ten (58 per cent) say they will be responding to local recruitment challenges in 2016, up 3 per cent from last year. There is also a growing concern among HR professionals that their education system is not aligned with their hiring needs; three in ten (31 per cent) expect this as an issue this year, up 6 per cent on last year. Probably linked to both of these concerns, the fastest-growing labour market concern for HR professionals is talent immigration. Although only one in five (19 per cent) will be proactively engaged in this issue, by lobbying government on visa regulations for example, this is up 7 per cent compared with 12 months ago and reflects the seriousness of local challenges in recruiting talent.
Concern about ageing workforces and demographic shifts appears to be receding, down 8 per cent compared with last year. However, it is unlikely that HR professionals have found a way to reverse the ageing process! It is more likely that organisations are adapting to the reality of an ageing workforce, and therefore responding to the issue is less of a concern to them. The UK is the only exception, where 55 per cent of HR professionals are responding to ageing workforce issues, up 6 per cent on last year.
LABOUR MARKET TRENDS
HR professionals report concerns linked to talent acquisition
Fewer HR professionals responding to ageing workforce issues this year, except in the UK
Table 3. What labour market trends do you anticipate you will be responding to in the next two years?
Chart 13. What labour market trends do you anticipate you will be responding to in the next two years? Ageing workforce
550= 55%490= 49%
490= 49%530= 53%
420= 42%500= 50%
410= 41%450= 45%
260= 26%450= 45%
UK
Europe
Global Av.
Nordics
Asia-PAC
50= 201550= 2014

GLOBAL RESULTS
HARVEY NASH HR SURVEY 201619
With growing concern about the ability to source local talent, it is no surprise that a large majority of HR professionals are sourcing talent from overseas. Only one-third (36 per cent) of respondents have no talent sourced from overseas. For almost half of HR professionals (45 per cent) up to one in ten of their workers are internationally sourced. For 12 per cent of HR professionals up to a quarter of their workforce is not recruited locally. And for 8 per cent of HR professionals more than a quarter of all staff are sourced from overseas.
HR professionals in Asia-PAC are more likely to have sourced more than a quarter of their workforce from overseas compared with any other region of the survey audience.
Looking ahead, the importance of overseas labour is going to grow for up to a quarter (23 per cent) of HR professionals, while almost seven in ten (68 per cent) will maintain current levels of overseas talent. Only 9 per cent plan to decrease international sourcing and expect to find sufficient talent locally.
HR professionals report significant dependence on international labour pool to source talent
Asia-PAC HR professionals most dependent on overseas talent
Over 90 per cent of HR professionals will maintain or grow dependence on overseas labour
Chart 14. What proportion of your current workforce is sourced from overseas?
Chart 15. What proportion of your current workforce is sourced from overseas? More than 25%
Chart 16. Over the next year, do you plan to increase or decrease the proportion of people your company recruits from overseas?
Global Av.Asia-PAC
UKEurope
Nordics
800= 8%800= 8%700= 7%700= 7%600= 6%
720= 36%880= 44%240= 12%100= 5%40= 2%20= 1%
23+68+9+A n Increasen Keep the samen Decrease
68%
9%23%
None1-10%
11-25%26-40%41-50%
51%+

GLOBAL RESULTS
HARVEY NASH HR SURVEY 201620
HR professionals in Asia-PAC are more intent on sourcing labour from overseas next year; 27 per cent anticipate doing this compared with HR professionals in Europe and the global average, at 23 per cent.
The trend for flexible work remains in line with previous years. Approximately one in ten HR professionals (12 per cent) offer no flexible work options; whilst almost half (49 per cent) provide it to up to 10 per cent of the workforce. Four in ten offer flexible work to more than 10 per cent of the workforce.
A quarter (24 per cent) of HR professionals in Asia-PAC trend above the global average for offering flexible work. The Nordics (6 per cent) have the fewest flexible work options within the survey community.
UK least likely to increase proportion of people recruited from overseas
Flexible work embraced most in Asia-PAC (for larger proportion of workforce)
Four in ten HR professionals offer flexible work to more than 10 per cent of workforce
Chart 17. Over the next year, do you plan to increase or decrease the proportion of people your company recruits from overseas? Increase
Chart 19. What proportion of your current workforce is flexible labour? 25+%
Chart 18. What proportion of your current workforce is flexible labour?
Asia-PACGlobal Av.
EuropeNordics
UK
Asia-PACGlobal Av.
EuropeUK
Nordics
810= 27%690= 23%690= 23%660= 22%540= 18%
720= 24%540= 18%450= 15%420= 14%180= 6%
240= 12%380= 19%
9500= 49%10000= 53%
460= 23%460= 23%
160= 8%140= 7%
100= 5%60= 3%
100= 5%100= 5%
None
1-10%
11-25%
26-40%
41-50%
51%+
50= 201550= 2014

GLOBAL RESULTS
HARVEY NASH HR SURVEY 201621
Table 4. Please rate how important each of the following tools is in your recruitment strategy.
Chart 20 2015 vs 2014. Please rate how important each of the following tools are in your recruitment strategy?
Chart 21. Approximately, what percentage of your recruitment is directly hired (i.e. direct to the candidate, without using a recruitment organisation or other third party)?
Recruitment tools rated ‘very important’ to HR function’s recruitment strategy
More than 85 per cent of HR professionals are now directly engaged in the recruitment activity of their organisation. A wide range of recruitment techniques have been adopted to deliver competitive talent acquisition programmes.
Digital platforms are almost exclusively more popular this year with one notable exception: the use of corporate websites as a recruiting tool has dropped 5 per cent this year while the use of online job boards has increased 7 per cent.
The use of social media platforms like Facebook and Twitter in the recruitment process has also increased strongly this year (up 7 per cent), while LinkedIn continues its rapid rise in usage (up 6 per cent this year, and up 13 per cent in the past 24 months).
However, offline tools continue to play an important role, with 44 per cent of HR professionals rating the personal network of the recruiter as ‘very important’, up 5 per cent on last year. Employee referral programmes have also grown in importance during the past two years.
With an increasingly powerful range of digital recruitment tools available to them, HR professionals are able to take more responsibility for the direct management of the hiring process.
More than half of HR professionals (52 per cent) use direct recruitment tools for a majority of their hires, and three in ten HR professionals will recruit almost exclusively via direct channels.
Less than 10% 11 – 25%
26 – 50%51 – 75%
76 – 100%
450= 15%450= 15%570= 19%720= 24%840= 28%
RECRUITMENT
2015 2014 2013
Annual change
Online job boards 49% 42% 41% 7%
Corporate website 49% 54% 53% -5% Personal network of the recruiter 44% 39% 36% 5%
LinkedIn 43% 37% 30% 6%
Recruitment companies 36% 34% 33% 2%Employee referral programme 35% 31% 27% 4%
Social media (Facebook, Twitter, etc.) 29% 22% 21% 7%
Alumni programme 8% 5% 5% 3%
Printed adverts 7% 5% 9% 2%
Increased use of most recruitment tools this year, except corporate websites
Approximately half of HR professionals use direct recruitment tools for majority of hires
-6% 600=200= 2%200= 2% 300= 3% 400= 4%500= 5%600= 6% 700= 7% 700= 7%
Corporate websiteRecruitment companies
Printed advertsAlumni programme
Employee referral programmePersonal network of the recruiter
LinkedInOnline job boards
Social media (Facebook, Twitter etc.)

GLOBAL RESULTS
HARVEY NASH HR SURVEY 201622
HR DISRUPTION AND THE FUTURE
What major trends are likely to significantly change/disrupt the HR function?
Keeping up with the pace of
change
The next generation of
talent is entering the workplace without key technical skills
Legislation will increasingly
restrict – rather than support – employees in a
mobilised world
Learning and development
will be a critical retention factor
Automation of HR
processes
Ageing workforce
and the resultant skill
gaps
Rising wages
Agile working
Delivering HR in a digital
world
The role of
social media, technology and direct access to
candidates
What will disrupt the HR function in the future?
HR professionals anticipate that a wide range of trends will disrupt the HR function in the future. How they manage this expected disruption will have a significant impact on the perception of HR within the business.
HR DISRUPTIONAND THE FUTURE

HARVEY NASH HR SURVEY 201623
GLOBAL RESULTS HR disruption and the future If you could design the perfect HR function, what would be its mission and structure? Despite the potential for disruption, HR professionals foresee an exciting future for their function and have a strong belief that HR can continue to deliver value to their organisation.
To be proactive Deliver an outward-looking HR process
To deliver business value through the talent and flexibility of its people
HR would be a true partner at the highest level, with a voice central to the core business strategy
Increased focus on leadership, emotional intelligence and company culture
Focused on talent management, culture and professional development
To embody the values of the company but also feed back vital market intelligence to the CEO on
external talent trends
To facilitate commercial performance through people
Increase long-term focus and organise the HR function around profit
To create a ‘high trust’ culture
If you could design the perfect HR function, what would be its mission and structure?
23
GLOBAL RESULTS
HR DISRUPTION AND THE FUTURE
If you could design the perfect HR function, what would be its mission and structure?
HR would be a true partner at the highest level, with
a voice central to the core business
strategy
To embody the values of the
company but also feed back vital market
intelligence to the CEO on external
talent trends
Focused on talent
management, culture and
professional development
To facilitate
commercial performance
through people
Increased focus on
leadership, emotional
intelligence and company
culture
To create a
‘high trust’ culture
To be proactive
Increase long-term focus
and organise the HR function
around profit
To deliver business
value through the talent and
flexibility of its people
If you could design the perfect HR function, what would be its mission and structure?
Despite the potential for disruption, HR professionals foresee an exciting future for their function and have a strong belief that HR can continue to deliver value to their organisation.
HR DISRUPTIONAND THE FUTURE
Deliver an outward-looking
HR proces

GLOBAL RESULTS
HARVEY NASH HR SURVEY 201624
By a wide margin, HR professionals are more optimistic today about employee engagement compared with five years ago. Half (50 per cent) believe engagement has improved, compared with only 20 per cent who think employee engagement has deteriorated since 2010.
Opinion surveys remain, by far, the most used tool for measuring engagement (82 per cent), although six in ten (59 per cent) track retention levels as a measure of engagement. A sizeable proportion still do not measure employee engagement at all, despite the board making it a priority for the HR function. ‘Other’ metrics include: ‘informal feedback’, ‘performance review curve’ and ‘employee development dialogue’.
HR professionals believe that promoting a positive, open culture can contribute most to enhancing employee engagement (83 per cent). However, staff events (70 per cent) and offering flexible work (53 per cent) will be used by a majority of HR professionals to improve employee engagement.
Twice as many HR professionals optimistic about employee engagement compared with past
Majority of HR professionals rely on surveys to measure employee engagement
Open culture rated higher than staff events and flexible working to enhance employee engagement
Chart 22. Compared with five years ago, has employee engagement got better or worse?
Chart 23. How do you measure employee engagement?
Chart 24. What methods are you using to engage your employees?
EMPLOYEE ENGAGEMENT
50+30+20+A n Bettern Samen Worse
30%
20%
50%
Opinion surveysRetention levels
Other
Promoting a positive, open cultureStaff events (social, charitable etc.)
Flexible working practicesStaff forums
Creative reward structures
820= 82%590= 59%120= 12%
830= 83%700= 70%530= 53%470= 47%450= 45%

GLOBAL RESULTS
HARVEY NASH HR SURVEY 201625
Chart 25. Does your organisation have a talent management programme in place? Yes (Small = company with <100 employees, Mid-sized = 100 – 999, Large = 999+)
Chart 26. What reward initiatives is your company using to engage and attract employees?
Table 5. What reward initiatives is your company using to engage and attract employees? Healthcare benefits
TALENT MANAGEMENT
Six in ten HR professionals (61 per cent) have a talent management programme in place. This is essentially unchanged from last year (63 per cent). However, at smaller organisations the proportion of HR professionals with a formal talent management programme in place has dropped by 8 per cent. There is slightly more investment in talent management programmes at mid-sized organisations this year (60 per cent of HR professionals have one; unchanged from last year). Large company HR professionals are most likely to invest in talent management.
A large majority of HR professionals (71 per cent) indicate that healthcare benefits are the most popular method of rewarding employee engagement and talent retention. Flexible benefits are also used by over half of HR professionals (55 per cent).
Across the regions surveyed, the top reward offered to attract and engage employees is healthcare benefits. A large majority of HR professionals provide rewards, and almost eight in ten HR professionals in the Nordics offer healthcare benefits, compared with 66 per cent in Asia-PAC.
HR professionals at smaller organisations indicating less investment in talent management
HR professionals use healthcare benefits as primary reward for talent retention schemes
Healthcare benefits most offered as reward for employee engagement
Healthcare benefits Flexible benefits
Discount schemesNon-monetary
710= 71%550= 55%370= 37%320= 32%
610= 61%630= 63%
460= 46%540= 54%
600= 60%600= 60%
710= 71%700= 70%
Average
Small
Mid-sized
Large
Region Top reward % Offering
Nordics Healthcare benefits 78%
United Kingdom Healthcare benefits 75%
Global Av. Healthcare benefits 71%
Europe Healthcare benefits 71%
Asia-PAC Healthcare benefits 66%
50= 201550= 2014

GLOBAL RESULTS
HARVEY NASH HR SURVEY 201626
Far more HR professionals (76 per cent) focus their talent management strategy on developing talent compared with rewarding people (45 per cent). Seven in ten use talent management to develop future leaders and prepare for succession, while six in ten include a focus on recruitment (63 per cent) and reinforcing behaviour and values (60 per cent).
However, less than half of HR professionals (47 per cent) measure the effectiveness of leadership development. Given the importance placed on talent management and leadership development by the board, it is surprising that so few HR professionals seek to measure results. The exception is HR professionals in Asia-Pacific, where a majority (60 per cent) do track results.
For those HR professionals who measure leadership development results, a majority (55 per cent) track leadership behaviours, while four in ten (38 per cent) use employee retention figures to measure success. Only a quarter (24 per cent) link company profitability to leadership development.
Only approximately one in ten HR professionals rate their leadership development programme as ‘very effective’ while three in ten admit it is ‘not effective’.
Internal and management focus for talent management, over external recruitment value
Fewer HR professionals in Europe track leadership development metrics compared with ASIA-PAC
Fewer HR professionals link leadership development results to profitability
Nine in ten leadership development programmes could be better
Chart 27. What does your talent management strategy include?
Chart 28. Do you measure the effectiveness of your leadership development? Yes
Chart 29. If ‘yes’, how do you measure your leadership development?
Chart 30. How effective is your leadership development?
Talent developmentSuccession
Management developmentRecruitment
Behaviours and valuesRewarding talent
760= 76%710= 71%700= 70%630= 63%600= 60%450= 45%
ASIA-PACGlobal Av.
NordicsEurope
UK
Company profitabilityEmployee retention figures
Leadership behaviours
600= 60%470= 47%440= 44%420= 42%410= 41%
240= 24%380= 38%550= 55%
10+62+28+A n Very effectiven Quite effectiven Not effective
10%28%
62%

GLOBAL RESULTS
HARVEY NASH HR SURVEY 201627
Eight in ten HR professionals confident they provide an effective environment to develop skills
Asia-Pacific rate themselves highest at creating positive skills environment
Progress shown in deployment of performance management programmes
Large majority of HR professionals committed to ‘high performance strategy’
Chart 31. How strongly do you agree that your organisation provides an effective environment to develop skills?
Chart 32. How strongly do you agree that your organisation provides an effective environment to develop skills? Agree or Strongly agree
Chart 33. To what extent has a performance management programme been implemented at your company?
Chart 34. To what extent is a high performance strategy important to your company?
A large majority of HR professionals (83 per cent) agree or strongly agree that their organisation provides an effective environment to develop skills. However, this is not a uniform view from HR professionals around the world.
A majority of HR professionals in the UK and Europe (77 per cent and 78 per cent) believe they offer an effective environment to develop skills. HR professionals from Asia-Pacific are even more optimistic (90 per cent) regarding their environment to develop skills, above the global average (83 per cent).
There has been some progress in the past 12 months in the deployment of performance management programmes. While the proportion of HR professionals who have fully rolled out their programme remains static at 30 per cent, there has been a 5 per cent jump (from 28 per cent to 33 per cent) of HR professionals who have most initiatives in place (although there are still gaps). The proportion of HR professionals with no performance management programme in place has fallen from 13 per cent to 10 per cent this year.
The focus by HR professionals on performance is reinforced clearly with only 6 per cent reporting that ‘a high performance strategy’ was not important to their organisation. Six in ten HR professionals (57 per cent) rated ‘high performance’ as very important.
ASIA-PACGlobal Av.
NordicsEurope
UK
900= 90%830= 83%820= 82%780= 78%770= 77%
19+65+15+1+A
57+37+6+A
n Strongly agreen Agreen Disagreen Strongly disagree
n Strongly agreen Agreen Disagree
16%
6%
1%
19%
57%
65%
37%
900= 30%900= 30%
990= 33%840= 28%
810= 27%840= 28%
300= 10%390= 13%
Fully
Mostly
Partially
No extent
50= 201550= 2014

GLOBAL RESULTS
HARVEY NASH HR SURVEY 201628
The gender split in HR remains essentially unchanged compared with last year. Almost two-thirds of respondents (65 per cent) were female, compared with 62 per cent last year. However, at the Chief HR Officer level the demographic switches to a more balanced 50 per cent male and 50 per cent female. This is an improvement on the senior HR leadership demographic last year (where 61 per cent were male and 39 per cent female).
A majority of HR professionals (55 per cent ) have ‘all’ or ‘most’ diversity programmes in place, up slightly on last year. However, this suggests there has been little or no diversity progress for 45 per cent.
Diversity programmes are being implemented at different speeds in various global regions. The Nordics have the highest implementation rate (57 per cent) but only 54 per cent are satisfied with this progress.
More than half of HR professionals believe they have mostly or fully delivered diversity initiatives
Regional satisfaction with diversity progress often higher than implementation of programmes
Chart 35. To what extent do you have a formal strategy/policy for promoting diversity in your organisation?
Chart 36. Are diversity programmes in place and are you satisfied with how diversity is progressing in your organisation?
DIVERSITY
19 33 28 29 20 1533
660= 22%570= 19%
570= 57%540= 54%
990= 33%960= 32%
560= 56%630= 63%
840= 28%870= 29%
550= 55%580= 58%
510= 17%600= 20%
540= 54%530= 53%
530= 53%570= 57%
All relevant policies in place
Most initiatives in place
Some initiatives, but major gaps
Very few initiatives in place
Nordics
ASIA-PAC
Global Av.
United Kingdom
Europe
50=
50=
Are diversity programmes in place in all or most of your organisation?Are you satisfied with how diversity is progressing?
50= 201550= 2014

GLOBAL RESULTS
HARVEY NASH HR SURVEY 201629
Government HR functions lead the way, delivering ‘all or most’ of their diversity programme
In most sectors satisfaction exceeds actual progress with diversity programmes
Chart 37. To what extent do you have a formal strategy/policy for promoting diversity in your organisation? All/Most by sector
Chart 38. Are diversity programmes in place and are you satisfied with how diversity is progressing in your organisation?
Progress of diversity programme implementation varies greatly between sectors.
However, for a number of sectors, satisfaction with their diversity programme outpaces the actual implementation progress. In Retail, for example, although only 53 per cent of HR professionals have implemented all or most of their diversity programme, 67 per cent are happy with this apparent progress. The only sectors where implementation exceeds satisfaction are Financial Services (by 10 per cent), Government (8 per cent), Technology (3 per cent) and Transport (3 per cent).
560= 56%460= 46%
880= 88%800= 80%
570= 57%610= 61%
610= 61%580= 58%
470= 47%520= 52%
570= 57%540= 54%
390= 39%470= 47%
660= 66%670= 67%
650= 65%660= 66%
530= 53%670= 67%
Financial Services
Government
Technology
Transport
Non-profit
Healthcare
Professional Services
Manufacturing
Construction
Retail
GovernmentNon-profitHealthcareTechnology
TransportProfessional Services
Financial ServicesAverage
RetailManufacturing
Construction
880= 88%660= 66%650= 65%610= 61%570= 57%570= 57%560= 56%550= 55%530= 53%470= 47%390= 39%
50= Most or all implemented50= Satisfaction with diversity

GLOBAL RESULTS
HARVEY NASH HR SURVEY 201630
Compared with the previous two years, more HR professionals moved job in 2015 (21 per cent compared with 16 per cent in 2014 and 17 per cent in 2013). Similarly, the proportion of HR professionals who have been with their current employer for six years or more is falling.
Looking ahead, although 50 per cent of HR professionals plan to be in a new job in the next two years this is down on previous trends (57 per cent in 2014 and 56 per cent in 2013 planned a job move within a similar timescale). Given the higher proportion of HR professionals who moved job in the past 12 months, a shift towards medium-term career planning is understandable.
Job turnover for HR professionals increased in 2015
Fewer HR professionals planning immediate job move compared with previous years
Chart 39. How long have you worked for your current employer?
Chart 40. How long, from this point onwards, do you expect to stay with your current employer?
HR CAREER
420= 21%320= 16%340= 17%
400= 20%540= 27%460= 23%
520= 26%560= 28%520= 26%
600= 30%560= 30%520= 33%
570= 29%520= 26%520= 26%
700= 35%580= 28%620= 31%
320= 16%360= 18%360= 18%
180= 9%180= 9%160= 8%
160= 8%240= 12%260= 13%
120= 6%120= 6%100= 5%
Less than 1 year
1 - 2 years
3 - 5 years
6 - 10 years
More than 10 years
Less than 1 year
1 - 2 years
3 - 5 years
6 - 10 years
More than 10 years
50= 201550= 201450= 2013
50= 201550= 201450= 2013

HARVEY NASH HR SURVEY 201631
GLOBAL RESULTS
Job satisfaction has stabilised within the HR professional community with approximately one-third (32 per cent) reporting to be ‘very fulfilled’ in their role. Overall, 82 per cent of HR professionals are satisfied, almost unchanged from 81 per cent last year, but down from the high of 85 per cent in 2013.
A number of the indicators that contribute to the job satisfaction of HR professionals are falling. An important role for HR (49 per cent) and the ability to undertake interesting work (44 per cent) remain the top factors, but both are falling. Financial considerations play a bigger role in job satisfaction this year. Having a financially secure organisation is important for 18 per cent (up 4 per cent) and a good salary is important for 27 per cent (up 5 per cent). However, the fastest-growing contributor is ‘a culture of open communication’, important for 28 per cent (up 7 per cent this year).
2015 2014 2013Annual change
A sense that HR has an important role to play in the organisation 49% 51% 58% -2%
Interesting and exciting work 44% 53% 55% -9%
A feeling that I am empowered 38% 42% 40% -4%
An opportunity to shape the business strategy 37% 41% 41% -4%
Access to management/contribute to strategy 32% 34% 37% -2%
A culture of open communication 28% 21% 24% 7%
Good salary 27% 22% 26% 5%
Competent management and a vision for the future 23% 28% 27% -5%
A creative/entrepreneurial environment 22% 22% 21% 0%
A reputation for fairness and respect 20% 18% 20% 2%
The opportunity to build a rewarding career 20% 19% 20% 1%
A financially secure organisation 18% 14% 14% 4%
Working for a brand I align with 18% 18% 17% 0%
A large organisation – international career opportunities 12% 11% 13% 1%
HR professionals’ job satisfaction stabilises, remains lower than peak in 2013
Chart 41. How fulfilling do you find your current role?
Many indicators of HR professional job satisfaction have dropped in the past 12 months
Table 6. Please identify the three factors which contribute most to your sense of fulfilment.
640= 32%640= 32%720= 37%
1000= 50%980= 49%960= 48%
300= 15%320= 16%240= 12%
60= 3%80= 4%60= 3%
Very fulfilling
Quite fulfilling
Not very fulfilling
Not at all fulfilling
50= 201550= 201450= 2013

GLOBAL RESULTS
HARVEY NASH HR SURVEY 201632
The top reason why HR professionals move job remains ‘a fresh challenge’ (for 64 per cent). However, this has dropped 3 per cent since 2014, and is the only indicator to fall. Greater involvement in business strategy is an important reason for moving job for almost half (48 per cent), up 3 per cent this year.
Yet the fastest-growing reason for HR professionals to move job is ‘more money’: up 9 per cent since last year, and important to 42 per cent. The importance of work/life balance is also growing, but it is not increasing as fast as the financial incentive to move.
2015 2014Annual change
A fresh challenge 64% 67% -3% Greater involvement in business strategy
48% 45% 3%
More money 42% 33% 9%
Better work/life balance 42% 36% 6%
Major change programme 24% 21% 3%
Seat on the board 21% 18% 3%
Greater budget responsibility 14% 9% 5%Greater financial stability of employer
14% 9% 5%
The challenge of a new job remains most important factor in decision to move, but it is falling
Fastest-growing reason to move job is ‘more money’
Table 7. If you were to move to a new role/organisation, which of the following factors would most affect your decision making?
Chart 42. If you were to move to a new role/organisation, which of the following factors would most affect your decision making?
A fresh challengeGreater involvement in business strategy
Major change programmeSeat on the board
Greater budget responsibilityGreater financial stability of employer
Better work/life balanceMore money
-3% 300=300= 3%300= 3% 300= 3% 500= 5%500= 5%600= 6% 900= 9%

GLOBAL RESULTS
HARVEY NASH HR SURVEY 201633
More HR professionals advancing their career to the executive management level
HR professionals set their sights on the C-suite during their career
Chart 43. Are you a member of the operational board/executive management team of your organisation? Yes
Chart 44. What role do you ultimately aspire to?
A higher proportion of HR professionals are being appointed to their executive management team or operational board. This year 54 per cent of respondents report their career milestone, compared with 50 per cent last year.
The career aspirations of HR professionals appear to be rising. More respondents are aiming to join the C-suite and represent the HR function during their career (23 per cent), compared with 21 per cent last year. A growing number also aspire to run their organisation as CEO; 12 per cent hold this as an ambition, up from 8 per cent last year.
1000= 54%880= 50%
50= 201550= 2014
50= 201550= 2014
920= 23%840= 21%
840= 21%920= 23%
640= 16%760= 19%
480= 12%320= 8%
240= 6%200= 5%
240= 6%160= 4%
240= 6%320= 8%
120= 3%80= 2%
Chief HR Officer
VP/Director HR
Head of HR
Chief Executive
HR Business Partner
Chief Operating Officer
(Senior) Manager HR
Other C-Level

GLOBAL RESULTS
HARVEY NASH HR SURVEY 201634
HR SALARIES
Based on the analysis of 526 HR professionals who provided salary information, we have calculated that the average salary for HR professionals who responded to the survey is €99,715 per year.
Across the main regions of the survey audience, a Chief HR Officer can earn, on average, almost €150,000 per year, while their VP/Director can command almost €135,000. Salary inflation is steady throughout the leadership ranks of the HR function.
Chief HR Officers at larger organisations (1,000+ people) can command the highest salaries in HR. Many small firms (fewer than 100 employees) do not have a VP of HR or Chief HR Officer; in fact senior HR Managers are paid – on average – more highly than Head of HR job titles at smaller organisations. This may be due to the smaller size of the HR function and the use of job titles in smaller organisations.
Average annual HR salary by region
Average salary by HR job description
Average salary by HR job description and size of organisation
Table 8. What is your base salary? Average by region
Table 9. What is your base salary? Average by job title
Table 10. What is your base salary? Average by job title and size of organisation
UK €111,413
Europe €103,846
Global Average €99,715
Nordics €98,582
ASIA-PAC €77,123
Chief HR Officer €149,057
VP/Director HR €134,184
Head of HR €93,750
(Senior) HR Manager €77,950
HR Exec (non-manager) €73,454
Small Mid Large
Chief HR Officer N/A €132,143 €169,231
VP/Director HR €125,000 €117,442 €148,558
Head of HR €68,750 €89,423 €113,971
HR Manager €77,381 €74,242 €89,286
HR Exec (non-manager) €70,000 €72,159 €77,500

GLOBAL RESULTS
HARVEY NASH HR SURVEY 201635
Three-quarters of HR professionals are eligible for a performance bonus in addition to their annual salary.
A majority of HR professionals – seven in ten – are satisfied or extremely satisfied with their remuneration. More than one in ten (12 per cent) are extremely satisfied and believe they are well rewarded for what they do. The largest proportion are happy and see their remuneration package as fair, while 28 per cent feel they are paid less than they are worth.
75+25+A n Yesn No
75%
25%
Large majority of HR professionals qualify for bonus
Chart 45. Are you eligible for a performance bonus?
Most HR professionals satisfied with remuneration
Chart 46. Overall, how satisfied are you with your current remuneration package?
60+28+12+An Extremely satisfiedn Satisfiedn Dissatisfied
12%28%
60%
OUR PORTFOLIO OF SURVEYS FOR 2016...CIO SURVEY / TECHNOLOGY SURVEY
HUMAN RESOURCES SURVEY / THE BOARD REPORT
WWW.HARVEYNASH.COM

37
2. REGIONAL PROFILES

REGIONAL PROFILES
HARVEY NASH HR SURVEY 201638
ASIA-PACIFIC (APAC) REGION
Compared with the global average, an HR professional from APAC is…
Less likely to be global in outlook 12 per cent have a global spread of responsibility, 5 per cent lower than the global average (17 per cent)
More satisfied with HR image69 per cent are satisfied with the image of HR, 4 per cent higher than the global average (65 per cent)
Less focused on employee engagement
14 per cent identify employee engagement as their top HR priority, 9 per cent less than the global average (23 per cent)
More likely to value metrics and HR reporting 64 per cent rate the use of metrics and HR reporting very important, 7 per cent more than the global average (57 per cent)
More troubled by recruitment challenges65 per cent expect recruitment challenges in the next two years, 8 per cent more than the global average (57 per cent)
Less likely to offer flexible working16 per cent do NOT offer any type of flexible work options, 5 per cent higher than the global average (11 per cent)
More dependent on overseas workers27 per cent will increase their use of talent sourced from overseas, 4 per cent higher than the global average (23 per cent)
Equally likely to invest in talent management60 per cent have implemented a talent management programme, the same percentage as the global average (61 per cent)
More satisfied with diversity progress64 per cent are satisfied with progress of diversity programme, 6 per cent higher than the global average (58 per cent)
Asia-PAC includes Australia, China, Japan, Singapore and Vietnam.

REGIONAL PROFILES
HARVEY NASH HR SURVEY 201639
HR professionals from APAC are less focused on talent management this year, although it remains the top HR priority for more than six in ten (62 per cent), a drop from 76 per cent last year. Less focus is also being given to employee engagement and leadership capability this year (both down 13 per cent). However, recruitment has become a top priority for 62 per cent of APAC HR professionals (up 7 per cent), and employee retention is growing in importance (up 13 per cent). Almost twice as many HR professionals in APAC are focused on training and education, up from 26 per cent last year to 53 per cent today.
When it comes to their own career development, HR professionals from APAC are less likely to move job in the immediate future. Eleven per cent plan to move job in the next year, compared with 13 per cent in 2014. In fact, possibly as a result of economic instability in the region, more than a quarter of HR professionals in APAC (26 per cent) would prefer to stay with their current employer for six years or more, up from 17 per cent when asked last year.
Top HR priorities in APAC
APAC HR professionals planning to move job
620= 62%760= 76%
620= 62%550= 55%
600= 60%470= 47%
580= 58%400= 40%
570= 57%370= 37%
550= 55%680= 68%
530= 53%260= 26%
480= 48%610= 61%
480= 48%470= 47%
420= 42%450= 45%
Talent management
Recruitment
Employee retention
Performance management
HR Systems & Processes
Employee engagement
Training & education
Leadership capability
Culture development
Organisational growth
110= 11%130= 13%
270= 27%270= 27%
370= 37%430= 43%
140= 14%100= 10%
120= 12%70= 7%
Less than 1 year
1 - 2 years
3 - 5 years
6 - 10 years
More than 10 years
50= 201550= 2014
50= 201550= 2014
Key priorities the Board wants to address
How long from this point onwards do you expect to stay with your current employer?

REGIONAL PROFILES
HARVEY NASH HR SURVEY 201640
GERMANY
Compared with the global average, an HR professional from Germany is…
More likely to be global in outlook 42 per cent have a global spread of responsibility, 25 per cent higher than the global average (17 per cent)
Equally satisfied with HR image64 per cent are satisfied with the image of HR, the same percentage as the global average (65 per cent)
Less focused on employee engagement10 per cent identify employee engagement as their top HR priority, 13 per cent less than the global average (23 per cent)
More likely to value metrics and HR reporting 70 per cent rate the use of metrics and HR reporting very important, 13 per cent more than the global average (57 per cent)
Less troubled by recruitment challenges20 per cent expect recruitment challenges in the next two years, 37 per cent less than the global average (57 per cent)
Equally likely to offer flexible working10 per cent do NOT offer any type of flexible work options, the same percentage as the global average (11 per cent)
More dependent on overseas workers30 per cent will increase their use of talent sourced from overseas, 7 per cent higher than the global average (23 per cent)
More likely to invest in talent management69 per cent have implemented a talent management programme, 8 per cent higher than the global average (61 per cent)
Less satisfied with diversity progress50 per cent are satisfied with progress of diversity programme, 8 per cent lower than the global average (58 per cent)

REGIONAL PROFILES
HARVEY NASH HR SURVEY 201641
Top HR priorities in Germany
German HR professionals planning to move job
9 8 720 13 1013 46 47
Change management (up 13 per cent) has replaced employee retention (down 4 per cent) as the top priority for most HR professionals in Germany. Leadership capability is also a rising priority (for 73 per cent) of HR professionals, up 4 per cent. Also more important this year are HR systems and processes (up 9 per cent), while recruitment (down 16 per cent), employee engagement (down 33 per cent) and performance metrics (down 10 per cent) are all less of a priority this year.
HR professionals in Germany are more likely to be planning a career move in the next year (25 per cent) compared with last year (9 per cent). Fewer HR professionals in Germany plan to move job in the next 2–5 years compared with last year, and 37 per cent plan to stay in their current roles for more than six years, compared with 18 per cent who had the same intention last year.
820= 82%690= 69%
730= 73%770= 77%
730= 73%690= 69%
640= 64%770= 77%
550= 55%460= 46%
460= 46%620= 62%
360= 36%690= 69%
360= 36%460= 46%
Change management
Employee retention
Leadership capability
Talent management
HR Systems & Processes
Recruitment
Employee engagement
Performance metrics
250= 25%90= 9%
130= 13%270= 27%
250= 25%460= 46%
120= 12%80= 8%
250= 25%100= 10%
Less than 1 year
1 - 2 years
3 - 5 years
6 - 10 years
More than 10 years
50= 201550= 2014
50= 201550= 2014
Key priorities the Board wants to address
How long from this point onwards do you expect to stay with your current employer?

REGIONAL PROFILES
HARVEY NASH HR SURVEY 201642
HONG KONG
Compared with the global average, an HR professional from Hong Kong is…
Less likely to be global in outlook 12 per cent have a global spread of responsibility, 5 per cent lower than the global average (17 per cent)
Less satisfied with HR image58 per cent are satisfied with the image of HR, 7 per cent lower than the global average (65 per cent)
Less focused on employee engagement17 per cent identify employee engagement as their top HR priority, 6 per cent less than the global average (23 per cent)
Equally likely to value metrics and HR reporting
57 per cent rate the use of metrics and HR reporting very important, the same percentage as the global average (57 per cent)
More troubled by recruitment challenges68 per cent expect recruitment challenges in the next two years, 11 per cent more than the global average (57 per cent)
More likely to offer flexible working4 per cent do NOT offer any type of flexible work options, 7 per cent less than the global average (11 per cent)
Equally dependent on overseas workers
22 per cent will increase their use of talent sourced from overseas, the same percentage as the global average (23 per cent)
Less likely to invest in talent management48 per cent have implemented a talent management programme, 13 per cent lower than the global average (61 per cent)
Less satisfied with diversity progress40 per cent are satisfied with progress of diversity programme, 18 per cent lower than the global average (58 per cent)

REGIONAL PROFILES
HARVEY NASH HR SURVEY 201643
Top HR priorities in Hong Kong
Hong Kong HR professionals planning to move job
Employee engagement has replaced talent management as the top priority for HR professionals in Hong Kong this year. Eight per cent more HR professionals in Hong Kong are focused on employee retention this year compared with last year, while both performance management and organisational growth planning are up 17 per cent this year. Local HR professionals are also spending more time on organisational culture (up 11 per cent) and management development (up 15 per cent), although succession planning is 10 per cent lower this year.
Significantly more HR professionals from Hong Kong are planning to move job in the next 12 months. Almost a quarter (24 per cent) hope to change role compared with only 6 per cent who had the same plans last year. Another quarter (24 per cent) will move in the next two years, while a larger proportion (38 per cent) will wait 3–5 years before planning their next career more. Fewer than one in five HR professionals in Hong Kong (14 per cent) are planning a long-term career with their current employer (down from 19 per cent last year).
580= 58%670= 67%
580= 58%500= 50%
560= 56%390= 39%
560= 56%390= 39%
540= 57%780= 37%
540= 54%500= 50%
500= 50%390= 39%
480= 48%330= 33%
460= 46%560= 56%
Employee engagement
Employee retention
Organisational growth
Performance management
Talent management
Leadership capability
Culture development
Management development
Succession
240= 24%60= 6%
240= 24%380= 38%
380= 38%380= 38%
90= 9%130= 13%
50= 5%60= 6%
Less than 1 year
1 - 2 years
3 - 5 years
6 - 10 years
More than 10 years
50= 201550= 2014
50= 201550= 2014
Key priorities the Board wants to address
How long from this point onwards do you expect to stay with your current employer?

REGIONAL PROFILES
HARVEY NASH HR SURVEY 201644
Compared with the global average, an HR professional from Ireland is…
More likely to be global in outlook 21 per cent have a global spread of responsibility, 4 per cent higher than the global average (17 per cent)
Less satisfied with HR image61 per cent are satisfied with the image of HR, 4 per cent lower than the global average (65 per cent)
More focused on employee engagement38 per cent identify employee engagement as their top HR priority, 15 per cent higher than the global average (23 per cent)
Less likely to value metrics and HR reporting 52 per cent rate the use of metrics and HR reporting very important, 5 per cent less than the global average (57 per cent)
More troubled by recruitment challenges67 per cent expect recruitment challenges in the next two years, 10 per cent more than the global average (57 per cent)
Equally likely to offer flexible working11 per cent do NOT offer any type of flexible work options, the same percentage as the global average (11 per cent)
More dependent on overseas workers35 per cent will increase their use of talent sourced from overseas, 12 per cent higher than the global average (23 per cent)
Equally likely to invest in talent management60 per cent have implemented a talent management programme, the same percentage as the global average (61 per cent)
More satisfied with diversity progress79 per cent are satisfied with progress of diversity programme, 21 per cent higher than the global average (58 per cent)
IRELAND

REGIONAL PROFILES
HARVEY NASH HR SURVEY 201645
There has been a major shift in the priorities of HR professionals in Ireland. Last year the top priorities were employee engagement (down 26 per cent this year) and leadership capability (down 39 per cent this year). This year, recruitment (up 16 per cent) has leapt into the priority most concerning HR professionals in Ireland. Employee retention (up 5 per cent) is one of the few other HR priorities to increase this year, alongside HR systems and processes (up 3 per cent).
Fewer HR professionals in Ireland are planning to move job this year (14 per cent) compared with 25 per cent last year. However, a third of local HR professionals (32 per cent) expect to be in a new job within the next two years. The largest proportion (40 per cent) will move role in the next 3–5 years, while 14 per cent are committing to their current employer for more than six years, down from 16 per cent last year.
Top HR priorities in Ireland
Ireland HR professionals planning to move job
50= 201550= 2014
630= 63%470= 47%
590= 59%670= 67%
540= 54%800= 80%
500= 50%670= 67%
430= 43%530= 53%
450= 45%400= 40%
430= 43%600= 60%
360= 36%400= 40%
360= 36%330= 33%
340= 34%730= 73%
Recruitment
Talent management
Employee engagement
Performance management
Management development
Employee retention
Organisational growth
Training & education
HR Systems & Processes
Leadership capability
50= 201550= 2014
140= 14%250= 25%
320= 32%250= 25%
400= 40%330= 33%
80= 8%80= 8%
60= 6%80= 8%
Less than 1 year
1 - 2 years
3 - 5 years
6 - 10 years
More than 10 years
Key priorities the Board wants to address
How long from this point onwards do you expect to stay with your current employer?
REGIONAL PROFILES
HARVEY NASH HR SURVEY 201646
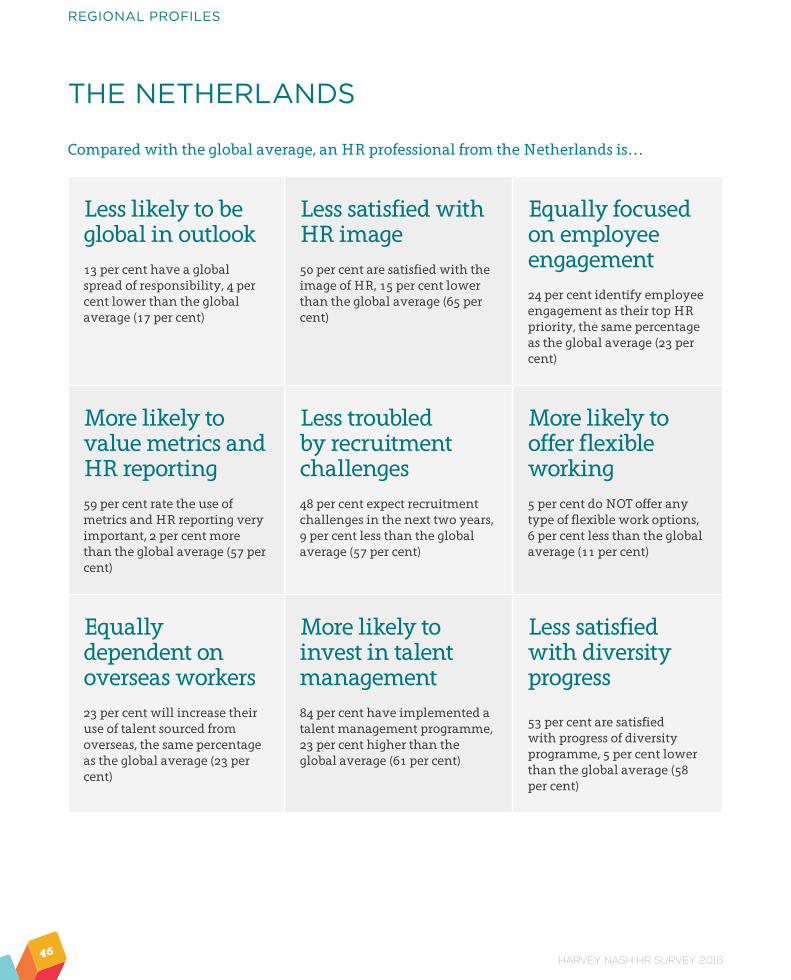
Compared with the global average, an HR professional from the Netherlands is…
Less likely to be global in outlook 13 per cent have a global spread of responsibility, 4 per cent lower than the global average (17 per cent)
Less satisfied with HR image50 per cent are satisfied with the image of HR, 15 per cent lower than the global average (65 per cent)
Equally focused on employee engagement24 per cent identify employee engagement as their top HR priority, the same percentage as the global average (23 per cent)
More likely to value metrics and HR reporting
59 per cent rate the use of metrics and HR reporting very important, 2 per cent more than the global average (57 per cent)
Less troubled by recruitment challenges48 per cent expect recruitment challenges in the next two years, 9 per cent less than the global average (57 per cent)
More likely to offer flexible working5 per cent do NOT offer any type of flexible work options, 6 per cent less than the global average (11 per cent)
Equally dependent on overseas workers23 per cent will increase their use of talent sourced from overseas, the same percentage as the global average (23 per cent)
More likely to invest in talent management84 per cent have implemented a talent management programme, 23 per cent higher than the global average (61 per cent)
Less satisfied with diversity progress
53 per cent are satisfied with progress of diversity programme, 5 per cent lower than the global average (58 per cent)
THE NETHERLANDS

REGIONAL PROFILES
HARVEY NASH HR SURVEY 201647
HR professionals in the Netherlands are placing more emphasis on employee engagement (63 per cent) compared with 55 per cent who made it an HR priority last year. Also more important to local HR professionals this year are training (up 8 per cent), employee retention (up 13 per cent) and recruitment (up 15 per cent). However, fewer HR professionals from the Netherlands will focus on talent management (down 15 per cent), which was their top priority last year. Leadership capability (down 10 per cent) and change management (down 9 per cent) also receive less attention.
Fewer HR professionals from the Netherlands are planning to move job this year (11 per cent) compared with 28 per cent last year. However, far more HR professionals (50 per cent) plan to change role within the next 24 months, more than double the 21 per cent who planned a similar move last year.
Top HR priorities in the Netherlands
The Netherlands HR professionals planning to move job
630= 63%550= 55%
550= 55%470= 47%
540= 54%410= 41%
540= 54%390= 39%
520= 52%670= 67%
500= 50%600= 60%
500= 50%390= 39%
420= 42%510= 51%
410= 41%340= 34%
Employee engagement
Training
Employee retention
Recruitment
Talent management
Leadership capability
HR Systems & Processes
Change management
Culture development
110= 11%280= 28%
500= 50%210= 21%
220= 22%260= 26%
110= 11%140= 14%
60= 6%110= 11%
Less than 1 year
1 - 2 years
3 - 5 years
6 - 10 years
More than 10 years
Key priorities the Board wants to address
How long from this point onwards do you expect to stay with your current employer?
50= 201550= 2014
50= 201550= 2014

REGIONAL PROFILES
HARVEY NASH HR SURVEY 201648
Compared with the global average, an HR professional from Norway is…
Less likely to be global in outlook 7 per cent have a global spread of responsibility, 10 per cent lower than the global average (17 per cent)
More satisfied with HR image75 per cent are satisfied with the image of HR, 10 per cent higher than the global average (65 per cent)
More focused on employee engagement27 per cent identify employee engagement as their top HR priority, 4 per cent more than the global average (23 per cent)
Less likely to value metrics and HR reporting 41 per cent rate the use of metrics and HR reporting very important, 16 per cent less than the global average (57 per cent)
Less troubled by recruitment challenges39 per cent expect recruitment challenges in the next two years, 18 per cent less than the global average (57 per cent)
Equally likely to offer flexible working11 per cent do NOT offer any type of flexible work options, the same percentage as the global average (11 per cent)
Less dependent on overseas workers16 per cent will increase their use of talent sourced from overseas, 7 per cent lower than the global average (23 per cent)
Less likely to invest in talent management49 per cent have implemented a talent management programme, 12 per cent lower than the global average (61 per cent)
More satisfied with diversity progress
72 per cent are satisfied with progress of diversity programme, 14 per cent higher than the global average (58 per cent)
NORWAY
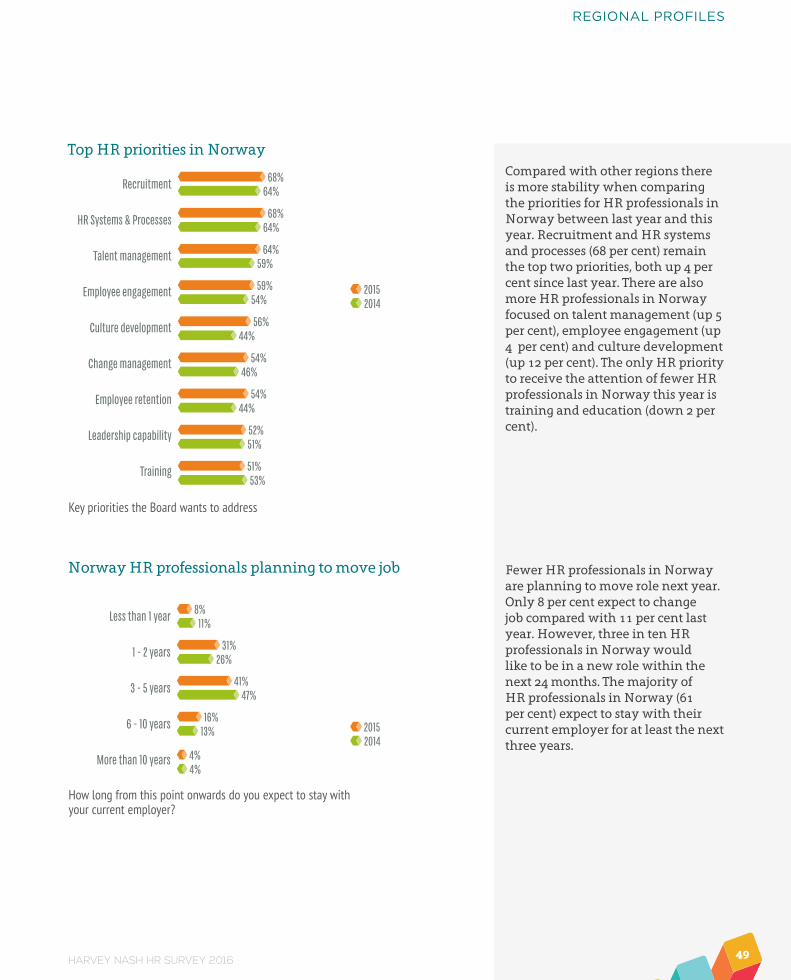
REGIONAL PROFILES
HARVEY NASH HR SURVEY 201649
Compared with other regions there is more stability when comparing the priorities for HR professionals in Norway between last year and this year. Recruitment and HR systems and processes (68 per cent) remain the top two priorities, both up 4 per cent since last year. There are also more HR professionals in Norway focused on talent management (up 5 per cent), employee engagement (up 4 per cent) and culture development (up 12 per cent). The only HR priority to receive the attention of fewer HR professionals in Norway this year is training and education (down 2 per cent).
Fewer HR professionals in Norway are planning to move role next year. Only 8 per cent expect to change job compared with 11 per cent last year. However, three in ten HR professionals in Norway would like to be in a new role within the next 24 months. The majority of HR professionals in Norway (61 per cent) expect to stay with their current employer for at least the next three years.
Top HR priorities in Norway
Norway HR professionals planning to move job
680= 68%640= 64%
680= 68%640= 64%
640= 64%590= 59%
590= 59%540= 54%
560= 56%440= 44%
540= 54%460= 46%
540= 54%440= 44%
520= 52%510= 51%
510= 51%530= 53%
Recruitment
HR Systems & Processes
Talent management
Employee engagement
Culture development
Change management
Employee retention
Leadership capability
Training
80= 8%110= 11%
310= 31%260= 26%
410= 41%470= 47%
160= 16%130= 13%
40= 4%40= 4%
Less than 1 year
1 - 2 years
3 - 5 years
6 - 10 years
More than 10 years
Key priorities the Board wants to address
How long from this point onwards do you expect to stay with your current employer?
50= 201550= 2014
50= 201550= 2014
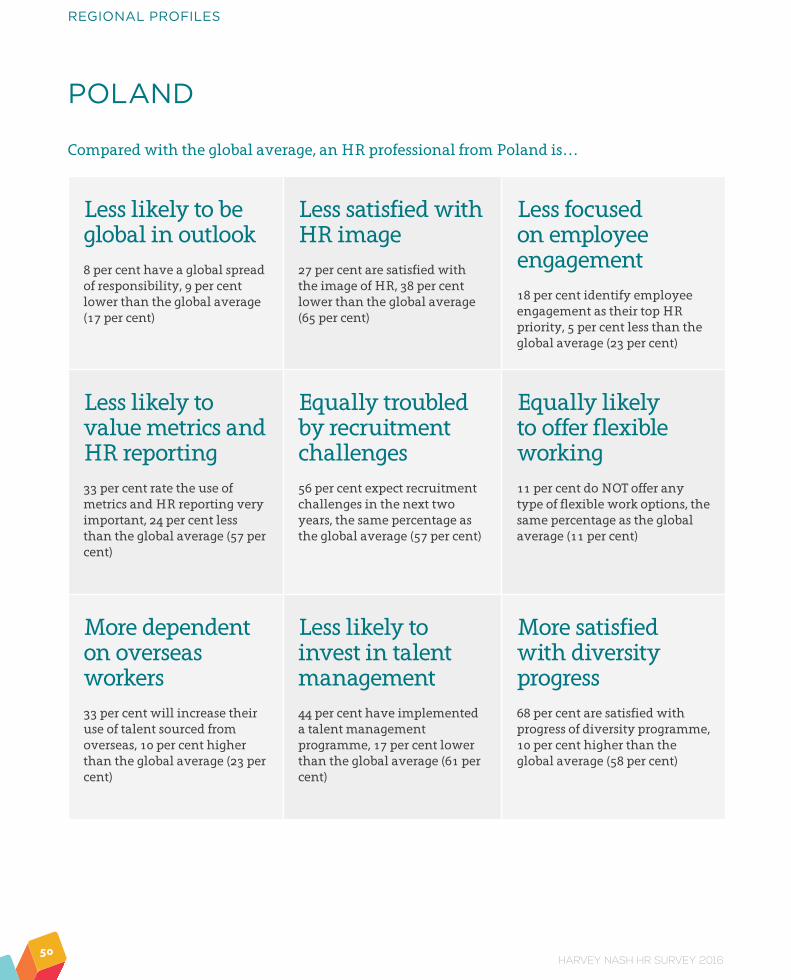
REGIONAL PROFILES
HARVEY NASH HR SURVEY 201650
POLAND
Compared with the global average, an HR professional from Poland is…
Less likely to be global in outlook 8 per cent have a global spread of responsibility, 9 per cent lower than the global average (17 per cent)
Less satisfied with HR image27 per cent are satisfied with the image of HR, 38 per cent lower than the global average (65 per cent)
Less focused on employee engagement18 per cent identify employee engagement as their top HR priority, 5 per cent less than the global average (23 per cent)
Less likely to value metrics and HR reporting 33 per cent rate the use of metrics and HR reporting very important, 24 per cent less than the global average (57 per cent)
Equally troubled by recruitment challenges56 per cent expect recruitment challenges in the next two years, the same percentage as the global average (57 per cent)
Equally likely to offer flexible working11 per cent do NOT offer any type of flexible work options, the same percentage as the global average (11 per cent)
More dependent on overseas workers33 per cent will increase their use of talent sourced from overseas, 10 per cent higher than the global average (23 per cent)
Less likely to invest in talent management44 per cent have implemented a talent management programme, 17 per cent lower than the global average (61 per cent)
More satisfied with diversity progress68 per cent are satisfied with progress of diversity programme, 10 per cent higher than the global average (58 per cent)

REGIONAL PROFILES
HARVEY NASH HR SURVEY 201651
Top HR priorities in Poland
Poland HR professionals planning to move job
910= 91%580= 58%
550= 55%600= 60%
550= 55%380= 38%
460= 46%500= 50%
270= 27%540= 54%
180= 18%450= 45%
90= 9%210= 21%
Recruitment
Employee engagement
Organisational growth
Employee retention
Performance management
Culture development
Diversity
220= 22%200= 20%
440= 44%300= 30%
220= 22%350= 35%
120= 12%150= 15%
Less than 1 year
1 - 2 years
3 - 5 years
6 - 10+ years
Significantly more HR professionals in Poland (91 per cent) are making recruitment a top priority compared with their global peers (58 per cent). Local HR professionals are also more likely to invest their time and resources in organisational growth; 55 per cent will make it a priority next year compared with only 38 per cent of global HR professionals. However, compared with their global peers, HR professionals in Poland are less likely to make employee engagement and employee retention a priority, and they are far less likely to make performance management, culture development and diversity initiatives a priority.
HR professionals in Poland are slightly more likely to want to move job this year compared with their global peers; 22 per cent plan to move compared with 20 per cent of global HR professionals. They are significantly more likely to move role within the next 24 months, with more than four in ten (44 per cent) expecting to change employer in this timescale compared with only three in ten HR professionals globally (30 per cent).
Key priorities the Board wants to address
How long from this point onwards do you expect to stay with your current employer?
50= 201550= 2014
50= 201550= 2014

REGIONAL PROFILES
HARVEY NASH HR SURVEY 201652
SWEDENCompared with the global average, an HR professional from Sweden is…
More likely to be global in outlook 20 per cent have a global spread of responsibility, 3 per cent higher than the global average (17 per cent)
Equally satisfied with HR image64 per cent are satisfied with the image of HR, the same percentage as the global average (65 per cent)
Less focused on employee engagement15 per cent identify employee engagement as their top HR priority, 8 per cent less than the global average (23 per cent)
Less likely to value metrics and HR reporting 38 per cent rate the use of metrics and HR reporting very important, 19 per cent less than the global average (57 per cent)
Equally troubled by recruitment challenges57 per cent expect recruitment challenges in the next two years, the same percentage as the global average (57 per cent)
More likely to offer flexible working9 per cent do NOT offer any type of flexible work options, 2 per cent less than the global average (11 per cent)
More dependent on overseas workers25 per cent will increase their use of talent sourced from overseas, 2 per cent higher than the global average (23 per cent)
Less likely to invest in talent management52 per cent have implemented a talent management programme, 9 per cent lower than the global average (61 per cent)
Less satisfied with diversity progress48 per cent are satisfied with progress of diversity programme, 10 per cent lower than the global average (58 per cent)

REGIONAL PROFILES
HARVEY NASH HR SURVEY 201653
The priority that most HR professionals in Sweden continue to focus on is leadership capability (61 per cent), almost unchanged from last year (62 per cent). There are 9 per cent more HR professionals in Sweden who will invest time and resources in employee engagement this year compared with last year. Two priorities that are receiving less attention this year are talent management (down 6 per cent) and performance management (down 7 per cent).
Fewer HR professionals in Sweden plan to move job in the next 12 months. One in five (21 per cent) will look to change role this year, down from 26 per cent last year. Fewer are planning to move within the next two years also, down 4 per cent compared with the previous year. Most HR professionals in Sweden (39 per cent) intend to stay with their current employer for the next 3–5 years, a higher proportion than last year.
Top HR priorities in Sweden
Sweden HR professionals planning to move job
610= 61%620= 62%
570= 57%480= 48%
530= 53%590= 59%
510= 51%500= 50%
480= 48%550= 55%
470= 47%410= 41%
460= 46%480= 48%
400= 40%400= 40%
Leadership capability
Employee engagement
Talent management
Change management
Performance management
Culture development
Recruitment
HR Systems & Processes
210= 21%260= 26%
280= 28%320= 32%
390= 39%310= 31%
90= 9%80= 8%
20= 2%30= 3%
Key priorities the Board wants to address
How long from this point onwards do you expect to stay with your current employer?
Less than 1 year
1 - 2 years
3 - 5 years
6 - 10 years
More than 10 years
50= 201550= 2014
50= 201550= 2014
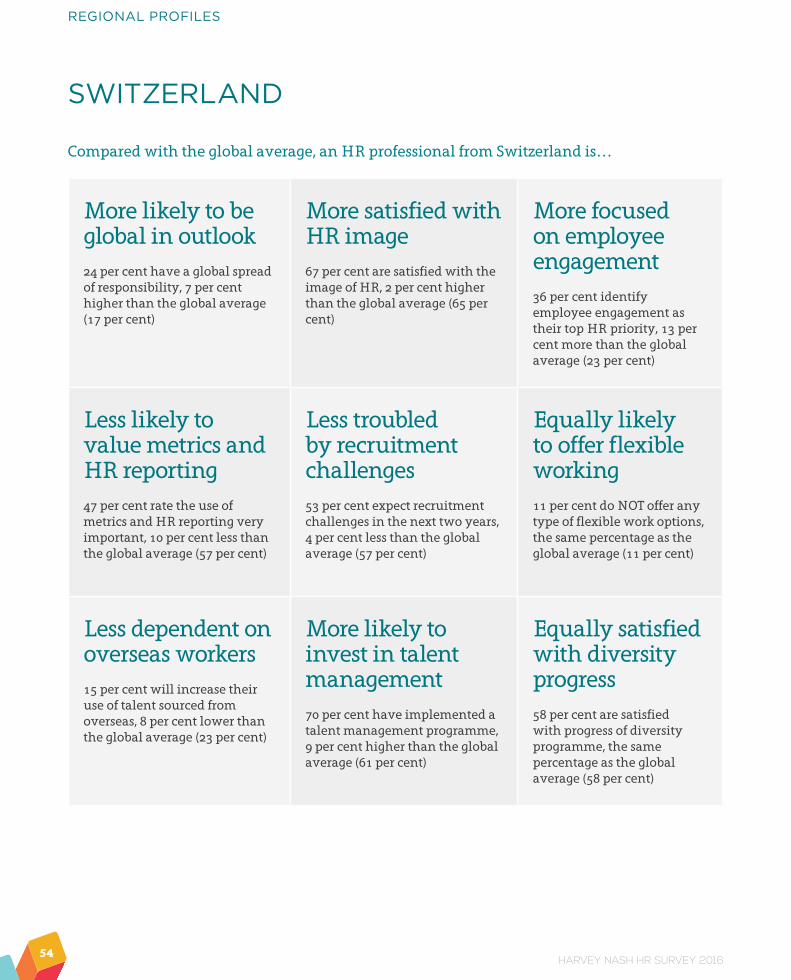
REGIONAL PROFILES
HARVEY NASH HR SURVEY 201654
SWITZERLAND
Compared with the global average, an HR professional from Switzerland is…
More likely to be global in outlook 24 per cent have a global spread of responsibility, 7 per cent higher than the global average (17 per cent)
More satisfied with HR image67 per cent are satisfied with the image of HR, 2 per cent higher than the global average (65 per cent)
More focused on employee engagement36 per cent identify employee engagement as their top HR priority, 13 per cent more than the global average (23 per cent)
Less likely to value metrics and HR reporting
47 per cent rate the use of metrics and HR reporting very important, 10 per cent less than the global average (57 per cent)
Less troubled by recruitment challenges53 per cent expect recruitment challenges in the next two years, 4 per cent less than the global average (57 per cent)
Equally likely to offer flexible working11 per cent do NOT offer any type of flexible work options, the same percentage as the global average (11 per cent)
Less dependent on overseas workers15 per cent will increase their use of talent sourced from overseas, 8 per cent lower than the global average (23 per cent)
More likely to invest in talent management70 per cent have implemented a talent management programme, 9 per cent higher than the global average (61 per cent)
Equally satisfied with diversity progress58 per cent are satisfied with progress of diversity programme, the same percentage as the global average (58 per cent)

REGIONAL PROFILES
HARVEY NASH HR SURVEY 201655
HR professionals in Switzerland have shifted their focus this year. Fewer are focused on recruitment (down 17 per cent), while more are focused on change management (up 11 per cent) and talent management (up 13 per cent). In addition, there are significantly fewer HR professionals in Switzerland investing their time and resources in management development activity (down 13 per cent) and HR systems and processes (down 28 per cent) this year.
Slightly more HR professionals in Switzerland plan to move job this year (12 per cent) compared with 10 per cent last year. However, there are also more HR professionals in Switzerland planning to commit to their current employer for longer. There has been a 5 per cent increase in those expecting to stay for 6–10 years, and a 4 per cent increase in those planning to stay for more than ten years.
Top HR priorities in Switzerland
Switzerland HR professionals planning to move job
690= 69%580= 58%
690= 69%560= 56%
610= 61%660= 66%
580= 58%750= 75%
580= 58%600= 60%
530= 53%510= 51%
420= 42%550= 55%
360= 36%640= 64%
Change management
Talent management
Leadership capability
Recruitment
Performance management
Employee engagement
Management development
HR Systems & Processes
120= 12%100= 10%
340= 34%370= 37%
330= 33%420= 42%
120= 12%70= 7%
90= 9%50= 5%
Less than 1 year
1 - 2 years
3 - 5 years
6 - 10 years
More than 10 years
Key priorities the Board wants to address
How long from this point onwards do you expect to stay with your current employer?
50= 201550= 2014
50= 201550= 2014

REGIONAL PROFILES
HARVEY NASH HR SURVEY 201656
UNITED KINGDOM
Compared with the global average, an HR professional from the UK is…
More likely to be global in outlook 19 per cent have a global spread of responsibility, 2 per cent higher than the global average (17 per cent)
Less satisfied with HR image61 per cent are satisfied with the image of HR, 4 per cent lower than the global average (65 per cent)
More focused on employee engagement29 per cent identify employee engagement as their top HR priority, 6 per cent more than the global average (23 per cent)
More likely to value metrics and HR reporting
68 per cent rate the use of metrics and HR reporting very important, 9 per cent more than the global average (57 per cent)
Equally troubled by recruitment challenges56 per cent expect recruitment challenges in the next two years, the same percentage as the global average (57 per cent)
Equally likely to offer flexible working10 per cent do NOT offer any type of flexible work options, the same percentage as the global average (11 per cent)
Less dependent on overseas workers18 per cent will increase their use of talent sourced from overseas, 5 per cent lower than the global average (23 per cent)
More likely to invest in talent management66 per cent have implemented a talent management programme, 5 per cent more than the global average (61 per cent)
Less satisfied with diversity progress53 per cent are satisfied with progress of diversity programme, 5 per cent lower than the global average (58 per cent)

REGIONAL PROFILES
HARVEY NASH HR SURVEY 201657
Marginally more HR professionals in the UK prioritise employee engagement as their top focus (70 per cent) compared with last year (69 per cent). The focus on leadership capability has also marginally increased (by 2 per cent), while the proportion of HR professionals in the UK focused on talent management has increased more substantially (by 9 per cent) in the past 12 months. It appears that each of the top HR priorities is requiring the focus of more HR professionals in the UK. Recruitment will be a focus for 4 per cent more, succession planning for 3 per cent more, and employee retention for 1 per cent more.
Fewer HR professionals in the UK are planning to move job this year (32 per cent) compared with 36 per cent who had plans to move role in the last 12 months. A larger proportion HR professionals in the UK (28 per cent) plan to stay with their current employer for 3–5 years, an increase of 8 per cent compared with last year.
Top HR priorities in the UK
UK HR professionals planning to move job
700= 70%790= 79%
670= 67%650= 65%
640= 64%550= 55%
570= 57%560= 56%
570= 57%530= 53%
540= 54%510= 51%
510= 51%500= 50%
Employee engagement
Leadership capability
Talent management
Performance management
Recruitment
Succession
Employee retention
320= 32%360= 36%
320= 32%320= 32%
280= 28%200= 20%
60= 6%70= 7%
20= 2%50= 5%
Less than 1 year
1 - 2 years
3 - 5 years
6 - 10 years
More than 10 years
Key priorities the Board wants to address
How long from this point onwards do you expect to stay with your current employer?
50= 201550= 2014
50= 201550= 2014

REGIONAL PROFILES
HARVEY NASH HR SURVEY 201658
VIETNAMCompared with the global average, an HR professional from the Vietnam is…
Less likely to be global in outlook 11 per cent have a global spread of responsibility, 6 per cent lower than the global average (17 per cent)
More satisfied with HR image70 per cent are satisfied with the image of HR, 5 per cent higher than the global average (65 per cent)
Less focused on employee engagement14 per cent identify employee engagement as their top HR priority, 9 per cent less than the global average (23 per cent)
More likely to value metrics and HR reporting 64 per cent rate the use of metrics and HR reporting very important, 7 per cent more than the global average (57 per cent)
More troubled by recruitment challenges64 per cent expect recruitment challenges in the next two years, 7 per cent more than the global average (57 per cent)
Less likely to offer flexible working18 per cent do NOT offer any type of flexible work options, 7 per cent higher than the global average (11 per cent)
More dependent on overseas workers29 per cent will increase their use of talent sourced from overseas, 6 per cent higher than the global average (23 per cent)
Equally likely to invest in talent management60 per cent have implemented a talent management programme, the same percentage as the global average (61 per cent)
More satisfied with diversity progress68 per cent are satisfied with progress of diversity programme, 10 per cent higher than the global average (58 per cent)

REGIONAL PROFILES
HARVEY NASH HR SURVEY 201659
Compared with their global peers, HR professionals in Vietnam are more focused on recruitment (8 per cent higher) but equally focused on talent management (62 per cent) compared with 61 per cent globally. However, HR professionals in Vietnam are significantly more invested in HR systems and processes than their global peers (16 per cent higher), employee retention (10 per cent higher) and training and education (20 per cent higher). HR professionals in Vietnam are less focused on employee engagement (4 per cent lower) and leadership capability (11 per cent lower).
HR professionals in Vietnam are significantly less likely to move job in the next year (8 per cent) compared with the global average (20 per cent). They are more likely to commit to their current employer for longer than the global average. Almost three in ten (27 per cent) would like to stay in their current role for six years or more, compared with 16 per cent of HR professionals generally around the globe.
Top HR priorities in Vietnam
Vietnam professionals planning to move job
10% 25% 36% 16% 14%
660= 66%580= 58%
620= 62%610= 61%
610= 61%450= 45%
600= 60%500= 50%
580= 58%380= 38%
580= 58%540= 54%
560= 56%600= 60%
480= 48%450= 45%
450= 45%560= 56%
Recruitment
Talent management
HR Systems & Processes
Employee retention
Training & education programme
Performance management
Employee engagement
Culture development
Leadership capability
80= 8%200= 20%
280= 28%300= 30%
370= 37%350= 35%
150= 15%100= 10%
120= 12%60= 6%
Less than 1 year
1 - 2 years
3 - 5 years
6 - 10 years
More than 10 years
Key priorities the Board wants to address
How long from this point onwards do you expect to stay with your current employer?
50= 201550= 2014
50= 201550= 2014

Harvey Nash Group plcwww.harveynash.com