Embed Size (px)
Citation preview

*37692*Printed in Switzerland
Geneva, 2012ISBN 978-92-61-14121-9
Handbook ITU-R propagation prediction methods for interference and
sharing studies
Hand
book
ITU
-R p
ropa
gatio
n pr
edic
tion
met
hods
for
inte
rfer
ence
and
sha
ring
stu
dies
Ed
ition
201
2
E n g l i s h E d i t i o n 2 0 1 2Radiocommunication Bureau
THE RADIOCOMMUNICATION SECTOR OF ITU
The role of the Radiocommunication Sector is to ensure the rational, equitable, efficient and economical use of the radio-frequency spectrum by all radiocommunication services, including satellite services, and carry out studies without limit of frequency range on the basis of which Recommendations are adopted.
The regulatory and policy functions of the Radiocommunication Sector are performed by World and Regional Radiocommunication Conferences and Radiocommunication Assemblies supported by Study Groups.
Inquiries about radiocommunication mattersPlease contact:
I T URadiocommunication BureauPlace des NationsCH -1211 Geneva 20Switzerland
Telephone: +41 22 730 5800Fax: +41 22 730 5785E-mail: [email protected]: www.itu.int/itu-r
Placing orders for ITU publicationsPlease note that orders cannot be taken over the telephone. They should be sent by fax or e-mail.
I T USales and Marketing DivisionPlace des NationsCH -1211 Geneva 20 Switzerland
Fax: +41 22 730 5194E-mail: [email protected]
The Electronic Bookshop of ITU: www.itu.int/publications
ITU 2012
All rights reserved. No part of this publication may be reproduced, by any means whatsoever, without the prior written permission of ITU.

HANDBOOK
ITU-R propagation prediction methods for interference and sharing studies
Edition 2012
Radiocommunication Bureau


ITU-R propagation prediction methods for interference and sharing studies iii
PREFACE
This Handbook provides technical information and guidance needed for sharing studies and interference assessments using selected ITU-R P-Series RF propagation models and prediction methods. It has been developed within Study Group 3 under the leadership of Working Party 3M chaired by Ms Carol Wilson (Australia).
Contributors to this document include:
Clare ALLEN
David BACON
Les BARCLAY
Chris BEHM
Ralph CAGER
Alex EPSHTEYN
Glenn FELDHAKE
Rainer GROSSKOPF
Fryderyk LEWICKI
Paul MCKENNA
Alakananda PAUL
Patti RAUSH
Laura ROBERTI
Teresa RUSYN
Carol WILSON


ITU-R propagation prediction methods for interference and sharing studies v
TABLE OF CONTENTS
Page
PREFACE ............................................................................................................................................ iii
TABLE OF CONTENTS ..................................................................................................................... v
CHAPTER 1 – Introduction ................................................................................................................. 1
1.1 Background .............................................................................................................................. 1
1.2 Objective .................................................................................................................................. 1
1.3 Organization ............................................................................................................................ 1
CHAPTER 2 – Interference basics ....................................................................................................... 3
2.1 Introduction to radio interference ............................................................................................ 3
2.2 Radio parameters ..................................................................................................................... 5
2.3 Propagation variability ............................................................................................................ 5
2.4 Coordination distances and zones ............................................................................................ 5
2.5 Propagation mechanisms ......................................................................................................... 6
CHAPTER 3 – Brief Guide to ITU-R P-Series propagation effects and methods ............................... 9
3.1 Introduction ............................................................................................................................. 9
3.2 Propagation terminology ......................................................................................................... 9
3.3 Guide to RF propagation prediction methods of ITU-R P-Series Recommendations useful for interference analysis ........................................................................................................... 10
3.4 ITU-R P-Series specific RF propagation phenomena .............................................................. 15
3.4.1 ITU-R P-Series specific propagation effects ........................................................................... 15
3.5 ITU-R P-Series RF propagation path requirements ................................................................. 19
Chapter 4 – Radiowave propagation phenomena ................................................................................. 25
4.1 Introduction ............................................................................................................................. 25
4.2 Statistical nature of radio propagation ..................................................................................... 25
4.3 Interference protection criteria ................................................................................................ 30
Chapter 5 – Application of ITU-R P-Series propagation models and methods for sharing and interference assessments .......................................................................................................... 33
5.1 Introduction ............................................................................................................................. 33
5.2 Recommendation ITU-R P.452 ............................................................................................... 33
5.3 Recommendation ITU-R P.528 ............................................................................................... 34
5.4 Recommendation ITU-R P.533 ............................................................................................... 35
5.5 Recommendation ITU-R P.619 ............................................................................................... 37
5.6 Recommendation ITU-R P.620 ............................................................................................... 38
5.7 Recommendation ITU-R P.1546 ............................................................................................. 40
5.8 Recommendation ITU-R P.1812 ............................................................................................. 41

vi Spectrum Monitoring
Page
Chapter 6 – Representative sharing scenarios for ITU-R P-Series propagation methods and models . 43
6.1 Recommendation ITU-R P.452 sample sharing scenarios ...................................................... 43
6.2 Recommendation ITU-R P.528 sample sharing scenario ........................................................ 44
6.3 Recommendation ITU-R P.533 sample sharing scenario ........................................................ 45
6.4 Recommendation ITU-R P.620 sample sharing scenario ........................................................ 46
6.5 Recommendation ITU-R P.1546 sample sharing scenario ...................................................... 47
6.6 Recommendation ITU-R P.1812 sample sharing scenario ...................................................... 47
APPENDIX A – Sample calculations .................................................................................................. 49
Annex A1 to Appendix A – Recommendation ITU-R P.452 sample calculations ............................... 49
Annex A2 to Appendix A – Recommendation ITU-R P.528 sample calculations ............................... 53
Annex A3 to Appendix A – Recommendation ITU-R P.533 sample calculations ............................... 55
Annex A4 to Appendix A – Recommendation ITU-R P.620 sample calculations ............................... 57
Annex A5 to Appendix A – Recommendation ITU-R P.1546 sample calculations ............................. 59
Annex A6 to Appendix A – Recommendation ITU-R P.1812 sample calculations ............................. 63
APPENDIX B – References ................................................................................................................. 65

Chapter 1 1
CHAPTER 1
INTRODUCTION
1.1 Background
Within the ITU-R, Study Group 3 is responsible for carrying out studies on propagation of radio waves in ionized and non-ionized media and the characteristics of radio noise, for the purpose of improving radiocommunication systems. Study Group 3 consists of four Working Parties each covering particular aspects of radiowave propagation and has 86 technical Recommendations and 8 technical Reports within the ITU-R P-Series category in force as of August 2011. Some of these documents provide detailed measurement data; others provide models for specific propagation phenomena; still others provide propagation prediction methods − that is, steps and procedures for combining models to evaluate the overall propagation loss along a transmission path.
Accurate propagation information is required to support the design, implementation and operation of most modern radiocommunication systems. In addition, accurate propagation information is of great concern and importance to Study Groups of the ITU-R studying the impact or interference of one radiocommunication system upon other radiocommunication systems. Study Group 3 frequently receives liaison statements requesting clarification of propagation methods, such as:
− how to determine which propagation prediction method contained in ITU-R P-Series Recommendations is most appropriate or applicable for use in interference analyses and sharing studies; and
− how to use individual propagation prediction methods contained in ITU-R P-Series Recommendations in the course of conducting interference analyses and sharing studies.
In order to facilitate other Study Groups and Working Parties, this Handbook provides general guidance on these issues.
1.2 Objective
This Handbook is intended to be used in conjunction with ITU-R P-Series Recommendations to assist in performing interference analyses and prediction methods on radiocommunication service systems. This Handbook uses the same terminology and notations of ITU-R P-Series Recommendations and the salient features of the selected ITU-R P-Series propagation prediction methods are given. Detailed examples are also included showing the application of the methods to specific interference analysis scenarios.
1.3 Organization
Following the introductory material of Chapter 1, Chapter 2 of this Handbook will present a guide on the background, supplementary information, and a brief description of radio interference and the propagation mechanisms used in the ITU-R P-Series Recommendations selected for this Handbook. Chapter 3 will provide a guide on propagation terminology and a guide for the selection of one of these recommendations for an interference analyses. Chapter 4 of this Handbook will discuss the methods and mechanisms relied upon for interference analysis. Chapter 5 will go on to discuss specific details including inputs, propagation mechanisms involved, and outputs produced by the method in each recommendation. Chapter 6 will put forward sample sharing scenarios and the accompanying annexes of this handbook will show sample calculations producing an interference analysis of the sample sharing scenarios.


Chapter 2 3
CHAPTER 2
INTERFERENCE BASICS
2.1 Introduction to radio interference
Interference is caused when unwanted radio signals enter a receiving antenna at a sufficient power level to degrade reception of the wanted signal. Each unwanted signal power will depend on the strength of the unwanted radio wave at the antenna and the gain of the antenna in the direction of arrival.
There are three types of power levels to be considered at the input of a receiver: the wanted signal, the sum of all interference signals, and radio noise. A given level of performance, usually specified by bit-error rate in a digital system, requires a minimum ratio of wanted signal power to the sum of noise and all interference power at the demodulator. In practice this ratio is normally specified at an accessible reference point in the receiving system, taking account of the associated noise figure and gains. By convention this ratio is written as /( + ), where represents the power of the wanted signal, represents noise power, and represents the sum of interference powers.
The power ratio, /( + ) is normally expressed in decibels (dB), given by 10 ( ). All use of decibels should be traceable to a ratio of two powers. For instance, when a power level is given in decibels relative to 1 W, written dBW, the calculation is actually 10 ( /1) where is the actual power in Watts and the 1 represents the 1 W reference.
The terms in the above power ratio, , and , are powers normally expressed in decibels, such as dBW. This produces an anomaly if /( + ) is treated as a mathematical expression, since in that case the three terms should be in linear units of power. It is conventional to treat /( + ) and similar expressions as though each is a single quantity.
A logarithmic scale of power ratios is convenient because it is the relative strengths of different signals that is important in calculating interference, and most factors influencing signal power are multiplicative. This facilitates the common practice of assembling a link budget for a radio system by summing the quantities concerned expressed in dB. The same principle can be extended to the evaluation of interference.
Figure 2.1 illustrates the summation of and a single interferer to give ( + ). Both scales show power levels in dBW, with values typical of conditions in a receiver. The horizontal scale gives the power of a single interference signal, , which is assumed to vary as shown by the diagonal (magenta) line. Noise power is assumed to remain constant, shown by the horizontal (black) line.

4 ITU-R propagation prediction methods for interference and sharing studies
FIGURE 2.1
Combination of interference and noise power
PPM. 02.1
Interference power, dBW
–120 –115 –110 –105 –100–120
–115
–110
–105
–100
Pow
er, d
BW
N+I
N
I
Multiple interference signals are normally combined by power summation, that is by adding linear powers, such as in Watts. When the inputs are in decibel form, this requires the powers to be converted to linear units, summed, and then converted back to decibels. Thus the combination of and in Fig. 2.1 is given by:
e( + ) = 10 (10 . + 10 . ) dBW (2.1)
The power of the wanted signal, , is not shown in Fig. 2.1. For a required performance it must remain at a specified minimum ratio above ( + ). Due to the decibel scales, the (red) line plotting ( + ) is curved. At the left side of the graph, where is 10 dB higher than , ( + ) is only about 0.4 dB higher than , and becomes asymptotic to for lower values of . At the right side of the graph there is a similar situation, with ( + ) becoming asymptotic to . At the centre of the graph, where = , the combined noise plus interference is 3 dB higher than or .
Radio systems may be designed to be limited by noise or interference. At the thin crossed (black) lines at = −116 dBW in Fig. 2.1, interference is 6 dB below noise, , and this gives ( + ) close to 1 dB higher than . This represents a noise-limited criterion, since the majority of ( + ) consists of noise. This example would be described as having an interference margin of 1 dB, or a noise-to-interference ratio ( / ) of –6 dB.
In systems above VHF, total noise is usually dominated by circuit noise, as opposed to external noise sources such as sky and man-made. These examples of noise sources will be described in further detail in subsequent chapters. At UHF and above, therefore, total noise is fairly stable, and noise-limited systems are relatively simple to plan.
It is spectrally more efficient for radio systems to operate under interference-limited conditions, as represented by the right-hand side of Fig. 2.1. Interference levels usually vary more than noise levels, however, and this can make interference-limited systems correspondingly more complicated to plan.
Study Group 3 Recommendations are intended to provide predictions of signal power levels, including the statistics of how they vary, which is of great importance to sharing studies. The following sub-sections describe the parameters used for the power conveyed by radio signals, and the propagation mechanisms responsible for varying signal levels.

Chapter 2 5
2.2 Radio parameters
There are two parameters in common use to indicate the absolute strength of a propagating radio wave, electric field strength and power flux density. These are essentially equivalent, being related by the simple expression
= + 145.8 (2.2)
where is the electric field strength in dB relative to 1 µV/m, written dB(µV/m), and is power flux density in dB relative to 1 Watt per square metre, written dB(W/m2).
The absolute strength of a radio wave depends on the power radiated by the transmitting antenna, its gain in the direction of propagation, and the propagation losses. The combination of radiated power and antenna gain in the direction of propagation can be quoted as a single parameter, equivalent isotropically radiated power (e.i.r.p.), , given by
= + dBW (2.3)
where is the total power radiated by the antenna, dBW, and is the antenna gain in the direction concerned, in dB relative to an isotropic antenna, written dBi.
Alternatively, signal levels are calculated indirectly by obtaining the propagation loss due to the radio path. Basic transmission loss, along with several other definitions of loss, is defined in Recommendation ITU-R P.341. Expressed simply, basic transmission loss, , is the loss in dB between isotropic antennas. Basic transmission loss is used within a link budget to calculate the corresponding signal strength in a receiver.
2.3 Propagation variability
The strength of a radio signal will typically vary even for propagation between stationary antennas. The strength achieved or exceeded for half of the time is the median signal level. Various mechanisms can cause fading below or enhancement above the median. Variability statistics are normally given in terms of percentages of an average year, or of the “worst month”, a concept described in Recommendation ITU-R P.581.
It should be noted that different recommendations use the symbol % for either the percentage time for which a given fade or loss is exceeded, or for which a given enhancement is exceeded or loss not exceeded. The context within which % time is quoted, as well as whether it is for annual or worst-month times, should be taken into account.
Some basic concepts concerning the variability of unwanted signals are described in Recommendation ITU-R SM.1448 §1.3. Criteria are typically applied for “long-term” and “short-term” conditions for unwanted signal strengths exceeded for 20%, and the range 0.001% to 1.0% time, respectively.
2.4 Coordination distances and zones
The principle of a coordination distance is that the probability of harmful interference from a station at a greater distance can be considered negligible.
The calculation of coordination distance involves special consideration. Path length is usually an input to any P-Series Recommendation used to calculated field strength or a propagation loss. A coordination distance can be calculated by defining the minimum allowable loss (or possibly the maximum allowable field strength) for the unwanted signal, and then iterating the propagation model for different distances until the required condition is satisfied to an acceptable degree of accuracy. This requires the propagation model to produce a result which varies monotonically with path length. Thus assumptions must be made about the path rather than performing detailed analysis of a path profile. The assumptions made should tend to over-estimate the unwanted signal strength to increase the probability that the coordination distance is a safe value.

6 ITU-R propagation prediction methods for interference and sharing studies
Coordination zones are the areas inside coordination distances, and in particular Recommendation ITU-R SM.1448 gives a method for constructing coordination zones for the international coordination of Earth stations. The propagation elements in Recommendation ITU-R SM.1448 are taken from Recommendation ITU-R P.620.
Both Recommendations ITU-R SM.1448 and ITU-R P.620 refer to propagation modes (1) and (2) without describing them, although the differences can be inferred. The two modes are described in the Radiocommunication Data Dictionary contained in Recommendation ITU-R SM.1413-2 § 5.24. Mode (1) refers to propagation mechanisms which can be taken into account by an analysis of the great-circle profile between the transmitting and receiving antennas, and mode (2) refers to mechanisms which require off-great-circle conditions to be examined. Essentially, mode (2) consists of hydrometeor scattering which can result in coupling between antenna beams, including side-lobes under certain conditions, and which can act to increase unwanted signal levels. Mode (1) consists of all other mechanisms.
2.5 Propagation mechanisms
Recommendations maintained by the Study Group 3, the P-Series, provide methods to predict the strength and the statistics of variability of received signal levels, both wanted and unwanted, in frequency sharing and coordination studies. Most of the methods give basic transmission loss using various propagation mechanisms. In one case it is necessary to give the result as transmission loss. The distinction between these two definitions of basic transmission loss is given in Recommendation ITU-R P.341.
This sub-section summarises the characteristics of the propagation mechanisms taken into account in the P-Series Recommendations.
a) Free-space loss. This is sometimes referred to as “spreading loss”. It accounts for the dilution of power flux density across a wave-front as it expands. The term "free space loss" should be restricted to cases where the radio wave expands in a 3-dimensional homogeneous medium. This can be approximated by transmission in the troposphere. Spreading loss is taken into account, where appropriate, in P-series Recommendations.
b) Gaseous attenuation. At higher frequencies, attenuation due to atmospheric gases may be significant on both terrestrial and Earth-space paths. Under average conditions at sea level the specific attenuation exceeds 0.01 dB/km at about 6 GHz, and 0.1 dB/km at about 20 GHz. Detailed methods for calculating gaseous attenuation are given in Recommendation ITU-R P.676. Atmospheric attenuation is due to oxygen and water vapour. The oxygen content of the atmosphere is stable, but the water vapour content is variable. The variability of water-vapour content is most significant at a peak in its attenuation around 22 GHz, and above 70 GHz. Statistics of water-vapour content are given in Recommendation ITU-R P.836.
c) Diffraction. Attenuation is caused by obstructions to a radio wave. In particular it is used to take account of terrain obstruction due to hills in combination with Earth curvature. Terrain diffraction occurs mainly on terrestrial paths, but can be significant for an Earth-space path at low elevation angles. Diffraction loss at a given frequency is constant for a stable obstruction geometry. However, variations in atmospheric refractivity with height can be equivalent to changes to the effective earth radius, with consequential changes to diffraction losses. This type of change, associated with normal although variable atmospheric conditions, can produce changes in terrain diffraction loss exceeded for percentage times in the approximate range 10% to 90%, that is, both enhancements and fades to signal strength. The mechanism is not associated with more extreme variability exceeded for less than about 10% time.
d) Atmospheric refractivity structures. Certain structures in atmospheric refractivity can cause convergence or divergence, sometimes referred to as focusing and de-focusing. These effects can cause both slow and fast enhancements and fades on both terrestrial and Earth-space paths, particularly for longer paths in the troposphere. Fast changes are referred to as scintillation. Irregularities in refractivity across the aperture of an antenna can also reduce the effective gain due to phase incoherence, an effect known as aperture-to-medium coupling.
e) Ducting and layer reflection. Departures from normal atmospheric structure in the form of layers can cause more extreme changes to signal strengths. In particular a wave trapped within an

Chapter 2 7
atmospheric duct can propagate with less than free-space loss. This can produce large enhancements when propagation through a duct effectively bypasses terrain diffraction loss. Depending on the relative heights of antennas and layers or ducts, this type of atmospheric structure can also produce deep fades, and when this occurs the attenuation is flat, that is, not frequency selective.
Ducting or layer reflection over land does not normally coincide with precipitation or windy conditions. The global incidence of these mechanisms varies from about 3% to 50%. The mechanisms have little impact for short paths, of the order of a few kilometres, but beyond about 10 km they can have large effects, and in particular cause large enhancements to interfering signals. They are thus an important part of sharing studies involving paths longer than of the order of 10 km.
Different conditions exist over the sea or large bodies of water. A duct exists for all, or at least a large fraction of, time above water due to evaporation from its surface. Windy conditions and high sea states can break up such ducts sufficiently to prevent them having a large effect on propagation, but under calm conditions the effect can be large. At low VHF the signal frequency may also be below the critical frequency of the waveguide formed by a surface duct. But at higher frequencies a propagation surface duct normally exists for more than half the time, and in some locations for most of the time. As in the case with a duct over terrain obstruction, the effect depends on the relative geometry of antenna and duct heights, which affect signal coupling into and out of the duct.
Ducting and layer reflection affects near-horizontal paths, and is thus primarily an issue for terrestrial-path propagation.
f) Tropospheric scatter. A further effect is due to atmospheric inhomogeneity which causes the scattering of radio waves. Where a strong signal exists, such as for a line-of-sight path or a transhorizon path with small diffraction losses, tropospheric scatter is not normally significant. The most usual effect is to provide in-fill to what would otherwise be a deep diffraction shadow. Tropospheric scatter can thus limit the protection which diffraction loss would otherwise provide against an unwanted signal.
g) Ionospheric effects. At low VHF there are various ionospheric mechanisms, including sporadic E-layer reflection, which can cause signal enhancements on terrestrial paths. These effects tend to be infrequent over long time periods, but have regional and seasonal variations. Ionospheric effects are also important on Earth-space paths below about 1 GHz, including rotation of linear polarisation, and ionospheric scintillation, and focusing and defocusing.
h) Precipitation. Rain and wet snow can cause signal fading on both terrestrial and Earth-space paths. For the purposes of sharing studies, fading primarily concerns the wanted signal. It must be taken into account in calculating the fade margin such that fading outage does not exceed the allowable percentage time. Rain-induced depolarisation is also significant where polarisation discrimination forms part of the separation of radio systems.
Precipitation can also cause a coupling between antenna beams due to scattering, the mode (2) mechanism which particularly effects coordination between earth stations and line-of-sight links.
i) Multi-path propagation. Simultaneous multiple propagation paths can exist due to atmospheric inhomogeneity, ground reflections, and reflections from objects such as buildings. The associated signal-level variability is frequency selective. Atmospheric multipath can be rapid, due to small-scale inhomogeneity, when it is termed scintillation. Slower multi-path variability occurs particularly on terrestrial line-of-sight paths with low inclination. Ground-reflection multi-path can be fairly stable in time, although rarely constant, and variations occur mainly with antenna height. Reflections from buildings can produce multiple rays. In urban environments the movement of traffic, etc., causes variability in time, and there will also be variability in space. All signal-strength variability due to multi-path propagation is characterised by broad small enhancements and narrow deeper fades, the terms broad and “narrow” applying to variability in all of time, space and frequency.
j) Shadowing. Terminals in cluttered environments, such as urban or woodland, and below clutter height, will experience special variability of signal strength over distances comparable with the width of the clutter objects.

8 ITU-R propagation prediction methods for interference and sharing studies
With reference to bullets i) and j) above, with the atmospheric and topographic data generally available it is impracticable to predict signal strength as a point on the multi-path distribution. The objective of the main part of a model will be to predict the median of the multi-path distribution. Where appropriate, a method will predict position on the shadowing distribution on a statistical basis, and apply this as a correction to the median of the multi-path distribution.

Chapter 3 9
CHAPTER 3
BRIEF GUIDE TO ITU-R P-SERIES PROPAGATION EFFECTS AND METHODS
3.1 Introduction
The selection of applicable RF propagation models and prediction methods for use in a technical analysis is dependent on the different propagation effects needed for a particular propagation path. The models and prediction methods developed by ITU-R P-Series cover a wide range of these effects. This chapter provides a brief guide to those models and methods with particular applicability for sharing studies and interference analyses.
The fundamental measure of the impact to a radio signal as it travels is its signal power. The propagation mechanisms modelled in ITU-R P-Series recommendations represent particular effects that can either increase or decrease the loss of a radio signal and consequently, the potential of radio interference from one system to another. Propagation mechanisms that can potentially increase interference include reflection/refraction, multipath, atmospheric ducting, effects of the Ionosphere, effects of the Troposphere, and rain scatter. Propagation mechanisms that can decrease interference between radio systems include diffraction and various attenuation effects.
Whereas a propagation model can calculate the impact of a single propagation mechanism along a radio path, prediction methods in ITU-R P-Series Recommendations consider multiple propagation mechanisms to allow the calculation of radio signal loss as the radio signal travels through a propagation environment. The propagation methods from ITU-R P-Series Recommendations discussed within this Handbook provide background on path mechanism impairments used within each prediction method, system performance objectives, details of system configuration, and additional information considered useful for applying the model to perform path predication or interference analysis. As far as possible, the prediction methods are evaluated by testing with measured data from the data banks of Study Group 3, and the results are used to indicate the accuracy of the prediction methods and the variability of the measured data.
The P-Series Recommendations contain a mix of models and methods for two complementary types of analyses. Models and methods for the design of links or paths are used for planning a radio service system and estimating the signal propagation loss between the transmitter and associated receiver(s). Link or path interference prediction models/methods are used to evaluate radio interference between and among two or more systems or services.
Propagation models are typically used to define a worst case scenario for a particular propagation mechanism. Models for system design focus on high attenuation scenarios. Interference analysis varies with changing conditions including multiple propagation mechanisms. The changing conditions in interference analysis lead to statistical descriptions in interference prediction models. Models for interference, therefore, focus on low attenuation scenarios.
3.2 Propagation terminology
The ITU has established the Coordination Committee for Vocabulary (CCV). This group is tasked to handle the large vocabulary requirements of the ITU. The CCV maintains and updates an online database of terms and definitions at:
http://www.itu.int/ITU-R/go/terminology-database

10 ITU-R propagation prediction methods for interference and sharing studies
This is the preferred method for finding definitions for any terms in the ITU Recommendations.
There are some Recommendations in the V-Series that are still in force. Table 3.2-1 lists the most relevant Recommendations for this Handbook. These Recommendations have ITU-R designations, but they are managed by the CCV at this time.
TABLE 3.2-1
Propagation terminology provided in V-Series Recommendations
Recommendation ITU-R Topic Title Purpose
V.573 Radiocommunication Radiocommunication vocabulary
General terms relating to radio-wave propagation.
V.662 General propagation Terms and definitions
General terms relating to radio-wave propagation.
Table 3.2-2
Propagation terminology provided in P-Series Recommendations
Recommendation ITU-R Topic Title Purpose
P.310 General propagation Definitions of terms relating to propagation in non-ionized media
General terms relating to radio waves, ground effects on radio-wave propagation, and tropospheric effects on radio-wave propagation.
P.313 General propagation Voir version électronique
Terminology and notation for describing the various losses associated with a radio link.
3.3 Guide to RF propagation prediction methods of ITU-R P-Series Recommendations useful for interference analysis
Table 3.3-1 below provides a guide to selected propagation prediction methods in ITU-R P-Series Recommendations. For the methods shown, applicability factors include path characteristics, system RF and operational/location parameters, time statistical criteria and model input data requirements. Table 3.3-1 is a modified version of the table provided in Recommendation ITU-R P.1144-4 Guide to the application of the propagation methods of Radiocommunication Study Group 3.
Each of the propagation prediction methods identified in Table 3.3-1 is described in detail in ITU-R P-Series Recommendations. It should be noted that all Recommendations are subject to review or can be superseded and that the latest version of a Recommendation in force should be used.
The selected Recommendations include:
a) ITU-R P.452 − Prediction procedure for the evaluation of interference between stations on the surface of the Earth at frequencies above about 0.1 GHz.
b) ITU-R P. 528 − Propagation curves for aeronautical mobile and radionavigation services using the VHF, UHF, and SHF bands.
c) ITU-R P.533 − Method for the prediction of the performance of HF circuits.
Chapter 3 11
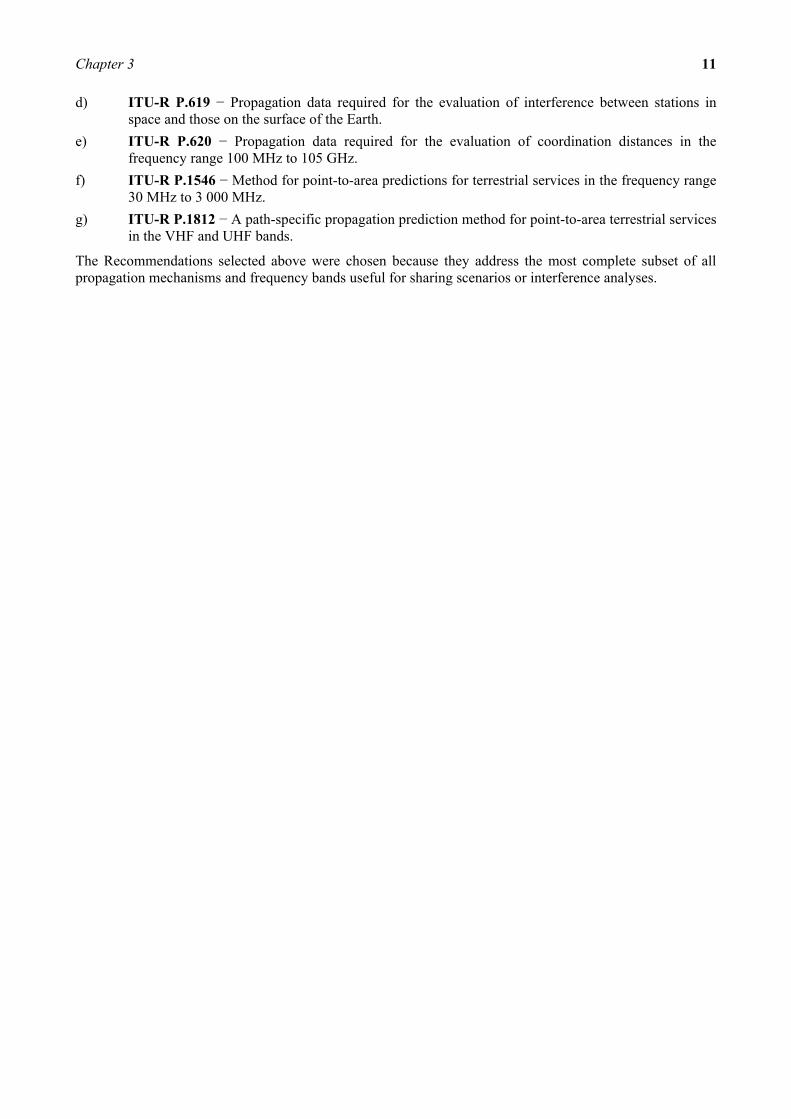
d) ITU-R P.619 − Propagation data required for the evaluation of interference between stations in space and those on the surface of the Earth.
e) ITU-R P.620 − Propagation data required for the evaluation of coordination distances in the frequency range 100 MHz to 105 GHz.
f) ITU-R P.1546 − Method for point-to-area predictions for terrestrial services in the frequency range 30 MHz to 3 000 MHz.
g) ITU-R P.1812 − A path-specific propagation prediction method for point-to-area terrestrial services in the VHF and UHF bands.
The Recommendations selected above were chosen because they address the most complete subset of all propagation mechanisms and frequency bands useful for sharing scenarios or interference analyses.

TABLE 3.3-1
Radiowave propagation prediction methods from selected ITU-R P-Series Recommendations
(modified version of Table in Rec. ITU-R P.1144-6)
Method Application Type Output Frequency Distance % time % location Terminal height Principle input data
Rec. ITU-R P.452
Services employing stations on the surface of the Earth; interference
Point-to-point Path loss 100 MHz to 50 GHz
Not specified but up to and beyond the radio horizon
0.001 to 50 Average year and worst month
Not applicable No limits specified, within the surface layer of the atmosphere. (Not suitable for aeronautical applications)
Path profile data Frequency Percentage time Tx antenna height Rx antenna height Latitude and longitude of Tx Latitude and longitude of Rx Meteorological data
Rec. ITU-R P.528
Evaluation of basic transmission losses likely to be encountered in the aeronautical services
Point-to-area Path loss
125 MHz to 15.5 GHz
0 to 1800 km (for aeronautical applications, 0 km horizontal distance does not mean 0 km path length)
1 to 95 Not applicable H1: 1.5 m to 20 km H2: 1 to 20 km
Distance Tx height Frequency Rx height Percentage time
Rec. ITU-R P.533
Method for the prediction of the performance characteristics for the prediction of sky-wave propagation
Point-to-point Basic MUF Sky-wave field strength Available receiver power Signal to noise ratio LUF Circuit reliability
2 − 30 MHz Up to 40 000 km All percentages
Not applicable Not applicable Latitude and longitude of Tx Latitude and longitude of Rx Sunspot number Month Time(s) of day Frequency Tx power Tx antenna type Rx antenna type
12
IT
U-R
propagation prediction methods for interference and sharing studies

Method Application Type Output Frequency Distance % time % location Terminal height Principle Input data
Rec. ITU-R P.619
Evaluation of interference between stations in space and those on the surface of Earth
Point-to-point Interference power level
100 MHz to 30 GHz
Not specified Not specified Not applicable No limits specified Path profile data Frequency Percentage time Tx antenna height Rx antenna height Latitude and longitude of Tx Latitude and longitude of Rx Meteorological data
Rec. ITU-R P.620
Earth station frequency coordination
Coordination distance
Distance of which the required propagation loss is achieved
100 MHz to 105 GHz
Up to 1 200 km
0.001 to 50 Not applicable No limits specified within the surface area of the atmosphere (not suitable for aeronautical applications)
Minimum basic transmission loss Frequency Percentage of time Earth-station elevation angle Principle antenna beam 3 dB beamwidth
Rec. ITU-R P.1546
Terrestrial services Tropospheric radio circuits over land paths, sea paths, mixed land/sea paths
Point-to-area Field strength
30 to 3 000 MHz
1 to 1 000 km 1 to 50 1 to 99 Tx/base: effective height from less than 0 m to 3 000 mRx/mobile:> 1 m
Terrain heights and ground cover (optional) Path classification Distance Tx antenna height Frequency Percentage time Rx antenna height Terrain clearance angle Percentage locations Refractivity gradient
Rec. ITU-R P.1812
Terrestrial services
Point-to-point Point-to-area
Field strength 30 MHz to 3 GHz
Not specified but up and beyond the radio horizon
1 to 50 1 to 99 No limits specified, within the surface layer of the atmosphere (not suitable for aeronautical applications)
Path profile data Frequency Percentage time Tx antenna height Rx antenna height Latitude and longitude of Tx Latitude and longitude of Rx Meteorological data
Chapter 3
13

NOTE 1 − For each of the ITU-R Recommendations in Table 1, there are associated information columns to indicate:
Application: the service(s) or application for which the Recommendation is intended.
Type: the situation to which the Recommendation applies, such as point-to-point, point-to-area, line-of-sight, etc.
Output: the output parameter value produced by the method of the Recommendation, such as path loss.
Frequency: the applicable frequency range of the Recommendation.
Distance: the applicable distance range of the Recommendation.
% time: the applicable time percentage values or range of values of the Recommendation; % time is the percentage of time that the predicted signal is exceeded during an average year.
% location: the applicable per cent location range of the Recommendation; % location is the percentage of locations within, say, a square with 100 to 200 m sides that the predicted signal is exceeded.
Terminal height: the applicable terminal antenna height range of the Recommendation.
Input data: a list of parameters used by the method of the Recommendation; the list is ordered by the importance of the parameter and, in some instances, default values may be used.
14
IT
U-R
propagation prediction methods for interference and sharing studies

Chapter 3 15
3.4 ITU-R P-Series specific RF propagation phenomena
The P-Series Recommendations include numerous models for specific propagation effects. Some of these models are incorporated into the propagation prediction methods cited above. Others are standalone and are useful in evaluating a specific propagation phenomenon. All models are regularly validated and updated by Study Group 3 based on new insight such as correlation with propagation measurements. The latest versions of the P-Series Recommendations are available on the ITU website.
3.4.1 ITU-R P-Series specific propagation effects
Table 3.4-1 summarizes propagation effects in different frequency bands with a list of applications in each band.
Table 3.4-2 is a brief summary of certain P-Series Recommendations, i.e. those that deal with certain specific propagation properties or mechanisms affecting a radiowave. These tables can be used by interested Study Groups to obtain further information and specific calculations on any dominant propagation mechanism discussed within the Handbook or for other mechanism specific modelling scenario.

TABLE 3.4-1
Propagation effects in different frequency bands
Frequency band Atmospheric influence Terrestrial influence Applications Comments
ELF < 3 kHz
Waveguide and cavity propagation with ionosphere as upper boundary
Earth forms lower boundary of waveguide, waves propagate deep into earth or sea
Long-range communication with submarines, mines, underground remote sensing, etc.
Very large antennas, very low data rate
VLF 3-30 kHz
Waveguide propagation with D-region as upper boundary
Earth forms lower boundary Worldwide telegraphic services with ships, fixed long-range services, navigational aids, time standards
Very large antennas, low data rate
LF 30-300 kHz
Waves below D region up to 100 kHz, sky waves distinct from ground waves above 100 kHz
Ground waves follow Earth Long-range communication with ships, medium distance navigation systems
Large antennas, difficult to make it directional
MF 300-3 000 kHz
Sky waves for longer distances and higher frequencies
Surface waves for shorter distances and lower frequencies, ground reflections
Broadcasting, navigational aids, other mobile and fixed services
Large but efficient antennas, service area about 100 km during day, much longer distances possible at night
HF 3-30 MHz
Ionospheric beyond skip distance (6-30 MHz)
Surface waves only at short distance (3-6 MHz), reflection, scatter
Fixed point-to-point, land, maritime and aeronautical mobile, long distance broadcasting
Curtain arrays, vertical whips, log periodic arrays
VHF 30-300 MHz
Tropospheric waves sporadic E cause interference
Terrestrial LOS and BLOS with diffraction, multipath effects due to reflection
Broadcasting, land, aeronautical and maritime mobile, cordless telephones, radionavigation
Yagi, slots and helixes used
UHF 300-3 000 MHz
Refraction, reflection at lower and ducting at higher frequencies, troposcatter above about 500 MHz
Terrestrial and Earth-space LOS and slightly BLOS, screening by hills and buildings
TV broadcasting, radars, fixed point-to-point, mobile, MSS, BSS, FSS, cellular radio, cordless telephones
Both wideband and high gain antennas used
16
IT
U-R
propagation prediction methods for interference and sharing studies

TABLE 3.4-1 (end)
Frequency band Atmospheric influence Terrestrial influence Applications Comments
SHF 3-30 GHz
Refraction and ducting, attenuation due to rain etc., scintillation, ducting may cause interference, multipath cause fading, absorption by rain, snow, fog, cloud and gases
Terrestrial and Earth-space LOS, diffraction and screening due to buildings, scatter and reflection from buildings, terrain, trees and sea
Fixed terrestrial and satellite services, mobile, future MSS, radar remote sensing
High gain parabolic dishes and horns
MILLIMETRIC EHF 30-300 GHz
Refractive index gradient, rain etc. cause attenuation and scatter, absorption by water vapour and oxygen, scintillation
Terrestrial short distance LOS, screening by buildings and foliage
Short-range fixed and mobile communication systems, satellite applications, remote sensing, radars
Small parabolic dishes
SUBMILLIMETR 300-3 000 GHz
Localized refractive index gradient, rain etc. cause severe attenuation, absorption by gases, scintillation
Very short range LOS, screening by trees
Short-range communications, remote sensing
Mirror or lens antennas, equipment lacking
INFRARED AND OPTICAL 3-430 THz and 430-860 THz
Localized refractive index gradient, rain etc. cause very severe attenuation, absorption by gases, scintillation
LOS, screening by small objects Short-range and indoor for far-infrared, alarms, smoke detectors, remote control and spectrometry for near-infrared, optical LOS links
Mirrors and lenses for antennas
Chapter 3
17

18 ITU-R propagation prediction methods for interference and sharing studies
TABLE 3.4-2
ITU-R P-Series models for specific propagation effects
Recommendation ITU-R
Topic Title Purpose
P.525 Free-space propagation
Calculation of free-space attenuation
Fundamental formula for basic free space transmission. This calculation is often used as a reference point in other Study Group 3 propagation loss calculations.
P.453 Refraction The radio refractive index: its formula and refractivity data
Definition of refractive index and procedure to calculate the refractive index
P.834 Refraction Effects of tropospheric refraction on radiowave propagation
Methods and calculations for large scale diffractive effects in the atmosphere
P.531 Ionospheric effects
Ionospheric propagation data and prediction methods required for the design of satellite services and systems
Methods and calculations for evaluating ionospheric effects on Earth-to-space paths from 0.1-12 GHz
P.532 Ionospheric effects
Ionospheric effects and operational considerations associated with artificial modification of the ionosphere and the radio-wave channel
Methods and calculations for evaluating the effect of radio signals and other phenomenon such as chemicals on the ionosphere
P.844 Ionospheric effects
Ionospheric factors affecting frequency sharing in the VHF and UHF bands (30 MHz-3 GHz)
Information to be taken into account on the ionosphere when planning systems in the VHF & UHF bands
P.1239 Ionospheric effects
ITU-R reference ionospheric characteristics
General reference information for ionospheric calculations
P.676 Atmospheric gases
Attenuation by atmospheric gases
Describes the effects and provides calculations on atmospheric gases on radio waves
P.833 Clutter Attenuation in vegetation Provides a model and describes the effects of various vegetation on radio waves
P.837 Precipitation Characteristics of precipitation for propagation modelling
Maps of meteorological data for performing attenuation calculations
P.838 Precipitation Specific attenuation model for rain for use in prediction methods
Calculation method for rain attenuation on communications paths
P.840 Precipitation Attenuation due to clouds and fog
Provides a description and calculation method for the attenuation due to clouds and fog on communications paths
P.1815 Precipitation Differential rain attenuation Method to calculate differential rain attenuation on satellite paths

Chapter 3 19
3.5 ITU-R P-Series RF propagation path requirements
Radio waves travel through many different propagation environments due to the diversity of services that they support. While specific radio propagation mechanisms addressed in § 3.6.1 are dominant parameters in interference modelling, it is important to know which propagation path a particular link uses so that an appropriate model can be applied which considers all relevant propagation effects. Table 3.6-1 briefly summarizes ITU-R P-Series Recommendations detailing propagation considerations and required data for analysis of propagation paths used by certain radiocommunication services. This table can be used by interested parties to obtain further information and specific calculations on any path specific propagation characteristic discussed within the Handbook or for other path specific modelling scenarios.
TABLE 3.5-1
Recommended propagation data requirements for specific service analysis
Method Path type Title Purpose
ITU-R P.679 Space-Earth Propagation data required for the design of broadcasting-satellite systems
Propagation considerations that must be taken into account when designing or analysing a broadcast satellite system
ITU-R P.680 Earth-space Propagation data required for the design of Earth-space maritime mobile telecommunications systems
Propagation considerations that must be taken into account when designing or analysing a maritime mobile communications system
ITU-R P.681 Earth-space Propagation data required for the design of Earth-space land mobile telecommunications systems
Propagation considerations that must be taken into account when designing or analysing an Earth-space mobile telecommunications system
ITU-R P.682 Earth-space Propagation data required for the design of Earth-space aeronautical mobile telecommunication systems
Propagation considerations that must be taken into account when designing or analysing an Earth-space aeronautical mobile telecommunication systems
ITU-R P.530 Line-of-sight Propagation data and prediction methods required for the design of terrestrial line-of-sight systems
Propagation considerations and calculations in the design or analysis of a line-of-sight system
ITU-R P.1407 Multipath Multipath propagation and parameterization of its characteristics
Propagation considerations that must be taken into account when designing or analysing a multipath telecommunications system
A communication path may also involve many links from the originating transmitting station to the specified receiver. The links can involve both terrestrial and Earth-to-space satellite communications hops. The links can take many forms that involve multiple transmitter stations, ground repeaters, ground amplifiers, or even a satellite link in the middle of a terrestrial path. One such example of a multiple hop transmission is communication between one mobile device and another mobile device. The transmitting mobile device may not be able to directly communicate with the intended receiving mobile device because of distance or other factors. The transmitting mobile device must instead communicate by way of an intermediate radio tower or multiple intermediate radio towers. The radio tower may then have to transmit to another radiocommunication tower before the intended receiver is able to communicate. The communications link may also involve a satellite path if the receiving communication device is at a significant distance from the transmitting device.

20 ITU-R propagation prediction methods for interference and sharing studies
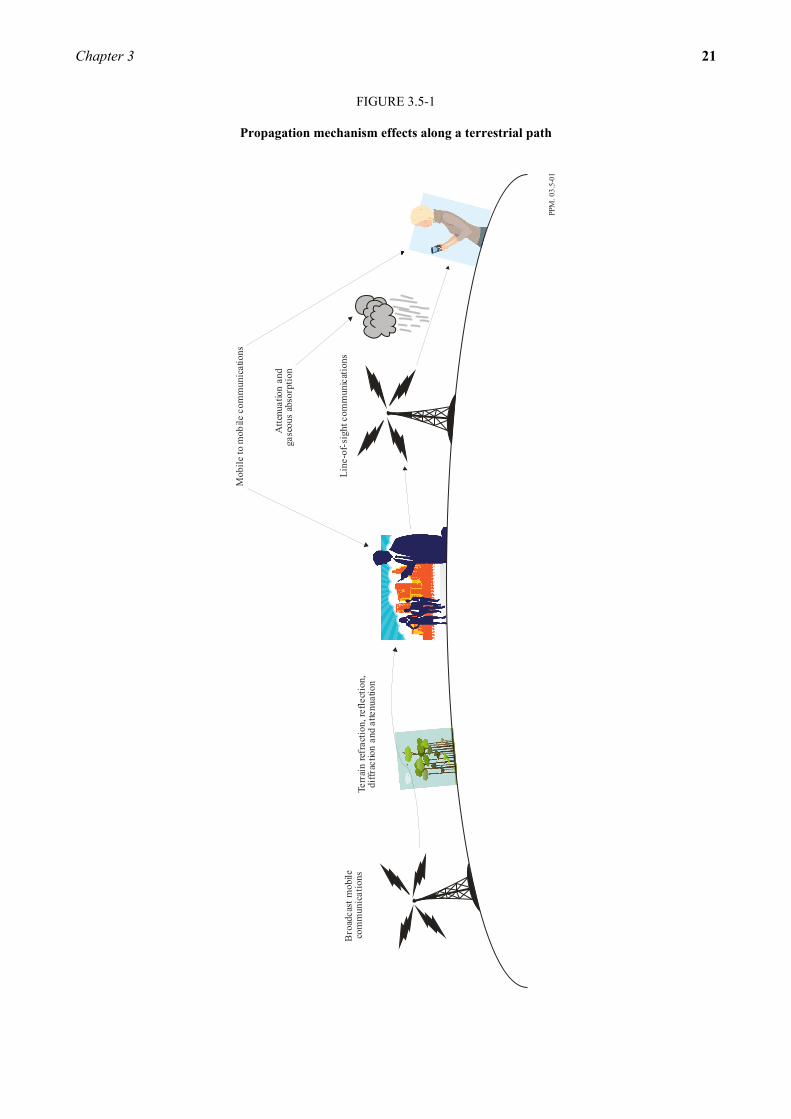
The propagation effects that can affect terrestrial paths include reflection, refraction, free space loss, and diffraction due to the terrain of the environment and also physical obstacles that can lie in the path of the radio wave as discussed in Table 3.5-1. Gaseous absorption in the atmosphere can also cause propagation effects on terrestrial paths. Figure 3.5-1 illustrates the various propagation paths and the propagation mechanisms that apply to each path. These illustrations can be used to help identify the appropriate propagation modelling scenario to be applied for a specific interference sharing scenarios.
Chapter 3 21
FIGURE 3.5-1
Propagation mechanism effects along a terrestrial path
PPM
. 03.
5-01
Mob
ile
to m
obile
com
mun
icat
ions
Att
enua
tion
and
gase
ous
abso
rpti
on
Lin
e-of
-sig
ht c
omm
unic
atio
ns
Terr
ain
refr
acti
on, r
efle
ctio
n,di
ffra
ctio
n a
nd a
ttenu
atio
n
Bro
adca
st m
obile
com
mun
icat
ions

22 ITU-R propagation prediction methods for interference and sharing studies
Earth-to-space and space-to-Earth paths traverse the Earth’s atmosphere. Many propagation effects can potentially affect the radio link. A signal that originates at an earth station may encounter diffraction if the surrounding area is not clear of obstructions. As the signal travels upward, it can encounter attenuation due to atmospheric gasses, clouds, or hydrometeors. As the signal propagates through the ionosphere, it can encounter scintillation, further signal attenuation, and signal depolarization due to Faraday rotation. A signal that originates in space will encounter attenuation in the atmosphere and ionosphere and then diffraction and ground effects as the signal propagates closer to the Earth’s surface. Figure 3.5-2 illustrates a space-to-Earth path of a radio wave and the various propagation effects that can affect the radio signal as it propagates along the path.

Chapter 3 23
FIGURE 3.5-2 Propagation mechanism effects along a space-Earth or Earth-space path
PPM
. 03.
5-02
Sci
ntil
lati
onIo
nosp
here
Dep
olar
izat
ion
Clo
ud a
nd r
ain
atte
nuat
ion
Atm
osph
eric
gas
esre
frac
tive
eff
ects


Chapter 4 25
CHAPTER 4
RADIOWAVE PROPAGATION PHENOMENA
4.1 Introduction
This chapter describes certain fundamentals of radio wave propagation including environmental properties along with propagation terminology applicable to interference analysis using models and methods in ITU-R P-Series Recommendations.
4.2 Statistical nature of radio propagation
There are many phenomena which affect the propagation of radio signals. Because it is very difficult to control or account for all possible contributing phenomena on even a single, well defined fixed link of a useful radio system, observations of the signal strength will fluctuate as a function of time. In general, these fluctuations may have two time-scales: one which varies approximately hour-to-hour and a second, nearly instantaneous time-scale determined by the differences in the times of arrival of rays from scattering centres in the surrounding environment that superpose both constructively and destructively, which is often referred to as multipath. This latter variation is beyond the scope of this Handbook. Instead, if one supposes that the hourly medians of the signal strength are measured, thus averaging out the multipath variations, then one can characterize the fluctuations of these hourly medians, when measured for a period of, say, several years. Although these fluctuations of the hourly medians have deterministic causes, in general neither our observations nor P-series models and methods have the complexity necessary to account for these effects. In particular, the models could not be reliably used to predict the time series of hourly median fluctuations. Because of this, we take the approach that we can characterize the long term median of these hourly medians and the values exceeded for given fractions of the time, which is equivalent to a description of the cumulative distribution function of our (supposed) random variable, the hourly median signal strength. Statements such as: “On this path, the signal strength of 41 dB (μV/m) is exceeded for 10% of the time” arise from our model of time variability.
In Recommendations ITU-R P.452, ITU-R P.1546 and ITU-R P.1812, users will find that the time variability is distance and radio-climate dependent, in particular, with respect to proximity to large bodies of water. The second of these dependences is not surprising, since one expects that changes in the atmosphere, specifically, the atmospheric refractive index and its lapse rate, are responsible for much of the time variability that concerns us here. The distance dependence is also not too surprising, if one remembers that different mechanisms tend to dominate tropospheric propagation at different distance ranges, and these might reasonably be expected to result in different cumulative distribution functions.
If one next turns to the question of long-term measurements on different paths in the same situation, that is, the same system parameters, the paths chosen in the same way within a single area and the environmental parameters as close as possible to being the same, then one finds that the long-term time variability statistics (i.e. the cumulative distribution functions) change from path to path. This path-to-path variation in the long-term time variability statistics is referred to as the location variability. One possible cause for the location variability is that although the paths’ profiles appear to be indistinguishable from one another in a statistical sense, the detailed differences alter their long-term time variabilities. Thus there are cumulative distributions of cumulative distributions and one makes statements of the form: “In this situation, there will be 30% of path locations where the signal strength of 41 dB (μV/m) is exceeded for at least 10% of the time.”
In a Recommendation, such as ITU-R P.452, which considers only a single well defined path, it is improper to speak of different paths or to make adjustments for location variability. However, in the point-to-area prediction methods of Recommendations ITU-R P.1546 and ITU-R P.1812, it is certainly the case that different paths must be considered and therefore proper to make adjustments for location variability. The location variability is independent of distance and radio-climate but is frequency and situation dependent. In Recommendation ITU-R P.1812 the location variability is also dependent on receive antenna height.

26 ITU-R propagation prediction methods for interference and sharing studies
As a prelude to subsequent discussion, it will be useful to introduce the concept of the deviation. We want to compute the quantiles of basic transmission loss at distance , , ( , , ). The distributions involved are nearly normal, so it simplifies the calculation to express the fractions in terms of standard normal deviates. The complementary normal distribution is given by:
( ) = 1√2π =
(4.1)
and the standard normal deviate, z, is obtained from the inverse function:
( ) = ( ) (4.2)
If the field strength, E (dB), is a normally distributed random variable with mean (also equal to its median) and standard deviation σ, then its quantiles are given by:
( ) = + σ ∙ ( ).
(4.3)
Note the convention that the positive direction of deviation corresponds to an increase in field
strength, hence a decrease in loss. To obtain the twofold quantile of basic transmission loss, ,
we write:
( ) ( ) ( ) ( )LLTTbLTb qYqYxLxqqL −−= ,5.0,5.0,, (4.4)
where the overall median value, (0.5,0.5, ) = (0.5), and the deviations, YL and YT, may be written:
( ) ( )LLLL qzqY ⋅σ= (4.5a)
( ) ( )TTTT qzqY ⋅σ= + for ( ) 0≥Tqz
(4.5b)
and where the “pseudo-standard deviation” of the time variability, +σT , is a function of the distance, x. A
method for computing the “pseudo-standard deviation” of the time variability, +σT , is given below, since it is not explicitly given in the Recommendations.
x
( )5.00 ≤≤ q( )xqqL LTb ,,

Chapter 4 27
For certain interference and/or sharing studies involving mobile services, it may be necessary to calculate the combined time and location variability. In those cases, the root sum square approximation may be used to estimate the combined variability. To obtain the “pseudo-standard deviation” of the time variability, +σT , use the 10% time and 50% time quantiles of the field strengths [dB]:
( ) ( )282.1
5.0,5.05.0,1.0 EET
−=σ + (4.6a)
or, in terms of the corresponding quantiles of basic transmission losses in dB,
( ) ( )282.1
1.05.0 bubuT
LL −=σ + (4.6b)
As noted above, the “pseudo-standard deviation” of the time variability is path distance dependent, so it must be evaluated for each distance of interest.
The combined standard deviation of time and locations,σ , is then approximated by the square root of the sum of the squares of the standard deviations of the time variability, σ , and the location variability, σ :
σ = σ + σ .
(4.7)
Evaluation of service and interference
In many radiocommunication services, frequency reuse is required for efficient utilization of a service’s allocated band. Furthermore, if the allocated band’s spectral extent exceeds that necessary to support a single channel’s operation, there may be adjacent channel emitters at some frequency offset from a given emitter’s desired signal. An important issue that may arise is the co- and adjacent-channel interference that may occur from multiple transmitters operating within this band. When a band is shared among different services, there is also the potential for inter-service interference, even though each of the services is individually free of interference.
• D/U within a service
When considering intra-service interference, one common method for estimating the effect of interference is the ratio of the desired-to-undesired (i.e. interfering) signal strengths, either co-channel or adjacent-channel. Typically, but not always, co-channel interference is the more invidious of the two and the limiting factor in intra-service frequency reuse. The starting point here is that the desired signal should be strong enough that its availability in terms of fractions of the time is great enough that one would judge the service acceptable or adequate. If one imagines a broadcast-like service with an mni-directional coverage area, it is natural to extend the signal availability to fractions of locations also and talk of a coverage area.
There are two idealized deployment scenarios which bound service planning. Now if the transmitter providing the desired signal is very low power and isolated, then one could simply increase its coverage area by increasing the transmitter’s power, all other system parameters being fixed. This is noise-limited service. (In a similar vein, for a single well defined path, increasing the transmitter’s power would increase the fraction of the time that the desired signal is available.) The only limitation on the coverage area size would be the practical constraints on transmitted power.
28 ITU-R propagation prediction methods for interference and sharing studies
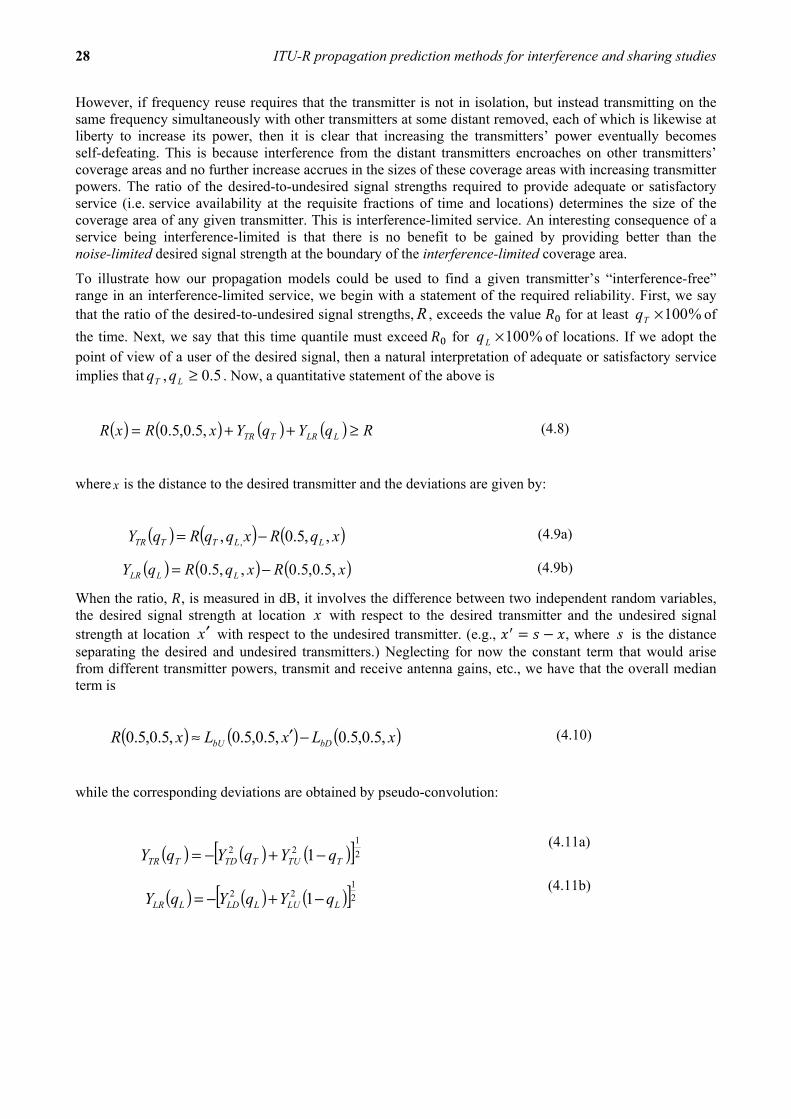
However, if frequency reuse requires that the transmitter is not in isolation, but instead transmitting on the same frequency simultaneously with other transmitters at some distant removed, each of which is likewise at liberty to increase its power, then it is clear that increasing the transmitters’ power eventually becomes self-defeating. This is because interference from the distant transmitters encroaches on other transmitters’ coverage areas and no further increase accrues in the sizes of these coverage areas with increasing transmitter powers. The ratio of the desired-to-undesired signal strengths required to provide adequate or satisfactory service (i.e. service availability at the requisite fractions of time and locations) determines the size of the coverage area of any given transmitter. This is interference-limited service. An interesting consequence of a service being interference-limited is that there is no benefit to be gained by providing better than the noise-limited desired signal strength at the boundary of the interference-limited coverage area.
To illustrate how our propagation models could be used to find a given transmitter’s “interference-free” range in an interference-limited service, we begin with a statement of the required reliability. First, we say that the ratio of the desired-to-undesired signal strengths, R , exceeds the value for at least %100×Tq of
the time. Next, we say that this time quantile must exceed for %100×Lq of locations. If we adopt the point of view of a user of the desired signal, then a natural interpretation of adequate or satisfactory service implies that 5.0, ≥LT qq . Now, a quantitative statement of the above is
( ) ( ) ( ) ( ) RqYqYxRxR LLRTTR ≥++= ,5.0,5.0 (4.8)
where is the distance to the desired transmitter and the deviations are given by:
( ) ( ) ( )xqRxqqRqY LLTTTR ,,5.0, , −= (4.9a)
( ) ( ) ( )xRxqRqY LLLR ,5.0,5.0,,5.0 −= (4.9b)
When the ratio, , is measured in dB, it involves the difference between two independent random variables, the desired signal strength at location x with respect to the desired transmitter and the undesired signal strength at location x′ with respect to the undesired transmitter. (e.g., = − , where s is the distance separating the desired and undesired transmitters.) Neglecting for now the constant term that would arise from different transmitter powers, transmit and receive antenna gains, etc., we have that the overall median term is
( ) ( ) ( )xLxLxR bDbU ,5.0,5.0,5.0,5.0,5.0,5.0 −′≈ (4.10)
while the corresponding deviations are obtained by pseudo-convolution:
( ) ( ) ( )[ ]2
122 1 TTUTTDTTR qYqYqY −+−=
(4.11a)
( ) ( ) ( )[ ]2
122 1 LLULLDLLR qYqYqY −+−=
(4.11b)
x

Chapter 4 29
where the subscripts and refer to the desired and undesired stations, respectively, the overall negative signs on the right-hand sides are because we assume that 5.0, ≥LT qq and we use the complementary
quantiles for the undesired signals because, if the quantiles of . are ( )qYU , then the quantiles of Uy− are
( )qYU −− 1 . The individual deviations are given by:
( ) ( ) ( )xqLxqqLqY LbDLTbDTTD ,,5.0,, −= (4.12a)
( ) ( ) ( )xqLxqqLqY LbULTbUTTU ′−−′−−=− ,1,5.0,1,11 (4.12b)
( ) ( ) ( )xLxqLqY bDLbDLLD ,5.0,5.0,,5.0 −= (4.12c)
( ) ( ) ( )xLxqLqY bULbULLU ′−′−=− ,5.0,5.0,1,5.01 (4.12d)
If the basic transmission loss is monotonically increasing with distance, then the “interference-free” range is rx ≤ where ( ) 0RrR = , along the line joining the locations of the desired transmitter and the undesired
transmitter.
• Sharing between services (e.g. C/I)
In the previous example we were concerned with intra-service interference observed at the locations that might be the sites of attempts to receive a desired signal in the presence of an undesired signal. A practical example might be determining the optimal spacing of co-channel broadcast transmitters in order to maximize “interference-free” coverage over a large region, such as a country.
Another scenario where interference may occur is that where two or more different services share spectrum. In this scenario, a regulator may need to develop rules for each service, in order to ensure “interference-free” coexistence. As before, we take the modifier “interference-free” to be tied to a statement of the required reliability for the ratio of signal strengths, i.e. the ratio of the wanted, i.e. desired, signal strength, C, to the unwanted, or interfering or undesired, signal strength, I, and we can use the method of the previous section to analyse such interference scenarios also. However, in view of the fact that, when the ratio is measured in dB, it involves the difference of two independent random variables, the statement of reliability should apply to both the wanted and interfering signals in a consistent way.
For example, a statement of reliability involving only a percentage of time, which might apply to a link having both terminals’ locations fixed, must be generalized when considering interference from a mobile station into the fixed link. In this case, the complementary quantile of the deviation for the undesired signal should apply to the combined time and location variability. For interference in the opposite sense, i.e. interference from the fixed link into the mobile station, the statement of reliability for the wanted signal would involve a percentage of the combined time and locations. The complementary quantile of the undesired signal would involve the combined time and location variabilities, instead of the time variability alone.
As a second example, consider a broadcast station sharing with a mobile station. For mobile interference into a broadcast receiver, the wanted/desired signal’s reliability would be stated in the twofold quantile of time and location variability. The complementary quantile for the unwanted/undesired mobile signal must also be in the twofold quantile. For interference in the opposite sense, from the broadcast transmitter into the mobile station, the statement of reliability for the wanted signal would be in terms of the quantile of the combined time and location fraction, so the complementary quantile for the unwanted/undesired broadcast signal should be in terms of the combined time and location fraction.

30 ITU-R propagation prediction methods for interference and sharing studies
For some cases, in which one only wishes to consider the variability of the interfering or unwanted signals, the focus is solely on the complementary quantiles. For example, for a radio astronomy station, one might
make a statement that interference should only exceed a specified threshold for % of the time. In
this case, the meaning of “interference-free” service corresponds to % time availability/reliability of the wanted signal and the natural interpretation of adequate or satisfactory service is
.
4.3 Interference protection criteria
Interference protection criteria (IPC) is a relative or absolute interfering signal level defined at the receiver input, under specified conditions, such that the allowable performance degradation is not exceeded. This is usually defined as an absolute interference power level I, interference-to-noise power ratio I/N, or carrier-to-interfering signal power ratio C/I. IPC are specified for aggregate interfering signals, i.e. total from all interfering signals or single-entry interfering signal. Aggregate IPC are generally derived from the performance objectives and may be used to define the interfering signal environment in system design. Single-entry IPC are derived from aggregate IPC and used as some form of sharing criteria like spectrum sharing.
IPC are dependent upon the specific type of interfering signal and are usually specified for a few kinds of generic signal types, such as, continuous wave (CW), noise-like, pulse, impulse. Some are also specified as short-term, long-term and same as desired signal. There are a few other parameters generally needed to fully specify IPC. They are power threshold, reference bandwidth, percentage of time and location and other special conditions, if any. A review of IPC specified for different types of services suggest the following trend: IPC expressed as I/N range from −12 dB to −6 dB and IPC expressed as C/I range 12 dB to 20 dB. Examples of IPC specified in various ITU-R Recommendations are listed in Table 4.3-1.
TABLE 4.3-1
Examples of interference protection criteria in ITU-R Recommendations
Type of service Interference protection criteria Reference
Fixed service − Other than radar interference
I/N≤ −6 dB ITU-R F.1334
Fixed service − Radar interference (fixed and transportable land based radar)
IPK/N ≤ 0 dB ITU-R F.1190
Fixed service - Radar interference (maritime and land mobile radar)
IPK/N≤ 10 dB ITU-R F.1190
Fixed-satellite service I/N (single-entry) ≤ −12 dB ITU-R S.735, ITU-R S.1323 ITU-R S.1432
C/I ≥ 27 dB aggregate (Regions 1 and 3) Appendix 30A of the ITU Radio Regulations
C/I ≥ 30 dB single entry (Earth-to-space) C/I ≥ 26.65 dB single entry (space-to-Earth)
C/I ≥ 21 dB aggregate (overall, including Earth uplink and downlink)
Appendix 30B of the ITU Radio Regulations
100×Tq
( ) 1001 ×− Tq
5.0≤Tq

Chapter 4 31
TABLE 4.3-1 (end)
Type of service Interference protection criteria Reference
Radiodetermination service (f = 2 700-2 900)
I/N≤ −10 dB ITU-R M.1464
Radiodetermination service (all other bands)
I/N≤ −6 dB ITU-R M.1461
Broadcasting-satellite service C/I ≥ 21 dB aggregate (Regions 1 and 3) C/I ≥ 28 dB aggregate (Region 2)
Appendix 30 of the ITU Radio Regulations
Terrestrial-broadcasting service I ≤ 1% total receiving noise power (emissions without corresponding frequency allocation)
I ≤ 10% total receiving noise power (emissions from radiocommunication services with a corresponding co-
primary allocation.
ITU-R BT.1895
Land mobile I ≤ −117 dBW aggregate indoor I ≤ −119 dBW aggregate outdoor
ITU-R M.687
GSO mobile satellite service I/N≤−7 dB aggregate I/N≤−12 dB single entry
ITU-R M.1183
NGSO mobile satellite service I ≤ −142.1 dBW aggregate I ≤ −146.2 dBW single entry space Earth
I ≤ −147.3dBW single entry terrestrial
ITU-R M.1231 ITU-R M.1232
Aeronautical mobile satellite service
I/N≤−7 dB aggregate I/N≤−12 dB single entry
ITU-R M.1234
Space research service near-Earth: space-to-Earth
I ≤−216 dB (W/Hz) for 1-20 GHz Earth I ≤−156 dB (W/MHz) above 20 GHz Earth
ITU-R SA.609
Space research service near-Earth: Earth-to-space
I ≤−177 dB (W/kHz) ITU-R SA.609
Space research service deep-space: space-to-Earth
I ≤ −222 dB(W/Hz) in bands near 2 GHz I ≤ −221 dB(W/Hz) in bands near 8 GHz I ≤ −220 dB(W/Hz) in bands near 13 GHz I ≤ −217 dB(W/Hz) in bands near 32 GHz
ITU-R SA.1157
Space research service deep-space: Earth-to-space
I ≤ −193 dB(W/20 Hz) in bands near 2 GHz I ≤ −190 dB(W/20 Hz) in bands near 7 GHz I ≤ −186 dB(W/20 Hz) in bands near 17 GHz I ≤ −183 dB(W/20 Hz) in bands near 34 GHz
ITU-R SA.1157
Space research service 37 and 40 GHz bands (space-to-Earth links)
I/N≤−6 dB ITU-R SA.1396
Space research service 37 and 40 GHz bands (Earth-to-space links)
I/N≤ 0 dB
ITU-R SA.1396
Data relay satellite outside S-Band
I ≤−178 dBW ITU-R SA.1155
Data relay satellite in S-Band
I ≤−181 dBW ITU-R SA.1274
Space operation systems space-to-Earth links
I ≤−184 dBW ITU-R SA.363
Space operation systems Earth-to-space links
C/I ≥ 20 dB

Chapter 5 33
CHAPTER 5
APPLICATION OF ITU-R P-SERIES PROPAGATION MODELS AND METHODS FOR SHARING AND INTERFERENCE ASSESSMENTS
5.1 Introduction
The selection of an applicable propagation model for use in a technical analysis is based on the different propagation effects needed in a propagation path as discussed in the preceding chapters. The models are based on Recommendations and prediction methods developed by ITU-R Study Group 3. This Chapter will provide a detailed review of the selection of specific propagation models, see Chapter 3 for a brief Guide to propagation models. This chapter will provide a detailed description of the individual propagation models and methods referenced in this Handbook.
5.2 Recommendation ITU-R P.452
Recommendation ITU-R P.452 contains a prediction method for the evaluation of microwave interference between stations on the surface of the Earth at frequencies from the range of 0.7 GHz to 50 GHz. The model deals strictly with two stations on the surface of the Earth, operating in a point-to-point or line of sight propagation path. Propagation effects considered in Recommendation ITU-R P.452 involve both clean air propagation mechanisms and hydrometeor scattering propagation mechanisms. Clean air propagation mechanisms in Recommendation ITU-R P.452 include line-of-sight propagation, diffraction, ducting, and clutter losses. The output of the method evaluates the field strength produced at a receiver as a radio signal propagates from one radio station to another and does not include a method to calculate interference produced by this radio signal. However, interference problems can be addressed using Recommendation ITU-R P.452, where the potential for interference is between microwave radio stations located on the surface of the Earth by using the field strength calculated by the model and a basic radio link analysis to see the result of interference between the transmitter and receiver.
The method of Recommendation ITU-R P.452 includes a complementary set of propagation models which ensure that the predictions embrace all the significant interference propagation mechanisms that can arise. To use the method, a specific knowledge and database of the terrain path profile between the transmitter and receiver are input into the model. Additionally, a correction factor is included in the method for evaluation of clutter loss at either or both ends of the path where the clutter scenario is known. The recommendation provides a model to calculate additional clutter loss to a maximum of 20 dB above 0.9 GHz, down to 5 dB at 0.1 GHz.
The terrain path profile and clutter methods for analysing the radio-meteorological and topographical features of the path are provided in the model so that predictions can be prepared for any practical interference path falling within the scope of the procedure up to a distance limit of 10 000 km. The procedure for calculating meteorological effects has been defined completely as separate methods for clear-air and hydrometeor-scatter (rain and cloud) interference prediction. Since the method can analyse many types and combinations of the interference path, perform detailed analysis of the terrain profile path, and has the ability to analyse additional losses due to clutter, Recommendation ITU-R P.452 is an attractive solution to analysing interference cases between two stations on the surface of the Earth.

34 ITU-R propagation prediction methods for interference and sharing studies
Figure 5.2 presents an overview of the various propagation mechanisms considered in Recommendation ITU-R P.452.
FIGURE 5.2
Overview of the various propagation mechanisms considered in Recommendation ITU-R P.452
PPM. 05.2
Radio-climaticinformation
Terrain profile
Additional clutter losses
Climatic zones
Clear air effects
Rainfall characteristics
Rec. ITU-R P.0452Propagation loss result
Diffraction
Tropospheric scatter
Ducting/layer reflection
5.3 Recommendation ITU-R P.528
Recommendation ITU-R P.528 presents curve sets for median basic transmission loss in the 125 MHz-15.5 GHz range for antenna heights that include aeronautical and satellite heights. Recommendation ITU-R P.528 is valid for ground-air, air-air, ground-satellite, air-satellite, and satellite-satellite links. The curves in Recommendation ITU-R P.528 are produced by the IF77 model which is a semi-empirical model developed for aeronautical links. The Recommendation, also, includes a method to calculate separation distances between interfering stations (transmitted power and gains for the transmit and receive antennas for each system are required for this calculation.). The Recommendation cautions that the data supporting these curves are from a continental temperate climate and that care should be used for other climates.

Chapter 5 35
The required inputs for the Recommendation include the two antenna heights, the frequency, the distance, and the time percentage. Terrain data is not needed for this Recommendation.
The benefit and use of Recommendation ITU-R P.528 is for determining median basic transmission loss and separation distances for aeronautical and satellite links without requiring terrain data.
FIGURE 5.3
Overview of the various propagation mechanisms considered by Recommendation ITU-R P.528
PPM. 05.3
Refractivity Atmospheric absorption
Scintillation
Rain attenuation
Troposcatter
Diffraction
Rec. ITU-R P.0528Propagation loss result
IF 77 model
5.4 Recommendation ITU-R P.533
This Recommendation provides methods for the prediction of available frequencies, signal levels and the predicted reliability for both analogue and digital modulated systems at HF. The Recommendation takes into account not only the signal to noise ratio but also of the expected time and frequency spreads of the channel. This prediction procedure applies a ray-path analysis for path lengths up to 7 000 km, composite mode empirical formulations from the fit to measured data beyond 9 000 km and a smooth transition between these two approaches over the 7 000-9 000 km distance range.

36 ITU-R propagation prediction methods for interference and sharing studies
Monthly median basic MUF, incident sky-wave field strength and available receiver power from a lossless receiving antenna of given gain are determined. The method includes an estimation of the parameters of the channel transfer function for use for the prediction of performance of digital systems. Methods are given for the assessment of circuit reliability. Signal strengths are standardized against an ITU-R measurement data bank. The method requires the determination of a number of ionospheric characteristics and propagation parameters at specified “control points”.
In equatorial regions, in the evening hours (local time), it is possible to have distortions in the predicted results due to regional ionospheric structural instabilities which are not fully accounted for by this method.
Figure 5.4 presents an overview of the mechanisms that are considered in Recommendation ITU-R P.533.
FIGURE 5.4
Overview of the various mechanisms considered in Recommendation ITU-R P.533
PPM. 05.4
Rec. ITU-R P.0842Statistical variability
Rec. ITU-R P.0373Lowest usable frequency
Rec. ITU-R P.1239Ionospheric characteristics
Rec. ITU-R P.0371Choice of indices
Rec. ITU-R P.1240Maximum usable frequency
and ray-path predictions
Rec. ITU-R P.1057Probability distributions
Rec. ITU-R P.0533HF performance prediction
Chapter 5 37
5.5 Recommendation ITU-R P.619
Recommendation ITU-R P.619 describes the evaluation of interference between stations on the surface of the Earth and stations in space, between space stations in the same system, and between space stations not in the same system. The Recommendation considers four possible propagation paths and summarizes the various propagation conditions that can exist on such a path and points the reader to the appropriate ITU-R Recommendation to calculate the result of that condition. The four propagation paths considered in Recommendation ITU-R P.619 include the following propagation paths:
– transmission from a space station of one system causing interference to reception by an earth station of another system;
– transmission from an earth station of one space system causing interference to reception by a space station of another system;
– transmission from a space station causing interference to reception by a terrestrial station;
– transmission from a terrestrial station causing interference to reception by a space station.
The three principal propagation mechanisms considered in the Recommendation are clear-air propagation, precipitation scatter, and differential attenuation on adjacent Earth-space paths. This Recommendation does not provide a user with a clear step by step method to calculate the interference between stations or even a propagation loss between stations like other P-Series Recommendations discussed in this Handbook. The benefit and use of Recommendation ITU-R P.619 points the reader to the appropriate propagation effects and the associated ITU-R P-Series Recommendation to calculate the appropriate propagation mechanism in order to effectively evaluate interference between terrestrial and space stations by referencing other ITU-R Recommendations.
As stated previously, Recommendation ITU-R P.619 does not present a clear step by step solution to an interference problem but is instead a Recommendation that points the reader to the appropriate ITU-R Recommendations to calculate propagation conditions along a set path. Thus, providing a valid sharing scenario for the many applications of Recommendation ITU-R P.619 would be difficult in the context of this Handbook and will not be included.
Figure 5.5 presents an overview of propagation mechanisms that are considered in Recommendation ITU-R P.619.

38 ITU-R propagation prediction methods for interference and sharing studies
FIGURE 5.5
Overview of the various propagation mechanisms considered in Recommendation ITU-R P.619
PPM. 05.5
Radio-climaticinformation
Terrain profile
Clear air effects Diffraction
Rainfall characteristicsTropospheric scintillation
Rec. ITU-R P.0619Interference prediction
Diffraction
Tropospheric scatter
Ducting/layer reflection
5.6 Recommendation ITU-R P.620
Recommendation ITU-R P.620 describes a method for the assessment of the propagation mechanisms concerned in the determination of coordination distances. The determination of the coordination distance in the method is based on the computation of a required transmission loss through propagation mechanisms between an earth station and terrestrial stations. The coordination distance is thus the propagation loss equal to the required minimum permissible basic transmission loss, not exceeded for a given annual percentage time. The method of Recommendation ITU-R P.620 provides a step by step solution for calculating coordination distance based on a minimum propagation loss requirement.

Chapter 5 39
The Recommendation determines coordination distances by iteratively calculating propagation loss using propagation mechanisms until either the required transmission loss is achieved or a limiting distance is reached. The propagation mechanisms used in the method are classified into two modes, propagation in clean air and hydrometeor scatter. The propagation in clean air mode considers the propagation mechanisms of diffraction, refraction, ducting, tropospheric scattering, and layer reflection. The propagation mode of hydrometeor scattering is limited to earth stations operating with geostationary satellites. A basic knowledge of the terrain features in the direction being considered for a coordination is a requirement for the use of this method. The benefit and use of Recommendation ITU-R P.620 is to calculate coordination distances when locations and information pertaining to an earth station is available and the locations of terrestrial stations with which coordination is to be sought are not known.
Figure 5.6 presents an overview of the various propagation mechanisms that are considered in Recommendation ITU-R P.620.
FIGURE 5.6
Overview of the various propagation mechanisms considered in Recommendation ITU-R P.620
PPM. 05.6
Radio-climaticinformation
Terrain profile
Clear air effects Rainfall characteristics
Rec. ITU-R P.0620Propagation loss result
Diffraction
Tropospheric scatter
Ducting/layer reflection
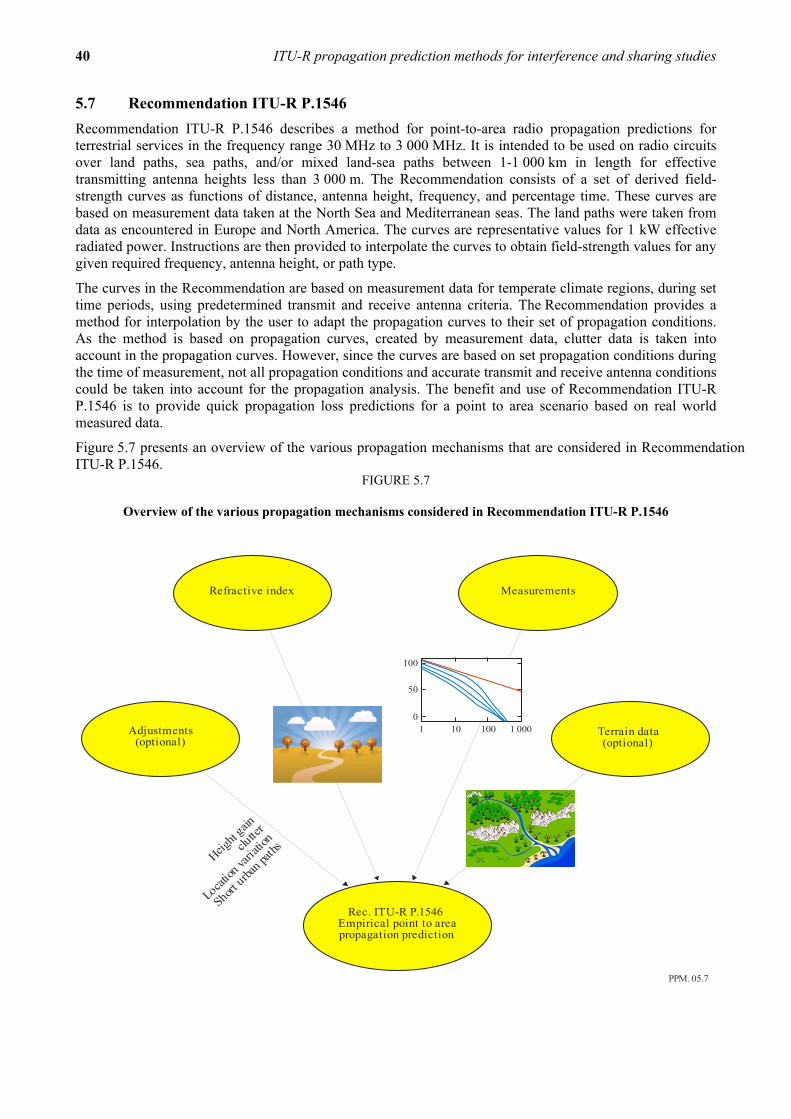
40 ITU-R propagation prediction methods for interference and sharing studies
5.7 Recommendation ITU-R P.1546
Recommendation ITU-R P.1546 describes a method for point-to-area radio propagation predictions for terrestrial services in the frequency range 30 MHz to 3 000 MHz. It is intended to be used on radio circuits over land paths, sea paths, and/or mixed land-sea paths between 1-1 000 km in length for effective transmitting antenna heights less than 3 000 m. The Recommendation consists of a set of derived field-strength curves as functions of distance, antenna height, frequency, and percentage time. These curves are based on measurement data taken at the North Sea and Mediterranean seas. The land paths were taken from data as encountered in Europe and North America. The curves are representative values for 1 kW effective radiated power. Instructions are then provided to interpolate the curves to obtain field-strength values for any given required frequency, antenna height, or path type.
The curves in the Recommendation are based on measurement data for temperate climate regions, during set time periods, using predetermined transmit and receive antenna criteria. The Recommendation provides a method for interpolation by the user to adapt the propagation curves to their set of propagation conditions. As the method is based on propagation curves, created by measurement data, clutter data is taken into account in the propagation curves. However, since the curves are based on set propagation conditions during the time of measurement, not all propagation conditions and accurate transmit and receive antenna conditions could be taken into account for the propagation analysis. The benefit and use of Recommendation ITU-R P.1546 is to provide quick propagation loss predictions for a point to area scenario based on real world measured data.
Figure 5.7 presents an overview of the various propagation mechanisms that are considered in Recommendation ITU-R P.1546.
FIGURE 5.7
Overview of the various propagation mechanisms considered in Recommendation ITU-R P.1546
PPM. 05.7
Refractive index Measurements
Terrain data(optional)
Adjustments(optional)
Rec. ITU-R P.1546Empirical point to areapropagation prediction
Height g
ain
clutte
r
Locatio
n varia
tion
Short urba
n paths
1 10 100 1 0000
50
100

Chapter 5 41
5.8 Recommendation ITU-R P.1812
Recommendation ITU-R P.1812 describes a propagation prediction method suitable for terrestrial point-to-point or point-to-area services in the frequency range 30 MHz to 3 GHz for the detailed evaluation of signal levels exceeded for a given percentage of time, p%, in the range 1% ≤ p ≤ 50% and a given percentage of locations, pL, in the range 1% ≤ pL≤ 99%. The method also relies on any analysis based on a terrain profile of a path. This method may be used to predict both the service area and availability for a desired signal level (coverage), and the reductions in this service area and availability due to undesired, co- and/or adjacent-channel signals (interference).
The method is first described in terms of calculating basic transmission loss (dB) not exceeded for p% time for the median value of locations. The location variability and building entry loss elements are then characterized statistically with respect to receiver locations. A procedure is then given for converting to electric field strength (dB(μV/m)) for an effective radiated power of 1 kW.
This method is intended primarily for use with systems using low-gain antennas. However, the change in accuracy when high-gain antennas are used only affects the troposcatter element of the overall method, and the change in the predictions is small. For example, even with 40 dBi antennas at both ends of the link the over-estimation of troposcatter signals will amount to only about 1 dB.
The propagation prediction method in this Recommendation is path-specific. Point-to-area predictions using this method consist of series of many P-P (i.e. transmitter-point-to-receiver-multipoint) predictions, uniformly distributed over notional service areas. The number of points should be large enough to ensure that the predicted values of basic transmission losses or field strengths thus obtained are reasonable estimates of the median values, with respect to locations, of the corresponding quantities for the elemental areas that they represent.

42 ITU-R propagation prediction methods for interference and sharing studies
Figure 5.8 presents an overview of the various propagation mechanisms that are considered in Recommendation ITU-R P.1812.
FIGURE 5.8
Overview of the various propagation mechanisms considered in Recommendation ITU-R P.1812
PPM. 05.8
Terrain profile
Radio-climaticinformation
Clear air effects Additional clutter losses
Climatic zones
Rec. ITU-R P.1812Propagation loss result
Diffraction
Tropospheric scatter
Ducting/layer reflection

Chapter 6 43
CHAPTER 6
REPRESENTATIVE SHARING SCENARIOS FOR ITU-R P-SERIES PROPAGATION METHODS AND MODELS
The Chapter presents a background and context for model/method utilization by providing sample sharing scenarios that can be analysed using the propagation methods and models discussed in this Handbook. Some of the sharing scenarios in this section represent a historical study of past liaison statement interactions between Study Group 3 and other Study Groups. If a liaison statement interaction was found that was relevant to a particular propagation model, the thread of back and forth liaisons were identified and the interested sharing scenario was identified. This Chapter presents the sharing studies and representative use of the models discussed in this Handbook.
Annex B contains a documented table of back and forth liaison statements between Study Group 3 and other Study Groups of the ITU-R. These liaison statements identify the historical context for the need of this Handbook to help interested Study Groups in using ITU-R P-Series models for interference and sharing studies.
6.1 Recommendation ITU-R P.452 sample sharing scenarios
Sharing/RFI scenario of SRS station from fixed VSAT earth station
Background
There has been recent progress of establishing a new SRS earth station to communicate with the TDRSS satellite network. The new earth station will be located in a location within 50 km of a major metropolitan area. There is great concern about interference into the SRS earth station from recent proposals of VSAT earth stations that may be in close proximity to the new SRS earth station.
The FCC’s Rules, Part 47, § 25.222(d) requires coordination on operations within 125 km of TDRSS earth stations. There was concern among the different VSAT earth station operators that a separation distance of 125 km will significantly impair operations especially in the vicinity of the SRS earth station, which is about 50 km from a major metropolitan area, a potential big market for ESV and VMES operators. The coordination problem involved determining the minimum acceptable separation distance from the SRS earth station to a VSAT earth station.
Reasons for the use of Recommendation ITU-R P.452
Recommendation ITU-R P.452 was chosen because it is a well suited model for studying Earth-to-Earth propagation links between a VSAT earth station and a SRS earth station. Recommendation ITU-R P.452 was also well suited to model the various propagation considerations such as terrain and percentage of time criteria required for the SRS earth station scenario.
Coordination scenario assumptions
Frequency range
13.4-14.05 GHz TDRSS with 14.0-14.5 GHz FSS uplinks.

44 ITU-R propagation prediction methods for interference and sharing studies
SRS Rx parameters
Parameter Value
Location 38.409, −77.107
Rx antenna height 11.35 m
Rx antenna diameter 16.5 m
Rx antenna peak gain 65 dB
Rx antenna pattern ITU RR APS8
Operational TDRSS satellite TDRS 12 W
Frequency 14.0 GHz
“In-band” RFI criteria (Rec. ITU-R SA.1155) −146 dB(W/MHz)
Percentage of time criteria (Rec. ITU-R SA.1155) 0.1%
Fixed VSAT earth station interferer assumptions
Parameter Value
Location 38.863, −77.067
Tx antenna height 2.5 m
Rx antenna gain 0 dB
Single terminal Tx e.i.r.p. 12.5 dB(W/MHz)
Frequency 14.0 GHz
Modelling assumptions
− The area around the SRS earth station contains variations in terrain height so terrain should be considered as an interference modelling factor.
− Diffraction and path loss modelling effects should be considered.
− 0.1% time interference.
6.2 Recommendation ITU-R P.528 sample sharing scenario
Background
This scenario is based on a transmission loss calculation along a representative path of an aeronautical mobile transmission. The transmission loss calculation can be used in various sharing calculations involving a transmission from an aeronautical mobile station into a station on the ground.
Reasons for selection of Recommendation ITU-R P.528
Recommendation ITU-R P.528 was chosen for this sample sharing scenario because the scenario deals with an aeronautical mobile transmission.

Chapter 6 45
Aeronautical mobile station parameters
Parameter Value
Frequency 5 100 MHz
Height of aeronautical mobile station antenna 10 000 m
Height of ground station antenna 15 m
Time percentage 50%
Path distance 800 km
6.3 Recommendation ITU-R P.533 sample sharing scenario
Representative point-to-point path prediction scenario
Background
This scenario is based on a point-to-point representative path prediction between a desired link and an interfering link. The victim receiver and transmitter make up the desired link, while the interfering link is between a victim receiver and an interfering transmitter. We wish to find what effect the presence of the interferer will have on the victim receiver SNR performance.
Reasons for selection of Recommendation ITU-R P.533
Recommendation ITU-R P.533 was chosen for this scenario because of the frequency ranges of the scenario.
Coordination scenario assumptions
Victim receiver parameters
Location 49.88 N 119.48 W
Bandwidth 7 kHz
Centre frequency 10.125 MHz
Antenna Type 34 ITS-78 Horizontal Yagi
Antenna bearing 120° CW from North
SSN 51
SNR 50% reliability 15 dB
Transmitter parameters
Location 45.52 N 73.57 W
Bandwidth 7 kHz
Centre frequency 10.125 MHz
Antenna Type 34 ITS-78 Horizontal Yagi
Antenna bearing 295.0° CW from North
Transmitter power 1 kW

46 ITU-R propagation prediction methods for interference and sharing studies
Interferer parameters
Location 42.97 N 85.67 W
Bandwidth 7 kHz
Centre frequency 10.125 MHz
Antenna Type 01 multiband aperiodic reflector array
Antenna bearing 178.5° CW from North
Transmitter power 1 kW
6.4 Recommendation ITU-R P.620 sample sharing scenario
Background
This scenario is based on computing a coordination area for a fixed earth station in the frequency band 450 MHz from a mobile interferer.
Reasons for use of Recommendation ITU-R P.620
Recommendation ITU-R P.620 was chosen for this scenario because it contains the process for coordination distance calculation.
Coordination scenario assumptions
Earth station assumptions
Parameter Value
Location 39.26, −80.11
Frequency 450 MHz
Interference threshold (I/N) −10 dB
Earth station noise power −162.58 dB
Earth station receive gain 14.3
Time percentage 50%
Mobile interferer assumptions
Parameter Value
e.i.r.p. 16.98 dBW
Frequency 2 200 MHz

Chapter 6 47
6.5 Recommendation ITU-R P.1546 sample sharing scenario
Background
The radio astronomy community is concerned about interference from adjacent bands. Radio astronomy observatory coordination distances are zealously protected in order that their sensitive receivers are not polluted by terrestrial earth stations operating in adjacent bands.
The 608-614 MHz band is assigned to the radio astronomy community. The adjacent band 470-608 MHz is allocated for broadcast services. In the United States and some other administrations, this band is assigned to digital broadcast television. Broadcast television transmitters have high e.i.r.p.. Coordination distances between these two bands, and the interference potential, are the subject of this scenario.
ITU-R Working Party 7D provided WP 3M a coordination/interference scenario at 608 Hz involving a radio astronomy victim receiver at the US National Radio Astronomy Observatory (NRAO), located in a radio-free quiet zone, and a digital television broadcast station having 1 MW effective radiated power (ERP).
Working Party 7D noted that radio astronomy receivers have “exceptionally high sensitivity,” according to ITU RR Article No. 29, and urges that as regards adjacent band services, “administrations are urged… to take all practical steps to protect the radio astronomy service from harmful interference in accordance with No. 4.51”
Interference scenario assumptions
– Frequency: 605 MHz
– Transmitter: 1 MW ERP, 6 MHz BW, 165 m antenna height
– Transmitter location: 38° 57′ 22″ N 77° 4′ 59″ W 105 m AMSL
– Receiver: 139.6 m antenna height
– Receiver location: 38° 25′ 59.2″ N 79° 50′ 23.4″ W 806 m AMSL
– Received in 0 dBi side lobe of radio telescope
– Required percentage: 2% of the time
6.6 Recommendation ITU-R P.1812 sample sharing scenario
Sharing/RFI scenario of fixed earth station from mobile AWS station
Background
There was great concern about interference from advanced wireless services (AWS) operations into a federal fixed earth station in the 1 710-1 755 MHz band.
The Federal Communication Commission (FCC) AWS auction rules permit its AWS licensees to begin to implement service during the transition period allocated for Federal Government operations provided they do not cause harmful interference into the federal earth stations. In mitigation for interference, coordination zones and operational contours were needed to be created around affected federal earth stations.
Reasons for selection of Recommendation ITU-R P.1812
Recommendation ITU-R P.1812 was chosen for this scenario because both the transmitter and receiver terminal locations are known, terrain data between these two terminals can be found, and the terminal height requirement fits the parameters of Recommendation ITU-R P.1812.
____________________ 1 ITU Article No. 4.5: “The frequency assigned to a station of a given service shall be separated from the
limits of the band allocated to this service in such a way that, taking account of the frequency band assigned to the station, no harmful interference is caused to services to which frequency bands immediately adjoining are allocated.” This adjacent-band article is frequently invoked by radio astronomy contributions.

48 ITU-R propagation prediction methods for interference and sharing studies
Coordination scenario assumptions
Frequency range
1 710-1 755 MHz
Earth station Rx parameters
Parameter Value
Location 29.56N, 95.09W
Frequency 1741.0 MHz
Bandwidth 12 MHz
HAAT 6 m
Rx antenna gain 34 dBi
Rx antenna diameter ---
System noise temperature 300 K Antenna +5 dB Rx noise figure
RFI criteria (at antenna flange) –109.0 dBm (~10 dB below noise)
Mobile AWS earth station interferer assumptions
Parameter Value
Active mobile terminal density 16/Sector (Operator data)
Frequency 1710 – 1755 MHz
Bandwidth 1.25 MHz
HAAT 1.5 m (Operator data)
Tx EIRP (in band) –6.3 dBW (Operator data)
Tx EIRP (out-of-band) –43.0 dBW/MHz (FCC rules)
Modelling assumptions
− The area around the earth station contains variations in terrain height so terrain should be considered as an interference modelling factor.
− Diffraction and path loss modelling effects should be considered.
− 10% reliability, 50% confidence.

Appendix A 49
Appendix A
Sample calculations
Annex A1 to Appendix A
Recommendation ITU-R P.452 sample calculations
Please refer to § 6.1 for the description and assumptions used in this sample calculation.
Worked sharing example
The initial calculations to produce a coordination distance are conducted using the ITU-R P.452-14 spreadsheet as available on the ITU-R Study Group 3 Website at the time of the writing of this Handbook (http://www.itu.int/ITU-R/index.asp?category=documents&rlink=rsg3&lang=en). The steps involved in developing the initial calculations for coordination are shown below and screenshots are provided whenever possible and necessary. All inputs to the ITU-R P.452-14 calculations are based on the station parameters as provided above.
Other software implementations of Recommendation ITU-R P.452 might require additional input parameters. Please refer to the text of Recommendation ITU-R P.452 for details of other default parameters not discussed in this section.
Step 1: Input user parameters

50 ITU-R propagation prediction methods for interference and sharing studies
Step 2: Select average year or worst-month
The choice of average year or “worst-month” predictions is generally dictated by the quality (i.e. performance and availability) objectives of the interfered with radio system at the receiving end of the interference path. In the majority of cases, the quality objectives will be couched in terms of a percentage “of any month”, and hence worst month data will be needed.
For our example of interference into an SRS earth station, we will select a worst-month prediction. This selection is made because we are interested in the worst possible case of interference in any particular time. This worst case of interference can then be used to decide on coordination conditions in a worst case interference scenario.
Step 3: Enter radiometeorological data
The prediction procedure of Recommendation ITU-R P.452-14 employs two radio-meteorological parameters to describe the variability of background and anomalous propagation conditions at the different locations around the world. These two parameters are:
– ΔN (N-units/km) − provides the data upon which the appropriate effective Earth radius can be calculated for path profile and diffraction obstacle analysis. See Figs. 11 and 12 of Rec. ITU-R P.452-14 or ‘Figure 12’ tab of the ITU-R P.452-14 Excel Implementation that is used for these calculations.
– No − sea level surface refractivity is used only by the troposcatter model as a measure of location variability of the troposcatter scatter mechanism. See Figure 13 of Rec. ITU-R P.452-14 or ‘Fig 13’ tab of the ITU-R P.452-14 Excel Implementation that is used for these calculations.
For the example scenario calculated here, the values of ΔN and No were found to be 60 and 330, respectively.
Step 3.5: Distance from transmitting and receiving stations to coastline
This calculation is only needed when the path has one or more sections over water. They are used to calculate a correction factor for coupling in the anomalous propagation loss calculations between over land and over sea paths. The exact values of this calculation are only of importance if the distances are ≤ 5 km. If, in either or both cases, the distances are obviously in excess of 5 km, then it is only necessary to enter a large value (e.g. 500 km) in the Excel Implementation of Recommendation ITU-R 452-14. Few interference paths will in fact need detailed evaluation of this calculation. The parameters calculated for this step are:
– dct − The distance over land from the TX antenna to the coast along the interference path.
– dcr − The distance over land from the RX antenna to the coast along the interference path.
Since both the distance from the transmitting and receiving path in our sample scenario are in excess of 500 km, the input value to the Excel Implementation of Recommendation ITU-R P.452-14 will be 500.
Step 4: Path profile analysis
Values for a number of path-related parameters necessary for the calculations must be derived via an initial analysis of the path profile. The information derived based on the path profile include clear-air losses, attenuation by atmospheric gasses, diffraction losses, tropospheric scatter, ducting/layer reflection, and additional clutter losses.
The Excel implementation that is being used for these sample calculations provides a computerized computation of the above parameters based on the equations given in Recommendation ITU-R P. 452-14. The inputs required for the Excel implementation include specific points for the distance between the interfering transmitter and receiver, height of the terrain at that distance, and the type of radio-climate zones for that distance point. The radio climate zones are:
– A1 − Coastal land and shore areas i.e. land adjacent to the sea up to an altitude of 100 m relative to mean sea or water level, but limited to a distance of 50 km from the nearest sea area.
– A2 − All land other than coastal and shore areas, as defined above. – A3 − Seas, oceans, and other large bodies of water.

Appendix A 51
Terrain profile information is available from (many sources but no one source exists that is the preferred method of Study Group 3). For purposes of this example scenario, the terrain type will be A2. (The screenshot below provides a snapshot of the input terrain profile for the example scenario into the Excel spreadsheet implementation.)
Step 5: Calculate the path loss based on the input parameters
Coordination analysis
The result of the ITU-R P.452-14 propagation model stated that the overall propagation path loss from the interfering transmitter to the victim receiver was 183.2 dB for 0.1% of the time. This path loss includes all applicable propagation effects along the point to point link between the interferer and victim. We know that the distance between the interferer and victim is 50.5 km. Using simple link budget analysis, we can
52 ITU-R propagation prediction methods for interference and sharing studies
determine if this distance is sufficient for coordination to meet the coordination requirement of −146 dBW/MHz. To simplify the calculations, we will assume that the bandwidth is 1 MHz. Thus, the coordination requirement is −146 dBW for 0.1% of the time. The table below provides the link budget analysis.
e.i.r.p. 12.5 dBW
Gr 65 dBi
Lp (from Rec. ITU-R P.452-14) 183.2
Pr −106 dBW
Thus, the received interference power into the victim SRS earth station exceeds the criteria of Recommendation ITU-R SA.1155 at a distance of 50.5 km. The procedure above can be repeated for a further distance until one is found that does not exceed the criteria of −146 dBW received interference power into the SRS earth station. After such a distance is found, this distance can be used as a basis for a coordination distance. Similarly, multiple instances of the ITU-R P.452-14 method can be run at various angular positions from the victim SRS station to determine a coordination contour for a new VSAT earth station.

Appendix A 53
Annex A2 to Appendix A
Recommendation ITU-R P.528 sample calculations
Please refer to § 6.2 for the description and assumptions used in this sample calculation.
To determine the propagation loss of a 5 100 MHz aeronautical mobile transmitter, Fig. A2-1 (b) of Recommendation ITU-R P.528-3 can be used. As can be seen for the code for antenna heights at the top of the figure, the target path loss curve for the need of this sample analysis is curve for h1 = 15 m. Following Fig. A2-1(b) from a path distance of 800 km, it can be seen that the path loss on curve for h1 = 15 m is 250 dB. This path loss value can then be used to analyse any number of interference or coordination analysis as is deemed necessary.
FIGURE A2-1
Curve sets for basic transmission loss at 5 100 MHz for 50% of the time for values of h1
PPM. A02-01
Distance (km)
0 200 400 600 800 1 000 1 200 1 400 1 600 1 800300
280
260
240
220
200
180
160
140
120
100
Bas
ic tr
ansm
issi
on lo
ss (d
B) Free space
h1 = 1.5 m
h1 = 15 m
h1 = 30 m
h1 = 60 m
h1 = 1 000 m
h1 = 10 000 m


Appendix A 55
Annex A3 to Appendix A
Recommendation ITU-R P.533 sample calculations
The following scenario consists of a desired link and an interfering link. The victim receiver and transmitter make up the desired link, while the interfering link is between a victim receiver and an interfering transmitter. The program used to carry out these analyses is REC533, which is an implementation of Recommendation ITU-R P.533. Appropriate parameters must be entered into the program which represent the assumptions about each link.
The desired link has a 1 kW transmitter and is configured with a high gain directional antenna pointed at the victim receiver. The antenna is a Type 34 ITS-78 Horizontal Yagi with directive gain of 13.4 dBi. The interfering link’s 1 kW transmitter is using a Type 01 multiband aperiodic reflector array with 22.1 dBi directive gain. The interfering link also points at the victim receiver. This is done to illustrate the worst-case scenario.
The communication links both operate at 10.125 MHz with 7 kHz bandwidths. For this example the noise environment at the victim receiver is assumed to be rural. The rural noise environment is defined in accordance with Recommendation ITU-R P.372. The communications links take place at 12 UTC and at no other time. The time restriction was necessary to simplify the example. In a typical HF circuit analysis, many temporal inputs can significantly change the prediction. In particular time and month have a bearing on the calculation since they govern the state of the ionospheric parameters within the model. The analysis was conducted only for odd number months. The sunspot number was chosen to be 51. All other values necessary to execute REC533 remained at default values. All output variables from the model are based on monthly median values of the propagation channel. For an in-depth explanation of the operation of REC533 consult the documentation
The victim receiver, in this scenario, is located in Kelowna, British Columbia, Canada where it receives a signal from a transmitter in Montreal, Quebec, Canada. The interference comes from a transmitter in Grand Rapids, Michigan, USA. To achieve a signal reliability of 50%, a signal-to-noise ratio of at least 15 dB at the victim is required. The interfering transmitter acts on the victim receiver as a co-channel interferer.
To carry out this analysis REC533 was used to determine the signal power which appears at the victim receiver from each transmitter. The desired link victim receiver median power is shown in Table A3-1.
TABLE A3-1
Victim receiver median power, SNR and noise for the desired link
Month Received Power (dBW) SNR 50% (dB) Approximate Noise (dB)
January 11 16 5
March 17 22 5
May 21 26 5
July 16 19 3
September 24 29 5
November 13 18 5
A similar analysis is carried out between the victim receiver and the interfering transmitter and appears in Table A3-2.

56 ITU-R propagation prediction methods for interference and sharing studies
TABLE A3-2
Victim receiver median power and maximum usable frequency for interferer link
Month Received Power (dBW) Maximum Useable Frequency (MHz)
January –16 6.8
March –7 8.6
May 5 12.0
July 2 12.0
September –3 12.0
November –13 7.2
The output from REC533 for the interfering link shows that the interferer will not be as troublesome throughout the year. The maximum usable frequencies (MUF) given in Table 2 indicate that the 10.125 MHz signal has a low probability of propagating in the late fall to early spring. The highest probability for interference will occur in the late spring through early fall. One of the unique characteristics of HF propagation is that the ionosphere cannot support all the frequencies of the band at all times. The HF propagation channel has a MUF above which signals are not reflected and returned to the earth. Thus signals at frequencies above the MUF pass through the ionosphere.
From Table 1 A 3-2, assuming a worst-case scenario for this calculation, an interferer median power of 5 dBW should be examined.
Under the criteria that the victim receiver needs 15 dB of SNR to receive the signal for 50% reliability, we can see how the interferer affects the desired link. If the noise on the desired link is assumed to be 5 dB and we also assume that the interferer received power is 5 dB then the unwanted signal will increase by a factor of two. The total noise and interference power for this worse case will then be 3 dB above the noise power or 8 dB. An increase in total noise and interference power will decrease the May, July and September SNR values on the desired link to 23, 16 and 26 respectively. In the presence of the interferer the desired link will thus be near its designed 15 dB SNR for the month of July. When propagation variability is encountered then the desired performance may not be achieved. Since the outputs from this model are based on monthly medians variation is assured.
This example has shown a vulnerability of the desired system to interference that will affect link performance. The calculation has illustrated the utility of using software based on ITU models to evaluate complex communications which must share common spectral resources.

Appendix A 57
Annex A4 to Appendix A
Recommendation ITU-R P.620 sample calculations
Please refer to § 6.4 for the description and assumptions used in this sample calculation.
User input parameters
The user input parameters required by Recommendation ITU-R P.620-6 involve the frequency, basic transmission loss requirement, latitude and longitude of the earth station for which the coordination contour is being developed, minimum coordination distance, and maximum coordination distance. The frequency for the analysis and location of the earth station are given in the tables in § 6.2. The required transmission loss can be calculated using a simple link budget analysis given the known values about the earth station protection criteria and the interferer parameters.
e.i.r.p. of interferer 16.98 dBW
Gr 14.3 dBi
Path loss (PL) Unknown
Noise power (Pn) −162.58
The received power from the interferer into the earth station that we are trying to protect is thus:
Pr = 16.98 + 14.3 − PL
The received I/N value into the earth station is:
I/N = Pr − Pn
I/N = 16.98 + 14.3 − PL − (−162.58)
Since we know the required I/N threshold is −10:
−10 = 16.98 + 14.3 - PL − (−162.58)
Solving for the path loss requirement (PL)
PL = 203.86
Following the steps in § 2 of Appendix 2 to Annex 1 of Recommendation ITU-R P.620-6, the coordination distance will be calculated based on an iterative process. The process is continued in calculating a path loss until a distance is found in which the path loss calculated is greater than the path loss threshold that was computed above as 203.86.
The minimum coordination distance and maximum coordination distances are evaluated using equations (15)-(18) of Recommendation ITU-R P.620-6. The distance increment used for the iterative calculations is 1 km. The iterative path loss is then calculated using equation (16) of Recommendation ITU-R P.620-6 starting at the calculated minimum coordination distance and incrementing by 1 km.

58 ITU-R propagation prediction methods for interference and sharing studies
The result of the iterative coordination distance calculations for this sample scenario produces a coordination distance of 511 km. This value can be plotted on a mapping program to produce coordination contours for a particular interference scenario. Such a sample coordination contour is shown in Fig. A4-1 below.
FIGUREF A4-1
Sample coordination contour generated using Recommendation ITU-R P.620-6
PPM. A04-01
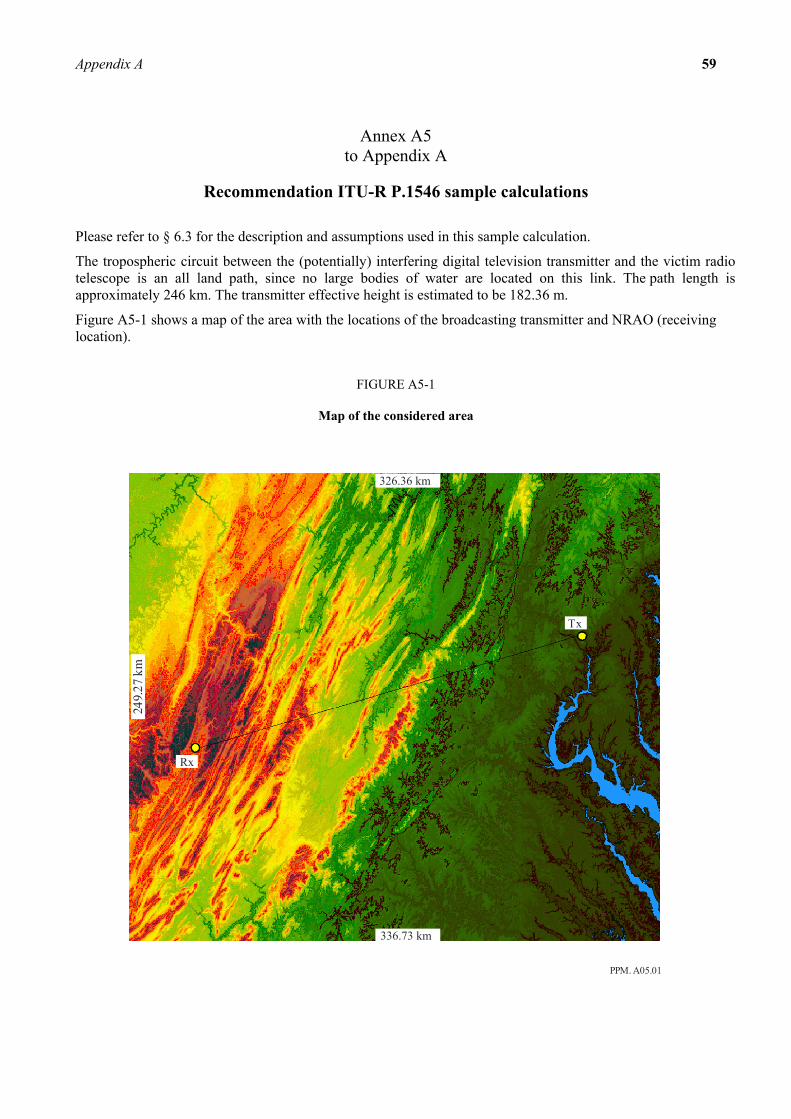
Appendix A 59
Annex A5 to Appendix A
Recommendation ITU-R P.1546 sample calculations
Please refer to § 6.3 for the description and assumptions used in this sample calculation.
The tropospheric circuit between the (potentially) interfering digital television transmitter and the victim radio telescope is an all land path, since no large bodies of water are located on this link. The path length is approximately 246 km. The transmitter effective height is estimated to be 182.36 m.
Figure A5-1 shows a map of the area with the locations of the broadcasting transmitter and NRAO (receiving location).
FIGURE A5-1
Map of the considered area
PPM. A05.01
249.
27 k
m
Rx
Tx
336.73 km
326.36 km

60 ITU-R propagation prediction methods for interference and sharing studies
Figure A5-2 shows a terrain profile between the transmitter and NRAO based on the digital terrain data (SRTM-3 data).
FIGURE A5-2
The terrain profile between the transmitter and the receiver (NRAO)
PPM. A05-02
Distance (km)
0
Terrain profile TX -> Rx
0
200
400
600
800
1 000
1 200
1 400
1 600
50 100 150 200 250
Hei
ght A
MSL
(m
)
Interpolating on the 600 MHz and 2 000 MHz field strength tabulations (1% and 10% time) yields a predicted interfering signal of −4.07 dB(μV/m) relative to 1 kW ERP. The receiver height correction and the terrain clearance angle correction are 23.41 dB and −12.68 dB, respectively. Finally, an adjustment of 30 dB is included to account for the transmitter power (1MW), which yields an interfering signal strength of 36.66 dB (μV/m).
Figure A5-3 shows field strength predictions across the propagation path to the receiving antenna at 139.6 m height above ground and 2% of time. Similar predictions for the entire area are presented in Fig. A5-4, however these calculations are for the receiving antenna height at 10 m.

Appendix A 61
FIGURE A5-3
Field strength predictions along the great circle path from the transmitter to the receiver for the 2% of time, receiver height of 139.6 m
PPM. A05-03
Distance (km)
0
Predicted field strength TX -> Rx
–50
0
50
100
150
200
50 100 150 200 250
Fiel
d st
reng
th (d
B µ
V/m
)
FIGURE A5-4
Field strength predictions in the area shown in Fig. A5-1 for 2% of the time and a receiver height of 10 m
PPM. A05-04
336.73 km
249.
27 k
m
Rx
Tx
326.36 km
0.00 20.00 40.00 60.00 80.00 100.00 dBuV/m


Appendix A 63
ANNEX A6 to Appendix A
Recommendation ITU-R P.1812 sample calculations
Please refer to § 6.6 for the description and assumptions used in this sample calculation.
To investigate the −109 dBm interference target, basic transmission loss calculations were performed using the method of Rec. ITU-R P.1812-1 for a terrain profile along the great circle path from the SRS location to 30° N, 94° W (in the vicinity of Beaumont-Port Arthur, Texas) at a frequency of 1 741 MHz. Both 10% time (the percentage of time that the interfering signal could be present) and 50% time values were calculated at 100 m intervals along the approximately 115 km path. These are plotted in Figs A4-1 and A4-2. If one considers the in-band interference, then the basic transmission loss must be greater than 109+34+23.7 = 166.7 dB, which occurs at a distance of 90 km for 10% time using this profile. The required separation distance is much shorter for 50% time, but this amount of interference would likely be intolerable. If the interferer is out-of-band, the basic transmission loss required is only 124.7 dB, or a separation distance of about 5.2 km.
FIGURE A6-1
Transmission loss prediction for 10% of the time
PPM. A06-01
Distance (km)
0
Notional interfering signal basic transmission loss, 10% time
10 20 30 40 50 60 70 80 90 100 110 120
0
20
40
60
80
100
120
140
160
180
200
Bas
ic tr
ansm
issi
on lo
ss (d
B)
Series1
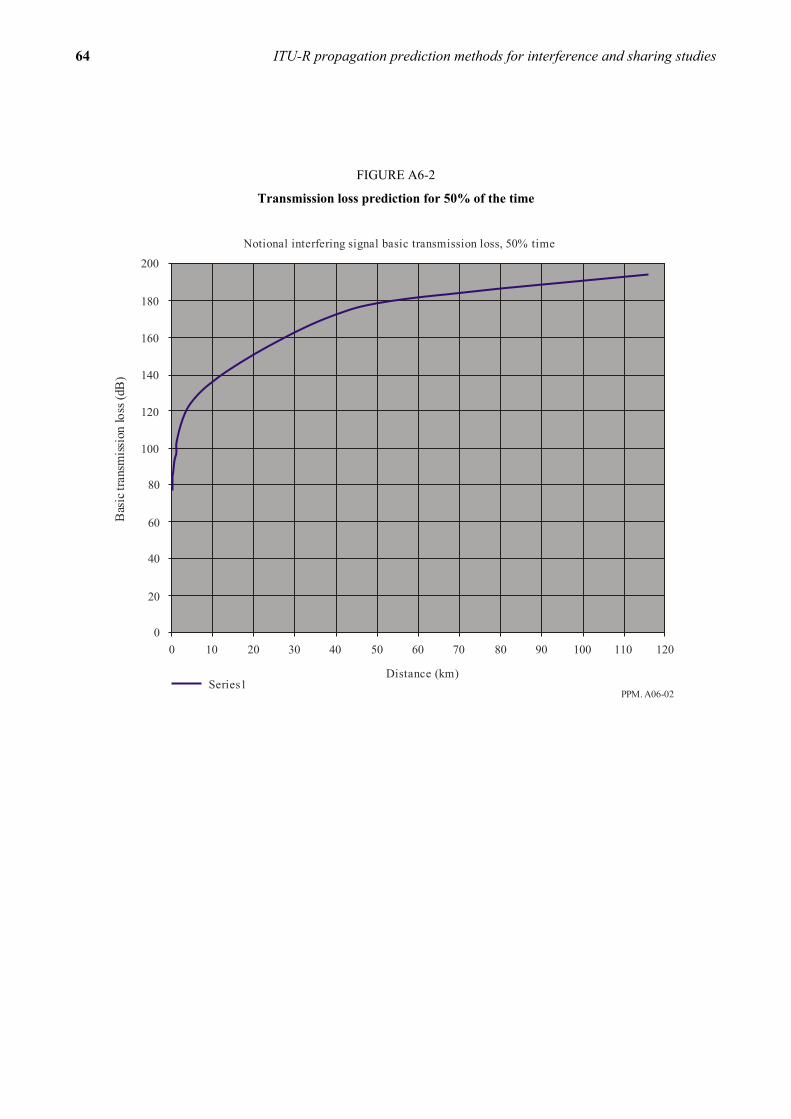
64 ITU-R propagation prediction methods for interference and sharing studies
FIGURE A6-2
Transmission loss prediction for 50% of the time
PPM. A06-02
Distance (km)
0
Notional interfering signal basic transmission loss, 50% time
10 20 30 40 50 60 70 80 90 100 110 120
0
20
40
60
80
100
120
140
160
180
200
Bas
ic tr
ansm
issi
on lo
ss (d
B)
Series1

APPENDIX B
References
TABLE B-1
Review of relevant liaison statements to Study Group 3
Liaison statement
(LS)
Study period
Originating organization
Relevant document Statement of problem Frequency range
3M/42 2000-2003 WP 8A Recs ITU-R P.452 and ITU-R P.1411
Working Party 8A wants to perform tests on methods for point-to-area predictions to terrestrial services. WP 8A is uncertain if sufficient tests have been conducted to verify the adequacy of propagation models. It is desirable to clarify the comparisons between a new propagation model (unlisted) and Recommendations ITU-R P.452 and ITU-R P.1411.
30-3 000 MHz
3M/43 2000-2003 WP 9A Rec. ITU-R P.530 Discussions of several Recommendations and working by WPs 3M and 9A on use of Appendix 30 on Recommendation ITU-R P.620.
N/A
3M/86 2000-2003 WP 6S Appendix 7 vs. Appendix 30 for Mode (2) propagation
The applicability of the Appendix 7 propagation model for the coordination of terrestrial stations or transmit FSS earth stations with BSS earth stations.
3M/87 3J/59 3K/63
2000-2003 WP 8F Question ITU-R 229/8 Liaison statement to Working Parties 3J, 3K, and 3M on propagation issues for systems beyond IMT-2000. Seeking to kick off an ITU imitative for propagation models for next-generation cellular system having the following features: Different frequencies than current cellular systems (assumed at the time to be in the lower part of the SHF band - below 6 GHz), service rates to include 100 MB/s for user handsets and 1 Gbit/s for system transmitter, multicell, LOS and NLOS, indoor, and high density urban environments.
< 6 GHz
3M/88 2000-2003 WP 3K Recs ITU-R P.1238, ITU-R P.1411
Working Party 8F requested propagation characteristics and prediction methods for systems beyond IMT-2000. WP 3K responded with some propagation prediction Recommendations that can be used for it.
Appendix B
65

TABLE B-1 (Continued)
Liaison statement
(LS)
Study period
Originating organization
Relevant document Statement of problem Frequency range
3M/90 2000-2003 WP 3M Rec. ITU-R P.620 Answer by WP 3M to WP 6S on use of Recommendation ITU-R P.620 would present problems when used with Annex 3 of Appendix 30 versus Appendix 7 to which it was defined.
N/A
3M/97 2000-2003 WP 6S Rec. ITU-R P.620-4 Reply from previous liaison statement concerning use of Appendix 3 to interference scenario.
N/A
3M/2 2000-2003 Director, BR Recs ITU-R SM.1448 andITU-R P.620
Comparison of results obtained with Recs. ITU-R SM.1448 and ITU-R P.620.
14 and 6 GHz
3M/51 2003-2007 WP 4A Rec. ITU-R P.452 Use of Rec. ITU-R P.452. Two difficulties found with Rec. ITU-R P.452: (1) At distance close to the diffraction distance, the propagation loss formula was discontinuous. (2) when running simulations which were based on Recommendation ITU-R P.452, the amount of diffraction loss seemed to vary with latitude. In particular, equatorial diffraction losses (0° lat) differed from mid-northern latitudes (40°) or higher (>50°). Was this a real difference? What was the reason for this variation?
13.75-14 GHz
3M/103 2003-2007 WP 4A Use of Rec. ITU-R P.452 Working Party 4A asked some questions about 452. WP 3M has requested comment about utility and applicability.
N/A
3M/227 3K/183
2003-2007 WP 8F Rec. ITU-R P.1546 Propagation models for application to sharing study between IMT-2000 and DVB-T. WP 8F asks WPs 3M and 3K to comment on two prediction models, being Recommendation ITU-R P.1546 and the “extended Hata” models, and advise on three points: (1) Predicted path loss differences for the same application conditions (freq., antenna height, distance, environment). Which model is more appropriate for use in sharing between IMT-2000 and DVB-T in the UHF band (470-862 MHz) for different antenna heights, distances, and use in urban and rural areas? (2) Antenna heights: IMT-2000 receiver antenna heights are typically 1.5m above ground level, whereas broadcast receive antennas are 10m or higher. What are the appropriate height correction factors in urban and rural areas? (3) In the case of different antenna polarization between IMT-2000 and DVB-T, what are the recommended antenna depolarization factors for four listed cases?
3M/1 9D/10
2003-2007 Working Party 7E
Sharing between high-density links in the fixed service and other services. Three issues: (1) Shielding by buildings near HDFS terminals is different than for cellular systems. (2) Discussion of spatial distribution of HDFS terminals (to model aggregate interference?) (3) HDFS signal dynamics are faster than propagation fade times, and this presumably impacts protection and interference analyses.
30-50 GHz
66
IT
U-R
propagation prediction methods for interference and sharing

Liaison statement
(LS)
Study period
Originating organization
Relevant document Statement of problem Frequency range
3M/5 4A/77
2003-2007 Joint Rapporteur Group 8A-
9B
Doc. 8A-9B/TEMP/4 Building attenuation. Related to protection of non-GSO MSS feeder links from RLAN interference.
5 GHz
3M/26 2003-2007 Japan Rec. ITU-R P.1238, ITU-R P.1410
A method to quantitatively evaluate building entry loss by combing several study group 3 models.
5 GHz
3M/41 2003-2007 3M Rec. ITU-R P.1546 Announcing to WPs 8B and 8F that a new recommendation for sharing in point-to-area predictions has been approved.
2 700-2900
3M/46 2003-2007 WP 9D New methodology Working Party 9D has created a new methodology for coordination and area-to-point interference between radio astronomy and earth stations.
above 30 GHz
3M/79 2003-2007 WP 9A Recs ITU-T M.2110, ITU-R F.1330-1
Clear air propagation information relevant for bringing into service (BIS) radio links. Telenor conducted experiments for 1 year in coastal Norway and measured probability of severe degradation (deep fades) of a point to point wideband terrestrial digital microwave link with space diversity. Analysis results were presented in this Liaison statement. BIS commissioning traditionally relies on Rec. ITU-T M.2110 0, but Telenor recommends that Rec. ITU-R F.1330-1 0 be used instead for rare-event deep fades due to anomalous atmospheric propagation conditions.
6 GHz
3M/95 2003-2007 WP 9A Rec. ITU-R P.530 Comparison of Recommendation ITU-R P.530 with the crane global method and is helpful to WP 9A on implementation of Recommendation ITU-R P.530.
N/A
3M/93 2003-2007 WP 9A Rec. ITU-R P. 837 Seeks advice of interrelation of one rain model versus another on use in a recommendation since one rain model was considered inaccurate.
N/A
3M/49 2003-2007 WP 9A Based on Recs ITU-T G.827, with possible applicability to Recommendations ITU-R F.1491 and ITU-R F.1492
Request for guidance on prediction method for outage intensity (OI). WP 9A informing WP 3M of a decision to finalize the PDNR, “Availability objectives for real digital fixed wireless links used in the 27 500 km hypothetical reference path.” WP 9A seeks guidance on a prediction method for OI, based on the characteristics of the connection already used for design purposes, in order that the designer is allowed to take into account this parameter for real link dimensioning.
3M/60 2003-2007 ITU-T SG 15 Draft revision of Question ITU-R 228/3
Propagation data required for the planning of systems operating above 275 GHz. Predictive propagation methods used for point to point applications between 800 nm and 1600 nm (187.5 and 375 THz). Existing propagation methods at the time were only for Earth-space and space-space paths.
187.5-375 THz
3M/96 2003-2007 WP 7C Rec. ITU-R P.528 Is a correction factor needed of Recommendation ITU-R P.528 based on the discrepancy in frequency and extrapolate information based on different time percentages.
403 or 1680 MHz
_______________
Appendix B
67


*37692*Printed in Switzerland
Geneva, 2012ISBN 978-92-61-14121-9
Handbook ITU-R propagation prediction methods for interference and
sharing studiesHa
ndbo
ok
I
TU-R
pro
paga
tion
pred
ictio
n m
etho
ds f
or in
terf
eren
ce a
nd s
hari
ng s
tudi
es
Editi
on 2
012
E n g l i s h E d i t i o n 2 0 1 2Radiocommunication Bureau