Embed Size (px)
Citation preview

RESEARCH ARTICLE Open Access
NPF:network propagation for proteinfunction predictionBihai Zhao1,2,3†, Zhihong Zhang1,2†, Meiping Jiang4,5*, Sai Hu1, Yingchun Luo4,5 and Lei Wang1,2*
* Correspondence:[email protected];[email protected]†Bihai Zhao and Zhihong Zhangcontributed equally to this work.4Department of Ultrasound, HunanProvincial Maternal and ChildHealth Care Hospital, Changsha410008, Hunan, China1College of Computer Engineeringand Applied Mathematics,Changsha University, Changsha410022, Hunan, ChinaFull list of author information isavailable at the end of the article
Abstract
Background: The accurate annotation of protein functions is of great significance inelucidating the phenomena of life, treating disease and developing new medicines.Various methods have been developed to facilitate the prediction of these functions bycombining protein interaction networks (PINs) with multi-omics data. However, it is stillchallenging to make full use of multiple biological to improve the performance offunctions annotation.
Results: We presented NPF (Network Propagation for Functions prediction), anintegrative protein function predicting framework assisted by network propagationand functional module detection, for discovering interacting partners with similarfunctions to target proteins. NPF leverages knowledge of the protein interactionnetwork architecture and multi-omics data, such as domain annotation and proteincomplex information, to augment protein-protein functional similarity in apropagation manner. We have verified the great potential of NPF for accuratelyinferring protein functions. According to the comprehensive evaluation of NPF, itdelivered a better performance than other competing methods in terms of leave-one-out cross-validation and ten-fold cross validation.
Conclusions: We demonstrated that network propagation, together with multi-omics data, can both discover more partners with similar function, and isunconstricted by the “small-world” feature of protein interaction networks. Weconclude that the performance of function prediction depends greatly on whetherwe can extract and exploit proper functional information of similarity from proteincorrelations.
Keywords: Network propagation, Protein-protein interaction, Prediction of proteinfunction
BackgroundProteins are the main component of cells and play an essential role in nearly all cell
functions such as composing cellular structure. Biological functions are performed by
groups of interacting and functionally associated proteins, instead of individual pro-
teins. The accurate characterization of protein functions is a key to understanding life
at the molecular level and has a profound impact on biomedicine and pharmaceuticals.
© The Author(s). 2020 Open Access This article is licensed under a Creative Commons Attribution 4.0 International License, whichpermits use, sharing, adaptation, distribution and reproduction in any medium or format, as long as you give appropriate credit tothe original author(s) and the source, provide a link to the Creative Commons licence, and indicate if changes were made. Theimages or other third party material in this article are included in the article's Creative Commons licence, unless indicated otherwisein a credit line to the material. If material is not included in the article's Creative Commons licence and your intended use is notpermitted by statutory regulation or exceeds the permitted use, you will need to obtain permission directly from the copyrightholder. To view a copy of this licence, visit http://creativecommons.org/licenses/by/4.0/. The Creative Commons Public DomainDedication waiver (http://creativecommons.org/publicdomain/zero/1.0/) applies to the data made available in this article, unlessotherwise stated in a credit line to the data.
Zhao et al. BMC Bioinformatics (2020) 21:355 https://doi.org/10.1186/s12859-020-03663-7

Proteins of unknown function comprise a significant fraction of sequenced ge-
nomes [1]. Thus, how accurately unknown proteins are determined in their pur-
poses has become one of the greatest challenges in the post-gene era. However,
due to the inherent difficulty and high costs, experimental techniques to deter-
mine protein functions has been unable to meet the growing genomic sequence
data. An increasing number of protein-protein interaction data urgently requires
computational methods to predict protein functions.. A protein interaction net-
work (PIN) can be modelled as an undirected graph, in which a vertex represents
a protein and an edge denotes an interaction between a pair of proteins. Intui-
tively, numerous network-based [2–4] or graph-based [5, 6] approaches are ap-
plied to predict protein functions from PINs. These methods are based on the
observation that proteins often possess similar or identical biochemical functions
with their interaction partners in the PINs [2, 7]. Unfortunately, these methods
are often plagued by noise and errors, resulting in biased outcomes and reduced
confidence in PINs.
To provide an accurate prediction results, the integration of different types of
biological data has become an important and popular strategy. A number of ap-
proaches have been developed to facilitate the prediction of protein functions by
combining PPIs with multi-source biological data. Cozzetto et al. [8] proposed an
effective method to deduce protein functions by integrating PINs with a wide var-
iety of biological information, such as sequence, gene expression, etc. Zhang et al.
[9] developed the domain context similarity for the prediction of protein functions
using protein domain composition and PINs. As an improvement on Zhang’s
method, two algorithms, named DCS (domain combination similarity) [10] and
DSCP (domain combination similarity in context of protein complexes) were pro-
posed to annotate unknown proteins by combining PINs with proteins’ domain in-
formation and protein complexes information. For the annotation of protein
functions, the PON (protein overlap network) [11] was constructed using the pro-
tein domain information and PIN topology. Sarker et al. [12] initially reconstructed
a protein-protein network based on PINs and protein domains, and then presented
the GrAPFI method for the annotation of protein functions. INGA [13] and INGA
2.0 [14] web servers were developed to infer protein functions by combining pro-
tein interaction networks, domain assignments and sequence similarity. PANNZER2
[15] was another functional annotation web server based on sequence similarity
practical. On the basis of the deep learning framework, Zhang proposed two
methods: DeepGOA [16] and DeepFunc [17], for accurate prediction of protein
functions. Normally, these methods are based network or neighbour-count. Mul-
tiple biological data is fused into these methods to improve the quality of the PINs.
For example, Zhang, DCS and DSCP have improved neighbour-count-based
methods with integrated protein domain data. The combinatorial theory was
used in these three methods to calculate the functional similarity between pro-
teins. Combining protein domain information with the topologies of PINs, the
PON and GrAPFI method rebuilt protein interaction networks for the prediction
of protein functions. Then, these two methods annotated unknown proteins ac-
cording to their 1-layer neighbours in the constructed network based on neigh-
bor count and link weights. In spite of the advances in these methods, it was a
Zhao et al. BMC Bioinformatics (2020) 21:355 Page 2 of 21
central challenge to the integration of multiple biological data categories within
a single analysis framework.
In the context of functions prediction, most network analysis methods depended
on the principle of ‘guilt by association’, which is based on observations that a pro-
tein shares many functional features with its direct interacting partners in PINs. A
simple and generic method might be to characterize unknown proteins with func-
tions of all direct neighbours in PINs. Nevertheless, such a straightforward way
would potentially yield false positives that are linked to proteins by irrelevant inter-
actions; it would also introduce false negatives that do not directly connect to pro-
teins with known functions [18]. It is verified by our statistics on the yeast PINs.
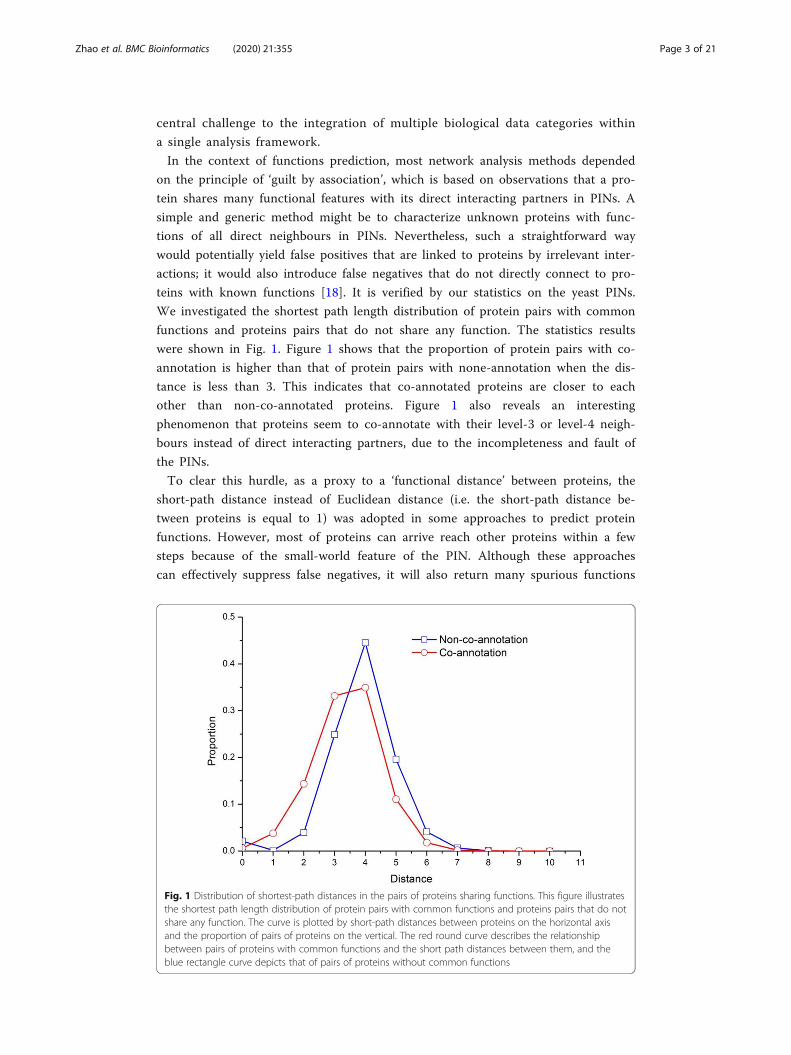
We investigated the shortest path length distribution of protein pairs with common
functions and proteins pairs that do not share any function. The statistics results
were shown in Fig. 1. Figure 1 shows that the proportion of protein pairs with co-
annotation is higher than that of protein pairs with none-annotation when the dis-
tance is less than 3. This indicates that co-annotated proteins are closer to each
other than non-co-annotated proteins. Figure 1 also reveals an interesting
phenomenon that proteins seem to co-annotate with their level-3 or level-4 neigh-
bours instead of direct interacting partners, due to the incompleteness and fault of
the PINs.
To clear this hurdle, as a proxy to a ‘functional distance’ between proteins, the
short-path distance instead of Euclidean distance (i.e. the short-path distance be-
tween proteins is equal to 1) was adopted in some approaches to predict protein
functions. However, most of proteins can arrive reach other proteins within a few
steps because of the small-world feature of the PIN. Although these approaches
can effectively suppress false negatives, it will also return many spurious functions
Fig. 1 Distribution of shortest-path distances in the pairs of proteins sharing functions. This figure illustratesthe shortest path length distribution of protein pairs with common functions and proteins pairs that do notshare any function. The curve is plotted by short-path distances between proteins on the horizontal axisand the proportion of pairs of proteins on the vertical. The red round curve describes the relationshipbetween pairs of proteins with common functions and the short path distances between them, and theblue rectangle curve depicts that of pairs of proteins without common functions
Zhao et al. BMC Bioinformatics (2020) 21:355 Page 3 of 21

by including irrelevant interactions. Network propagation provides us with a more
refined approach by using the flow of information through network connections as
a means to establish relationships between nodes [19]. There are various guises of
network propagation, such as random walks on graphs [20], the Google PageRank
search algorithm [21], heat diffusion processes [22], graph kernels [23], etc. In bio-
logical network, plenty of methods based on network propagation have been widely
applied to essential proteins identification [24, 25], drug synergy prediction [26],
tumors classification [27], disease associated genes identification [28, 29], microbe-
disease associations inference [30] and protein functions prediction [31], which
demonstrated that network propagation is a powerful data transformation method
of broad utility in genetic research [18]. Additionally, the rationality of combining
the protein domain, complex information and PINs for functions prediction is sub-
stantiated by the DCS and DSCP methods.
Inspired by these findings, we developed a network propagation-based method,
named NPF, for prediction of protein functions. Our model initially simulates the
random walk with restart algorithm and constructs a propagation network by inte-
grating knowledge of the protein interaction network architecture, protein domains
and protein complexes. This serves as the basis for us to detect functional modules
with high coupling in the prediction of functions of unknown protein. To evaluate
the performance of NPF, we apply our method and six other state-of-the-art
methods for prediction of protein functions on yeast PINs. Experimental results
demonstrated that NPF outperformed these competing methods, including
Neighbourhood-counting (NC) [2], Zhang [9], DCS [10], DSCP [10], PON [11] and
GrAPFI [12].
MethodsThe NPF method is divided into three stages: (1) Constructing three protein-
protein correlation networks by integrating knowledge of the protein interaction
network architecture, protein-domain associations and protein-complex associa-
tions. (2) Building a propagation network by applying an improved random walk
with restart algorithm to multiple protein correlation networks. (3) Detecting func-
tional modules with high coupling in the propagation network and annotating
functions for target proteins. The flowchart for the NPF method is shown in
Fig. 2.
Construction of multiple protein correlation networks
Biological functions are performed by a group of genes or proteins which are
related to one or more cellular interactions, e.g. protein-protein interaction, co-
regulation, co-expression or membership of a protein complex. Physical PINs
directly indicate the cooperation of proteins to drive a biological process [32].
Moreover, computational approaches had successfully detected stable functional
modules from co-expression networks [33]. We suspect that tightly interacting
and functionally dependent proteins may co-express, co-regulate or share a com-
mon protein complex, etc. Therefore, we constructed multiple protein-protein
correlation networks with integration of knowledge of protein interaction
Zhao et al. BMC Bioinformatics (2020) 21:355 Page 4 of 21

network architecture, protein domain annotation and protein complexes
information.
Co-neighbor network
Molecular functions are performed by groups of proteins interacting to each
other. Thus, a straightforward strategy is to annotate proteins for target proteins
using knowledge of the protein interaction network architecture. In this study,
we used the overlapping interacting partners between a pair of proteins as an es-
timate of their functional correlation. In the Co-Neighbor network, two proteins
are connected if they have a physical interaction and link to one or more com-
mon proteins simultaneously. Given a pair of proteins pi and pj in the Co-
Neighbor network, their correlation value was calculated as follow [34]:
P N pi; pj
� �¼ 2 j Npi∩Np j
jj Npi j þ j Npi∩Np j
j �2 j Npi∩Np j
jj Npj
j þ j Npi∩Npjj ð1Þ
Fig. 2 Flowchart of NPF method. a Three protein correlation networks Co_Neighbor, Co-Domain and Co-Complex are derived from original PIN, protein domain data, as well as protein complex information,respectively. b The propagation network PN is generated by running an improved random walk with restartalgorithm on multiple functional similarity networks. The propagation process is illustrated at different stepsuntil convergence. Changes in the color of nodes in the graph indicate the progress of the iterativeprocess. c Annotation for target proteins. Taking the target node as the seed node, a highly cohesivefunctional module can be obtained. Functions of neighbors in the detected functional module are used tocharacterize the target node
Zhao et al. BMC Bioinformatics (2020) 21:355 Page 5 of 21

where, N pi and N pj represents the set of direct neighbors of pi and pj respectively.
Npi∩N pj is an intersection of N pi and N pj.
Co-domain network
Domains are sequential and structural motifs found independently in different proteins
and play as the stable functional block of proteins. We now generalize the idea to con-
struct a protein correlation network based on the protein domain annotation informa-
tion. For a pair of proteins pi and pj, let M denotes the total number of domain
categories in PINs, and let x and y represent the number of domain categories of pi and
pj, respectively. Let z expresses the number of overlapping domain categories between
pi and pj. Then, we measured the functional correlation between two proteins pi and pjin the Co-Domain network with the follow formula, which is an improvement of the
Zhang method [9]:
P D pi; pj
� �¼ − log
Mz� M − zð Þx − z� M − xð Þy − z
Mx�My ð2Þ
Finally, the correlation score between pi and pj was obtained by the normalization
processing, which was described as follows:
P D pi; pj
� �¼
P D pi; pj
� �− min P Dð Þ
max P Dð Þ − min P Dð Þ ð3Þ
Co-complex network
Protein complexes consisting of molecular aggregations of proteins assembled by
multiple protein interactions are fundamental units of macro-molecular
organization and play crucial roles in integrating individual gene products to per-
form useful cellular functions. Studies [10] have revealed that if two proteins are
consisted of the same protein complexes, they tend to perform the same or similar
biological functions. As much, incorporating quality-controlled protein complexes
and analysing functional associations are both essential for accurate function anno-
tation. We therefore proposed to construct the protein correlation network Co-
Complex, where the functional correlation between two proteins is measured using
the Eq. (4) [35].
P C pi; pj
� �¼ j Cpi∩Cp j
jj Cpi j � j Cp j
j ð4Þ
In Eq. (4), C pi and C pj represents the set of protein complexes in which pi and pj is in-
volved respectively. Cpi∩C pj denotes the set of protein complexes containing both pi and pj.
Network propagation algorithm
The network propagation algorithm involved a random walk with restart process on
multiple protein correlation networks to generate an aggregated protein functional
similarity network with high confidence. This process considered the global connectiv-
ity patterns of the PIN for annotating target proteins. Moreover, this algorithm took
into account the structural feature and modular feature of protein for measuring func-
tional similarity by performing a two-step propagation operation. The output of the
Zhao et al. BMC Bioinformatics (2020) 21:355 Page 6 of 21
network propagation algorithm is a propagated protein functional matrix, which could
be used as input for protein function prediction.
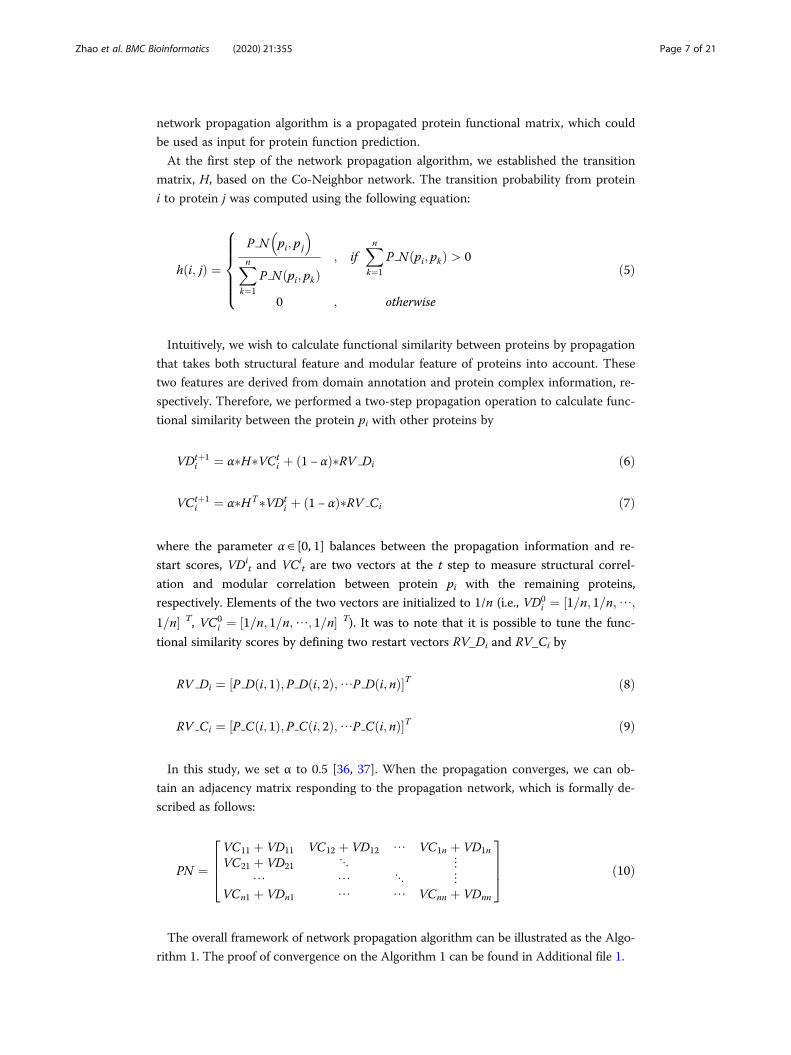
At the first step of the network propagation algorithm, we established the transition
matrix, H, based on the Co-Neighbor network. The transition probability from protein
i to protein j was computed using the following equation:
h i; jð Þ ¼P N pi; pj
� �
Xnk¼1
P N pi; pkð Þ; if
Xnk¼1
P N pi; pkð Þ > 0
0 ; otherwise
8>>>><>>>>:
ð5Þ
Intuitively, we wish to calculate functional similarity between proteins by propagation
that takes both structural feature and modular feature of proteins into account. These
two features are derived from domain annotation and protein complex information, re-
spectively. Therefore, we performed a two-step propagation operation to calculate func-
tional similarity between the protein pi with other proteins by
VDtþ1i ¼ α�H�VCt
i þ 1 − αð Þ�RV Di ð6Þ
VCtþ1i ¼ α�HT�VDt
i þ 1 − αð Þ�RV Ci ð7Þ
where the parameter α ∈ [0, 1] balances between the propagation information and re-
start scores, VDit and VCi
t are two vectors at the t step to measure structural correl-
ation and modular correlation between protein pi with the remaining proteins,
respectively. Elements of the two vectors are initialized to 1/n (i.e., VD0i ¼ ½1=n; 1=n;⋯;
1=n� T, VC0i ¼ ½1=n; 1=n;⋯; 1=n� T). It was to note that it is possible to tune the func-
tional similarity scores by defining two restart vectors RV_Di and RV_Ci by
RV Di ¼ P D i; 1ð Þ;P D i; 2ð Þ;⋯P D i; nð Þ½ �T ð8Þ
RV Ci ¼ P C i; 1ð Þ; P C i; 2ð Þ;⋯P C i; nð Þ½ �T ð9Þ
In this study, we set α to 0.5 [36, 37]. When the propagation converges, we can ob-
tain an adjacency matrix responding to the propagation network, which is formally de-
scribed as follows:
PN ¼VC11 þ VD11 VC12 þ VD12 ⋯ VC1n þ VD1n
VC21 þ VD21 ⋱ ⋮⋯ ⋯ ⋱ ⋮
VCn1 þ VDn1 ⋯ ⋯ VCnn þ VDnn
2664
3775 ð10Þ
The overall framework of network propagation algorithm can be illustrated as the Algo-
rithm 1. The proof of convergence on the Algorithm 1 can be found in Additional file 1.
Zhao et al. BMC Bioinformatics (2020) 21:355 Page 7 of 21

Prediction of protein functionsIntuitively, interacting partners are helpful to characterize target proteins. However,
members of the same functional module are often more densely connected than those
across functional modules [38]. Therefore, at the final stage of our work, we threw out
loosely connected neighbours and annotated target proteins with the remaining part-
ners in the newly constructed propagation network. Given a target protein v, M_V is a
module of the propagation network PN, which is composed of all neighbour nodes of v.
The module fitness [39] was introduced to quantitative describe the cohesion of M_V.
f M V ¼ WDinM V
WDinM V þWDout
M V
� �β ð11Þ
where WDM _ Vin denotes the total weight of edges contained entirely by a group of pro-
teins in the module M_V, WDM _Vout denotes the total weight of edges that connect
the group with the rest of the network. β is a positive real-valued parameter, controlling
the size of the module. To simplify operation, we set β to 1. The aim of this stage was
to determine a module starting from protein v such that the inclusion of a new neigh-
bour or the elimination of one neighbor from the module would lower fM_V. Thus for
this purpose, we introduced the concept of neighbour fitness. Given a v’s neighbour u,
the neighbour fitness of u in reference to the module M_V was calculated as follows:
f uM V ¼ f M Vþ uf g − f M V − uf g ð12Þ
In eq. (12), M_V+ {u} and M_V-{u} represents the module obtained from M_V with
neighbour u inside and outside, respectively.
Zhao et al. BMC Bioinformatics (2020) 21:355 Page 8 of 21
First, neighbours of v were ranked in descending order according to the functional
similarity to v. And then, all neighbours of v were visited and nodes with neighbour fit-
ness greater than 0 were selected to form a candidate proteins set P = {p1, p2,…, pl}. Let
F = {f1, f2,…, fm} be a list of functions of all proteins in P. The score of a candidate func-
tion fj in F can be calculated as follows:
Score F f j� �
¼Xl
u¼1
PN v; uð Þ�tuj ð13Þ
where PN(v, u) represents the functional similarity between u and v in the newly con-
structed propagation network. If u contains function fj, then tuj = 1, otherwise tuj = 0. Fi-
nally, candidate functions were ranked in descending order according to their scores
and TOP K of them were selected to characterize the target protein v. In this study, the
parameter K was set to the number of functions of the protein with the greatest func-
tional similarity to v in the propagation network PN. The Algorithm 2 gave the overall
framework of the proposed NPF method.
ResultsExperimental data
To test the performance of NPF, we applied our method and six competing
methods to infer protein functions in the protein interaction network of Saccha-
romyces cerevisiae (Baker’s yeast), because of their completeness, convincement,
and widespread used in function prediction algorithms as gold standard data. The
PIN data is derived from BioGRID database [40], updated to Oct.28, 2017, which
consists of 4113 proteins and 26,105 interactions among the proteins with self-
interactions and repeated interactions removed. The BioGRID is an integrated
network, which has been proven successful in tasks such as predicting disease
genes [41].
The annotation data of proteins used for validation was downloaded from GO official
website [42]. The GO system consists of three separate categories of annotations,
namely molecular function, biological process and cellular component. This paper takes
the biological process as an example to analyse the performance of NGF. The protein
domain data was downloaded from Pfam database [43], which contains 1026 different
types of domains associated with 2566 proteins in the BioGRID network. The bench-
mark protein complexes set was adopted from CYC2008 [44], which consists of 408
Zhao et al. BMC Bioinformatics (2020) 21:355 Page 9 of 21

complexes involving 1600 proteins in the BioGRID dataset. The above four dataset
were uniformly transformed to use the Ensemble Genomes Protein labelling system.
View of the constructed networks
In order to better understand the behaviour of the proposed NPF method, we provided
descriptive statistics on the constructed networks, including the Co-Neighbor network,
Co-Domain network, Co-Complex network and PN (propagation network). Table 1
listed the basic statistics of the four constructed networks, such as size of networks,
average degree etc. When considering network characteristics, the characteristic path
length and the clustering coefficient are usually used to measure the network. Table 2
shows the topology features of the original PPI network and the constructed propaga-
tion network. The results indicate that the effect of the small-world characteristic on
function prediction was improved through network propagation. Figures 3 and 4
depicted the distribution of degree and clustering coefficient in these four networks, re-
spectively. Our statistics revealed reinforcing functional correlations or relationships
between proteins in the PN. Therefore, it is reasonable to believe that network propaga-
tion is helpful to reduce the negative effect of false negative and improve the accuracy
of prediction of protein functions.
Assessment criteria
Two assessment criteria were adopted to compare function prediction performance of
the NPF with six competing methods, including NC [2], ZhangDC [9], DCS [10], DSCP
[10], PON [11] and GrAPFI [12]. The NC method is a classic protein function annota-
tion method, which is only based on the PIN. Zhang and DCS inferred protein func-
tions through protein domain composition and PINs, and DSCP extends the protein
functional similarity definition in DCS by combining the domain compositions of both
proteins and complexes including them. PON and GrAPFI constructed a protein cor-
relation network and characterized unknown proteins by integrating PINs and protein
domain information.
Proteins in PINs were divided into two categories: the training set and the test-
ing set. In one round of cross validation, the functions of each protein in the test-
ing set are predicted according to the proteins in the training set. The validation
process is repeated multiple times until each protein has a chance to become a
member of the testing set. The final performances were evaluated by the average
of all rounds. The first assessment criterion was leave-one-out cross-validation [10]
which put one target protein into the testing set and the rest of proteins into the
training set per round. However, the leave-one-out cross-validation was often
Table 1 Statistics of constructed networks
Networks Number of nodes Number of edges Average degree Clustering coefficient Connectedcomponents
Co-Neighbor 2696 13,728 10.184 0.645 25
Co-Domain 2448 18,123 14.806 0.743 471
Co-Complex 1595 10,886 13.650 0.798 279
PN 3082 57,256 37.155 0.673 185
Zhao et al. BMC Bioinformatics (2020) 21:355 Page 10 of 21

plagued by many unannotated proteins in the network. Another assessment criter-
ion used in this study was ten-fold cross validation [45], in which the proteins set
was randomly divided into ten subsets, a single subset was retained for the testing
set, and the remaining nine subsets were used as the training set. The cross-
validation process was then repeated ten times, with each of the ten subsets used
exactly once as the testing set. The ten results from the folds were then averaged
to produce the final performance.
To assess the quality of predicted functions, we matched inferred functions with ac-
tual functions of target proteins. Precision and Recall were the commonly used mea-
sures to test the performance of function prediction methods. Precision is the fraction
of predicted functions that are matched with known proteins while Recall is the frac-
tion of known functions that are matched with predicted functions. In this study, true
positive (TP), false positive (FP) and false negative (FN) represents the number of
matched predicted functions, incorrectly matched predicted functions and missing
matched known functions, respectively. Therefore, these two measures can be defined
as follows:
Precison ¼ TPTP þ FP
ð14Þ
Table 2 Comparison of the original network and the constructed network
Networks Number of nodes Number of edges Characteristic path length Clustering coefficient
BioGRID 4113 26,105 3.461 0.309
PN 3082 57,256 3.710 0.673
This table compares the topology features of the original network based on the BioGRID dataset and the constructednetwork PN
Fig. 3 The distribution of degree in constructed networks. This Figure shows the distribution of degree inthe four constructed networks. (a) Co-Complex network, (b) Co-Domain network, (c) Co-Neighbor network,(d) PN network
Zhao et al. BMC Bioinformatics (2020) 21:355 Page 11 of 21

Recall ¼ TPTP þ FN
ð15Þ
F-measure, as the harmonic mean of Precision and Recall, was another measure to
evaluate the performance of a method synthetically, which was calculated as follows:
F −measure ¼ 2� Precision� RecallPrecisionþ Recall
ð16Þ
Leave-one-out cross-validation
First, the leave-one-out cross validation was applied to verify the quality of predicted
functions inferred by our NPF methods, as well as a representative set of competing
methods: NC, Zhang, DCS, DSCP, PON and GrAPFI. To ensure impartiality, we fil-
tered out those GO terms whose number of annotated proteins is less than 10 or more
than 200 proteins. After being processed by this step, the number of GO terms is 267.
Out of all the 4113 proteins in the PINs, 2716 proteins were annotated. The average
and median number of GO terms for these annotated protein was 2.1 and 2, respect-
ively. The NPF method obtained 2146 functional modules for these 2716 training pro-
teins on the BioGRID databases. The average size and fitness value of the detected
functional modules is 13.48 and 0.5625, respectively.
We first assessed the performance of NPF and six other competing methods on these
target proteins by the average Precision, Recall and F-measure. The basic information
about predicted functions by NPF and six other competing methods was presented in
Table 3. In Table 3, MP was the number of proteins successfully matching at least one
known function, while PMP represented the number of proteins perfectly matching the
known functions, yet ZP was the number of proteins with zero-error prediction. MMP
Fig. 4 The distribution of clustering coefficient in constructed networks. This Figure shows the distributionof clustering coefficient in the four constructed networks. (a) Co-Complex network, (b) Co-Domain network,(c) Co-Neighbor network, (d) PN network
Zhao et al. BMC Bioinformatics (2020) 21:355 Page 12 of 21

denoted the number of proteins completely mismatching the known functions. In other
words, none of the predicted functions match the known functions. From Table 3, we
can see that NPF contained the second-biggest number of perfect matching proteins
(891) after NC (1428), while ZP of our method (885) is far more than NC’s (100). Fig-
ure 5 showed the overall comparison in terms of Precision, Recall and F-measure. It
illustrated that NPF archives the largest value of Precision and F-measure, the second-
largest value of Recall after NC. This is due to the maximum number of perfect match-
ing proteins with NC. F-measure of NPF was 61.56, 109.41, 19.74, 11.53, 209.80 and
103.36% higher than NC, Zhang, DCS, DSCP, PON and GrAPFI, respectively.
To further investigate the performance of NPF and six other competing methods, we
applied the Precision-Recall (PR) curve, whose vertical and horizontal coordination are
the values of Precision and Recall, respectively. The PR curve is a standard for evalu-
ation of the comprehensive performance of all methods in terms of different strategies
of function selection. Predicted functions were ranked in descending order according
to the values of functional similarity calculated by NPF, NC, PON and GrAPFI,
Table 3 Basic information of prediction by various algorithms
Methods MP PMP MMP ZP
NPF 1503 891 1213 885
NC 1945 1428 771 100
Zhang 727 421 1989 432
DCS 1269 743 1447 742
DSCP 1358 810 1358 799
PON 536 229 2180 277
GrAPFI 774 384 1942 432
This table shows the basic information of the results predicted by NPF, NC, Zhang, DCS, DSCP, PON and GrAPFI. MP is thenumber of proteins successfully matching at least one known function. PMP represents the number of proteins perfectlymatching the known functions. MMP denotes the number of proteins completely mismatching the known functions. ZPis the number of proteins with zero-error prediction. That is, all the predicted functions in these proteins match theknown functions
Fig. 5 Overall comparisons of various methods. Numbers of each bar are the values for each score,including precision, recall and F-measure
Zhao et al. BMC Bioinformatics (2020) 21:355 Page 13 of 21
respectively. Then, the top K functions were selected and annotated target proteins.
The Parameter K changed from 1 to 267. As for the methods of Zhang, DSC and
DSCP, top N (N < =K) proteins which had the highest similarity value with target pro-
teins were selected and K functions in these fell out proteins were selected in turn to
characterize target proteins. For a given target protein and the parameter K, the preci-
sion and recall values can be calculated according to the definition in Eqs. (14) and
(15). The final PR curves of NPF and six other competing methods were drew accord-
ing to the average precision and recall values over all target proteins. The PR curves of
seven methods were illustrated in Fig. 4. Numbers in brackets represented the max-
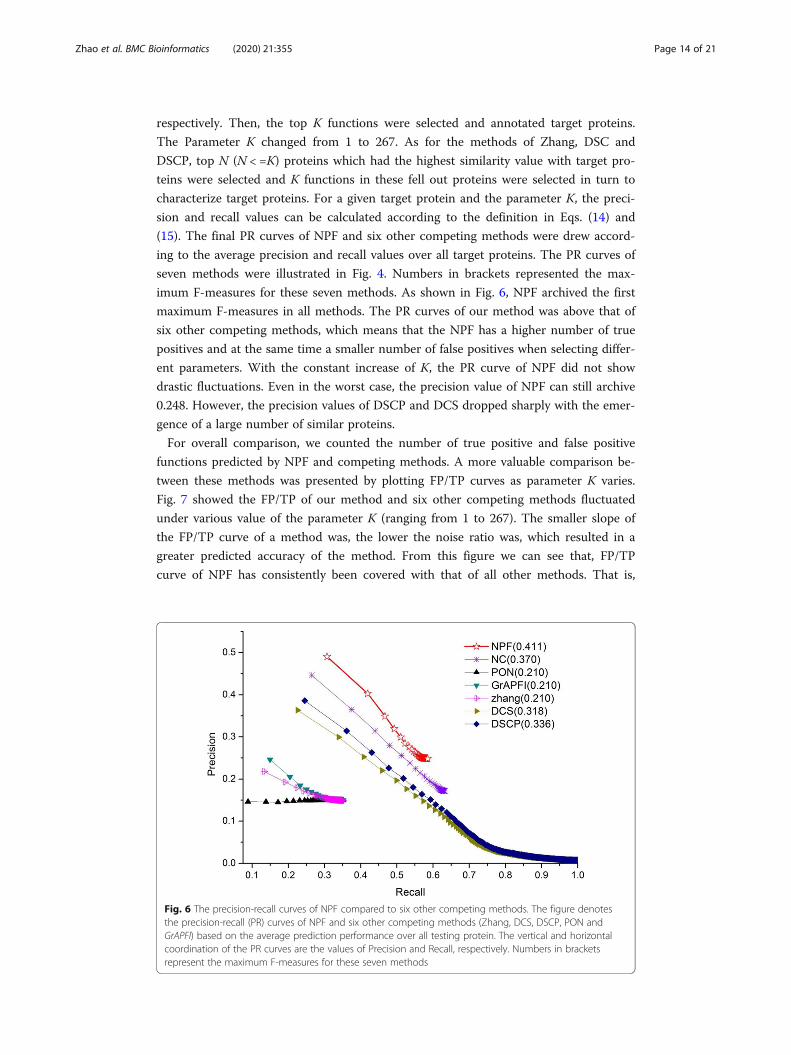
imum F-measures for these seven methods. As shown in Fig. 6, NPF archived the first
maximum F-measures in all methods. The PR curves of our method was above that of
six other competing methods, which means that the NPF has a higher number of true
positives and at the same time a smaller number of false positives when selecting differ-
ent parameters. With the constant increase of K, the PR curve of NPF did not show
drastic fluctuations. Even in the worst case, the precision value of NPF can still archive
0.248. However, the precision values of DSCP and DCS dropped sharply with the emer-
gence of a large number of similar proteins.
For overall comparison, we counted the number of true positive and false positive
functions predicted by NPF and competing methods. A more valuable comparison be-
tween these methods was presented by plotting FP/TP curves as parameter K varies.
Fig. 7 showed the FP/TP of our method and six other competing methods fluctuated
under various value of the parameter K (ranging from 1 to 267). The smaller slope of
the FP/TP curve of a method was, the lower the noise ratio was, which resulted in a
greater predicted accuracy of the method. From this figure we can see that, FP/TP
curve of NPF has consistently been covered with that of all other methods. That is,
Fig. 6 The precision-recall curves of NPF compared to six other competing methods. The figure denotesthe precision-recall (PR) curves of NPF and six other competing methods (Zhang, DCS, DSCP, PON andGrAPFI) based on the average prediction performance over all testing protein. The vertical and horizontalcoordination of the PR curves are the values of Precision and Recall, respectively. Numbers in bracketsrepresent the maximum F-measures for these seven methods
Zhao et al. BMC Bioinformatics (2020) 21:355 Page 14 of 21

NPF generated the fewest false positives among all the methods when matching the
same number of known functions.
To further analyze the difference between NPF and six other competing
methods, we selected YNL262W, YBR278W and YPR175W as examples and in-
ferred proteins using the seven methods. Table 4 listed the basic information of
these target proteins, including degree, number of domains and number of in-
volving complexes. Figure 8 showed the predicted functions by various methods
and the benchmark set. In Fig. 8, red elliptic nodes were target proteins, and red
edges represented interactions between target proteins. Green round rectangle
and grey rectangle nodes represented matched functions and false matched func-
tions, respectively. Solid edges and dash edges between proteins and functions de-
noted correct and false associations. Table 5 showed the description of seven
known functions of the three selected proteins. Take the protein YBR278W as an
example, which does not contain any domains. For the three domain-based
methods Zhang, PON and GrAPFI, no one function was inferred, let alone
matched a known function. DCS and DSCP generated two predicted functions
with one function matched by including neighbors or complex members for
Fig. 7 The FP/TP curves of various methods. This Figure depicts the FP/TP of our method and othercompeting methods fluctuate under various value of the parameter K. The vertical and horizontalcoordination of the curve are the values of FP/TP and K, respectively. a Shows the FP/TP curves of NC andNPF. b Shows the FP/TP curves of Zhang and NPF. c Shows the FP/TP curves of DCS, GrAPFI and NPF. dShows the FP/TP curves of DSCP and NPF
Table 4 Basic information of selected target proteins
Proteins Degree Number of domains Number of complexes
YNL262W 13 2 1
YBR278W 9 0 1
YPR175W 9 1 1
This table shows the basic information of three target proteins. The second column represents the number of its directneighbors in the original PINs, while the third column is the number of domains it contains. The last column denotes thenumber of complexes involved
Zhao et al. BMC Bioinformatics (2020) 21:355 Page 15 of 21

calculation of domain context similarities. The NC method annotated the protein
YBR278W with functions of its all neighbors. Although the method successfully
matched five functions, it introduced a large number of false-positive functions.
Out of seven functions predicted by NPF, five functions were matched with
known functions. This is due to the fact that we discovered more partners with
similar functions through network propagation and got rid of some functionally
unrelated proteins by detecting functional modules with high coupling. The ex-
ample exhibited the highest predicting accuracy of NPF, compared to the results
archived by other competing methods.
Ten-fold cross validation
In the previous section, we applied the leave-one-out cross-validation to exhibit the
NPF’s improvement on function prediction compared to the state-of-the-art methods.
Fig. 8 Functions of three selected proteins predicted by various methods. Red elliptic nodes denote targetproteins, and red edges represent interactions between them. Green round rectangle and gray rectanglenodes represent matched functions and false matched functions respectively. Solid edges and dash edgesbetween proteins and functions denote correct and false associations. (a) Benchmark results (b)-(h) is theresult generated by NPF, Zhang, DCS, DSCP, PON and GrAPFI, respectively
Table 5 Description of selected GO Terms
GO Term Description
GO:0006272 Leading strand elongation, which is continuous as it proceeds in the same direction asthe replication fork.
GO:0006273 Lagging strand elongation proceeds by discontinuous synthesis of short stretches ofDNA, known as Okazaki fragments, from RNA primers; these fragments are then joinedby DNA ligase.
GO:0006289 Nucleotide excision repair recognizes a wide range of substrates, including damagecaused by UV irradiation and chemicals.
GO:0006298 The mismatch repair system promotes genomic fidelity by repairing base-basemismatches, insertion-deletion loops and heterologies generated during DNAreplication and recombination.
GO:0006303 The repair of a double-strand break in DNA in which the two broken ends arere-joined with little or no sequence complementarity.
GO:0006348 Chromatin silencing at telomere means the repression of transcription of telomereDNA by altering the structure of chromatin.
GO:0007064 Mitotic sister chromatid cohesion. The cell cycle process in which the sister chromatidsof a replicated chromosome are joined along the entire length of the chromosome.
The underscored text represents the name of GO Term
Zhao et al. BMC Bioinformatics (2020) 21:355 Page 16 of 21

However, in real-world applications, there are usually much more unknown proteins
than just one. To do this we adopted the ten-fold validation to verify the validity of our
method on PINs with less function information. The entire set of proteins was divided
into ten equal sets randomly, nine of which were used for training and the remaining
part was used for testing. The process is repeated 1000 times, each time using another
testing set. We ran the functional annotation methods of NPF, Zhang, DCS, DSCP,
PON and GrAPFI on PINs to get mean values and standard deviations of precision, re-
call and F-measure, as shown in Table 6. Additionally, predicted functions were ranked
in descending order according to the values obtained by various method and the top K
functions were selected to annotate target proteins. A more valuable comparison be-
tween these methods was presented by plotting PR curves and F-measure curves as the
parameter K varies using the ten-fold validation. Figures 9 and 10 illustrated the PR
curves and F-measure curves of various methods, respectively. Table 6, Figs. 9 and 10
exhibited the performance improvement of NPF compared to six other competing
methods. Therefore, NPF seemed to be an effective method for characterizing unknown
proteins.
DiscussionsThe accurate annotation of protein functions is the key to understanding life at
the molecular level and plays an important role in disease treatment, new drug
development. Limited by the quality of protein interaction data generated by
high-throughput technologies, methods that infer protein functions in terms of
protein interactions may not work well [10]. A popular optimization scheme for
the problem is to infer protein functions by combining PINs with multiple bio-
logical data. Despite the advances in these methods, designing efficient algo-
rithms to fuse these multi-source biological data remains challenging.
Additionally, the topology of the PINs, such as the “small world”, is also one of
the factors that affect the prediction performances. Here, we presented the NPF,
a network propagation-based method to annotate functions for target proteins.
To overcome the problem of incomplete and false interaction data, we con-
structed a propagation network by integrating knowledge of the protein inter-
action network architecture, protein-domain associations and protein-complex
associations. By propagating functional similarities across the networks, we can
obtain more functionally relevant interacting partners to characterize the target
Table 6 The prediction results using ten-fold validation
Methods Precison Recall F-measure
mean value standard deviations mean value standard deviations mean value standarddeviations
NPF 0.424 0.025 0.429 0.022 0.426 0.022
NC 0.176 0.014 0.610 0.023 0.273 0.018
Zhang 0.198 0.019 0.196 0.019 0.197 0.019
DCS 0.352 0.025 0.354 0.027 0.353 0.025
DSCP 0.378 0.027 0.382 0.028 0.380 0.027
PON 0.139 0.017 0.129 0.016 0.134 0.016
GrAPFI 0.219 0.018 0.209 0.018 0.214 0.018
Zhao et al. BMC Bioinformatics (2020) 21:355 Page 17 of 21

proteins, which effectively free from the constraints of the “small-world” charac-
teristic. Additionally, we take out those redundant function-independent partners
by forming functional modules with high cohesion. Comprehensive comparisons
among the state-of-the-art methods and our method have been made in terms
of the leave-one-out cross-validation and the ten-fold cross validation. Experi-
mental results demonstrated that our method outperforms other competing
methods. Specially, DSCP used the same kind of data as NPF, yet NPF outper-
formed DSCP. There are two reasons to believe that NPF probably come out
much better in the comparison. On the one hand, NPF can discover more
neighbors with similar functions through network propagation; on the other
Fig. 10 The F-measure curves of various methods using ten-fold validation. This Figure depicts the F-measure of seven methods fluctuate under various value of the parameter K. The vertical and horizontalcoordination of the curve are the values of F-measure and K, respectively. a Shows the F-measure curves ofNC, DCS, Zhang and NPF. b Shows the F-measure curves of DSCP, GrAPFI, PON and NPF
Fig. 9 The precision-recall curves of various methods using ten-fold validation. This Figure shows the PRcurves of NPF and six other methods using ten-fold validation. The entire set of proteins is divided into tenequal sets randomly, nine of which are used for training and the remaining part is used for testing. Theprocess is repeated 1000 times, each time using another testing set
Zhao et al. BMC Bioinformatics (2020) 21:355 Page 18 of 21

hand, NPF predicted functions using multiple neighbors, not just the closest
neighbors. In my opinion, proteins may be involved in different functional mod-
ules to perform multiple biological functions. Based on these results, we can
conclude that the network propagation is useful for the study of protein inter-
action networks.
ConclusionsIn this study, we proposed a novel protein functions annotation method based on
network propagation, named NPF, which incorporates the topology of PINS and
multiple biological data, such as domain annotation information, protein complexes
information. Furthermore, we guarantee the NPF against false functions by detect-
ing functional modules based on the neighbour fitness. Experimental comparison
results between NPF and six state-of-the-art methods on yeast PINs showed that
NPF significantly outperforms other competing methods. In our future study, we
will take the hierarchical structure of GO Terms into account for further improve-
ment of the performance of function prediction.
Supplementary informationSupplementary information accompanies this paper at https://doi.org/10.1186/s12859-020-03663-7.
Additional file 1 Algorithm convergence. This file provides the proof of the Algorithm 1 convergence aboutthe effect of parameter α and ∂ on the speed of convergence.
AbbreviationsPIN: Protein interaction network; NPF: Network propagation for functions prediction; DCS: Domain combinationsimilarity; DSCP: Domain combination similarity in context of protein complexes; PON: Protein overlap network;INGA: Interaction network go annotator; PANNZER: Protein ANNotation with Z-scoRE; NC: Neighbourhood-counting;PN: Propagation network; GO: Gene ontology; TP: True positive; FP: False positive; FN: False negative
AcknowledgementsNot applicable.
Authors’ contributionsBHZ, ZHZ and LW designed the NPF method; SH, YCL and LW analysed data for the work; BHZ and MPJ drafted andrevised the manuscript. The authors read and approved the final manuscript.
FundingThis work was supported in part by the National Natural Science Foundation of China (61772089, 61873221,61672447), Natural Science Foundation of Hunan Province (No. 2019JJ40325, No. 2018JJ3566, No. 2018JJ3565, No.2018JJ4058), National Scientific Research Foundation of Hunan Province (19A048), Major Scientific and TechnologicalProjects for collaborative prevention and control of birth defects in Hunan Province (2019SK1010), Hunan ProvincialKey Laboratory of Industrial Internet Technology and Security (2019TP1011), and Hunan Provincial Key Laboratory ofNutrition and Quality Control of Aquatic Animals (2018TP1027).The funding body played no role in the design of the study and collection, analysis, and interpretation of data and inwriting the manuscript.
Availability of data and materialsPublicly available datasets were analysed in this study. This data and the NGF program can be found here: https://github.com/husaiccsu/NPF.
Ethics approval and consent to participateNot applicable.
Consent for publicationNot applicable.
Competing interestsThe authors declare that they have no competing interests.
Zhao et al. BMC Bioinformatics (2020) 21:355 Page 19 of 21
Author details1College of Computer Engineering and Applied Mathematics, Changsha University, Changsha 410022, Hunan, China.2Hunan Provincial Key Laboratory of Industrial Internet Technology and Security, Changsha University, Changsha410022, Hunan, China. 3Hunan Provincial Key Laboratory of Nutrition and Quality Control of Aquatic Animals,Changsha University, Changsha 410022, Hunan, China. 4Department of Ultrasound, Hunan Provincial Maternal andChild Health Care Hospital, Changsha 410008, Hunan, China. 5NHC Key Laboratory of Birth Defect for Research andPrevention (Hunan Provincial Maternal and Child Health Care Hospital), Changsha 410100, Hunan, China.
Received: 29 February 2020 Accepted: 14 July 2020
References1. Shumilin IA, Cymborowski M, Chertihin O, et al. Identification of unknown protein function using metabolite cocktail
screening. Structure. 2012;20(10):1715–25.2. Schwikowski B, Uetz P, Fields S. A network of protein–protein interactions in yeast. Nat Biotechnol. 2000;18(12):1257–61.3. Bogdanov P, Singh AK. Molecular function prediction using neighborhood features. IEEE/ACM Trans Comput Biol
Bioinformatics. 2009;7(2):208–17.4. Cho YR, Zhang A. Predicting protein function by frequent functional association pattern mining in protein interaction
networks. IEEE Trans Inf Technol Biomed. 2009;14(1):30–6.5. Vazquez A, Flammini A, Maritan A, et al. Global protein function prediction from protein-protein interaction networks.
Nat Biotechnol. 2003;21(6):697–700.6. Nabieva E, Jim K, Agarwal A, et al. Whole-proteome prediction of protein function via graph-theoretic analysis of
interaction maps. Bioinformatics. 2005;21(suppl_1):i302–10.7. Tang XW, Xiao Q, Yu K. Breast Cancer candidate gene detection through integration of subcellular localization data with
protein-protein interaction networks. IEEE Trans Nanobioscience. 2020;19(3):556–61.8. Cozzetto D, Buchan DWA, Bryson K, et al. Protein function prediction by massive integration of evolutionary analyses
and multiple data sources. BMC Bioinformatics. 2013;14(Suppl 3):S1.9. Zhang S, Chen H, Liu K, et al. Inferring protein function by domain context similarities in protein-protein interaction
networks. BMC Bioinformatics. 2009;10(1):395.10. Peng W, Wang J, Cai J, et al. Improving protein function prediction using domain and protein complexes in PPI
networks. BMC Syst Biol. 2014;8(1):35.11. Liang S, Zheng D, Standley DM, et al. A novel function prediction approach using protein overlap networks. BMC Syst
Biol. 2013;7(1):61.12. Sarker B, Rtichie DW, Aridhi S. Exploiting complex protein domain networks for protein function annotation. In:
International Conference on Complex Networks and their Applications. Cham: Springer; 2018. p. 598–610.13. Piovesan D, Giollo M, Leonardi E, et al. INGA: protein function prediction combining interaction networks, domain
assignments and sequence similarity. Nucleic Acids Res. 2015;43(W1):W134–40.14. Piovesan D, Tosatto SCE. INGA 2.0: improving protein function prediction for the dark proteome. Nucleic Acids Res.
2019;47(W1):W373–8.15. Törönen P, Medlar A, Holm L. PANNZER2: a rapid functional annotation web server. Nucleic Acids Res. 2018;46(W1):
W84–8.16. Zhang F, Song H, Zeng M, et al. A deep learning framework for gene ontology annotations with sequence - and
network-based information. IEEE/ACM Trans Comput Biol Bioinform. 2020;10.1109/TCBB.2020.2968882. https://doi.org/10.1109/TCBB.2020.2968882. [published online ahead of print, 2020 Jan 23].
17. Zhang FH, Song H, Zeng M, et al. DeepFunc: a deep learning framework for accurate prediction of protein functionsfrom protein sequences and interactions. Proteomics. 2019;19(12):1900019.
18. Cowen L, Ideker T, Raphael BJ, et al. Network propagation: a universal amplifier of genetic associations. Nat Rev Genet.2017;18(9):551.
19. Martiniano HFMC, Asif M, Vicente AM, et al. Network propagation-based semi-supervised identification of genesassociated with autism Spectrum disorder. In: International Meeting on Computational Intelligence Methods forBioinformatics and Biostatistics. Cham: Springer; 2018. p. 239–48.
20. Tong H, Faloutsos C, Pan J, et al. Random walk with restart: fast solutions and applications. Knowl Inf Syst. 2008;14(3):327–46.
21. Haveliwala TH. Topic-sensitive pagerank: a context-sensitive ranking algorithm for web search. IEEE Trans Knowl DataEng. 2013;15(4):784–96.
22. Lebowitz JL, Krapivsky PL, Redner S, Ben-Naim E. A kinetic view of statistical physics. J Stat Phys. 2011;143(4):831–2.23. Borgwardt KM, Ong CS, Schonauer S, et al. Protein function prediction via graph kernels. Bioinformatics. 2005;21(1):47–
56.24. Zhao BH, Zhao YL, Zhang XX, et al. An iteration method for identifying yeast essential proteins from heterogeneous
network. BMC Bioinformatics. 2019;20(1):1–13. Article number: 355 (2019).25. Zhao BH, Han X, Liu XR, et al. A novel method to predict essential proteins based on diffusion distance networks. IEEE
Access. 2020:29385–94.26. Li H, Li T, Quang D, et al. Network propagation predicts drug synergy in cancers. Cancer Res. 2018;78(18):5446–57.27. Zhang W, Ma J, Ideker T. Classifying tumors by supervised network propagation. Bioinformatics. 2018;34(13):i484–93.28. Gottlieb A, Magger O, Berman I, et al. PRINCIPLE: a tool for associating genes with diseases via network propagation.
Bioinformatics. 2011;27(23):3325–6.29. Qian Y, Besenbacher S, Mailund T, et al. Identifying disease associated genes by network propagation. BMC Syst Biol
BioMed Central. 2014;8(S1):S6.30. Peng L, Zhou D, Liu W, et al. Prioritizing human microbe-disease associations utilizing a node-information-based link
propagation method. IEEE Access. 2020:31341–9.
Zhao et al. BMC Bioinformatics (2020) 21:355 Page 20 of 21
31. Peng W, Li M, Chen L, et al. Predicting protein functions by using unbalanced random walk algorithm on threebiological networks. IEEE/ACM Trans Comput Biol Bioinformatics. 2017;14(2):360–9.
32. Liang L, Chen V, Zhu K, et al. Integrating data and knowledge to identify functional modules of genes: a multilayerapproach. BMC Bioinformatics. 2019;20(1):225.
33. Stuart JM, Segal E, Koller D, et al. A gene-coexpression network for global discovery of conserved genetic modules.Science. 2003;302(5643):249–55.
34. Chua HN, Sung W, Wong L, et al. Exploiting indirect neighbours and topological weight to predict protein functionfrom protein-protein interactions. Bioinformatics. 2006;22(13):1623–30.
35. Zhao BH, Hu S, Li XY, et al. An efficient method for protein function annotation based on multilayer protein networks.Hum Genomics. 2016;10(33):1–15.
36. Hwang TH, Sicotte H, Tian Z, et al. Robust and efficient identification of biomarkers by classifying features on graphs.Bioinformatics. 2008;24(18):2023–9.
37. Vanunu O, Magger O, Ruppin E, et al. Associating genes and protein complexes with disease via network propagation.PLoS Comput Biol. 2010;6(1):e1000641.
38. Hartwell LH, Hopfield JJ, Leibler S, et al. From molecular to modular cell biology. Nature. 1999;402(6761):C47–52.39. Lancichinetti A, Fortunato S, Kertész J. Detecting the overlapping and hierarchical community structure in complex
networks. New J Phys. 2009;11(3):033015.40. Oughtred R, Stark C, Breitkreutz B, et al. The BioGRID interaction database: 2019 update. Nucleic Acids Res. 2019.41. Huang JK, Carlin DE, Yu MK, et al. Systematic evaluation of molecular networks for discovery of disease genes. Cell Syst.
2018;6(4):484–95.42. Ashburner M, Ball CA, Blake JA, et al. Gene ontology: tool for the unification of biology. Nat Genet. 2000;25(1):25–9.43. Bateman A, Coin L, Durbin R, et al. The Pfam protein families database. Nucleic Acids Res. 2004;32(suppl 1):D138–41.44. Pu S, Wong J, Turner B, et al. Up-to-date catalogues of yeast protein complexes. Nucleic Acids Res. 2009;37:825–31.45. Moreno-Torres JG, Sáez JA, Herrera F. Study on the impact of partition-induced dataset shift on k-fold cross-validation.
IEEE Trans Neural Netw Learn Syst. 2012;23(8):1304–12.
Publisher’s NoteSpringer Nature remains neutral with regard to jurisdictional claims in published maps and institutional affiliations.
Zhao et al. BMC Bioinformatics (2020) 21:355 Page 21 of 21