Embed Size (px)
Citation preview

Craig Drummond – Chief Executive Officer | Mark Rogers – Chief Financial Officer
Investor presentation
2021 half year results
24 February 2021

The information contained in this presentation is general information only. The information contained in this presentation is not investment or financial product advice and has been prepared without taking into account the investment objectives, financial situation or particular needs of any particular person. To the extent permitted by law, no responsibility for any loss arising in any way from anyone acting or refraining from acting as a result of this information is accepted by Medibank Private Limited (“MPL”) or any of its related bodies corporate. No representation or warranty, express or implied, is made by any person, including MPL, and its related bodies corporate, directors, officers, employees, professional advisors and agents (“Related Parties”) as to the fairness, accuracy, completeness, reliability or correctness of the information, opinions and conclusions contained in this presentation.
An investment in MPL securities is subject to investment and other known and unknown risks, some of which are beyond the control of MPL, such as general economic conditions in Australia, exchange rates, the market environment in which MPL operates and inherent regulatory risks in MPL’s business. MPL does not guarantee any particular rate of return or the performance of MPL securities.
Past performance information in this presentation is given for illustrative purposes only. It is not, and should not be relied upon as, an indication of future performance.
This presentation contains certain forward‐looking statements with respect to the financial condition, results of operations and business of MPL and associated entities and certain plans and objectives of the management of MPL. Forward‐looking statements can be identified by the use of forward‐looking terminology, including without limitation the terms “believes”, “estimates”, “anticipates”, “expects”, “predicts”, “intends”, “plans”, “goals”, “targets”, “aims”, “outlook”, “guidance”, “forecasts”, “may”, “will”, “would”, “could” or “should” or, in each case, their negative or other variations or comparable terminology. These forward‐looking statements include all matters that are not historical facts.
Such forward‐looking statements are not guarantees or predictions of future performance and are based on information, expectations and assumptions as at the date of this presentation regarding MPL’s present and future business strategies and the future political, regulatory and economic environment in which MPL will operate.
Important notice
2
Such forward‐looking statements involve known and unknown risks, uncertainties and other factors. The nature of such factors may cause the actual results or performance of MPL to be materially different from the results or performance expressed or implied by such forward‐looking statements. No representation or warranty is made that any of these statements or forecasts (express or implied) will come to pass or that any forecast result will be achieved.
To the full extent permitted by law, MPL and its Related Parties disclaim any obligation or undertaking to release any updates or revisions to information to reflect any change in any of the information contained in this presentation (including but not limited to any assumptions or expectations set out in the presentation).
All figures in the presentation are in Australian dollars unless stated otherwise and all market shares are estimates only. Some figures, amounts, percentages, estimates, calculations of value and fractions are subject to rounding. Accordingly, the actual calculations of these figures may differ from figures set out in this presentation. Further, some balances subject to rounding may not add consistently throughout this presentation.
The distribution of this presentation, including in jurisdictions outside Australia, may be restricted by law. Any person who receives this presentation must seek advice on and observe any such restrictions. Nothing in this presentation constitutes an offer or invitation to issue or sell securities, or a recommendation to subscribe for or acquire securities, by or on behalf of MPL, its related bodies corporate or any other person in any jurisdiction including where it is unlawful to do so. This presentation is not and does not constitute an offer to sell or the solicitation, invitation or recommendation to purchase any securities in the United States and neither this presentation nor anything contained herein shall form the basis of any contract or commitment. This presentation may not be distributed or released, directly or indirectly, in the United States.
Abbreviations and acronyms used throughout the presentation may be found in the glossary. This presentation should be read in conjunction with MPL’s other periodic and continuous disclosure announcements lodged with the ASX, which are available at www.asx.com.au.
Unless noted specifically within this presentation, all references to Operating Profit or NPAT are reported on a continuing basis.

Craig Drummond – Chief Executive Officer
Highlights

Results summary
4
High quality result underpinned by strong policyholder growth and ongoing vigilance on management costs
Health Insurance results Medibank Health results
Group results
Operating profit
$255.2m
+16.6%
1 Total expected consideration of $63 million. Under the terms of the share purchase agreement, if certain conditions are not met, Medibank may be required to acquire additional shares in Myhealth Medical Holdings Pty Ltd and pay additional consideration
Operating margin
7.7%
+90bps
Management expenses
$250.8m
+1.1%
Service NPS (average)
Medibank 37.9, +7.2
ahm 46.8, +6.1
Operating profit
$18.8m
+41.4%
Strengthening focus on preventative health with $63m investment
in Myhealth1
Operating profit
$254.6m
+13.6%
Benefits payable
$2.8b
-1.8%
Policyholder growth
Net resident policyholders +49k, +2.7% (6 mths)
Market share growth: +28bps (6 mths)
Premium revenue
$3.3b
+0.3%
NPAT
$226.4m
+26.8%
Net investment income
$71.8m
+86.5% (Up from $38.5m)
Interim dividend
5.8 cps
+1.8%
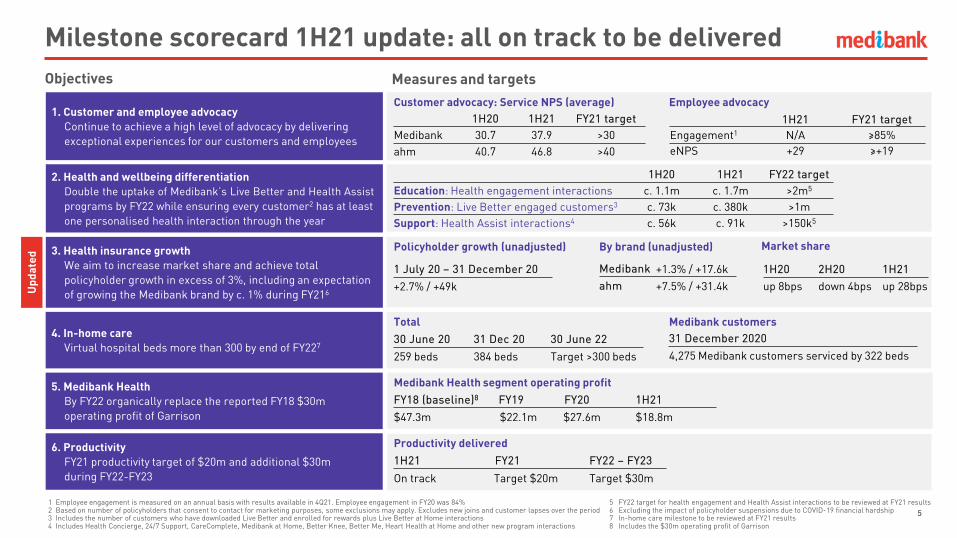
Milestone scorecard 1H21 update: all on track to be delivered
55
1. Customer and employee advocacy Continue to achieve a high level of advocacy by delivering exceptional experiences for our customers and employees
1H20 1H21 FY21 targetMedibank 30.7 37.9 >30ahm 40.7 46.8 >40
1H21 FY21 targetEngagement1 N/A ≥85%eNPS +29 ≥+19
Objectives Measures and targets
2. Health and wellbeing differentiationDouble the uptake of Medibank’s Live Better and Health Assist programs by FY22 while ensuring every customer2 has at least one personalised health interaction through the year
3. Health insurance growthWe aim to increase market share and achieve total policyholder growth in excess of 3%, including an expectation of growing the Medibank brand by c. 1% during FY216
Market share
1 July 20 – 31 December 20
+2.7% / +49k
Policyholder growth (unadjusted)
1H20 2H20 1H21up 8bps down 4bps up 28bps
By brand (unadjusted)
4. In-home care Virtual hospital beds more than 300 by end of FY227
30 June 20 31 Dec 20 30 June 22
259 beds 384 beds Target >300 beds
31 December 2020
4,275 Medibank customers serviced by 322 beds
Medibank customersTotal
1 Employee engagement is measured on an annual basis with results available in 4Q21. Employee engagement in FY20 was 84%2 Based on number of policyholders that consent to contact for marketing purposes, some exclusions may apply. Excludes new joins and customer lapses over the period3 Includes the number of customers who have downloaded Live Better and enrolled for rewards plus Live Better at Home interactions4 Includes Health Concierge, 24/7 Support, CareComplete, Medibank at Home, Better Knee, Better Me, Heart Health at Home and other new program interactions
5 FY22 target for health engagement and Health Assist interactions to be reviewed at FY21 results6 Excluding the impact of policyholder suspensions due to COVID-19 financial hardship7 In-home care milestone to be reviewed at FY21 results 8 Includes the $30m operating profit of Garrison
1H20 1H21 FY22 targetEducation: Health engagement interactions c. 1.1m c. 1.7m >2m5
Prevention: Live Better engaged customers3 c. 73k c. 380k >1mSupport: Health Assist interactions4 c. 56k c. 91k >150k5
5. Medibank HealthBy FY22 organically replace the reported FY18 $30m operating profit of Garrison
Medibank Health segment operating profit
6. ProductivityFY21 productivity target of $20m and additional $30m during FY22-FY23
Medibank +1.3% / +17.6kahm +7.5% / +31.4kU
pdat
ed
FY18 (baseline)8 FY19 FY20 1H21
$47.3m $22.1m $27.6m $18.8m
1H21 FY21 FY22 – FY23
On track Target $20m Target $30m
Productivity delivered
Customer advocacy: Service NPS (average) Employee advocacy
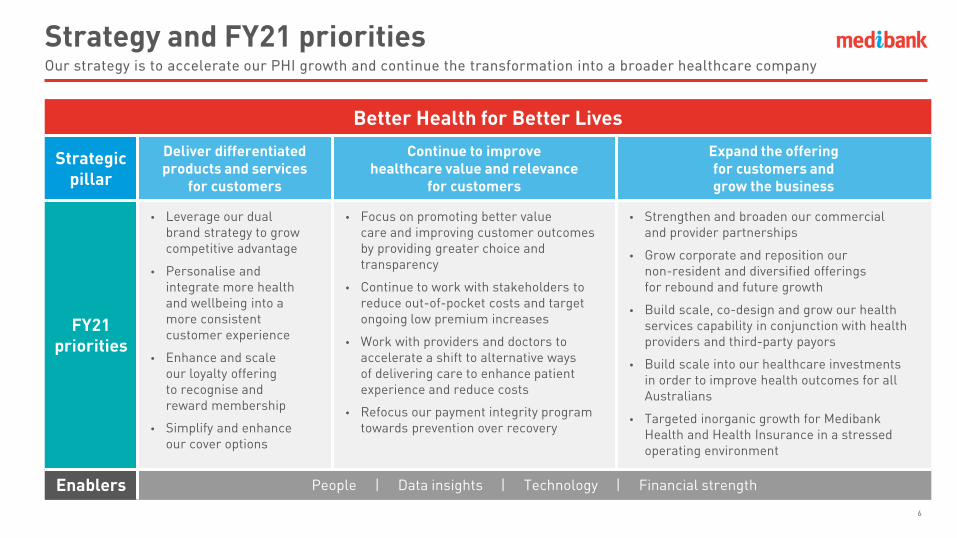
Our strategy is to accelerate our PHI growth and continue the transformation into a broader healthcare company
Better Health for Better Lives
Strategicpillar
Deliver differentiatedproducts and services
for customers
Continue to improvehealthcare value and relevance
for customers
Expand the offeringfor customers andgrow the business
FY21priorities
• Leverage our dual brand strategy to grow competitive advantage
• Personalise and integrate more health and wellbeing into a more consistent customer experience
• Enhance and scale our loyalty offering to recognise and reward membership
• Simplify and enhance our cover options
• Focus on promoting better value care and improving customer outcomes by providing greater choice and transparency
• Continue to work with stakeholders to reduce out-of-pocket costs and target ongoing low premium increases
• Work with providers and doctors to accelerate a shift to alternative ways of delivering care to enhance patient experience and reduce costs
• Refocus our payment integrity program towards prevention over recovery
• Strengthen and broaden our commercial and provider partnerships
• Grow corporate and reposition our non-resident and diversified offerings for rebound and future growth
• Build scale, co-design and grow our health services capability in conjunction with health providers and third-party payors
• Build scale into our healthcare investments in order to improve health outcomes for all Australians
• Targeted inorganic growth for Medibank Health and Health Insurance in a stressed operating environment
Enablers People | Data insights | Technology | Financial strength
Strategy and FY21 priorities
6

1,806.6
1,824.8
1,864.61,872.4
1,863.7
+6.7+12.2
+3.6
+11.5
+27.6
+4.2-6.1
-2.6
Policyholders as at 31 January 2021
Net 1H21 policyholder growth
Policyholders suspended as at 31 January 2021
Net policyholder growth January 2021
+2.6%
+2.2%Medibank
ahm
Policyholders as at 30 June 2020
Policyholders suspended as at
30 June 2020
YTD resident policyholder growth (‘000, as at 31 January 2021)
Our dual brand strategy is workingTop line growth gaining momentum
7
Customer growth reflects the strength of our brands and proposition differentiation, driving significant improvement in retention and advocacy
• Renewed focus on health in the community, pressure on the public system, low premium increases, and returning Australians are driving the PHI industry hospital participation turnaround (up 26bps to 43.86% over the last 6 months)
• Medibank and ahm brands are positioned to appeal to all customer segments with new to industry share of joins moderately higher in 1H21 vs 1H20
• Strong growth in digital acquisitions (accounted for 32% of joins compared to 22% in 1H20) and engagement, due to changes in customer behaviour and investment focus
• Significant improvement in retention:– As we continue to apply learnings from Medibank programs into ahm– Brand strength driving growth in diversified products as we expand and scale the offerings – supporting retention in PHI– Continued up-take of health prevention offerings through Live Better, health promotions and health navigation are having a noticeable impact on customer retention
• Service quality continues to improve as reflected through the ongoing sharp uplift in Service NPS and Customer NPS, and PHIO complaints remaining well below our market share (21.4% in Sep 20 Quarter)

Enabling more choice in care
Clinical homecare• 5,599 patients used hospital in the home, Rehab in the Home or other
pilot programs in 1H21 (including 4,275 Medibank customers)– Significant uplift in demand for Rehab in the Home total joint
replacements following COVID-19-related elective surgery shutdown (particularly in VIC)
• Heart Health at Home offers personalised, telehealth-delivered cardiac rehabilitation services
• My Home Hospital (delivered by a Calvary-Medibank joint venture) provides acute in-home care to public patients in South Australia
Short stay / No Gap Joint Replacement Program• Short stay coverage in 6 regions
• Halved the number of bed days per episode for no gap joint replacement procedures with positive patient experiences and feedback
Virtual health• c. 340k COVID-19-related telehealth interactions2
• c. 23k ancillary claims from telehealth services in 1H21
1 Includes the number of customers who have downloaded Live Better and enrolled for rewards plus Live Better at Home interactions2 As at 20 January 2021
Improving long-term value and relevance of private healthcareThrough more proactive preventative healthcare and enabling more choice outside of acute hospital settings
8
There is now a focus on scaling these initiatives and programs for customers
Supporting health and wellbeing through preventative healthcare
Health engagement• Over one million personalised and proactive health promotions in 1H21
Live Better• c. 380k interactions1 in 1H21• Live Better at Home program continues to engage customers and the community
Health propositions• Planning, Pregnancy and Parenting
• Healthy Mind by Medibank
• Healthier Weight, Healthier Me pilot to support remission in customers with type 2 diabetes
Health navigation• Doubled the number of hospital admissions supported by Health Concierge vs 1H20
CareComplete• Delivered through phone and video consultations during COVID-19
Myhealth• Investment in Myhealth recognises the vital role GPs have in enhancing
the health of their patients early in the system

Investment in Myhealth Medical Group
9
Myhealth 86 clinics across Australia
Delivers 2.5m patient consultations per year
More than 1,300 health professionals
Growth Clinical footprint expected (on average) to grow by more than 10 clinics per annum
FY21 EBITDA budget (incl. rent) of c. $21m (FY20: $17.0m, FY19: $11.1m, FY18: $7.4m)
Governance Five member Myhealth Board includes two Medibank representatives
Completion Expected by 31 March 2021
1 Medibank is acquiring 49% of the ordinary shares of Myhealth Medical Holdings Pty Ltd, which represents a 33.4% economic interest in the Myhealth Medical Group when taking into account the interests of management and the local GP shareholders in Myhealth Medical Holdings Pty Ltd and its subsidiaries. Under the terms of the share purchase agreement, if certain conditions are not met, Medibank may be required to acquire additional shares in MyhealthMedical Holdings Pty Ltd and pay additional consideration. However, even if this occurs Medibank will not have any financial and operational decision-making control over the Myhealth Medical Group or its board of directors
• Medibank announced on 5 February 2021 it would acquire a non-controlling 33.4% economic interest in Myhealth Medical Group (Myhealth)1 for a total expected consideration of $63m
• This investment:– Recognises the vital role of GPs in enhancing the health and
quality of life of their patients, helping to reduce high-cost hospital admissions
– Provides Myhealth GPs with access to additional capabilities to improve data analytics and information management
– Complements our existing partnerships with doctors across the health system
– Reflects our ongoing transformation into a broader healthcare company
– Utilises our marketing, digital and sales capabilities, alongside our strong consumer DNA
• GPs will retain full clinical autonomy with patients continuing to be treated equitably. No clinical priority will be given to Medibank or any other private health insurance customer
• Fully funded from existing cash resources
• Expected to be immediately EPS accretive

New products and services
• Expansion of diversified product range including: – ahm car and home insurance products
launched in January 2021– Additional COVID-19 benefits through
Medibank domestic travel insurance
• Expansion of mental health propositions including Healthy Mind by Medibank, 24/7 mental health support via phone and webchat for customers, and programs aimed at preventing hospital readmissions
• Digital triage will utilise technology to promote proactive health and wellbeing approaches which are tailored to our customers, enabling a smoother and more connected customer journey
A return to growth in FY21
10
Future growth will be driven by strengthening our competitive advantage in PHI, offering new products, and leveraging our strategic partnerships and investments
Accelerating growth and scale in PHI
• Continue to improve the consistency of experience for our customers
• Build on our brand strength with a dual brand strategy that delivers flexibility, broad customer coverage and price competitiveness
• Continue to apply acquisition and retention learnings between both brands
• Leverage investment in technology to drive more meaningful digital engagement and data insights
• Maintain focus on customer health and wellbeing through embedding health promotions, proactive preventative care and broadening choice
Partnerships and investments
• In advanced discussions with several well-known partners to expand our short stay, no gap offering across additional sites, as well as establishing pilots for new procedures
• Initial $8.8m investment in East Sydney Private Hospital helps fund investment required to scale up its short stay model of care
• Medibank’s investment in Myhealthenables its clinical footprint expansion and access to additional capabilities to support GPs to improve patient health, which helps reduce high cost hospital admissions or readmissions

Financial resultsMark Rogers – Chief Financial Officer

Group financial summary
Six months ended 31 Dec ($m) 1H20 1H21 ChangeGroup revenue from external customers1 3,421.5 3,442.2 0.6%Health Insurance operating profit 224.2 254.6 13.6%Medibank Health operating profit1 13.3 18.8 41.4%Segment operating profit 237.5 273.4 15.1%Corporate overheads (18.7) (18.2) (2.7%)Group operating profit – continuing operations 218.8 255.2 16.6%Net investment income 38.5 71.8 86.5%Amortisation of intangibles (4.5) (3.4) (24.4%)Other income / (expenses) 1.8 (1.7) n.m.Profit before tax 254.6 321.9 26.4%Income tax expense (76.0) (95.5) 25.7%NPAT - continuing operations 178.6 226.4 26.8%Effective tax rate2 29.9% 29.7% (20bps)EPS (cents)2 6.5 8.2 27.3%Underlying NPAT3 179.4 203.4 13.4%Underlying EPS (cents)3 6.5 7.4 13.4%Dividend per share (cents) 5.70 5.80 1.8%Dividend payout ratio3 88% 79% (10.2%)
12
• Profit before tax up 26.4% to $321.9m
• Other income / (expenses):– One-off $3.3m AASB16 impact
in 1H20– Expect c. $3m of M&A costs in 2H21
• Lower corporate costs reflects ongoing tight expense management
• Investment income up 86.5% to $71.8m
• Amortisation charge reduced as intangibles balances progressively run off
• EPS:– Reported EPS up 27.3% to 8.2 cps– Underlying EPS up 13.4% to 7.4cps
1 Excludes discontinued operations2 Calculated on total operations3 Underlying NPAT adjusted to normalise growth asset returns to historical long-term expectations and credit spread movements. Dividend payout ratio based on Underlying NPAT

• COVID-19 net claims expense impact of $99m in 1H21:– 1H21 claims $112m lower than pre-COVID expectations– Offset by $13m increase in COVID-19 deferred claims liability
• COVID-19 deferred claims liability of $310m at 31 December 2020: – Hospital liability up $67m:
– Change in hospital deferral assumption to 85% from 100%– $102m of largely Victorian deferred hospital claims in 1H21
– Ancillary liability reduction of $54m:– Medibank limit reset on 31 December 2020– 1H21 claims $14m above our pre-COVID expectation
$310m balance sheet liability for deferred COVID-19 claims
13
• Customer relief measures reduced revenue by $109m in 1H21
• Impact to revenue not expected to be material in 2H21
• Net policies suspended reduced from 18.2k at 30 June 2020 to 9.0k at 31 December 2020
• Expect majority of remaining suspensions to reactivate
Lower / (higher) than expected claims 126 (14) 112Liability (increase) / decrease (67) 54 (13)COVID-19 claims expense impacts 59 40 99
COVID-19 impacts
Policyholders
PHI revenue
PHI claims
Overseas PHI & Medibank Health
Customer relief impact ($m) 2H20 1H21 Total
6-mth waiver of the 1 April 20 premium increase 65 92 157
Customer suspensions 15 17 32
Total customer relief impact 80 109 189
• No material impact in 1H21
1 Hospital movement includes prior-year provision release
Six months ended 31 Dec 2020 ($m) Hospital Ancillary Total
30 June – COVID-19 claims liability 234 63 297Hospital deferral assumption to 85% (35) - (35)Current period deferral / (liability release)1 102 (54) 4831 Dec – COVID-19 claims liability 301 9 310

COVID-19 impacts – claims recoveryPrivate hospital claims paid in non-Victorian states has been mixed so far
1 Private hospital services incurred by Medibank Group in the 5 months to November 2020 and 2019 (excluding prostheses and medical)2 Based off industry standard Diagnosis Related Groups (DRGs). Surgical categorisation involves the use of an operating room3 Total growth includes a portion of other claims not yet categorised
14
2019 composition:• Private hospital claims comprised1:
– 34% in Victoria and 66% in non-Victorian states
– c. 60% surgical and c. 40% non-surgical2
Indicative private hospital claims insights:• Total:
– Victorian claims down 15%, reflecting impact of more than 4-month lockdown
– Non-Victorian claims up 2%, with surgical claims growth offset by reduction in non-surgical claims
• Surgical:– Victorian claims decreased by 11% though showed signs of picking up in
October and November 20– Non-Victorian claims up 7% with same day claims showing stronger
rebound than overnight claims
• Non-surgical:– Victorian claims reduced by 21% – Non-Victorian claims down 14% with notable declines across rehab,
psych and respiratory claims
• Softness in rehab, respiratory and psych categories supports change in hospital deferral assumption
Private hospital claims – YTD Nov 20 $ growth vs pcp1
Private Hospital Non-Surgical claims – YTD Nov 20 $ growth vs pcp1
-8%
-22%
-41%
-9%-14%-13%
-37%
-56%
-12%
-21%
Psych Rehab Respiratory Other TotalNon-Surgical
Other States Victoria
7%
-14%
2%
-11%
-21%
-15%
Surgical Non-Surgical Total
Other States Victoria
3

Health Insurance resultOperating performance reflects policyholder growth and benefits of our productivity agenda
15
Six months ended 31 Dec ($m) 1H20 1H21 Change
Premium revenue 3,315.5 3,324.5 0.3%Claims expense (2,851.6) (2,801.3) (1.8%)Risk equalisation 8.4 (17.8) n.m.
Net claims expense (including risk equalisation) (2,843.2) (2,819.1) (0.8%)Gross profit 472.3 505.4 7.0%Management expenses (248.1) (250.8) 1.1%Operating profit 224.2 254.6 13.6%Gross margin1 14.2% 15.2% 100bpsMER1 7.5% 7.5% -Operating margin1 6.8% 7.7% 90bps
COVID Adj.2 Change vs 1H20
3,433.9 3.6%
(2,918.1) 2.6%515.8 9.2%
(250.8) 1.1%265.0 18.2%
15.0% 80bps7.3% (20bps)7.7% 90bps
Adjusted for claims provision impacts
Six months ended 31 Dec ($m) 1H20 1H21 Change
Gross profit 472.3 505.4 7.0%Under / (over) movement on central provision estimate 26.1 - n.m.Adjusted gross profit 498.4 505.4 1.4%Adjusted gross margin 15.0% 15.2% 20bpsAdjusted operating margin 7.5% 7.7% 20bps
COVID Adj.2 Change vs 1H20
515.8 9.2%- n.m.
515.8 3.5%15.0% -7.7% 20bps
1 Includes Australian residents, OSHC and OVHC. The gross margin for Australian residents only was 13.8% in 1H20 and 14.9% in 1H21, the MER for Australian residents only was 7.3% in 1H20 and 7.5% in 1H21, and the operating margin for Australian residents only was 6.5% in 1H20 and 7.5% in 1H21
2 Adjusted for the impact of customer relief measures +$109.4m and hospital and ancillary claims savings -$99.0m as a result of COVID-19

Health Insurance – policyholdersStronger resident policyholder growth of 2.6% in the last 12 months
16
1 Consistent with reported industry data, policyholder numbers only include resident business whereas total policy units include both resident and non-resident policyholders (i.e. OSHC and OVHC)2 Adjusted for suspensions and reactivations occurring as a result of COVID-193 Consolidated lapse and acquisition rates exclude transfers of policyholders between ahm and Medibank at a combined brand level. Figures at brand level include these transfers. Lapse and acquisition rates
are based on the average of the opening and closing balances for the period 4 Refer to glossary for definition of policy units. Policy units include both resident and non-resident business (i.e. OSHC and OVHC). Based on an average of the month-end balances over the reporting period
(2.01%)(1.70%)
(1.15%)
(0.83%)
(2.5%)
(2.0%)
(1.5%)
(1.0%)
(0.5%)
-1H19 1H20 2H20 1H21
PHI product mix & downgrading2
Six months ended 31 Dec ($m) 1H20 1H21 Change
Policyholders1 (thousand):Opening balance 1,796.0 1,806.6 0.6%Acquisitions 98.3 102.6 4.4%Lapses (86.6) (62.8) (27.5%)Net suspensions / reactivations - 9.2 n.m.Closing balance 1,807.7 1,855.6 2.6%- Medibank 1,401.5 1,405.8 0.3%- ahm 406.2 449.8 10.7%
Acquisition rate3 5.5% 5.6% 10bps- Medibank 4.1% 4.1% -- ahm 11.3% 11.3% -
Lapse rate3 4.8% 3.4% (140bps)- Medibank 4.5% 3.3% (120bps)- ahm 7.2% 5.0% (220bps)
Policyholder growth 0.7% 2.7% 200bps
Total policy units1,4 (thousand) Closing balance 4,709.1 4,761.6 1.1%Average balance 4.711.1 4,736.5 0.5%
Annualised average revenue per policy unit1,4 ($) 1,407.5 1,403.8 (0.3%)
COVID Adj.2 Change vs 1H20
1,824.8 1.6%102.6 4.4%(62.8) (27.5%)
- -1,864.6 3.1%1,411.9 0.7%
452.7 11.4%
2.2% 150bps
4,781.7 1.5%4,763.1 1.1%
1,441.9 2.4%
Target downgrading of c.100bps going forward

Health Insurance – claimsUnderlying claims growth per policy unit of 2.6%
17
Six months ended 31 Dec ($m) 1H20 1H21 Change
Claims expense (2,851.6) (2,801.3) (1.8%)Risk equalisation 8.4 (17.8) n.m.Net claims expense (including risk equalisation) (2,843.2) (2,819.1) (0.8%)- Hospital (2,160.3) (2,145.2) (0.7%)- Extras (682.9) (673.9) (1.3%)Annualised average net claims expense per policy unit1 ($) (1,207.0) (1,190.4) (1.4%)Resident hospital utilisation growth2 0.1%Resident extras utilisation growth2 2.8%
1 Refer to glossary for definition of policy units. Policy units include both resident and non-resident business (i.e. OSHC and OVHC). Based on an average of the month-end balances over the reporting period2 Estimated hospital utilisation is defined as the number of hospital admissions per hospital policy unit and includes a provision for IBNR and COVID-19. Actual hospital utilisation for 1H20 was 0.1%
compared to the reported estimate of 1.1% as at 31 December 2019. Actual extras utilisation for 1H20 was 2.8% compared to the reported estimate of 3.3% as at 31 December 2019. Estimated utilisation differs from actual utilisation largely as a result of the claims provision impacts
3 Adjusted for the impact of hospital and ancillary claims savings of $99.0m as a result of COVID-19
COVID Adj.3 Change vs 1H20
(2,900.3) 1.7%
(17.8) n.m.
(2,918.1) 2.6%(2,204.2) 2.0%
(713.9) 4.5%(1,225.3) 1.5%
(0.1%) (20bps)
0.7% (210bps)
Change per PSEU adjusted
for COVID-19 and provision
impacts
2.5%
3.1%
2.6%
• Underlying claims growth of 2.6%:– Adjusted for provision movements and COVID-19 impacts– Broadly in line with 2H20
• Underlying hospital claims growth of 2.5%:– Includes modest benefit of prostheses price reductions from 1 February 20
• Underlying extras claims growth of 3.1%:– Reduced following investment in Members’ Choice Advantage network in
the prior period
• Net claims expense down 0.8%:– 1.8% decline in gross claims– Includes $99.0m reduction in claims expense due to COVID-19– COVID-19 adjusted net claims growth of 2.6%
• Risk equalisation payment of $17.8m vs $8.4m receipt in 1H20:– Continued lower than industry claims growth– Impact of lower claims paid in Medibank brand expected to
unwind with increased claims activity– Expect to be a net payer going forward

$2,160.3m
$2,145.2m
$682.9m $673.9m
HY20 HY21
Hospital Extras
Net claims expense (including risk equalisation)
Health Insurance – claimsClaims growth impacted by COVID-19 restrictions
18
$2,843.2m $2,819.1m
-1.3%
-0.7%
Indicative composition & movement in dollar value1 vs. 1H20
53%
20%
7%
6%
6%8%
Dental
Optical
Physiotherapy
Chiropractic
Alternative therapies
Other modalities(including Ambulance)
Extras
62%14%
13%
6%
2% 3%
Private hospitals
Medical
Prostheses
Public hospitals
Other
Overseas
Hospital
$ value movement
-1%
-1%
-2%
+1%
-1%
-7%
+1%
+2%
n.m.
-1%
-12%
+6%1 Includes movement in COVID-19 liability of ($54m) for Extras and $67m for Hospital
1H20 1H21

Health Insurance – management expensesContinued discipline on costs resulted in a 1.1% increase in management expenses and MER of 7.5%
19
Six months ended 31 Dec ($m) 1H20 1H21 Change
Premium revenue 3,315.5 3,324.5 0.3%Management expenses (248.1) (250.8) 1.1%- Depreciation and amortisation (21.1) (21.2) 0.5%- DAC amortisation (19.6) (19.5) (0.5%)- Operating expenses1 (207.4) (210.1) 1.3%MER 7.5% 7.5% -
COVID Adj. 2 Change
3,433.9 3.6%(250.8) 1.1%
7.3% (20bps)
• Management expenses up 1.1% to $250.8m:– Flat non-cash costs– Operating expenses up 1.3%
• Operating expenses up $2.7m to $210.1m:– Underlying cost inflation of c. 2.0%– Increase in incentive payments versus 1H20– c. $10m of productivity savings
• Productivity agenda:– On track to deliver $20m in FY21– Savings from business simplification, technology modernisation
and continual process improvement– Will assess potential for additional productivity opportunities,
including from COVID-19 experience – Expect to provide update at FY21 results
• Expect FY21 management expenses of c. $530m:– Reflects seasonality of management expenses towards 2H21
1 Operating expenses include right-of-use depreciation of $10.7m (1H20: $10.6m)2 Adjusted for the impact of customer relief measures +$109.4m as a result of COVID-19

Medibank Health resultResult reflects period of growth and increasing take up of in-home care
20
• Strong revenue growth of 13.2%, reflecting:– Increased demand for in-home care and telehealth services– Partly offset by soft demand in travel insurance
• Gross margin improved 80bps to 42.6% reflecting:– Improved operating efficiency– Increasing scale benefits
• $2.8m uplift in management expenses driven by:– Underlying cost inflation– Full period impact of FY20 investments in growth capacity
Six months ended 31 Dec ($m)Continuing businesses1
1H20 1H21 ChangeRevenue 128.6 145.6 13.2%Gross profit 53.7 62.0 15.5%Management expenses (40.4) (43.2) 6.9%Operating profit 13.3 18.8 41.4%Gross margin 41.8% 42.6% 80bpsMER 31.4% 29.7% (170bps)Operating margin 10.3% 12.9% 260bps
• Operating profit up 41.4% to $18.8m, including:– Benefit of strong revenue growth– Operating margin up 260bps to 12.9%
• Business is set up for growth in FY22 and beyond:– Focus on realising benefits of scale – On track to deliver on $30m organic operating profit growth
milestone– Interest in Myhealth will be equity accounted in this segment
and provides another strong avenue for growth
1 Including telehealth, in-home care, CareComplete, Health Concierge, Diversified Insurance, Loyalty and equity accounted investments

Investment portfolio & investment incomeInvestment income […]
21
• Growth portfolio investment income performance driven primarily by stronger equity market returns and a positive return in property
• Defensive portfolio investment income increased as credit spreads tightened, offsetting impact of the lower RBA cash rate
Investment income uplift driven by increased returns in growth and defensive assets
Six months ended 31 Dec ($m) 1H20 1H21 Change
Closing balance:Growth 443.4 449.5 1.4%Defensive1 1,951.5 2,272.5 16.4%Total balance1 2,394.9 2,722.0 13.7%
Average monthly balance:Growth 478.8 464.7 (2.9%)Defensive1 2,019.1 2,311.0 14.5%Total average monthly balance 2,497.9 2,775.7 11.1%
Net investment income:Growth 15.4 44.8 190.9%Defensive1 25.3 28.9 14.2%Investment expenses (2.2) (1.9) (13.6%)Total net investment income1,2 38.5 71.8 86.5%Total net investment income – underlying3 39.7 38.9 (2.0%)
RBA cash rate (average) 4
Underlying premium over RBA cash rate
• Asset allocation – Retained 20% growth 80% defensive allocation – Infrastructure portfolio allocation fully funded – Elevated cash balance of approximately $300m to
fund deferred claims liability
• Impact of lower RBA cash rate– Reduced interest income by c. $7m in 1H21 – Expect further impact of c. $1m in 2H21
• Underlying spread to benchmark of 1.30% (pro-rata) is above target range of 1.50% - 2.00% per annum due to historic low level for benchmark
1 Includes interest income and asset balances from non health fund investments, short-term operational cash sub portfolio and operational cash2 Reported and underlying returns are calculated using total average monthly balances
3 Adjusted to normalise all growth asset returns to long-term expectations and defensive asset returns for credit spread movements
4 RBA cash rate pro-rata for six months
Investment returns
1H20 1H21 Change
3.23% 9.64% 641bps1.25% 1.25% -
1.54% 2.59% 105bps1.59% 1.40% (19bps)0.44% 0.10% (34bps)1.15% 1.30% 15bps

Capital & dividendOur capital position reflects strong capital generation and disciplined capital management
22
1 Calculated as required Health Insurance related capital post dividends divided by the last 12 months’ Health Insurance premium revenue inflated by the growth rate in Health Insurance premium revenue over the same 12-month period2 Policies that include a product bonus receive an entitlement every 1 January to spend on otherwise uncovered expenses. The allowance is booked on 1 January each year 3 Payment Date for interim ordinary dividend: 25 March 2021 (Ex-dividend Date 03 March 2021, Record Date 04 March 2021)
Period ended ($m) 31 Dec 2019 30 Jun 2020 31 Dec 2020
Total equity 1,837.0 1,813.9 1,864.6
Less: Intangible and illiquid assets (491.3) (476.5) (467.9)
Total tangible and liquid assets 1,345.7 1,337.4 1,396.7
Determined but unpaid ordinary dividend (157.0) (173.5) (159.7)
Cost of product bonus additions2 (24.2) (10.5) (22.7)
Total tangible eligible capital 1,164.5 1,153.4 1,214.3
Required capital
- Health Insurance 872.8 873.2 908.6
- Other 89.5 91.8 100.5
Unallocated capital 202.2 188.4 205.2
Health insurance capital (%)1 13.0% 13.2% 13.0%
• Health Insurance capital:– At top end of 11% to 13% target range1
– Increase in required capital due to revenue growth
• Other required capital increased largely due to investment in East Sydney Private Hospital
• Strong capital position:– Unallocated capital of $205.2m (~$142.2m post
Myhealth investment)– Well placed to implement new APRA capital standard
from 1 July 2023– Potential for subordinated debt issuance– Provides ability to:
– Fund organic and inorganic growth– Consider future capital management activities
• Dividend:– Interim dividend of 5.80 cents per share, fully franked– 79% payout ratio of Underlying NPAT– Expect to pay towards top end of target payout ratio
range of 75% - 85% of Underlying NPAT in FY21
Dividend3 31 Dec 2019 30 Jun 2020 31 Dec 2020
Dividend per share (cents) 5.7 6.3 5.8
Payout ratio 88% 93% 79%

Key success factorsWe remain focused on the execution of key success factors
23
Business set to operate in continued lower rate rise environment
Maintain policyholder growth trajectory
• Leverage dual brand strength
• Continued focus on retention
• Prepared to invest for growth
Maintain market leading claims management capability
• Hospital contracting
• Payment integrity innovation
• Allocate capital to preventative health and alternative care settings
Further improve management expense ratio
• Productivity agenda
• Increasing scale benefits
• Provides capacity to invest in growth
Strong capital position to support growth
• Organic growth
• Inorganic growth– Opportunities to expand
Medibank Health– Well positioned for potential
PHI consolidation

ConclusionCraig Drummond – Chief Executive Officer

Customer driven choice
Proactive preventative
healthcare
Virtual health
New care settings
Clinical homecare
The short-term impacts of COVID-19 on the Australian healthcare system are significant
• Large reduction in medical and inpatient rehab admissions to hospital, however wait times for elective surgery in the public system continue to rise meaningfully
• COVID-19 accelerated / embedded the adoption and use of alternative ways to deliver healthcare including telehealth and in-home care– 4 in 5 people surveyed would consider receiving care at home,
if clinically appropriate, instead of in hospital since the onset of COVID-191
• Increasing demand for mental health support – which will have longer-term implications and likely see market solutions evolve
• Specialists rapidly understanding the out-of-pocket cost problem and coming to us to be part of the solution
The future will see more prominent digital delivery of physical and mental wellbeing promotion, more healthcare choice for consumers at an affordable price and a relentless focus on system waste and cost reduction
This can be done through:
• More focus on proactive preventative healthcare and primary care to keep pressure off the downstream health system
• Improving accessibility and customer experience through virtual health including services such as digital concierge, triage and telehealth
• More extensive use of clinical homecare so that patients can substitute hospital treatment where appropriate
• Expanding new care settings such as short stay, as clinically appropriate
COVID-19 has driven meaningful innovation through the health system – more is needed
251 Data from Medibank survey of 1,353 Australians (April 2020 – January 2021) conducted by Pureprofile

To deliver more value
• Making home and community-based care more sustainable through private health insurance, commencing with mental health and general rehabilitation services
• More virtual and alternative healthcare delivery models
Future reform must remain customer focused
26
Centred on building participation, improving affordability and delivering more value, while driving broader system reform for mental health
To build participation To improve affordability
• Potential changes to incentives for PHI uptake, including LHC changes and an increase to the MLS
• Reforms to make PHI more relevant to all Australians, including supporting primary care and out of hospital services
• Enable effective implementation of Prostheses List reform to potentially deliver an additional $500m saving to all PHI customers, with expected implementation in early 2022
• Restore the PHI rebate
(39)(56)
(77)
(38)
11
(12)
(31)
(24)
14
(20)
(19)
(7)
9 68 67 62 60
69
-150
-100
-50
0
50
100
150
Dec-16 Dec-17 Dec-18 Dec-19 Dec-20
Growth in hospital lives covered (‘000)1
– encouraging trend in participation
Under 30 30-4950-69 Over 70Overall growth
To drive broader system reform for mental health
• Focus on expansion of early intervention and prevention
• Improve integration of services across health and social services for serious mental health conditions
• Stepped care approach within the private sector and reduced reliance on hospital care as the sole solution
Future reforms
1 Source: APRA Quarterly Private Health Insurance Statistics
(10)
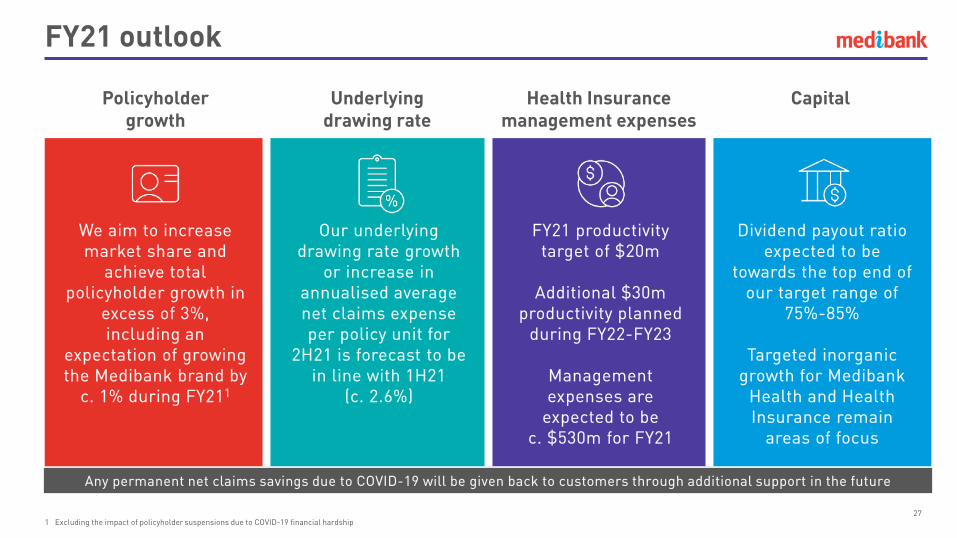
FY21 outlook
27
Policyholdergrowth
Underlyingdrawing rate
Health Insurance management expenses
Capital
We aim to increase market share and
achieve total policyholder growth in
excess of 3%, including an
expectation of growing the Medibank brand by
c. 1% during FY211
Our underlying drawing rate growth
or increase in annualised average net claims expense per policy unit for
2H21 is forecast to be in line with 1H21
(c. 2.6%)
FY21 productivity target of $20m
Additional $30m productivity planned
during FY22-FY23
Management expenses are
expected to be c. $530m for FY21
Dividend payout ratio expected to be
towards the top end of our target range of
75%-85%
Targeted inorganic growth for Medibank
Health and Health Insurance remain
areas of focus
1 Excluding the impact of policyholder suspensions due to COVID-19 financial hardship
Any permanent net claims savings due to COVID-19 will be given back to customers through additional support in the future

Appendix

Reconciliation of Group operating profit and Underlying NPAT
29
($m) 1H20 1H21 ChangeGroup operating profit – continuing operations 218.8 255.2 16.6%Operating loss / profit – discontinued operations (1.0) - n.m.Group operating profit – total operations 217.8 255.2 17.2%
Underlying NPAT
Group operating profit – total operations
($m) 2H19 FY19 1H20 2H20 FY20 1H21
NPAT – continuing operations 241.4 437.7 178.6 137.0 315.6 226.4Normalisation for growth asset returns (28.6) (7.9) 1.2 42.0 43.2 (13.2)Normalisation for defensive asset returns –credit spread movement
(7.3) (2.9) (0.4) 8.9 8.5 (9.8)
Underlying NPAT – continuing operations 205.5 426.9 179.4 187.9 367.3 203.4Dividend payout ratio1 95% 80% 88% 92% 90% 79%
1 Calculated on Underlying NPAT – total operations. In 1H19, FY19 and 1H20 there were discontinued operations balances. NPAT – total operations 1H19: $207.7m, FY19: $458.7m, 1H20: $177.9m

Group financial summary – half by half
30
Change
($m) 1H20 2H20 1H21 1H21 vs 1H20
1H21 vs 2H20
Group revenue from external customers1 3,421.5 3,348.1 3,442.2 0.6% 2.8%Health Insurance operating profit 224.2 246.4 254.6 13.6% 3.3%Medibank Health operating profit1 13.3 14.5 18.8 41.4% 29.7%Segment operating profit 237.5 260.9 273.4 15.1% 4.8%Corporate overheads (18.7) (18.7) (18.2) (2.7%) (2.7%)Group operating profit – continuing operations
218.8 242.2 255.2 16.6% 5.4%
Net investment income 38.5 (36.1) 71.8 86.5% n.m.Amortisation of intangibles (4.5) (4.5) (3.4) (24.4%) (24.4%)Other income / (expenses) 1.8 (6.0) (1.7) n.m. (71.7%)Profit before tax 254.6 195.6 321.9 26.4% 64.6%Income tax expense (76.0) (58.6) (95.5) 25.7% 63.0%NPAT – continuing operations 178.6 137.0 226.4 26.8% 65.3%EPS (cents) 2 6.5 5.0 8.2 27.3% 65.1%Underlying NPAT3 179.4 187.9 203.4 13.4% 8.2%Underlying EPS (cents)3 6.5 6.8 7.4 13.4% 8.2%Dividend per share (cents) 5.70 6.30 5.80 1.8% (7.9%)Dividend payout ratio3 88% 92% 79% (10.2%) (14.1%)1 Excludes discontinued operations2 Calculated on total operations3 Underlying NPAT adjusted to normalise growth asset returns to historical long-term expectations and credit spread movements. Dividend payout ratio based on Underlying NPAT

Health Insurance policyholders – half by half
31
Change
1H20 2H20 1H21 1H21 vs 1H20 1H21 vs 2H20Premium revenue ($m) 3,315.5 3,230.1 3,324.5 0.3% 2.9%Policyholders1 (thousand):
Opening balance 1,796.0 1,807.7 1,806.6 0.6% (0.1%)Acquisitions 98.3 97.5 102.6 4.4% 5.2%Lapses (86.6) (80.4) (62.8) (27.5%) (21.9%)Net suspensions / reactivations - (18.2) 9.2 n.m. n.m.Closing balance 1,807.7 1,806.6 1,855.6 2.6% 2.7%- Medibank 1,401.5 1,388.2 1,405.8 0.3% 1.3%- ahm 406.2 418.4 449.8 10.7% 7.5%
Acquisition rate2 5.5% 5.4% 5.6% 10bps 20bps- Medibank 4.1% 3.8% 4.1% - 30bps- ahm 11.3% 11.8% 11.3% - (50bps)
Lapse rate2 4.8% 4.4% 3.4% (140bps) (100bps)- Medibank 4.5% 4.0% 3.3% (120bps) (70bps)- ahm 7.2% 7.2% 5.0% (220bps) (220bps)
Policyholder growth 0.7% (0.1%) 2.7% 200bps 280bpsTotal policy units1,3 (thousand):
Closing balance 4,709.1 4,677.1 4,761.6 1.1% 1.8%Average balance 4,711.1 4,684.0 4,763.5 0.5% 1.7%
Annualised average revenue per policy unit1,3 ($) 1,407.5 1,379.2 1,403.8 (0.3%) 1.8%
1 Consistent with reported industry data, policyholder numbers only include resident business whereas total policy units include both resident and non-resident business (i.e. OSHC and OVHC)
2 Consolidated lapse and acquisition rates exclude transfers of policyholders between ahm and Medibank at a combined brand level. Figures at brand level include these transfers. Lapse and acquisition rates are based on the average of the opening and closing balances for the period
3 Refer to glossary for definition of policy units. Policy units include both resident and non-resident business (i.e. OSHC and OVHC). Based on an average of the month-end balances over the reporting period

Cash flow
32
Six months ended 31 Dec ($m) 1H20 1H21 Change
Profit before net investment income and income tax 215.1 250.1 35.0Changes in working capital (45.7) (20.4) 25.3Customer acquisition costs 0.6 0.1 (0.5)Changes in other operating assets and liabilities (176.2) (97.7) 78.5Depreciation and amortisation 42.1 41.6 (0.5)Net cash flows from operations 35.9 173.7 137.8Income tax (104.9) (139.3) (34.4)Capital expenditure (16.6) (16.2) 0.4(Purchase) / sale of equity accounted investments - (7.1) (7.1)Loan to equity accounted investments - (2.9) (2.9)Lease principal and interest payments (17.7) (18.3) (0.6)Net cash flows before investment related items and dividends
(103.3) (10.1) 93.2
Net realised investment income 14.1 5.4 (8.7)(Purchase) / sale of investments 141.3 (81.4) (222.7)Purchase of shares to settle share-based payment (3.8) (5.6) (1.8)Net cash flows before dividends 48.3 (91.7) (140.0)Dividends paid (272.6) (173.5) 99.1Net increase / (decrease) in cash and cash equivalents (224.3) (265.2) (40.9)Cash and cash equivalents at beginning of the period 656.5 871.4 214.9Cash and cash equivalents at end of the period 432.2 606.2 174.0
• Movement in working capital was due to timing of claims payments
• Change in other operating assets and liabilities driven by impact of COVID-19 deferred claims liability
• Capital expenditure continues to be below D&A
• Equity investments line comprises the investment in East Sydney Private Hospital and establishment of the My Home Hospital JV
• Purchase of investments reflects shift to floating-rate notes during the period

Investment portfolio
33
As at 31 December 2020 Balance ($m) Portfolio composition Target asset allocation
Australian equities 105.5 4.7% 5.0%
International equities 128.0 5.8% 6.0%
Property 165.4 7.5% 7.0%
Infrastructure 50.6 2.3% 2.0%
Growth 449.5 20.3% 20.0%
Fixed income1,2 1,207.6 54.7% 52.0%
Cash3 552.0 25.0% 28.0%
Defensive 1,759.6 79.7% 80.0%
Total fund (pre-STOC) 2,209.1 100.0% 100.0%
Short-term operational cash4 310.3
Total fund 2,519.4
Non health fund investments5 202.6
Total investment portfolio 2,722.0
1 Target asset allocation comprises floating rate notes and asset-backed investments 32.0% and other fixed income 20.0%. Average credit duration is approximately 2.3 years, average interest rate duration is approximately 0.9 years, and the average credit rating is ‘A’.
2 For investment portfolio purposes, fixed income comprises fixed income securities ($1,693.2m), less reclassified cash with maturities between 3-12 months ($199.8m), less non health fund fixed income securities ($123.5m), less short-term operational cash fixed income securities ($229.2m), plus cash allocated to the fixed income portfolio ($66.9m).
3 For investment portfolio purposes, cash comprises cash and cash equivalents ($606.2m) plus cash with maturities between 3-12 months ($199.8m), less non health fund investments ($79.1m), less short-term operational cash ($81.1m), less operational cash ($26.9m) less cash allocated to the fixed income portfolio ($66.9m).
4 Short-term operational cash (“STOC”) sub-portfolio of the fund’s investment portfolio consists of short dated defensive assets with the purpose of funding the COVID-19 claims liability. Given the short-term nature of this portfolio, it is not subject to the existing SAA, TAA framework
5 The fund’s strategic asset allocation does not apply to the non health fund investment portfolio

Glossary
34
Term Definition
1H Six months ended/ending 31 December of the relevant financial year
2H Six months ended/ending 30 June of the relevant financial year
APRA Australian Prudential Regulation Authority
bps Basis points (1.0% = 100 bps)
cps Cents per share
Customer NPS A measure of the likelihood of an existing customer to recommend the brand
DAC Deferred acquisition costs
Downgrading The difference between the average premium rate rise and revenue growth per policy unit
eNPS Employee Net Promoter Score. A measure of the likelihood of an employee to recommend the companys products and services
EBITDA Earnings before interest, tax, depreciation and amortisation
EPS Earnings per share
FY Financial year ended/ending 30 June
IBNR Incurred but not reported
IHPA Independent Hospital Pricing Authority
LHC Lifetime Health Cover
MER Management expense ratio
MLS Medicare levy surcharge
n.m. Not meaningful
NPAT Net profit after tax
NTI New to industry
OSHC Overseas students hospital cover
OVHC Overseas visitor health cover
Term Definition
PHI Private Health Insurance
PHIO Private Health Insurance Ombudsman
PolicyholderThe primary person who is insured under a private health insurance policy (other than in relation to overseas students or visitors), who is not a dependent child, and who is responsible for paying the premium
PSEUs or policy units
Policy Single Equivalent Units are used by Medibank as a standard measure of income units. They take into account the number of adults on a policy, and whether they have Hospital Cover or Extras Cover or both. For example, a household with two parents and three children, all of which had both Hospital and Extras Cover, would represent four policy units (2 adults x 2 types of Cover = 4; no premium payable in relation to children). This measure includes residents and non-resident policies and only adult insureds are typically counted in the calculation of PSEUs
SAA Strategic Asset Allocation. The long-term portfolio asset allocation that meets the expected risk and return objectives of the fund
Service NPS A measure of the likelihood of an existing customer to recommend the brand immediately following a service interaction
TAATactical Asset Allocation. The medium-term portfolio asset allocation that varies to the strategic asset allocation in order to help optimise risk-adjusted investment returns in light of the prevailing relative market pricing
UnderlyingNPAT
Underlying NPAT is calculated based on statutory NPAT – total operations adjusted for short-term outcomes that are expected to normalise over the medium to longer term, most notably in relation to the level of gains or losses from investments and movements in credit spreads, and for one-off items, especially those that are non-cash, such as asset impairments
Virtual hospital beds
The number of people receiving hospital substitute treatments by Medibank Health which is calculated for a given period as total days of hospital substitute treatments service / number of days in the period
Working capitalWorking capital comprises trade and other receivables, other assets, trade and other payables other than balances relating to customer acquisition costs and operating assets and liabilities