Embed Size (px)
Citation preview
Half Empty or Half Full? Staffing Trends inAcademic Libraries at U.S. ResearchUniversities, 2000–2008by Christopher StewartAvailable online 23 July 2010
This study is a quantitative analysis of FTEstaffing levels at academic libraries at 176
U.S. research universities between 2000 and2008. Results showed that overall staffinglevels at these libraries declined but that
the average number of professionallibrarian FTE positions modestly increased.Other professional staff positions increasedat a significantly higher rate than librarian
positions. In addition, a significantpercentage of libraries in the study showeda decrease in librarian FTE positions while
gaining other professional positions.Results of this study provide an empirical
reference point for organizationaltransformations occurring in academic
libraries and a starting point for furtherquantitative and qualitative inquiry.
Christopher Stewart, Dean of Libraries,Illinois Institute of Technology, 35 West 33rd Street,
Chicago, IL 60616-3793, USA<[email protected]>.
394 The Journal of Academic Librarianship, Volume 36, Number 5, pages
INTRODUCTIONPerhaps no enterprise in higher education has undergone suchdramatic shift over the past two decades as the academic library. Asexpectations of library users and parent institutions have changed, thelibrary organization has begun to reshape itself. The staffing landscapeis increasingly altered, not only for librarians, but also for otherprofessionals and full time staff working in academic libraries. Usingquantitative data from the U.S. Department of Education's NationalCenter for Education Statistics, this study will investigate staffinglevels at U.S. research university libraries from 2000 through 2008.
A recent alarm sounded in the library professionwarns of shortagesamong the ranks of academic librarians in the coming years. Accordingto data from the U.S. Department of Labor Bureau of Labor Statistics,two out of three librarians are aged 45 and older, and the professionwill see massive waves of retirements in the coming decade.1
Recruitment and retention are at the center of many discussions inthe literature and at professional conferences. Librarianship has evenbeen identified as a “best career” in the mainstream media.2 The 56American Library Association accredited graduate schools of libraryand information science produce approximately 5,000 new graduateseach year. It has been reported that academic libraries are and willcontinue to face seriousproblems in recruiting research librarians at alllevels.3 Other studies have suggested that, while projected growth inthe profession may well be modest, employment opportunities stilloutnumber job seekers.4 All this fuels the perception that librarianshipoffers ample opportunities for those entering the workforce.
Other data, however, suggest a different forecast for academiclibrary employment in the coming years. This outlook is informed byemerging hiring trends in academic libraries, including the growth inacademic library professional positions that do not require thetraditional credential for entry into the profession, the master'sdegree in library science (MLS). In his well-known article on “feral”professionals, James Neal5 outlines the growing trend amongacademic libraries to “hire an increasing number of individuals tofill professional librarian positions who do not have the master'sdegree in library science,” including positions previously held bylibrarians. It is likely that, at least to some degree, these new ranks ofprofessionals will “challenge the standards and practices of the libraryprofession.” Neal also remarks on the continuing trend of migratinglibrarian responsibilities to support staff. Walter describes a newecosystem in which academic libraries are looking “beyond theconfines of ‘our’ profession” to fill a wide range of new, existing, andemerging library professional positions as organizational prioritiesevolve6. The Council on Library and Information Resources' recentapprenticeship program that provides humanists Ph.Ds with oppor-tunities to prepare for academic library careers without having to earn
394–400
an MLS has been criticized as having the dire if unintendedconsequences of “hastening the replacement of academic librarianseducated in ALA-accredited programs.”7 The migration of subjectPh.Ds into academic library jobs has been documented before.Miller's study in the mid-1970s examined the “influx” of Ph.Ds intoacademic library positions due to the limited academic job marketthat marked that period.8 This influx was generally welcomed bylibrary employers and educators, and both considered job prospects(across a range of positions, including administrative positions) inthe academic library to be very good for subject Ph.Ds.9 At thattime, however, Ph.Ds wanting to enter academic library careerswere generally required to earn an MLS.
Subject Ph.Ds in the 1970s and CLIR's current initiative aside, thegrowing ranks of non-librarian professionals joining academiclibraries today are more likely to be performing professional supportroles that are not exclusive to the library environment. For example,information technology continues to create new efficiencies andorganizational imperatives that leave many libraries still struggling toadapt in an environment that requires more staff with sophisticatedtechnology skills.10 Information technology continues to be an area inwhich many professional-level positions outside of the MLS areoffered in the academic library.
These data, along with stagnant to slightly declining staff levelsoverall, supports a more sobering job outlook for new and in-careerlibrarians in the coming years. Zabel argues that, unlike a decade ago,academic libraries are more likely to address budget shortfalls byreducing and/or de-professionalizing staff rather than reducingcollections.11 A 2004 survey of graduate programs in library scienceas well as recent graduates shows slow salary growth and generalstagnancy in the academic library job market.12 Holt and Strock'sstudy describes the declining number of full-time MLS requiredpositions in academic libraries, along with the de-professionalizationof many entry-level positions and the tendency for libraries to fillprofessional positions with non-librarians. Holt and Strock alsosuggest that library schools, flush with rising enrollment in recentyears, are producing more graduates than there are jobs.13 In 2008,there were approximately 6,500 LIS graduates, and an unemploymentpost graduation rate of nearly 6%.14
A 2007 ARL report suggests that despite the looming waves ofretirements, the increasing demand for non-MLS professionals willresult in only modest demands for new librarians in the comingdecades.15
PURPOSE AND SIGNIFICANCE OF STUDYThe purpose of this study is to provide a basic quantitative analysis ofstaffing levels in libraries at U.S. research universities between 2000and 2008. This study attempts to determine whether levels of threemajor staff categories are increasing or decreasing and at whatbalance andmeasure. Overall FTE staffing levels are investigated alongwith staffing levels for librarians and other professional staff. As not allresearch universities are members of the Association of ResearchLibraries, this study will include both ARL and non-ARL libraries.Previous research has shown that a majority of academic librarians inthe United States work at doctoral institutions.16 There is a goodamount of descriptive information on research universities availablefrom the Carnegie Foundation for the Advancement of Teaching that,when combined with library data from the federal government, allowfor categorical organization of libraries by discrete criteria, and it ishoped a more focused, data-driven view of recent library staffingtrends. These resources will be the primary sources of data for thisstudy. For academic leadership, library administrators, and thoseworking in or about to enter the profession, an overview of theemployment picture may provide insight into the direction theacademic library organization is taking and, by extension, implica-tions for academic librarianship in the coming years. Quantitative data
on staffing levels over an extended period of time can provideempirical context to speculation about organizational shifts occurringin the academic library.
METHODS
This study will analyze data on library staffing trends in Americanresearch universities from 2000 through 2008. This information willhopefully provide a starting point for further research that focuses onspecific institutional categorizations and samples within the group(and beyond) of U.S. colleges and universities used in this paper. Forthe purposes of this study, however, basic statistical tools will be usedto analyze information from these libraries in order to make generalobservations on library staffing trends at U.S. research universities. Inaddition, the methods for organizing this information will provideinstructive examples for those that are interested in the use of tworecently updated resources, the Carnegie Foundation classificationsand the Department of Education's National Center for EducationStatistics Academic Libraries Survey. Used together, these areexcellent tools for researching the academic library.
Specifically, this study will examine library staffing levels between2000 and 2008 at research university cohorts categorized according toCarnegie Foundation for the Advancement of Teaching classifications.In 2005, the Carnegie Foundation for the Advancement of Teachingrevised its classification system for American higher educationinstitutions to “provide different lenses through which to view U.S.colleges and universities, offering researchers greater flexibility inmeeting their analytical needs”17 These revisions provide theresearcher with tools for comparing and grouping institutionsaccording to more descriptive criteria such as institution size andinstructional program. As part of these revisions, the original Carnegieclassification schemas were also updated to provide more detailed,expanded information for institutional categorization.
This study's population included all doctoral granting, researchinstitutions in two of the three primary Carnegie Foundationclassifications for research institutions: research universities withhigh research activity (RU/H) and research universities with very highresearch activity (RU/VH). Carnegie describes “research universities”to include “institutions that award at least 20 doctoral degrees peryear, excluding doctoral-level degrees that qualify recipients for entryinto professional practice, such as the JD, MD, PharmD, DPT, etc.”18
According to the Carnegie Foundation, the revised framework forclassifying institutions by research activity use a “multi-measure indexrather than the single measure of federal funding used in previouseditions” and “considers both aggregate and per-capita measures ofresearch activity.”19 The remaining institutions on the “DoctoralGranting” category are not rated at the high or very high researchlevels and also include several for-profit and/or online institutions.This group falls outside of the framework of this study. Because of theunique characteristics of the “high” and “very high” research activityinstitutions, this group of institutions was not considered a subset ofthe overall population of all U.S. colleges and universities for thepurposes of this study. Results from this study are intended to outlinelibrary staffing trends at the country's major research universities,where a large percentage of those in the academic library professionare employed, and should not be generalized beyond that population.Implications of the data from this study however, could providemeaningful starting points for conducting similar research andcomparing results from other distinct populations (e.g., 4-yearbaccalaureate colleges) within U.S. higher education.
The very high research activity group comprises most of thenation's premier doctoral granting institutions. A majority of theinstitutions in this group are members of the Association of ResearchLibraries. There are 91 institutions in the very high research category.The second group, high research activity universities, consists of 105institutions, including many mid-sized public and private STEM-
September 2010 395
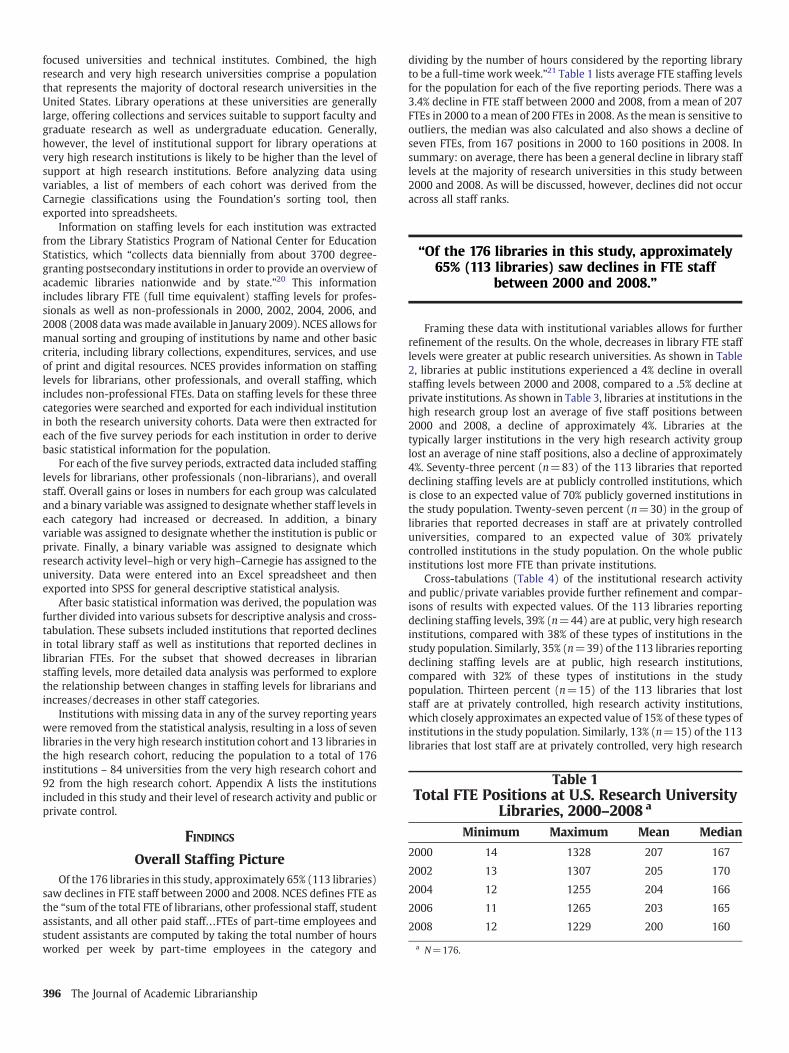
Table 1Total FTE Positions at U.S. Research University
Libraries, 2000–2008 a
Minimum Maximum Mean Median
2000 14 1328 207 167
2002 13 1307 205 170
2004 12 1255 204 166
2006 11 1265 203 165
2008 12 1229 200 160
a N=176.
focused universities and technical institutes. Combined, the highresearch and very high research universities comprise a populationthat represents the majority of doctoral research universities in theUnited States. Library operations at these universities are generallylarge, offering collections and services suitable to support faculty andgraduate research as well as undergraduate education. Generally,however, the level of institutional support for library operations atvery high research institutions is likely to be higher than the level ofsupport at high research institutions. Before analyzing data usingvariables, a list of members of each cohort was derived from theCarnegie classifications using the Foundation's sorting tool, thenexported into spreadsheets.
Information on staffing levels for each institution was extractedfrom the Library Statistics Program of National Center for EducationStatistics, which “collects data biennially from about 3700 degree-granting postsecondary institutions in order to provide an overview ofacademic libraries nationwide and by state.”20 This informationincludes library FTE (full time equivalent) staffing levels for profes-sionals as well as non-professionals in 2000, 2002, 2004, 2006, and2008 (2008 datawasmade available in January 2009). NCES allows formanual sorting and grouping of institutions by name and other basiccriteria, including library collections, expenditures, services, and useof print and digital resources. NCES provides information on staffinglevels for librarians, other professionals, and overall staffing, whichincludes non-professional FTEs. Data on staffing levels for these threecategories were searched and exported for each individual institutionin both the research university cohorts. Data were then extracted foreach of the five survey periods for each institution in order to derivebasic statistical information for the population.
For each of the five survey periods, extracted data included staffinglevels for librarians, other professionals (non-librarians), and overallstaff. Overall gains or loses in numbers for each group was calculatedand a binary variable was assigned to designate whether staff levels ineach category had increased or decreased. In addition, a binaryvariable was assigned to designate whether the institution is public orprivate. Finally, a binary variable was assigned to designate whichresearch activity level–high or very high–Carnegie has assigned to theuniversity. Data were entered into an Excel spreadsheet and thenexported into SPSS for general descriptive statistical analysis.
After basic statistical information was derived, the population wasfurther divided into various subsets for descriptive analysis and cross-tabulation. These subsets included institutions that reported declinesin total library staff as well as institutions that reported declines inlibrarian FTEs. For the subset that showed decreases in librarianstaffing levels, more detailed data analysis was performed to explorethe relationship between changes in staffing levels for librarians andincreases/decreases in other staff categories.
Institutions with missing data in any of the survey reporting yearswere removed from the statistical analysis, resulting in a loss of sevenlibraries in the very high research institution cohort and 13 libraries inthe high research cohort, reducing the population to a total of 176institutions – 84 universities from the very high research cohort and92 from the high research cohort. Appendix A lists the institutionsincluded in this study and their level of research activity and public orprivate control.
FINDINGSOverall Staffing Picture
Of the 176 libraries in this study, approximately 65% (113 libraries)saw declines in FTE staff between 2000 and 2008. NCES defines FTE asthe “sum of the total FTE of librarians, other professional staff, studentassistants, and all other paid staff…FTEs of part-time employees andstudent assistants are computed by taking the total number of hoursworked per week by part-time employees in the category and
396 The Journal of Academic Librarianship
dividing by the number of hours considered by the reporting libraryto be a full-time work week.”21 Table 1 lists average FTE staffing levelsfor the population for each of the five reporting periods. There was a3.4% decline in FTE staff between 2000 and 2008, from a mean of 207FTEs in 2000 to a mean of 200 FTEs in 2008. As themean is sensitive tooutliers, the median was also calculated and also shows a decline ofseven FTEs, from 167 positions in 2000 to 160 positions in 2008. Insummary: on average, there has been a general decline in library stafflevels at the majority of research universities in this study between2000 and 2008. As will be discussed, however, declines did not occuracross all staff ranks.
“Of the 176 libraries in this study, approximately65% (113 libraries) saw declines in FTE staff
between 2000 and 2008.”
Framing these data with institutional variables allows for furtherrefinement of the results. On the whole, decreases in library FTE stafflevels were greater at public research universities. As shown in Table2, libraries at public institutions experienced a 4% decline in overallstaffing levels between 2000 and 2008, compared to a .5% decline atprivate institutions. As shown in Table 3, libraries at institutions in thehigh research group lost an average of five staff positions between2000 and 2008, a decline of approximately 4%. Libraries at thetypically larger institutions in the very high research activity grouplost an average of nine staff positions, also a decline of approximately4%. Seventy-three percent (n=83) of the 113 libraries that reporteddeclining staffing levels are at publicly controlled institutions, whichis close to an expected value of 70% publicly governed institutions inthe study population. Twenty-seven percent (n=30) in the group oflibraries that reported decreases in staff are at privately controlleduniversities, compared to an expected value of 30% privatelycontrolled institutions in the study population. On the whole publicinstitutions lost more FTE than private institutions.
Cross-tabulations (Table 4) of the institutional research activityand public/private variables provide further refinement and compar-isons of results with expected values. Of the 113 libraries reportingdeclining staffing levels, 39% (n=44) are at public, very high researchinstitutions, compared with 38% of these types of institutions in thestudy population. Similarly, 35% (n=39) of the 113 libraries reportingdeclining staffing levels are at public, high research institutions,compared with 32% of these types of institutions in the studypopulation. Thirteen percent (n=15) of the 113 libraries that loststaff are at privately controlled, high research activity institutions,which closely approximates an expected value of 15% of these types ofinstitutions in the study population. Similarly, 13% (n=15) of the 113libraries that lost staff are at privately controlled, very high research
Table 3Average Number of Library FTE Staff Positionsand Research Level of University, 2000–2008
Level of Research Activity 2000 2002 2004 2006 2008
High research activityuniversities (N=92)
121 119 119 117 116
Very high research activityuniversities (N=84)
301 299 296 298 292
Table 4Library FTE Staffing Levels 2000–2008
Cross Tabulation
Level of Research Outputof University
Very High High Total
Public (N=123) Decreased staff 44 39 83
Increased staff 22 18 40
Table 2Average Number of Library FTE at Public and
Private Universities, 2000–2008
Public/Private Control 2000 2002 2004 2006 2008
Public (N=123) 203 202 199 198 194
Private (N=53) 215 212 214 217 214
Total 66 57 123
Private (N=53) Decreased staff 15 15 30
Increased staff 11 12 23
Total 26 27 53
Table 5
activity institutions, which approximates a 15% expected value basedon the number of these types of institutions in the study population. Ingeneral, based on expected values for the study population, librariesthat reported staff declines were fairly evenly distributed across theresearch activity cohorts as well as public/private control.
Overall Staffing Levels for Librarians and OtherProfessional Staff
While overall library staffing levels declined on average acrossthe population, the average number of librarian FTE positionsactually increased marginally. Between 2000 and 2008, the numberof FTE rose by 6%, from a mean of 50 librarian positions in 2000 toan average of 53 positions in 2008. The median increase was alsothree librarian FTE positions. As Table 5 illustrates, there was noincrease in the average number of librarian positions between 2002and 2006. Despite these modest increases in librarian FTE positionson average, a significant percentage of the population reporteddeclines in librarian staffing levels, which will be discussed later inthis paper.
While growth in the number of librarian positions was modest,growth in staffing levels for other (non-librarian) FTE professionalpositions rose significantly between 2000 and 2008, from an averageof 14 positions in 2000 to 18 positions in 2008, an increase ofapproximately 30%. The median increase in non-librarian FTEprofessional positions was even more pronounced, from 5 positionsin 2000 to 10 positions in 2008, an increase of 100% (Table 6).
Libraries that Decreased Librarian PositionsOf the 176 universities in the study, 44% (n=78) reported declines
in staffing levels of FTE librarians between 2000 and 2008. Put anotherway, when measured against the modest increases in librarian FTEsfor the whole, the number of librarians at nearly half of theseinstitutions actually decreased. For these libraries, the average declinein the number of librarian positions was 6 FTE librarians (see Table 7),twice that of the average number of positions gained when averagingall of the libraries in the study.
For representativeness in the overall population of high andvery high research level universities, institutions that saw declines inlibrarian staffing levels closely approximated expected values forthese Carnegie classifications as well as whether the institution ispublicly or privately controlled. Of the libraries that saw declines inlibrarian FTE positions, 58% are part of the high research universitycohort versus 42% in the very high research university cohort. These
Librarian FTE Positions at U.S. ResearchUniversity Libraries, 2000-2008 a
Minimum Maximum Mean Median
2000 4 387 50 39
2002 4 420 52 42
2004 4 434 52 41
2006 4 420 52 42
2008 4 417 53 42
a N=176.
September 2010 397
results approximate expected values based on the balance of theseinstitutions in the study population by 52% and 48% respectively. Thehigher number of librarian FTE positions lost in the very high researchcohort is likely proportional to institutional size: universities (andtheir libraries) in the very high research activity cohort are likely to besignificantly larger than those in the high research activity group(Table 8). When sorted by institutional public/private control, theaverage number of librarian position reductions is the same for bothpublic and private institutions. Expected values based on thepercentage of libraries in the subset of institutions that saw declinesin librarian positions closely mirror percentages of public and privateuniversities in the population (see Table 9). It is assumed that a cross-tabulation using research activity and public/private control for thesubset of libraries that saw declines in librarian FTEs would showclose proximity of results and expected values between the subset andthe population.
The final section of these findings focuses on the relationshipbetween declining librarian staff levels and changes in library stafflevels overall, as well as changes in staff levels for other academiclibrary professionals. Of the 78 universities that saw declininglibrarian FTE staff levels, 60 of these (77%) experienced accompanyingdeclines in overall FTE staff levels. Of these libraries, the average lossof librarian FTEs was five positions and a sobering 31 staff positionsoverall. The remaining 23% of universities that saw declines inlibrarian FTEs experienced gains in overall staff. Of these libraries, theloss in librarian FTEs was slightly higher than the loss of librarian FTEpositions at libraries that saw staff declines across the board. Overallstaff gains in this group of libraries were fairly robust: 24 FTEs, with anaverage decrease of 6 librarian FTEs (Table 10).
A final point of analysis for these results is an outline of therelationship between declining librarian FTEs and other professionalstaff. As shown in Table 11, the majority of libraries that saw declines
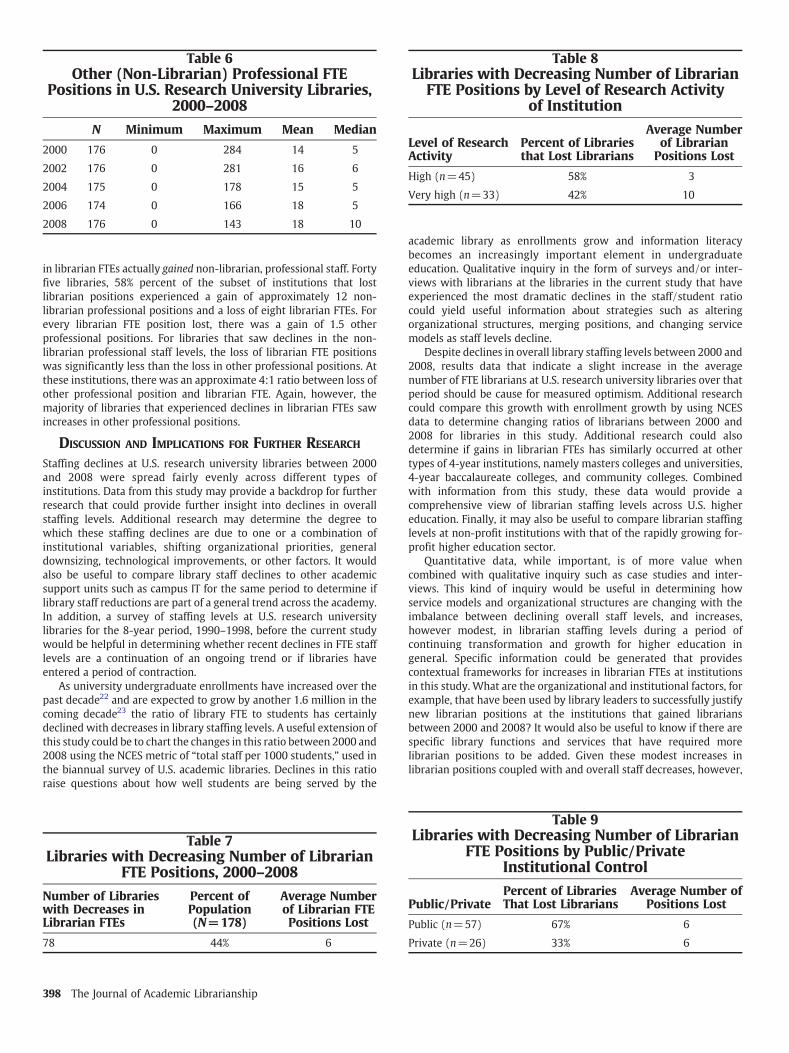
Table 7Libraries with Decreasing Number of Librarian
FTE Positions, 2000–2008
Number of Librarieswith Decreases inLibrarian FTEs
Percent ofPopulation(N=178)
Average Numberof Librarian FTEPositions Lost
78 44% 6
Table 8Libraries with Decreasing Number of LibrarianFTE Positions by Level of Research Activity
of Institution
Level of ResearchActivity
Percent of Librariesthat Lost Librarians
Average Numberof Librarian
Positions Lost
High (n=45) 58% 3
Very high (n=33) 42% 10
Table 6Other (Non-Librarian) Professional FTE
Positions in U.S. Research University Libraries,2000–2008
N Minimum Maximum Mean Median
2000 176 0 284 14 5
2002 176 0 281 16 6
2004 175 0 178 15 5
2006 174 0 166 18 5
2008 176 0 143 18 10
398 The Journal of Academic Librarianship
in librarian FTEs actually gained non-librarian, professional staff. Fortyfive libraries, 58% percent of the subset of institutions that lostlibrarian positions experienced a gain of approximately 12 non-librarian professional positions and a loss of eight librarian FTEs. Forevery librarian FTE position lost, there was a gain of 1.5 otherprofessional positions. For libraries that saw declines in the non-librarian professional staff levels, the loss of librarian FTE positionswas significantly less than the loss in other professional positions. Atthese institutions, there was an approximate 4:1 ratio between loss ofother professional position and librarian FTE. Again, however, themajority of libraries that experienced declines in librarian FTEs sawincreases in other professional positions.
DISCUSSION AND IMPLICATIONS FOR FURTHER RESEARCH
Staffing declines at U.S. research university libraries between 2000and 2008 were spread fairly evenly across different types ofinstitutions. Data from this study may provide a backdrop for furtherresearch that could provide further insight into declines in overallstaffing levels. Additional research may determine the degree towhich these staffing declines are due to one or a combination ofinstitutional variables, shifting organizational priorities, generaldownsizing, technological improvements, or other factors. It wouldalso be useful to compare library staff declines to other academicsupport units such as campus IT for the same period to determine iflibrary staff reductions are part of a general trend across the academy.In addition, a survey of staffing levels at U.S. research universitylibraries for the 8-year period, 1990–1998, before the current studywould be helpful in determining whether recent declines in FTE stafflevels are a continuation of an ongoing trend or if libraries haveentered a period of contraction.
As university undergraduate enrollments have increased over thepast decade22 and are expected to grow by another 1.6 million in thecoming decade23 the ratio of library FTE to students has certainlydeclined with decreases in library staffing levels. A useful extension ofthis study could be to chart the changes in this ratio between 2000 and2008 using the NCES metric of “total staff per 1000 students,” used inthe biannual survey of U.S. academic libraries. Declines in this ratioraise questions about how well students are being served by the
Table 9Libraries with Decreasing Number of Librarian
FTE Positions by Public/PrivateInstitutional Control
Public/PrivatePercent of LibrariesThat Lost Librarians
Average Number ofPositions Lost
Public (n=57) 67% 6
Private (n=26) 33% 6
academic library as enrollments grow and information literacybecomes an increasingly important element in undergraduateeducation. Qualitative inquiry in the form of surveys and/or inter-views with librarians at the libraries in the current study that haveexperienced the most dramatic declines in the staff/student ratiocould yield useful information about strategies such as alteringorganizational structures, merging positions, and changing servicemodels as staff levels decline.
Despite declines in overall library staffing levels between 2000 and2008, results data that indicate a slight increase in the averagenumber of FTE librarians at U.S. research university libraries over thatperiod should be cause for measured optimism. Additional researchcould compare this growth with enrollment growth by using NCESdata to determine changing ratios of librarians between 2000 and2008 for libraries in this study. Additional research could alsodetermine if gains in librarian FTEs has similarly occurred at othertypes of 4-year institutions, namely masters colleges and universities,4-year baccalaureate colleges, and community colleges. Combinedwith information from this study, these data would provide acomprehensive view of librarian staffing levels across U.S. highereducation. Finally, it may also be useful to compare librarian staffinglevels at non-profit institutions with that of the rapidly growing for-profit higher education sector.
Quantitative data, while important, is of more value whencombined with qualitative inquiry such as case studies and inter-views. This kind of inquiry would be useful in determining howservice models and organizational structures are changing with theimbalance between declining overall staff levels, and increases,however modest, in librarian staffing levels during a period ofcontinuing transformation and growth for higher education ingeneral. Specific information could be generated that providescontextual frameworks for increases in librarian FTEs at institutionsin this study. What are the organizational and institutional factors, forexample, that have been used by library leaders to successfully justifynew librarian positions at the institutions that gained librariansbetween 2000 and 2008? It would also be useful to know if there arespecific library functions and services that have required morelibrarian positions to be added. Given these modest increases inlibrarian positions coupled with and overall staff decreases, however,
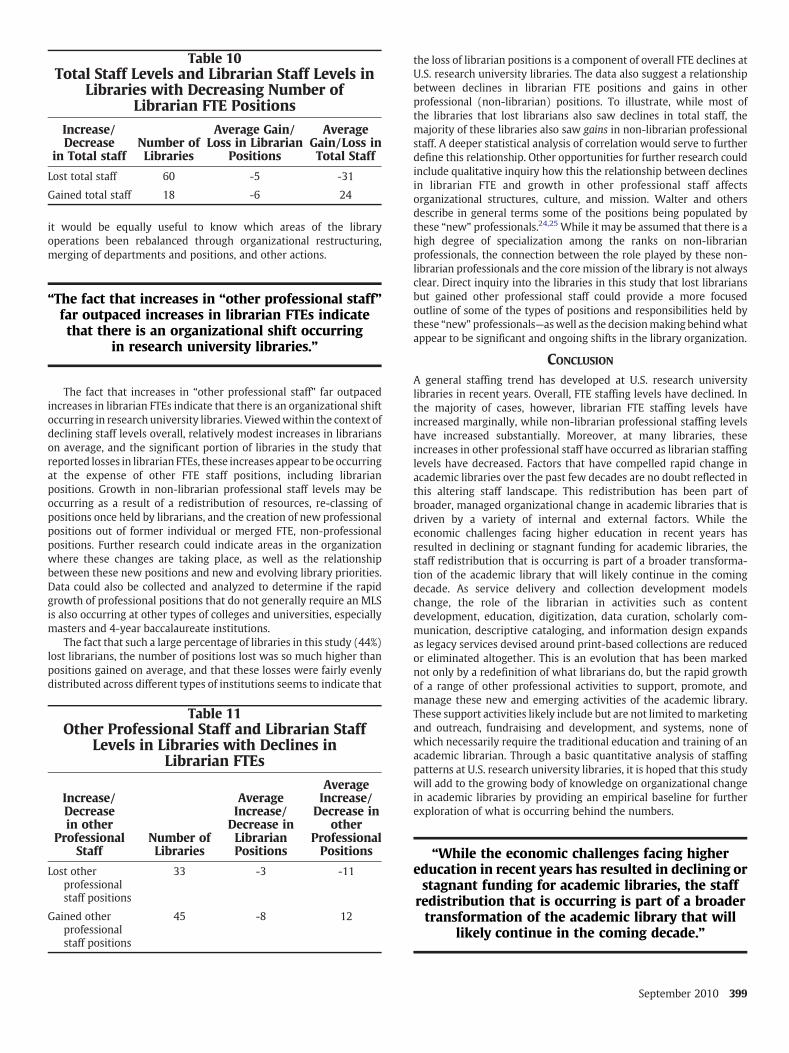
Table 11Other Professional Staff and Librarian Staff
Levels in Libraries with Declines inLibrarian FTEs
Increase/Decreasein other
ProfessionalStaff
Number ofLibraries
AverageIncrease/
Decrease inLibrarianPositions
AverageIncrease/
Decrease inother
ProfessionalPositions
Lost otherprofessionalstaff positions
33 3 11
Gained otherprofessionalstaff positions
45 8 12
Table 10Total Staff Levels and Librarian Staff Levels in
Libraries with Decreasing Number ofLibrarian FTE Positions
Increase/Decrease
in Total staffNumber ofLibraries
Average Gain/Loss in Librarian
Positions
AverageGain/Loss inTotal Staff
Lost total staff 60 5 31
Gained total staff 18 6 24
it would be equally useful to know which areas of the libraryoperations been rebalanced through organizational restructuring,merging of departments and positions, and other actions.
“The fact that increases in “other professional staff”far outpaced increases in librarian FTEs indicatethat there is an organizational shift occurring
in research university libraries.”
The fact that increases in “other professional staff” far outpacedincreases in librarian FTEs indicate that there is an organizational shiftoccurring in research university libraries. Viewedwithin the context ofdeclining staff levels overall, relatively modest increases in librarianson average, and the significant portion of libraries in the study thatreported losses in librarian FTEs, these increases appear to be occurringat the expense of other FTE staff positions, including librarianpositions. Growth in non-librarian professional staff levels may beoccurring as a result of a redistribution of resources, re-classing ofpositions once held by librarians, and the creation of new professionalpositions out of former individual or merged FTE, non-professionalpositions. Further research could indicate areas in the organizationwhere these changes are taking place, as well as the relationshipbetween these new positions and new and evolving library priorities.Data could also be collected and analyzed to determine if the rapidgrowth of professional positions that do not generally require an MLSis also occurring at other types of colleges and universities, especiallymasters and 4-year baccalaureate institutions.
The fact that such a large percentage of libraries in this study (44%)lost librarians, the number of positions lost was so much higher thanpositions gained on average, and that these losses were fairly evenlydistributed across different types of institutions seems to indicate that
the loss of librarian positions is a component of overall FTE declines atU.S. research university libraries. The data also suggest a relationshipbetween declines in librarian FTE positions and gains in otherprofessional (non-librarian) positions. To illustrate, while most ofthe libraries that lost librarians also saw declines in total staff, themajority of these libraries also saw gains in non-librarian professionalstaff. A deeper statistical analysis of correlation would serve to furtherdefine this relationship. Other opportunities for further research couldinclude qualitative inquiry how this the relationship between declinesin librarian FTE and growth in other professional staff affectsorganizational structures, culture, and mission. Walter and othersdescribe in general terms some of the positions being populated bythese “new” professionals.24,25 While it may be assumed that there is ahigh degree of specialization among the ranks on non-librarianprofessionals, the connection between the role played by these non-librarian professionals and the core mission of the library is not alwaysclear. Direct inquiry into the libraries in this study that lost librariansbut gained other professional staff could provide a more focusedoutline of some of the types of positions and responsibilities held bythese “new” professionals—aswell as the decisionmaking behindwhatappear to be significant and ongoing shifts in the library organization.
CONCLUSION
A general staffing trend has developed at U.S. research universitylibraries in recent years. Overall, FTE staffing levels have declined. Inthe majority of cases, however, librarian FTE staffing levels haveincreased marginally, while non-librarian professional staffing levelshave increased substantially. Moreover, at many libraries, theseincreases in other professional staff have occurred as librarian staffinglevels have decreased. Factors that have compelled rapid change inacademic libraries over the past few decades are no doubt reflected inthis altering staff landscape. This redistribution has been part ofbroader, managed organizational change in academic libraries that isdriven by a variety of internal and external factors. While theeconomic challenges facing higher education in recent years hasresulted in declining or stagnant funding for academic libraries, thestaff redistribution that is occurring is part of a broader transforma-tion of the academic library that will likely continue in the comingdecade. As service delivery and collection development modelschange, the role of the librarian in activities such as contentdevelopment, education, digitization, data curation, scholarly com-munication, descriptive cataloging, and information design expandsas legacy services devised around print-based collections are reducedor eliminated altogether. This is an evolution that has been markednot only by a redefinition of what librarians do, but the rapid growthof a range of other professional activities to support, promote, andmanage these new and emerging activities of the academic library.These support activities likely include but are not limited tomarketingand outreach, fundraising and development, and systems, none ofwhich necessarily require the traditional education and training of anacademic librarian. Through a basic quantitative analysis of staffingpatterns at U.S. research university libraries, it is hoped that this studywill add to the growing body of knowledge on organizational changein academic libraries by providing an empirical baseline for furtherexploration of what is occurring behind the numbers.
“While the economic challenges facing highereducation in recent years has resulted in declining orstagnant funding for academic libraries, the staff
redistribution that is occurring is part of a broadertransformation of the academic library that will
likely continue in the coming decade.”
September 2010 399
APPENDIX A. SUPPLEMENTARY DATA
Supplementary data associated with this article can be found, in theonline version, at doi:10.1016/j.acalib.2010.06.003.
NOTES AND REFERENCES
1. “U.S. Department of Labor, Bureau of Labor Statistics OccupationalOutlook: Librarians Handbook,” United States Department of Labor,Bureau of Labor Statistics, 18 December 2007, http://www.bls.gov/oco/ocos068.htm#projections_data (accessed September 3, 2009).
2.Marty Nemko, “Librarian: Executive Summary,” US News andWorld Report, 19 December 2007, http://www.usnews.com/articles/business/best-careers/2007/12/19/librarian-executive-summary.html (accessed September 10, 2009).
3. Jen Stevens and Rosemary Streatfield, SPEC Kit 276 Recruitingand Retention, (Washington DC: Association of Research Libraries,2003).
4. Larry Hardesty, “Future of Academic/Research Librarians: A Periodof Transition – To What,” portal: Libraries and the Academy 2, no. 1(2002): 79–97.
5. James G. Neal, “Integrating the New Generation of Feral Profes-sionals into the Academic Library”, Library Journal, http://www.libraryjournal.com/article/CA6304405.html (accessed November23, 2009).
6. Scott Walter, “The Library as Ecosystem,” Library Journal 133, no.16 (Oct 1, 2008): 28–30.
7. Bill Crowley, “Just Another Field?,” Library Journal 129, no. 18 (Nov1, 2004): 44–46.
8. Rush G. Miller, “The Influx of Ph.Ds into Librarianship: Intrusionor Transfusion?” College and Research Libraries 37, no. 2 (March1976): 158–165.
9. Ibid.10. Pongracz Sennyey, Lyman Ross and Caroline Mills, “Exploring the
Future of Academic Libraries, A Definitional Approach,” The Journalof Academic Librarianship 35, no. 3 (April 2, 2009): 252–259.
400 The Journal of Academic Librarianship
11. Diane Zabel, “Trends in Reference and Public Services Librarian-ship and the Role of RUSA,” Reference and User Services Quarterly 45(Winter 2005): 104–107.
12. Stephanie Maata, “Jobs! (Eventually),” Library Journal 129 (Octo-ber 15, 2004): 28–35.
13. Rachel Holt and Adrienne Strock, “The Entry Level Gap,” LibraryJournal 130 (May 2005): 36–38.
14.Maata, (2004): 28-35.15. Stanley J. Wilder, “The ARL Youth Movement: Reshaping the ARL
Workforce,” ARL: A Bimonthly Report 254 (Oct. 2007): 1–4.16. Rachel Applegate, “Charting Academic Library Staffing: Data from
National Surveys,” College and Research Libraries 68, no. 1 (Jan.2007): 59–68.
17. “Classification Description,” The Carnegie Foundation for theAdvancement of Teaching, http://classifications.carnegiefoundation.org/descriptions/basic.php (accessed November 25, 2009).
18. Ibid.19. Ibid.20. “Library Statistics Program: Academic Libraries”, National Center
for Educational Statistics, http://nces.ed.gov/surveys/libraries/academic.asp (accessed August 10, 2009).
21. “Library Statistics Program: Compare Academic Libraries”,NationalCenter for Educational Statistics, http://nces.ed.gov/surveys/libraries/compare/Index.asp?LibraryType=Academic (accessedNovember 18, 2009).
22. “Growth in Undergraduate Enrollments by Type of College.” TheChronicle of Higher Education, Almanac of Higher Education,Published August 24, 2009, http://chronicle.com/article/Growth-in-Undergraduate-Enr/48052/ (accessed November 18, 2009).
23. “Projections of Educational Statistics to 2018”, IES National Centerfor Education Statistics, http://nces.ed.gov/programs/projections/projections2018/tables/table_19.asp?referrer=list (accessedNovember 18, 2009).
24.Walter, (2008).25. Neal, (2009).


![5 Ways to Avoid a Half Empty Room Block [WEBINAR]](https://img.pdfslide.us/doc/110x75/589b87bc1a28abc0098b4a9b/5-ways-to-avoid-a-half-empty-room-block-webinar.jpg)