Embed Size (px)
Citation preview

H1 2021 Results |
SES Proprietary and Confidential
H1 2021 RESULTS
SIX MONTHS ENDED 30 JUNE 2021
4 August 2021

BUSINESS HIGHLIGHTSSteve Collar, CEO
H1 2021 Results |
SOLID H1 PERFORMANCE DRIVING IMPROVED EBITDA OUTLOOK FOR 2021
3
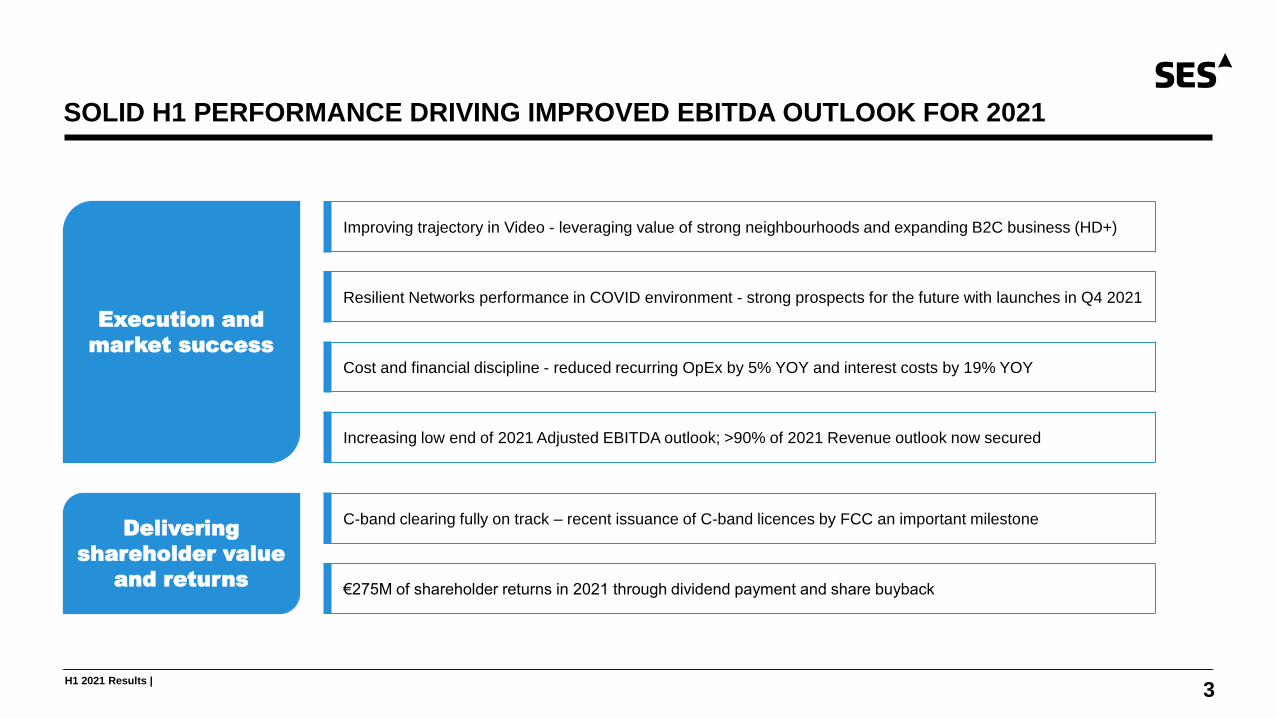
Increasing low end of 2021 Adjusted EBITDA outlook; >90% of 2021 Revenue outlook now secured
Improving trajectory in Video - leveraging value of strong neighbourhoods and expanding B2C business (HD+)
Resilient Networks performance in COVID environment - strong prospects for the future with launches in Q4 2021
C-band clearing fully on track – recent issuance of C-band licences by FCC an important milestone
€275M of shareholder returns in 2021 through dividend payment and share buyback
Execution and
market success
Delivering
shareholder value
and returns
Cost and financial discipline - reduced recurring OpEx by 5% YOY and interest costs by 19% YOY
H1 2021 Results |
SOLID FINANCIAL PERFORMANCE IN COVID ENVIRONMENT
4
H1 2021
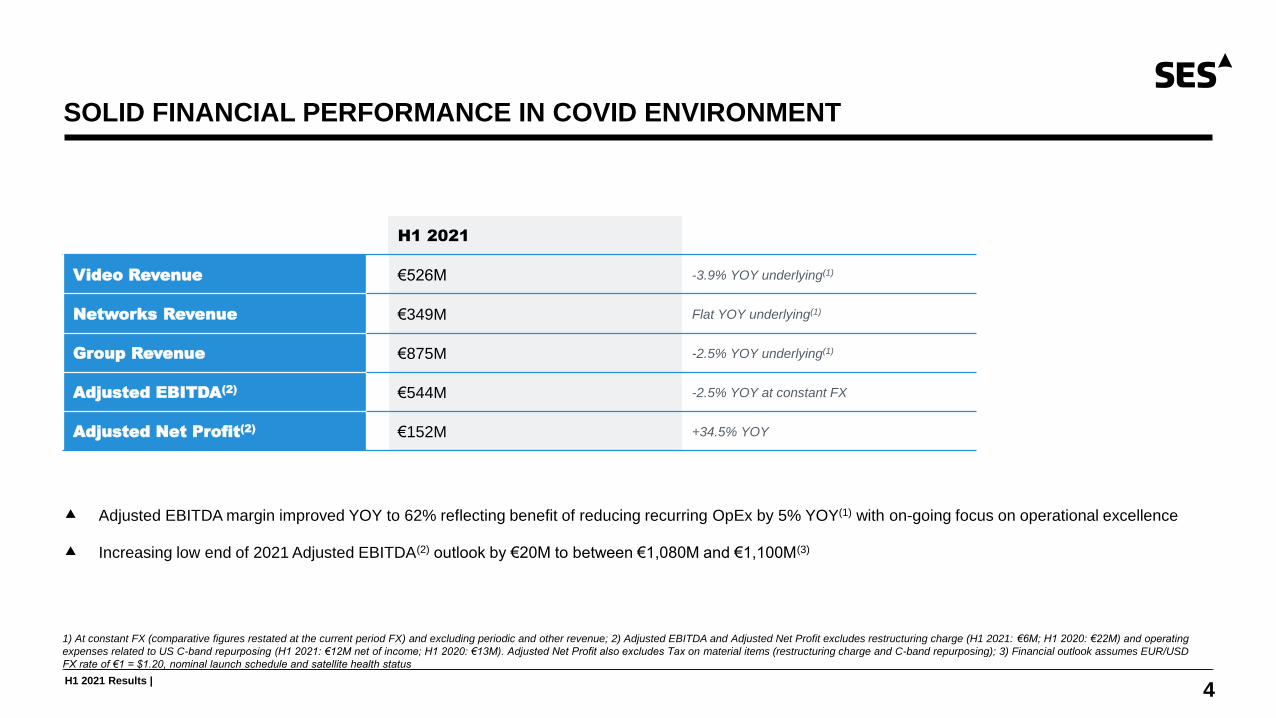
Video Revenue €526M -3.9% YOY underlying(1)
Networks Revenue €349M Flat YOY underlying(1)
Group Revenue €875M -2.5% YOY underlying(1)
Adjusted EBITDA(2) €544M -2.5% YOY at constant FX
Adjusted Net Profit(2) €152M +34.5% YOY
Adjusted EBITDA margin improved YOY to 62% reflecting benefit of reducing recurring OpEx by 5% YOY(1) with on-going focus on operational excellence
Increasing low end of 2021 Adjusted EBITDA(2) outlook by €20M to between €1,080M and €1,100M(3)
1) At constant FX (comparative figures restated at the current period FX) and excluding periodic and other revenue; 2) Adjusted EBITDA and Adjusted Net Profit excludes restructuring charge (H1 2021: €6M; H1 2020: €22M) and operating
expenses related to US C-band repurposing (H1 2021: €12M net of income; H1 2020: €13M). Adjusted Net Profit also excludes Tax on material items (restructuring charge and C-band repurposing); 3) Financial outlook assumes EUR/USD
FX rate of €1 = $1.20, nominal launch schedule and satellite health status
H1 2021 Results |
MULTI-YEAR RENEWAL WHILE ENABLING C-BAND TRANSITION
“SES has been integral in providing continuity of service to our Managed Satellite Distribution customers in the midst of great change. SES has been collaborative and hands-on, participating in webinars and outreach efforts to maximise response time for businesses, solve for problems before they occur, and provide clear transition paths for every impacted operation.”
Allison Olien, VP and GM, Comcast Technology Solutions
LEVERAGING OUR PREMIUM VIDEO NEIGHBOURHOODS AND PRICING POWER
5
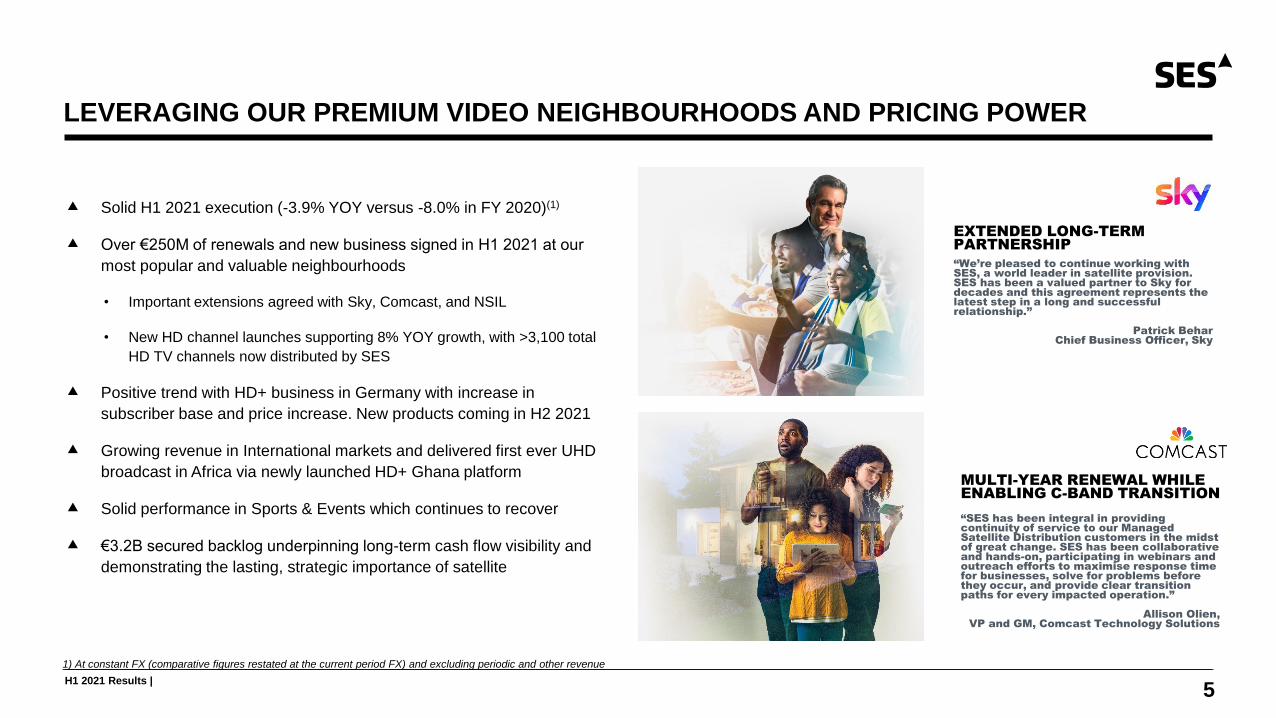
EXTENDED LONG-TERM PARTNERSHIP
“We’re pleased to continue working with SES, a world leader in satellite provision. SES has been a valued partner to Sky for decades and this agreement represents the latest step in a long and successful relationship.”
Patrick BeharChief Business Officer, Sky
Solid H1 2021 execution (-3.9% YOY versus -8.0% in FY 2020)(1)
Over €250M of renewals and new business signed in H1 2021 at our
most popular and valuable neighbourhoods
• Important extensions agreed with Sky, Comcast, and NSIL
• New HD channel launches supporting 8% YOY growth, with >3,100 total
HD TV channels now distributed by SES
Positive trend with HD+ business in Germany with increase in
subscriber base and price increase. New products coming in H2 2021
Growing revenue in International markets and delivered first ever UHD
broadcast in Africa via newly launched HD+ Ghana platform
Solid performance in Sports & Events which continues to recover
€3.2B secured backlog underpinning long-term cash flow visibility and
demonstrating the lasting, strategic importance of satellite
1) At constant FX (comparative figures restated at the current period FX) and excluding periodic and other revenue
H1 2021 Results |
EXPANDING OUR B2C PLATFORM OFFERING IN GERMANY
6
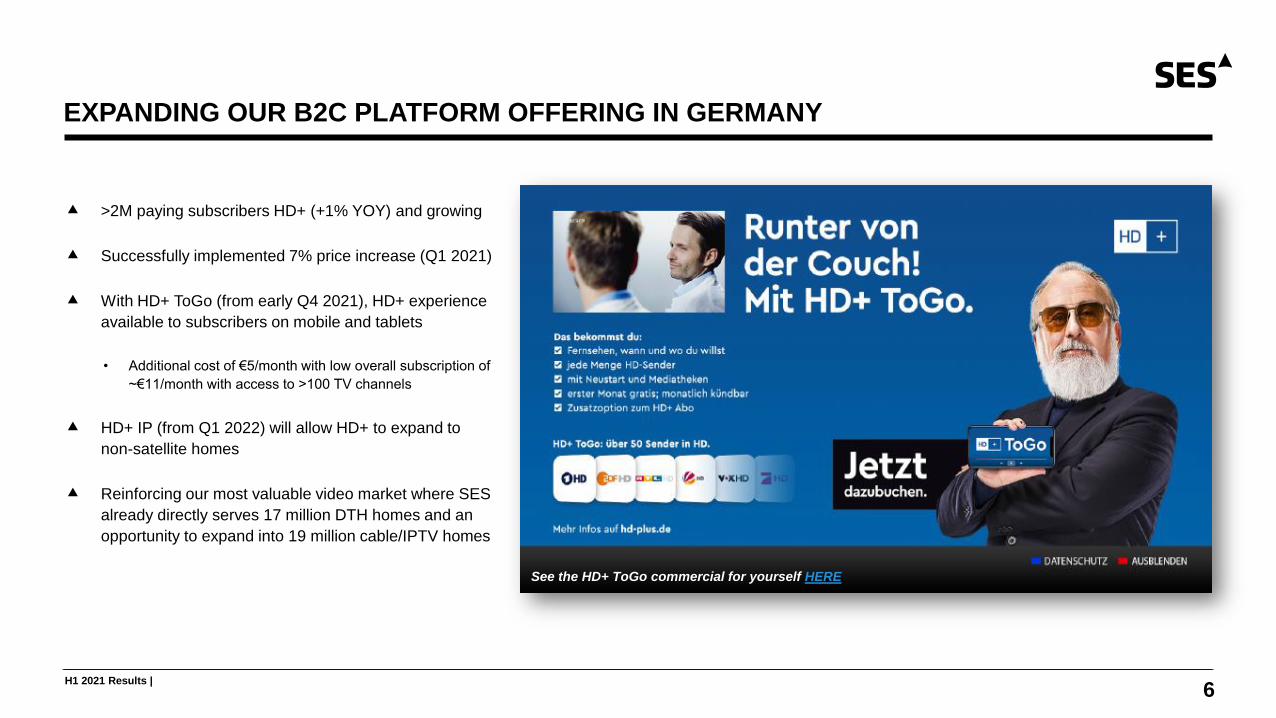
>2M paying subscribers HD+ (+1% YOY) and growing
Successfully implemented 7% price increase (Q1 2021)
With HD+ ToGo (from early Q4 2021), HD+ experience
available to subscribers on mobile and tablets
• Additional cost of €5/month with low overall subscription of
~€11/month with access to >100 TV channels
HD+ IP (from Q1 2022) will allow HD+ to expand to
non-satellite homes
Reinforcing our most valuable video market where SES
already directly serves 17 million DTH homes and an
opportunity to expand into 19 million cable/IPTV homes
See the HD+ ToGo commercial for yourself HERE

H1 2021 Results |
RESILIENT NETWORKS OUTTURN IN COVID ENVIRONMENT AND WELL PLACED TO GROW
7
EXPANDED PARTNERSHIP TO ENHANCE MARITIME SERVICES
Orange will integrate its own global infrastructure with the global network coverage powered by SES’ Skala Global Platform. Together it will enable Orange maritime customers to cost-effectively scale up their bandwidth with seamless, ubiquitous and global services.
Government (+11.3%(1)): acceleration fueled by new MEO- and GEO- US
mobility and land deployments, plus new wins with European governments
Fixed Data (-3.9%(1)): ongoing growth of ‘tier 1’ 4G networks and rural
inclusion, offset by lower wholesale business and reductions in the Pacific
Mobility (-10.7%(1)): COVID environment resulting in short-term impacts
SES-17 and O3b mPOWER (1-3) on track to launch in Q4 2021, bringing
differentiated products and services to market from H2 2022
• $210M of new SES-17 and O3b mPOWER backlog in 2021 with gross
backlog now up to $770M(2), underpinning growth acceleration from 2022
• Successful demonstrations with various Naval Forces using existing MEO
Multi-cloud strategy takes next step with AWS Direct Connect partnership
1) At constant FX (comparative figures restated at the current period FX) and excluding periodic and other revenue; 2) Gross backlog $770M (fully protected: $610M)
EXPANDING SERVICES FOR US GOVERNMENT
Recent contract to support combatant command, represents the 15th task order awarded under the Blanket Purchase Agreement giving the US Government fast access to SES’ unique MEO capability. Plus, renewed award to support Thule Air Base in Greenland (>20 years of service now)
H1 2021 Results |
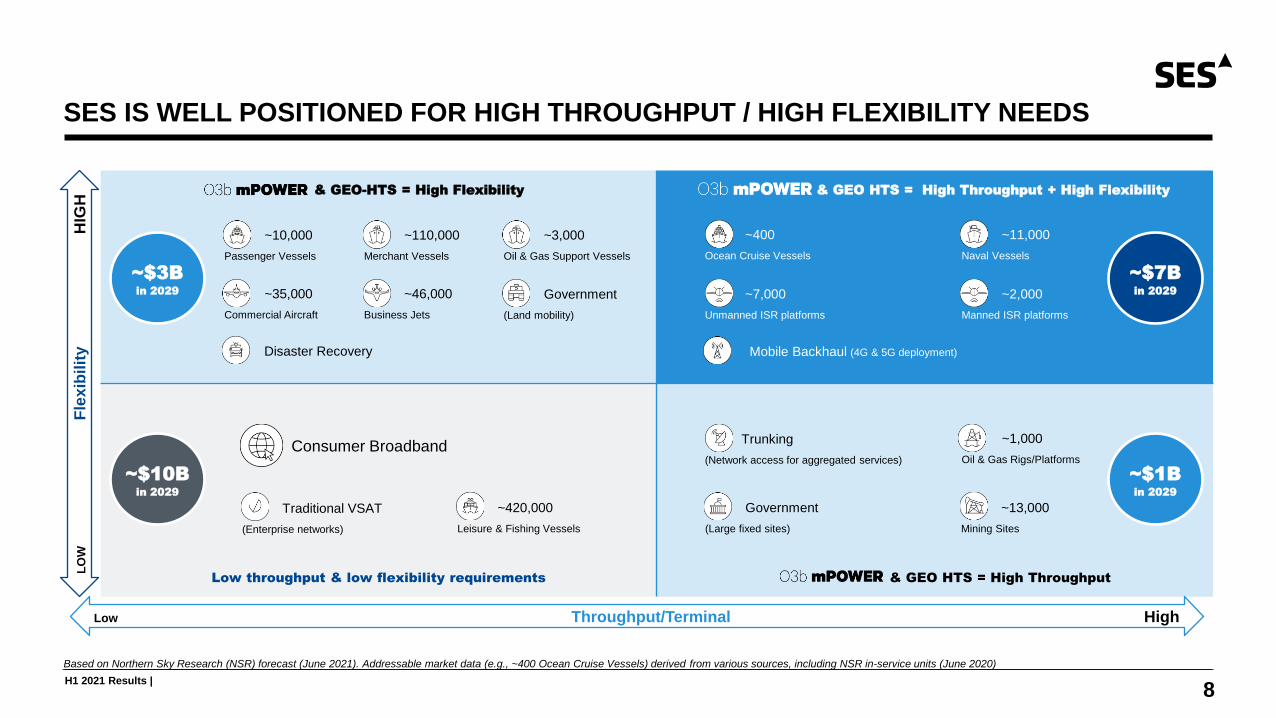
& GEO-HTS = High Flexibility & GEO HTS = High Throughput + High Flexibility
Low throughput & low flexibility requirements & GEO HTS = High Throughput
SES IS WELL POSITIONED FOR HIGH THROUGHPUT / HIGH FLEXIBILITY NEEDS
8
Low Throughput/Terminal High
LO
WF
lex
ibil
ity
HIG
H
~400
Ocean Cruise Vessels
Based on Northern Sky Research (NSR) forecast (June 2021). Addressable market data (e.g., ~400 Ocean Cruise Vessels) derived from various sources, including NSR in-service units (June 2020)
~$7Bin 2029
~$1Bin 2029
~$3Bin 2029
~$10Bin 2029
~7,000
Unmanned ISR platforms
~2,000
Manned ISR platforms
~11,000
Naval Vessels
Trunking
(Network access for aggregated services)
Mobile Backhaul (4G & 5G deployment)
~1,000
Oil & Gas Rigs/Platforms
~35,000
Commercial Aircraft
~46,000
Business Jets
~10,000
Passenger Vessels
~110,000
Merchant Vessels
Government
(Land mobility)
Consumer Broadband
~420,000
Leisure & Fishing Vessels
Traditional VSAT
(Enterprise networks)
~13,000
Mining Sites
~3,000
Oil & Gas Support Vessels
Government
(Large fixed sites)
Disaster Recovery
H1 2021 Results |
2020 H1 2021 H2 2021 2022 2023 2024
DELIVERING SUBSTANTIAL VALUE-CREATION FROM US C-BAND
9
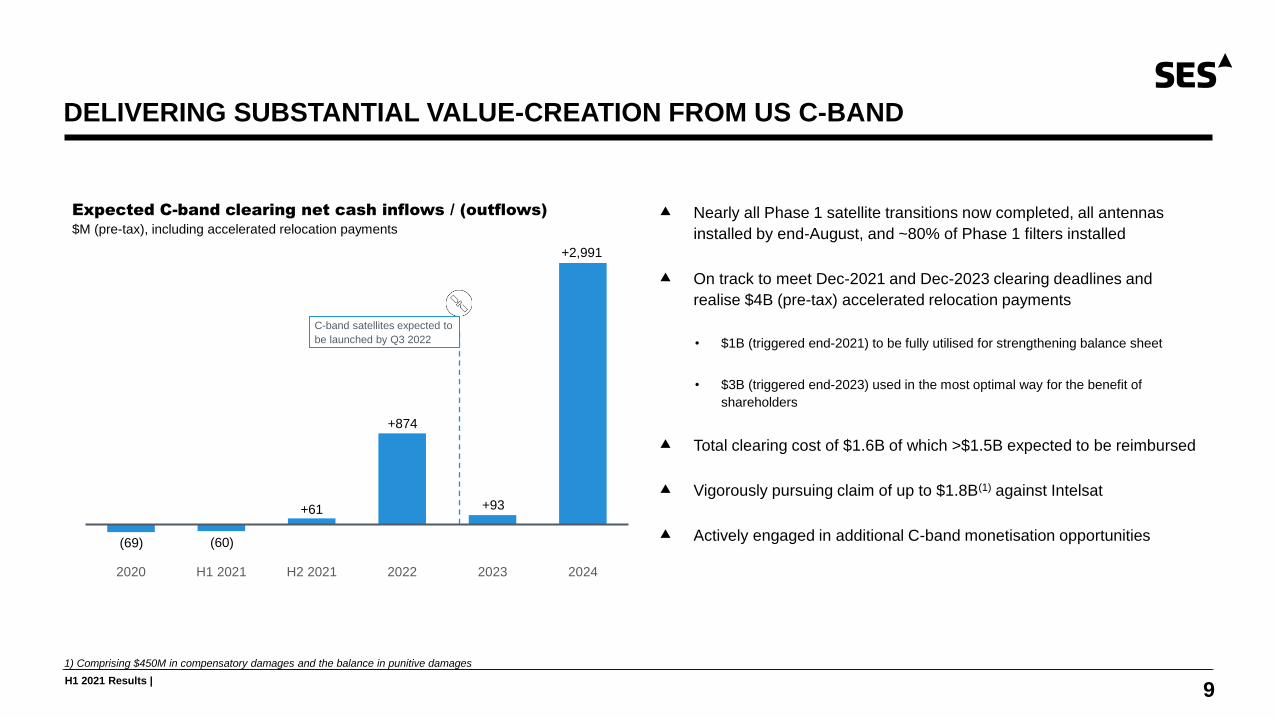
Expected C-band clearing net cash inflows / (outflows)
$M (pre-tax), including accelerated relocation payments
C-band satellites expected to
be launched by Q3 2022
Nearly all Phase 1 satellite transitions now completed, all antennas
installed by end-August, and ~80% of Phase 1 filters installed
On track to meet Dec-2021 and Dec-2023 clearing deadlines and
realise $4B (pre-tax) accelerated relocation payments
• $1B (triggered end-2021) to be fully utilised for strengthening balance sheet
• $3B (triggered end-2023) used in the most optimal way for the benefit of
shareholders
Total clearing cost of $1.6B of which >$1.5B expected to be reimbursed
Vigorously pursuing claim of up to $1.8B(1) against Intelsat
Actively engaged in additional C-band monetisation opportunities
1) Comprising $450M in compensatory damages and the balance in punitive damages
+2,991
+874
+61
(60)(69)
+93

FINANCIAL HIGHLIGHTSSandeep Jalan, CFO
H1 2021 Results |
SOLID ADJUSTED EBITDA AND IMPROVED MARGIN
11
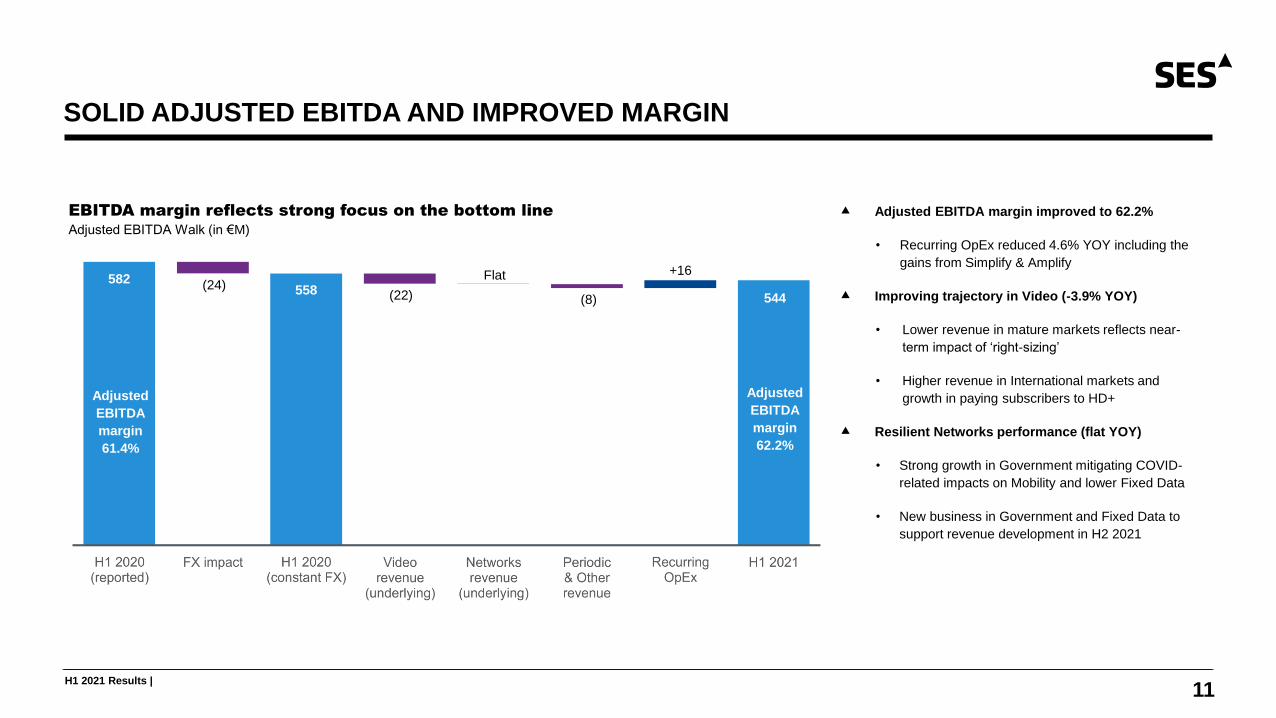
EBITDA margin reflects strong focus on the bottom line
Adjusted EBITDA Walk (in €M)
Adjusted EBITDA margin improved to 62.2%
• Recurring OpEx reduced 4.6% YOY including the
gains from Simplify & Amplify
Improving trajectory in Video (-3.9% YOY)
• Lower revenue in mature markets reflects near-
term impact of ‘right-sizing’
• Higher revenue in International markets and
growth in paying subscribers to HD+
Resilient Networks performance (flat YOY)
• Strong growth in Government mitigating COVID-
related impacts on Mobility and lower Fixed Data
• New business in Government and Fixed Data to
support revenue development in H2 2021
Adjusted
EBITDA
margin
61.4%
Adjusted
EBITDA
margin
62.2%
(22)
Flat
(8)
+16(24) 558
582
544
H1 2021 Results |
35% GROWTH IN ADJUSTED NET PROFIT
12
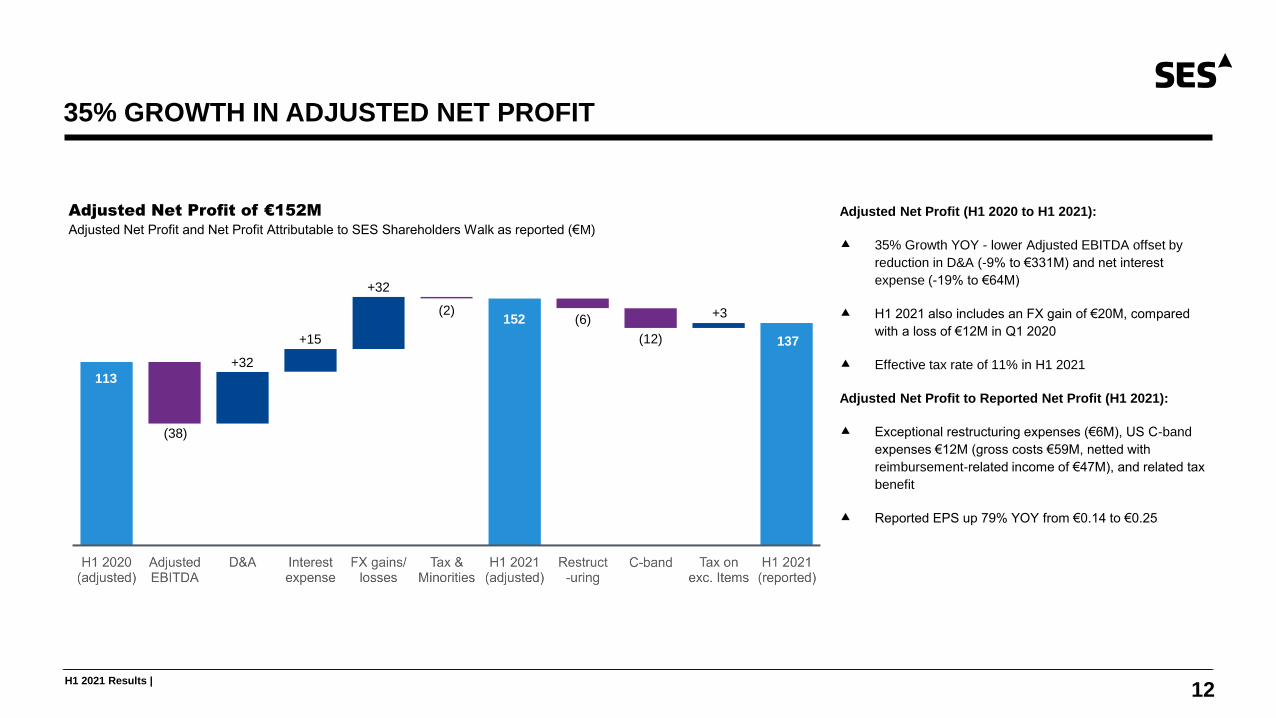
Adjusted Net Profit of €152M
Adjusted Net Profit and Net Profit Attributable to SES Shareholders Walk as reported (€M)
Adjusted Net Profit (H1 2020 to H1 2021):
35% Growth YOY - lower Adjusted EBITDA offset by
reduction in D&A (-9% to €331M) and net interest
expense (-19% to €64M)
H1 2021 also includes an FX gain of €20M, compared
with a loss of €12M in Q1 2020
Effective tax rate of 11% in H1 2021
Adjusted Net Profit to Reported Net Profit (H1 2021):
Exceptional restructuring expenses (€6M), US C-band
expenses €12M (gross costs €59M, netted with
reimbursement-related income of €47M), and related tax
benefit
Reported EPS up 79% YOY from €0.14 to €0.25
+15
(6)
(12)
(38)
137
+32
(2)
113
152 +3
+32
H1 2021 Results |
REDUCED ADJUSTED NET DEBT BY €391M YOY AND LOWERING INTEREST COSTS
13
1) Treats hybrid bonds as 50% debt and 50% equity, per the rating agency methodology
604
1,200
631
150250
650 640
400
631
15357
16
16
16
16 16 50
2021 2022 2023 2024 2025 2026 2027 2028 2029 >2030
Cash & cash equivalents Revolving Credit Facility Senior Bonds Other Debt
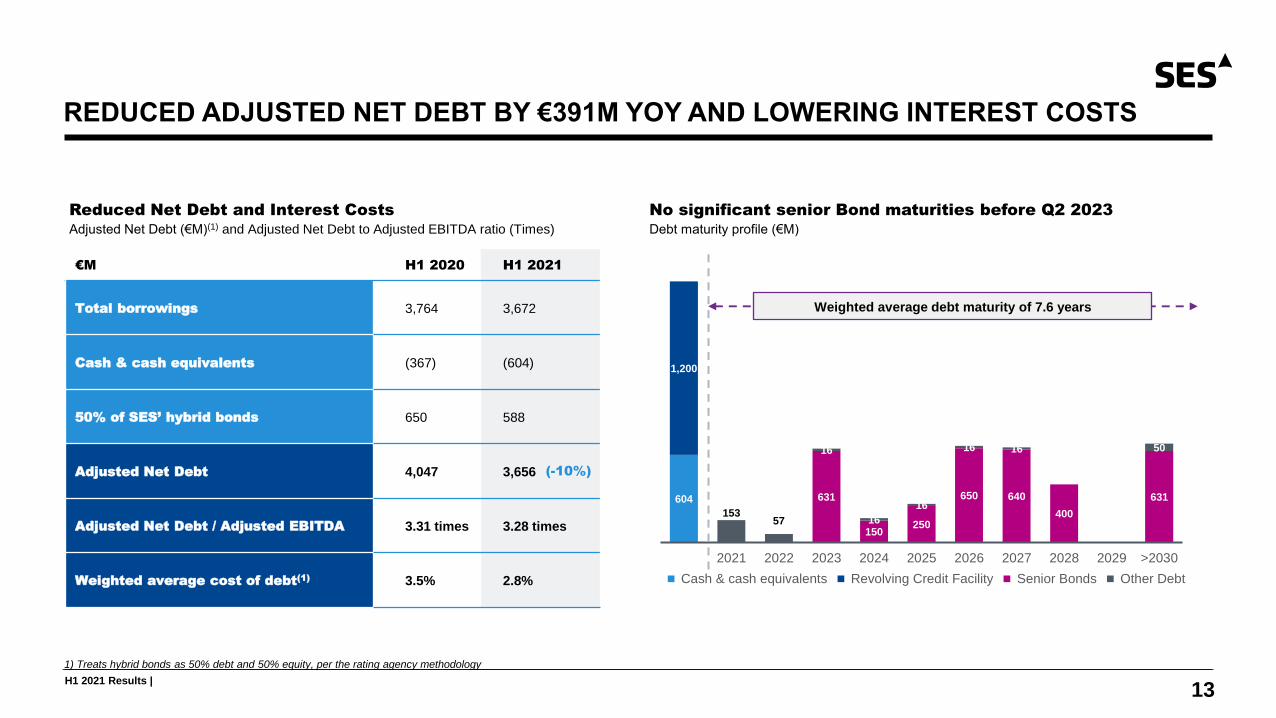
No significant senior Bond maturities before Q2 2023
Debt maturity profile (€M)
Reduced Net Debt and Interest Costs
Adjusted Net Debt (€M)(1) and Adjusted Net Debt to Adjusted EBITDA ratio (Times)
Weighted average debt maturity of 7.6 years
€M H1 2020 H1 2021
Total borrowings 3,764 3,672
Cash & cash equivalents (367) (604)
50% of SES’ hybrid bonds 650 588
Adjusted Net Debt 4,047 3,656
Adjusted Net Debt / Adjusted EBITDA 3.31 times 3.28 times
Weighted average cost of debt(1) 3.5% 2.8%
(-10%)
H1 2021 Results |
EXPANDING FCF BEYOND 2022 DRIVEN BY INCREASING EBITDA AND LOWER CAPEX
14
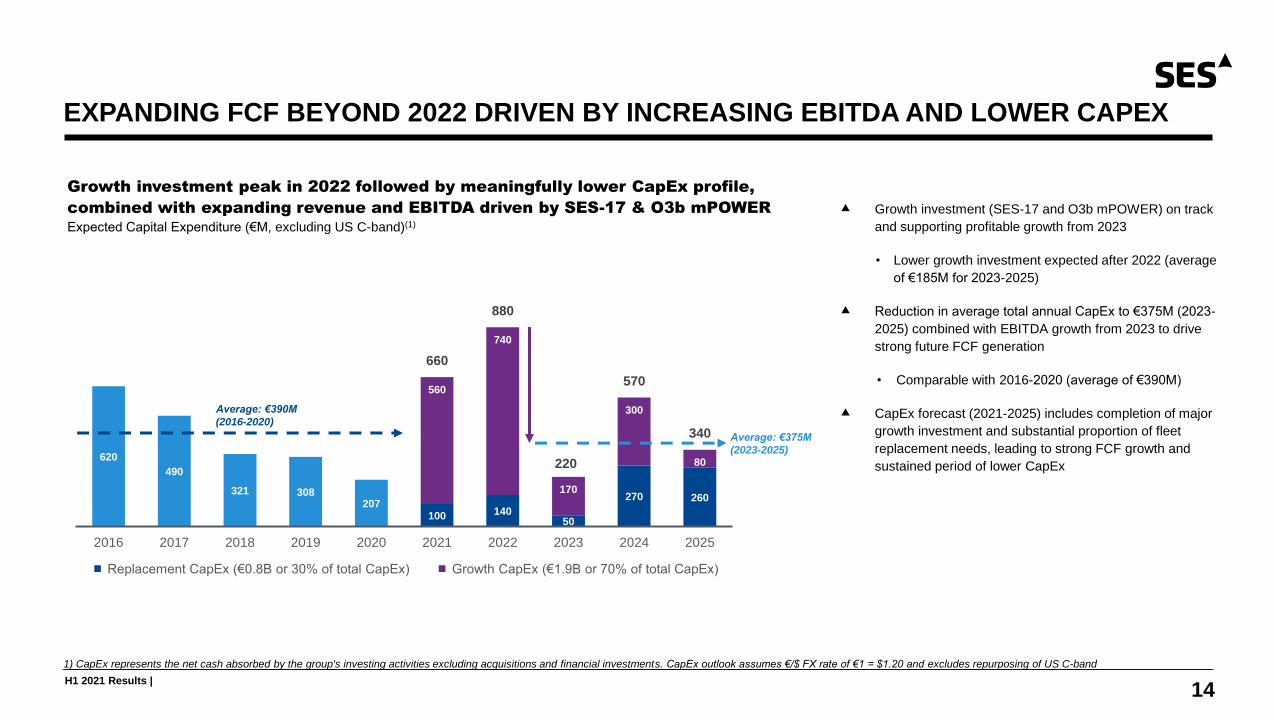
Growth investment peak in 2022 followed by meaningfully lower CapEx profile,
combined with expanding revenue and EBITDA driven by SES-17 & O3b mPOWER
Expected Capital Expenditure (€M, excluding US C-band)(1)
1) CapEx represents the net cash absorbed by the group's investing activities excluding acquisitions and financial investments. CapEx outlook assumes €/$ FX rate of €1 = $1.20 and excludes repurposing of US C-band
620
490
321 308207
100 14050
270 260
560
740
170
300
80
660
880
220
570
340
2016 2017 2018 2019 2020 2021 2022 2023 2024 2025
Replacement CapEx (€0.8B or 30% of total CapEx) Growth CapEx (€1.9B or 70% of total CapEx)
Growth investment (SES-17 and O3b mPOWER) on track
and supporting profitable growth from 2023
• Lower growth investment expected after 2022 (average
of €185M for 2023-2025)
Reduction in average total annual CapEx to €375M (2023-
2025) combined with EBITDA growth from 2023 to drive
strong future FCF generation
• Comparable with 2016-2020 (average of €390M)
CapEx forecast (2021-2025) includes completion of major
growth investment and substantial proportion of fleet
replacement needs, leading to strong FCF growth and
sustained period of lower CapEx
Average: €375M
(2023-2025)
Average: €390M
(2016-2020)
H1 2021 Results |
INCREASING LOW END OF 2021 ADJUSTED EBITDA OUTLOOK
15
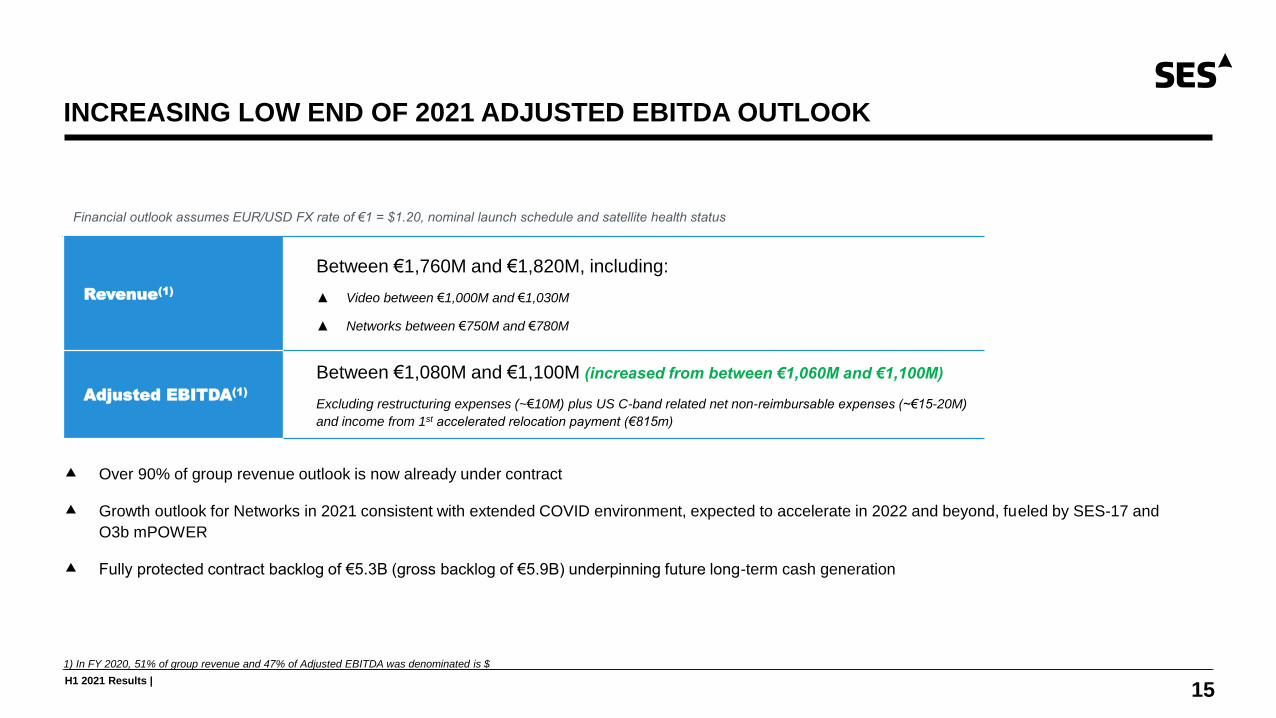
Financial outlook assumes EUR/USD FX rate of €1 = $1.20, nominal launch schedule and satellite health status
Revenue(1)
Between €1,760M and €1,820M, including:
▲ Video between €1,000M and €1,030M
▲ Networks between €750M and €780M
Adjusted EBITDA(1)
Between €1,080M and €1,100M (increased from between €1,060M and €1,100M)
Excluding restructuring expenses (~€10M) plus US C-band related net non-reimbursable expenses (~€15-20M)
and income from 1st accelerated relocation payment (€815m)
Over 90% of group revenue outlook is now already under contract
Growth outlook for Networks in 2021 consistent with extended COVID environment, expected to accelerate in 2022 and beyond, fueled by SES-17 and
O3b mPOWER
Fully protected contract backlog of €5.3B (gross backlog of €5.9B) underpinning future long-term cash generation
1) In FY 2020, 51% of group revenue and 47% of Adjusted EBITDA was denominated is $

CONCLUSIONSteve Collar, CEO
H1 2021 Results |
CLEAR PATH TO SUSTAINED PROFITABLE GROWTH
17
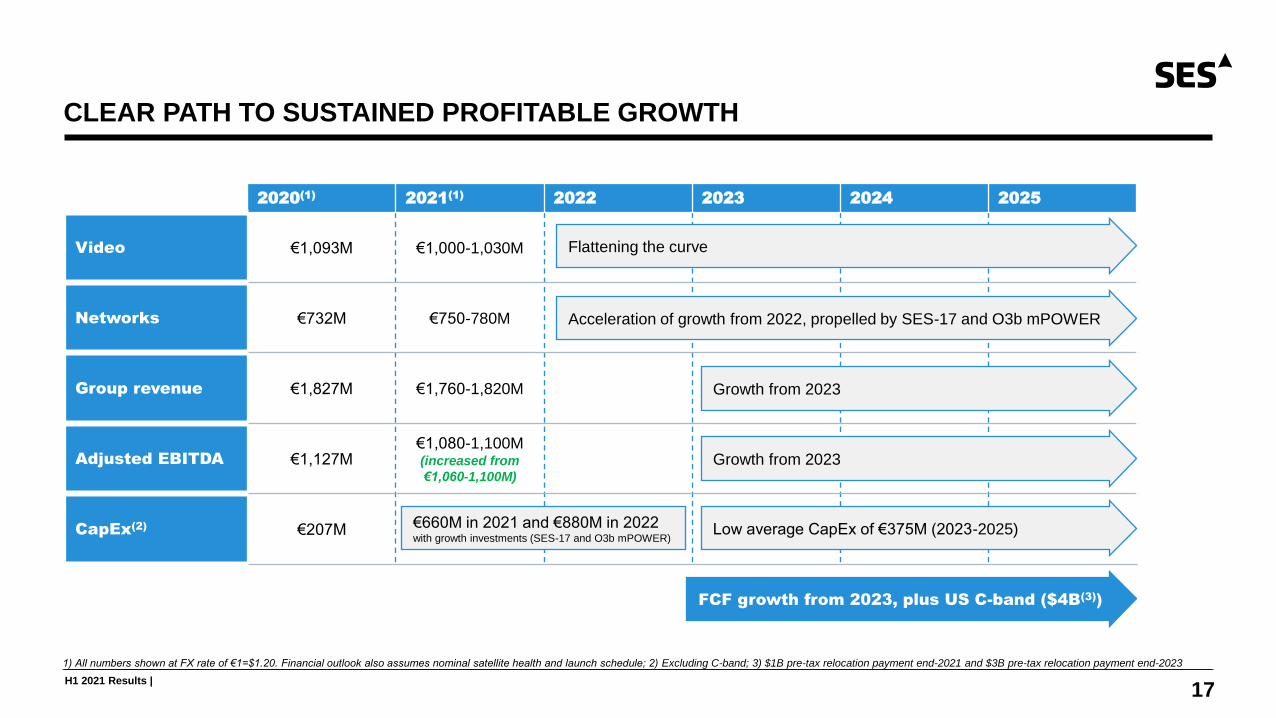
2020(1) 2021(1) 2022 2023 2024 2025
Video €1,093M €1,000-1,030M
Networks €732M €750-780M
Group revenue €1,827M €1,760-1,820M
Adjusted EBITDA €1,127M€1,080-1,100M(increased from
€1,060-1,100M)
CapEx(2) €207M
Flattening the curve
Acceleration of growth from 2022, propelled by SES-17 and O3b mPOWER
Growth from 2023
Growth from 2023
Low average CapEx of €375M (2023-2025)
FCF growth from 2023, plus US C-band ($4B(3))
€660M in 2021 and €880M in 2022with growth investments (SES-17 and O3b mPOWER)
1) All numbers shown at FX rate of €1=$1.20. Financial outlook also assumes nominal satellite health and launch schedule; 2) Excluding C-band; 3) $1B pre-tax relocation payment end-2021 and $3B pre-tax relocation payment end-2023

ADDITIONAL INFORMATION
H1 2021 Results |
COMMITMENT TO THE DISCIPLINED FINANCIAL POLICY
19
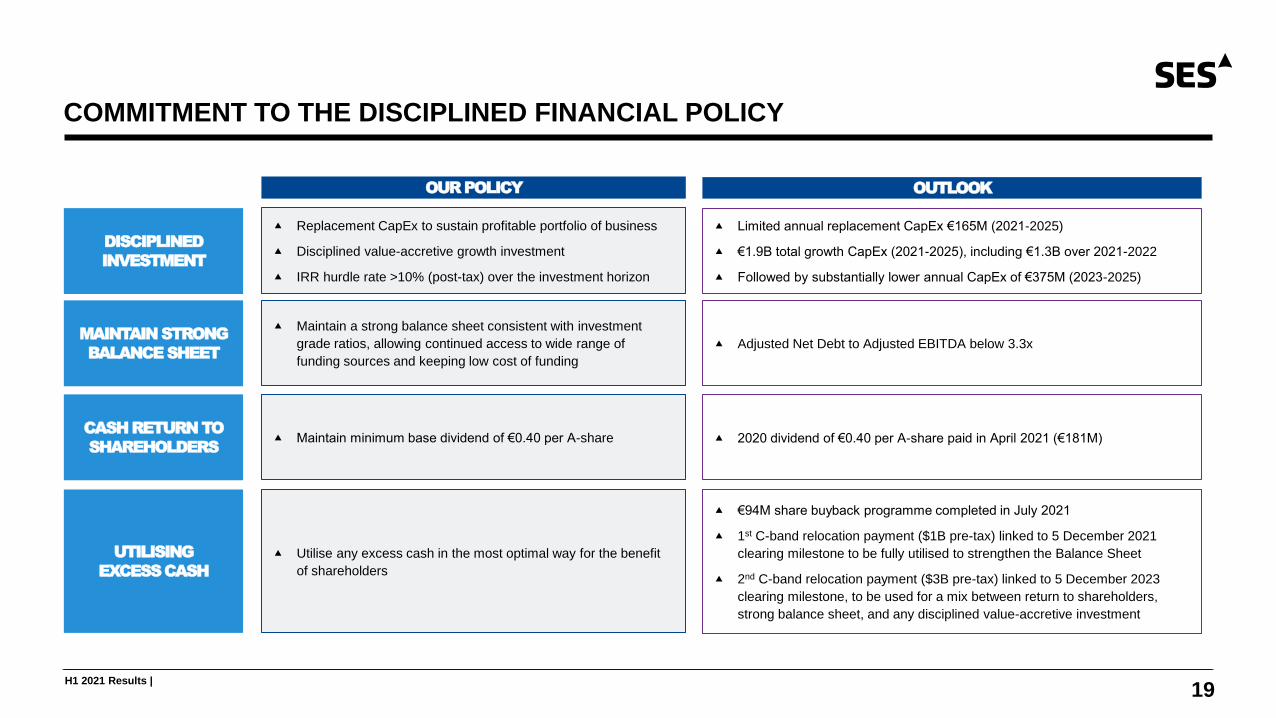
DISCIPLINED
INVESTMENT
MAINTAIN STRONG
BALANCE SHEET
CASH RETURN TO
SHAREHOLDERS
UTILISING
EXCESS CASH
Replacement CapEx to sustain profitable portfolio of business
Disciplined value-accretive growth investment
IRR hurdle rate >10% (post-tax) over the investment horizon
Maintain a strong balance sheet consistent with investment
grade ratios, allowing continued access to wide range of
funding sources and keeping low cost of funding
Utilise any excess cash in the most optimal way for the benefit
of shareholders
Limited annual replacement CapEx €165M (2021-2025)
€1.9B total growth CapEx (2021-2025), including €1.3B over 2021-2022
Followed by substantially lower annual CapEx of €375M (2023-2025)
Adjusted Net Debt to Adjusted EBITDA below 3.3x
€94M share buyback programme completed in July 2021
1st C-band relocation payment ($1B pre-tax) linked to 5 December 2021
clearing milestone to be fully utilised to strengthen the Balance Sheet
2nd C-band relocation payment ($3B pre-tax) linked to 5 December 2023
clearing milestone, to be used for a mix between return to shareholders,
strong balance sheet, and any disciplined value-accretive investment
Maintain minimum base dividend of €0.40 per A-share 2020 dividend of €0.40 per A-share paid in April 2021 (€181M)
OUR POLICY OUTLOOK
H1 2021 Results |
ESG – WE ARE HERE TO MAKE A DIFFERENCE
20
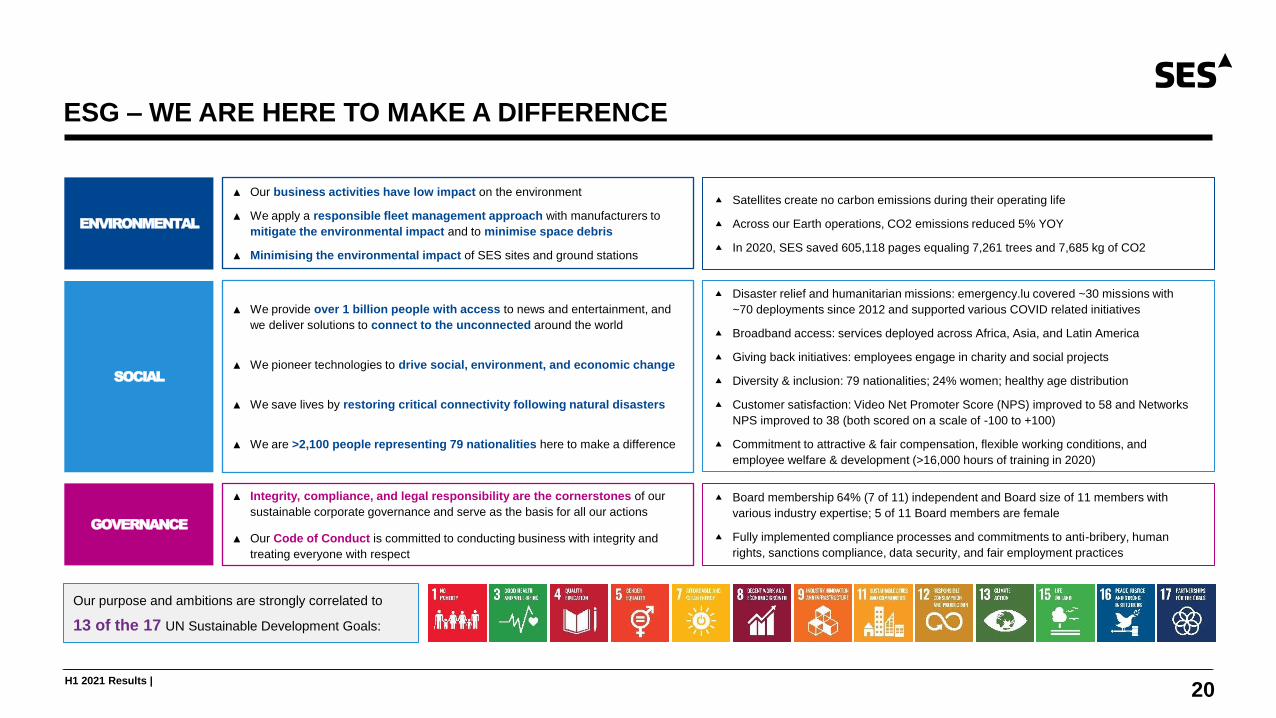
Our purpose and ambitions are strongly correlated to
13 of the 17 UN Sustainable Development Goals:
ENVIRONMENTAL
▲ Our business activities have low impact on the environment
▲ We apply a responsible fleet management approach with manufacturers to
mitigate the environmental impact and to minimise space debris
▲ Minimising the environmental impact of SES sites and ground stations
Satellites create no carbon emissions during their operating life
Across our Earth operations, CO2 emissions reduced 5% YOY
In 2020, SES saved 605,118 pages equaling 7,261 trees and 7,685 kg of CO2
GOVERNANCE
Board membership 64% (7 of 11) independent and Board size of 11 members with
various industry expertise; 5 of 11 Board members are female
Fully implemented compliance processes and commitments to anti-bribery, human
rights, sanctions compliance, data security, and fair employment practices
▲ Integrity, compliance, and legal responsibility are the cornerstones of our
sustainable corporate governance and serve as the basis for all our actions
▲ Our Code of Conduct is committed to conducting business with integrity and
treating everyone with respect
SOCIAL
▲ We provide over 1 billion people with access to news and entertainment, and
we deliver solutions to connect to the unconnected around the world
▲ We pioneer technologies to drive social, environment, and economic change
▲ We save lives by restoring critical connectivity following natural disasters
▲ We are >2,100 people representing 79 nationalities here to make a difference
Disaster relief and humanitarian missions: emergency.lu covered ~30 missions with
~70 deployments since 2012 and supported various COVID related initiatives
Broadband access: services deployed across Africa, Asia, and Latin America
Giving back initiatives: employees engage in charity and social projects
Diversity & inclusion: 79 nationalities; 24% women; healthy age distribution
Customer satisfaction: Video Net Promoter Score (NPS) improved to 58 and Networks
NPS improved to 38 (both scored on a scale of -100 to +100)
Commitment to attractive & fair compensation, flexible working conditions, and
employee welfare & development (>16,000 hours of training in 2020)
H1 2021 Results |
ALTERNATIVE PERFORMANCE MEASURES
21
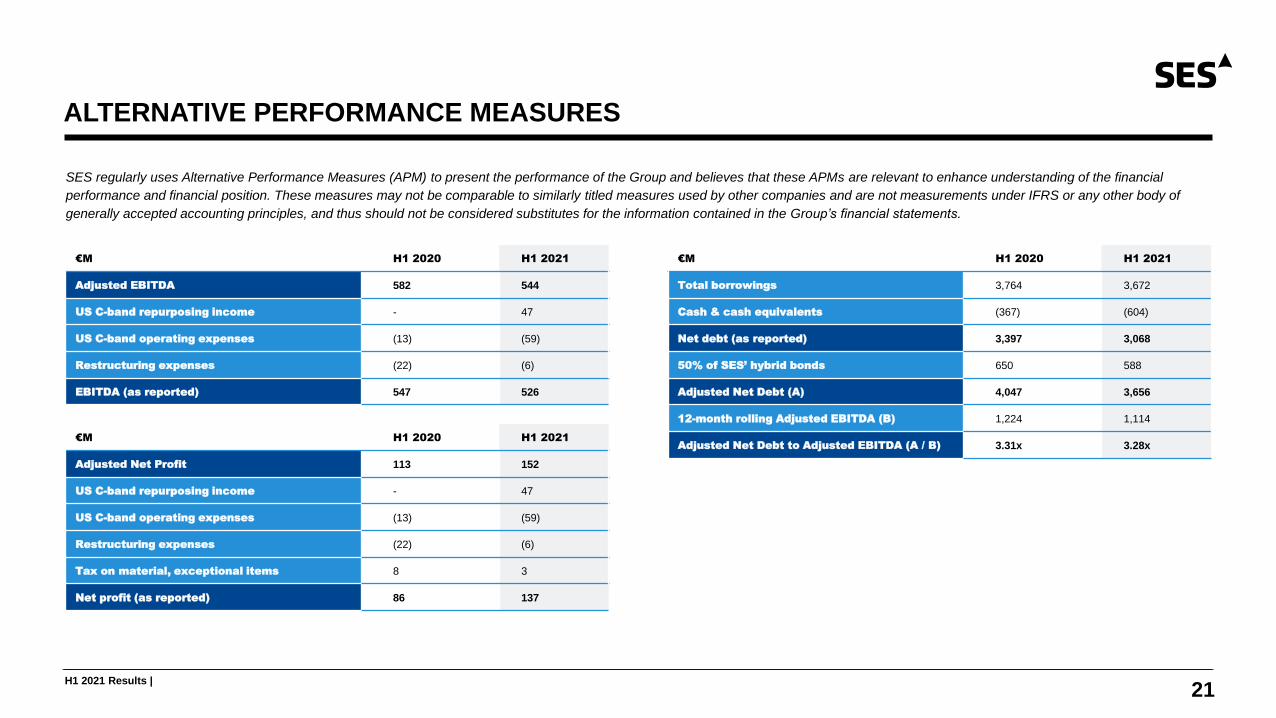
SES regularly uses Alternative Performance Measures (APM) to present the performance of the Group and believes that these APMs are relevant to enhance understanding of the financial
performance and financial position. These measures may not be comparable to similarly titled measures used by other companies and are not measurements under IFRS or any other body of
generally accepted accounting principles, and thus should not be considered substitutes for the information contained in the Group’s financial statements.
€M H1 2020 H1 2021
Adjusted EBITDA 582 544
US C-band repurposing income - 47
US C-band operating expenses (13) (59)
Restructuring expenses (22) (6)
EBITDA (as reported) 547 526
€M H1 2020 H1 2021
Total borrowings 3,764 3,672
Cash & cash equivalents (367) (604)
Net debt (as reported) 3,397 3,068
50% of SES’ hybrid bonds 650 588
Adjusted Net Debt (A) 4,047 3,656
12-month rolling Adjusted EBITDA (B) 1,224 1,114
Adjusted Net Debt to Adjusted EBITDA (A / B) 3.31x 3.28x€M H1 2020 H1 2021
Adjusted Net Profit 113 152
US C-band repurposing income - 47
US C-band operating expenses (13) (59)
Restructuring expenses (22) (6)
Tax on material, exceptional items 8 3
Net profit (as reported) 86 137
H1 2021 Results |
Disclaimer
This presentation does not, in any jurisdiction, including without limitation in the US, constitute or form part of, and should not be construed as, any offer for sale of, or solicitation of any offer to
buy, or any investment advice in connection with, any securities of SES, nor should it or any part of it form the basis of, or be relied on in connection with, any contract or commitment whatsoever.
No representation or warranty, express or implied, is or will be made by SES, its directors, officers or advisors, or any other person, as to the accuracy, completeness or fairness of the
information or opinions contained in this presentation, and any reliance you place on them will be at your sole risk. Without prejudice to the foregoing, none of SES, or its directors, officers or
advisors accept any liability whatsoever for any loss however arising, directly or indirectly, from use of this presentation or its contents or otherwise arising in connection therewith.
This presentation includes “forward-looking statements”. All statements other than statements of historical fact included in this presentation, including without limitation those regarding SES’
financial position, business strategy, plans and objectives of management for future operations (including development plans and objectives relating to SES products and services), are forward-
looking statements. Such forward-looking statements involve known and unknown risks, uncertainties and other important factors that could cause the actual results, performance or
achievements of SES to be materially different from future results, performance or achievements expressed or implied by such forward-looking statements. Such forward-looking statements are
based on numerous assumptions regarding SES and its subsidiaries and affiliates, present and future business strategies, and the environment in which SES will operate in the future, and such
assumptions may or may not prove to be correct. These forward-looking statements speak only as at the date of this presentation. Forward-looking statements contained in this presentation
regarding past trends or activities should not be taken as a representation that such trends or activities will occur or continue in the future. SES, and its directors, officers and advisors do not
undertake any obligation to update or revise any forward-looking statements, whether as a result of new information, future events or otherwise.
22
23
Connect with us
Richard Whiteing
Investor Relations
T +352 710 725 261
M +352 691 898 956
Michelle Suc
Investor Relations
T +352 710 725 403
M +352 621 228 182