Embed Size (px)
Citation preview

Q2 and H1 2021
CEO Terje Wibe and CFO Fredrik Eeg
25 August 2021

Our Vision
We aim to be the preferred e-tendering and procurement platform in Europe by unleashing the full potential of a user-friendly and trusted marketplace.

▪ Unrivaled market leader in the Nordics and the Netherlands
▪ Close to 30,000 paying customers
▪ One of few platforms servicing both buyers and suppliers and multiple markets
▪ Scalable and profitable business model
▪ Proven organic and M&A growth ability
▪ Positioned to be the consolidator in European eTendering and eProcurement
We have established a unique market position
3
Norway; 21%
Sweden; 29%
Denmark; 20%
Finland; 14%
Netherlands; 9%
Other; 7%
ARR split Q2’21
Mercell leading player
Mercell foothold
NOK
770mARR

0
100
200
300
400
500
600
700
800
900
Q1'19 Q2'19 Q3'19 Q4'19 Q1'20 Q2'20 Q3'20 Q4'20 Q1'21 Q2'21
Organic Acquisitions
Annual Recurring Revenue (ARR)
▪ ARR increase from NOK 98 million in Q1’19 to NOK 770 million in Q2’21
▪ Active acquisition strategy
− Consolidated Nordic region and begun venturing into continental Europe
− Acquired 12 companies since Q2’19
− Strong continued performance in the acquired companies show the potential of well-executed M&A
Grown into one of the largest Nordic B2B SaaS companies
4
Commerce
Annual Recurring Revenue (ARR)NOK million

▪ Year on year ARR growth of 158%, with 21% organic growth
▪ Revenue last 12 months of NOK 505m, +118% vs. Q2’20
▪ Continued expansion in Q2’21− Consolidating the Nordics with milestone
acquisition of Finnish market leader Cloudia
− Bolt-on acquisitions of CTM Solutions in the Netherlands and Ibistic in Denmark
− Acquisition funding secured through NOK 400 million share issue and SEK 500 million bond tap issue
Strong ARR and revenue growth
ARR and revenue developmentNOKm
299338
552
634
770
232263
312
403
505
LTM toQ2 2020
LTM toQ3 2020
LTM toQ4 2020
LTM toQ1 2021
LTM toQ2 2021
ARR Revenue (LTM)
* Revenue as reported under IFRS in 2021 and NGAAP in 2020
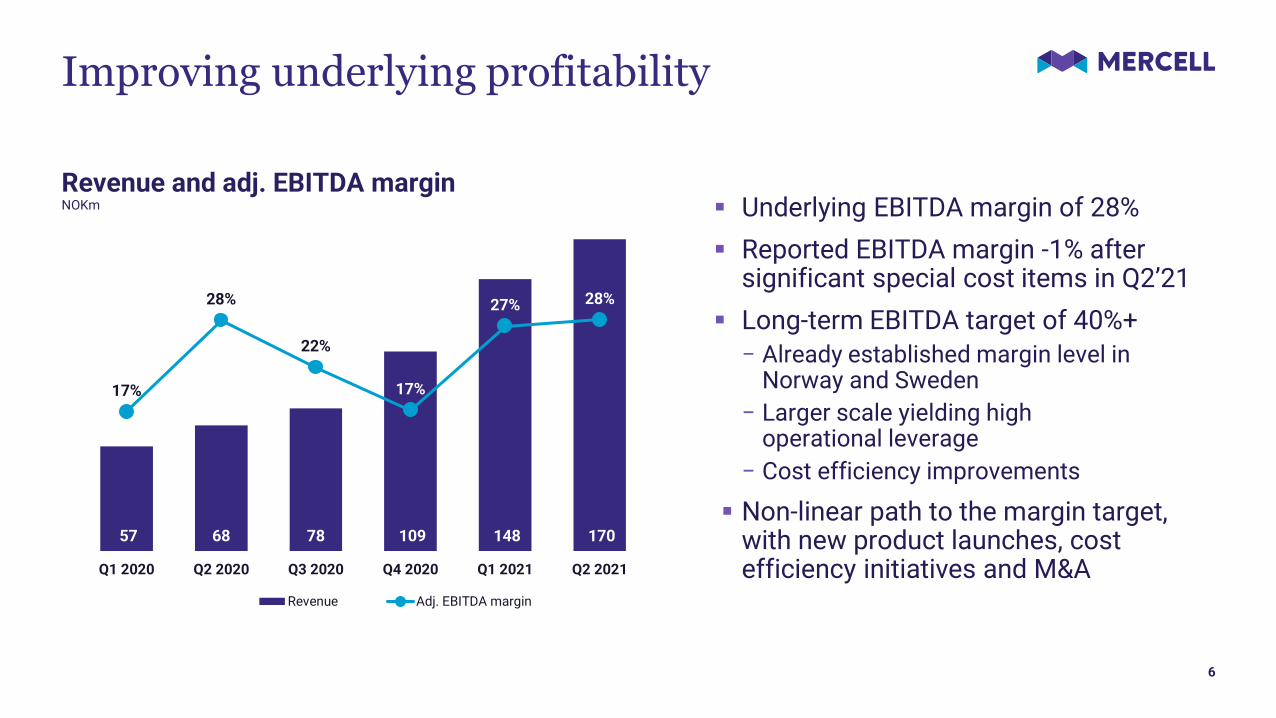
Improving underlying profitability
6
Revenue and adj. EBITDA marginNOKm
57 68 78 109 148 170
17%
28%
22%
17%
27% 28%
Q1 2020 Q2 2020 Q3 2020 Q4 2020 Q1 2021 Q2 2021
Revenue Adj. EBITDA margin
▪ Underlying EBITDA margin of 28%
▪ Reported EBITDA margin -1% after significant special cost items in Q2’21
▪ Long-term EBITDA target of 40%+− Already established margin level in
Norway and Sweden
− Larger scale yielding high operational leverage
− Cost efficiency improvements
▪ Non-linear path to the margin target, with new product launches, cost efficiency initiatives and M&A

M&A
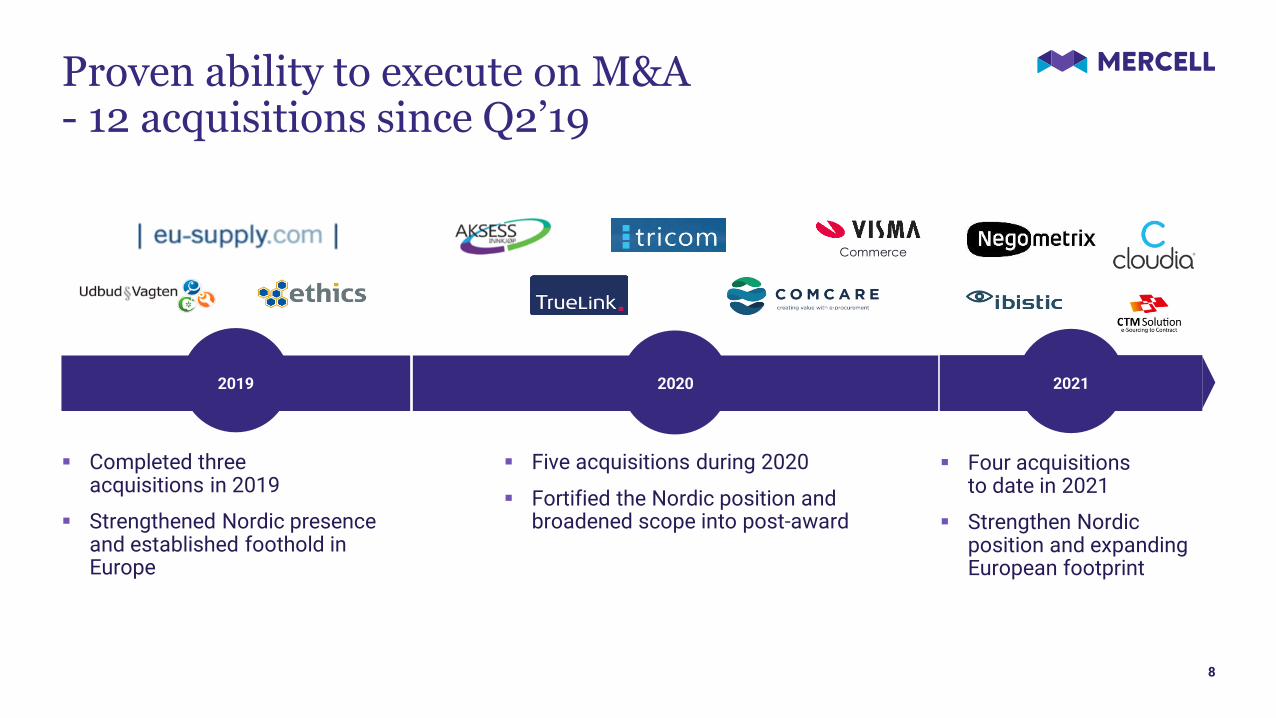
Proven ability to execute on M&A- 12 acquisitions since Q2’19
▪ Completed three acquisitions in 2019
▪ Strengthened Nordic presence and established foothold in Europe
8
▪ Five acquisitions during 2020
▪ Fortified the Nordic position and broadened scope into post-award
▪ Four acquisitions to date in 2021
▪ Strengthen Nordic position and expanding European footprint
Commerce
2019 2020 2021

▪ Leading Finnish eTendering platform− Customer base including 95 of the 100
largest Finnish municipalities and ten of the largest cities
− 558 buy-side customers
▪ Acquisition based on M&A playbook− Strong public buy side position as ideal
fundament for supply side expansion− Opportunity to cross sell post-award
solutions
▪ ARR Q2’21 of EUR 9.9m, +13% from YE’20
Cloudia Oy acquisition –Consolidating the Nordic market position
9
Q2’21Q4’20 Q1’21
+13%
Cloudia ARR development EUR

Implementing Mercell best practices-shows the potential of value-accretive M&A
10
Commerce
Q4’20Q4’19 Q2’21Q2’20 Q3’20Q1’20 Q1’21
+2%
+10%
Mercell Commerce ARR development NOK
Applied several new sales initiatives already beginning to take effect
▪ Implementing the ‘Mercell way of sales’
▪ Strengthening sales team
▪ New CRM system set to improve sales and marketing automation
▪ Launching and up-selling new products
Acquisition of

Product and technology development

Mercell provides workflow solutions for the full procurement life cycle
12
Source to contract (pre-award)
Identify tender area
Sourcing and plan tender
Create & publish tender
Evaluate & award
contract
Procurement & goods handling
Invoice approval & automation
Payment(ERP)
Spend Management
Purchase to pay (post-award)
Contract management
Mercell Tender Notification System
New tender
Tender Management for buyers & suppliers
Contract Management Purchase items and services.Automated invoice handling.
Automatic controlling and spend management
New tender
Submitted
Submitted

Moving towards a common platform suite
13
TendSign
Pre-award Post-award▪ Moving towards a common platform suite replacing the multiple
platforms currently used across the source-to-pay chain
▪ Mercell Source To Contract for pre-award buyers
− Based on the ‘battle-tested’ NX4 platform currently in use in the Netherlands,
Bulgaria and the US
− Starting to upgrade Danish customers in Q3’21, followed by Norway and
Sweden
▪ Mercell Tender Finder for pre-award suppliers
− Rebuilding platform with greatly improved functionality and user interface
based on ‘best of breed’ solutions
− Soft launched in Norway with first customers onboarding in Q3’21, followed
by Denmark
▪ Mercell Procure To Pay for post-award customers
− Ongoing enhancement of the Tricom platform, planning to upgrade first
customers in Norway and Denmark in Q1’22Source-to-contract
Tender FinderProcure-to-Pay

Mercell Source-to-Contract for pre-award buyers
- Localising and rolling out across our markets
Denmark
Netherlands, Bulgaria and US
Norway & Sweden
Q3
14

Mercell Tender Finder soft launched in Norway
- A new ‘Google-like’ search engine
15
Advanced Search
Filtering
Notifications
Surveillance

The Mercell marketplace
16
A large two-sided marketplace matching buyers and suppliers, with increasing network effects as the marketplace grows
More buyers More suppliers
More bids
More tenders
Buyers Suppliers

Financials

▪ ARR +NOK 136m
− Organic growth of NOK 15m
− New sales of NOK 17m
− Upselling NOK 25m
− Churn/contraction NOK -19m
− Currency/Other NOK -8m
− NOK 122m from acquisitions
− Cloudia NOK 104m
− Ibistic NOK 12m
− CTM Solutions NOK 6m
ARR growth overview Q2 2021
18
ARR bridge Q2 2021NOKm
634
770
17
25
-19 -8
122
Churn/contraction
ARR Mar’21 New sales Upselling ARR Jun’21Currency/Other
Acquired ARR
at time of acquisitionNet retention

▪ Year on year revenue growth and operating costs supported by six acquisitions
▪ M&A cost and special items NOK 49.8m
▪ Higher depreciation & amortization reflecting acquisitions and higher R&D
▪ Impairment reflecting platform consolidation
▪ Net financial items significantly impacted by foreign exchange losses
Profit & Loss
19
NOKm Q2 2020 Q2 2021 % growth
Total revenue 68 471 170 300 149 %
Operating costs -49 335 -122 597 148 %
M&A cost -3 317 -25 092
Other special items -6 836 -24 756
EBITDA 8 982 -2 145
EBITDA-margin 13 % -1 %
Adjusted EBITDA 19 135 47 703 149 %
Adj. EBITDA-margin 28 % 28 %
Depreciation & Amort. -10 710 -43 686
Impairment - -14 814
EBIT -1 728 -60 645
Net financial items -3 784 -64 449
Profit/loss before tax -5 512 -125 049
Profit & Loss Account (unaudited)
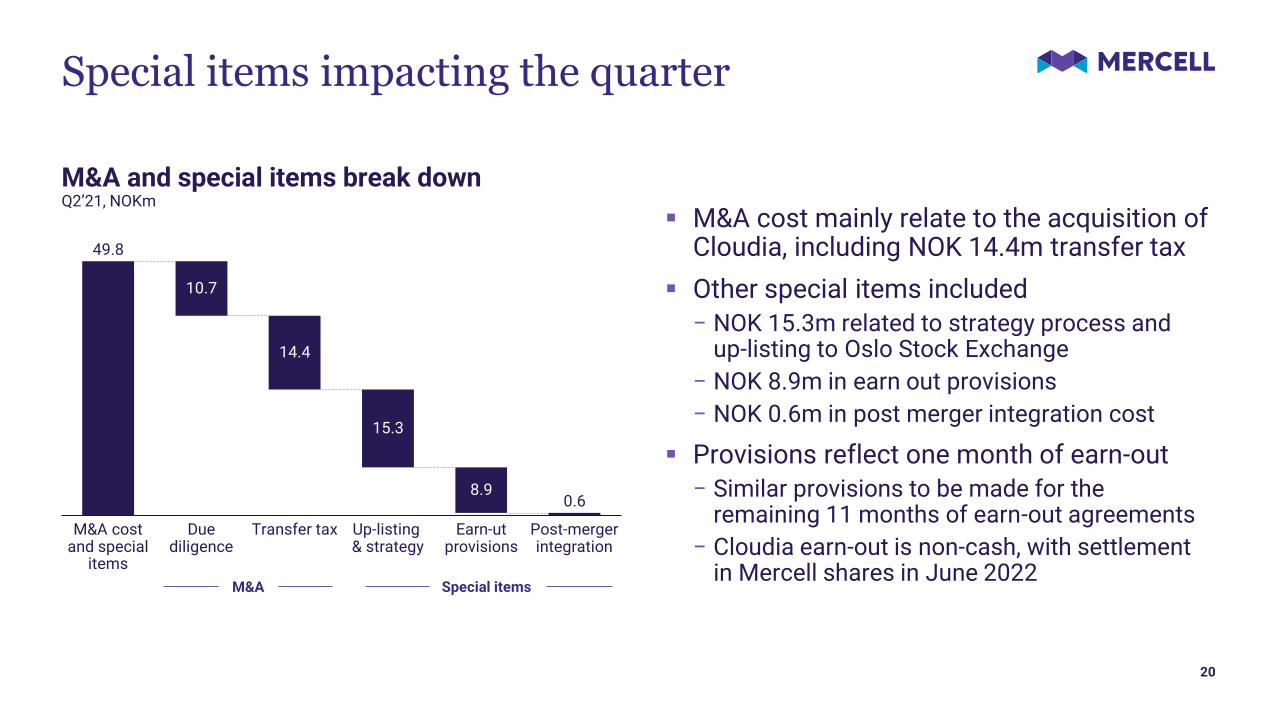
▪ M&A cost mainly relate to the acquisition of Cloudia, including NOK 14.4m transfer tax
▪ Other special items included− NOK 15.3m related to strategy process and
up-listing to Oslo Stock Exchange
− NOK 8.9m in earn out provisions
− NOK 0.6m in post merger integration cost
▪ Provisions reflect one month of earn-out − Similar provisions to be made for the
remaining 11 months of earn-out agreements
− Cloudia earn-out is non-cash, with settlement in Mercell shares in June 2022
Special items impacting the quarter
20
8.9
Transfer tax
10.7
M&A cost and special
items
Due diligence
14.4
15.3
Up-listing & strategy
Earn-ut provisions
Post-merger integration
49.8
0.6
M&A Special items
M&A and special items break downQ2’21, NOKm

▪ Rapid pace of innovation and new product launches
▪ Software development cost of NOK 34m in Q1’21 and NOK 47m in Q2’21
▪ Planning for NOK 160-180m in 2021, and similar level in 2022− Lower Capex/Revenue in 2022, with the ratio
set to decline further in the years to come
Capitalized software developmentNOKm
Capitalized development costs
21
81
160-180
1H 2021 2021
Q1
Q2
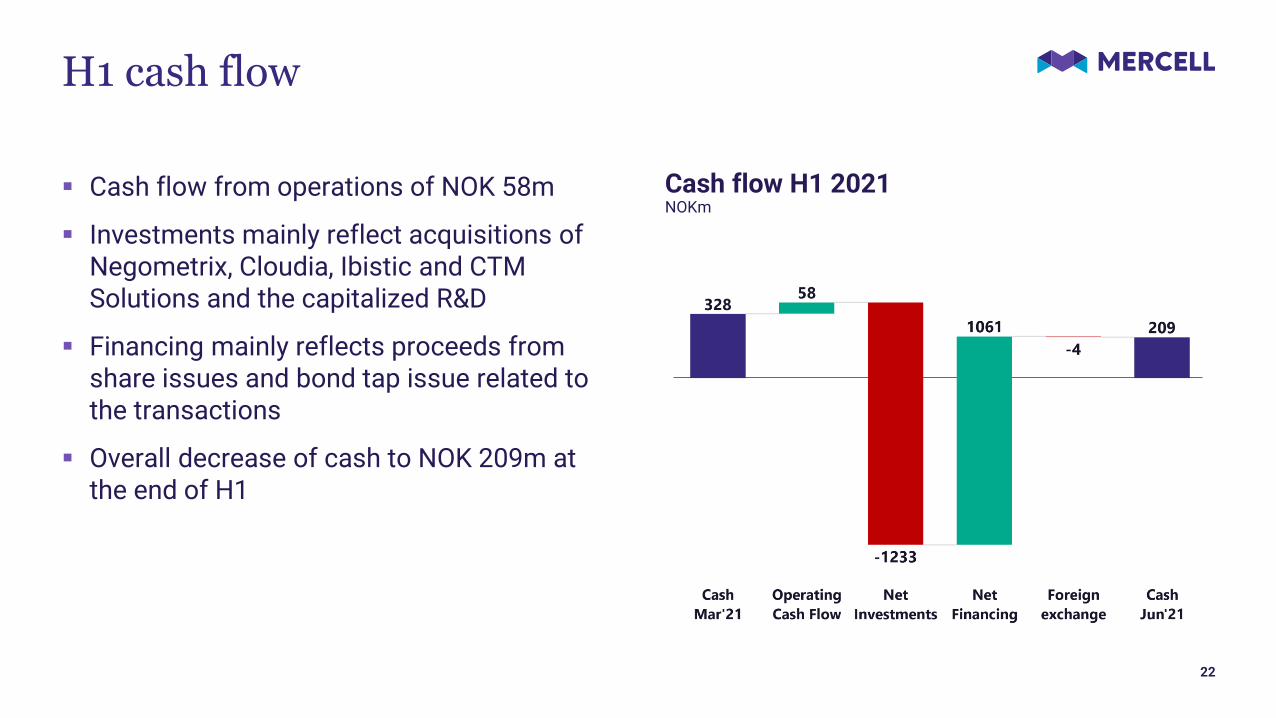
▪ Cash flow from operations of NOK 58m
▪ Investments mainly reflect acquisitions of Negometrix, Cloudia, Ibistic and CTM Solutions and the capitalized R&D
▪ Financing mainly reflects proceeds from share issues and bond tap issue related to the transactions
▪ Overall decrease of cash to NOK 209m at the end of H1
H1 cash flow
22
Cash flow H1 2021NOKm

▪ Increase in intangible assets reflecting M&A and software development
▪ Strengthened equity position through positive earnings and equity issue
▪ Equity ratio of 48 %
▪ Cash position of NOK 209m
▪ NIBD of NOK 1.45bn
▪ In compliance with all loan covenants
▪ Signed NOK 100m RCF in July, for general purposes and acquisition financing
Balance sheet
23
AssetsNOKm
726
3 484
4 657
Q2'20 YE'20 Q2'21
Current liabilities
Non-current liabilities
Total equity
726
3 484
4 657
Q2'20 YE'20 Q2'21
Goodwill Other intangiblesOther non-current Current assetsCash
Equity and liabilities

Outlook and summary

▪ Significant savings with simpler and more efficient processes
▪ Less ‘red-tape’ and administrative burdens
▪ Increased transparency and traceability reduces corruption
▪ Greater innovation and improved access for SMEs
EU Commission on digital procurement
What we do is important!
25
▪ Mercell markets score high on the EU Single Scoreboard for public procurement
▪ Score performance indicators emphasise core principles of public procurement
− Ensure widespread distribution
− Increase number of bidders
− Increase SME participation
SatisfactoryAverageUnsatisfactory
EU procurement performance scoreboard1

ARR in existing markets >2x from YE’20 to YE’25 Supply-side set to drive growth
▪ Introducing new supply-side platform in Scandinavia from H2’21 onwards
▪ Significant upside potential in establishing dual platforms in the Netherlands and Finland
▪ Growing marketplace will enable increasing network effects
High ambitions for long-term growth
26
607
2020* Buyers Suppliers Post-award 2025
*2020 ARR including Negometrix YE’20
Pre-award
CAGR+15% - 20%

▪ Completed Nordic consolidation
▪ Started venture into Europe
▪ Acquired 12 companies over the past 25 months and six over the past year
▪ Continued high growth ambitions for European expansion
▪ Main focus on integration of the recently acquired units and profitable growth in the existing business in H2 2021
Large European opportunity
27
Mercell leading player
Mercell foothold

Long-term outlook
28
FY 2020 Long-term ambitions
NOK 607m*
>2x in existing markets by 2025
Build similar size in new European markets
Explore US opportunity
ARR
19% 40%+Adj. EBITDA margins
Added ARR of ~NOK 200m per year(avg last 2 years to Q1’21*)
Continuing at same pacenext three years
M&A
Q2’21
NOK 770m
28%
NOK 183m YTD
*Includes Negometrix, acquired in February 2021

Next event
November 24, 2021: Quarterly Report – Q3

Appendix
Q2 2021
Reported financials
Q2 2021(01.04-30.06)
Q2 2020(01.04-30.06)
YTD 2021(01.01-30.06)
YTD 2020(01.01-30.06)
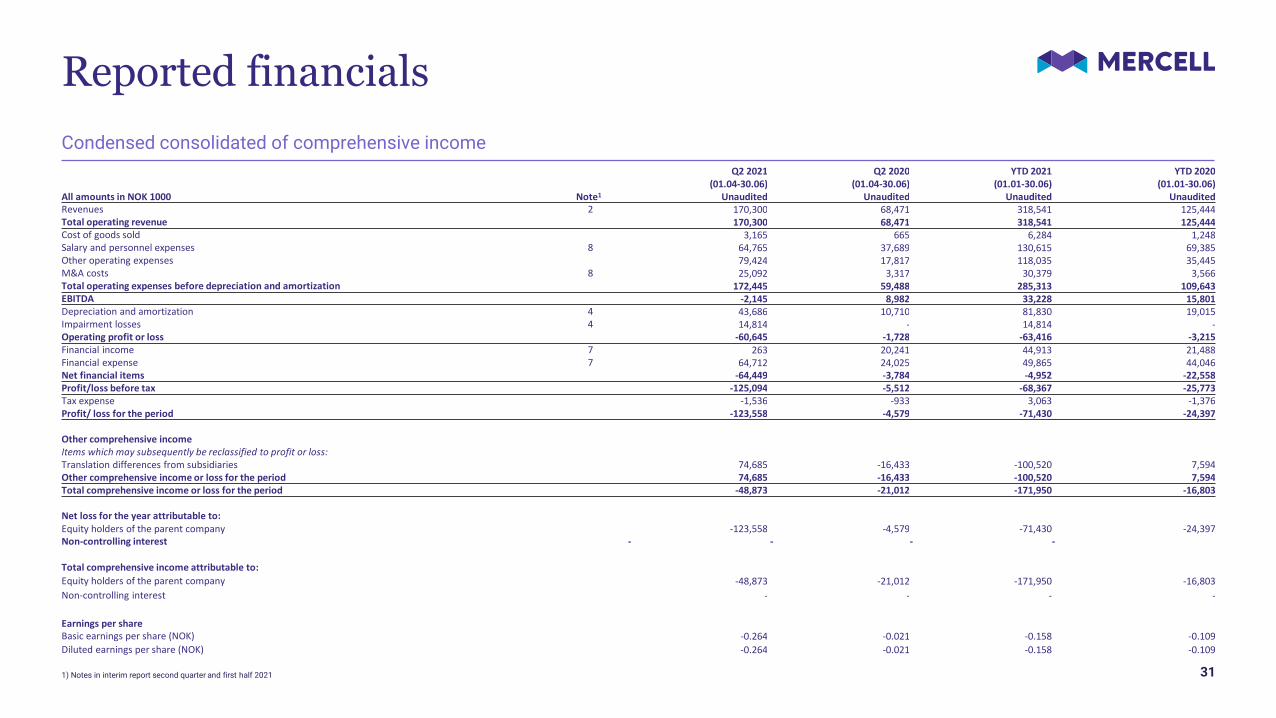
All amounts in NOK 1000 Note1 Unaudited Unaudited Unaudited UnauditedRevenues 2 170,300 68,471 318,541 125,444Total operating revenue 170,300 68,471 318,541 125,444Cost of goods sold 3,165 665 6,284 1,248Salary and personnel expenses 8 64,765 37,689 130,615 69,385Other operating expenses 79,424 17,817 118,035 35,445M&A costs 8 25,092 3,317 30,379 3,566Total operating expenses before depreciation and amortization 172,445 59,488 285,313 109,643EBITDA -2,145 8,982 33,228 15,801Depreciation and amortization 4 43,686 10,710 81,830 19,015Impairment losses 4 14,814 - 14,814 -Operating profit or loss -60,645 -1,728 -63,416 -3,215Financial income 7 263 20,241 44,913 21,488Financial expense 7 64,712 24,025 49,865 44,046Net financial items -64,449 -3,784 -4,952 -22,558Profit/loss before tax -125,094 -5,512 -68,367 -25,773Tax expense -1,536 -933 3,063 -1,376Profit/ loss for the period -123,558 -4,579 -71,430 -24,397
Other comprehensive incomeItems which may subsequently be reclassified to profit or loss:Translation differences from subsidiaries 74,685 -16,433 -100,520 7,594Other comprehensive income or loss for the period 74,685 -16,433 -100,520 7,594Total comprehensive income or loss for the period -48,873 -21,012 -171,950 -16,803
Net loss for the year attributable to:Equity holders of the parent company -123,558 -4,579 -71,430 -24,397Non-controlling interest - - - -
Total comprehensive income attributable to:
Equity holders of the parent company -48,873 -21,012 -171,950 -16,803
Non-controlling interest - - - -
Earnings per shareBasic earnings per share (NOK) -0.264 -0.021 -0.158 -0.109Diluted earnings per share (NOK) -0.264 -0.021 -0.158 -0.109
1) Notes in interim report second quarter and first half 2021 31
Condensed consolidated of comprehensive income

202130.06
202031.12
All amounts in NOK 1000 Note1 Unaudited Audited
Share capital 5 100,425 82,720
Share premium 2,577,352 1,791,125
Other equity -419,241 -255,916
Total equity 2,258,535 1,617,930
Non-current interest-bearing liabilities 6 1,637,312 1,144,186
Deferred tax liabilities 192,987 151,462
Other non-current liabilities 5,524 4,526
Other non-current financial liabilities 1,188 1,262
Total non-current liabilities 1,837,011 1,301,436
Current interest-bearing liabilities 6 23,172 15,713
Trade and other payables 90,018 88,705
Contract liabilities 326,259 235,682
Other current financial liabilities 121,788 224,478
Total current liabilities 561,237 564,578
Total liabilities 2,398,248 1,866,014
Total equity and liabilities 4,656,783 3,483,944
202130.06
202031.12
All amounts in NOK 1000 Note1 Unaudited Audited
Deferred tax assets 32,457 26,703
Goodwill 4 3,086,488 2,114,806
Intangible assets 4 1,104,326 811,442
Right-of-use assets 72,319 58,329
Property, plant & equipment 14,401 6,361
Other non-current assets 18,646 14,549
Other non-current receivables 5,877 5,600
Total non-current assets 4,334,515 3,037,789
Trade and other receivables 100,470 118,049
Contract assets 12,318 122
Cash and cash equivalents 209,480 327,984
Total current assets 322,268 446,155
Total assets 4,656,783 3,483,944
Reported financials
32
Condensed consolidated statements of financial position: AssetsCondensed consolidated statements of financial position: Equity and liabilities
1) Notes in interim report second quarter and first half 2021
Reported financials
33
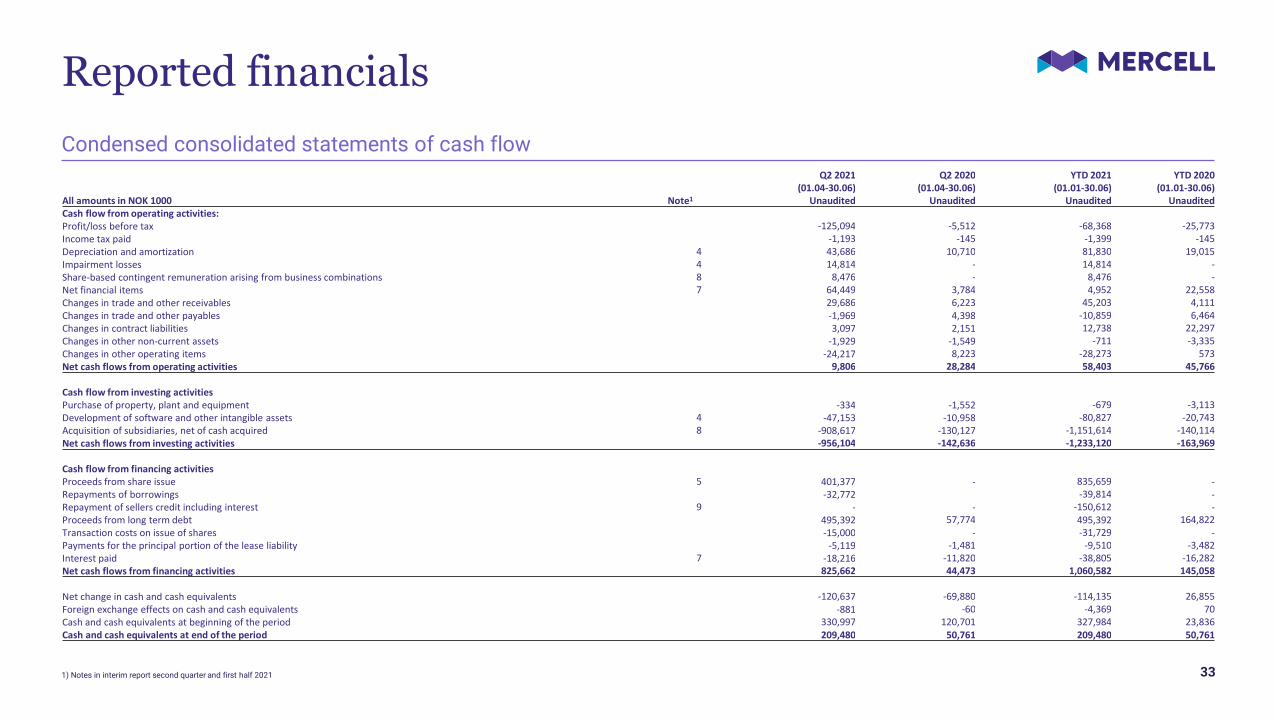
Condensed consolidated statements of cash flow
1) Notes in interim report second quarter and first half 2021
Q2 2021(01.04-30.06)
Q2 2020(01.04-30.06)
YTD 2021(01.01-30.06)
YTD 2020(01.01-30.06)
All amounts in NOK 1000 Note1 Unaudited Unaudited Unaudited UnauditedCash flow from operating activities:Profit/loss before tax -125,094 -5,512 -68,368 -25,773Income tax paid -1,193 -145 -1,399 -145Depreciation and amortization 4 43,686 10,710 81,830 19,015Impairment losses 4 14,814 - 14,814 -Share-based contingent remuneration arising from business combinations 8 8,476 - 8,476 -Net financial items 7 64,449 3,784 4,952 22,558Changes in trade and other receivables 29,686 6,223 45,203 4,111Changes in trade and other payables -1,969 4,398 -10,859 6,464Changes in contract liabilities 3,097 2,151 12,738 22,297Changes in other non-current assets -1,929 -1,549 -711 -3,335Changes in other operating items -24,217 8,223 -28,273 573Net cash flows from operating activities 9,806 28,284 58,403 45,766
Cash flow from investing activitiesPurchase of property, plant and equipment -334 -1,552 -679 -3,113Development of software and other intangible assets 4 -47,153 -10,958 -80,827 -20,743Acquisition of subsidiaries, net of cash acquired 8 -908,617 -130,127 -1,151,614 -140,114Net cash flows from investing activities -956,104 -142,636 -1,233,120 -163,969
Cash flow from financing activitiesProceeds from share issue 5 401,377 - 835,659 -Repayments of borrowings -32,772 -39,814 -Repayment of sellers credit including interest 9 - - -150,612 -Proceeds from long term debt 495,392 57,774 495,392 164,822Transaction costs on issue of shares -15,000 - -31,729 -Payments for the principal portion of the lease liability -5,119 -1,481 -9,510 -3,482Interest paid 7 -18,216 -11,820 -38,805 -16,282Net cash flows from financing activities 825,662 44,473 1,060,582 145,058
Net change in cash and cash equivalents -120,637 -69,880 -114,135 26,855Foreign exchange effects on cash and cash equivalents -881 -60 -4,369 70Cash and cash equivalents at beginning of the period 330,997 120,701 327,984 23,836Cash and cash equivalents at end of the period 209,480 50,761 209,480 50,761

▪ Cash flow from operations of NOK 10m− Impacted by special items and negative net
working capital development
▪ Investments mainly reflect acquisitions of Cloudia, Ibistic and CTM Solution and the capitalized R&D
▪ Financing mainly reflects proceeds from share issue and bond tap issue in June
▪ Overall decrease of cash to NOK 209m at the end of Q2
▪ Signed NOK 100m RCF in July− For general purposes and acquisition financing
Q2 cash flow overview
34
Cash flow Q2 2021NOKm

Largest shareholders
As of August 20, 2021 35
Top 20 shareholders
Investor Holding % of total
VIKING VENTURE (Combined 16, 16B, 16C and 16D) 53,067,864 10.6 %
State Street Bank and Trust Comp 40,800,000 8.1 %
Citibank, N.A. 30,512,288 6.1 %
Skandinaviska Enskilda Banken AB 29,247,857 5.8 %
The Bank of New York Mellon SA/NV 24,818,226 4.9 %
Morgan Stanley & Co. Int. Plc. 18,542,512 3.7 %
VERDIPAPIRFONDET DNB NORGE 16,522,253 3.3 %
UBS SECURITIES LLC 16,000,000 3.2 %
Morgan Stanley & Co. LLC 14,692,696 2.9 %
JPMorgan Chase Bank, N.A., London 12,144,904 2.4 %
Myrlid AS 10,186,144 2.0 %
Nordnet Bank AB 10,140,478 2.0 %
GRIEG HOLDINGS II AS 9,567,947 1.9 %
J.P. Morgan Securities LLC 8,863,793 1.8 %
State Street Bank and Trust Comp 8,852,179 1.8 %
HSBC TRINKAUS & BURKHARDT AG 7,923,000 1.6 %
CAMIVEO AS 7,023,897 1.4 %
The Bank of New York Mellon SA/NV 6,840,232 1.4 %
GLABELLA AS 6,542,397 1.3 %
Brown Brothers Harriman & Co. 6,263,951 1.2 %
Top 20 shareholders 338,552,618 67.4 %
Other shareholders 163,570,625 32.6 %
Total number of shares 502,123,243 100.0 %

This presentation (the “Presentation") has been prepared by Mercell Holding ASA (the "Company“ or “Mercell”, and together with its consolidated subsidiaries, the "Group")
The Presentation contains forward-looking information and statements relating to the business, financial performance and results of the Company and/or industry and markets in which it operates. Forward-looking statements concern future circumstances and results and other statements that are not historical facts, sometimes identified by the words “aims”, “anticipates”, “ambitions”, “believes”, “estimates”, “expects”, “foresees”, “intends”, “plans”, “predicts”, “projects”, “targets”, and similar expressions. Any forward-looking statements and other information contained in this Presentation, including assumptions, opinions and views of Mercell or cited from third party sources are solely opinions and forecasts based on the current expectations, estimates and projections of the Company or assumptions based on information currently available to the Company, which are subject to risks, uncertainties and other factors that may cause actual events to differ materially from any anticipated development.
Important factors may lead to actual profits, results and developments deviating substantially from what has been expressed or implied in such statements. Although Mercell believes that its expectations and the Presentation are based upon reasonable assumptions, it can give no assurance that those expectations will be achieved or that the actual results will be as set out in the Presentation. The Company assumes no obligation, except as required by law, to update any forward-looking statements or to conform these forward-looking statements to its actual results.
Mercell makes no representation or warranty, expressed or implied, as to the accuracy, reliability or completeness of the Presentation, and neither the Company nor any of its directors, officers or employees shall be liable to you or to any other party for any losses
incurred as a result of your or their use of, or reliance on, any information contained in the Presentation.
This Presentation does not constitute or form part of, and is not prepared or made in connection with, an offer or invitation to sell, or any solicitation of any offer to subscribe for or purchase any securities, and nothing contained herein shall form the basis of any contract or commitment whatsoever. No reliance may be placed for any purpose whatsoever on the information contained in this Presentation or on its completeness, accuracy or fairness. The information in this Presentation is subject to verification, completion and change. The contents of this Presentation have not been independently verified. The Company’s securities have not been and will not be registered under the United States Securities Act of 1933, as amended (the “US Securities Act”), and are offered and sold only outside the United States in accordance with an exemption from registration provided by Regulation S under the US Securities Act. This Presentation should not form the basis of any investment decision.
The Presentation speaks and reflects prevailing conditions and views as of the date of this presentation. It may be subject to corrections and change at any time without notice except as required by law. The delivery of this Presentation or any further discussions of the Company with any recipient shall not, under any circumstances, create any implication that the Company assumes any obligation to update or correct the information herein, nor any implication that there has been no change in the affairs of the Company since such date.
Disclaimer

37