Embed Size (px)
Citation preview
H1 2021Results
July 27, 2021
Results H1 2021 Wereldhave N.V. 2
Wereldhave Full Service Centers contribute to a more joyful and comfortable everyday life.
A one-stop location for groceries, shopping, leisure, relaxation, sports, health, work and other daily needs, all supported
by smart concepts and digital services. By investing sustainably to meet the needs of customers and local areas, we enrich communities, while caring for the environment, and have a positive effect on the way people live, work and shop.
Wereldhave Full Service Centers play a vital role in people’s everyday lives in leading regional cities in the Netherlands,
Belgium and France.
Results H1 2021 Wereldhave N.V. 3
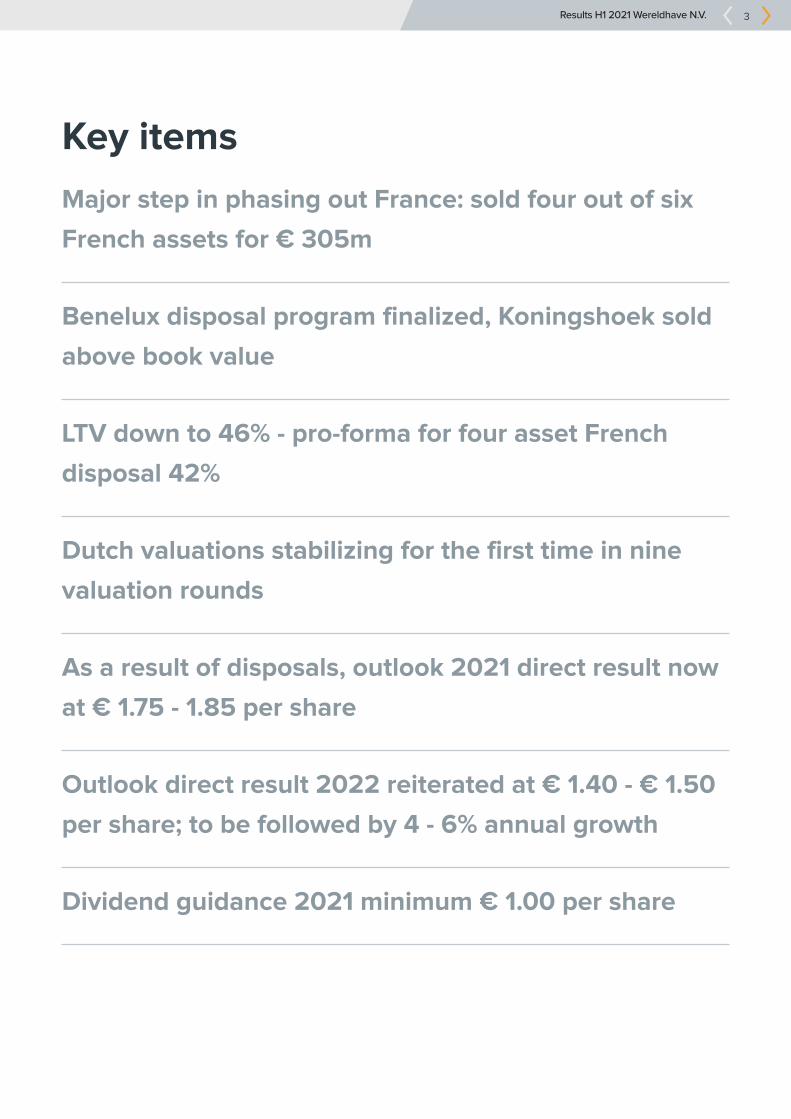
Key items
Major step in phasing out France: sold four out of six
French assets for € 305m
Benelux disposal program finalized, Koningshoek sold
above book value
LTV down to 46% - pro-forma for four asset French
disposal 42%
Dutch valuations stabilizing for the first time in nine
valuation rounds
As a result of disposals, outlook 2021 direct result now
at € 1.75 - 1.85 per share
Outlook direct result 2022 reiterated at € 1.40 - € 1.50
per share; to be followed by 4 - 6% annual growth
Dividend guidance 2021 minimum € 1.00 per share
Results H1 2021 Wereldhave N.V. 4
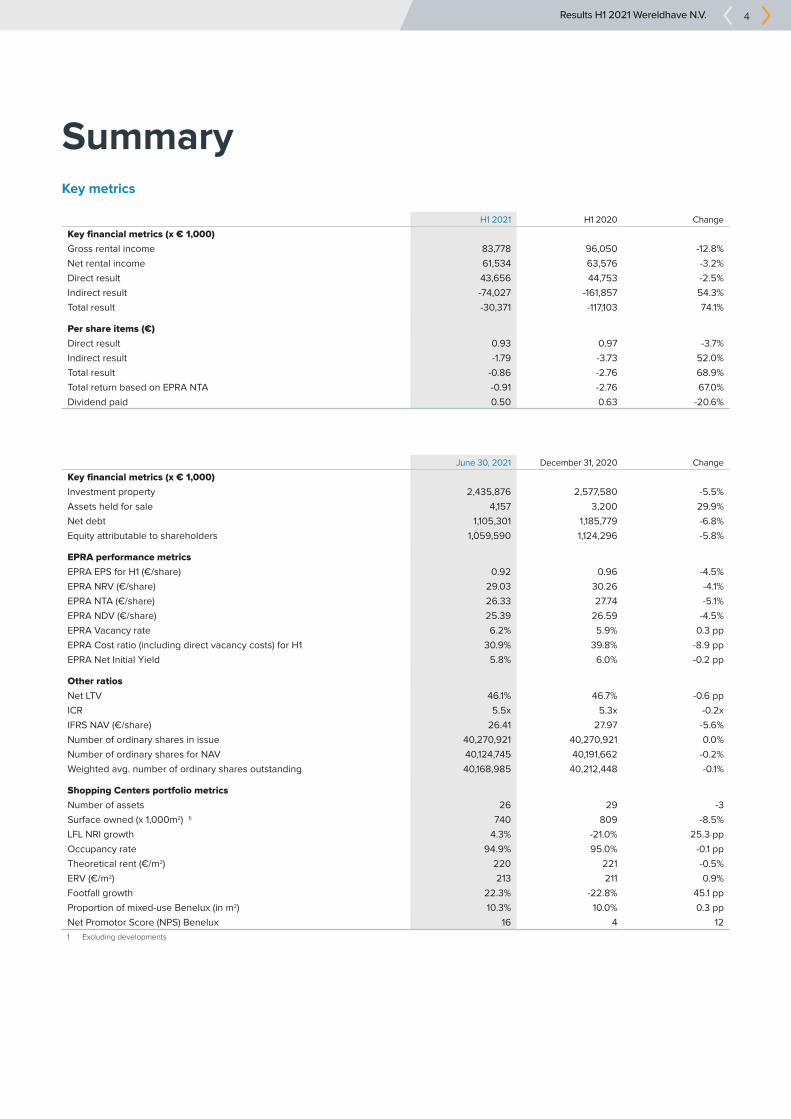
SummaryKey metrics
H1 2021 H1 2020 Change
Key financial metrics (x € 1,000)
Gross rental income 83,778 96,050 -12.8%
Net rental income 61,534 63,576 -3.2%
Direct result 43,656 44,753 -2.5%
Indirect result -74,027 -161,857 54.3%
Total result -30,371 -117,103 74.1%
Per share items (€)
Direct result 0.93 0.97 -3.7%
Indirect result -1.79 -3.73 52.0%
Total result -0.86 -2.76 68.9%
Total return based on EPRA NTA -0.91 -2.76 67.0%
Dividend paid 0.50 0.63 -20.6%
June 30, 2021 December 31, 2020 Change
Key financial metrics (x € 1,000)
Investment property 2,435,876 2,577,580 -5.5%
Assets held for sale 4,157 3,200 29.9%
Net debt 1,105,301 1,185,779 -6.8%
Equity attributable to shareholders 1,059,590 1,124,296 -5.8%
EPRA performance metrics
EPRA EPS for H1 (€/share) 0.92 0.96 -4.5%
EPRA NRV (€/share) 29.03 30.26 -4.1%
EPRA NTA (€/share) 26.33 27.74 -5.1%
EPRA NDV (€/share) 25.39 26.59 -4.5%
EPRA Vacancy rate 6.2% 5.9% 0.3 pp
EPRA Cost ratio (including direct vacancy costs) for H1 30.9% 39.8% -8.9 pp
EPRA Net Initial Yield 5.8% 6.0% -0.2 pp
Other ratios
Net LTV 46.1% 46.7% -0.6 pp
ICR 5.5x 5.3x -0.2x
IFRS NAV (€/share) 26.41 27.97 -5.6%
Number of ordinary shares in issue 40,270,921 40,270,921 0.0%
Number of ordinary shares for NAV 40,124,745 40,191,662 -0.2%
Weighted avg. number of ordinary shares outstanding 40,168,985 40,212,448 -0.1%
Shopping Centers portfolio metrics
Number of assets 26 29 -3
Surface owned (x 1,000m2) 1) 740 809 -8.5%
LFL NRI growth 4.3% -21.0% 25.3 pp
Occupancy rate 94.9% 95.0% -0.1 pp
Theoretical rent (€/m2) 220 221 -0.5%
ERV (€/m2) 213 211 0.9%
Footfall growth 22.3% -22.8% 45.1 pp
Proportion of mixed-use Benelux (in m2) 10.3% 10.0% 0.3 pp
Net Promotor Score (NPS) Benelux 16 4 12
1 Excluding developments
Results H1 2021 Wereldhave N.V. 5
Message from our CEOWith valuations stabilizing and the vast majority of our disposals now complete, we have a strong balance sheet and sufficient liquidity to step up our LifeCentral strategy. Our operations have proved resilient, even in difficult market conditions. Given that we are approaching our “trough” earnings forecast for 2022 and have delivered most of our 2020-2022 management agenda, growth is once more in sight. For shareholders, it means a return to increased dividends, beginning next year. In addition, we have strengthened our lease portfolio. Over the past years, we have reduced our exposure to the vulnerable Benelux fashion segment while at the same time increasing the proportion of mixed-use in our portfolio. For our top ten Benelux tenants, all leases have now been secured or renewed successfully – a clear demonstration of the confidence these retail brands have in our portfolio and LifeCentral strategy. I am proud of our leasing and asset management teams who have achieved this, particularly as they were already working hard to support tenants through the Covid-19 crisis. Although the economic effects of Covid-19 will still be with us in the second half of the year, our expectation is that these will be centered around potential bankruptcies of smaller businesses. We don’t believe this will have a material impact on our occupancy rate or rents beyond what is already factored into our strategy. Following the completion of our Dutch disposal program in Q2, we have made significant progress in the phase-out of our French operations. We have now sold four of the six centers slated for disposal. The impact of this transaction will become visible in the figures at year-end 2021. Annual cost savings will be realized, starting in 2022. With the four French disposals, we are getting much closer to our targeted loan-to-value range of 30-40%. As Dutch valuations are stabilizing, it becomes more likely that we will reach our target range ahead of our year-end 2022 objective, even as we accelerate implementation of our LifeCentral transformation strategy. During H1, the decline in the value of our portfolio slowed significantly. In our view, this reflects lower risks for retail itself, and increased confidence in the prospects for mixed-use center strategies. In H1, we report a stable yield in the Netherlands for the first time since H1 2017, helped by an active investment market. In Belgium, yields for our leading Full Service Center (FSCs) transformations in Liège and Courtrai even narrowed, a first sign that our strategy is paying off and that our theory that FSCs will trade at lower yields than traditional shopping centers is valid. Looking forward, we will continue our LifeCentral journey, creating more FSCs in line with the program set out in our strategy. Today, we are announcing plans to transform our Sterrenburg center in Dordrecht into an FSC. Next year, we plan to deliver our first FSC projects in Courtrai, Tilburg, Capelle aan den IJssel, Dordrecht and Hoofddorp. Today, we are also re-confirming our Direct Result Per Share (DRPS) guidance for 2022, and targeted annual growth of 4-6% thereafter. At the same time, we now expect a DRPS for 2021 at € 1.75-1.85, but now including the € 0.13 negative impact from the sale of our French centers. To be clear, without this disposal impact, our DRPS guidance for the year would have increased. Now that most of our disposal program is complete and valuations stabilizing, we can also be more specific about future dividend distributions. Our proposal will be to distribute at least EUR 1.00 per share as a dividend for 2021; for 2022, we expect to return to our regular pay-out ratio of 75-85% of our direct result. We remain focused on realizing strong total returns for our shareholders – a track record of delivering regular and increasing dividends is something investors are right to expect from the only Dutch Real Estate Investment Trust (REIT) with a 75-year history on the stock market. Matthijs Storm, CEO Schiphol, 27 July 2021
Results H1 2021 Wereldhave N.V. 6
Our markets Covid-19
Lockdowns were gradually lifted during Q2. Less restrictions, allowing consumers to visit non-essential stores, had a positive effect on footfall. Restrictions on F&B and the leisure & entertainment sectors were eased only later, however; full reopening in these sectors is still to be confirmed. During H1, discussions with non-essential retailers were mainly focused on rental payments. Our Fair Support Policy again provided a good basis on which to handle case-by-case requests from retailers. Naturally, our discussions took into account changes in government policy and financial support provided to retailers. With stores reopening and an improvement in prospects for the economy, we were also able to restart conversations with prospective new tenants. This gives us confidence that the second half of the year will prove to be more dynamic than the first, with more new leases being concluded and existing leases renewed. This assumes, first, that there is no new wave of Covid-19 infections, resulting in further lockdowns. Secondly, it depends on the agility of non-essential retailers to seize opportunities from the expected surge in retail spending. At the same time, non-essential retailers will have to deal with a reduction in government support and built-up indebtedness.
Belgium
Following reopening, consumers have returned to our Belgian shopping centers and retail parks. Immediately after reopening, our centers are almost back to the levels witnessed in 2019, where high-street locations still face footfall levels 20-30% below pre-pandemic levels. Retailers’ turnover in out-of-town locations proved resilient despite recent lockdowns. Negotiations for new leases took slightly more time than usual; rent collection remains the main point of discussion between tenants and landlords. Sentiment among retailers is broadly divided. E-commerce continues to provide challenges for electronics / multimedia and for multi-brand fashion chains. Despite this, supermarkets, food stores, DIY stores, home decoration and furniture, F&B, and sporting goods retailers are looking to expand. Consequently, we expect the current market lull to end after the summer. With hardly any bankruptcies among larger retail chains, the rental market remains resilient for high-quality and well-occupied centers. Lower quality locations increasingly have to deal with rising vacancy, which in turn leads to a decline in market rents.” In Belgium, our occupancy rate and market rents have slightly increased in Q2. Meanwhile, the retail property investment market remained slow; values for shopping centers and retail parks were largely unchanged.
France
Despite centers reopening, the number of visitors is yet to reach its 2019 level, only partly due to the impact of e-commerce, but mainly because of continued limits on customer numbers at restaurants and cinemas. That said, consumer spending has increased, which means retailer turnover is recovering faster than footfall. In recent months, the French retail market has proved highly resilient. For larger tenants, there is no obvious major bankruptcy risk. For medium-sized retailers in mid-market fashion, risk is higher; many of these retailers remain under financial pressure. With cash available, it is more likely retailers will be able to restart operations, even if the market deteriorates and some are forced to close. Recently, for example, buyers came forward to take over the French operations of fashion retailer GAP, following its decision to withdraw from the European market. The rental market in Q2, meanwhile, remained broadly unchanged. During the quarter, we focused on continuing to collect rent from tenants, though it’s clear some are facing a significant decline in turnover. Negotiations with tenants concentrated on Covid-19 related issues rather than overall rent levels, which remained stable. Demand during lockdowns was highest for stores related to DIY, and home decoration - part of a rising trend within the French retail segment. Following reopening, demand is increasing from fashion, services and health & beauty.
Netherlands
During H1, footfall in the Netherlands mirrored the gradual easing in restrictions on visiting shops. Since full reopening, visitor numbers have returned to approximately 90% of their 2019 levels and are more or less unchanged compared with last year. Bankruptcy levels, meanwhile, have remained low. Those bankruptcies that did occur, including Miss Etam and Steps becoming effective, are likely to increase market vacancies, however. During Q2, these stores continued to operate in order to sell their remaining stock. We don’t yet know the exact market effect of travel group D-Reizen’s recent bankruptcy; the restart of its stores is still pending. Currently, negotiations with tenants are focused mainly on Covid-19 provisions. Even so, regular leasing discussions are also now gathering pace. An expected reduction in risk over the summer should lead to shorter decision-making processes and more deals. During Q2, the shopping center investment market in the Netherlands remained active. Private investors were able to pick up opportunistic investments and assets that require substantial transformation or redevelopment at relatively low prices. At the same time, centers anchored around groceries and convenience stores have attracted significant investor interest, putting upward pressure on prices. Institutional interest for well-established core centers has also increased.
Results H1 2021 Wereldhave N.V. 7
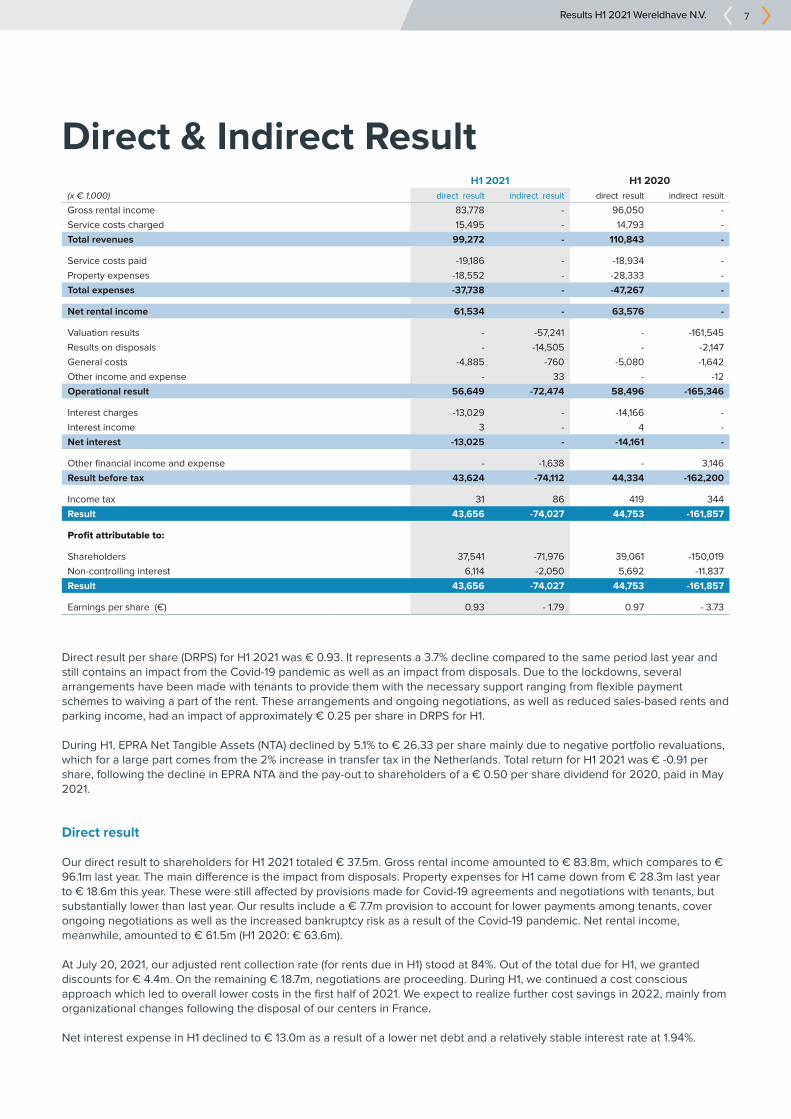
Direct & Indirect ResultH1 2021 H1 2020
(x € 1,000) direct result indirect result direct result indirect result
Gross rental income 83,778 - 96,050 -
Service costs charged 15,495 - 14,793 -
Total revenues 99,272 - 110,843 -
Service costs paid -19,186 - -18,934 -
Property expenses -18,552 - -28,333 -
Total expenses -37,738 - -47,267 -
Net rental income 61,534 - 63,576 -
Valuation results - -57,241 - -161,545
Results on disposals - -14,505 - -2,147
General costs -4,885 -760 -5,080 -1,642
Other income and expense - 33 - -12
Operational result 56,649 -72,474 58,496 -165,346
Interest charges -13,029 - -14,166 -
Interest income 3 - 4 -
Net interest -13,025 - -14,161 -
Other financial income and expense - -1,638 - 3,146
Result before tax 43,624 -74,112 44,334 -162,200
Income tax 31 86 419 344
Result 43,656 -74,027 44,753 -161,857
Profit attributable to:
Shareholders 37,541 -71,976 39,061 -150,019
Non-controlling interest 6,114 -2,050 5,692 -11,837
Result 43,656 -74,027 44,753 -161,857
Earnings per share (€) 0.93 - 1.79 0.97 - 3.73
Direct result per share (DRPS) for H1 2021 was € 0.93. It represents a 3.7% decline compared to the same period last year and still contains an impact from the Covid-19 pandemic as well as an impact from disposals. Due to the lockdowns, several arrangements have been made with tenants to provide them with the necessary support ranging from flexible payment schemes to waiving a part of the rent. These arrangements and ongoing negotiations, as well as reduced sales-based rents and parking income, had an impact of approximately € 0.25 per share in DRPS for H1. During H1, EPRA Net Tangible Assets (NTA) declined by 5.1% to € 26.33 per share mainly due to negative portfolio revaluations, which for a large part comes from the 2% increase in transfer tax in the Netherlands. Total return for H1 2021 was € -0.91 per share, following the decline in EPRA NTA and the pay-out to shareholders of a € 0.50 per share dividend for 2020, paid in May 2021.
Direct result
Our direct result to shareholders for H1 2021 totaled € 37.5m. Gross rental income amounted to € 83.8m, which compares to € 96.1m last year. The main difference is the impact from disposals. Property expenses for H1 came down from € 28.3m last year to € 18.6m this year. These were still affected by provisions made for Covid-19 agreements and negotiations with tenants, but substantially lower than last year. Our results include a € 7.7m provision to account for lower payments among tenants, cover ongoing negotiations as well as the increased bankruptcy risk as a result of the Covid-19 pandemic. Net rental income, meanwhile, amounted to € 61.5m (H1 2020: € 63.6m). At July 20, 2021, our adjusted rent collection rate (for rents due in H1) stood at 84%. Out of the total due for H1, we granted discounts for € 4.4m. On the remaining € 18.7m, negotiations are proceeding. During H1, we continued a cost conscious approach which led to overall lower costs in the first half of 2021. We expect to realize further cost savings in 2022, mainly from organizational changes following the disposal of our centers in France. Net interest expense in H1 declined to € 13.0m as a result of a lower net debt and a relatively stable interest rate at 1.94%.
Results H1 2021 Wereldhave N.V. 8
Indirect result
Our indirect result to shareholders for H1 amounted to -€ 72.0m, due mainly due to a downward revaluation of € 57.2m in our property portfolio (equivalent to -2.3% of the portfolio’s total value). An amount of € 14.5m relates to the loss on disposals that were executed during H1. Values for the Dutch portfolio are stabilizing when isolated from one-off impact from the increase in transfer tax. This also shows in a stable valuation yield on the Dutch portfolio on a like-for-like basis. The value of our Dutch properties decreased by € 32.4m (-3.7%), compared with year-end 2020. In the Netherlands, € 15.7m of this downward adjustment was due to a 2% increase in transfer tax, effective January 1. Excluding the impact of the transfer tax, the values of the Dutch portfolio have been nearly stable with a value decline of only -1.6% versus -10.5% over 2020. The investment market showed an increasing appreciation for smaller convenience centers and stronger mixed-use schemes. This was visible also in the valuation of our Dutch portfolio. By end of H1, the average EPRA Net Initial Yield (NIY) on our Dutch portfolio compressed 30bps versus year-end 2020 and stood at 6.7%. The compression can be fully explained by the disposals. On a like-for-like basis, the valuation yield on the portfolio has remained stable. There still has been a wait-and-see approach among real estate investors in both Belgium and France during H1, leading to an absence of market transactions. The average EPRA NIY in France was stable at 4.9%, and for our Belgian shopping centers also had a stable yield at 5.6%. In France, values went slightly down by € 17.5m (-2.5%) on the back of a downward adjustment of expected market rents. In Belgium the value of the portfolio was nearly stable (-€ 7.3m or -0.8%), of which € 1.3m related to our Belgian office portfolio.
Results H1 2021 Wereldhave N.V. 9
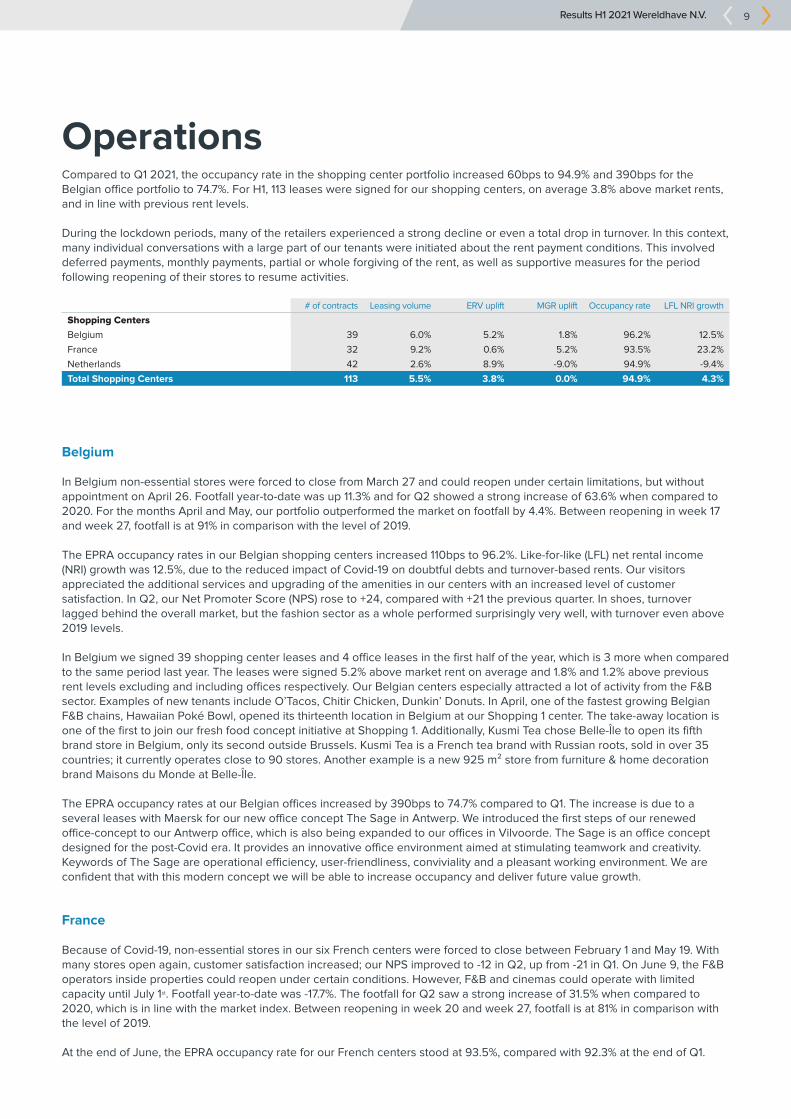
OperationsCompared to Q1 2021, the occupancy rate in the shopping center portfolio increased 60bps to 94.9% and 390bps for the Belgian office portfolio to 74.7%. For H1, 113 leases were signed for our shopping centers, on average 3.8% above market rents, and in line with previous rent levels. During the lockdown periods, many of the retailers experienced a strong decline or even a total drop in turnover. In this context, many individual conversations with a large part of our tenants were initiated about the rent payment conditions. This involved deferred payments, monthly payments, partial or whole forgiving of the rent, as well as supportive measures for the period following reopening of their stores to resume activities.
# of contracts Leasing volume ERV uplift MGR uplift Occupancy rate LFL NRI growth
Shopping Centers
Belgium 39 6.0% 5.2% 1.8% 96.2% 12.5%
France 32 9.2% 0.6% 5.2% 93.5% 23.2%
Netherlands 42 2.6% 8.9% -9.0% 94.9% -9.4%
Total Shopping Centers 113 5.5% 3.8% 0.0% 94.9% 4.3%
Belgium
In Belgium non-essential stores were forced to close from March 27 and could reopen under certain limitations, but without appointment on April 26. Footfall year-to-date was up 11.3% and for Q2 showed a strong increase of 63.6% when compared to 2020. For the months April and May, our portfolio outperformed the market on footfall by 4.4%. Between reopening in week 17 and week 27, footfall is at 91% in comparison with the level of 2019. The EPRA occupancy rates in our Belgian shopping centers increased 110bps to 96.2%. Like-for-like (LFL) net rental income (NRI) growth was 12.5%, due to the reduced impact of Covid-19 on doubtful debts and turnover-based rents. Our visitors appreciated the additional services and upgrading of the amenities in our centers with an increased level of customer satisfaction. In Q2, our Net Promoter Score (NPS) rose to +24, compared with +21 the previous quarter. In shoes, turnover lagged behind the overall market, but the fashion sector as a whole performed surprisingly very well, with turnover even above 2019 levels. In Belgium we signed 39 shopping center leases and 4 office leases in the first half of the year, which is 3 more when compared to the same period last year. The leases were signed 5.2% above market rent on average and 1.8% and 1.2% above previous rent levels excluding and including offices respectively. Our Belgian centers especially attracted a lot of activity from the F&B sector. Examples of new tenants include O’Tacos, Chitir Chicken, Dunkin’ Donuts. In April, one of the fastest growing Belgian F&B chains, Hawaiian Poké Bowl, opened its thirteenth location in Belgium at our Shopping 1 center. The take-away location is one of the first to join our fresh food concept initiative at Shopping 1. Additionally, Kusmi Tea chose Belle-Île to open its fifth brand store in Belgium, only its second outside Brussels. Kusmi Tea is a French tea brand with Russian roots, sold in over 35 countries; it currently operates close to 90 stores. Another example is a new 925 m² store from furniture & home decoration brand Maisons du Monde at Belle-Île. The EPRA occupancy rates at our Belgian offices increased by 390bps to 74.7% compared to Q1. The increase is due to a several leases with Maersk for our new office concept The Sage in Antwerp. We introduced the first steps of our renewed office-concept to our Antwerp office, which is also being expanded to our offices in Vilvoorde. The Sage is an office concept designed for the post-Covid era. It provides an innovative office environment aimed at stimulating teamwork and creativity. Keywords of The Sage are operational efficiency, user-friendliness, conviviality and a pleasant working environment. We are confident that with this modern concept we will be able to increase occupancy and deliver future value growth.
France
Because of Covid-19, non-essential stores in our six French centers were forced to close between February 1 and May 19. With many stores open again, customer satisfaction increased; our NPS improved to -12 in Q2, up from -21 in Q1. On June 9, the F&B operators inside properties could reopen under certain conditions. However, F&B and cinemas could operate with limited capacity until July 1st. Footfall year-to-date was -17.7%. The footfall for Q2 saw a strong increase of 31.5% when compared to 2020, which is in line with the market index. Between reopening in week 20 and week 27, footfall is at 81% in comparison with the level of 2019. At the end of June, the EPRA occupancy rate for our French centers stood at 93.5%, compared with 92.3% at the end of Q1.
Results H1 2021 Wereldhave N.V. 10
Most centers saw unchanged-to-increasing occupancy rates. For H1, our LFL NRI growth came out at +23.2%, mainly due to a lower Covid-19 impact on doubtful debts and turnover compared to prior year. In France, we signed 32 lease contracts in H1, double the amount when compared with the same period last year. During H1, we signed a 6-year lease with supermarket chain Lidl for a new 2,500 m² store at Docks Vauban. With the addition of Lidl, all our French centers are now anchored by one or more grocery retailers. In this center we also opened a new 200 m² LEGO® Certified store. The LEGO® store is the first in Normandy, and immediately attracted considerable attraction. A food hal project is currently being considered for development at Mériadeck. For this project, heads-of-terms have been signed for 6 out of 8 units. Meanwhile, at Docks 76 in Rouen, we signed a lease with food market Biltoki; this will be Biltoki’s tenth location and the first in Normandy. By March 2022, the food market will be home to 25 independent traders, artisans and chefs. At Côté Seine we increased our healthcare offer by increasing the size of a pharmacy to now nearly 500 m ².
Netherlands
In the Netherlands, Covid-19 restrictions were gradually eased during Q1. Non-essential stores were fully re-opened from April 28. Customer satisfaction continued to increase also in our Dutch portfolio and stood at +4 versus -3 in Q1 with new services being added for instance at The Point in Cityplaza. The lockdown effects year-to-date are most visible in the Netherlands, with visitor numbers showing an 17% decline. As reopening started in Q2, footfall numbers are 10% above 2020 levels. Between reopening in week 17 and week 27, footfall is at 88% in comparison with the level of 2019. At the end of June, our EPRA occupancy rate in the Netherlands stood at 94.9%, stable versus Q1. Over the same period, LFL NRI was down 9.4%, due mainly to an increase in doubtful debt provisions resulting from the Covid-19 crisis. The leasing activity has remained robust with 42 leases closed during H1, on average 8.9% above market rents, but 9.0% below previous rent levels. This decline versus previous rent level has been the result of moving to full sales-based rents, worsened market conditions over the past years, but in some cases is compensated by reduced capex obligations for us in the coming years. We have been able to close deals for large floor plates for long-term rental contracts. In Tilburg, Wereldhave and The Sting Companies are strengthening their collaboration by extending three lease agreements covering more than 17,000 m². Additionally, the leases with Intersport and Mediamarkt at Pieter Vreedeplein have been extended. At Cityplaza in Nieuwegein, we extended the leases with The Sting and Mediamarkt. This quarter we entered into a package deal with H&M for all our locations and with Shoeby for three locations.
Results H1 2021 Wereldhave N.V. 11
Portfolio, disposals & investmentsWereldhave’s strategy is focused on anticipating long-term trends by transforming our centers into strong, future-proof Full Service Centers. To maximize long-term value growth for shareholders, we focus only on those centers that will deliver above market total returns. We call this our LifeCentral strategy. Transformation does not need to happen overnight, which is why our LifeCentral strategy will be implemented at a controlled pace.
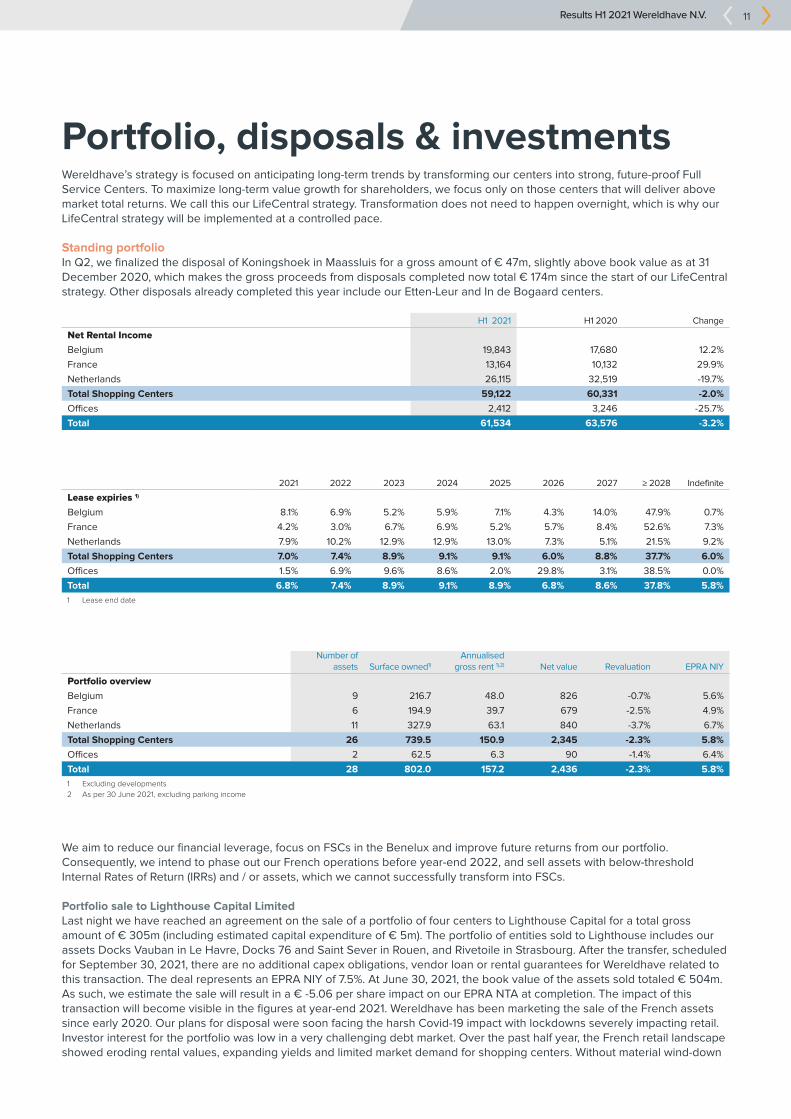
Standing portfolioIn Q2, we finalized the disposal of Koningshoek in Maassluis for a gross amount of € 47m, slightly above book value as at 31 December 2020, which makes the gross proceeds from disposals completed now total € 174m since the start of our LifeCentral strategy. Other disposals already completed this year include our Etten-Leur and In de Bogaard centers.
H1 2021 H1 2020 Change
Net Rental Income
Belgium 19,843 17,680 12.2%
France 13,164 10,132 29.9%
Netherlands 26,115 32,519 -19.7%
Total Shopping Centers 59,122 60,331 -2.0%
Offices 2,412 3,246 -25.7%
Total 61,534 63,576 -3.2%
2021 2022 2023 2024 2025 2026 2027 ≥ 2028 Indefinite
Lease expiries 1)
Belgium 8.1% 6.9% 5.2% 5.9% 7.1% 4.3% 14.0% 47.9% 0.7%
France 4.2% 3.0% 6.7% 6.9% 5.2% 5.7% 8.4% 52.6% 7.3%
Netherlands 7.9% 10.2% 12.9% 12.9% 13.0% 7.3% 5.1% 21.5% 9.2%
Total Shopping Centers 7.0% 7.4% 8.9% 9.1% 9.1% 6.0% 8.8% 37.7% 6.0%
Offices 1.5% 6.9% 9.6% 8.6% 2.0% 29.8% 3.1% 38.5% 0.0%
Total 6.8% 7.4% 8.9% 9.1% 8.9% 6.8% 8.6% 37.8% 5.8%
1 Lease end date
Number of assets Surface owned1)
Annualised gross rent 1),2) Net value Revaluation EPRA NIY
Portfolio overview
Belgium 9 216.7 48.0 826 -0.7% 5.6%
France 6 194.9 39.7 679 -2.5% 4.9%
Netherlands 11 327.9 63.1 840 -3.7% 6.7%
Total Shopping Centers 26 739.5 150.9 2,345 -2.3% 5.8%
Offices 2 62.5 6.3 90 -1.4% 6.4%
Total 28 802.0 157.2 2,436 -2.3% 5.8%
1 Excluding developments
2 As per 30 June 2021, excluding parking income
We aim to reduce our financial leverage, focus on FSCs in the Benelux and improve future returns from our portfolio. Consequently, we intend to phase out our French operations before year-end 2022, and sell assets with below-threshold Internal Rates of Return (IRRs) and / or assets, which we cannot successfully transform into FSCs.
Portfolio sale to Lighthouse Capital LimitedLast night we have reached an agreement on the sale of a portfolio of four centers to Lighthouse Capital for a total gross amount of € 305m (including estimated capital expenditure of € 5m). The portfolio of entities sold to Lighthouse includes our assets Docks Vauban in Le Havre, Docks 76 and Saint Sever in Rouen, and Rivetoile in Strasbourg. After the transfer, scheduled for September 30, 2021, there are no additional capex obligations, vendor loan or rental guarantees for Wereldhave related to this transaction. The deal represents an EPRA NIY of 7.5%. At June 30, 2021, the book value of the assets sold totaled € 504m. As such, we estimate the sale will result in a € -5.06 per share impact on our EPRA NTA at completion. The impact of this transaction will become visible in the figures at year-end 2021. Wereldhave has been marketing the sale of the French assets since early 2020. Our plans for disposal were soon facing the harsh Covid-19 impact with lockdowns severely impacting retail. Investor interest for the portfolio was low in a very challenging debt market. Over the past half year, the French retail landscape showed eroding rental values, expanding yields and limited market demand for shopping centers. Without material wind-down
Results H1 2021 Wereldhave N.V. 12
costs, a saving in general cost will start in 2022. The transaction enables Wereldhave to largely exit France, to secure liquidity until Q1 2024, to strengthen the balance sheet by lowering the LTV and make funds available for the transformational strategy. The remaining centers in our French portfolio - Côté Seine in the greater Paris area (Argenteuil) and Mériadeck in Bordeaux - are still for sale. We now have more room to time the disposal of these two centers and maximize the disposal result. The remaining cost savings will be implemented once the last two assets have been sold. Upon completion of the transaction it will result in € 479m in asset sales since the announcement of our LifeCentral strategy in February 2020.
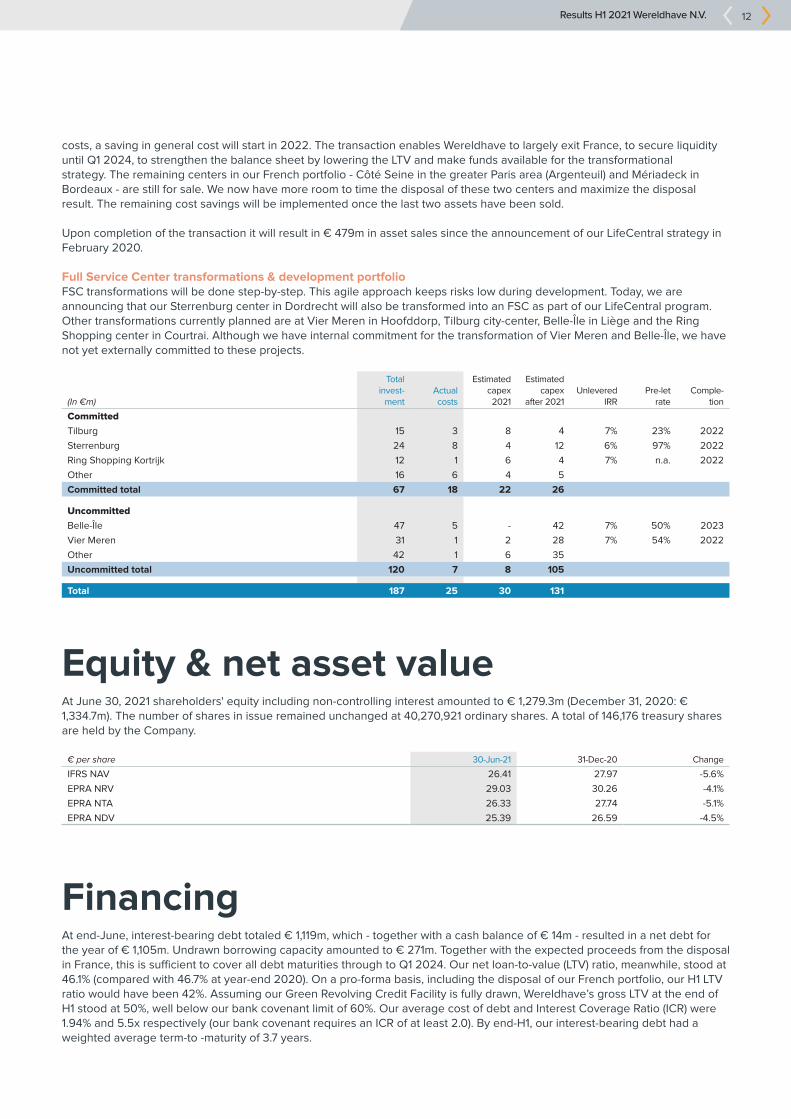
Full Service Center transformations & development portfolioFSC transformations will be done step-by-step. This agile approach keeps risks low during development. Today, we are announcing that our Sterrenburg center in Dordrecht will also be transformed into an FSC as part of our LifeCentral program. Other transformations currently planned are at Vier Meren in Hoofddorp, Tilburg city-center, Belle-Île in Liège and the Ring Shopping center in Courtrai. Although we have internal commitment for the transformation of Vier Meren and Belle-Île, we have not yet externally committed to these projects.
(In €m)
Total invest-
mentActual costs
Estimated capex 2021
Estimated capex
after 2021Unlevered
IRRPre-let
rateComple-
tion
Committed
Tilburg 15 3 8 4 7% 23% 2022
Sterrenburg 24 8 4 12 6% 97% 2022
Ring Shopping Kortrijk 12 1 6 4 7% n.a. 2022
Other 16 6 4 5
Committed total 67 18 22 26
Uncommitted
Belle-Île 47 5 - 42 7% 50% 2023
Vier Meren 31 1 2 28 7% 54% 2022
Other 42 1 6 35
Uncommitted total 120 7 8 105
Total 187 25 30 131
Equity & net asset valueAt June 30, 2021 shareholders' equity including non-controlling interest amounted to € 1,279.3m (December 31, 2020: € 1,334.7m). The number of shares in issue remained unchanged at 40,270,921 ordinary shares. A total of 146,176 treasury shares are held by the Company.
€ per share 30-Jun-21 31-Dec-20 Change
IFRS NAV 26.41 27.97 -5.6%
EPRA NRV 29.03 30.26 -4.1%
EPRA NTA 26.33 27.74 -5.1%
EPRA NDV 25.39 26.59 -4.5%
FinancingAt end-June, interest-bearing debt totaled € 1,119m, which - together with a cash balance of € 14m - resulted in a net debt for the year of € 1,105m. Undrawn borrowing capacity amounted to € 271m. Together with the expected proceeds from the disposal in France, this is sufficient to cover all debt maturities through to Q1 2024. Our net loan-to-value (LTV) ratio, meanwhile, stood at 46.1% (compared with 46.7% at year-end 2020). On a pro-forma basis, including the disposal of our French portfolio, our H1 LTV ratio would have been 42%. Assuming our Green Revolving Credit Facility is fully drawn, Wereldhave’s gross LTV at the end of H1 stood at 50%, well below our bank covenant limit of 60%. Our average cost of debt and Interest Coverage Ratio (ICR) were 1.94% and 5.5x respectively (our bank covenant requires an ICR of at least 2.0). By end-H1, our interest-bearing debt had a weighted average term-to -maturity of 3.7 years.
Results H1 2021 Wereldhave N.V. 13
Wereldhave’s disciplined approach to capital allocation is focused on delivering a strong balance sheet, outperforming long-term value growth for shareholders through its investments, and returning appropriate dividends to shareholders. Our current LTV ratio – at 46.1% – is still above our target range of 30-40%. We expect to receive proceeds of € 305m from our sale of four centers in France (see above) during on September 30, 2021. These proceeds will initially be used to reduce debt and gradually be used for further investments in our LifeCentral strategy. During H1, Wereldhave has obtained € 202m in additional funding by adding new as well as by extending existing credit facilities. Following the € 32m new funding in Q1, a new € 120m green financing facility was arranged in the Netherlands with ABN AMRO. In Belgium a € 50m facility has been refinanced by a new Green credit facility with a term of four years. Additionally the Treasury notes programme size has been increased from € 100m to € 150m. During Q2, we were able to refinance below our average cost of debt. The credit lines that can be repaid with the proceeds from the French disposals bear an interest rate below our average cost of debt. Therefore we expect our average interest rate to increase towards year-end 2021 to a level just above 2%. Maturities falling due in the next twelve months, however, bear interest rates above our current average cost of debt and current refinancing rates.
Dividend
Wereldhave intends to propose to the AGM a dividend for the fiscal year 2021 of at least € 1.00 per share (equivalent to a payout of € 40m). With regards to the 2022 dividend, our aim is to return to a pay-out ratio of 75% to 85%, as set out in our dividend policy.
Environmental, Social & GovernanceBetter Footprint
For each of our centers, we are developing net zero roadmaps - in line with our overall net zero ambition. Roadmaps have already been created during H1 for our Brugge retail park, and our centers at Vier Meren, Sterrenburg and Kronenburg. These roadmaps clearly set out priorities for how to best to reduce our carbon footprint - and how to combine this with refurbishment and structural repairs. Examples done during H1 are that we strengthened the insulation on the roof at our Cityplaza center in Nieuwegein and added LED lighting to the car park at Winkelhof. Another one is that at our Shopping 1 center in Genk, we deployed 1,745 solar panels - capable of producing 450 kWp. In France, we started a partnership with Too Good To Go to reduce food waste in five centers, contributing to UN Sustainable Development Goals (SDG) 12.5 (substantially reduce waste generation) and 17.16 (enhance the global partnership for sustainable development). During H1, our work with Too Good To Go lowered food waste production by 16,348 kg CO
2e, the equivalent of
16 flights from Paris to New York. Our partnership does more than lower food waste; it also creates additional income for the ten tenants who are part of the partnership, as well as an attractive deal opportunity for the 3,199 customers that picked up 6,539discounted food basket in H1 that otherwise would have ended up as food waste. We are currently discussing the possibility of extending our cooperation with Too Good To Go to Belgium in H2, and to the Netherlands after that.
Better Nature
Our centers can be used to reduce climate risk and increase biodiversity, creating a better local environment. By doing this, we can contribute positively to UN SDGs 11 (sustainable cities and communities) and 13 (climate action) if possible. During H1, we added new beehives at our Shopping Nivelles center in Belgium to support local biodiversity. Our net zero roadmaps also include plans to mitigate the physical effects of climate change (e.g. extreme heat, flooding, storms). Of our 29 centers, 20 have at least one feature aimed at improving biodiversity. These features also have a positive impact on the BREEAM certification of our buildings.
Better Living
Wereldhave invests in local communities, creating a positive social impact by offering space to social enterprises and charities, and by providing a welcoming environment that helps reduce loneliness and exclusion. By doing so, Wereldhave contributes to UN SDGs 8 (decent work and economic growth) and 11 (sustainable cities and communities). In Belgium, during H1, we supported 26 social events, including fund-raising sales for NGOs Ile de Paix, the Red Cross, and Doctors without Borders, as
Results H1 2021 Wereldhave N.V. 14
well as cultural events, and events to promote better health, or help disadvantaged groups. As part of its half-centenary, our Roselaar shopping center in the Netherlands, supported the charity ‘Ik Trakteer’ - or “My Treat.” Visitors to the center were able to donate the deposits due on plastic bottles to the charity. Proceeds were used to help underprivileged children in the local community.
Full Service Centers transformationsDuring H1, we made further progress transforming our centers to FSCs in the Benelux. The proportion of retail floor space devoted to mixed use was 10.3% versus 10.0% at year-end 2020. Notable developments include a strong leasing towards the F&B sector, particularly in Belgium, the opening of Basic Fit at Eggert and increasing the healthcare offer at Presikhaaf.
Introducing office concept The SageAs a customer-oriented operator of future FSCs, Wereldhave has decided to put its know-how at the service of its Belgian office parks by launching a new concept. This concept is called The Sage, and is designed for the post-Covid era. It provides an innovative office environment, helping stimulate teamwork and creativity. Keywords of The Sage are operational efficiency, user-friendliness, conviviality and a pleasant working environment. Following its introduction at our Belgian offices, The Sage will serve as a template for developing an office concept for our FSCs. This co-working concept will offer a high-tech, sustainable office space with flexible, smart meeting rooms, an F&B offer and sporting facilities. This project includes a restaurant chain Eatery, providing additional services such as food take-out. The Sage is a distinctive concept that provides a modern working environment, with a welcoming, healthy and productive atmosphere. It has been designed with a touch of rebel spirit to help our tenants remain one step ahead in the “war for talent.” The Sage also has modern technical installations to reduce carbon emissions, protect the environment, lower water consumption and help make our centers more energy efficient. There is also a focus on recycling, which means lower waste production. The Sage has already been launched at our office properties in Antwerp, and will soon be extended to Vilvoorde.
OutlookWereldhave’s aim is to become the market leader in FSCs in the Benelux, broaden our customer experience and improve our digital capabilities. Through our LifeCentral program, we will work to transform our centers, adapting them to new market realities, restoring the retail balance and adding new functions and uses. We have strengthened our balance sheet by divesting selected assets, including a large part of the phase out of our presence in France. The remaining part of the phase out is scheduled to be finalized before year-end 2022. The transformation of our portfolio into FSCs will be carried out simultaneously with our disposal program. This will lower our debt and strengthen our balance sheet. In the short term - over the next two years - we anticipate our DRPS will decrease to € 1.40-1.50. Once our disposals are complete however, we expect - through our FSC transformation strategy - to achieve rental, value and dividend growth. We currently project for this period an annual growth of our DRPS of between 4% and 6%. On a constant portfolio basis, we could have raised our previously issued outlook for 2021 DRPS, which was at the lower end of the € 1.80 - 2.00 range. However, the sale of our French portfolio will result in lower rental income for Q4 and therefore affect our DRPS forecast for 2021 negatively by € 0.13. Therefore we now expect a DRPS for 2021 between € 1.75 and 1.85. This outlook assumes a gradual recovery from the pandemic in Western Europe; we should emphasize however that, in the current context, there are significant uncertainties associated with this scenario (including the risk of a further wave of Covid-19 infections in our markets, additional or re-instated lockdown measures, or a material deterioration in economic prospects).
Conference call / webcast
Wereldhave will host a webcast at 10.00 CET today to present its H1 results. This (live) webcast will be available at www.wereldhave.com. Questions can be forwarded by e-mail to [email protected] prior to the webcast.
Results H1 2021 Wereldhave N.V. 15
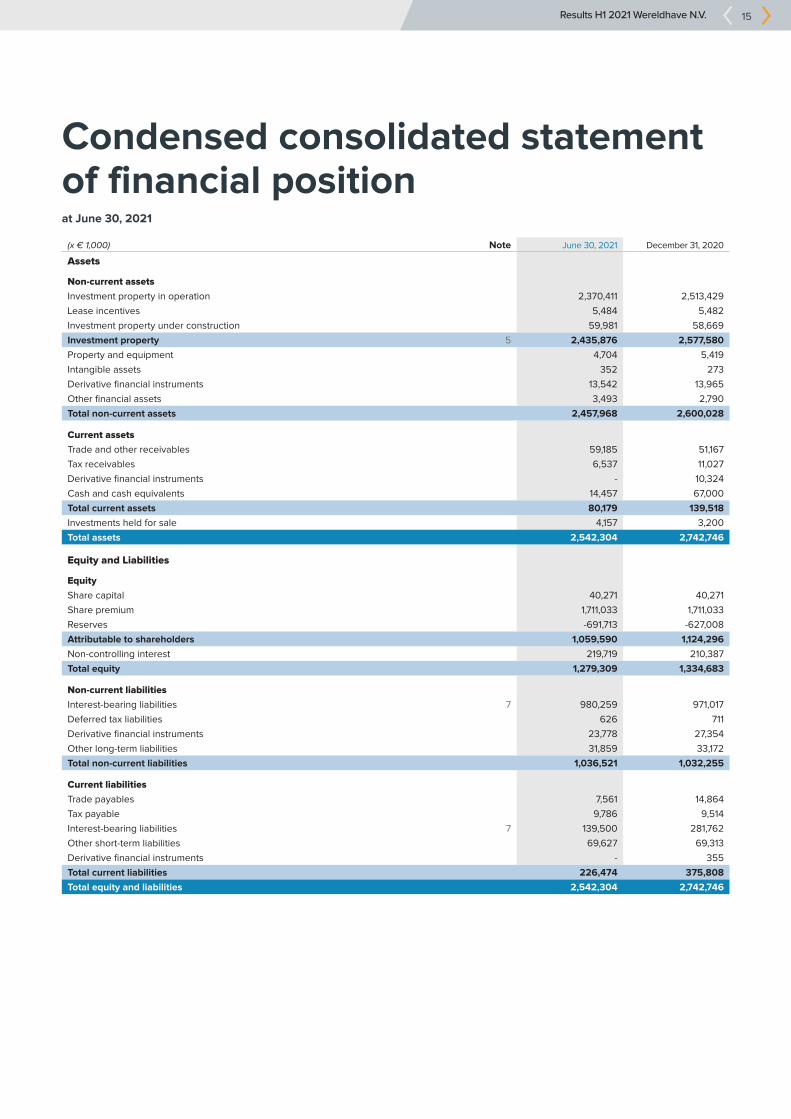
Condensed consolidated statement of financial position at June 30, 2021
(x € 1,000) Note June 30, 2021 December 31, 2020
Assets
Non-current assets
Investment property in operation 2,370,411 2,513,429
Lease incentives 5,484 5,482
Investment property under construction 59,981 58,669
Investment property 5 2,435,876 2,577,580
Property and equipment 4,704 5,419
Intangible assets 352 273
Derivative financial instruments 13,542 13,965
Other financial assets 3,493 2,790
Total non-current assets 2,457,968 2,600,028
Current assets
Trade and other receivables 59,185 51,167
Tax receivables 6,537 11,027
Derivative financial instruments - 10,324
Cash and cash equivalents 14,457 67,000
Total current assets 80,179 139,518
Investments held for sale 4,157 3,200
Total assets 2,542,304 2,742,746
Equity and Liabilities
Equity
Share capital 40,271 40,271
Share premium 1,711,033 1,711,033
Reserves -691,713 -627,008
Attributable to shareholders 1,059,590 1,124,296
Non-controlling interest 219,719 210,387
Total equity 1,279,309 1,334,683
Non-current liabilities
Interest-bearing liabilities 7 980,259 971,017
Deferred tax liabilities 626 711
Derivative financial instruments 23,778 27,354
Other long-term liabilities 31,859 33,172
Total non-current liabilities 1,036,521 1,032,255
Current liabilities
Trade payables 7,561 14,864
Tax payable 9,786 9,514
Interest-bearing liabilities 7 139,500 281,762
Other short-term liabilities 69,627 69,313
Derivative financial instruments - 355
Total current liabilities 226,474 375,808
Total equity and liabilities 2,542,304 2,742,746
Results H1 2021 Wereldhave N.V. 16
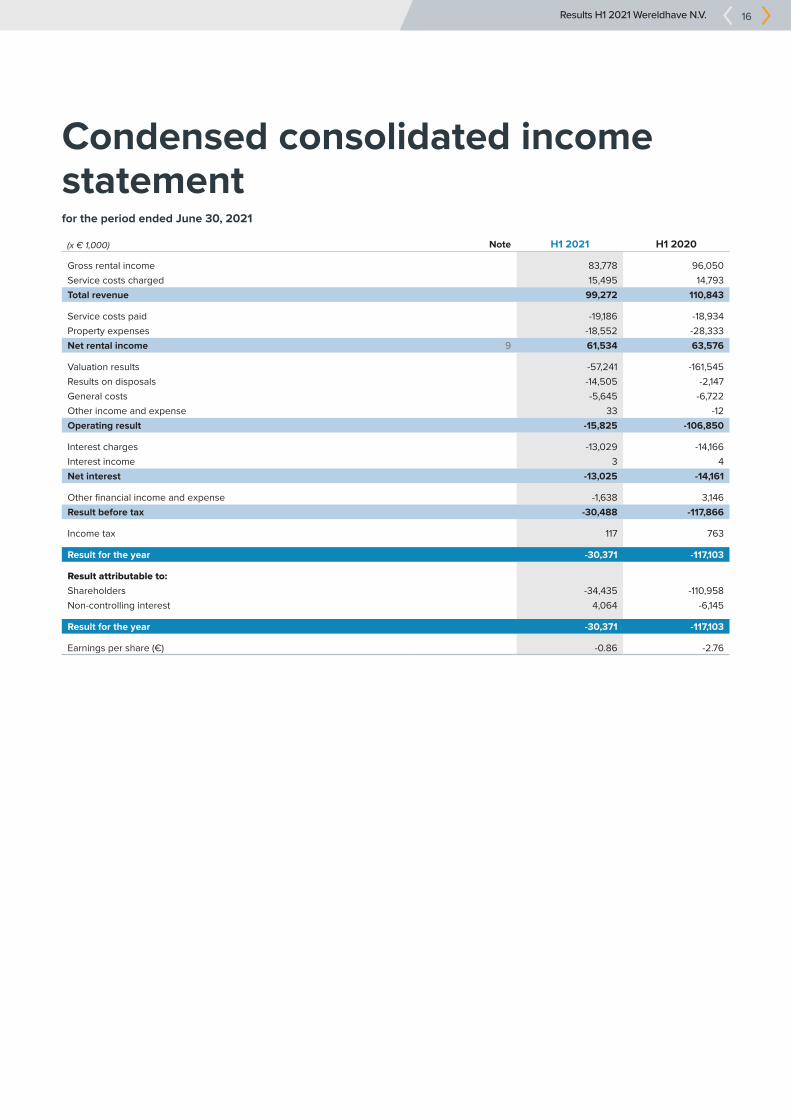
Condensed consolidated income statement for the period ended June 30, 2021
(x € 1,000) Note H1 2021 H1 2020
Gross rental income 83,778 96,050
Service costs charged 15,495 14,793
Total revenue 99,272 110,843
Service costs paid -19,186 -18,934
Property expenses -18,552 -28,333
Net rental income 9 61,534 63,576
Valuation results -57,241 -161,545
Results on disposals -14,505 -2,147
General costs -5,645 -6,722
Other income and expense 33 -12
Operating result -15,825 -106,850
Interest charges -13,029 -14,166
Interest income 3 4
Net interest -13,025 -14,161
Other financial income and expense -1,638 3,146
Result before tax -30,488 -117,866
Income tax 117 763
Result for the year -30,371 -117,103
Result attributable to:
Shareholders -34,435 -110,958
Non-controlling interest 4,064 -6,145
Result for the year -30,371 -117,103
Earnings per share (€) -0.86 -2.76
Results H1 2021 Wereldhave N.V. 17
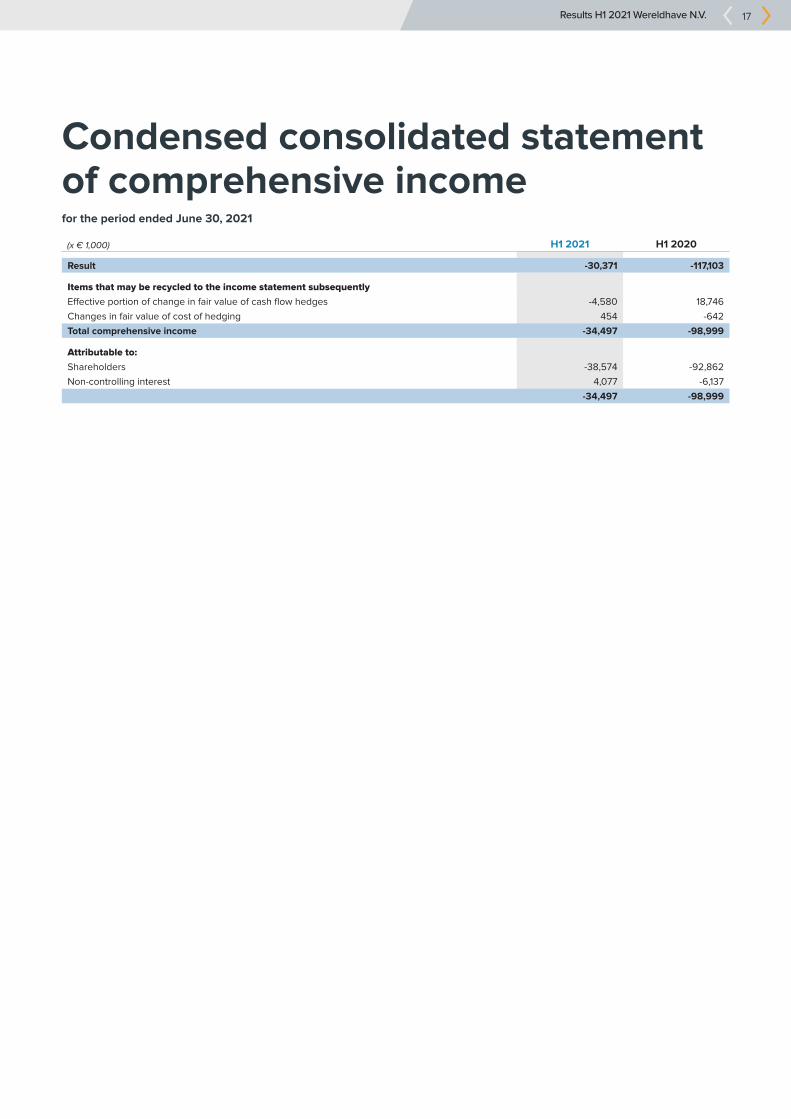
Condensed consolidated statement of comprehensive income for the period ended June 30, 2021
(x € 1,000) H1 2021 H1 2020
Result -30,371 -117,103
Items that may be recycled to the income statement subsequently
Effective portion of change in fair value of cash flow hedges -4,580 18,746
Changes in fair value of cost of hedging 454 -642
Total comprehensive income -34,497 -98,999
Attributable to:
Shareholders -38,574 -92,862
Non-controlling interest 4,077 -6,137
-34,497 -98,999
Results H1 2021 Wereldhave N.V. 18
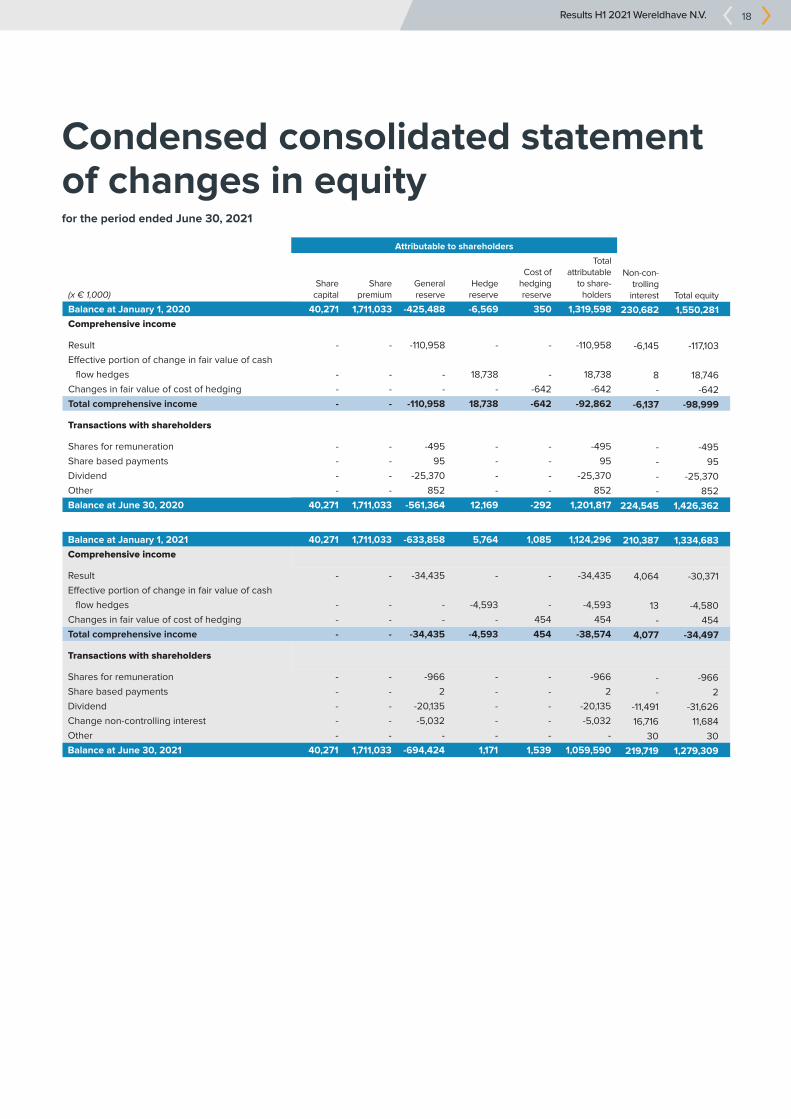
Condensed consolidated statement of changes in equityfor the period ended June 30, 2021
Attributable to shareholders
(x € 1,000)Share
capitalShare
premiumGeneral reserve
Hedge reserve
Cost of hedging reserve
Total attributable
to share-holders
Non-con-trolling
interest Total equity
Balance at January 1, 2020 40,271 1,711,033 -425,488 -6,569 350 1,319,598 230,682 1,550,281
Comprehensive income
Result - - -110,958 - - -110,958 -6,145 -117,103
Effective portion of change in fair value of cash
flow hedges - - - 18,738 - 18,738 8 18,746
Changes in fair value of cost of hedging - - - - -642 -642 - -642
Total comprehensive income - - -110,958 18,738 -642 -92,862 -6,137 -98,999
Transactions with shareholders
Shares for remuneration - - -495 - - -495 - -495
Share based payments - - 95 - - 95 - 95
Dividend - - -25,370 - - -25,370 - -25,370
Other - - 852 - - 852 - 852
Balance at June 30, 2020 40,271 1,711,033 -561,364 12,169 -292 1,201,817 224,545 1,426,362
Balance at January 1, 2021 40,271 1,711,033 -633,858 5,764 1,085 1,124,296 210,387 1,334,683
Comprehensive income
Result - - -34,435 - - -34,435 4,064 -30,371
Effective portion of change in fair value of cash
flow hedges - - - -4,593 - -4,593 13 -4,580
Changes in fair value of cost of hedging - - - - 454 454 - 454
Total comprehensive income - - -34,435 -4,593 454 -38,574 4,077 -34,497
Transactions with shareholders
Shares for remuneration - - -966 - - -966 - -966
Share based payments - - 2 - - 2 - 2
Dividend - - -20,135 - - -20,135 -11,491 -31,626
Change non-controlling interest - - -5,032 - - -5,032 16,716 11,684
Other - - - - - - 30 30
Balance at June 30, 2021 40,271 1,711,033 -694,424 1,171 1,539 1,059,590 219,719 1,279,309
Results H1 2021 Wereldhave N.V. 19
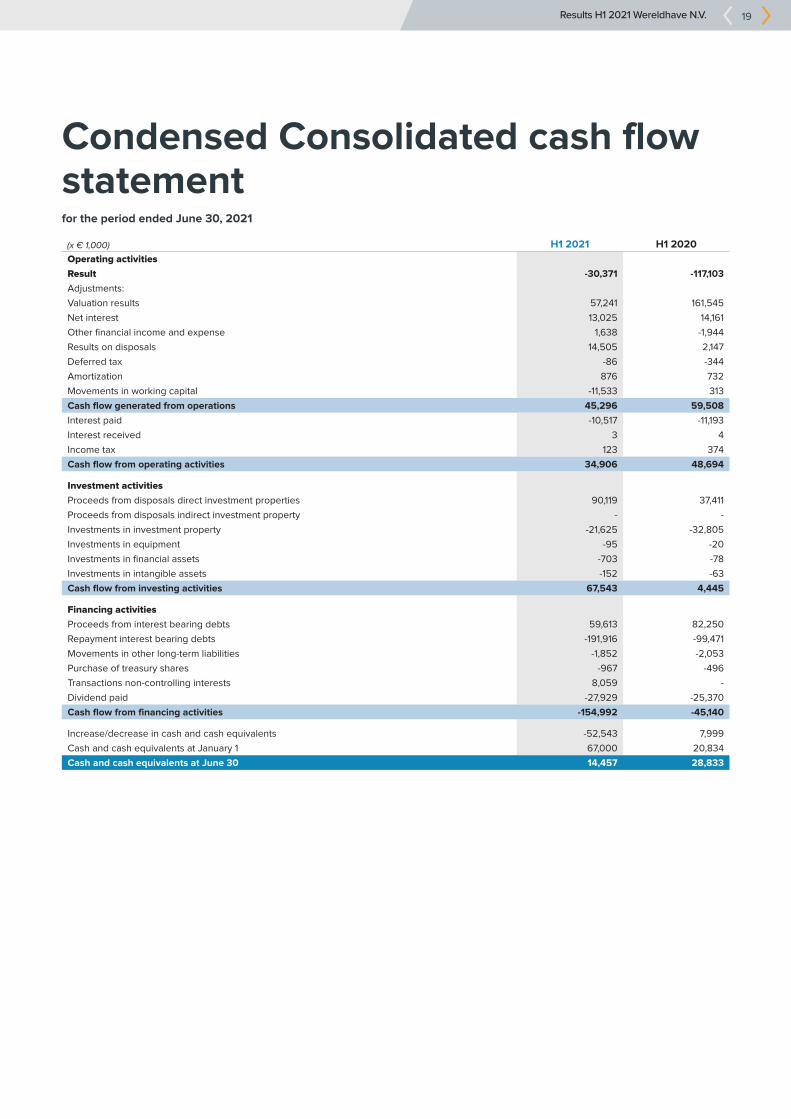
Condensed Consolidated cash flow statementfor the period ended June 30, 2021
(x € 1,000) H1 2021 H1 2020
Operating activities
Result -30,371 -117,103
Adjustments:
Valuation results 57,241 161,545
Net interest 13,025 14,161
Other financial income and expense 1,638 -1,944
Results on disposals 14,505 2,147
Deferred tax -86 -344
Amortization 876 732
Movements in working capital -11,533 313
Cash flow generated from operations 45,296 59,508
Interest paid -10,517 -11,193
Interest received 3 4
Income tax 123 374
Cash flow from operating activities 34,906 48,694
Investment activities
Proceeds from disposals direct investment properties 90,119 37,411
Proceeds from disposals indirect investment property - -
Investments in investment property -21,625 -32,805
Investments in equipment -95 -20
Investments in financial assets -703 -78
Investments in intangible assets -152 -63
Cash flow from investing activities 67,543 4,445
Financing activities
Proceeds from interest bearing debts 59,613 82,250
Repayment interest bearing debts -191,916 -99,471
Movements in other long-term liabilities -1,852 -2,053
Purchase of treasury shares -967 -496
Transactions non-controlling interests 8,059 -
Dividend paid -27,929 -25,370
Cash flow from financing activities -154,992 -45,140
Increase/decrease in cash and cash equivalents -52,543 7,999
Cash and cash equivalents at January 1 67,000 20,834
Cash and cash equivalents at June 30 14,457 28,833
Results H1 2021 Wereldhave N.V. 20
Notes to the condensed consolidated interim financial statements1 Reporting entity
Wereldhave N.V. (‘the Company’) is an investment company which invests in real estate (shopping centres and offices). The property portfolio of Wereldhave N.V. and its subsidiaries (‘the Group’) is located in Belgium, France and the Netherlands. The Group is principally involved in leasing investment property under operating leases. The property management is performed by Group management companies. The Company is a limited liability company incorporated and domiciled in the Netherlands. The address of the Company’s registered office is Schiphol Boulevard 233, 1118 BH Schiphol. The shares of the Company are listed on the Euronext Stock Exchange of Amsterdam. These condensed consolidated interim financial statements for the period ended June 30, 2021 were approved for issue on July 26, 2021. The figures of this press release are unaudited.
2 Tax status
Wereldhave N.V. has the tax status of an investment company (FBI status) in accordance with section 28 of the Dutch 'Wet op de Vennootschapsbelasting 1969'. This status assumes that the Group is (almost) exclusively engaged in portfolio investment activities. As a consequence, corporation tax is due at a rate of 0% in the Netherlands, provided that certain conditions are met. The main conditions concern the requirement to distribute the taxable result as dividend and restrictions with regard to the leverage. The taxable result of Wereldhave N.V. must be distributed as a dividend to its shareholders within eight months after the year during which the result was made. In general terms, the leverage restrictions imply that investments in real estate (including qualifying real estate companies) may only be financed through debt up to a maximum of 60% of their value. For investments in other assets the maximum level of debt allowed is only 20%. There is no requirement to include capital gains, arising on disposal of investments, in the result to be distributed. The subsidiaries in Belgium (OGVV status) and France (SIIC status) have a similar status. In Belgium the net value of one single asset may not exceed 20% of the total Belgium portfolio. Our largest asset in Belgium, Belle-Île, exceeds the threshold of 20% at June 30, 2021. The FSMA provided a concession for a maximum period of 2 years expiring December 31, 2022.
3 Accounting policies
The principal accounting policies applied in the preparation of these condensed consolidated interim financial statements for the period ended June 30, 2021 are set out below. These policies have been consistently applied to all years presented, unless otherwise stated.
Statement of complianceThis condensed consolidated interim financial information for the six months ended June 30, 2021 has been prepared in accordance with IAS 34 Interim Financial Reporting. The condensed consolidated interim financial information should be read in conjunction with the financial statements for the year ended December 31, 2020, which have been prepared in in accordance with the International Financial Reporting Standards (IFRS) as adopted by the European Union (EU-IFRS) and with Part 9 of Book 2 of the Dutch Civil Code.
Income and cash flow statementThe Group presents a separate ‘statement of profit or loss’ and ‘other comprehensive income’. The Group reports cash flows from operating activities using the indirect method. Interest received and interest paid is presented within operating cash flows. The acquisitions of investment properties are disclosed as cash flows from investing activities as this most appropriately reflects the Group’s business activities.
Results H1 2021 Wereldhave N.V. 21
Preparation of the condensed consolidated interim financial statementsThese condensed consolidated interim financial statements for the period ended June 30, 2021 have been prepared on a going concern basis, applying a historical cost convention, except for the measurement of investment property and derivative financial instruments that have been measured at fair value. The preparation of these condensed consolidated interim financial statements in conformity with EU-IFRS requires the use of certain critical accounting estimates. It also requires management to exercise its judgement in the process of applying the Group’s accounting policies. Changes in assumptions may have a significant impact on the condensed consolidated interim financial statements in the period the assumptions changed. Management believes that the underlying assumptions are appropriate.
Change in accounting policy and disclosures
New and amended standards adopted by the GroupExcept as described below, the accounting policies applied are consistent with those of the annual financial statements for the year ended December 31, 2020. As of January 1, 2021 the following standards became effective but did not have an impact on the Company's consolidated financial statements:• COVID-19-Related Rent Concessions – Amendment to IFRS 16• Interest Rate Benchmark Reform Phase 2 – Amendments to IFRS 9, IAS 39, IFRS 7, IFRS 4 and IFRS 16
New standards and interpretations not yet adoptedA number of new standards, amendments to standards and interpretations are effective for annual periods beginning after January 1, 2021 and have not been applied in preparing these condensed consolidated financial statements: • Onerous Contracts: Cost of Fulfilling a Contract – Amendments to IAS 37• Annual Improvements to IFRS Standards 2018–2020 – Amendments to IFRS 1, IFRS 9, illustrative examples accompanying
IFRS 16 and IAS 41• Property, Plant and Equipment: Proceeds before Intended Use – Amendments to IAS 16• Reference to the Conceptual Framework – Amendments to IFRS 3• Classification of Liabilities as Current or Noncurrent – Amendments to IAS 1• IFRS 17 Insurance Contracts• Definition of Accounting Estimate – Amendments to IAS 8 • Disclosure of Accounting Policies – Amendments to IAS 1 and IFRS Practice Statement 2
These amendments are not expected to have a significant impact on the Company's consolidated financial statements.
Results H1 2021 Wereldhave N.V. 22
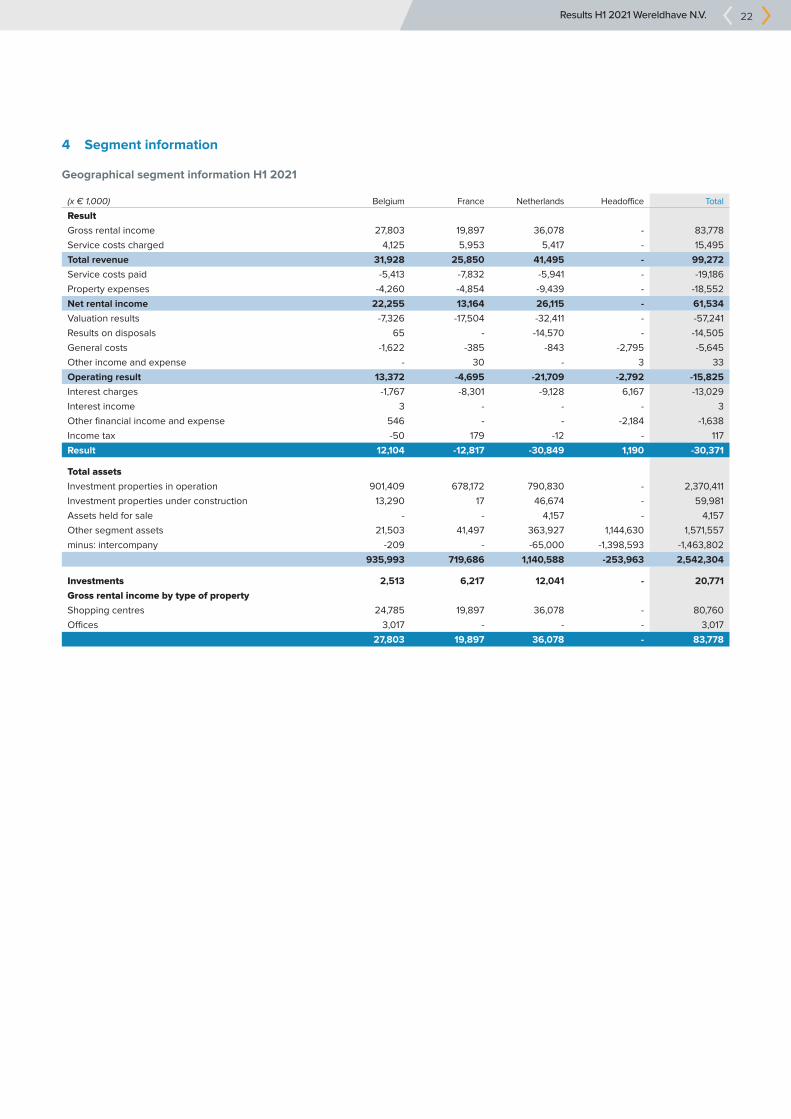
4 Segment information
Geographical segment information H1 2021
(x € 1,000) Belgium France Netherlands Headoffice Total
Result
Gross rental income 27,803 19,897 36,078 - 83,778
Service costs charged 4,125 5,953 5,417 - 15,495
Total revenue 31,928 25,850 41,495 - 99,272
Service costs paid -5,413 -7,832 -5,941 - -19,186
Property expenses -4,260 -4,854 -9,439 - -18,552
Net rental income 22,255 13,164 26,115 - 61,534
Valuation results -7,326 -17,504 -32,411 - -57,241
Results on disposals 65 - -14,570 - -14,505
General costs -1,622 -385 -843 -2,795 -5,645
Other income and expense - 30 - 3 33
Operating result 13,372 -4,695 -21,709 -2,792 -15,825
Interest charges -1,767 -8,301 -9,128 6,167 -13,029
Interest income 3 - - - 3
Other financial income and expense 546 - - -2,184 -1,638
Income tax -50 179 -12 - 117
Result 12,104 -12,817 -30,849 1,190 -30,371
Total assets
Investment properties in operation 901,409 678,172 790,830 - 2,370,411
Investment properties under construction 13,290 17 46,674 - 59,981
Assets held for sale - - 4,157 - 4,157
Other segment assets 21,503 41,497 363,927 1,144,630 1,571,557
minus: intercompany -209 - -65,000 -1,398,593 -1,463,802
935,993 719,686 1,140,588 -253,963 2,542,304
Investments 2,513 6,217 12,041 - 20,771
Gross rental income by type of property
Shopping centres 24,785 19,897 36,078 - 80,760
Offices 3,017 - - - 3,017
27,803 19,897 36,078 - 83,778
Results H1 2021 Wereldhave N.V. 23
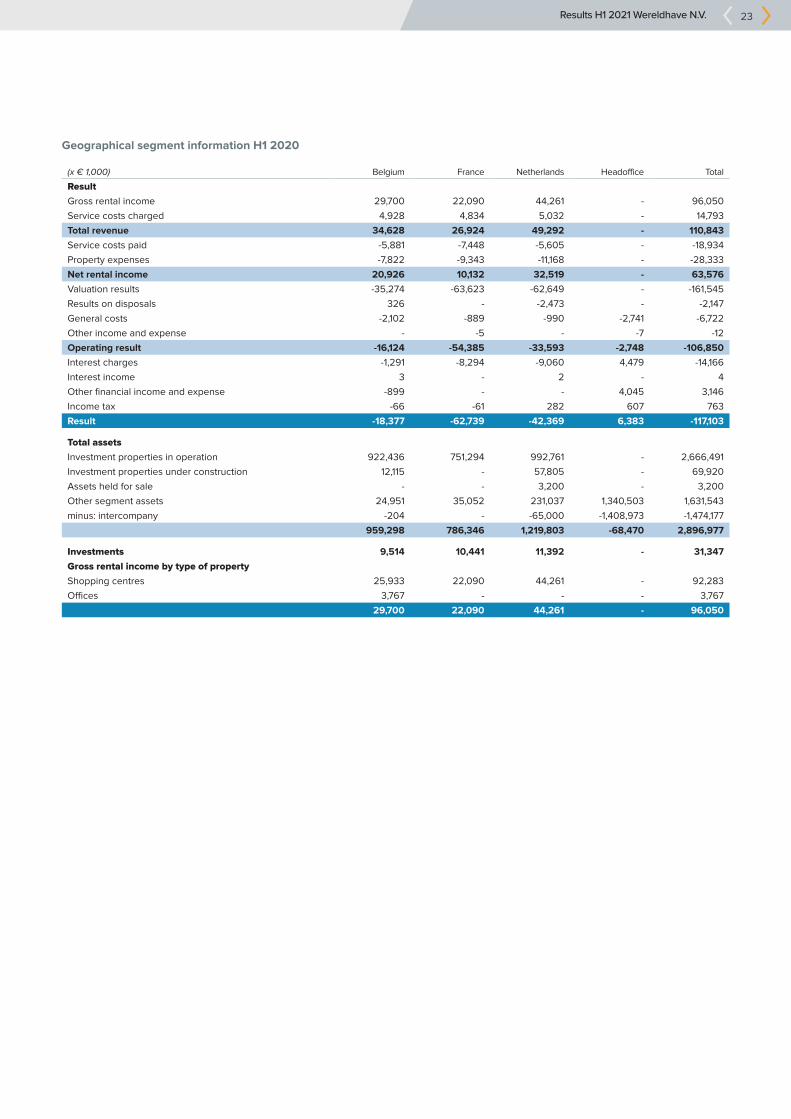
Geographical segment information H1 2020
(x € 1,000) Belgium France Netherlands Headoffice Total
Result
Gross rental income 29,700 22,090 44,261 - 96,050
Service costs charged 4,928 4,834 5,032 - 14,793
Total revenue 34,628 26,924 49,292 - 110,843
Service costs paid -5,881 -7,448 -5,605 - -18,934
Property expenses -7,822 -9,343 -11,168 - -28,333
Net rental income 20,926 10,132 32,519 - 63,576
Valuation results -35,274 -63,623 -62,649 - -161,545
Results on disposals 326 - -2,473 - -2,147
General costs -2,102 -889 -990 -2,741 -6,722
Other income and expense - -5 - -7 -12
Operating result -16,124 -54,385 -33,593 -2,748 -106,850
Interest charges -1,291 -8,294 -9,060 4,479 -14,166
Interest income 3 - 2 - 4
Other financial income and expense -899 - - 4,045 3,146
Income tax -66 -61 282 607 763
Result -18,377 -62,739 -42,369 6,383 -117,103
Total assets
Investment properties in operation 922,436 751,294 992,761 - 2,666,491
Investment properties under construction 12,115 - 57,805 - 69,920
Assets held for sale - - 3,200 - 3,200
Other segment assets 24,951 35,052 231,037 1,340,503 1,631,543
minus: intercompany -204 - -65,000 -1,408,973 -1,474,177
959,298 786,346 1,219,803 -68,470 2,896,977
Investments 9,514 10,441 11,392 - 31,347
Gross rental income by type of property
Shopping centres 25,933 22,090 44,261 - 92,283
Offices 3,767 - - - 3,767
29,700 22,090 44,261 - 96,050
Results H1 2021 Wereldhave N.V. 24
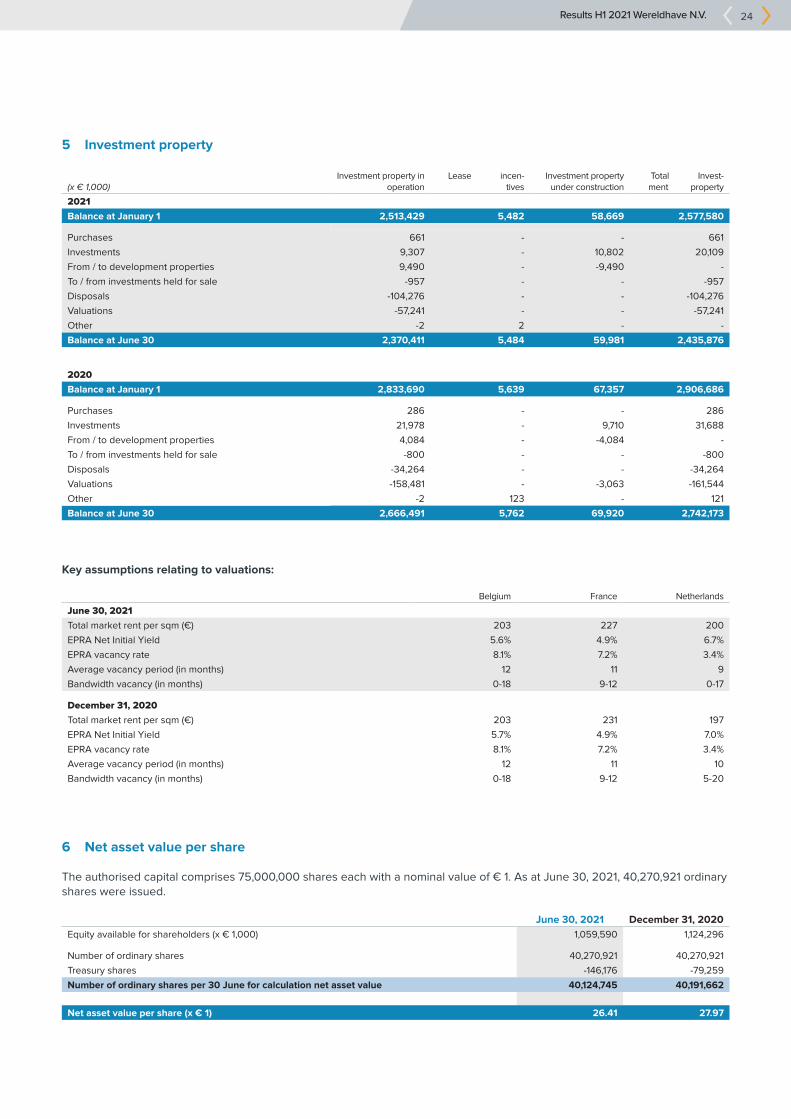
5 Investment property
(x € 1,000)Investment property in
operationLease incen-
tivesInvestment property
under constructionTotal Invest-ment property
2021
Balance at January 1 2,513,429 5,482 58,669 2,577,580
Purchases 661 - - 661
Investments 9,307 - 10,802 20,109
From / to development properties 9,490 - -9,490 -
To / from investments held for sale -957 - - -957
Disposals -104,276 - - -104,276
Valuations -57,241 - - -57,241
Other -2 2 - -
Balance at June 30 2,370,411 5,484 59,981 2,435,876
2020
Balance at January 1 2,833,690 5,639 67,357 2,906,686
Purchases 286 - - 286
Investments 21,978 - 9,710 31,688
From / to development properties 4,084 - -4,084 -
To / from investments held for sale -800 - - -800
Disposals -34,264 - - -34,264
Valuations -158,481 - -3,063 -161,544
Other -2 123 - 121
Balance at June 30 2,666,491 5,762 69,920 2,742,173
Key assumptions relating to valuations:
Belgium France Netherlands
June 30, 2021
Total market rent per sqm (€) 203 227 200
EPRA Net Initial Yield 5.6% 4.9% 6.7%
EPRA vacancy rate 8.1% 7.2% 3.4%
Average vacancy period (in months) 12 11 9
Bandwidth vacancy (in months) 0-18 9-12 0-17
December 31, 2020
Total market rent per sqm (€) 203 231 197
EPRA Net Initial Yield 5.7% 4.9% 7.0%
EPRA vacancy rate 8.1% 7.2% 3.4%
Average vacancy period (in months) 12 11 10
Bandwidth vacancy (in months) 0-18 9-12 5-20
6 Net asset value per share
The authorised capital comprises 75,000,000 shares each with a nominal value of € 1. As at June 30, 2021, 40,270,921 ordinary shares were issued.
June 30, 2021 December 31, 2020
Equity available for shareholders (x € 1,000) 1,059,590 1,124,296
Number of ordinary shares 40,270,921 40,270,921
Treasury shares -146,176 -79,259
Number of ordinary shares per 30 June for calculation net asset value 40,124,745 40,191,662
Net asset value per share (x € 1) 26.41 27.97
Results H1 2021 Wereldhave N.V. 25
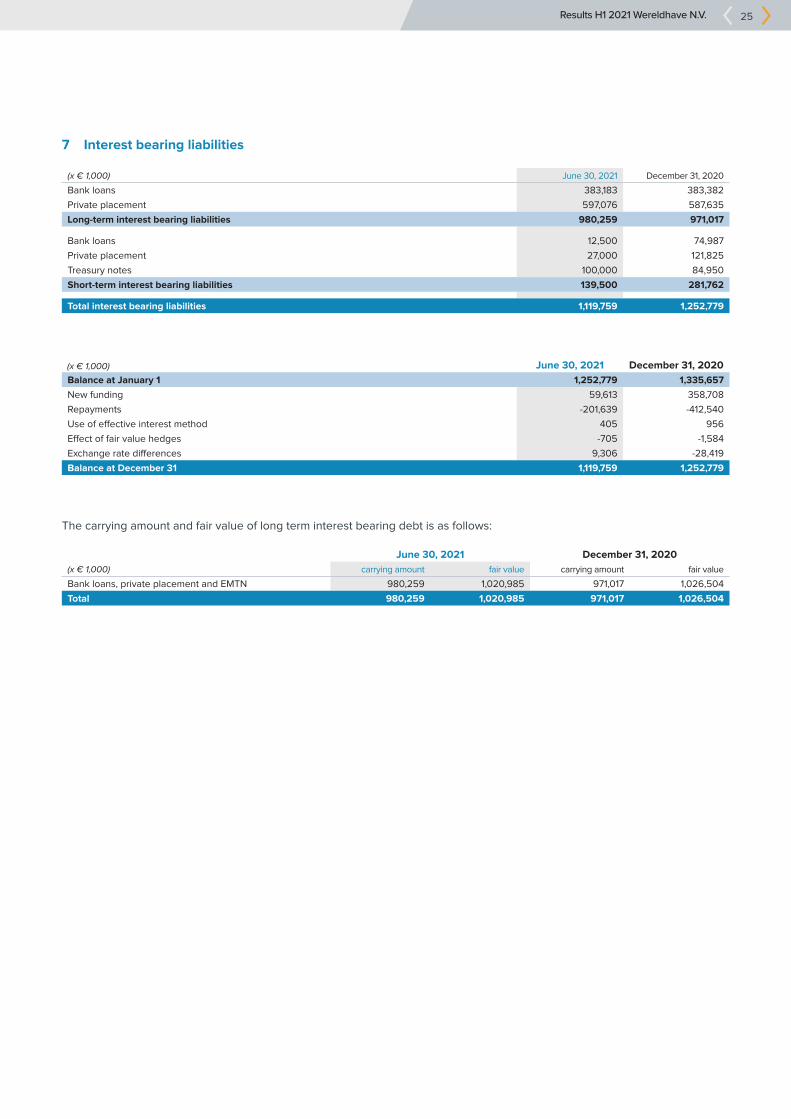
7 Interest bearing liabilities
(x € 1,000) June 30, 2021 December 31, 2020
Bank loans 383,183 383,382
Private placement 597,076 587,635
Long-term interest bearing liabilities 980,259 971,017
Bank loans 12,500 74,987
Private placement 27,000 121,825
Treasury notes 100,000 84,950
Short-term interest bearing liabilities 139,500 281,762
Total interest bearing liabilities 1,119,759 1,252,779
(x € 1,000) June 30, 2021 December 31, 2020
Balance at January 1 1,252,779 1,335,657
New funding 59,613 358,708
Repayments -201,639 -412,540
Use of effective interest method 405 956
Effect of fair value hedges -705 -1,584
Exchange rate differences 9,306 -28,419
Balance at December 31 1,119,759 1,252,779
The carrying amount and fair value of long term interest bearing debt is as follows:
June 30, 2021 December 31, 2020
(x € 1,000) carrying amount fair value carrying amount fair value
Bank loans, private placement and EMTN 980,259 1,020,985 971,017 1,026,504
Total 980,259 1,020,985 971,017 1,026,504
Results H1 2021 Wereldhave N.V. 26
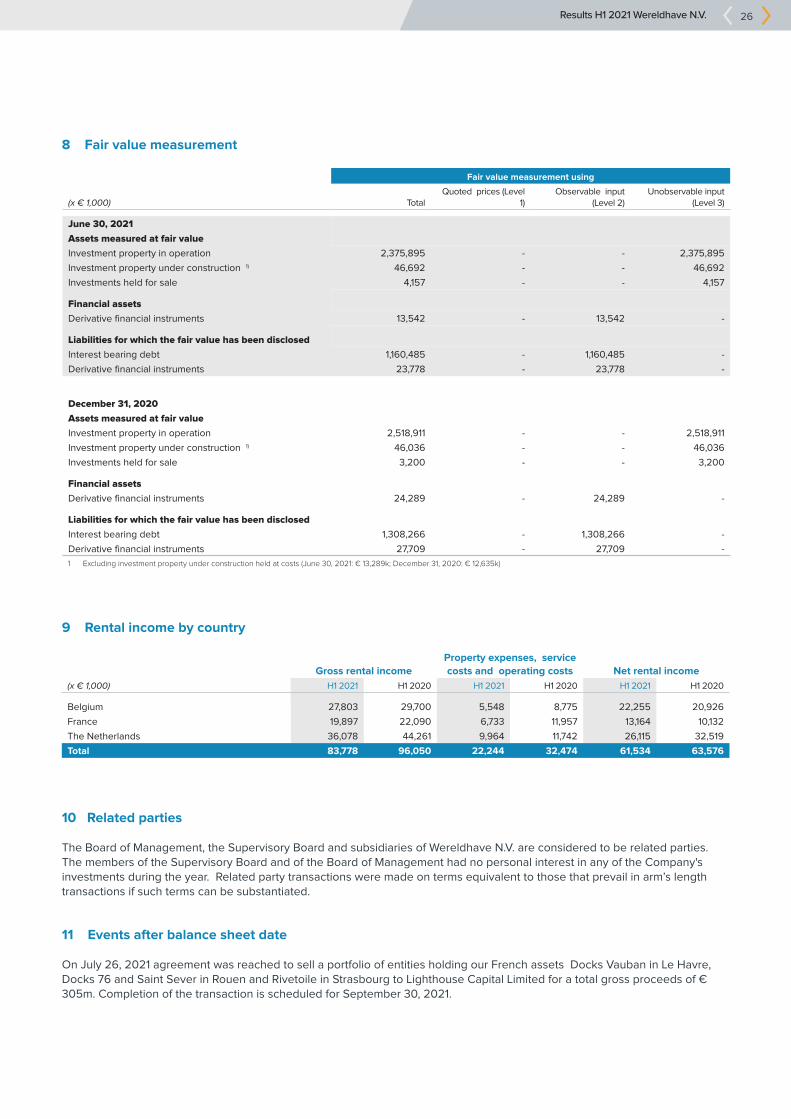
8 Fair value measurement
Fair value measurement using
(x € 1,000) TotalQuoted prices (Level
1)Observable input
(Level 2)Unobservable input
(Level 3)
June 30, 2021
Assets measured at fair value
Investment property in operation 2,375,895 - - 2,375,895
Investment property under construction 1) 46,692 - - 46,692
Investments held for sale 4,157 - - 4,157
Financial assets
Derivative financial instruments 13,542 - 13,542 -
Liabilities for which the fair value has been disclosed
Interest bearing debt 1,160,485 - 1,160,485 -
Derivative financial instruments 23,778 - 23,778 -
December 31, 2020
Assets measured at fair value
Investment property in operation 2,518,911 - - 2,518,911
Investment property under construction 1) 46,036 - - 46,036
Investments held for sale 3,200 - - 3,200
Financial assets
Derivative financial instruments 24,289 - 24,289 -
Liabilities for which the fair value has been disclosed
Interest bearing debt 1,308,266 - 1,308,266 -
Derivative financial instruments 27,709 - 27,709 -
1 Excluding investment property under construction held at costs (June 30, 2021: € 13,289k; December 31, 2020: € 12,635k)
9 Rental income by country
Gross rental incomeProperty expenses, service costs and operating costs Net rental income
(x € 1,000) H1 2021 H1 2020 H1 2021 H1 2020 H1 2021 H1 2020
Belgium 27,803 29,700 5,548 8,775 22,255 20,926
France 19,897 22,090 6,733 11,957 13,164 10,132
The Netherlands 36,078 44,261 9,964 11,742 26,115 32,519
Total 83,778 96,050 22,244 32,474 61,534 63,576
10 Related parties
The Board of Management, the Supervisory Board and subsidiaries of Wereldhave N.V. are considered to be related parties. The members of the Supervisory Board and of the Board of Management had no personal interest in any of the Company's investments during the year. Related party transactions were made on terms equivalent to those that prevail in arm’s length transactions if such terms can be substantiated.
11 Events after balance sheet date
On July 26, 2021 agreement was reached to sell a portfolio of entities holding our French assets Docks Vauban in Le Havre, Docks 76 and Saint Sever in Rouen and Rivetoile in Strasbourg to Lighthouse Capital Limited for a total gross proceeds of € 305m. Completion of the transaction is scheduled for September 30, 2021.
Results H1 2021 Wereldhave N.V. 27
12 Declaration of the Board of Management
The Board of management of Wereldhave N.V., consisting of Matthijs Storm and Dennis de Vreede, hereby declares that, to the best of their knowledge: 1. the condensed consolidated interim financial statement over the first half year of 2021 gives a true and fair view of the assets, liabilities, financial position and result of Wereldhave N.V. and the companies included in the consolidation as a whole; 2. the condensed consolidated interim financial statement over the first half year of 2021 provides a true and fair view on the condition as at the balance sheet date and the course of business during the half year under review of Wereldhave N.V. and the related companies of which the data have been included in the financial statement, and the expected course of business, where, in as far as important interest do not oppose, particular attention is paid to the investments and the conditions of which the development of turnover and profitability depend; and 3. the condensed consolidated interim financial statement over the first half year of 2021 includes a true and fair review of the information required pursuant to section 5:25d, subsections 8 and 9 of the Dutch Financial Markets Supervision Act (Wet op het financieel toezicht). Wereldhave considers the market risk, liquidity risk and credit risk as financial risks. The market risk can be divided into interest risk and currency risk. Rapidly changing economic environments and uncertainty about the solidity of the Euro(zone) may affect the market circumstances, and thus both the letting prospects as well as the market value of the properties. The continuation of the Euro(zone) is assumed. For further comments we refer to the annual report 2020. Our risks are being monitored on a continuous basis. Schiphol, July 27, 2021
Board of ManagementMatthijs Storm, CEO Dennis de Vreede, CFO

WERELDHAVE N.V.WTC Schiphol, Tower A, 3rd floor
Schiphol Boulevard 2331118 BH Schiphol
P.O. Box 75837, 1118 ZZ Schiphol The Netherlands
T: +31 20 702 78 00F: +31 20 702 78 01