Embed Size (px)
Citation preview
1229Olsson LM, et al. Gut 2020;69:1229–1238. doi:10.1136/gutjnl-2019-319322
Gut microbiota
Original research
Gut microbiota of obese subjects with Prader- Willi syndrome is linked to metabolic healthlisa M Olsson ,1 christine Poitou,2,3 Valentina Tremaroli,1 Muriel coupaye,3 Judith aron- Wisnewsky,2,3 Fredrik Bäckhed,1,4 Karine clément,2,3 robert caesar 1
To cite: Olsson lM, Poitou c, Tremaroli V, et al. Gut 2020;69:1229–1238.
► additional material is published online only. To view please visit the journal online (http:// dx. doi. org/ 10. 1136/ gutjnl- 2019- 319322).
For numbered affiliations see end of article.
Correspondence toDr robert caesar, The Wallenberg laboratory, Department of Molecular and clinical Medicine, institute of Medicine, sahlgrenska academy, University of gothenburg, gothenburg 41345, sweden; robert. caesar@ wlab. gu. se and Professor Karine clément, inserM, nutrition and obesities; systemic approaches (nutriOmics) research Unit, sorbonne Universite, Paris, France; karine. clement@ inserm. fr
received 20 June 2019revised 20 september 2019accepted 23 september 2019Published Online First 14 October 2019
© author(s) (or their employer(s)) 2020. re- use permitted under cc BY- nc. no commercial re- use. see rights and permissions. Published by BMJ.
AbsTrACTObjective The gut microbiota has been implicated in the aetiology of obesity and associated comorbidities. Patients with Prader- Willi syndrome (PWs) are obese but partly protected against insulin resistance. We hypothesised that the gut microbiota of PWs patients differs from that of non- genetically obese controls and correlate to metabolic health. Therefore, here we used PWs as a model to study the role of gut microbiota in the prevention of metabolic complications linked to obesity.Design We conducted a case- control study with 17 adult PWs patients and 17 obese subjects matched for body fat mass index, gender and age. The subjects were metabolically characterised and faecal microbiota was profiled by 16s ribosomal rna gene sequencing. The patients’ parents were used as a non- obese control group. stool samples from two PWs patients and two obese controls were used for faecal microbiota transplantations in germ- free mice to examine the impact of the microbiota on glucose metabolism.results The composition of the faecal microbiota in patients with PWs differed from that of obese controls, and was characterised by higher phylogenetic diversity and increased abundance of several taxa such as Akkermansia, Desulfovibrio and archaea, and decreased abundance of Dorea. Microbial taxa prevalent in the PWs microbiota were associated with markers of insulin sensitivity. improved insulin resistance of PWs was partly transmitted by faecal microbiota transplantations into germ- free mice.Conclusion The gut microbiota of PWs patients is similar to that of their non- obese parents and might play a role for the protection of PWs patients from metabolic complications.
InTrODuCTIOnObesity is a heterogeneous disease associated with increased risk of metabolic perturbations such as insulin resistance, diabetes and cardiovascular disor-ders. Subpopulations of obese subjects may also be protected from metabolic abnormalities, at least for a period of their disease history.1 Many different factors contribute to the metabolic consequences of obesity, including complex interactions between genetics, environment and lifestyle aspects, in which environmental factors may play critical roles as shown in large populations.2 Recent research indicates that the gut microbiota can be considered an environmental factor and/or an integrator of
environmental triggers that contribute to fat mass and obesity development.3 4 Several human studies have now investigated the relationship between the human gut microbiota and obesity phenotypes5–7 and a meta- analysis has shown significant associ-ations between decreased alpha diversity, obesity and obesity severity.8 Due mainly to small group sizes, the different studies have revealed only few microbial taxa consistently associated with obesity.8 However, high alpha diversity in the faecal micro-biota has generally been linked to a decreased rela-tive risk of being obese.8
Whereas genome wide scans have shown moderate effect of genetic variants in body mass index (BMI) and related traits variance in large scale populations,9 it is established that
significance of this study
What is already known on this subject? ► Obesity is associated with insulin resistance. ► The gut microbiota of patients with insulin resistance differs from that of healthy controls, and an altered microbiota has been suggested to be part of disease aetiology.
► Prader- Willi syndrome patients are morbidly obese but relatively protected against insulin resistance.
What are the new findings? ► The faecal microbiota of patients with Prader- Willi syndrome differs from that of obese subjects matched for body fat mass index, and is not different from that of non- obese subjects.
► The faecal microbiota of Prader- Willi syndrome patients is linked to markers of insulin sensitivity.
► Transplantation of faecal microbiota from Prader- Willi syndrome patients to germ- free mice transmits the insulin sensitivity of the donor.
How might it impact on clinical practice in the foreseeable future?
► The study supports the hypothesis that dysbiosis can worsen insulin tolerance and that the gut microbiota may be a suitable therapy target.
► Microbial taxa linked to butyrate production and intestinal mucus metabolism are identified as putative mediators of metabolic regulation.
on March 12, 2022 by guest. P
rotected by copyright.http://gut.bm
j.com/
Gut: first published as 10.1136/gutjnl-2019-319322 on 14 O
ctober 2019. Dow
nloaded from
1230 Olsson lM, et al. Gut 2020;69:1229–1238. doi:10.1136/gutjnl-2019-319322
Gut microbiota
Table 1 Clinical characteristics of OC subjects, PWS patients and PWS parents
OC(n=17)
PWs(n=17) PWs (n=24) P value
Female gender (%) 59 59 63
T2D (%) 18 24 0
BFMI 19.8±6 18.2±7.2 0.487
Fat mass (%, DXA) 47.2±7 47.6±6.7 0.8759
Age (year) 31.4±8.9 29.4±7.8 59.1±7.3 0.4902
Weight (kg) 119.7±29.4 87.8±22.5 69.3±9.8 0.0013
Height (cm) 167.8±9 154.9±8.5 164.9±7.2 <0.001
BMI (kg/m2) 42.3±8.7 37.4±10.1 25.5±3.7 0.1373
Fat mass (kg) 55.8±18 42.8±15.1 0.0299
Androgen fat (%) 55.6±7.5** 59.4±4.8 0.119
Fasting glycaemia (mmol/l) 5.1±0.5 4.6±1 0.0914
Fasting insulin (mU/l) 19.5±15.2** 8.8±5** 0.0236
HOMA- IR 4.5±3.5** 1.7±1** 0.0133
HbA1c (%) 5.6±0.6 5.7±0.5*** 0.623
HDL- c (mmol/l) 1.2±0.4 1.2±0.3 0.557
LDL- c (mmol/l) 3.2±2.3 3±0.6 0.764
Triglycerides (mmol/l) 1.7±1.8 1±0.4 0.1298
Leptin (ng/ml) 51.5±29.1** 38.6±24.3** 0.2149
C- reactive protein (mg/l) 6.8±3.9** 12.4±12.5* 0.1948
The values in Table indicates average value ±SD for continuous variables and percentage for factorial. P indicate significant differences in variable between OC and PWS using t- test, significant p values are in bold (alpha=0.05). Body fat mass index is calculated as body fat (kg) /height (m2). * n=10; ** n=14; *** n=16.BFMI, body fat mass index; BMI, body mass index; DXA, dual- energy X- ray absorptiometry; HbA1c, haemoglobin A1c; HDL- c, high density lipoprotein cholesterol; HOMA- IR, homeostatic model assessment of insulin resistance; LDL- c, low density lipoprotein cholesterol; OC, obese control; OWC, Over weigth control; PWS, Prader- Willi syndrome; T2D, type 2 diabetes.
in some obese patients, genetic mutations are causal. This includes monogenic genetic disruptions of the leptin signal-ling pathway,10 pleiotropic syndromes and chromosomal rearrangements.11
Among syndromic obesities, Prader- Willi syndrome (PWS) is the most common one.12 PWS patients lack expression of paternal alleles on chromosome 15, related to several genetic mechanisms including paternal deletion, uniparental disomy and more rarely sporadic mutations and chromosome translocations. Whereas after birth, PWS patients experience difficulties in eating, during early infancy there is a switch toward hyperphagia and rapid weight gain as well as metabolic alterations. However, metabolic alteration in PWS patients is debated and it has been reported that despite major adiposity, PWS patients exhibit rela-tive improved insulin sensitivity compared with subjects with common obesity.13–16 Many features in PWS patients could affect glucose homeostasis, including decreased baseline insulin levels,16 17 increased levels of the insulin sensitising hormone adiponectin,16 17 different body distribution of adipose tissue and an increased subcutaneous adipose tissue expandability with decreased inflammation and fibrosis,16 but the mechanism underlying the improved glucose metabolism of PWS patients remains elusive. We here used PWS as a model of genetically induced severe obesity with improved insulin resistance to inves-tigate how the interaction between genetics and gut microbiota can affect individual metabolic status.
MATerIAl AnD MeTHODsstudy populationTo conduct a case- control study we examined two distinct popu-lations matched for age, fat mass and gender. Subjects were recruited at the Pitié-Salpêtrière University Hospital, Paris, and exposed to the same clinical examinations. Stool samples were collected by similar procedures.
Between July 2007 and September 2015, 80 adults (age ≥16 years) with PWS were examined in the Nutrition Department (French Reference Centre for PWS, Nutrition department, Pitié-Salpêtrière Hospital, Paris). We obtained all authorisa-tions of the Ministry of Research and the French Institutional Review Board (Comité de Protection des Personnes Ile de France 1, reference number 2014- mai-13577) to use the clin-ical data from our register for research purpose, including those performed with international collaborations as well as the anal-ysis of faecal microbiota profiles. During the phase of recruit-ment (2014 to 2015), we proposed participation in the study to all patients coming for clinical follow- up in standard of care and to their parents. To be included in the study the subjects should have genetically confirmed PWS, be coming in standard of care visit in our centre, be living in their family home, have two living parents, have available measures of body composi-tion evaluated by dual- energy X- ray absorptiometry (DXA), have agreed to participate in this research and have agreed to give stool samples. The exclusion criterion was presence of severe behavioural disorders. Seventeen patients with PWS (12 with a paternal deletion and 5 with uniparental disomy) fulfilled these criteria and were enrolled in the study. Three PWS patients had type 2 diabetes. The parents of the PWS patients were recruited as a control group (PWS parents). They had an average BMI of 25.5 kg/m² (BMI<25, n=10, 42%; 30>BMI>25, n=11, 46%; BMI>30, n=3, 12%). All patients and parents gave informed consent. If the patient did not fully understand the informed consent, the consent of the patient’s legally authorised represen-tative was required for participation.
We also obtained faecal samples from subjects with common obesity that served as controls matched with the PWS patients for body fat mass index (BFMI) and percent fat mass (obese controls, OC). The OC group was selected among obese French subjects involved in the European project MetaCardis.18 Subjects provided written informed consent. The MetaCardis study was conducted in accordance with the Helsinki Declaration and is registered in clinical trial https:// clinicaltrials. gov/ show/ NCT02059538
Gut microbiota composition as well as metabolic and inflam-matory host phenotype are related to obesity. Since PWS patients have reduced height16 (table 1), the PWS patients and obese controls were matched for two height- independent parameters of obesity: per cent body fat mass and BFMI. BFMI is associated with features of the metabolic syndrome,19 provides information about body compartments and allows height- independent inter-pretation of nutrition status,20 which is important since PWS have a body composition with excess body fat mass and lower lean body mass.16
biochemical analyses and anthropometricsSubjects underwent systematic explorations that included a thor-ough medical interview recording obesity comorbidities such as type 2 diabetes, a routine physical examination and fasting biological measurements as previously described.18 21 Blood samples were collected after an overnight fast. Fasting glucose, high density lipoprotein cholesterol (HDL- c), triglycerides and haemoglobin A1c (HbA1c) were measured using enzymatic methods. Fasting serum insulin was measured using a chemi-luminescence assay (Insulin Architect, Abbott). Serum leptin was measured using the Human Leptin Quantikine ELISA Kit (R&D Systems, Inc). High- sensitivity c- reactive protein was
on March 12, 2022 by guest. P
rotected by copyright.http://gut.bm
j.com/
Gut: first published as 10.1136/gutjnl-2019-319322 on 14 O
ctober 2019. Dow
nloaded from
1231Olsson lM, et al. Gut 2020;69:1229–1238. doi:10.1136/gutjnl-2019-319322
Gut microbiota
measured using an IMMAGE automatic immunoassay system (Beckman- Coulter).
Weight and height were assessed during the clinical inclusion visit according to standardised procedures using the same scale for all subjects. Body composition was assessed using the same device; a whole- body fan- beam DXA scan (Hologic Discovery W, software V.12.6, 2; Hologic, Bedford, Massachusetts) which evaluated per cent body fat mass. BFMI was calculated as body fat (kg)/height (m2).
extraction of faecal genomic DnAHuman faecal samples were collected and stored at −80°C. Total genomic DNA was isolated from 100 to 150 mg of faeces or 100 mg of mouse caecum using a repeated bead- beating method.22 Briefly, samples were placed in Lysing Matrix E tubes (MP Biomedicals) and extracted twice in lysis buffer (4% w/v sodium dodecyl sulfate, 500 mmol/L NaCl, 50 mmol/L ethylene-diaminetetraacetic acid, 50 mmol/L Tris·hydrochloride, pH 8) with bead beating at 5.0 m/s for 60 s in a FastPrep−24 instru-ment (MP Biomedicals). After each bead- beating cycle, samples were incubated at 90°C for 15 min and then centrifuged at full speed for 5 min at 4°C. Supernatants from the two extractions were pooled, and the DNA was recovered by isopropanol puri-fication and then purified using the QIAamp DNA Mini kit (QIAGEN).
Profiling of faecal microbiota composition by sequencing of the 16s rrnA geneThe faecal microbiota was profiled by sequencing the V4 region of the 16S ribosomal RNA (rRNA) gene as previously been described.23 Singletons and low abundant operational taxo-nomic units (OTUs) with a relative abundance <0.002% were excluded. We obtained an average of 61 997±17 134 sequences/sample (mean±SD; range 48 603 to 123 343 sequences/sample); a total of 4 632 821 sequences and 1483 OTUs were included in the analyses. To correct for differences in sequencing depth between samples, 48 000 sequences were randomly subsampled from each sample and included in the analyses for the estima-tion of α-diversity and β-diversity. For the analysis of differen-tial abundance we included OTUs with abundance of at least 0.1% and present in 20% of the samples (n=166), and genera (L6- features) with abundance of at least 0.1% and present in 10% of the samples (n=66). Representative sequences for OTUs that showed significant differential abundance or correlation with metadata were blasted against the NCBI 16S ribosomal RNA sequences (Bacteria and Archaea) database to obtain a more specific taxonomic annotation. 16S data are available at European Nucleotide Archive (accession number: PRJEB33908; http://www. ebi. ac. uk/ ena/ data/ view/ PRJEB33908).
Transfer of gut microbiota to germ-free miceWe selected two female donor pairs, each consisting of one indi-vidual with PWS and one OC subject. Swiss Webster male and female mice aged 9 to 10 weeks and fed regular chow diet were transplanted with faeces from each donor. Mice were kept in individually ventilated cages (ISOcage N System, Tecniplast) with a maximum of five mice per cage under a 12 hours light cycle and a room temperature of 21°C. Food and water was provided ad libitum. Frozen stools (500 mg) obtained from each human donor were resuspended in 5 mL reduced PBS. The mice were randomised into two groups based on body weight and colonised by oral gavage with 200 µl of faecal slurry from each donor. An insulin tolerance test (ITT) was performed 2 weeks after
colonisation when mice were fasted for 4 hour and injected with insulin (0.75 U/kg body weight). Blood glucose was measured in tail vein blood at 0, 30, 60, 90 and 120 min with a Contour Next EZ glucometer (Bayer). For the first colonisation, an intraperito-neal glucose tolerance test was also performed 3 weeks after colo-nisation. Mice were fasted for 4 hour and injected with d- glucose (2 g/kg body weight). Blood glucose was measured in tail vein blood at 0, 15, 30, 60, 90 and 120 min. Additional blood samples were collected at 0 and 15 min to analyse plasma insulin levels by insulin ELISA (Crystal Chem). Interleukin 6 (IL-6) and tumour necrosis factor- alpha (TNFα) were measured by ELISA in plasma collected from vena cava according to the manufacturers' proto-cols (R&D Systems). Colonisation of the recipient mice by the human gut microbiota was examined in caecal samples collected at the end of the experiment. Caecal samples were processed to profile the 16S rRNA gene as described above.
statistical analysesStatistical analyses were performed in R24 and GraphPad Prism 7. Tests between groups were performed using Wilcoxon rank sum test, with adjustment for false discovery rate using Benjamini- Hochberg procedure.25 Significance was defined for features with adjusted p<0.05. Differences in composition of 16S rRNA gene profiles, using permutated multivariate analysis of variance (ANOVA), were tested using the adonis function in vegan (V2.4 to 5), while for distance- based redundancy analysis (dbRDA) we used the capscale function also in vegan.26 Correla-tions between microbial taxa and clinical parameters were tested using Spearman’s test with adjustment for false discovery rate using the Benjamini- Hochberg procedure.25 Significance was defined for p<0.05, while trends for p<0.1. For mouse experi-ments the two- sided Student's t- tests was used. For tests between groups with repeated measurements a two- way ANOVA test for repeated measurement was used, which included a Sidak’s multiple comparison.
resulTsClinical profiles in subjects with PWs, their parents and patients with common obesityClinical characteristics of the subjects participating in the study are shown in table 1. Severely obese subjects with PWS and common obesity (OC) were matched for BFMI, DXA- body fat percentage, age, gender and presence of type 2 diabetes. In line with the general characteristics of PWS, including dysmorphy and abnormal body fat distribution, the PWS patients were shorter, lighter, had lower total fat mass and lower BMI than OC subjects. Fasting serum insulin and homeostatic model assessment of insulin resistance (HOMA- IR) were lower in PWS patients compared with OC subjects despite similar fat mass index, in agreement with previous studies.16 Blood glucose levels and HbA1c did not differ between the groups, nor did levels of HDL- c, low density lipoprotein cholesterol, triglycerides, leptin or C- reactive protein. Parents of PWS patients (mean BMI 25.5 kg/m2) were used as an additional slightly overweight but non- obese control group sharing environmental and genetic conditions with PWS subjects.
The biological characteristics were similar in PWS patients with deletion and in those with uniparental disomy, with the exception of blood triglycerides that were moderately higher in the deletion group (Online Supplementary Table 1).
Differences in fecal microbiota composition between PWs patients and people with common obesityThe analysis of microbiota profiles by sequencing of the 16S rRNA gene showed that the microbiota of PWS patients was
on March 12, 2022 by guest. P
rotected by copyright.http://gut.bm
j.com/
Gut: first published as 10.1136/gutjnl-2019-319322 on 14 O
ctober 2019. Dow
nloaded from
1232 Olsson lM, et al. Gut 2020;69:1229–1238. doi:10.1136/gutjnl-2019-319322
Gut microbiota
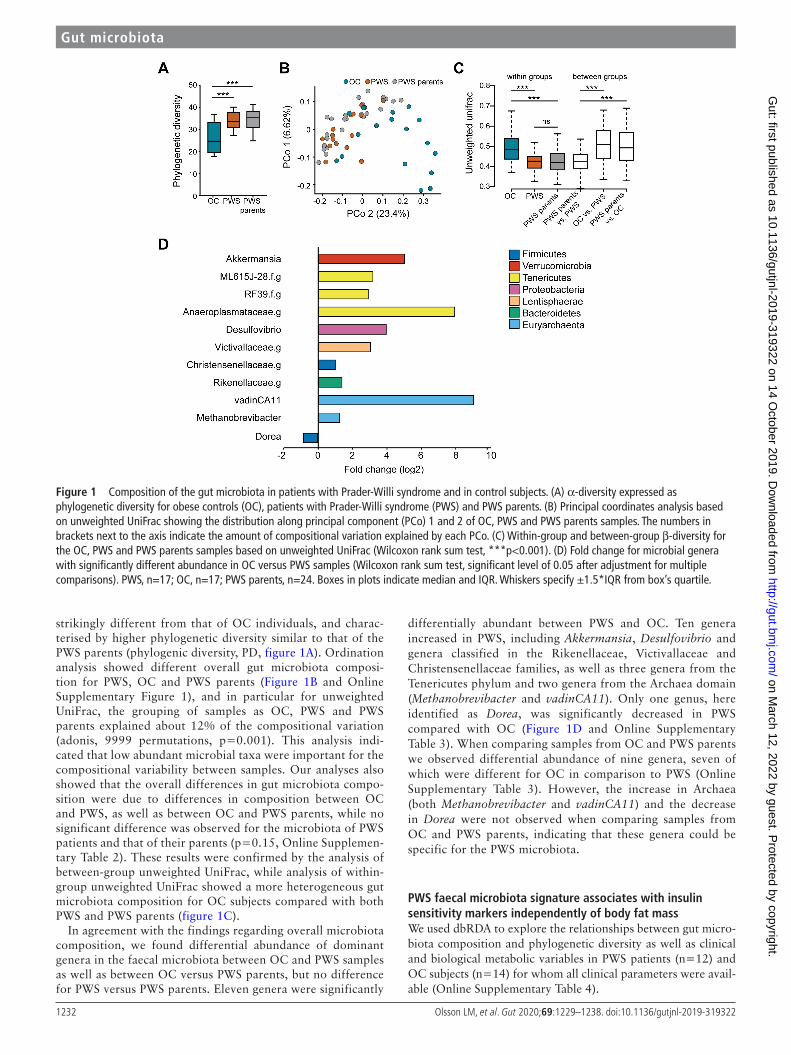
Figure 1 Composition of the gut microbiota in patients with Prader- Willi syndrome and in control subjects. (A) α-diversity expressed as phylogenetic diversity for obese controls (OC), patients with Prader- Willi syndrome (PWS) and PWS parents. (B) Principal coordinates analysis based on unweighted UniFrac showing the distribution along principal component (PCo) 1 and 2 of OC, PWS and PWS parents samples. The numbers in brackets next to the axis indicate the amount of compositional variation explained by each PCo. (C) Within- group and between- group β-diversity for the OC, PWS and PWS parents samples based on unweighted UniFrac (Wilcoxon rank sum test, ***p<0.001). (D) Fold change for microbial genera with significantly different abundance in OC versus PWS samples (Wilcoxon rank sum test, significant level of 0.05 after adjustment for multiple comparisons). PWS, n=17; OC, n=17; PWS parents, n=24. Boxes in plots indicate median and IQR. Whiskers specify ±1.5*IQR from box’s quartile.
strikingly different from that of OC individuals, and charac-terised by higher phylogenetic diversity similar to that of the PWS parents (phylogenic diversity, PD, figure 1A). Ordination analysis showed different overall gut microbiota composi-tion for PWS, OC and PWS parents (Figure 1B and Online Supplementary Figure 1), and in particular for unweighted UniFrac, the grouping of samples as OC, PWS and PWS parents explained about 12% of the compositional variation (adonis, 9999 permutations, p=0.001). This analysis indi-cated that low abundant microbial taxa were important for the compositional variability between samples. Our analyses also showed that the overall differences in gut microbiota compo-sition were due to differences in composition between OC and PWS, as well as between OC and PWS parents, while no significant difference was observed for the microbiota of PWS patients and that of their parents (p=0.15, Online Supplemen-tary Table 2). These results were confirmed by the analysis of between- group unweighted UniFrac, while analysis of within- group unweighted UniFrac showed a more heterogeneous gut microbiota composition for OC subjects compared with both PWS and PWS parents (figure 1C).
In agreement with the findings regarding overall microbiota composition, we found differential abundance of dominant genera in the faecal microbiota between OC and PWS samples as well as between OC versus PWS parents, but no difference for PWS versus PWS parents. Eleven genera were significantly
differentially abundant between PWS and OC. Ten genera increased in PWS, including Akkermansia, Desulfovibrio and genera classified in the Rikenellaceae, Victivallaceae and Christensenellaceae families, as well as three genera from the Tenericutes phylum and two genera from the Archaea domain (Methanobrevibacter and vadinCA11). Only one genus, here identified as Dorea, was significantly decreased in PWS compared with OC (Figure 1D and Online Supplementary Table 3). When comparing samples from OC and PWS parents we observed differential abundance of nine genera, seven of which were different for OC in comparison to PWS (Online Supplementary Table 3). However, the increase in Archaea (both Methanobrevibacter and vadinCA11) and the decrease in Dorea were not observed when comparing samples from OC and PWS parents, indicating that these genera could be specific for the PWS microbiota.
PWs faecal microbiota signature associates with insulin sensitivity markers independently of body fat massWe used dbRDA to explore the relationships between gut micro-biota composition and phylogenetic diversity as well as clinical and biological metabolic variables in PWS patients (n=12) and OC subjects (n=14) for whom all clinical parameters were avail-able (Online Supplementary Table 4).
on March 12, 2022 by guest. P
rotected by copyright.http://gut.bm
j.com/
Gut: first published as 10.1136/gutjnl-2019-319322 on 14 O
ctober 2019. Dow
nloaded from
1233Olsson lM, et al. Gut 2020;69:1229–1238. doi:10.1136/gutjnl-2019-319322
Gut microbiota
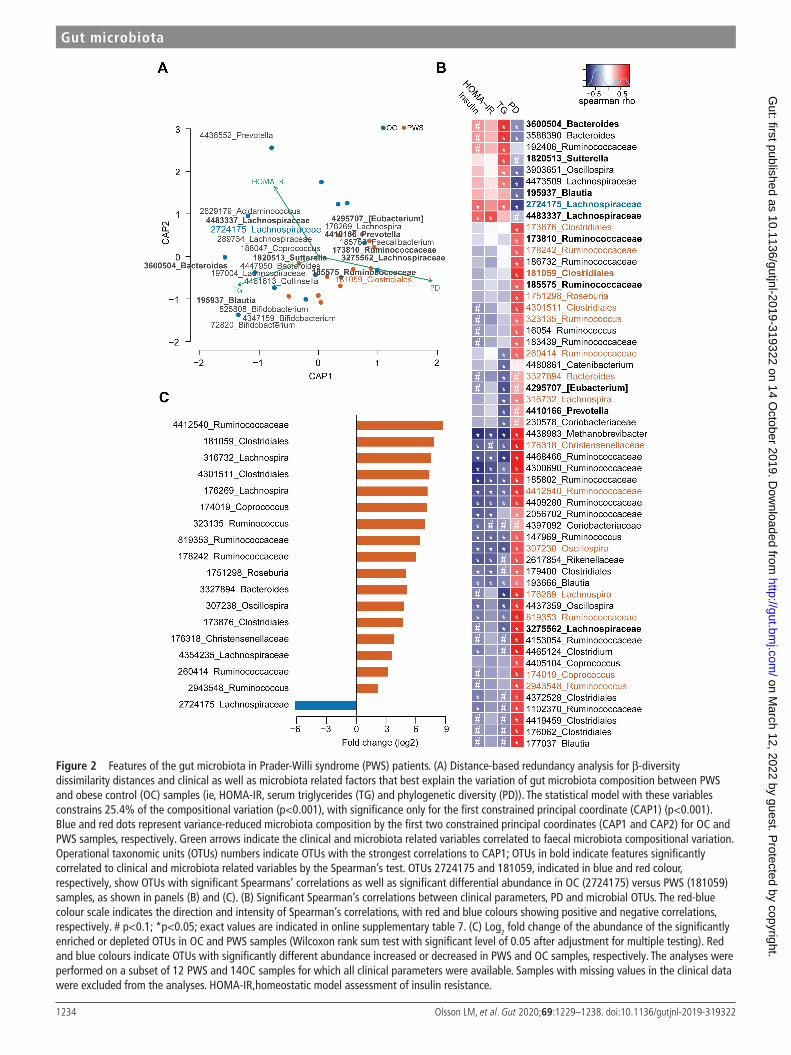
First, serum triglycerides (TG), HOMA- IR and phylogenetic diversity significantly contributed to compositional variation, and together constrained 25% of the total compositional vari-ance (figure 2A and Online Supplementary Table 5). Impor-tantly, parameters related to corpulence and adiposity were not significantly correlated to the variation of gut micro-biota composition (p=0.23 and p=0.19 for fat mass (kg) and weight (kg), respectively; Online Supplementary Table 5). The phylogenetic diversity contributed mostly to the compo-sitional variability and alone constrained 16% of the total variance (Online Supplementary Table 5). Moreover, in the dbRDA analysis the biplot vectors for serum triglycerides and HOMA- IR show opposite directions compared with phylo-genetic diversity, indicating a possible negative correlation of both insulin resistance and serum lipid levels with phyloge-netic diversity.
Second, microbial OTUs contributed significantly to the compositional variation of the faecal microbiota between PWS and OC in the constrained model. Interestingly, we found that OTU 3600504 corresponding to Bacteroides vulgatus, OTU 195937 corresponding to Blautia luti and OTU 185763 corre-sponding to Faecalibacterium prausnitzii had the strongest contributions to compositional variation in the microbiota in OC and PWS patients (Online Supplementary Table 7).
Third, we found significant correlations between 56 OTUs (p<0.1), phylogenetic diversity and metabolic variables (Figure 2B and Online Supplementary Table 7). The majority of these correlations were observed for phylogenetic diversity (n=46, p<0.05), in line with the dbRDA analysis. The abun-dance of several OTUs was nevertheless associated with the levels of serum insulin, HOMA- IR and triglycerides (Figure 2B and Online Supplementary Table 7). OTU 4438983 belonging to the Archaeon Methanobrevibacter showed the strongest significant negative correlations with these surrogates of insulin- resistance. In contrast, OTU 2724175 belonging to Ruminococcus gnavus, OTU 4483337 related to Merdimonas faecis and OTUs 3600 504 and 3588390 belonging to B. vulgatus were strongly posi-tively correlated to these markers (Figure 2B and Online Supple-mentary Table 7).
Finally, we found 18 OTUs with significant differential abundance in PWS versus OC samples (Figure 2C and Online Supplementary Table 8). Among these 18 OTUs, 8 OTUs belonging to Clostridiales (n=7) and Bacteroidales (n=1) were significantly more abundant in PWS and correlated nega-tively with serum insulin, HOMA- IR and TG (OTUs: 176269, 176318, 260414, 307238, 316732, 819353, 3327894, 4412540; Online Supplementary Table 7). The Clostridiales OTUs were highly prevalent in PWS samples (94% vs 52% for PWS vs OC, respectively) and showed a 8 to 400 times enrichment compared with OC (log2 fold change between 3.04 and 8.76; figure 2C and Online Supplementary Table 8). Only one OTU (2724175, matching to R. gnavus) showed decreased abundance in PWS samples and was more preva-lent in OC samples (47% vs 88% for PWS vs OC) (Figure 2C, Online Supplementary Table 7,8). As indicated above, OTU 2724175 correlated negatively to phylogenetic diversity and positively to serum triglycerides and HOMA- IR (Figure 2B, Online Supplementary Table 7), and in addition was identified as a contributing feature for the compositional variation of the microbiota between PWS and OC samples in the dbRDA analysis (Figure 2A, Online Supplementary Table 6). Overall, these results indicate that gut microbiota features linked to PWS associate with metabolic markers eventually suggesting a contribution of microbiota to insulin sensitivity.
Influence of genetic subtypes of PWs on the faecal microbiotaFaecal microbiota phylogenetic diversity was not different in PWS patients with deletion (n=12) compared with those with disomy (n=5). However, Principal Coordinates Analysis (PCoA) of unweighted UniFrac in conjunction with non- parametric multivariate ANOVA showed a significant difference in overall microbiota composition between patients with deletion and those with disomy (Online Supplementary Table 9). Moreover, phylogenetic diversity, triglycerides and serum insulin were important variables explaining the compositional variation in the microbiota of PWS patients with deletion and disomy, each of these factors explaining more than 10% of the total varia-tion (Online Supplementary Table 9). We also observed a trend for negative correlation between TG and phylogenetic diversity (Spearman’s Rho=−0.52, p=0.084).
As we observed increased triglyceride levels in patients with deletion (Online Supplementary Table 1), we tested the rela-tionship between microbiota compositional variation, genotype and triglyceride levels. Our analyses showed that the differ-ence in overall microbiota composition between patients with deletion and those with disomy could be attributed primarily to the difference in serum triglycerides. Serum triglyceride was a stronger factor for microbiota compositional variation than genotype (Online Supplementary Table 9). These analyses point to a possible link between composition and richness of the gut microbiota and serum lipids in PWS subjects.
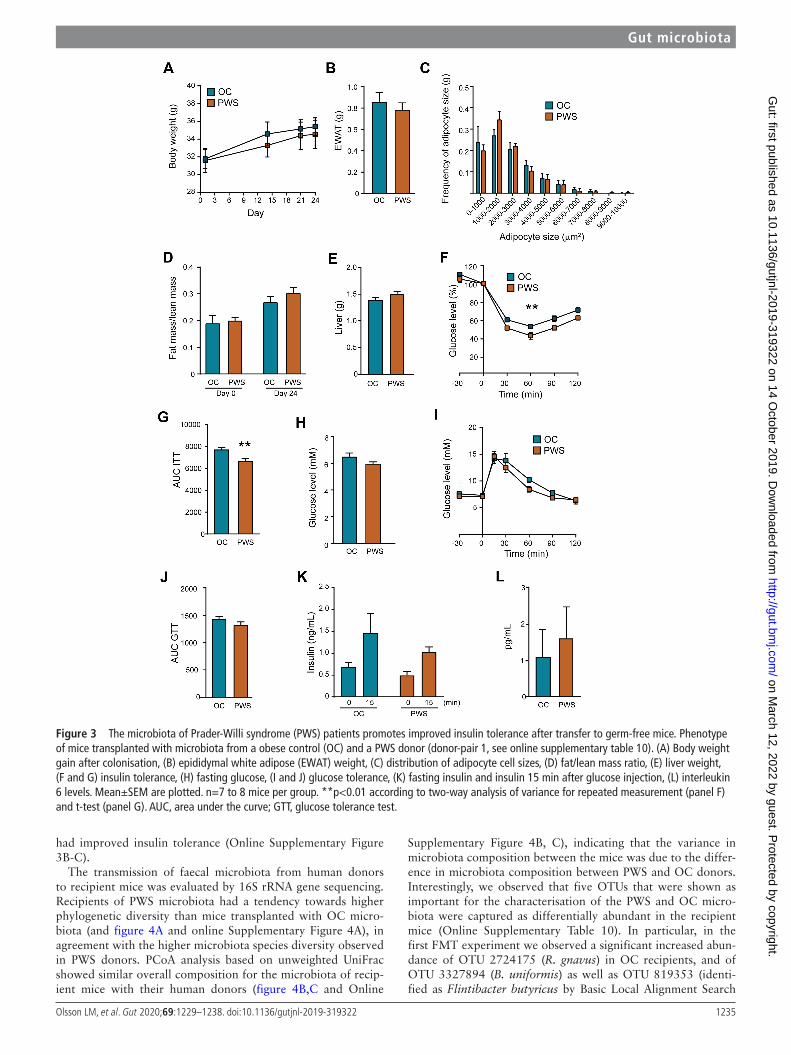
The improved insulin resistance of PWs compared to OC patients is transferred by gut microbiota transplantation into germ-free miceSince we observed significant links between metabolic vari-ables and the faecal microbiota of the PWS and OC subjects, we examined the impact of the gut microbiota on host metab-olism by faecal microbiota transplantation (FMT) in germ- free mice. We selected stools from BFMI- matched PWS and OC donor pairs based on clinical parameters (Table 1, Online Supplementary Table 10), and faecal microbiota profile (Online Supplementary Table 10). The OC donors were specif-ically lacking, or had low abundance of, Archaea, Tenericutes, Akkermansia, Christensenellaceae and microbial taxa signifi-cantly contributing to the specific structures of the PWS and OC microbiota (Online Supplementary Table 10 and Supple-mentary Figure 2). Faecal microbiota from a PWS patient with deletion was used in the first donor pair. Fourteen days after colonisation recipient mice colonised with OC and PWS faecal microbiota did not differ in body weight, gonadal fat weight, adipocyte size distribution, fat mass/lean mass ratio or liver weight (figure 3A–E). However, mice transplanted with PWS microbiota had improved insulin tolerance compared with mice transplanted with OC microbiota (figure 3F–G). Fasting glucose levels, glucose tolerance, fasting insulin levels and insulin secretion in response to glucose were similar between the groups (figure 3H–K). Systemic levels of IL-6 did not differ between the groups (figure 3L) while the levels of TNFα were below the detection limit.
To confirm the observed difference in insulin tolerance, a second FMT experiment was conducted with a new donor pair (this time with a PWS patient with disomy) and ITT was performed 14 days after colonisation. In agreement with the first experiment, we confirmed that the recipient groups had similar body weight and fasting glucose levels (Online Supplementary Figure 3A- B) but mice transplanted with PWS faecal microbiota
on March 12, 2022 by guest. P
rotected by copyright.http://gut.bm
j.com/
Gut: first published as 10.1136/gutjnl-2019-319322 on 14 O
ctober 2019. Dow
nloaded from
1234 Olsson lM, et al. Gut 2020;69:1229–1238. doi:10.1136/gutjnl-2019-319322
Gut microbiota
Figure 2 Features of the gut microbiota in Prader- Willi syndrome (PWS) patients. (A) Distance- based redundancy analysis for β-diversity dissimilarity distances and clinical as well as microbiota related factors that best explain the variation of gut microbiota composition between PWS and obese control (OC) samples (ie, HOMA- IR, serum triglycerides (TG) and phylogenetic diversity (PD)). The statistical model with these variables constrains 25.4% of the compositional variation (p<0.001), with significance only for the first constrained principal coordinate (CAP1) (p<0.001). Blue and red dots represent variance- reduced microbiota composition by the first two constrained principal coordinates (CAP1 and CAP2) for OC and PWS samples, respectively. Green arrows indicate the clinical and microbiota related variables correlated to faecal microbiota compositional variation. Operational taxonomic units (OTUs) numbers indicate OTUs with the strongest correlations to CAP1; OTUs in bold indicate features significantly correlated to clinical and microbiota related variables by the Spearman’s test. OTUs 2724175 and 181059, indicated in blue and red colour, respectively, show OTUs with significant Spearmans’ correlations as well as significant differential abundance in OC (2724175) versus PWS (181059) samples, as shown in panels (B) and (C). (B) Significant Spearman’s correlations between clinical parameters, PD and microbial OTUs. The red- blue colour scale indicates the direction and intensity of Spearman’s correlations, with red and blue colours showing positive and negative correlations, respectively. # p<0.1; *p<0.05; exact values are indicated in online supplementary table 7. (C) Log2 fold change of the abundance of the significantly enriched or depleted OTUs in OC and PWS samples (Wilcoxon rank sum test with significant level of 0.05 after adjustment for multiple testing). Red and blue colours indicate OTUs with significantly different abundance increased or decreased in PWS and OC samples, respectively. The analyses were performed on a subset of 12 PWS and 14OC samples for which all clinical parameters were available. Samples with missing values in the clinical data were excluded from the analyses. HOMA- IR,homeostatic model assessment of insulin resistance.
on March 12, 2022 by guest. P
rotected by copyright.http://gut.bm
j.com/
Gut: first published as 10.1136/gutjnl-2019-319322 on 14 O
ctober 2019. Dow
nloaded from
1235Olsson lM, et al. Gut 2020;69:1229–1238. doi:10.1136/gutjnl-2019-319322
Gut microbiota
Figure 3 The microbiota of Prader- Willi syndrome (PWS) patients promotes improved insulin tolerance after transfer to germ- free mice. Phenotype of mice transplanted with microbiota from a obese control (OC) and a PWS donor (donor- pair 1, see online supplementary table 10). (A) Body weight gain after colonisation, (B) epididymal white adipose (EWAT) weight, (C) distribution of adipocyte cell sizes, (D) fat/lean mass ratio, (E) liver weight, (F and G) insulin tolerance, (H) fasting glucose, (I and J) glucose tolerance, (K) fasting insulin and insulin 15 min after glucose injection, (L) interleukin 6 levels. Mean±SEM are plotted. n=7 to 8 mice per group. **p<0.01 according to two- way analysis of variance for repeated measurement (panel F) and t- test (panel G). AUC, area under the curve; GTT, glucose tolerance test.
had improved insulin tolerance (Online Supplementary Figure 3B- C).
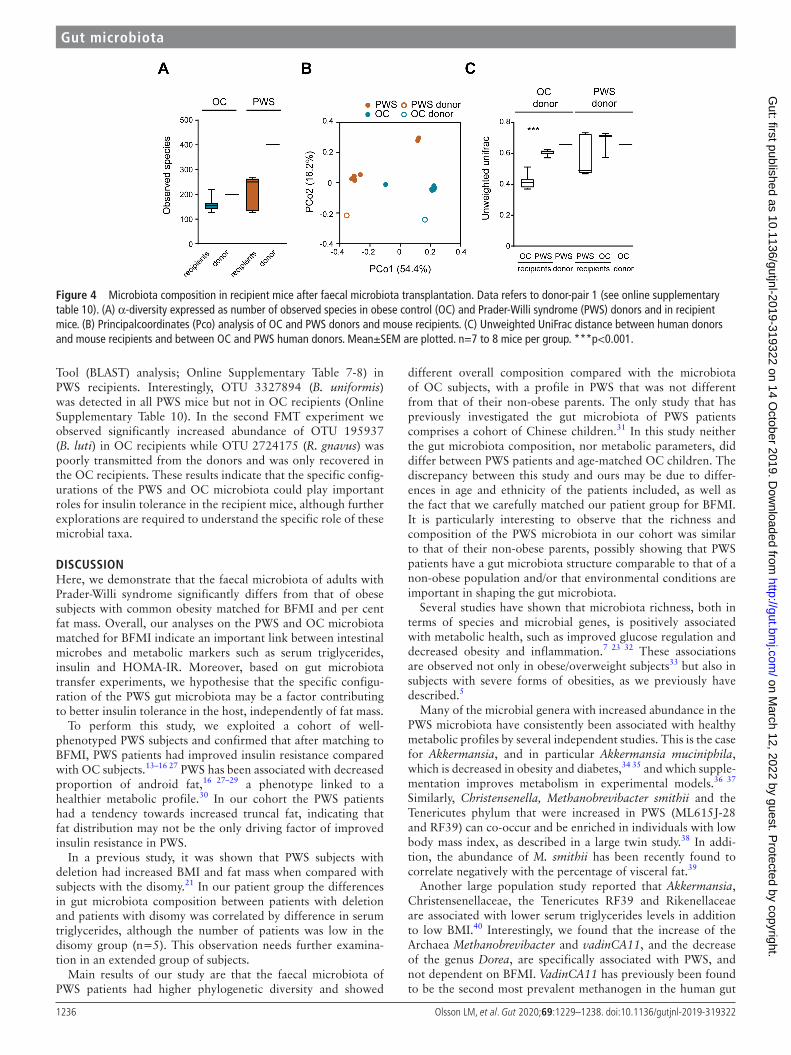
The transmission of faecal microbiota from human donors to recipient mice was evaluated by 16S rRNA gene sequencing. Recipients of PWS microbiota had a tendency towards higher phylogenetic diversity than mice transplanted with OC micro-biota (and figure 4A and online Supplementary Figure 4A), in agreement with the higher microbiota species diversity observed in PWS donors. PCoA analysis based on unweighted UniFrac showed similar overall composition for the microbiota of recip-ient mice with their human donors (figure 4B,C and Online
Supplementary Figure 4B, C), indicating that the variance in microbiota composition between the mice was due to the differ-ence in microbiota composition between PWS and OC donors. Interestingly, we observed that five OTUs that were shown as important for the characterisation of the PWS and OC micro-biota were captured as differentially abundant in the recipient mice (Online Supplementary Table 10). In particular, in the first FMT experiment we observed a significant increased abun-dance of OTU 2724175 (R. gnavus) in OC recipients, and of OTU 3327894 (B. uniformis) as well as OTU 819353 (identi-fied as Flintibacter butyricus by Basic Local Alignment Search
on March 12, 2022 by guest. P
rotected by copyright.http://gut.bm
j.com/
Gut: first published as 10.1136/gutjnl-2019-319322 on 14 O
ctober 2019. Dow
nloaded from
1236 Olsson lM, et al. Gut 2020;69:1229–1238. doi:10.1136/gutjnl-2019-319322
Gut microbiota
Figure 4 Microbiota composition in recipient mice after faecal microbiota transplantation. Data refers to donor- pair 1 (see online supplementary table 10). (A) α-diversity expressed as number of observed species in obese control (OC) and Prader- Willi syndrome (PWS) donors and in recipient mice. (B) Principalcoordinates (Pco) analysis of OC and PWS donors and mouse recipients. (C) Unweighted UniFrac distance between human donors and mouse recipients and between OC and PWS human donors. Mean±SEM are plotted. n=7 to 8 mice per group. ***p<0.001.
Tool (BLAST) analysis; Online Supplementary Table 7-8) in PWS recipients. Interestingly, OTU 3327894 (B. uniformis) was detected in all PWS mice but not in OC recipients (Online Supplementary Table 10). In the second FMT experiment we observed significantly increased abundance of OTU 195937 (B. luti) in OC recipients while OTU 2724175 (R. gnavus) was poorly transmitted from the donors and was only recovered in the OC recipients. These results indicate that the specific config-urations of the PWS and OC microbiota could play important roles for insulin tolerance in the recipient mice, although further explorations are required to understand the specific role of these microbial taxa.
DIsCussIOnHere, we demonstrate that the faecal microbiota of adults with Prader- Willi syndrome significantly differs from that of obese subjects with common obesity matched for BFMI and per cent fat mass. Overall, our analyses on the PWS and OC microbiota matched for BFMI indicate an important link between intestinal microbes and metabolic markers such as serum triglycerides, insulin and HOMA- IR. Moreover, based on gut microbiota transfer experiments, we hypothesise that the specific configu-ration of the PWS gut microbiota may be a factor contributing to better insulin tolerance in the host, independently of fat mass.
To perform this study, we exploited a cohort of well- phenotyped PWS subjects and confirmed that after matching to BFMI, PWS patients had improved insulin resistance compared with OC subjects.13–16 27 PWS has been associated with decreased proportion of android fat,16 27–29 a phenotype linked to a healthier metabolic profile.30 In our cohort the PWS patients had a tendency towards increased truncal fat, indicating that fat distribution may not be the only driving factor of improved insulin resistance in PWS.
In a previous study, it was shown that PWS subjects with deletion had increased BMI and fat mass when compared with subjects with the disomy.21 In our patient group the differences in gut microbiota composition between patients with deletion and patients with disomy was correlated by difference in serum triglycerides, although the number of patients was low in the disomy group (n=5). This observation needs further examina-tion in an extended group of subjects.
Main results of our study are that the faecal microbiota of PWS patients had higher phylogenetic diversity and showed
different overall composition compared with the microbiota of OC subjects, with a profile in PWS that was not different from that of their non- obese parents. The only study that has previously investigated the gut microbiota of PWS patients comprises a cohort of Chinese children.31 In this study neither the gut microbiota composition, nor metabolic parameters, did differ between PWS patients and age- matched OC children. The discrepancy between this study and ours may be due to differ-ences in age and ethnicity of the patients included, as well as the fact that we carefully matched our patient group for BFMI. It is particularly interesting to observe that the richness and composition of the PWS microbiota in our cohort was similar to that of their non- obese parents, possibly showing that PWS patients have a gut microbiota structure comparable to that of a non- obese population and/or that environmental conditions are important in shaping the gut microbiota.
Several studies have shown that microbiota richness, both in terms of species and microbial genes, is positively associated with metabolic health, such as improved glucose regulation and decreased obesity and inflammation.7 23 32 These associations are observed not only in obese/overweight subjects33 but also in subjects with severe forms of obesities, as we previously have described.5
Many of the microbial genera with increased abundance in the PWS microbiota have consistently been associated with healthy metabolic profiles by several independent studies. This is the case for Akkermansia, and in particular Akkermansia muciniphila, which is decreased in obesity and diabetes,34 35 and which supple-mentation improves metabolism in experimental models.36 37 Similarly, Christensenella, Methanobrevibacter smithii and the Tenericutes phylum that were increased in PWS (ML615J-28 and RF39) can co- occur and be enriched in individuals with low body mass index, as described in a large twin study.38 In addi-tion, the abundance of M. smithii has been recently found to correlate negatively with the percentage of visceral fat.39
Another large population study reported that Akkermansia, Christensenellaceae, the Tenericutes RF39 and Rikenellaceae are associated with lower serum triglycerides levels in addition to low BMI.40 Interestingly, we found that the increase of the Archaea Methanobrevibacter and vadinCA11, and the decrease of the genus Dorea, are specifically associated with PWS, and not dependent on BFMI. VadinCA11 has previously been found to be the second most prevalent methanogen in the human gut
on March 12, 2022 by guest. P
rotected by copyright.http://gut.bm
j.com/
Gut: first published as 10.1136/gutjnl-2019-319322 on 14 O
ctober 2019. Dow
nloaded from
1237Olsson lM, et al. Gut 2020;69:1229–1238. doi:10.1136/gutjnl-2019-319322
Gut microbiota
and not to be mutually exclusive with the most prevalent metha-nogen M. smithii.38 As we observed strong negative correlations between OTUs related to M. smithii and serum triglycerides and insulin levels, we could propose a protective role for this specific methanogenic Archaea in insulin tolerance and more broadly metabolic health even in case of severe obesity.
In contrast, Dorea has been associated with obesity41 and abundance of BMI- predictive plasma metabolites, including glutamate and branched- chain amino acids.42 In particular, D. longicatena has been found to be positively correlated with circulating leptin and negatively correlated with circulating adiponectin levels, indicating possible important roles in adipose tissue physiology.41 Whereas we did not explore adipose tissue samples in this study we have previously shown that subcuta-neous adipose tissue from PWS was less proinflammatory and profibrotic although with higher adipocyte size than that of commonly obese subjects suggesting an improved adipose tissue expandability in PWS subjects.16
Diet- induced obesity results in the degradation of the outer mucus layer of the epithelium.37 Several intestinal microbes distributed in diverse bacterial phyla have been characterised as mucin- degraders.43 However, while the activity of mucin- degraders such as A. muciniphila appears beneficial for intes-tinal health and host metabolism,44 mucus degradation by other bacteria such as R. gnavus45 and B. vulgatus has been associ-ated with opposite outcomes, including intestinal inflamma-tion, inflammatory bowel diseases, obesity, metabolic disorders and prediabetes.46 In addition, B. vulgatus is an opportunistic pathogen, present in many anaerobic infections and associated Crohn’s disease.47 OTUs 3600504 (B. vulgatus) and 2724175 (R. gnavus) were important features of the OC microbiota in our study. This observation is also in agreement with our previous report showing negative association between B. vulgatus with gut microbial richness and markers of insulin resistance in severe obesity.5 In line with these previous findings, we here show that these OTUs strongly contributed to overall community compo-sitional variability, negatively correlated to microbiota phyloge-netic diversity and positively correlated to serum triglycerides and insulin levels.
In addition to the possible negative impact of bacteria such as B. vulgatus and R. gnavus, we observed several microbial taxa beneficially associated with serum triglycerides, insulin and HOMA- IR. This includes B. uniformis, which has been previ-ously identified as an important feature of the microbiota of lean subjects in a Chinese population.41 We observed beneficial asso-ciations also for several taxa with a poor taxonomic affiliation in the Clostridiales family, known to contain important butyrate producers. Depletion of butyrate- producing bacteria is a consis-tent feature of type 2 diabetes, prediabetes as well as severe obesity, as indicated by several independent studies.5 22 23 32 Here, we observed an important role for F. prausnitzii in the compo-sitional variation between PWS and BFMI- matched OC micro-biota, and significant enrichment of butyrate producers such as E. eligens and Flintibacter butyricus,48 which displayed consistent negative correlations with serum triglycerides and insulin levels. Therefore, our results confirm the major importance of bacterial butyrate producers for metabolic regulation and a healthy gut, in line with observations that microbial butyrate production is an important modulator of intestinal inflammation.49
We acknowledge some limitations of the study. The recruit-ment strategy applied may prevent us from extrapolate the results to all patients with PWS, which is a phenotypically heterogeneous group. Moreover, we are lacking assessment of food consumption, which is very difficult to obtain in patients
with PWS. This would have been very informative and a possible link to the differences in the microbiota identified.
Faecal microbiota transplantation to germ- free mice resulted in improved insulin tolerance in recipients of PWS microbiota, which demonstrated that the microbiota of PWS patients and OC subjects not only differs in composition, but also has the func-tional potential to impact host metabolism. The ability of the gut microbiota to directly modulate insulin sensitivity has been demonstrated through faecal microbiota transfers in humans, where transfer of microbiota from healthy subjects to patients with metabolic syndrome improves insulin sensitivity.50 In our study, donors were not randomly selected but chosen based on the abundance of key microbial taxa that characterised the PWS faecal microbiota. Differences between the donors in key features of the microbiota such as diversity and overall compo-sition were preserved in the recipient mice, and we observed successful transfer of both OC- associated and PWS- associated microbial taxa. Importantly, PWS recipient mice displaying insulin tolerance were colonised by Flintibacter as well as B. uniformis, but not with R. gnavus and B. luti, which were more abundant and prevalent in the OC recipient mice. Therefore, our results indicate that structural and functional features of the microbiota, including phylogenetic diversity but also mucus degradation properties and butyrate production might be important for the transmission of the host phenotype. However, markers of systemic inflammation did not differ between the recipient groups and the mechanisms underlying the difference in insulin tolerance cannot be determined from the preformed experiments.
In conclusion, we show that despite severe obesity, PWS gut microbiota profiles differ from common obesity, but are not different from those of their non- obese parents. PWS gut microbiota strongly associate with indexes of metabolic health, a phenotype that could partly be transmitted in axenic animals. Future studies should explore whether the presence of methano-genic Archaea, butyrate production and intestinal mucus metab-olism that characterise the PWS gut microbiota, causally explain the improved lipid profiles and insulin tolerance, and whether they play a role in the protection from metabolic consequences of obesity.
Author affiliations1The Wallenberg laboratory, Department of Molecular and clinical Medicine, institute of Medicine, sahlgrenska academy, University of gothenburg, gothenburg, sweden2inserM, nutrition and obesities; systemic approaches (nutriOmics) research Unit, sorbonne Universite, Paris, Île- de- France, France3assistance Publique- hôpitaux de Paris, reference center for rare Diseases (Prader- Willi syndrome), nutrition Department, University hospital Pitié salpêtrière, Paris, Île- de- France, France4novo nordisk Foundation center for Basic Metabolic research, section for Metabolic receptology and enteroendocrinology, Faculty of health sciences, University of copenhagen, copenhagen, Denmark
Acknowledgements We thank louise helldén, carina arvidsson, antonio Molinaro, Manuela Krämer, robert Jakubowicz and anna hallén for technical assistance. We also thank Dr hichem gahouti (obese control phenotyping) and Valentine lemoine for their help in the clinical investigation of PWs and their parents (Pitié-salpêtrière hospital, ican and nutrition department). The clinical investigations were performed at the reference center of rare Diseases (nutrition Department) and at the human nutrition research center (crnh ile de France), Pitié-salpêtrière hospital. The computations were performed on resources provided by snic through Uppsala Multidisciplinary center for advanced computational science (UPPMaX) under Project snic 2018-3-350.
Contributors Kc, rc, FB, VT and cP designed and directed the project; rc, cP, Mc, lO, JaW, lh, ca, aM, MK, rJ, ah, hg and Vl performed the experiments; lO, VT and rc analysed data; rc, lO, VT, Kc and cP wrote the article with inputs from FB and Mc.
on March 12, 2022 by guest. P
rotected by copyright.http://gut.bm
j.com/
Gut: first published as 10.1136/gutjnl-2019-319322 on 14 O
ctober 2019. Dow
nloaded from
1238 Olsson lM, et al. Gut 2020;69:1229–1238. doi:10.1136/gutjnl-2019-319322
Gut microbiota
Funding This study was supported by several sources: european Union, FP7 health (MeTacarDis) (healTh- F4-2012-30531), svenska Forskningsrådet Formas (2017-01996_3 and 2017-02001), Foundation leducq (17cVD01), agence nationale de la recherche (anr-11- DPBs-0001 and anr-10- iahU-05), the swedish research council (Vetenskapsrådet) and grants from the swedish state under the agreement between the swedish government and the county councils, the alF- agreement (alFgBg- 718101). FB is Torsten söderberg Professor in Medicine and recipient of an erc consolidator grant (european research council, consolidator grant 615362- MeTaBase).
Competing interests FB is in the scientific advisory Board of Metabogen, sweden.
Patient consent for publication not required.
ethics approval all animal procedures were approved by the gothenburg animal ethics committee (152–2015).
Provenance and peer review not commissioned; externally peer reviewed.
Data availability statement 16s data are available at european nucleotide archive (accession number: PrJeB33908; http://www. ebi. ac. uk/ ena/ data/ view/ PrJeB33908)
Open access This is an open access article distributed in accordance with the creative commons attribution non commercial (cc BY- nc 4.0) license, which permits others to distribute, remix, adapt, build upon this work non- commercially, and license their derivative works on different terms, provided the original work is properly cited, appropriate credit is given, any changes made indicated, and the use is non- commercial. see: http:// creativecommons. org/ licenses/ by- nc/ 4. 0/.
OrCID iDslisa M Olsson http:// orcid. org/ 0000- 0001- 9730- 1915robert caesar http:// orcid. org/ 0000- 0003- 1017- 2933
RefeRences 1 iacobini c, Pugliese g, Blasetti Fantauzzi c, et al. Metabolically healthy versus
metabolically unhealthy obesity. Metabolism 2019;92:51–60. 2 rohde K, Keller M, la cour Poulsen l, et al. genetics and epigenetics in obesity.
Metabolism: clinical and experimental 2018. 3 Bäckhed F, Ding h, Wang T, et al. The gut microbiota as an environmental factor that
regulates fat storage. Proc Natl Acad Sci U S A 2004;101:15718–23. 4 rabot s, Membrez M, Bruneau a, et al. germ- free c57bl/6j mice are resistant to
high- fat- diet- induced insulin resistance and have altered cholesterol metabolism. The FASEB Journal 2010;24:4948–59.
5 aron- Wisnewsky J, Prifti e, Belda e, et al. Major microbiota dysbiosis in severe obesity: fate after bariatric surgery. Gut 2019;68:70–82.
6 Turnbaugh PJ, hamady M, Yatsunenko T, et al. a core gut microbiome in obese and lean twins. Nature 2009;457:480–4.
7 le chatelier e, nielsen T, Qin J, et al. richness of human gut microbiome correlates with metabolic markers. Nature 2013;500:541–6.
8 sze Ma, schloss PD. looking for a signal in the noise: revisiting obesity and the microbiome. MBio 2016;7:e01018–16.
9 ghosh s, Bouchard c. convergence between biological, behavioural and genetic determinants of obesity. Nat Rev Genet 2017;18:731–48.
10 Montague cT, Farooqi is, Whitehead JP, et al. congenital leptin deficiency is associated with severe early- onset obesity in humans. Nature 1997;387:903–8.
11 Farooqi is, O’rahilly s. Monogenic obesity in humans. Annu Rev Med 2005;56:443–58.
12 Butler Mg. Prader- willi syndrome: obesity due to genomic imprinting. Current genomics 2011;12:204–15.
13 Talebizadeh Z, Butler Mg. insulin resistance and obesity- related factors in Prader- Willi syndrome: comparison with obese subjects. Clin Genet 2005;67:230–9.
14 Faienza MF, Ventura a, lauciello r, et al. analysis of endothelial protein c receptor gene and metabolic profile in prader- willi syndrome and obese subjects. Obesity 2012;20:1866–70.
15 haqq aM, Muehlbauer MJ, newgard cB, et al. The metabolic phenotype of Prader- Willi syndrome (PWs) in childhood: heightened insulin sensitivity relative to body mass index. J Clin Endocrinol Metab 2011;96:e225–e232.
16 lacroix D, Moutel s, coupaye M, et al. Metabolic and adipose tissue signatures in adults with Prader- Willi syndrome: a model of extreme adiposity. J Clin Endocrinol Metab 2015;100:850–9.
17 haqq aM, Muehlbauer M, svetkey lP, et al. altered distribution of adiponectin isoforms in children with Prader- Willi syndrome (PWs): association with insulin sensitivity and circulating satiety peptide hormones. Clin Endocrinol 2007;67:944–51.
18 Touch s, assmann Ke, aron- Wisnewsky J, et al. Mucosal- associated invariant T (mait) cells are depleted and prone to apoptosis in cardiometabolic disorders. Faseb j;2018.
19 liu P, Ma F, lou h, et al. The utility of fat mass index vs. Body mass index and percentage of body fat in the screening of metabolic syndrome. BMC Public Health 2013;13:629.
20 Kyle Ug, schutz Y, Dupertuis YM, et al. Body composition interpretation. contributions of the fat- free mass index and the body fat mass index. Nutrition 2003;19:597–604.
21 coupaye M, Tauber M, cuisset l, et al. effect of genotype and previous gh treatment on adiposity in adults with Prader- Willi syndrome. J Clin Endocrinol Metab 2016;101:4895–903.
22 Karlsson Fh, Tremaroli V, nookaew i, et al. gut metagenome in european women with normal, impaired and diabetic glucose control. Nature 2013;498:99–103.
23 allin Kh, Tremaroli V, caesar r, et al. aberrant intestinal microbiota in individuals with prediabetes. Diabetologia 2018;61:810–20.
24 r core Team. R: a language and environment for statistical computing. Vienna, austria: r Foundation for statistical computing, 2018.
25 Benjamini Y, hochberg Y. controlling the false discovery rate: a practical and powerful approach to multiple testing. Journal of the Royal Statistical Society: Series B 1995;57:289–300.
26 Oksanen J, Blanchet Fg, Kindt r, et al. Vegan: Community ecology package, 2015. 27 lloret- linares c, Faucher P, coupaye M, et al. comparison of body composition,
basal metabolic rate and metabolic outcomes of adults with Prader Willi syndrome or lesional hypothalamic disease, with primary obesity. Int J Obes 2013;37:1198–203.
28 Theodoro MF, Talebizadeh Z, Butler Mg. Body composition and fatness patterns in Prader- Willi syndrome: comparison with simple Obesity*. Obesity 2006;14:1685–90.
29 sode- carlsen r, Farholt s, rabben KF, et al. Body composition, endocrine and metabolic profiles in adults with Prader- Willi syndrome. Growth Hormone & IGF Research 2010;20:179–84.
30 Després J- P, lemieux i. abdominal obesity and metabolic syndrome. Nature 2006;444:881–7.
31 Zhang c, Yin a, li h, et al. Dietary modulation of gut microbiota contributes to alleviation of both genetic and simple obesity in children. EBioMedicine 2015;2:968–84.
32 Forslund K, hildebrand F, nielsen T, et al. Disentangling type 2 diabetes and metformin treatment signatures in the human gut microbiota. Nature 2015;528:262–6.
33 cotillard a, Kennedy sP, Kong lc, et al. Dietary intervention impact on gut microbial gene richness. Nature 2013;500:585–8.
34 Dao Mc, everard a, aron- Wisnewsky J, et al. Akkermansia muciniphila and improved metabolic health during a dietary intervention in obesity: relationship with gut microbiome richness and ecology. Gut 2016;65:426–36.
35 Yassour M, lim MY, Yun hs, et al. sub- clinical detection of gut microbial biomarkers of obesity and type 2 diabetes. Genome Med 2016;8:17.
36 Plovier h, everard a, Druart c, et al. a purified membrane protein from akkermansia muciniphila or the pasteurized bacterium improves metabolism in obese and diabetic mice. Nat Med 2017;23:107–13.
37 everard a, Belzer c, geurts l, et al. cross- talk between akkermansia muciniphila and intestinal epithelium controls diet- induced obesity. Proc Natl Acad Sci U S A 2013;110:9066–71.
38 goodrich JK, Waters Jl, Poole ac, et al. human genetics shape the gut microbiome. Cell 2014;159:789–99.
39 Visconti a, le roy ci, rosa F. Interplay between the human gut microbiome and host metabolism, 2019.
40 soret r, chevalier J, De coppet P, et al. short- chain fatty acids regulate the enteric neurons and control gastrointestinal motility in rats. Gastroenterology 2010;138:1772–82.
41 liu r, hong J, Xu X, et al. gut microbiome and serum metabolome alterations in obesity and after weight- loss intervention. Nat Med 2017;23:859–68.
42 Ottosson F, Brunkwall l, ericson U, et al. connection between bmi- related plasma metabolite profile and gut microbiota. J Clin Endocrinol Metab 2018;103:1491–501.
43 Tailford le, crost eh, Kavanaugh D, et al. Mucin glycan foraging in the human gut microbiome. Front Genet 2015;6:81.
44 Belzer c, chia lW, aalvink s, et al. Microbial Metabolic networks at the Mucus layer lead to Diet- independent Butyrate and Vitamin B Production by intestinal symbionts. MBio 2017;8.
45 crost eh, Tailford le, Monestier M, et al. The mucin- degradation strategy of Ruminococcus gnavus : The importance of intramolecular trans -sialidases. Gut Microbes 2016;7:302–12.
46 hall aB, Yassour M, sauk J, et al. a novel ruminococcus gnavus clade enriched in inflammatory bowel disease patients. Genome Med 2017;9:103.
47 Wexler hM. Bacteroides: the good, the bad, and the nitty- gritty. Clin Microbiol Rev 2007;20:593–621.
48 lagkouvardos i, Pukall r, abt B, et al. The mouse intestinal bacterial collection (miBc) provides host- specific insight into cultured diversity and functional potential of the gut microbiota. Nat Microbiol 2016;1.
49 Byndloss MX, Olsan ee, rivera- chávez F, et al. Microbiota- activated PPar-γ signaling inhibits dysbiotic enterobacteriaceae expansion. Science 2017;357:570–5.
50 Kootte rs, levin e, salojärvi J, et al. improvement of insulin sensitivity after lean donor feces in metabolic syndrome is driven by baseline intestinal microbiota composition. Cell Metab 2017;26:611–9.
on March 12, 2022 by guest. P
rotected by copyright.http://gut.bm
j.com/
Gut: first published as 10.1136/gutjnl-2019-319322 on 14 O
ctober 2019. Dow
nloaded from