Embed Size (px)
Citation preview

1
Gulf Stream Note #3‐ 2017 The Gulf Stream in the Vicinity of the Rhumb Line Newport to Bermuda June 6, 2017 An Analysis of Conditions
W. Frank Bohlen Mystic, Connecticut Bohlen @uconn.edu Persistent cloud cover continues to limit satellite views of the Gulf Stream region forcing reliance on models and experience gained by previous study. Since the 19th of May there have been only three days of reasonable visibility allowing some assessment of Stream location, structure and evolution. On 21 May the northern margin of the Stream crossed the rhumb line at a point approximately 240nm from Newport (Fig. 1). To the north of the crossing there was a prominent lobe of warm water with sufficient structure (i.e. thermal contrast) to produce first a set to the east and then a counter flow to the west. These flows effectively offset each other and can be neglected for navigational purposes unless encountered in extremely light winds. To the south of the lobe the main body of the Gulf Stream crosses the rhumb line at a near right angle with flows proceeding from the west to the east. Maximun currents approaching 5 knots are typically located approximately 30nm to the south of the northern edge of the Stream. Exact determination of the width of the main body of the Stream and flow characteristics south to Bermuda is limited by cloud cover.
A composite image of sea surface temperatures (SSTs) on the 27 of May (Fig.3) again shows the northern margin of the Stream crossing the rhumb line at a point approximately 240nm from Newport. The warm water lobe remains in evidence with some slight easterly displacement and there is some indication of a developing meander in the main body of the Stream to the west of the rhumb line. The width of the main body of the stream is approximately 70nm. Further south the composite shows several areas of sharp organized thermal contrasts sufficient to produce counter clockwise flow around a region centered near 35o 15’ N 67o40’W. This appears to be the remnants of the cold core ring discussed in the last Note. The altimetry based model results for the 29th of May (two day delay for data processing) show this feature clearly (Fig. 3) and suggest that it influences a region extending through the main body of the Stream to its northern margin. With the exception of the small well defined region of the ring flows through the area are expected to be weak and generally less than 1 knot.
Visibility improved significantly on the 3rd and 4th of June allowing acquisition of both instantaneous and composite SST images (from https://rucool.marine.rutgers.edu/data). The instantaneous image of 4 June again shows little change in Stream position relative to the rhumb line and that the width of the main body of the Stream is approximately 70nm. There is however, some evident easterly displacement of the warm water lobe and clear development of a meander to the west of the rhumb line (Fig.4). On the 4th the Stream still crossed the rhumb line at a near

2
right angle with flows proceeding west to east. Continuing evolution of the meander may result in some change of this pattern over the next few days and may affect navigation both to Bermuda and back to the U.S.
To the south of the main body of the Steam the instantaneous SST image of 4 June shows a number of organized thermal patterns similar to those shown on the composite of 27 May (compare Figs 3 and 4). The altimetry based model results for this day (Fig.5) indicates that the temperature – water column density- gradients associated with these patterns are sufficient to affect an area of more than 180nm from the northern limit of the Stream to south of 35o N and to produce a relatively coherent counter-clockwise flow throughout this area. Maximum currents in this system should be less than 1 knot confined to a relatively narrow region along the outer edge of the feature. It’s likely that this feature will be affected by the developing meander as it affects entrainment. This possibility should be carefully watched over the next few days leading to the start of the Marion Bermuda Race.
One last comment. In addition to the large area of counter clockwise flow near the main body of the Stream, the altimetry based model also shows some development of counter-clockwise flow to the west of the rhumb line near Bermuda. This feature centered at 32o 30’ N 66o 45’ W is well west of the rhumb line and should drift slowly west. It’s another feature that deserves watching.

Figure 1 Daily Composite Satellite SST Image ‐ May 21, 2017Black Line shows Rhumb Line Newport‐Bermuda
https://rucool.marine.rutgers.edu/

https://rucool.marine.rutgers.edu/
Figure 2 Daily Composite Satellite SST Image ‐ May 27, 2017Black Line shows Rhumb Line Newport‐Bermuda
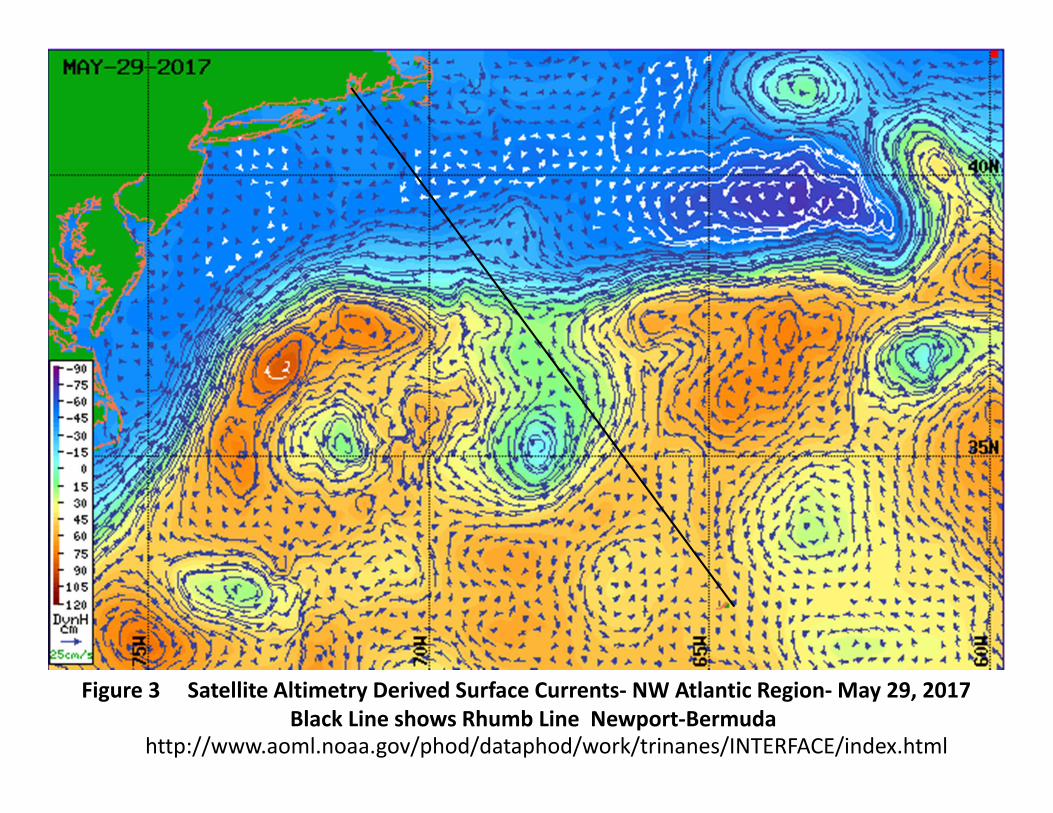
Figure 3 Satellite Altimetry Derived Surface Currents‐ NW Atlantic Region‐May 29, 2017Black Line shows Rhumb Line Newport‐Bermuda
http://www.aoml.noaa.gov/phod/dataphod/work/trinanes/INTERFACE/index.html

Figure 4 Instantaneous Satellite SST Image ‐ June 4, 2017Black Line shows Rhumb Line Newport‐Bermuda
https://rucool.marine.rutgers.edu/
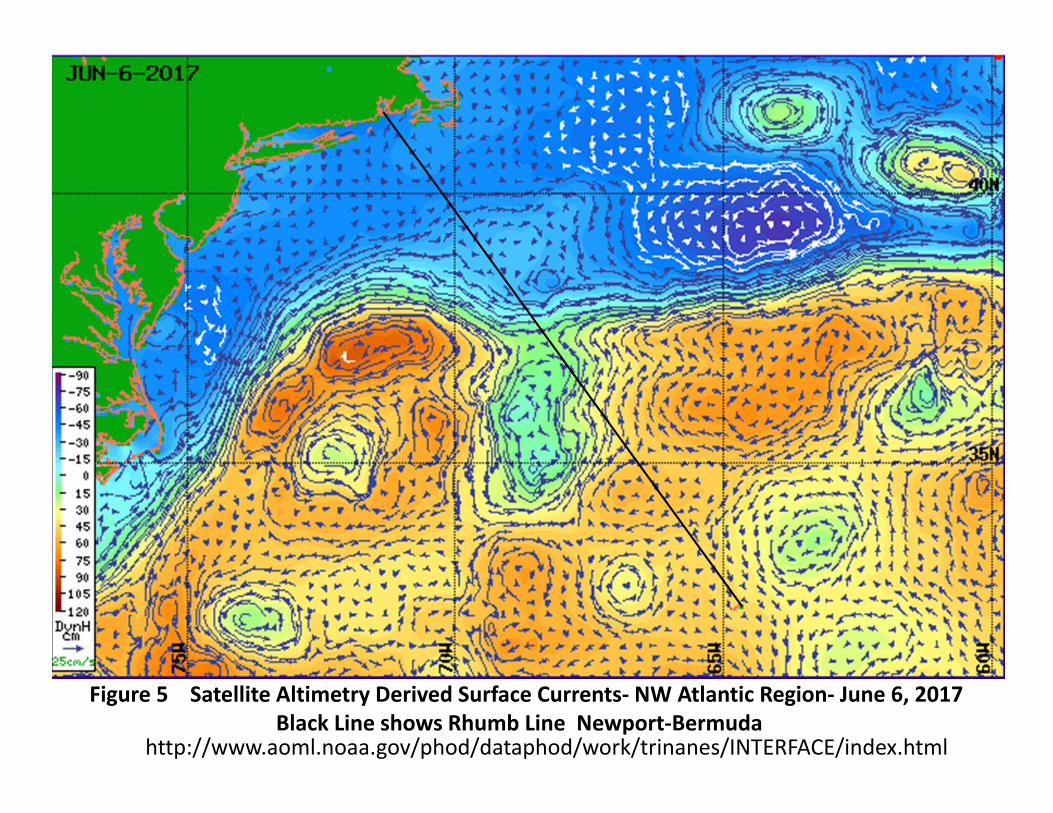
Figure 5 Satellite Altimetry Derived Surface Currents‐ NW Atlantic Region‐ June 6, 2017Black Line shows Rhumb Line Newport‐Bermuda
http://www.aoml.noaa.gov/phod/dataphod/work/trinanes/INTERFACE/index.html