Embed Size (px)
Citation preview
GUIDELINES FORMONITORING AND EVALUATING
BEACH EROSION ANDSHORELINE DYNAMICS
REPORT OF A TRAINING WORKSHOPTARAWA, KIRIBATI, 14-16 MARCH 2000
April 2000 SOPAC Training Report 84
Russell J. MaharajCommonwealth Secretariat/CFTC Expert
SOPAC Secretariat, Private Mail BagGPO, Suva,
FIJI
Funded by
The Commonwealth Secretariat (COMSEC)The Commonwealth Fund for Technical Co-operation (CFTC)
&The Government of the United Kingdom, under the UK Small Grants Scheme
Guidelines for Monitoring Beaches and Shorelines
SOPAC Training Report 84, April 2000: Russell J. Maharaj
2
TABLE OF CONTENTS
Page Number
ABSTRACT 5ACKNOWLEDGEMENTS 6
1.0 INTRODUCTION 71.1 General Comments 71.2 The Training Programme 8
2.0 BACKGROUND 11
3.0 SCOPE OF THE TRAINING 13
4.0 SOURCES OF INFORMATION 14
5.0 UTILISATION OF BEACHES AND THE COAST 155.1 Beach Sand and Gravel Mining 175.2 Coral Reef Mining 185.3 Shorefront Development 205.4 Inlets and Outlets/Outfalls 215.5 Cutting and Clearing of Mangroves 225.6 Mariculture 225.7 Construction of Coastal Protection Structures 235.8 Land Reclamation and Fill 28
6.0 WHAT TO DO IN CASE OF EROSION 306.1 Is the Coast Eroding? 306.2 Is It Acute or Chronic Erosion? 30
6.2.1 Chronic erosion 306.2.2 Acute erosion 31
6.3 When Did the Erosion Start? 316.4 How Much is the Coast Eroding? 326.5 What are the Causes of Erosion? 32
7.0 MANAGING BEACHES: DATA REQUIREMENTS 337.1 Why Collect Data? 337.2 Which Data to be Collected? 347.3 When and Where to Collect Data? 347.4 How to Store and Analyse Data? 357.5 How to Start a Data Collection Programme? 35
8.0 BEACH DATA COLLECTION 378.1 Programme Planning 378.2 Site Investigations 388.3 Beach Profiles and Coastal Hydrodynamic Boundary Conditions 388.4 Beach Response Near Structures 448.5 Beach Modification Near Structures 458.6 Beach Sediment Sampling 458.7 Beach Sediment Budget 50
Guidelines for Monitoring Beaches and Shorelines
SOPAC Training Report 84, April 2000: Russell J. Maharaj
3
Page Number
9.0 ENVIRONMENTAL DATA COLLECTION 51
10.0 NEARSHORE SEABED CHARACTERISTICS 5510.1 Introduction 5510.2 Bathymetry 5510.3 Seabed Sediments 5510.4 Sediment Transport 55
11.0 SEA STATE AND OCEANOGRAPHIC DATA COLLECTION 5811.1 Introduction 5811.2 Wave and Current Measurements 58
12.0 GEOTECHNICAL DATA COLLECTION 6312.1 Introduction 6312.2 Site investigation 63
12.2.1 Desk study 6312.2.2 Site Reconnaissance 64
12.3 Detailed Examination and Special Studies 6412.4 Interpretation 64
13.0 DATA STORAGE AND ANALYSIS 6513.1 Introduction 6513.2 Software 6513.3 Geographical Information Systems (GIS) 6513.4 Data input 6613.5 Data management and processing 6613.6 Data analysis 6613.7 Database operations 6713.8 Three-Dimensional Surface Modelling 6713.9 Applications 67
14.0 APPRAISAL OF MONITORING RESULTS 6814.1 Introduction 6814.2 Review of information obtained 6814.3 Deciding on further monitoring 68
15.0 LECTURES 6915.1 Appraisal and Management of Erosion Risks 6915.2 Coastal Adaptation Technologies 163
16.0 BIBLIOGRAPHY 187
APPENDIX 1: TASK PROFILE 190
Guidelines for Monitoring Beaches and Shorelines
SOPAC Training Report 84, April 2000: Russell J. Maharaj
4
FIGURES AND TABLE
Page Number
Figure 5.1. Breakwater construction in Bairiki, Kiribati. 16Figure 5.2. Seawall construction in Tarawa. Kiribati. 16Figure 5.3. Beach sand mining in Tarawa, Kiribati. 17Figure 5.4. Reef flat mining, Tarawa, Kiribati. 18Figure 5.5. Failure of shorefront buildings, Tarawa, Kiribati. 21Figure 5.6. Groyne designs showing erosion and accretion. 23Figure 5.7. Erosion and accretion. 24Figure 5.8. Preferential accretion updrift of structures. 25Figure 5.9. Interlocking coral seawalls in Tarawa, Kiribati. 26Figure 5.10. Scouring at the base of seawalls. 26Figure 5.11. Plan view of erosion and accretion. 27Figure 5.12. Reasons for failure of seawalls. 28Figure 5.13. Some concerns relating to coastal armouring. 29Figure 8.1. Beach terminology and morpho-dynamics. 39Figure 8.2. Example of a littoral data sheet. 39Figure 8.3. Example of a beach profile data sheet. 40Figure 8.4. Example of a processed beach profile. 40Figure 8.5. Surf zone dynamics. 42Figure 8.6. Hydraulic boundary conditions. 43Figure 8.7. Collapse of a shorefront building in Tarawa, Kiribati. 44Figure 8.8. Scouring alongside a gabion basket in Tarawa, Kiribati. 44Figure 8.9. Impact of beach control structures during construction. 47Figure 8.10. Impact of beach control structures. 48Figure 8.12. Application of beach control structures. 49Figure 9.1. Some physical environmental parameters. 52Figure 9.2. The environmental impact assessment (EIA) process. 53Figure 10.1. Sediment plumes generated by crosshore transport. 56Figure 10.2. Longshore transport, Tarawa, Kiribati. 57Figure 11.1. Hydraulics of beach sediments on an atoll. 59Figure 11.2. Hydraulics of the seawater-beach-land interface. 60
Table 8.1. Grain size parameters for sediments and soils. 46
Guidelines for Monitoring Beaches and Shorelines
SOPAC Training Report 84, April 2000: Russell J. Maharaj
5
ABSTRACT
The following is a transcript and a report of lectures/training delivered in Tarawa, Kiribati onGuidelines for Monitoring and Evaluating Beach Erosion and Shoreline Dynamics. Thetraining/lectures are part of in-country training and capacity building on Coastal Processes.
These lectures were delivered between 14-16 March 2000, at the Otintai Hotel, Tarawa, Kiribati.
The lecture discussed the need for understanding beaches, beach dynamics and neashore processeswithin the framework of coastal hazards and risks. Erosion and erosion processes were discussed,as wells as the hydrodynamics aspects of nearshore environments.
Engineering in the coastal zone was presented, within the framework of the coastal project cycle.Examples of coastal engineering projects were discussed, with reference to current port andharbour development in south Tarawa and the Nippon Causeway.
In addition, coastal protection structures were examined in the field and issues related to theappropriateness of these were highlighted. Construction material used along the shorefront werediscussed, in particular concrete and its performance in coastal environments.
Issues related to optimum coastal management and engineering were also discussed. A full list ofup-to-date and state-of-the-art references on the subject is also given and is included in thisreport.
The following text discusses erosion, coastal risks, engineering along shorefronts, sea-level rise andcoastal adaptation technologies and data-collection programmes and includes two (2) multi-media copies of the lectures delivered.
Guidelines for Monitoring Beaches and Shorelines
SOPAC Training Report 84, April 2000: Russell J. Maharaj
6
ACKNOWLEDGEMENTS
The participation and delivery of this training was facilitated by the Commonwealth Secretariat(COMSEC) and South Pacific Applied Geoscience Commission (SOPAC) Secretariat.
This project was funded and supported by the Commonwealth Secretariat (COMSEC) theCommonwealth Fund for Technical Co-operation (CFTC) and the Government of the UnitedKingdom, under the UK Small Grants Scheme
This project was executed under SOPAC Projects/Tasks KI 99.025 and RT 99.40.
Ms. Naomi Atauea, of the Ministry of Natural Resources Development, Tarawa, Government ofKiribati coordinated the training/lectures. Her assistance is gratefully acknowledged.
Guidelines for Monitoring Beaches and Shorelines
SOPAC Training Report 84, April 2000: Russell J. Maharaj
7
1.0 INTRODUCTION
1.1 General Comments
The following is a transcript and a report of in-country lectures/training delivered in Tarawa,Kiribati. The training was on Coastal Processes and formed part of SOPAC Task 99.025objectives to deliver simple technical training to community leaders and local Governmentpersonnel in Kiribati.
These lectures were delivered between 14-16 March 2000, at the Otintai Hotel, Tarawa, Kiribati.
The lecture discussed the need for understanding beaches, beach dynamics and nearshoreprocesses within the framework of coastal hazards and risks. Erosion and erosion processes werediscussed, as well as the hydrodynamics aspects of nearshore environments. Engineering in thecoastal zone was presented, within the framework of the coastal project cycle.
Examples of a coastal engineering project was discussed, with reference to current port andharbour development in Betio, the Nippon Causeway and construction of seawalls and coastalstructures in south Tarawa, Kiribati.
Issues related to optimum coastal management and engineering were also discussed. A full list ofup-to-date and state-of-the-art references on the subject was also given and is included in thisreport.
There were eighteen (18) participants at this course. Their names are as follows:
1. Utimawa Tinimarewe2. Moata Takirlia3. Tanaki Ruaia4. Tehoaniman Thmuera5. Takuia Namarou6. Taabua Teremia7. Kautu Temakei8. Daufung Binoka9. Teekoiti Tebwerewa10. Terabuntaake Tetaake11. Manikaoti Timeon12. Riaua Kaeka13. Taarite Teiaa14. Naomi Atauea15. Taebo Aravea16. Taebo Nakebae17. Maroiofi18. Naomi Atauea
Guidelines for Monitoring Beaches and Shorelines
SOPAC Training Report 84, April 2000: Russell J. Maharaj
8
1.2The Training Programme
Slide 1
Russell J. MaharajCommonwealth Secretariat/CFTC ExpertSOPAC SECRETARIATSuvaRepublic of FijiWORKSHOP
KI 99.025Contact SOPAC
www. sopac.org.fj
BEACHES WORKSHOPMONITORING & EVALUATION
14-16 March 2000Tarawa, Kiribati
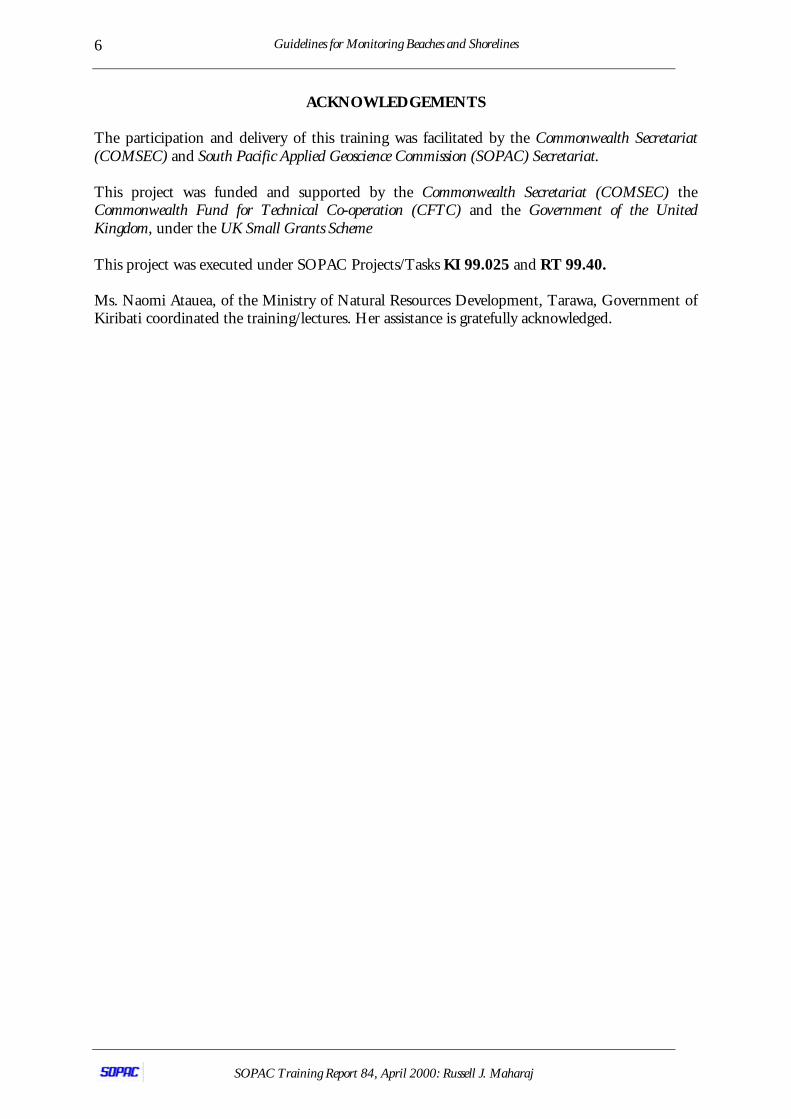
Slide 2
WORKSHOP DETAILSDay 1 - Tuesday
Morning:
• What is coastal engineering & management- scope?
• Why monitor the coast and beach - hazards and risks?
Afternoon:
• What is coastal erosion and what to do about it?
• Introduction to water levels, waves, tides & longshorecurrents- hydrodynamics &
• Coastal construction & shoreline protection.
Guidelines for Monitoring Beaches and Shorelines
SOPAC Training Report 84, April 2000: Russell J. Maharaj
9
Slide 3
WORKSHOP DETAILSDay 2 - Wednesday
Morning:
• Beach monitoring programs and data collection-detailed examination of program setup
Afternoon:
• Data collection and
• Data analysis
Slide 4
RESOURCE MATERIALHandouts to Be Distributed
• Draft beaches guidelines/manual;
• Examples of needs for monitoring beaches: sea-level rise and coastal risks and hazards (two (2) fullpapers);
• Beach profile data examples;
• Surf zone hydrodynamics chart;
• Grain size classification of sediments/soils Table;
Guidelines for Monitoring Beaches and Shorelines
SOPAC Training Report 84, April 2000: Russell J. Maharaj
10
Slide 5
RESOURCE MATERIALHandouts…
• Saffir/Simpson hurricane scale, coastal terminology,swash zone morphology, beach water table and waterflow, data collection program, hydraulic boundaryconditions, EIA’s and beach projects, impact of beachstructures, mitigation measures, groyne constructionmaterial, guidelines for application of beach controlworks, impact of seawalls, reasons for failure of verticalseawalls, concerns related to armoring, impact ofseawalls, groyne terminology, problems with groynesand beach structures, engineering options and theirproblems.
The following text discusses erosion, coastal risks, engineering along shorefronts, sea-level rise andcoastal adaptation technologies and data collection programmes and includes two (2) multi-media copies of the lectures delivered.
Guidelines for Monitoring Beaches and Shorelines
SOPAC Training Report 84, April 2000: Russell J. Maharaj
11
2.0 BACKGROUND
The Pacific Ocean is dotted with thousands of coral atoll islands, many of which are inhabitedalong coastal strips and foreshore areas and used for various socio-economic activities, rangingfrom nearshore fishing to aggregate extraction.
In the region which is serviced by the South Pacific Applied Geoscience Commission (SOPAC),there are some sixteen (16) small island developing states (SIDS), occupying a total land area ofabout 560,000 km2, in an ocean space of about 26 Million km2. These countries are the CookIslands, the Federated States of Micronesia, Republic of the Fiji Islands, French Polynesia, Guam,Kiribati, Republic of the Marshall Islands, Nauru, New Caledonia, Niue, Papua New Guinea,Samoa, Solomon Islands, Tonga, Tuvalu and Vanuatu.
Many of these SIDS consist of coral atoll islands and are geologically young, have low elevationsabove mean sea level and are generally flat. Elevation ranges from 1-5 metres above mean waterlevel and it is possible to see from one side of the island to the other. This makes these islandsentirely coastal, in terms of their influence by the sea, their geographical disposition and theirrelative relief.
As a result of their small land area, which can be between 0.0028 to 14.81% of their surroundingmaritime area, many Pacific SIDS are exposed to large-scale regional oceanographic and weatherphenomena. Frequent and annual events include cyclones and storms. These wreck havoc alongthe coastal and inland areas of many of these coral atoll islands, usually resulting in damage anddestruction of coastal property, agricultural land and coastal engineering facilities. These alsocause coastal flooding, coastal erosion/land loss and in some cases, loss of life. For many SIDS,the loss of lives can erode the skills base of the country and can prove to be a hindrance toeconomic development, causing persistent and undue poverty.
The scale of many natural hazards in PICs, are in many cases, several orders of magnitude largerthan the size of individual islands and consequently, are capable of engulfing entire island states.A typical example was cyclone Cora, which caused considerable damage to infrastructure andproperty on Tonga in December 1998.
On account of their small size and geographic location within a large ocean space, Pacific SIDSare continually affected by large ocean waves. These cause continuous erosion of coastlines, evenunder normal wave climate. In addition, the frequency of oceanographic hazards, modification ofcoastlines for human habitation and the mining of aggregate along the shore make many of theseislands and communities vulnerable to coastal erosion.
Oceanographic hazards and the possible threat of global warming and associated sea-level rise, inthese low, small island countries, can also exacerbate the erosion hazard. Consequently,population and communities along the coastal fringes of these island states are vulnerable and facea possible threat to their very existence. These natural events and human occupation of fragilecoastal areas can cause loss of scarce land, a culturally important and invaluable resource in manyon these non-market oriented developing economies.
In it’s 1997 flagship publication, A Future for Small States: Overcoming Vulnerability, theCommonwealth Secretariat, highlighted the fragility and susceptibility of many of these SIDS tonatural disasters, including coastal hazards like sea-level rise and their associated effects, inparticular, coastal erosion and coastal land loss. In turn, problems like coastal hazards, affecteconomic and social development in developing SIDS economies and make them economicvulnerable. This point was also highlighted and discussed in an Interim Report of a Joint World
Guidelines for Monitoring Beaches and Shorelines
SOPAC Training Report 84, April 2000: Russell J. Maharaj
12
Bank/Commonwealth Secretariat Task Force on Small States: Meeting the Challenge in the GobalEconomy, 1999 and at the Commonwealth Heads of Government Meeting (CHOGM) 1999,Durban, South Africa.
The fragility and vulnerability of the PICs to coastal and sea level rise hazards have also been thesubject of key thematic sessions at the recent Conference of Parties (COP-5) Meeting, Bonn,Germany, November 1999.
At the 10th Subsidiary Bodies on Scientific and Technological Advice (SBSTA), Bonn, Germany,June 1999, the United Nations Framework Convention on Climate Change (UNFCCC)Secretariat also highlighted that coastal adaptation measures to sea-level rise are key issues whichneeds to be addressed, especially in the context of Small Island Developing States (SIDS). Thissentiment was also echoed at the Alliance of Small Island States (AOSIS), July 1999 Meeting inMajuro, Republic of the Marshall Islands and the World Science Congress, Budapest, 1999 andby the UNFCCC Secretariat, Bonn, Germany.
To address current and future erosion problems and the possibly deleterious effects of sea-levelrise in Pacific SIDS, requires assessment of site specific, local and regional environmentalconditions. This also facilitates a rational approach to management of island resources.
It is also necessary to understand the factors, which influence erosion susceptibility on theseislands through time and space. This can be achieved only through a systematic and integratedapproach, with sound data collection, analysis and management exercises. Only then, canoptimum environmental and sustainable development strategies be formulated. This approachalso facilitates the development of appropriate coastal adaptation technologies for anticipated sea-level rise.
SOPAC, since it’s inception in 1972, has worked on coastal and marine projects in the South andCentral Pacific region. This includes work on coastal erosion and management, coastal naturalhazards, bathymetry and hydrography and physical oceanography. In fulfilment of its mandate, toprovide technical expertise and advice to Pacific Island Countries (PICs) on these and relatedissues, SOPAC has completed many projects in these technical areas, to address developmentinitiatives of PICs and fill data gaps This is exemplified in the range of projects which areincluded in its current fiscal year’s work programme. This includes projects on the assessment ofthe vulnerability to sea-level rise, assessment of shoreline change, assessment of coastal adaptationstrategies for anticipated sea-level rise and evaluation of aggregate potential.
For many SOPAC member countries, technical know-how is generally unavailable, whiletechnical guidelines and codes of professional practice are lacking. This lack of information canseriously impair effective management of coastal resources within PICs. In addition, lack of asound skill base handicaps poverty alleviation and social and economic reforms and development.
By providing timely and technically-sound advice, SOPAC is able to contribute to thedevelopment of the skills base within countries and the Pacific region, paving the way foroptimum management of island resources in Pacific SIDS, thereby contributing to the social andeconomic development of the region.
This project document, and the technical guidelines contained within, provides a sound base forthe transfer of coastal technology and technical skills to island residents. This project is based on acoastal training module for Kiribati.
Guidelines for Monitoring Beaches and Shorelines
SOPAC Training Report 84, April 2000: Russell J. Maharaj
13
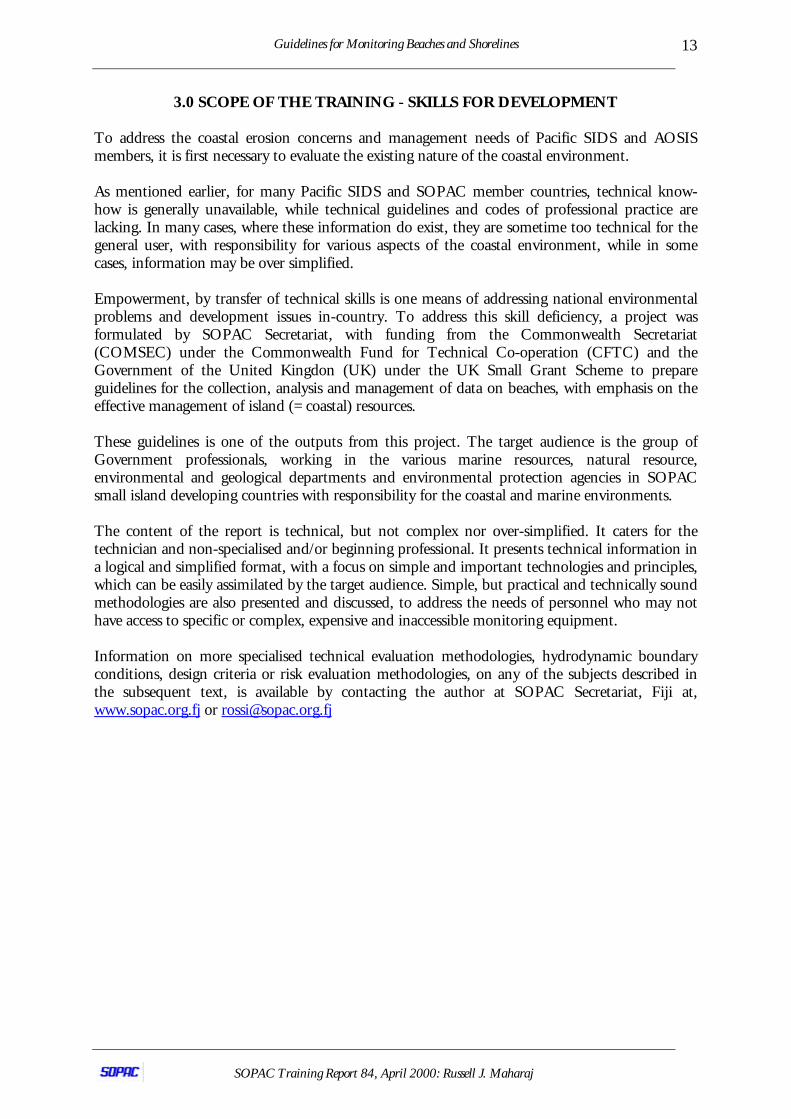
3.0 SCOPE OF THE TRAINING - SKILLS FOR DEVELOPMENT
To address the coastal erosion concerns and management needs of Pacific SIDS and AOSISmembers, it is first necessary to evaluate the existing nature of the coastal environment.
As mentioned earlier, for many Pacific SIDS and SOPAC member countries, technical know-how is generally unavailable, while technical guidelines and codes of professional practice arelacking. In many cases, where these information do exist, they are sometime too technical for thegeneral user, with responsibility for various aspects of the coastal environment, while in somecases, information may be over simplified.
Empowerment, by transfer of technical skills is one means of addressing national environmentalproblems and development issues in-country. To address this skill deficiency, a project wasformulated by SOPAC Secretariat, with funding from the Commonwealth Secretariat(COMSEC) under the Commonwealth Fund for Technical Co-operation (CFTC) and theGovernment of the United Kingdon (UK) under the UK Small Grant Scheme to prepareguidelines for the collection, analysis and management of data on beaches, with emphasis on theeffective management of island (= coastal) resources.
These guidelines is one of the outputs from this project. The target audience is the group ofGovernment professionals, working in the various marine resources, natural resource,environmental and geological departments and environmental protection agencies in SOPACsmall island developing countries with responsibility for the coastal and marine environments.
The content of the report is technical, but not complex nor over-simplified. It caters for thetechnician and non-specialised and/or beginning professional. It presents technical information ina logical and simplified format, with a focus on simple and important technologies and principles,which can be easily assimilated by the target audience. Simple, but practical and technically soundmethodologies are also presented and discussed, to address the needs of personnel who may nothave access to specific or complex, expensive and inaccessible monitoring equipment.
Information on more specialised technical evaluation methodologies, hydrodynamic boundaryconditions, design criteria or risk evaluation methodologies, on any of the subjects described inthe subsequent text, is available by contacting the author at SOPAC Secretariat, Fiji at,www.sopac.org.fj or [email protected]

Guidelines for Monitoring Beaches and Shorelines
SOPAC Training Report 84, April 2000: Russell J. Maharaj
14
4.0 SOURCES OF INFORMATION
The ideas and rationale for these guidelines are based on the author’s experience in the PIC’s andin other SIDS in other regions of the world. This also stems from numerous discussions betweenthe author and Governmental agencies throughout the SOPAC Member Countries.
Discussions were valuable with government departments in the Federated States of Micronesia(FSM), including the States of Yap, Pohnpei, Chuuk and Kosrae and island residents in morethan twenty-five atoll islands in the FSM territorial waters.
In addition, valuable discussions were held between SOPAC and other Governmentrepresentatives of Kiribati, Republic of Fiji Islands and the Cook Islands, on the need for thesetypes of technical guidelines.
The technical material presented is based on the author’s professional experience and consultationwith state-of-the-art professional material available in the published literature. These literature,are cited at the end of the text, and for the keen and enthusiastic reader, should provide ampleand valuable further reference on this and related subjects.
It is not the intention of the author to provide an exhaustive list of methodologies in theseguidelines, but to provide representative and appropriate examples, which are valuable and usefulwithin the framework of project development in Kiribati.
Guidelines for Monitoring Beaches and Shorelines
SOPAC Training Report 84, April 2000: Russell J. Maharaj
15
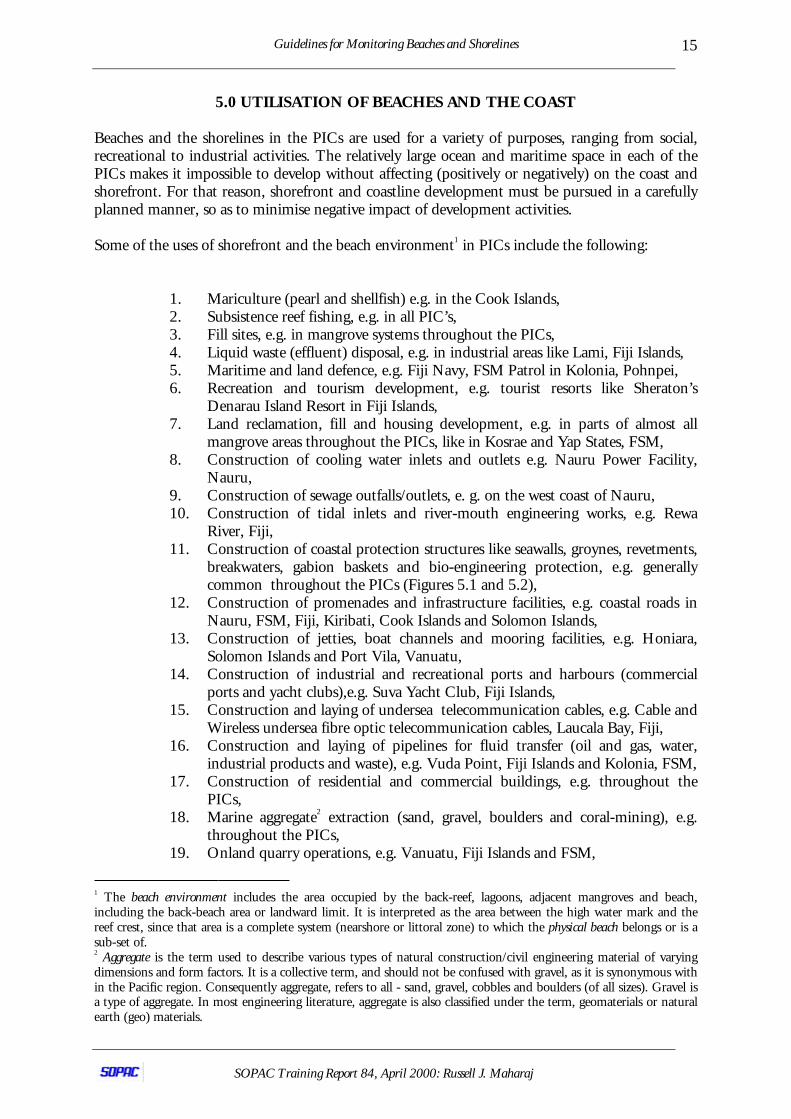
5.0 UTILISATION OF BEACHES AND THE COAST
Beaches and the shorelines in the PICs are used for a variety of purposes, ranging from social,recreational to industrial activities. The relatively large ocean and maritime space in each of thePICs makes it impossible to develop without affecting (positively or negatively) on the coast andshorefront. For that reason, shorefront and coastline development must be pursued in a carefullyplanned manner, so as to minimise negative impact of development activities.
Some of the uses of shorefront and the beach environment1 in PICs include the following:
1. Mariculture (pearl and shellfish) e.g. in the Cook Islands,2. Subsistence reef fishing, e.g. in all PIC’s,3. Fill sites, e.g. in mangrove systems throughout the PICs,4. Liquid waste (effluent) disposal, e.g. in industrial areas like Lami, Fiji Islands,5. Maritime and land defence, e.g. Fiji Navy, FSM Patrol in Kolonia, Pohnpei,6. Recreation and tourism development, e.g. tourist resorts like Sheraton’s
Denarau Island Resort in Fiji Islands,7. Land reclamation, fill and housing development, e.g. in parts of almost all
mangrove areas throughout the PICs, like in Kosrae and Yap States, FSM,8. Construction of cooling water inlets and outlets e.g. Nauru Power Facility,
Nauru,9. Construction of sewage outfalls/outlets, e. g. on the west coast of Nauru,10. Construction of tidal inlets and river-mouth engineering works, e.g. Rewa
River, Fiji,11. Construction of coastal protection structures like seawalls, groynes, revetments,
breakwaters, gabion baskets and bio-engineering protection, e.g. generallycommon throughout the PICs (Figures 5.1 and 5.2),
12. Construction of promenades and infrastructure facilities, e.g. coastal roads inNauru, FSM, Fiji, Kiribati, Cook Islands and Solomon Islands,
13. Construction of jetties, boat channels and mooring facilities, e.g. Honiara,Solomon Islands and Port Vila, Vanuatu,
14. Construction of industrial and recreational ports and harbours (commercialports and yacht clubs),e.g. Suva Yacht Club, Fiji Islands,
15. Construction and laying of undersea telecommunication cables, e.g. Cable andWireless undersea fibre optic telecommunication cables, Laucala Bay, Fiji,
16. Construction and laying of pipelines for fluid transfer (oil and gas, water,industrial products and waste), e.g. Vuda Point, Fiji Islands and Kolonia, FSM,
17. Construction of residential and commercial buildings, e.g. throughout thePICs,
18. Marine aggregate2 extraction (sand, gravel, boulders and coral-mining), e.g.throughout the PICs,
19. Onland quarry operations, e.g. Vanuatu, Fiji Islands and FSM,
1 The beach environment includes the area occupied by the back-reef, lagoons, adjacent mangroves and beach,including the back-beach area or landward limit. It is interpreted as the area between the high water mark and thereef crest, since that area is a complete system (nearshore or littoral zone) to which the physical beach belongs or is asub-set of.2 Aggregate is the term used to describe various types of natural construction/civil engineering material of varyingdimensions and form factors. It is a collective term, and should not be confused with gravel, as it is synonymous within the Pacific region. Consequently aggregate, refers to all - sand, gravel, cobbles and boulders (of all sizes). Gravel isa type of aggregate. In most engineering literature, aggregate is also classified under the term, geomaterials or naturalearth (geo) materials.
Guidelines for Monitoring Beaches and Shorelines
SOPAC Training Report 84, April 2000: Russell J. Maharaj
16
20. Metalliferous mining and hydrocarbon exploration and production, e.g. PapuaNew Guinea,
21. Agriculture and forestry, like timber and coconut production, e.g. in FijiIslands and the Solomon Islands,
22. Protection and natural resource conservation (marine parks and protectedareas), e.g. in New Caledonia and French Polynesia.
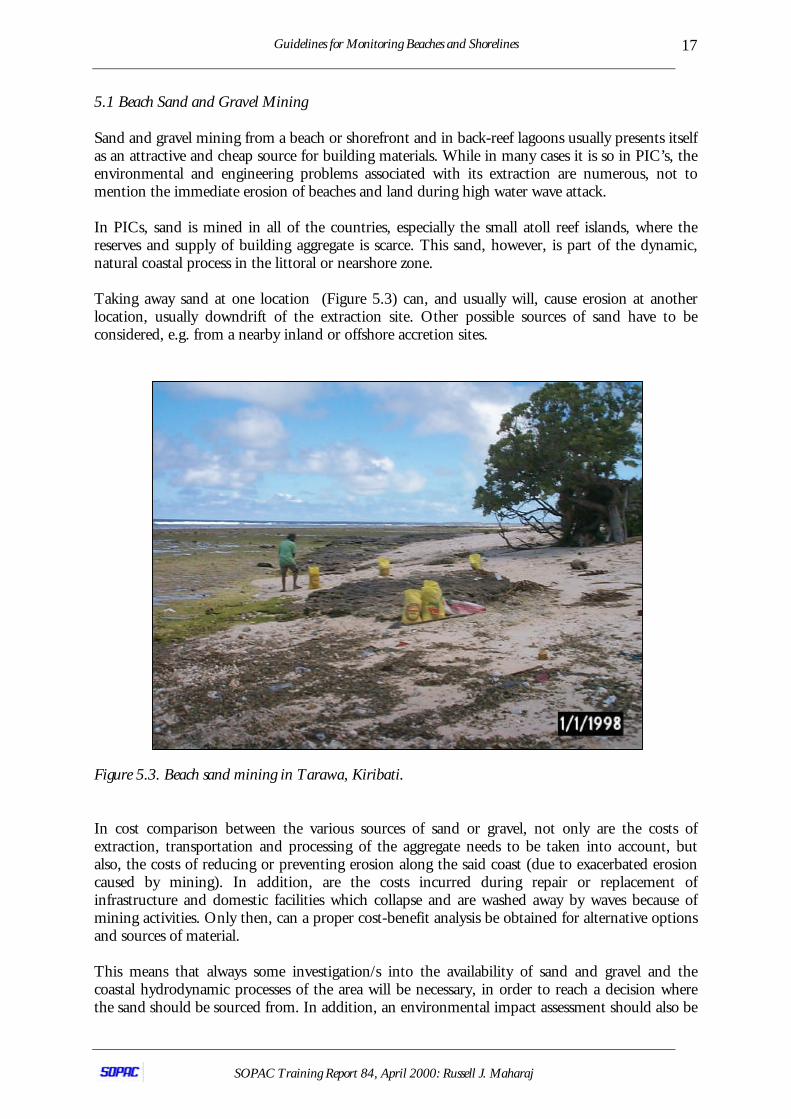
Some of these activities and uses of the coastline and shorefront will now be discussed in furtherdetail, especially as it relates to shoreline monitoring and beach management. Humanmodifications of the natural coastline will be highlighted, as issues related to optimummanagement of the system.
Figure 5.1. Breakwater construction in Bairiki, Kiribati.
Figure 5.2. Seawall construction in Tarawa, Kiribati.
Guidelines for Monitoring Beaches and Shorelines
SOPAC Training Report 84, April 2000: Russell J. Maharaj
17
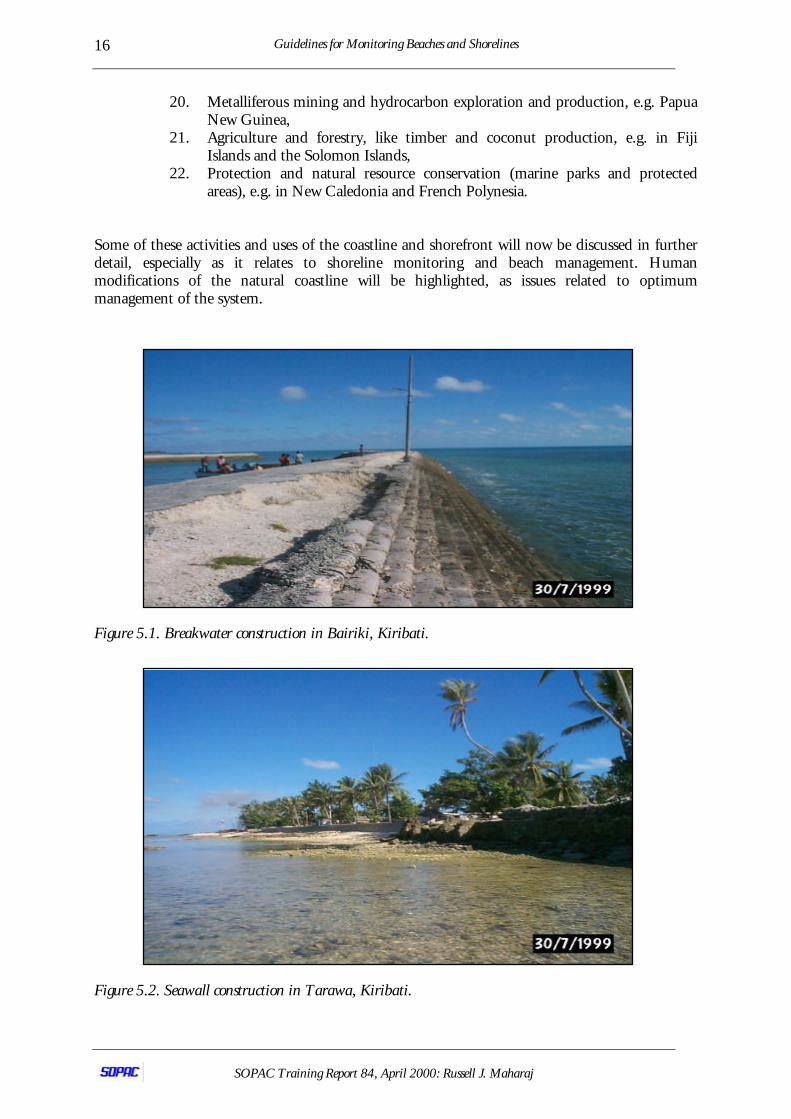
5.1 Beach Sand and Gravel Mining
Sand and gravel mining from a beach or shorefront and in back-reef lagoons usually presents itselfas an attractive and cheap source for building materials. While in many cases it is so in PIC’s, theenvironmental and engineering problems associated with its extraction are numerous, not tomention the immediate erosion of beaches and land during high water wave attack.
In PICs, sand is mined in all of the countries, especially the small atoll reef islands, where thereserves and supply of building aggregate is scarce. This sand, however, is part of the dynamic,natural coastal process in the littoral or nearshore zone.
Taking away sand at one location (Figure 5.3) can, and usually will, cause erosion at anotherlocation, usually downdrift of the extraction site. Other possible sources of sand have to beconsidered, e.g. from a nearby inland or offshore accretion sites.
Figure 5.3. Beach sand mining in Tarawa, Kiribati.
In cost comparison between the various sources of sand or gravel, not only are the costs ofextraction, transportation and processing of the aggregate needs to be taken into account, butalso, the costs of reducing or preventing erosion along the said coast (due to exacerbated erosioncaused by mining). In addition, are the costs incurred during repair or replacement ofinfrastructure and domestic facilities which collapse and are washed away by waves because ofmining activities. Only then, can a proper cost-benefit analysis be obtained for alternative optionsand sources of material.
This means that always some investigation/s into the availability of sand and gravel and thecoastal hydrodynamic processes of the area will be necessary, in order to reach a decision wherethe sand should be sourced from. In addition, an environmental impact assessment should also be
Guidelines for Monitoring Beaches and Shorelines
SOPAC Training Report 84, April 2000: Russell J. Maharaj
18
conducted to assess options before proceeding to mine the resource.
Basically sand mining should only be allowed at accreting coastlines where there are no downdriftcoastal erosion or littoral problems. Where mining is allowed, there should also be monitoringguidelines for the activity to assess and remedy any negative impacts.
5.2 Coral Reef Mining
Coral reef mining, has for many years, been the main source of construction aggregate for thebuilding industry in Pacific Island Countries (PICs). In coral reef and atoll environments, likethose in the Pacific, mining of reef carbonates and extraction from storm ridge deposits,carbonate sandbanks, coral heads, reef rubble and reef sands and gravel is a huge economicactivity.
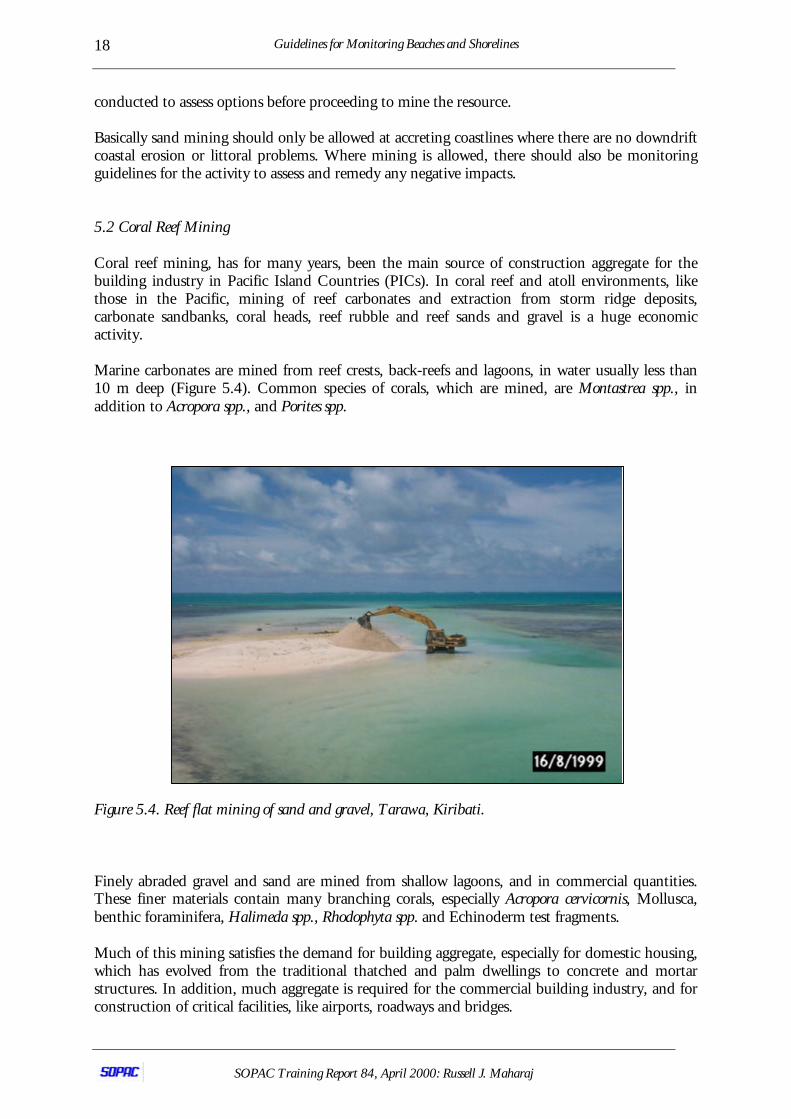
Marine carbonates are mined from reef crests, back-reefs and lagoons, in water usually less than10 m deep (Figure 5.4). Common species of corals, which are mined, are Montastrea spp., inaddition to Acropora spp., and Porites spp.
Figure 5.4. Reef flat mining of sand and gravel, Tarawa, Kiribati.
Finely abraded gravel and sand are mined from shallow lagoons, and in commercial quantities.These finer materials contain many branching corals, especially Acropora cervicornis, Mollusca,benthic foraminifera, Halimeda spp., Rhodophyta spp. and Echinoderm test fragments.
Much of this mining satisfies the demand for building aggregate, especially for domestic housing,which has evolved from the traditional thatched and palm dwellings to concrete and mortarstructures. In addition, much aggregate is required for the commercial building industry, and forconstruction of critical facilities, like airports, roadways and bridges.
Guidelines for Monitoring Beaches and Shorelines
SOPAC Training Report 84, April 2000: Russell J. Maharaj
19
With changing societal trends in the region, which show a departure from traditional (bures andcanoe houses) building techniques to more concrete and mortar structures, the demand for newhomes, constructed facilities and civil infrastructure increases the demand for building aggregate.Consequently, there is a corresponding increase in mining of coral reef communities to satisfythis demand.
Field investigations in Pohnpei, FSM, have revealed fifty-one (51) reef mining sites, of whichforty-seven (47) are dredge sites, with 13 recently active areas. These sites represent dredging andmining activities over the past two decades. Of the fifty-one (51) dredge sites, seven (7) are in theNan Madol area, an archaeological treasure designated a United States National HistoricLandmark and nominated to the World Heritage Convention of United Nations EducationalSocial and Cultural Organisation (UNESCO). Three (3) of these sites are actively dredged.
The mining of reef carbonates have caused many coastal environmental problems. Of these,coastal erosion and land loss are key impacts, due to the removal of natural coral barrierprotection, by mining. Dredging results in significant deepening of nearshore bathymetry,altering hydrodynamics and causing the propagation of larger waves along shorelines. These causesignificant scouring and coastal land loss, threatening coastal infrastructure and increasing erosionrisks to coastal communities.
Dragline and clamshell dredging and mining using front-end loaders, which is common in FSM,also causes death of benthic reef dwellers, including non-calcareous biota, cause smothering ofcoral and decrease fin and shellfish population. These reduce biological productivity and affectsubsistence fishing activities of the local population. The local fisheries authorities, in Pohnpei,have noted this decrease in recent years.
It is significant to note, that the use of modern and Holocene marine carbonates in construction,is also not without construction and engineering risks. These aggregates contain harmful chlorideand sulphate ions (common and in high concentrations in seawater). These ions can causechemical reactions with cement and steel (in steel-reinforced concrete), especially where concreteis mixed using normal/ordinary Portland cement (ASTM Type-I designation). Chloride ions alsodecrease the passivity of steel in concrete and increases the susceptibility of steel rebars(reinforcing bars) to corrosion in steel-reinforced concrete. This type of corrosion of rebars causeswelling of the outer corroded films of the rebar, by as much as 400 %. Such swelling results inhigh tensile stresses in casted concrete, which because of its low tensile strength cracks. Tensioncracks produced by this process cause further ingress of moisture and cause further oxidation ofrebars and more cracking. In addition, sulphate ions also react with calcium rich cement andleads to precipitation of expansive sulphate called ettringite. This also leads to swelling within theconcrete and tensile stresses, also causing cracking.
Chemical reactions, like those described above, in this high pH and moisture-rich environmentcan result in deterioration of cement-aggregate and steel-aggregate-cement binding reactions inconcrete. This can ultimately lead to collapse of the concrete structures. Steel-reinforced concretecasted with these aggregates, usually show ferrous oxide and hydroxide staining, due to rapidoxidation of the steel, on cracking of the concrete, and due to chemical attack by chloride ionsusually present in the aggregate.
In addition, modern reef carbonates are usually of high porosity, with high void ratio, of low dryand wet density, with low specific gravity (less than 2.60) are of low compressive and impactstrength and performs poorly under static or dynamic loads. Consequently, these geomaterial areof generally low quality for the construction industry. Where modern day marine carbonatesmust be used, due to the unavailability of alternative sources of geomaterial or engineered

Guidelines for Monitoring Beaches and Shorelines
SOPAC Training Report 84, April 2000: Russell J. Maharaj
20
composites, amendments to and modifications of design criteria will have to be prescribed andmade. This will facilitate the optimum performance of constructed facilities built with theseaggregates and therefore, reduce the risk and likelihood of their failure through engineering time.
However, the range of environmental, engineering and cultural problems associated with reefmining can be addressed in some PICs, by seeking alternatives to coastal reef mining and bymanaging extraction in less sensitive habitats. Recent studies have shown that onshore quarryingof on-land volcanics can supply large volumes of superior quality aggregate for the constructionindustry in Pohnpei and FSM and therefore, this can be one viable alternative to mining reefcarbonates.
Coral mining can also be attractive for cement raw material, e.g. Fiji Industries, Fiji Islands. Thecoral reefs however, form a natural beach protection and are analogous to coastal engineeringequivalent of the submerged breakwater. As with a submerged breakwater, these reefs dissipatewave energy when offshore deepwater waves break on the reef crest, causing smaller waves to bepropagate into the littoral zone. Once removed, this wave energy dissipater is “turned off” anderosion in the littoral zone starts or is exacerbated, which is usually manifested as beach erosion.
Tourist beaches behind coral reefs, can become narrower or vanish completely. Stability of hotels,residence and infrastructure near the coastline can also be endangered.
5.3 Shorefront Development
In PICs, building on the edge of the water or land is common. Since historical times, the seas andoceans have been of considerable value, as a source of food and livelihood for Pacific islanders.However, with steady population increase over the years, and with the corresponding demand forhousing and infrastructure, there is further development along shorelines. Much of thisdevelopment is again, at the water’s edge.
With social and economic development, many industries have developed. Tourism is one of theseand is quite a big industry in the Pacific. With most of the land being owned by native islandcommunities and the extended families, much private sector development is targeted at theshorefront, where reclamation, fill and development are feasible options to pursue for “landacquisition.” While these developments brings economic boom and social amenity to islandnations, there are many deleterious impacts of building along the shorefront in small island states.
If you intend to build near the coastline, you should be aware that the position of the coastline isnot fixed and is constantly changing. This is due to the dynamic nature of the coast, which isdirectly influenced by constantly changing hydrodynamic and morphological processes within thelittoral zone. As processes occur, so they alter shoreline morphology and subsequent erosion andaccretion patterns along the coast. While attempts are made to predict this change, it is significantto note, that every simulation is for a fixed set of parameters for a given time and three- or two-dimensional space, while those parameters in the natural open (system) environment are not.
Shorefront developers therefore, should also be reasonably sure that during the lifetime of theirdevelopment (e.g. 10, 25, 50 or 75 years), no erosion problems will threaten the viability of thestructure or facility. For that to be the case in development, structures should be set-back fromthe water edge, to a distance at least equal to the expected retreat of the coastline during thelifetime of the facility. If not, extra maintenance costs will have to be budgeted for protection ofthe facility against erosion (Figure 5.5).
Guidelines for Monitoring Beaches and Shorelines
SOPAC Training Report 84, April 2000: Russell J. Maharaj
21
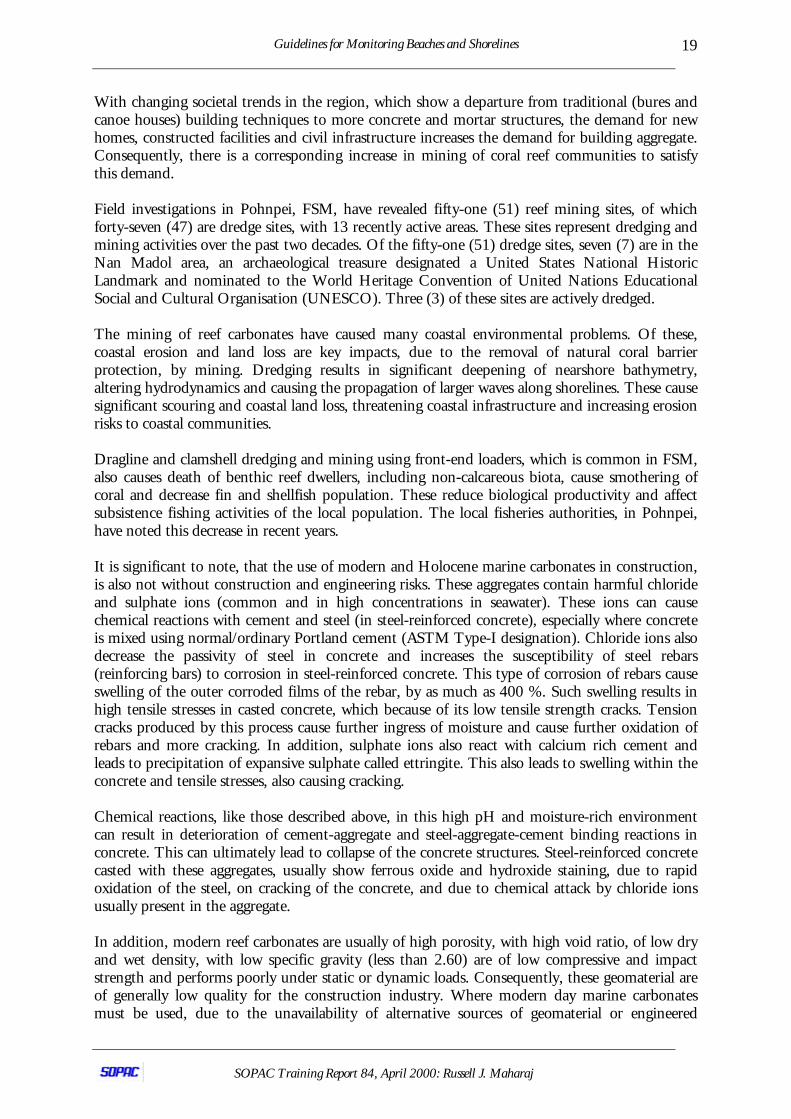
In many engineering projects, this maintenance aspect is not usually considered, while anticipatederosion at the constructed facility is not catered for. Post-construction maintenance of theconstructed facility is usually down played, even in a high-risk environment like the ocean.Usually, such follow-up is only entertained when damage or loss of the service of the facilityoccurs.
Figure 5.5. Failure of shorefront buildings due to wave action, Tarawa, Kiribati.
5.4 Inlets and Outlets/Outfalls
When making a seawater inlet, you should be aware that a coast is always a dynamicphenomenon. The inlet should be constructed at a location where there is no excessive erosion orsedimentation. Erosion can endanger the stability of the inlet, while sedimentation can block thewater inlet.
The same is true for an outlet, but an extra complication is water quality. When the outlet is asewer for municipal or industrial effluent, the sea can be polluted. This can be detrimental tofishery interests or to the bio-diversity in the region, but it can also contribute to coastal erosionin the long term. This is the case where coral reefs form a natural protection. These reefs can diebecause of pollution and lose their protective ability.

Guidelines for Monitoring Beaches and Shorelines
SOPAC Training Report 84, April 2000: Russell J. Maharaj
22
5.5 Cutting and Clearing of Mangroves
Mangrove forests or mangals3 in PICs are cut or wood for timber or fuel and to make fish trapsand even buildings. In some countries, like the FSM, mangroves are cut to provide space foraquaculture, like fish farming
But in all cases where a mangrove forest is removed, one should be aware of the consequences.First, mangroves can act as coastal defence and provide a buffer zone for the land against theharsh seas and waves. During storms and cyclones, these forests act as windbreaks and barriersand dissipate wave and tidal energy approaching shore.
Mangrove forests also act as filter for the sediment and biological waste products, beingdischarged by rivers to the coast. Cutting away a forest will then lead to more sedimentation atother locations, possibly having a negative influence on fishing grounds or corals.
Mangrove species include those of the Rhizophoraceae family. Mangrove systems in Fiji are usedas important fisheries, reclamation and construction sites, a sources of firewood, housing material,timber, conversion to agricultural sites and as sites for urban development. In addition, theyprovide natural coastal protection against storms, and trap sediments from fluvial and littoralsystems.
Estimates of mangrove systems for Fiji based on 1:50,000 aerial surveys, by the LandsDepartment was 45,288 ha (Watling, 1985). Studies by Watling (1985), using 1: 20,000 aerialphotographs showed that the total mangrove area was 11% less than that estimated by the LandsDepartment or 40,306 ha.
The total mangrove area for Viti Levu was estimated at 23,463 ha, about 58% of the total areafor the Fiji Islands (Watling, 1985). The larger systems are located in Ba, Rewa and Labasa Deltaareas, with 3,714 ha, 5,130 ha and 1,473 ha respectively. These three systems represent about40% of the mangrove area for Viti Levu.
In addition, much mangrove have been reclaimed for sugar cultivation (1,292 ha in Labasa) andconstruction activities, e. g. 750 ha in western Viti Levu (Watling, 1985). Watling (1985) alsonote that Lands Department indicated that at September 1987, 2,457 ha were reclaimed or 6%of the original area. Watling also indicated that at 1985, the remaining mangrove area for Fiji wasapproximately 38, 543 ha.
In terms of economic evaluation of mangal systems, Watling (1985), based on data from the FijiIslands Fisheries Department, note that mangrove associated fisheries provided subsistence in theorder of 8.76 Million kg of fish. This was 60% of the total subsistence fisheries for Fiji with amarket price of FJ $17.52 Million in 1983. For 1983, the total mangrove fisheries in Fiji wasestimated to have a total economic return of FJ $ 21.8 million, with mangrove contributing FJ$566/ha.
5.6 Mariculture
Ponds for seafish or shrimp are located in coastal areas, often in areas with mangrove forests. The
3 Mangals is use to denote mangrove trees and other swamp or brackish water plant and animal species that may beassociated with the mangrove wetlands. Mangals is a collective term, while mangroves is a type of plant group foundin the mangal environment.
Guidelines for Monitoring Beaches and Shorelines
SOPAC Training Report 84, April 2000: Russell J. Maharaj
23
combination of mangroves and shrimps is quite natural, shrimps feed on the waste products ofthe trees. A very high intensity of shrimps, however, causes disruption of the ecologicalequilibrium. Pollution of the water and diseases of the shrimp are the result. Also the cuttingaway of the mangroves to make room for shrimp ponds, can cause several negative effects andmay lead to additional work.
5.7 Construction of Coastal Protection Structures – Seawalls and Groynes
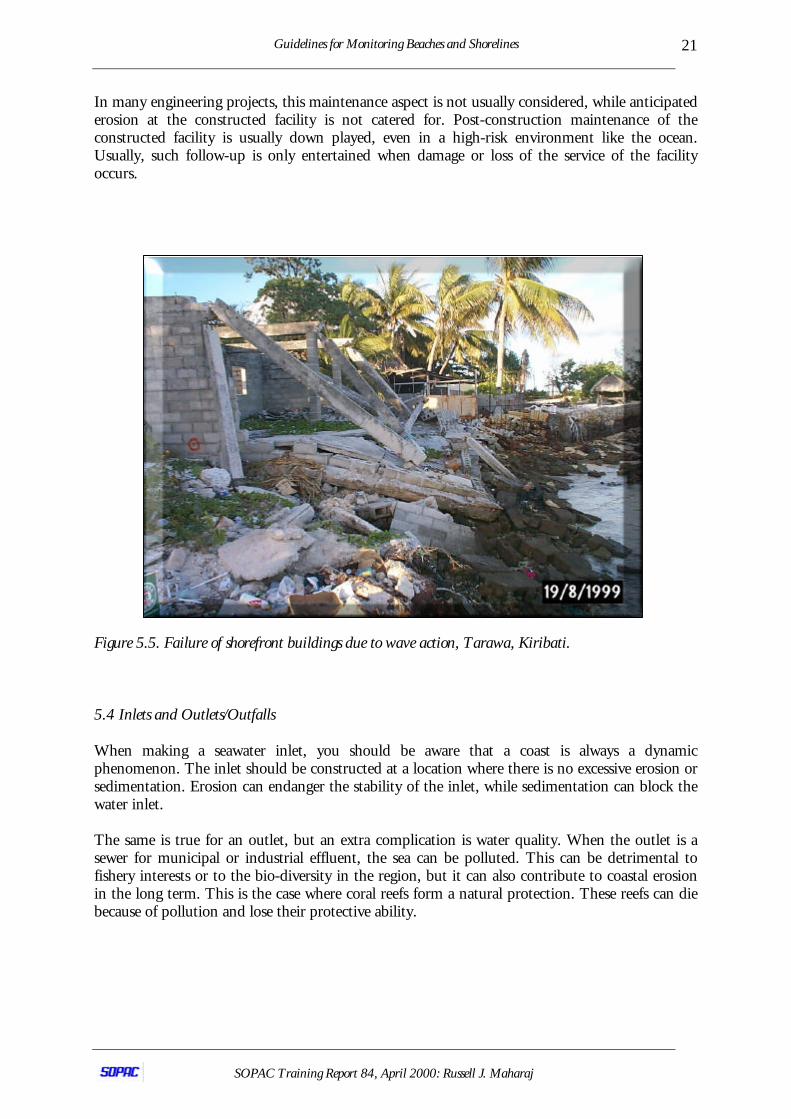
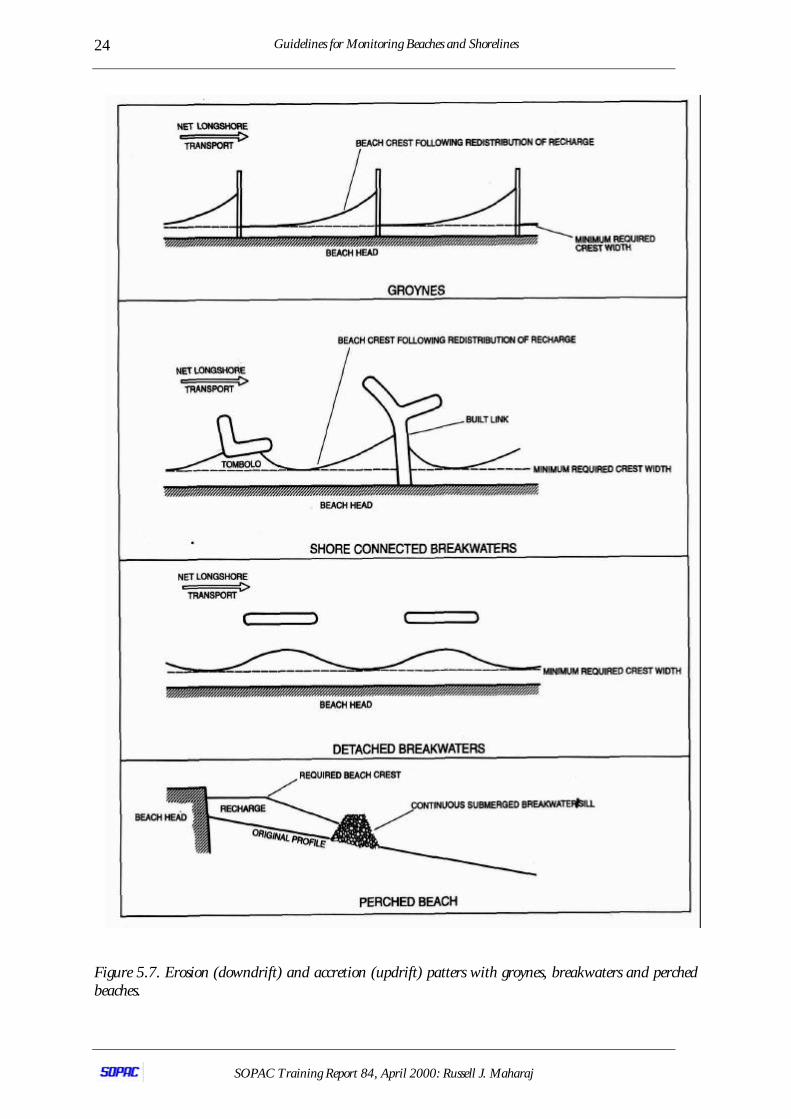
A groyne or breakwater perpendicular to the coast can be constructed to create quiet water(protection against waves) or to make a berthing or mooring for shipping or a runway for aircrafts(Figure 5.6). This can have an effect on the coastline, especially on a sandy coast.
There is a continuous transport along the coast of sand and the structure means interruption ofthis transport.
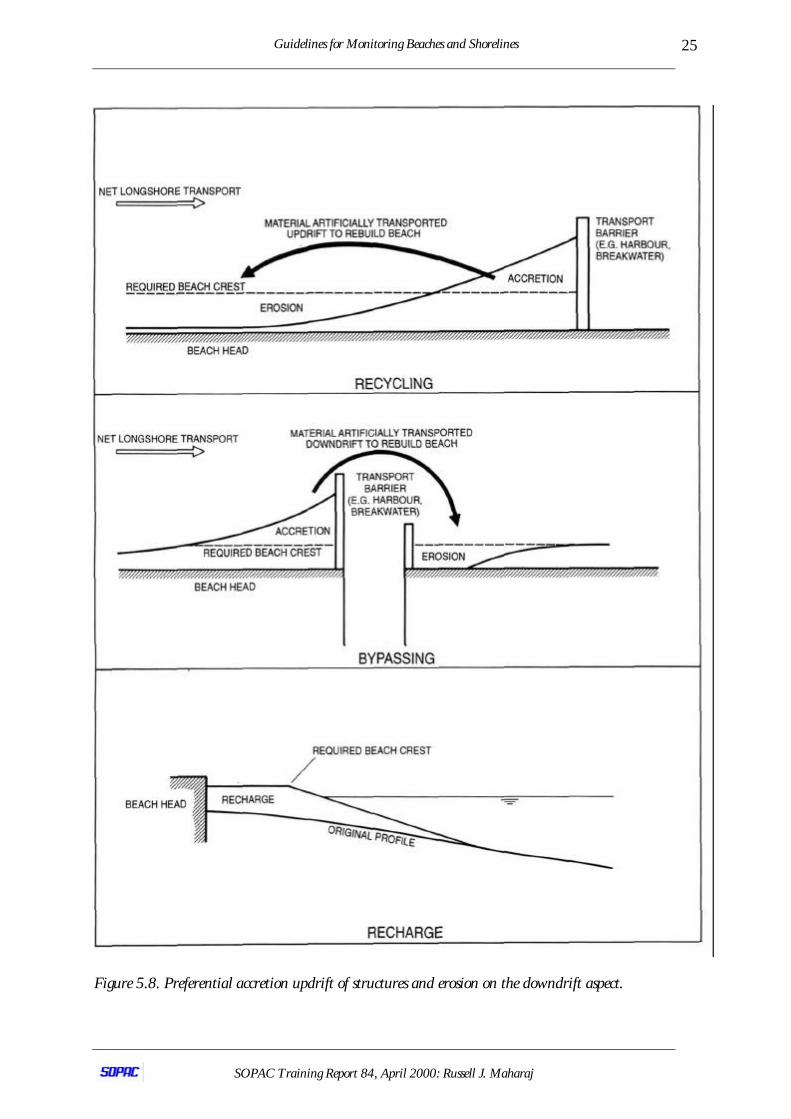
This will lead to accretion of the coast at one side and erosion at the other side (Figures 5.6 - 5.8).This means that always some investigation into the local sediment transport should be donebefore such a structure is constructed.
Figure 5.6. Groyne designs showing erosion on the downdrift side and accretion on the updrift side.
Guidelines for Monitoring Beaches and Shorelines
SOPAC Training Report 84, April 2000: Russell J. Maharaj
24
Figure 5.7. Erosion (downdrift) and accretion (updrift) patters with groynes, breakwaters and perchedbeaches.
Guidelines for Monitoring Beaches and Shorelines
SOPAC Training Report 84, April 2000: Russell J. Maharaj
25
Figure 5.8. Preferential accretion updrift of structures and erosion on the downdrift aspect.
Guidelines for Monitoring Beaches and Shorelines
SOPAC Training Report 84, April 2000: Russell J. Maharaj
26
Very often shorefront development is done along the beach. From a coastal stability point of viewthis can be risky, because such developments fixes the position of the coastline. Because coastlinesusually will fluctuate somewhat in time, the position of the development should be landward ofthe most expected position of the waterline.
Shorefront development like houses or hotels have the negative effect that they reflect waves. Thismay cause a somewhat higher wave in front of the structure, and due to that some erosion nearthe toe of the wall. Due to this erosion, the beach in front of the wall may get a deeper position(and consequently the beach will become narrower, or even disappear). In any case, a vertical wallwill never stop chronic erosion. Sometimes, a wall is good in case of problems with acute erosion.
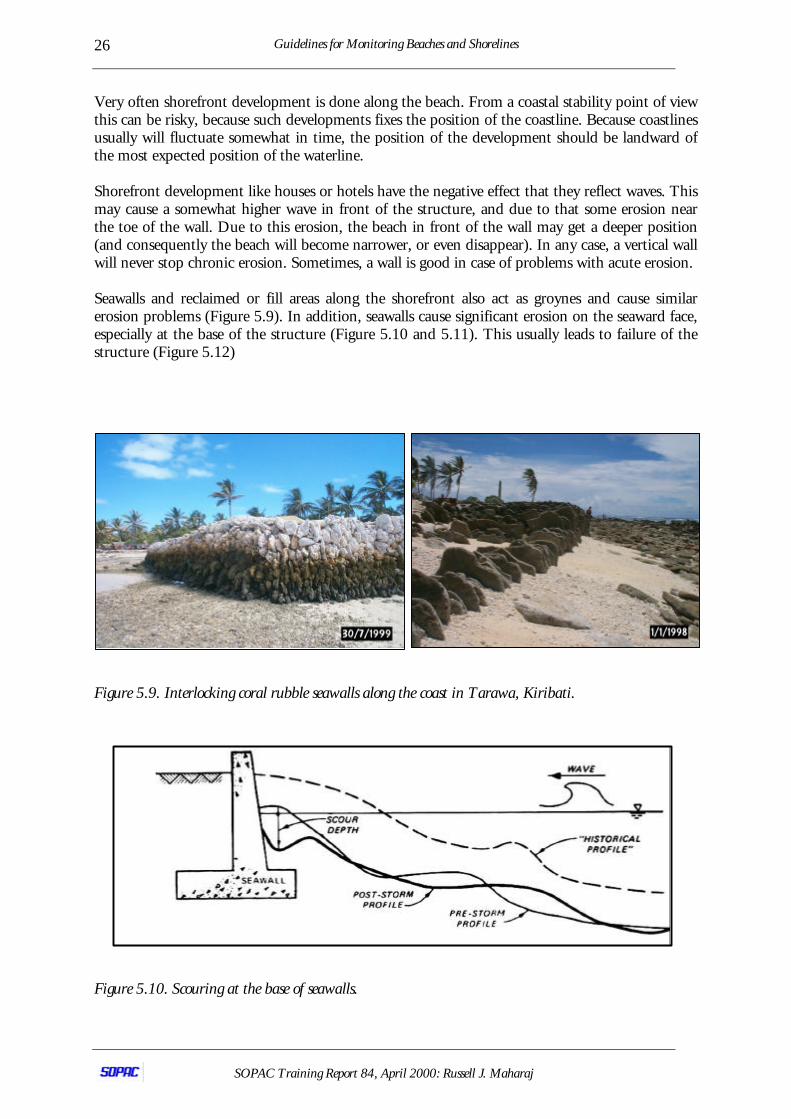
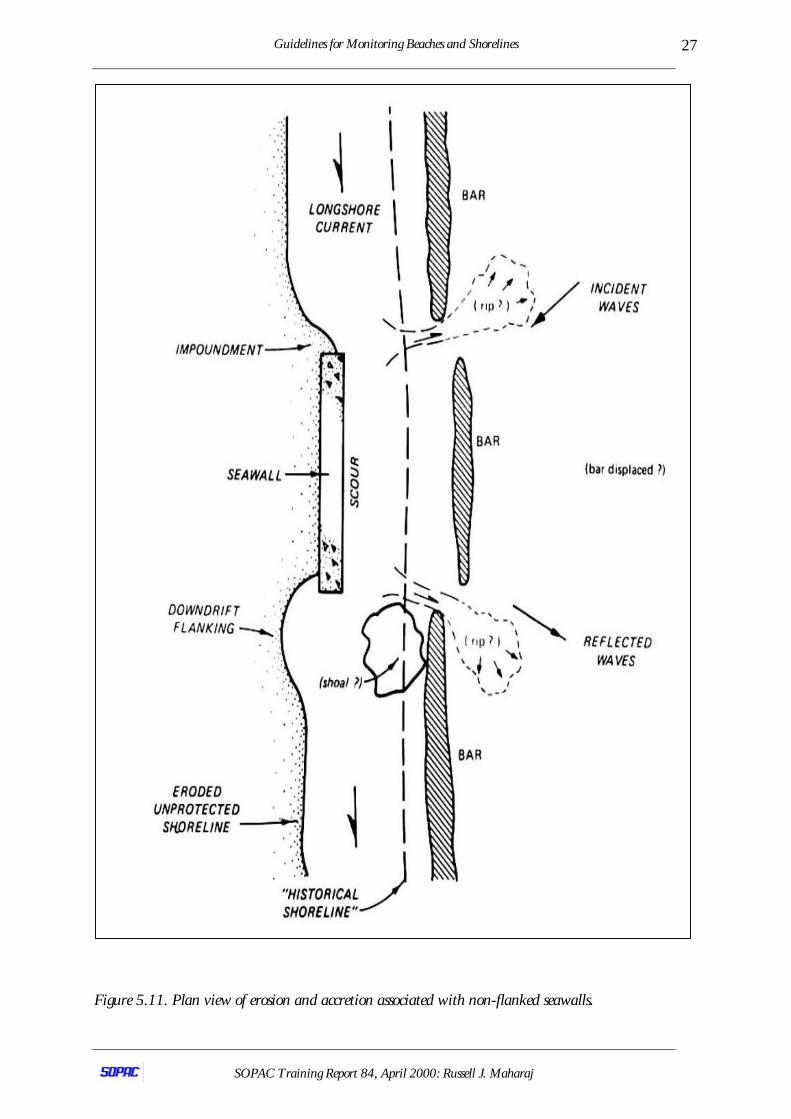
Seawalls and reclaimed or fill areas along the shorefront also act as groynes and cause similarerosion problems (Figure 5.9). In addition, seawalls cause significant erosion on the seaward face,especially at the base of the structure (Figure 5.10 and 5.11). This usually leads to failure of thestructure (Figure 5.12)
Figure 5.9. Interlocking coral rubble seawalls along the coast in Tarawa, Kiribati.
Figure 5.10. Scouring at the base of seawalls.
Guidelines for Monitoring Beaches and Shorelines
SOPAC Training Report 84, April 2000: Russell J. Maharaj
27
Figure 5.11. Plan view of erosion and accretion associated with non-flanked seawalls.
Guidelines for Monitoring Beaches and Shorelines
SOPAC Training Report 84, April 2000: Russell J. Maharaj
28
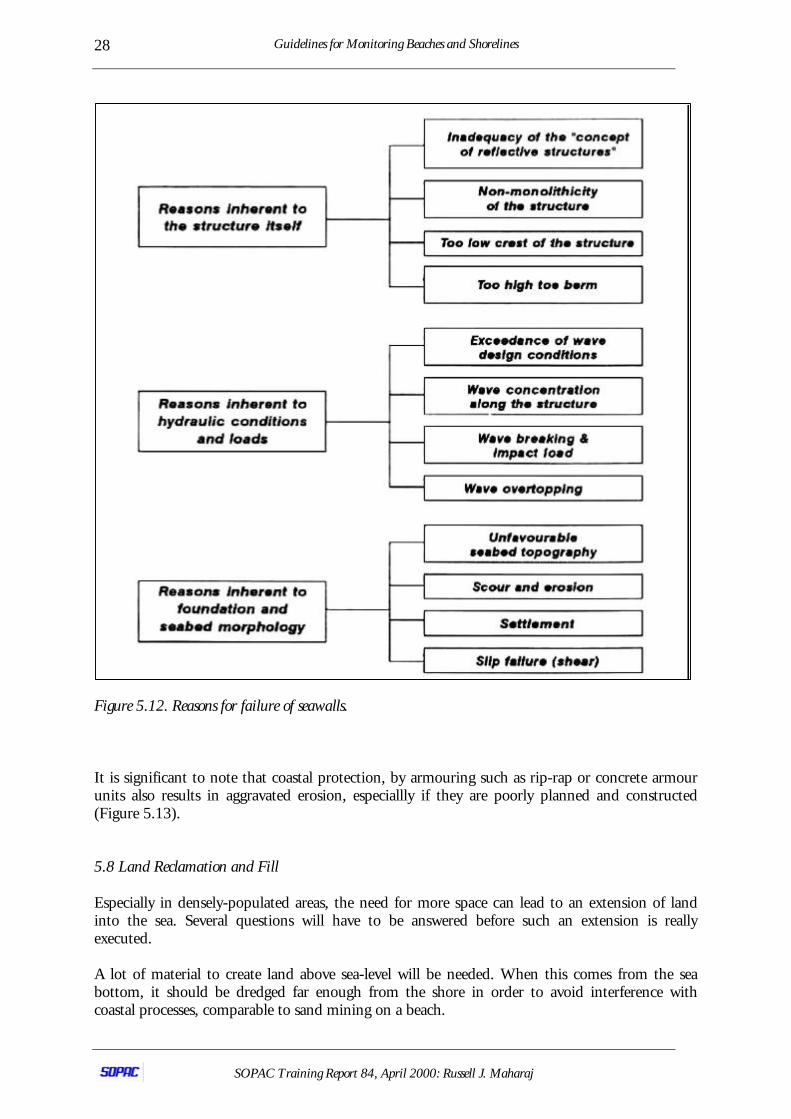
Figure 5.12. Reasons for failure of seawalls.
It is significant to note that coastal protection, by armouring such as rip-rap or concrete armourunits also results in aggravated erosion, especiallly if they are poorly planned and constructed(Figure 5.13).
5.8 Land Reclamation and Fill
Especially in densely-populated areas, the need for more space can lead to an extension of landinto the sea. Several questions will have to be answered before such an extension is reallyexecuted.
A lot of material to create land above sea-level will be needed. When this comes from the seabottom, it should be dredged far enough from the shore in order to avoid interference withcoastal processes, comparable to sand mining on a beach.
Guidelines for Monitoring Beaches and Shorelines
SOPAC Training Report 84, April 2000: Russell J. Maharaj
29
Another question is the height above sea level in order to avoid flooding or damage by waves.The design should take into account extreme water levels and waves.
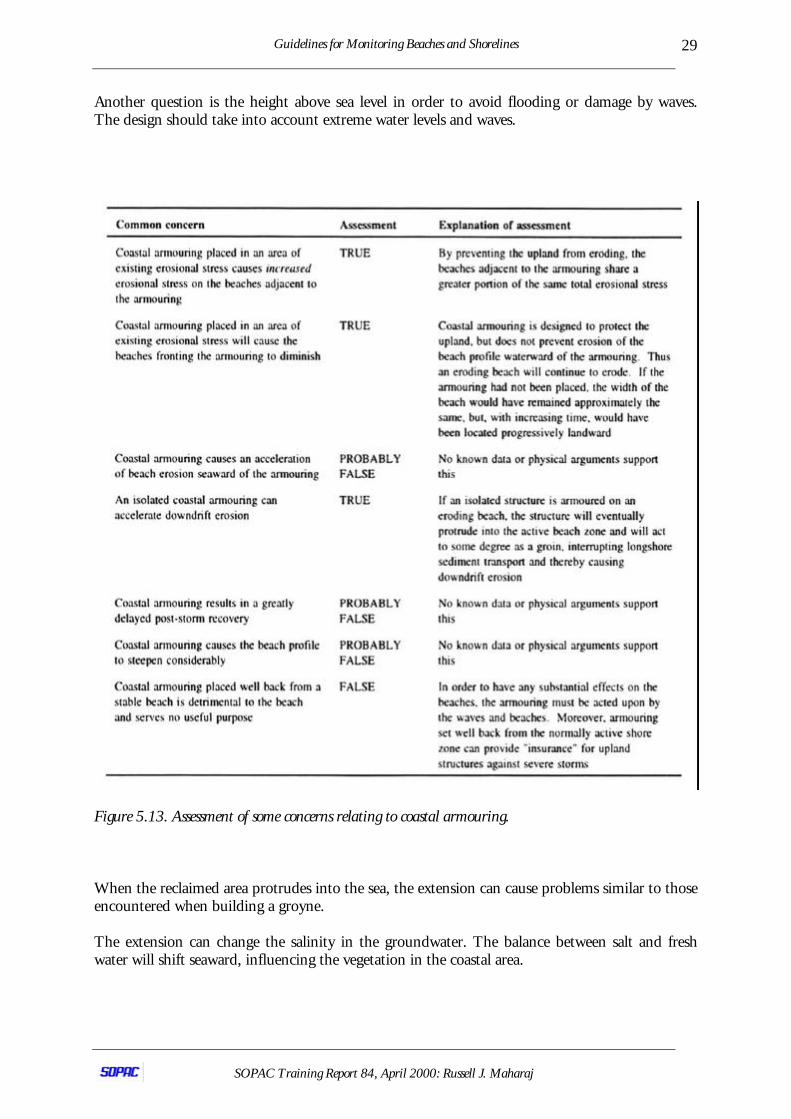
Figure 5.13. Assessment of some concerns relating to coastal armouring.
When the reclaimed area protrudes into the sea, the extension can cause problems similar to thoseencountered when building a groyne.
The extension can change the salinity in the groundwater. The balance between salt and freshwater will shift seaward, influencing the vegetation in the coastal area.
Guidelines for Monitoring Beaches and Shorelines
SOPAC Training Report 84, April 2000: Russell J. Maharaj
30
6.0 WHAT TO DO IN CASE OF EROSION
6.1 Is the Coast Eroding?
In a number of cases, the coastline is not eroding at all. Because of some activities (for exampleafter the construction of houses too near to the beach) the owner has a problem such as there isnot enough beach any more in front of his property. In this case the problem is not stop erosion,but to create a new, artificial beach.
Also it may be that the position of the coastline is only fluctuating, because of variations in theweather. The problem may be solved by simply wait-and-see. Coastlines always fluctuate.Therefore one should also give the coast the room to fluctuate. This means that fixed structuresnever should be constructed too near to the waterline. That is asking for trouble.
6.2 Is It Acute or Chronic Erosion?
Acute erosion is the consequence of a single event, for example the erosion caused by a storm, atsunami or by massive sand-mining operations (during a relatively short period). Chronic erosionis a type of erosion, which continues every year, the quantity per year is not so much, but theprocess always continues. Chronic erosion is not spectacular, and you seldom read something inthe newspapers, while the press always covers acute erosion.
6.2.1 Chronic erosion
Chronic erosion is usually caused by a gradient in longshore transport and takes place in thebreaker zone.
Chronic erosion as such cannot be stopped. In principle there are only three solutions for solvingchronic erosion problems:
Stop the erosion effect by feeding the beach. This can be done by means of artificial beachnourishment. It is only useful when sand is available in the neighbourhood for a reasonable price.
Move the problems to a downstream location. Sometimes this is a very attractive solution. Ifdownstream of the endangered site is a location where coastal erosion does not cause muchtrouble, it can be wise to move the erosion area to that spot. In the case that downstream of thetroubled area is a rocky coastal section it can also be attractive. Several technical solutions mightbe relevant:
Ø Construction of groynesØ Construction of offshore breakwatersØ Construction of artificial headlands
It is sometimes useful to feed the beach at the upstream side, if the longshore transport is blockedby a construction (for example a harbour entrance) by the construction of a bypass plant.
Guidelines for Monitoring Beaches and Shorelines
SOPAC Training Report 84, April 2000: Russell J. Maharaj
31
6.2.2 Acute erosion
Acute erosion is caused by a sudden event. Usually it is one sudden storm or the effect of aTsunami. In case there is only acute erosion, there is nothing to worry about for the long term. Inthat case, one has to make "only" a protection that, in case such an event happens, one should nothave too much erosion endangering the structures on the coast. Such a protection can be:
Ø A heavy revetment
This can be constructed as:
Ø Riprap,Ø Vertical wall orØ Sloping dike
Because natural coastlines always fluctuate, one has to allow sufficient space between the waterlineand the structures (apply a set-back line).
In some situations it may be attractive to construct the protection as a "hidden structure". Thismeans that normally you cannot see the structure, is completely covered by the sand of the beachand the first dune. Only in case of an extreme event, with much acute erosion, the structure willbecome visible and will prevent further erosion during that event. After the storm, one has tocover the structure again with sand, e.g. from extra sand extracted from alternative sites.
In case of acute erosion, it is absolutely necessary to verify that there is only acute erosion. Oftenthere is a combination of acute and chronic erosion. This means that underwater there is achronic erosion, which is may not be recognised at the beach itself (sometimes one sees only thatthe beach becomes somewhat steeper, and thus somewhat narrower). This chronic erosion in thesea area causes the water in the breaker-zone to becomes deeper. The beach slope becomessteeper, and the beach itself is no longer stable. A relatively small storm can then cause severeerosion, which is in fact, only an adaptation of beach profile to normal beach slopes.
In case of a combination of acute and chronic erosion, one has to take a number of steps:
1. First take measures against the chronic erosion.2. Re-establish the desired beach width and the desired beach slope.3. Check if the new beach is sufficiently stable against acute erosion. If not, an
additional structure is needed.
6.3 When Did the Erosion Start?
Erosion never starts without a reason. In many cases the erosion always existed, but was never aproblem. However, after buildings have been constructed near to the coast, coastal erosionbecame a problem. In fact, this problem should have considered, before starting the development.In some cases, some activities in the neighbourhood are probably initiating the erosion. Forexample sand mining, building structures upstream of the problem site, construction ofrevetments and beach walls.
Guidelines for Monitoring Beaches and Shorelines
SOPAC Training Report 84, April 2000: Russell J. Maharaj
32
6.4 How Much is the Coast Eroding?
For the analysis of the problem, and for designing solutions to erosion problems, it is necessary toquantify the erosion rate. This can be done in the easiest way by analysing beach measurements.Comparison of former coastal profiles with present day profiles is a valuable exercise. In a numberof cases, no profiles may be available. In that case, one can use the former positions of coastlines,extracted from older maps, bathymetric charts and aerial photography or satellite imagery (of theappropriate scale), and compare them with the present day coastline and calculate the loss of sandusing the present day profiles.
6.5 What are the Causes of Erosion?
The following causes of erosion can be recognised:
1. Less supply of sand because of an upstream structure;2. The original source of sand is depleted (for example, by the upstream
construction of a revetment, in front of an eroding beach or by a disappearingcoral reef);
3. Sand is removed from the beach (sand mining);4. Downstream transport of sand has increased;5. Sand is lost in an offshore direction;
Sea-level rise can also result in a loss in the offshore direction, but this loss is usually too small forcausing real engineering problems. Hard protections, are in this case, certainly not advisable.
In case of cause 1, 2 and 4, the best isto also try to stop the negative impact. However, this is inmost cases extremely difficult.
Fundamentally, coastal erosion is caused by longshore or cross-shore losses. In case of a loss inlongshore direction it is important to realise that the loss is always caused by gradient in thetransport and that the magnitude of the longshore transport is not relevant at all.
The next step is to decide if one has to accept the erosion, or if one is willing to invest much instopping the erosion. If one allows erosion, it is vital to devise a good system of set-back lines.
Guidelines for Monitoring Beaches and Shorelines
SOPAC Training Report 84, April 2000: Russell J. Maharaj
33
7.0 MANAGING BEACHES: DATA REQUIREMENTS
Managing a beach effectively requires data. Measurements or observations of the beach areobviously needed, data are required on the attributes of the beach.
Sometimes it is also necessary to include measurements of other factors, for example waves, tidesand weather conditions which dominate beach development.
Data are required for three main reasons:
1. To identify spatial and temporal trends, determine their significance, and helpto understand their causes,
2. To provide information to assist in the assessment and design of managementstrategies,
3. To appraise the performance and impacts of the adopted beach managementmethods.
A clear distinction must be made between an initial survey of the whole beach system at aparticular moment in time, and monitoring of the beach system as it varies with time.
Monitoring is an ongoing exercise in data collection. It is important that data collection is cost-effective, i.e. that the value obtained justifies the effort involved. Measurement methods need tobe chosen, bearing in mind the required accuracy, time and cost.
In order to design a suitable data collection system for any particular beach, the following keyquestions must be answered.
7.1 Why Collect Data?
The reasons to collect data can be summarised as follows:
Ø Understanding the past - short-term fluctuations and long-term trends in the behaviour ofthe beach and in the hydraulic regime need to be identified to understand the development ofa beach. Without this information it is often difficult to identify precisely the causes ofchange and is certainly much more difficult to predict future changes.
Ø Identification of present problems - The present is the key to the past The past is the key tothe future. Monitoring changes of the beaches allows the early identification of changes in thebeach response. This may confirm the year-to-year stability or health of the beach and mayprovide reassuring confirmation of beach recovery or re-growth. Perhaps more importantly,data can be used to detect when beach levels have fallen to a critical level, which could lead tounwanted overtopping, damage to the backshore or undermining of sea walls. Monitoringmay also be significant for the maintenance of other important beach attributes (e.g. to limitdamage to important ecological habitats).
Guidelines for Monitoring Beaches and Shorelines
SOPAC Training Report 84, April 2000: Russell J. Maharaj
34
Ø Programming management operations - monitoring can assist in the timing of existingmanagement schemes. Beach recharge schemes, for example, may be programmed withenhanced confidence if the beach is closely monitored.
Ø Predicting future solutions - data are required to calibrate and validate physical and numericalmodels, which may be used for predicting the future development of a beach, hence assistingin the design of appropriate solutions to any particular problem. Information may also helpjustify the expense of future beach management, for example, by quantifying numbers oftourists and the recreational use of beaches.
Ø Monitoring solutions - whatever their nature, soft beach management schemes will need to bemonitored much more carefully and frequently than hard defences. The information willassist, for example in post-project evaluations and in understanding the environmentalimpacts of schemes. It may also suggest better methods of tackling problems in the future.
7.2 Which Data to be Collected?
In general, the precise details of the data that need to be collected as part of a beach managementexercise will depend upon the specific site and its character. A preliminary assessment of the site isoften necessary to design a suitable data-collection programme. This should identify theinformation already available, the further variables to be measured and the level of accuracy andresolution required. Accuracy and resolution will govern the choice of instruments andmethodology that are appropriate. Possibilities for data collection will almost always exceed thebudget available. As a consequence it is often necessary to set priorities and to concentrate efforton the most vital information.
It is important to consider what information is already being collected, or generated, whichproposed monitoring might duplicate.
The following topics are presented in their likely order of priority for data collection:
1. Beach levels, sediments and attributes.2. Geotechnical site investigation.3. Land, underlying strata and nearshore seabed.4. Tidal currents and wave conditions close to the beach.5. Tidal levels, offshore waves, winds, etc.
7.3 When and Where to Collect Data?
Data have to be collected in a systematic and planned manner. The choice of sampling interval intime and space is dependent upon the process being studied. For example, to identify anyseasonal variation in beach levels against a seawall, will be necessary to survey them at least fourtimes a year, at regular intervals. In the longer term, once seasonal variations have beenestablished, a twice-yearly monitoring regime is likely to suffice.
If, however, post-storm beach levels are of interest, a more flexible fast-response approach tosurvey will be required. Similarly, thought needs to be given to the locations at which data aregathered.
Guidelines for Monitoring Beaches and Shorelines
SOPAC Training Report 84, April 2000: Russell J. Maharaj
35
The locations of any previous surveys should also be considered; more reliable comparisons canbe made when the data collection location is consistent. The frequency and location ofenvironmental seabed and geotechnical surveys also need to be considered carefully.It may be necessary to adjust the data collection programme over time if conditions change at thesite, or more importantly if the survey programme adopted is not providing the informationrequired. Analysing the data is a vital part of any data collection exercise, rather than a post-scriptto it.
7.4 How to Store and Analyse Data?
No universal consensus exists on the best way of storing beach-monitoring data. Data have ageographical location, so a Geographical Information System (GIS) is a powerful tool to store,collate and analyse information.
An important part of the analysis of the information gathered, therefore, involves time-seriesanalysis, for example to separate the short-term fluctuations from any long-term trends. For suchtime-series data storage and analysis, personal computer (PC) storage systems such asspreadsheets, Computer Aided Design (CAD) and simple bespoke databases can perhaps be usedmore simply than GIS if the geographical referencing is less important.
Simplicity of storage, retrieval and analysis are key to effective data management.
It is important that analysis is carried out as new data are entered into the database, and up-to-date summaries of the results are made available to interested parties. Although the data shouldhave been checked before being input, erroneous data can be identified after loading by promptanalysis, which will reveal surprising or unrealistic changes.
A vital part of any analysis of data is the presentation of results in a convenient form that can beappreciated by non-technical individuals and groups, as well as providing a summary for thebeach managers themselves. The requirement for such output from the data collectionprogramme needs to be defined in advance and developed in the light of experience.
7.5 How to Start a Data Collection Programme?
The practicalities of starting up and sustaining a data collection programme will be almost as site-specific as the beaches themselves. It is rarely possible to start a long-term monitoring exercisewithout prior justification, usually expressed in benefit-cost terms.
Several stages are normally needed before starting a beach-monitoring programme. First, the needfor the information has to be established, usually to non-technical fund holders. Then it isimportant to review what information already exists and where the gaps are. This leads on toconsideration of the needs for further information, and whether it can be obtained in a short-term programme of monitoring or whether longer-term monitoring is required.
Having set the objectives of a data collection programme, a decision will need to be made on therequired accuracy and frequency of the information for the baseline and monitoring surveys. Themethods for storing, analysing and disseminating the information also need to be specified at thisstage.
It is then necessary to estimate the costs of the programme and ideally to place financial values on

Guidelines for Monitoring Beaches and Shorelines
SOPAC Training Report 84, April 2000: Russell J. Maharaj
36
the likely benefits that will accrue. The benefits, of course, come from improving the efficiency,or cost, of beach management and thus avoiding losses or making economic gains as a result.

Guidelines for Monitoring Beaches and Shorelines
SOPAC Training Report 84, April 2000: Russell J. Maharaj
37
8.0 BEACH DATA COLLECTION
8.1 Programme Planning
CIRIA (1996) describes several methods for data collection. The following are adapted fromthose guidelines.
Beaches are constantly changing in response to the various processes and factors which controlthem. Successful management of a beach requires that the processes should be identified andchanges should be monitored. The data should be analysed and appraised following a carefullyplanned ongoing data collection programme.
The aim of the programme should be to understand the beach responses and to identify potentialproblems, thereby allowing management to be proactive rather than reactive.
Monitoring should be undertaken on any coastline where there is a potential risk of flooding orerosion that threatens significant property or infrastructure and it is essential for the post-construction assessment of any new beach works or management scheme.
The programme should include:
1. Recording observations,2. Taking fixed-aspect photographs,3. Measurement of beach profiles and plan shapes,4. Analysis of beach sediment samples,5. Determination of the sediment budget,6. Environmental data collection,7. Aerial photography,8. Bathymetric survey.
This work must be undertaken in conjunction with the monitoring of waves and water levels, aswell as the collection of geotechnical, bathymetric and tidal current data.
Prior to establishing a field programme, a desk study should be undertaken. Information relatingto the geological and historical development of the beach is vital to understanding presentsituation and therefore to the planning of the programme. Sources of information include:
1. Geological memoirs and maps,2. Published research papers,3. Universities theses,4. Ordnance Survey sheets,5. Admiralty Charts and Defence Mapping Agency Charts,6. Previous beach surveys,7. Engineering drawings and records,8. Historic photographs, both aerial and ground,9. Press reports and local knowledge and10. Satellite imagery.
Guidelines for Monitoring Beaches and Shorelines
SOPAC Training Report 84, April 2000: Russell J. Maharaj
38
Particular attention should be paid to the nearshore and backshore geology, and to the impact ofcoastal structures and dredging.
Fieldwork must be undertaken often enough to reveal short-term variations as well as long-termtrends. At the outset surveys should be undertaken monthly and immediately after anysignificant storm events.
This level of monitoring should be maintained until an understanding of the processes andfactors controlling the beach has been developed and the potential for seasonal and storm relatedvariations, the areas of particular concern, and the sediment sources and sinks have beenidentified. Once these requirements have been met, survey frequency and extent can be reduced.
8.2 Site Investigations
The simplest form of monitoring a beach is by regular inspection of the coastline. The use ofphotographs and pre-prepared checklists or record-sheets is a good way of increasing the value ofsuch inspections. Inspections will vary according to the site and the particular concerns of thebeach manager, but they should include the collection of information on:
1. Beach changes, for example:
Ø Beach levels against sea walls, groynes, etc.Ø Evidence of erosion of dune faces, or steep scarps at the beach crest andØ Exposure of the solid shore-platform in the inter-tidal zone.
2. Beach texture, for example:
Ø Deposition or loss of sand covering a shingle upper beach;Ø Deposition of mud on the lower beach face.
3. Damage to structures, for example:
Ø Missing groyne planking;Ø Spalling or abrasion of concrete walls;Ø Displacement of rock armour andØ Exposure of structure foundations.
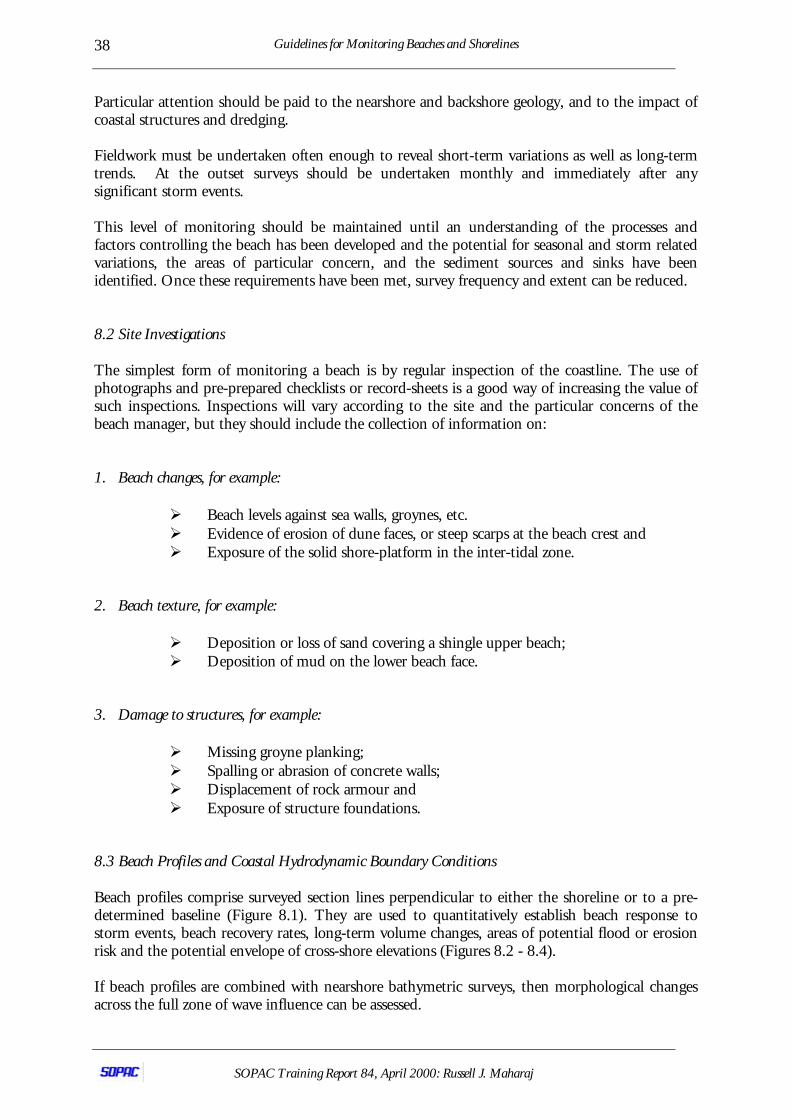
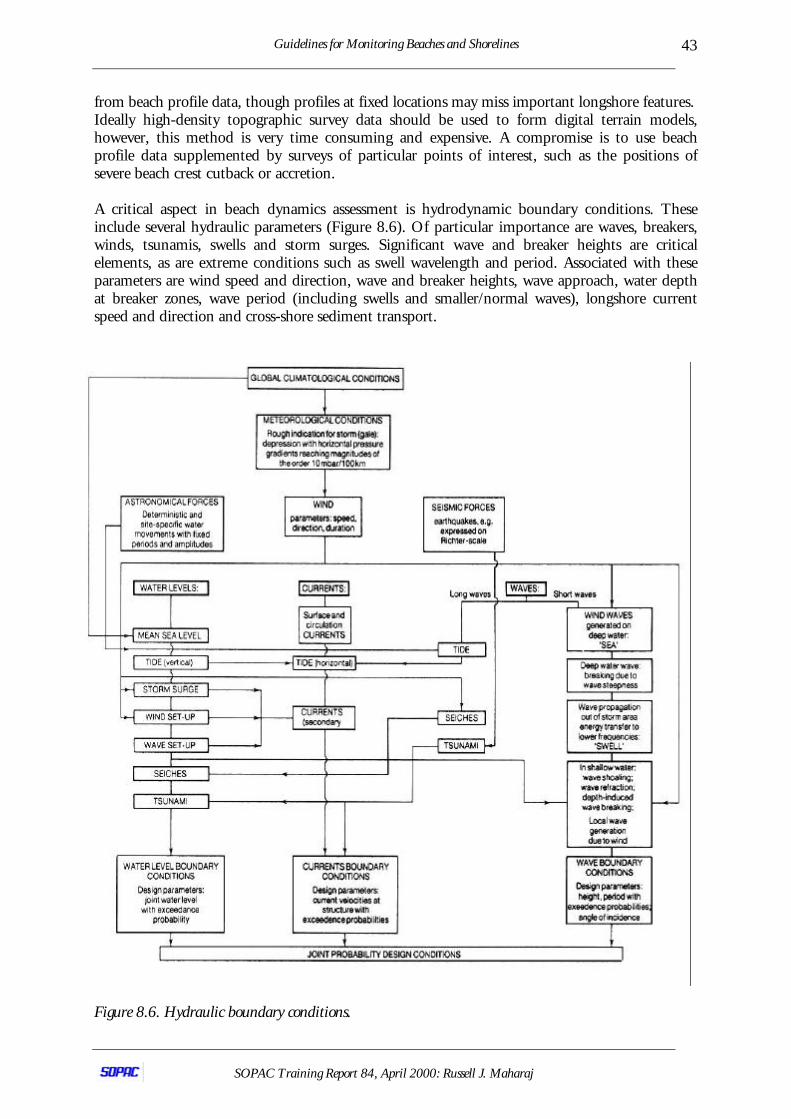
8.3 Beach Profiles and Coastal Hydrodynamic Boundary Conditions
Beach profiles comprise surveyed section lines perpendicular to either the shoreline or to a pre-determined baseline (Figure 8.1). They are used to quantitatively establish beach response tostorm events, beach recovery rates, long-term volume changes, areas of potential flood or erosionrisk and the potential envelope of cross-shore elevations (Figures 8.2 - 8.4).
If beach profiles are combined with nearshore bathymetric surveys, then morphological changesacross the full zone of wave influence can be assessed.
Guidelines for Monitoring Beaches and Shorelines
SOPAC Training Report 84, April 2000: Russell J. Maharaj
39
Figure 8.1. Beach terminology and morpho-dynamics.
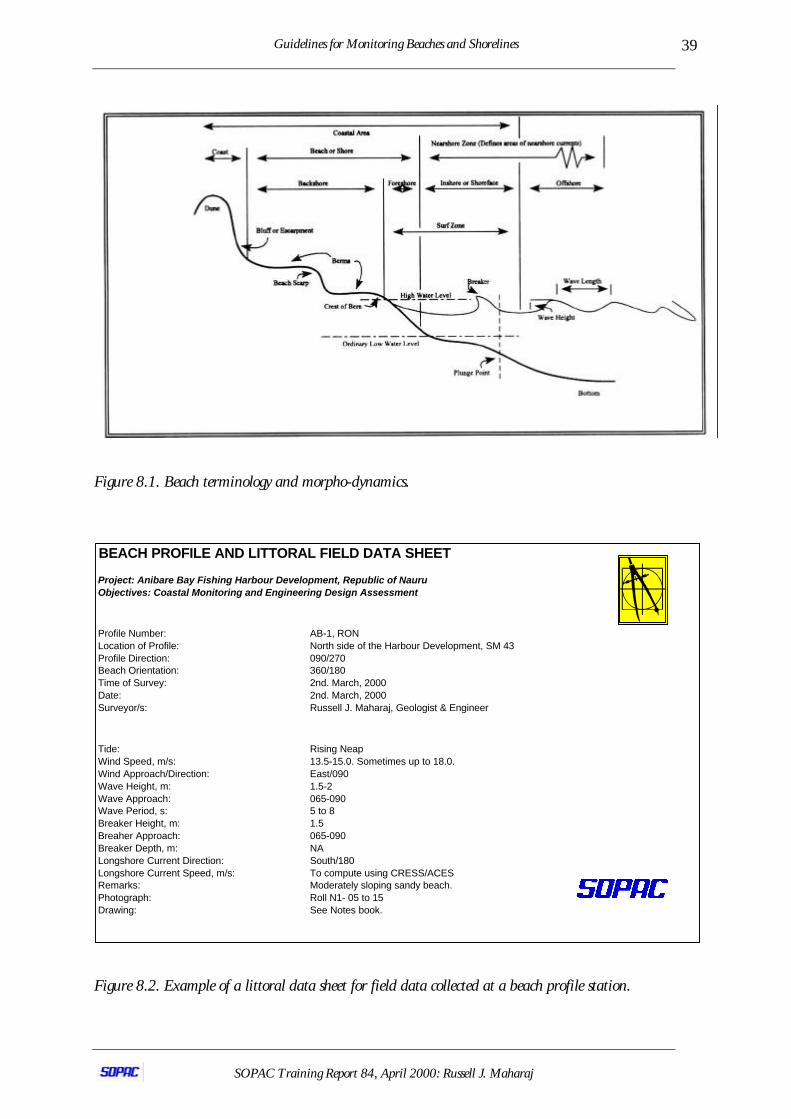
Figure 8.2. Example of a littoral data sheet for field data collected at a beach profile station.
BEACH PROFILE AND LITTORAL FIELD DATA SHEET
Project: Anibare Bay Fishing Harbour Development, Republic of NauruObjectives: Coastal Monitoring and Engineering Design Assessment
Profile Number: AB-1, RONLocation of Profile: North side of the Harbour Development, SM 43Profile Direction: 090/270Beach Orientation: 360/180Time of Survey: 2nd. March, 2000Date: 2nd. March, 2000Surveyor/s: Russell J. Maharaj, Geologist & Engineer
Tide: Rising NeapWind Speed, m/s: 13.5-15.0. Sometimes up to 18.0.Wind Approach/Direction: East/090Wave Height, m: 1.5-2Wave Approach: 065-090Wave Period, s: 5 to 8Breaker Height, m: 1.5Breaher Approach: 065-090Breaker Depth, m: NALongshore Current Direction: South/180Longshore Current Speed, m/s: To compute using CRESS/ACESRemarks: Moderately sloping sandy beach.Photograph: Roll N1- 05 to 15Drawing: See Notes book.
Guidelines for Monitoring Beaches and Shorelines
SOPAC Training Report 84, April 2000: Russell J. Maharaj
40
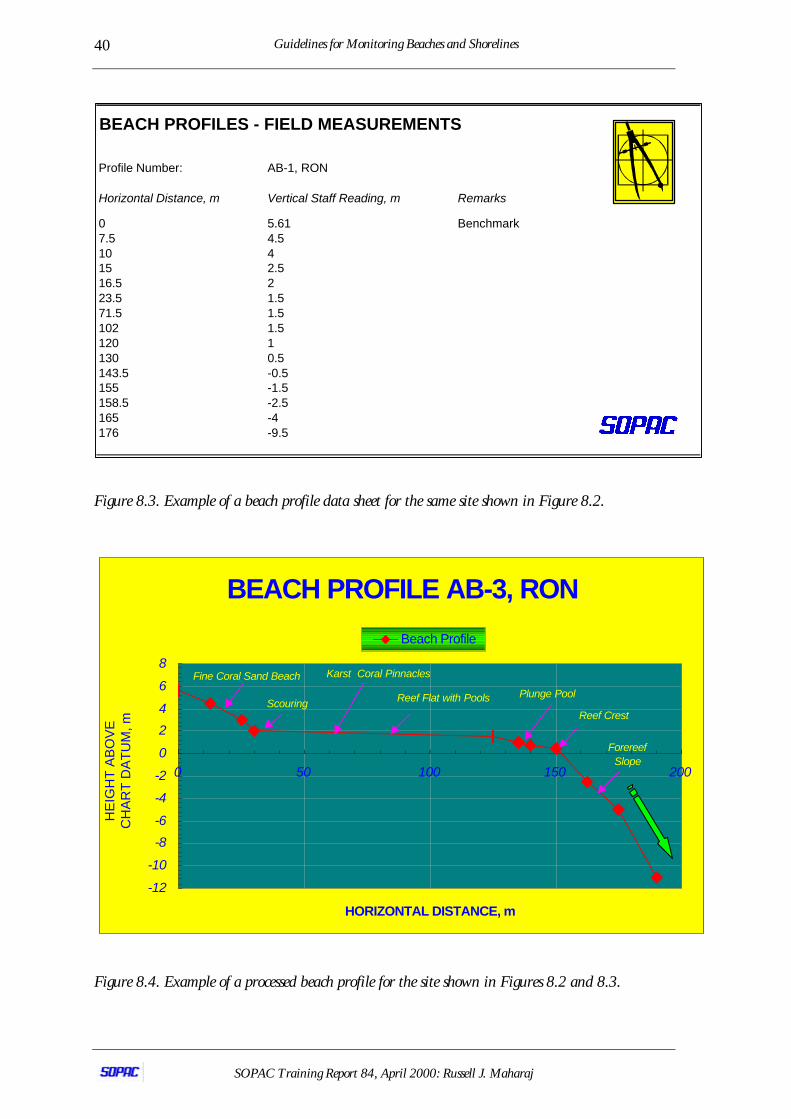
Figure 8.3. Example of a beach profile data sheet for the same site shown in Figure 8.2.
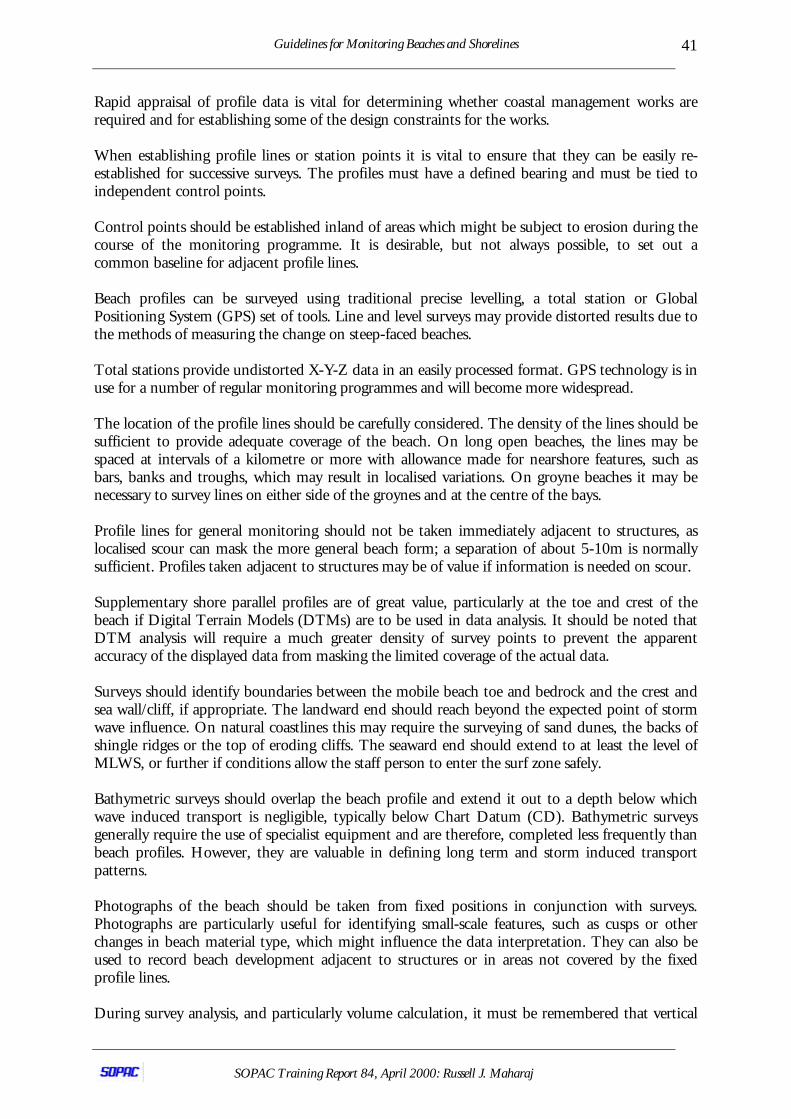
Figure 8.4. Example of a processed beach profile for the site shown in Figures 8.2 and 8.3.
BEACH PROFILES - FIELD MEASUREMENTS
Profile Number: AB-1, RON
Horizontal Distance, m Vertical Staff Reading, m Remarks
0 5.61 Benchmark7.5 4.510 415 2.516.5 223.5 1.571.5 1.5102 1.5120 1130 0.5143.5 -0.5155 -1.5158.5 -2.5165 -4176 -9.5
BEACH PROFILE AB-3, RON
-12
-10
-8
-6
-4
-2
0
2
4
6
8
0 50 100 150 200
HORIZONTAL DISTANCE, m
HE
IGH
T A
BO
VE
C
HA
RT
DA
TU
M, m
Beach Profile
Reef Crest
Reef Flat with Pools
ForereefSlope
Plunge Pool
Karst Coral PinnaclesFine Coral Sand Beach
Scouring
Guidelines for Monitoring Beaches and Shorelines
SOPAC Training Report 84, April 2000: Russell J. Maharaj
41
Rapid appraisal of profile data is vital for determining whether coastal management works arerequired and for establishing some of the design constraints for the works.
When establishing profile lines or station points it is vital to ensure that they can be easily re-established for successive surveys. The profiles must have a defined bearing and must be tied toindependent control points.
Control points should be established inland of areas which might be subject to erosion during thecourse of the monitoring programme. It is desirable, but not always possible, to set out acommon baseline for adjacent profile lines.
Beach profiles can be surveyed using traditional precise levelling, a total station or GlobalPositioning System (GPS) set of tools. Line and level surveys may provide distorted results due tothe methods of measuring the change on steep-faced beaches.
Total stations provide undistorted X-Y-Z data in an easily processed format. GPS technology is inuse for a number of regular monitoring programmes and will become more widespread.
The location of the profile lines should be carefully considered. The density of the lines should besufficient to provide adequate coverage of the beach. On long open beaches, the lines may bespaced at intervals of a kilometre or more with allowance made for nearshore features, such asbars, banks and troughs, which may result in localised variations. On groyne beaches it may benecessary to survey lines on either side of the groynes and at the centre of the bays.
Profile lines for general monitoring should not be taken immediately adjacent to structures, aslocalised scour can mask the more general beach form; a separation of about 5-10m is normallysufficient. Profiles taken adjacent to structures may be of value if information is needed on scour.
Supplementary shore parallel profiles are of great value, particularly at the toe and crest of thebeach if Digital Terrain Models (DTMs) are to be used in data analysis. It should be noted thatDTM analysis will require a much greater density of survey points to prevent the apparentaccuracy of the displayed data from masking the limited coverage of the actual data.
Surveys should identify boundaries between the mobile beach toe and bedrock and the crest andsea wall/cliff, if appropriate. The landward end should reach beyond the expected point of stormwave influence. On natural coastlines this may require the surveying of sand dunes, the backs ofshingle ridges or the top of eroding cliffs. The seaward end should extend to at least the level ofMLWS, or further if conditions allow the staff person to enter the surf zone safely.
Bathymetric surveys should overlap the beach profile and extend it out to a depth below whichwave induced transport is negligible, typically below Chart Datum (CD). Bathymetric surveysgenerally require the use of specialist equipment and are therefore, completed less frequently thanbeach profiles. However, they are valuable in defining long term and storm induced transportpatterns.
Photographs of the beach should be taken from fixed positions in conjunction with surveys.Photographs are particularly useful for identifying small-scale features, such as cusps or otherchanges in beach material type, which might influence the data interpretation. They can also beused to record beach development adjacent to structures or in areas not covered by the fixedprofile lines.
During survey analysis, and particularly volume calculation, it must be remembered that vertical
Guidelines for Monitoring Beaches and Shorelines
SOPAC Training Report 84, April 2000: Russell J. Maharaj
42
accuracy is usually +20 mm for topographic surveys and +150 mm for bathymetric surveys. Planposition is usually +0.2 m and +1 m respectively (based on the trapezoidal rule).
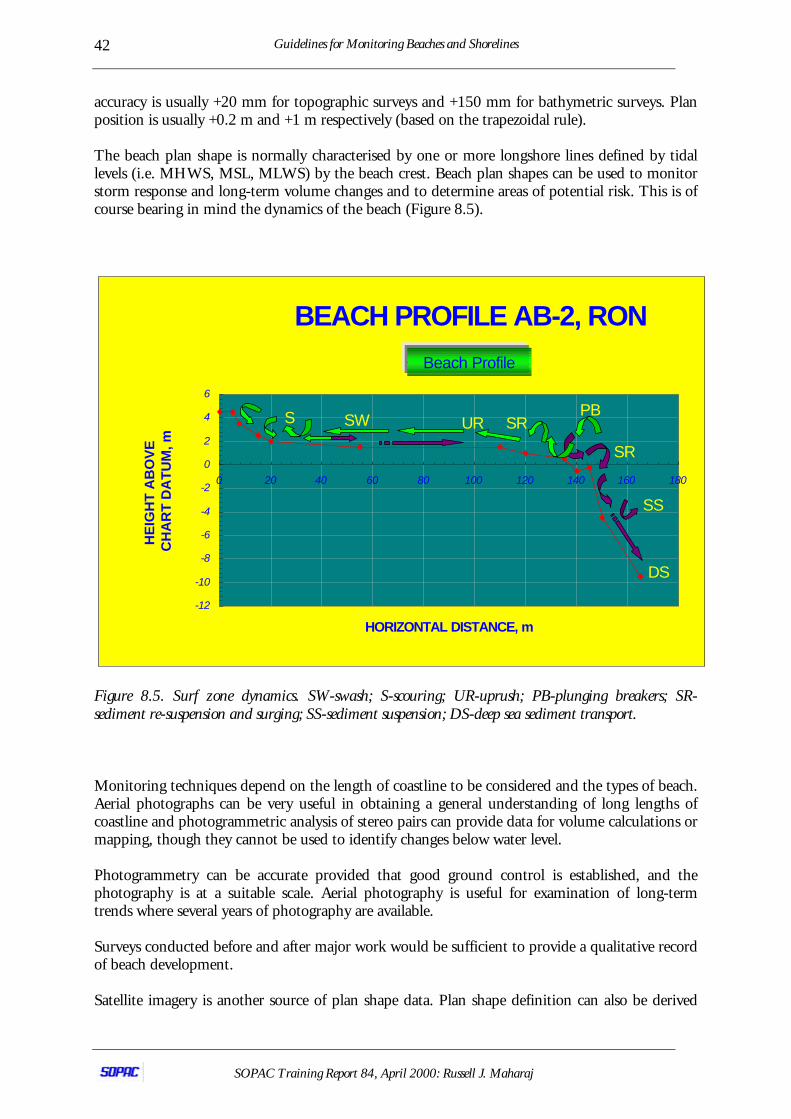
The beach plan shape is normally characterised by one or more longshore lines defined by tidallevels (i.e. MHWS, MSL, MLWS) by the beach crest. Beach plan shapes can be used to monitorstorm response and long-term volume changes and to determine areas of potential risk. This is ofcourse bearing in mind the dynamics of the beach (Figure 8.5).
Figure 8.5. Surf zone dynamics. SW-swash; S-scouring; UR-uprush; PB-plunging breakers; SR-sediment re-suspension and surging; SS-sediment suspension; DS-deep sea sediment transport.
Monitoring techniques depend on the length of coastline to be considered and the types of beach.Aerial photographs can be very useful in obtaining a general understanding of long lengths ofcoastline and photogrammetric analysis of stereo pairs can provide data for volume calculations ormapping, though they cannot be used to identify changes below water level.
Photogrammetry can be accurate provided that good ground control is established, and thephotography is at a suitable scale. Aerial photography is useful for examination of long-termtrends where several years of photography are available.
Surveys conducted before and after major work would be sufficient to provide a qualitative recordof beach development.
Satellite imagery is another source of plan shape data. Plan shape definition can also be derived
BEACH PROFILE AB-2, RON
-12
-10
-8
-6
-4
-2
0
2
4
6
0 20 40 60 80 100 120 140 160 180
HORIZONTAL DISTANCE, m
HE
IGH
T A
BO
VE
CH
AR
T D
AT
UM
, m
S
SS
SW UR SRPB
SR
DS
Beach Profile
Guidelines for Monitoring Beaches and Shorelines
SOPAC Training Report 84, April 2000: Russell J. Maharaj
43
from beach profile data, though profiles at fixed locations may miss important longshore features.Ideally high-density topographic survey data should be used to form digital terrain models,however, this method is very time consuming and expensive. A compromise is to use beachprofile data supplemented by surveys of particular points of interest, such as the positions ofsevere beach crest cutback or accretion.
A critical aspect in beach dynamics assessment is hydrodynamic boundary conditions. Theseinclude several hydraulic parameters (Figure 8.6). Of particular importance are waves, breakers,winds, tsunamis, swells and storm surges. Significant wave and breaker heights are criticalelements, as are extreme conditions such as swell wavelength and period. Associated with theseparameters are wind speed and direction, wave and breaker heights, wave approach, water depthat breaker zones, wave period (including swells and smaller/normal waves), longshore currentspeed and direction and cross-shore sediment transport.
Figure 8.6. Hydraulic boundary conditions.
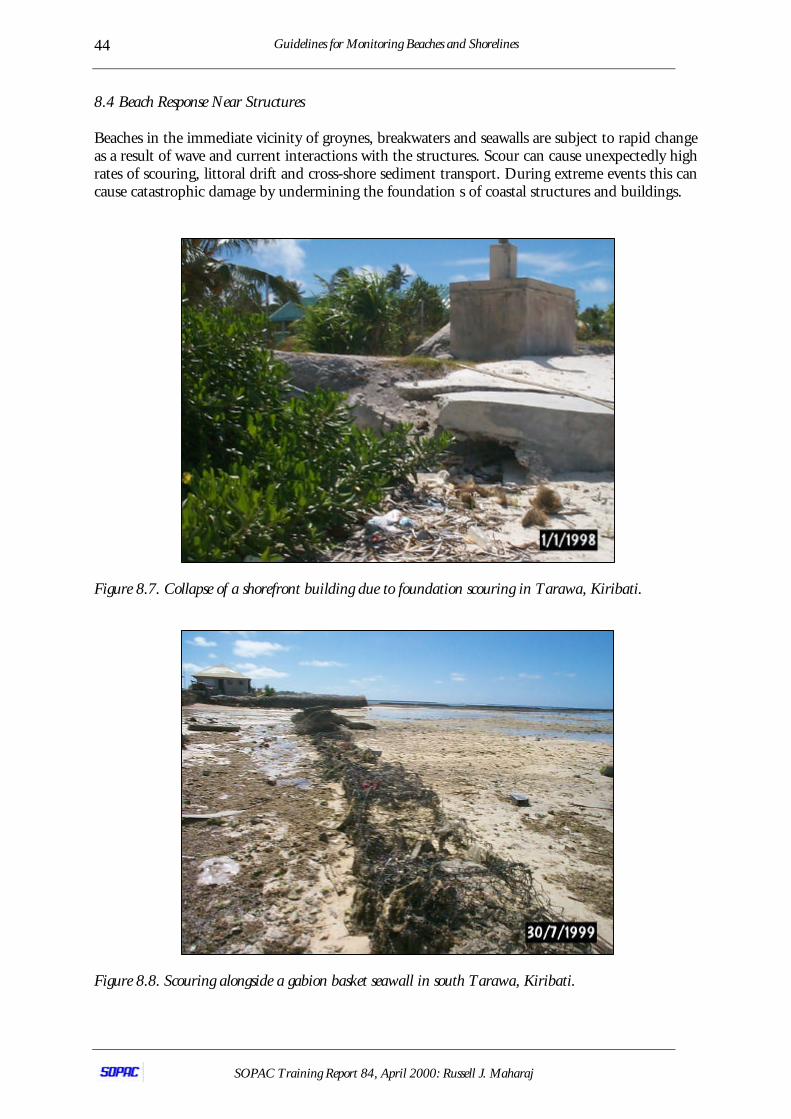
Guidelines for Monitoring Beaches and Shorelines
SOPAC Training Report 84, April 2000: Russell J. Maharaj
44
8.4 Beach Response Near Structures
Beaches in the immediate vicinity of groynes, breakwaters and seawalls are subject to rapid changeas a result of wave and current interactions with the structures. Scour can cause unexpectedly highrates of scouring, littoral drift and cross-shore sediment transport. During extreme events this cancause catastrophic damage by undermining the foundation s of coastal structures and buildings.
Figure 8.7. Collapse of a shorefront building due to foundation scouring in Tarawa, Kiribati.
Figure 8.8. Scouring alongside a gabion basket seawall in south Tarawa, Kiribati.
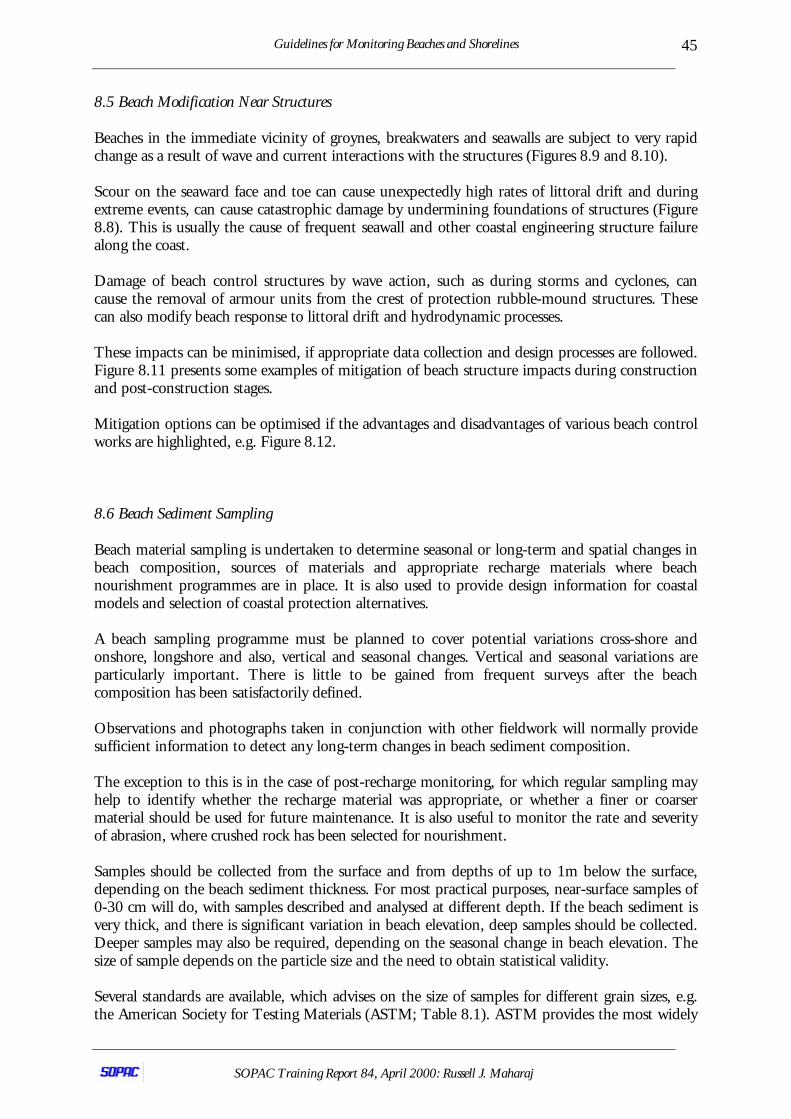
Guidelines for Monitoring Beaches and Shorelines
SOPAC Training Report 84, April 2000: Russell J. Maharaj
45
8.5 Beach Modification Near Structures
Beaches in the immediate vicinity of groynes, breakwaters and seawalls are subject to very rapidchange as a result of wave and current interactions with the structures (Figures 8.9 and 8.10).
Scour on the seaward face and toe can cause unexpectedly high rates of littoral drift and duringextreme events, can cause catastrophic damage by undermining foundations of structures (Figure8.8). This is usually the cause of frequent seawall and other coastal engineering structure failurealong the coast.
Damage of beach control structures by wave action, such as during storms and cyclones, cancause the removal of armour units from the crest of protection rubble-mound structures. Thesecan also modify beach response to littoral drift and hydrodynamic processes.
These impacts can be minimised, if appropriate data collection and design processes are followed.Figure 8.11 presents some examples of mitigation of beach structure impacts during constructionand post-construction stages.
Mitigation options can be optimised if the advantages and disadvantages of various beach controlworks are highlighted, e.g. Figure 8.12.
8.6 Beach Sediment Sampling
Beach material sampling is undertaken to determine seasonal or long-term and spatial changes inbeach composition, sources of materials and appropriate recharge materials where beachnourishment programmes are in place. It is also used to provide design information for coastalmodels and selection of coastal protection alternatives.
A beach sampling programme must be planned to cover potential variations cross-shore andonshore, longshore and also, vertical and seasonal changes. Vertical and seasonal variations areparticularly important. There is little to be gained from frequent surveys after the beachcomposition has been satisfactorily defined.
Observations and photographs taken in conjunction with other fieldwork will normally providesufficient information to detect any long-term changes in beach sediment composition.
The exception to this is in the case of post-recharge monitoring, for which regular sampling mayhelp to identify whether the recharge material was appropriate, or whether a finer or coarsermaterial should be used for future maintenance. It is also useful to monitor the rate and severityof abrasion, where crushed rock has been selected for nourishment.
Samples should be collected from the surface and from depths of up to 1m below the surface,depending on the beach sediment thickness. For most practical purposes, near-surface samples of0-30 cm will do, with samples described and analysed at different depth. If the beach sediment isvery thick, and there is significant variation in beach elevation, deep samples should be collected.Deeper samples may also be required, depending on the seasonal change in beach elevation. Thesize of sample depends on the particle size and the need to obtain statistical validity.
Several standards are available, which advises on the size of samples for different grain sizes, e.g.the American Society for Testing Materials (ASTM; Table 8.1). ASTM provides the most widely
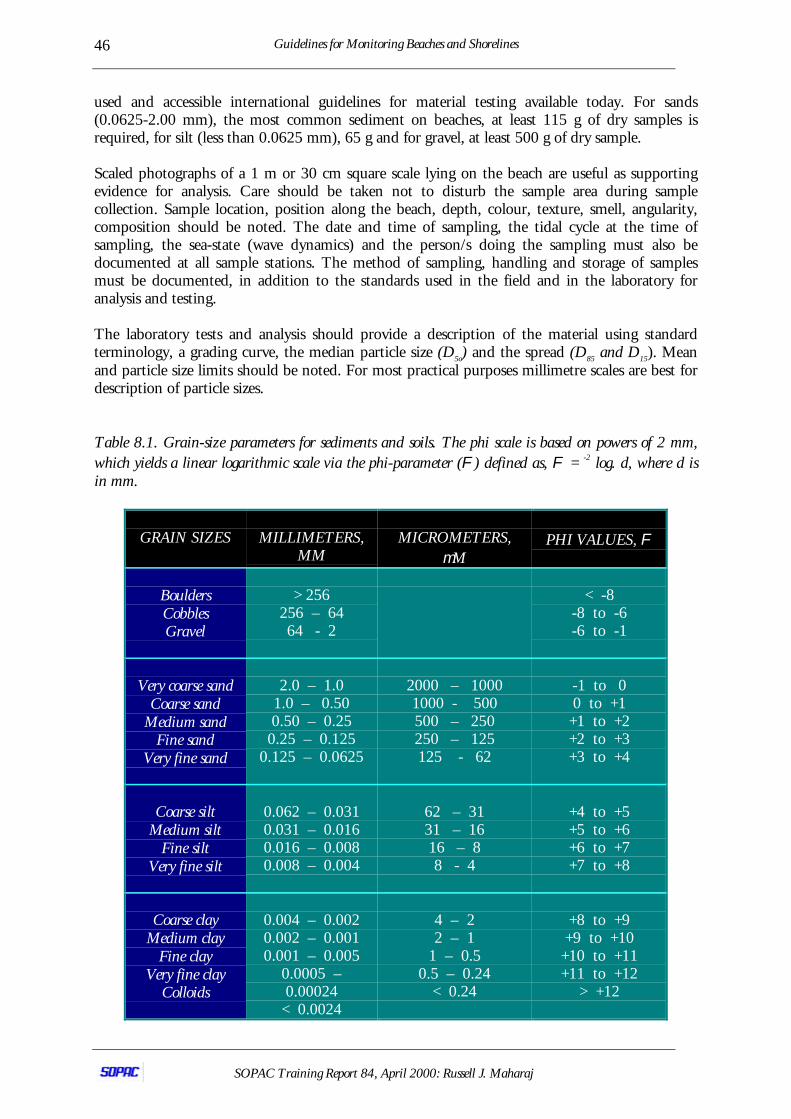
Guidelines for Monitoring Beaches and Shorelines
SOPAC Training Report 84, April 2000: Russell J. Maharaj
46
used and accessible international guidelines for material testing available today. For sands(0.0625-2.00 mm), the most common sediment on beaches, at least 115 g of dry samples isrequired, for silt (less than 0.0625 mm), 65 g and for gravel, at least 500 g of dry sample.
Scaled photographs of a 1 m or 30 cm square scale lying on the beach are useful as supportingevidence for analysis. Care should be taken not to disturb the sample area during samplecollection. Sample location, position along the beach, depth, colour, texture, smell, angularity,composition should be noted. The date and time of sampling, the tidal cycle at the time ofsampling, the sea-state (wave dynamics) and the person/s doing the sampling must also bedocumented at all sample stations. The method of sampling, handling and storage of samplesmust be documented, in addition to the standards used in the field and in the laboratory foranalysis and testing.
The laboratory tests and analysis should provide a description of the material using standardterminology, a grading curve, the median particle size (D5o) and the spread (D85 and D15). Meanand particle size limits should be noted. For most practical purposes millimetre scales are best fordescription of particle sizes.
Table 8.1. Grain-size parameters for sediments and soils. The phi scale is based on powers of 2 mm,which yields a linear logarithmic scale via the phi-parameter (Φ) defined as, Φ = -2 log. d, where d isin mm.
GRAIN SIZES MILLIMETERS,MM
MICROMETERS,µM
PHI VALUES, Φ
BouldersCobblesGravel
> 256256 – 6464 - 2
< -8-8 to -6-6 to -1
Very coarse sandCoarse sand
Medium sandFine sand
Very fine sand
2.0 – 1.01.0 – 0.500.50 – 0.25
0.25 – 0.1250.125 – 0.0625
2000 – 10001000 - 500500 – 250250 – 125125 - 62
-1 to 00 to +1
+1 to +2+2 to +3+3 to +4
Coarse siltMedium silt
Fine siltVery fine silt
0.062 – 0.0310.031 – 0.0160.016 – 0.0080.008 – 0.004
62 – 3131 – 1616 – 88 - 4
+4 to +5+5 to +6+6 to +7+7 to +8
Coarse clayMedium clay
Fine clayVery fine clay
Colloids
0.004 – 0.0020.002 – 0.0010.001 – 0.005
0.0005 –0.00024
< 0.0024
4 – 22 – 1
1 – 0.50.5 – 0.24
< 0.24
+8 to +9+9 to +10
+10 to +11+11 to +12
> +12
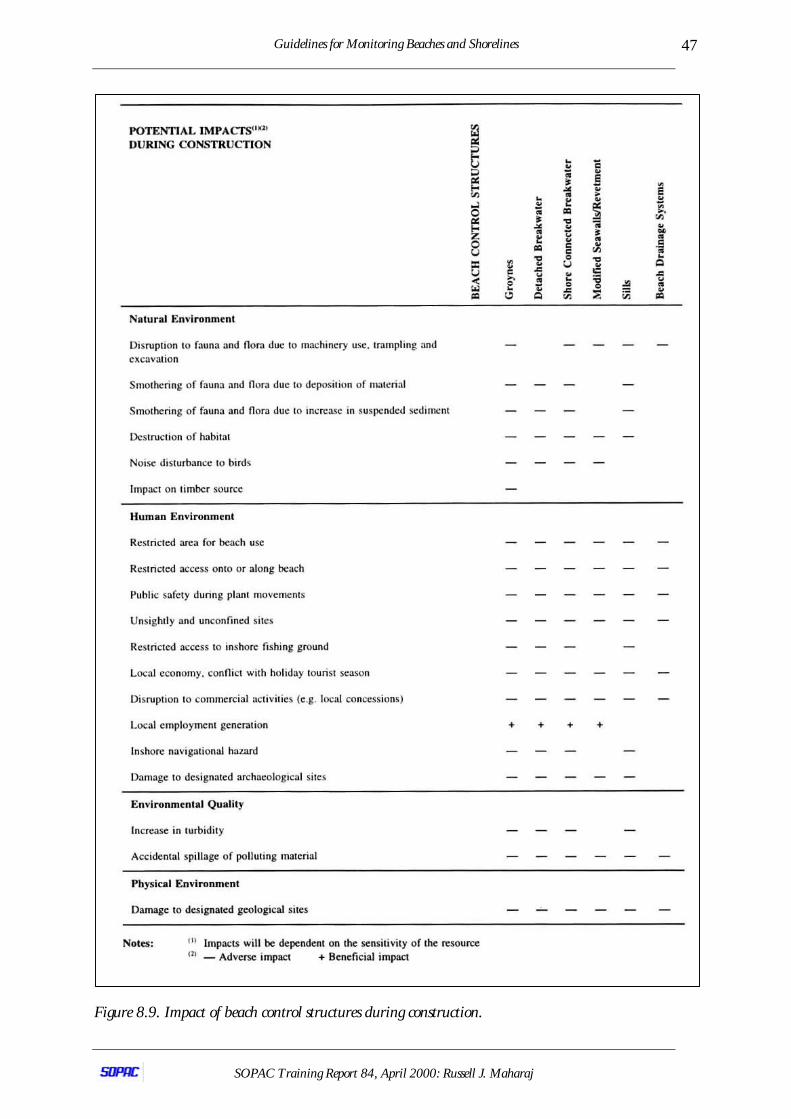
Guidelines for Monitoring Beaches and Shorelines
SOPAC Training Report 84, April 2000: Russell J. Maharaj
47
Figure 8.9. Impact of beach control structures during construction.
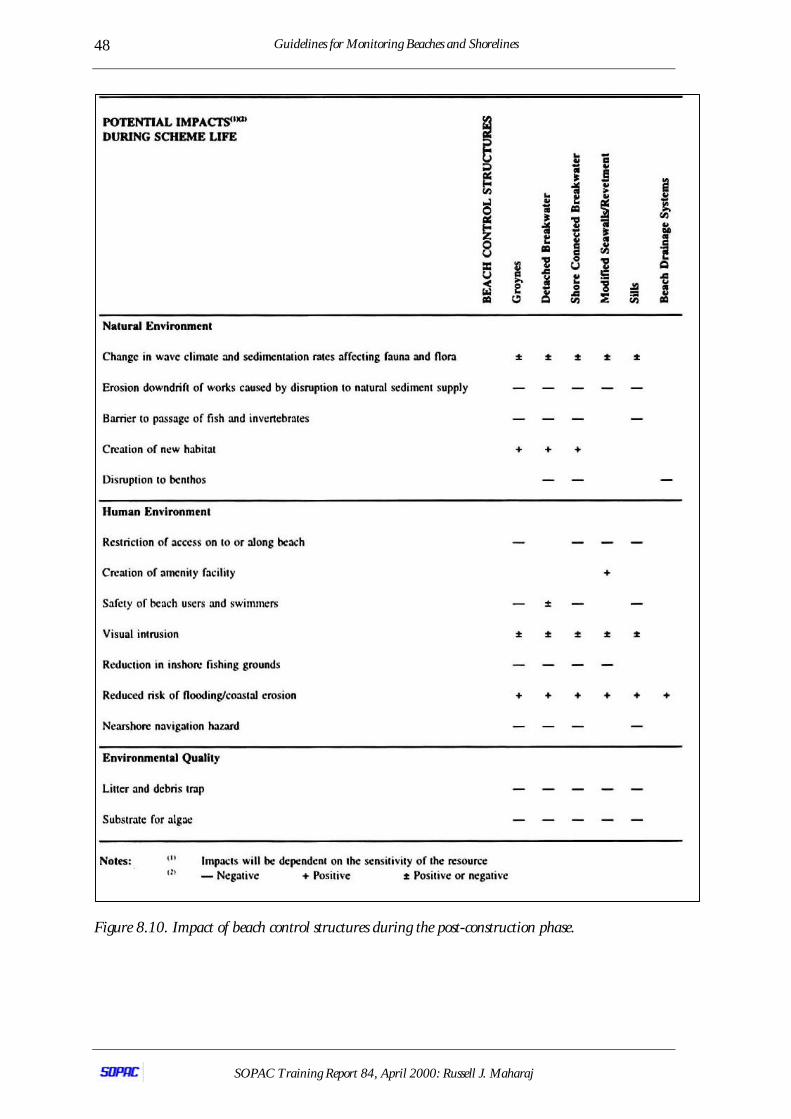
Guidelines for Monitoring Beaches and Shorelines
SOPAC Training Report 84, April 2000: Russell J. Maharaj
48
Figure 8.10. Impact of beach control structures during the post-construction phase.
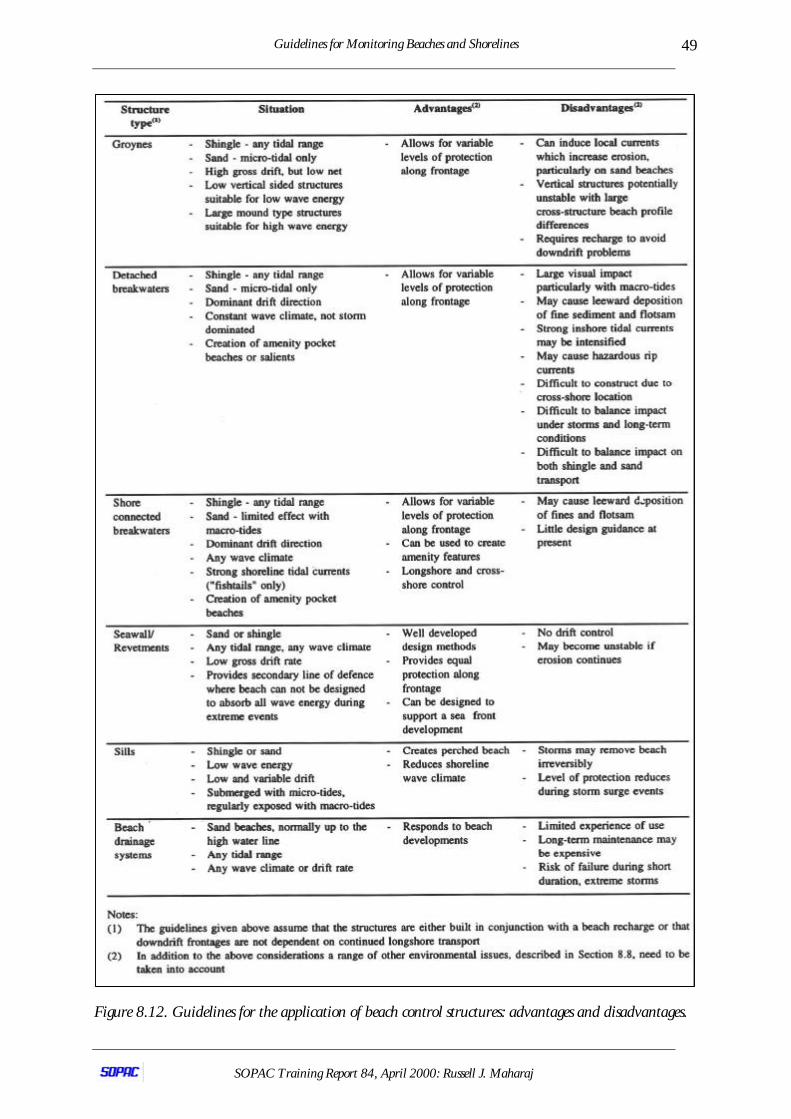
Guidelines for Monitoring Beaches and Shorelines
SOPAC Training Report 84, April 2000: Russell J. Maharaj
49
Figure 8.12. Guidelines for the application of beach control structures: advantages and disadvantages.
Guidelines for Monitoring Beaches and Shorelines
SOPAC Training Report 84, April 2000: Russell J. Maharaj
50
Other variables, such as mineralogy, geotechnical, hydraulic and hydrodynamic parameters can besubsequently evaluated from proven mathematical formulae and test procedures.
Beach sampling should be undertaken in conjunction with nearshore sampling and a study of theunderlying nearshore and onshore geology. This will help in identifying the relationships, if any,which exists between the beach sediments and local coastal geology.
8.7 Beach Sediment Budget
A sediment budget is the sediment transport volume balance for a coastline. Sediment quantitiescan be categorized according to the sources, sinks, sediment-types and processes involved.
Definition of a sediment budget will assist in:
1. Identifying the relevant conditions, processes and factors affecting the beach,2. Estimating transport volumes and rates and3. Monitoring the success of beach management schemes.
The methods for estimating the sediment budgets combine predictive techniques, with deskstudies and field measurements. All of the methods are subject to large uncertainties and requirethe involvement of specialist assistance. Generally, it must be indicated that the budgetdetermined are only indications and not absolute and therefore should be treated with discretion.
Desk studies involve analysis of available records such as Ordnance Survey maps, existing beachsurveys, satellite imagery and aerial photographs. This allows the investigator to build up a timeseries of beach positions, allowing long-term development of the beach plan-shape to be analysed.
Field measurements of plan and profile shape can be more reliable, particularly at sites where amonitoring programme has been in place for a number of years. Comparisons of successive beachplan shapes measured near crossshore structures can be used to estimate longshore and crossshoresediment drift.
Another more reliable approach, is to deploy tracers to identify sediment transport paths. In thepast radioactive, fluorescent, coloured or metallic tracers have been used. Other techniquesinclude the use of magnetic sand particles and electronic pebbles.
Guidelines for Monitoring Beaches and Shorelines
SOPAC Training Report 84, April 2000: Russell J. Maharaj
51
9.0 ENVIRONMENTAL DATA COLLECTION
The following types of environmental data are needed in order to assess, evaluate, or monitor theenvironmental characteristics of' the existing beach for the purpose of a beach managementinitiative.
Since the beach is part of a larger coastal ecosystem, characterising and understanding the bio-physical characteristics (of both natural and man-made systems) are important for successfulimplementation of any beach management plan. This serves to minimise the negative impacts ofdevelopment initiatives in the coastal/littoral environment.
Parameters of importance include the following:
1. Flora/invertebrates/birds/fish/fauna,2. Recreation activities (informal and formal),3. Safety,4. Topography and geomorphology,5. Fishery activities,6. Commercial industrial activities,7. Tourism,8. Land use,9. Archaeology and heritage,10. Navigation and shipping,11. Coastal engineering infrastructure,12. Water quality (beaches, tidal inlets, river mouths and adjacent offshore areas),13. Sediment quality (beaches, tidal inlets, river mouths and adjacent offshore
areas),14. Coastal hydrodynamics,15. River outflow - hydrological processes and16. Geological characteristics.
Some of the data types are presented in Figure 9.1. If insufficient information exists within thestudy area, baseline surveys and assessment may be required. This survey work should be carriedout in advance of any management or construction activity and should, ideally, take place over anumber of years prior to any major change being planned.
These surveys and assessments should be part of the planning processes, and should facilitateoptimum site selection and environmental and developmental planning decisions. This period ofsurvey enables an impact assessment to be made of any natural fluctuations in population,community structure, abundance, distribution in response to developmental changes. The detailof survey work required is, however, site specific and will depend to some extent on the natureand scale of the proposed activities.
Figure 9.2 show the Impact Assessment (IA) process. This can take the form of development ofan Environmental Assessment (EA), EIA and/or Strategic Environmental Impact Assessment(SEA). EA’s are general impact assessment, while the EIA is a comprehensive impact analysis,based on an inter-disciplinary study of the total environment (human and natural), with variousoptions and remedial measures proposed. SEA’s are policy documents and guidelines, thatsupports the decisions and recommendations produced in an EIA.
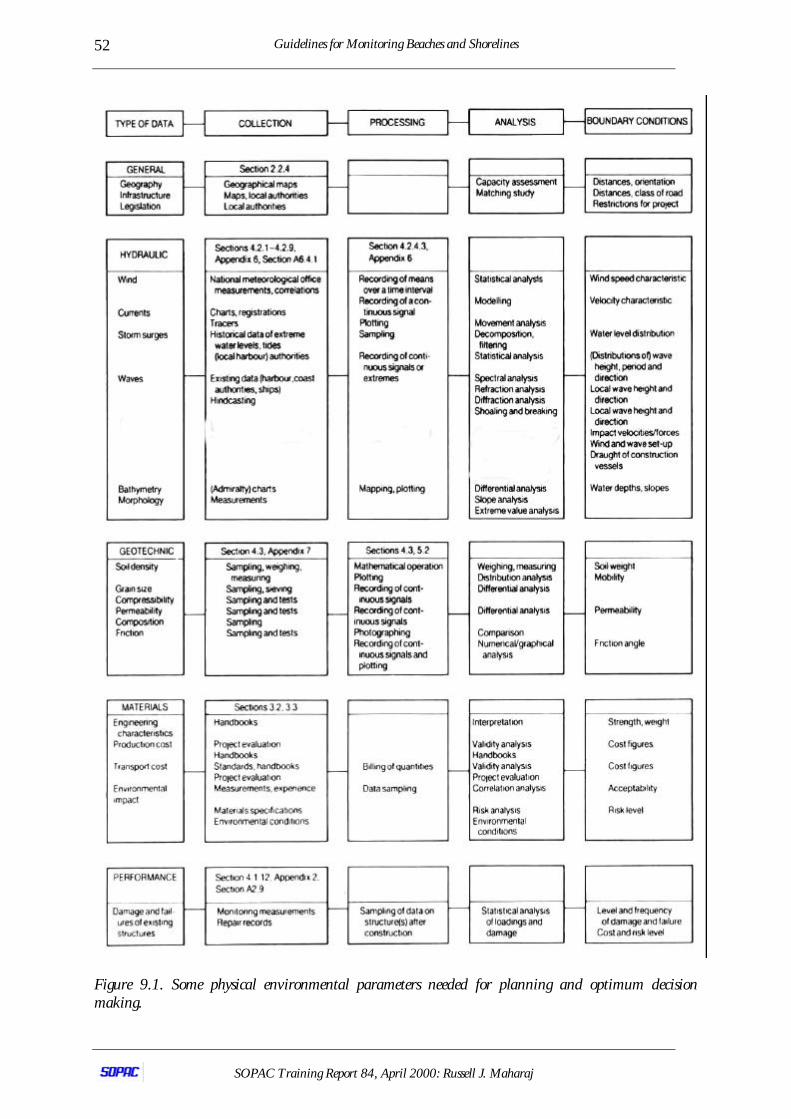
Guidelines for Monitoring Beaches and Shorelines
SOPAC Training Report 84, April 2000: Russell J. Maharaj
52
Figure 9.1. Some physical environmental parameters needed for planning and optimum decisionmaking.
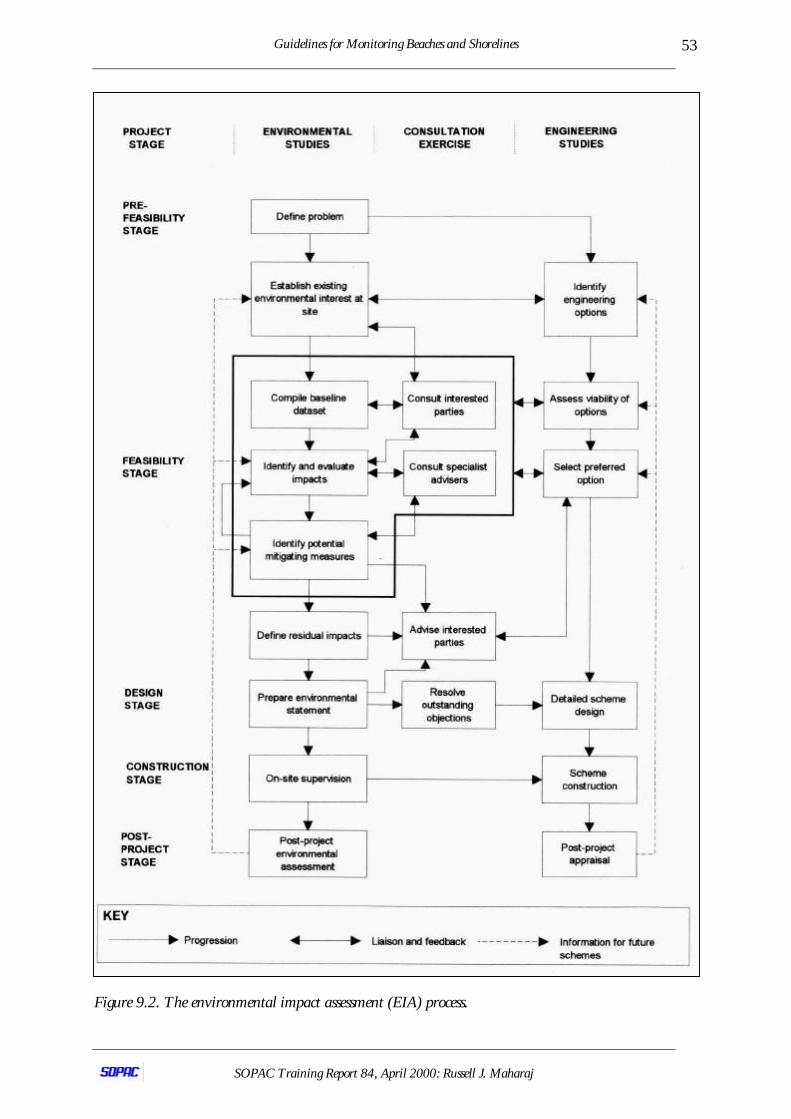
Guidelines for Monitoring Beaches and Shorelines
SOPAC Training Report 84, April 2000: Russell J. Maharaj
53
Figure 9.2. The environmental impact assessment (EIA) process.

Guidelines for Monitoring Beaches and Shorelines
SOPAC Training Report 84, April 2000: Russell J. Maharaj
54
Once impacts have been identified and predicted, it may be necessary to continue the surveywork as a monitoring exercise during the management or construction activity, that any damageto the environment is indeed minimised or that environmental benefits are, in fact, being realised.This will facilitate a rational approach to project planning and environmental management.
On completion of any management or construction activity, it is important to carry outsubsequent monitoring of some or all of the parameters previously surveyed. Such monitoringserves as a basis for comparison with pre-construction conditions. It is also important for assessingthe recovery of a site, following the construction process and/or for assessing any beneficialimpacts, which may have resulted.
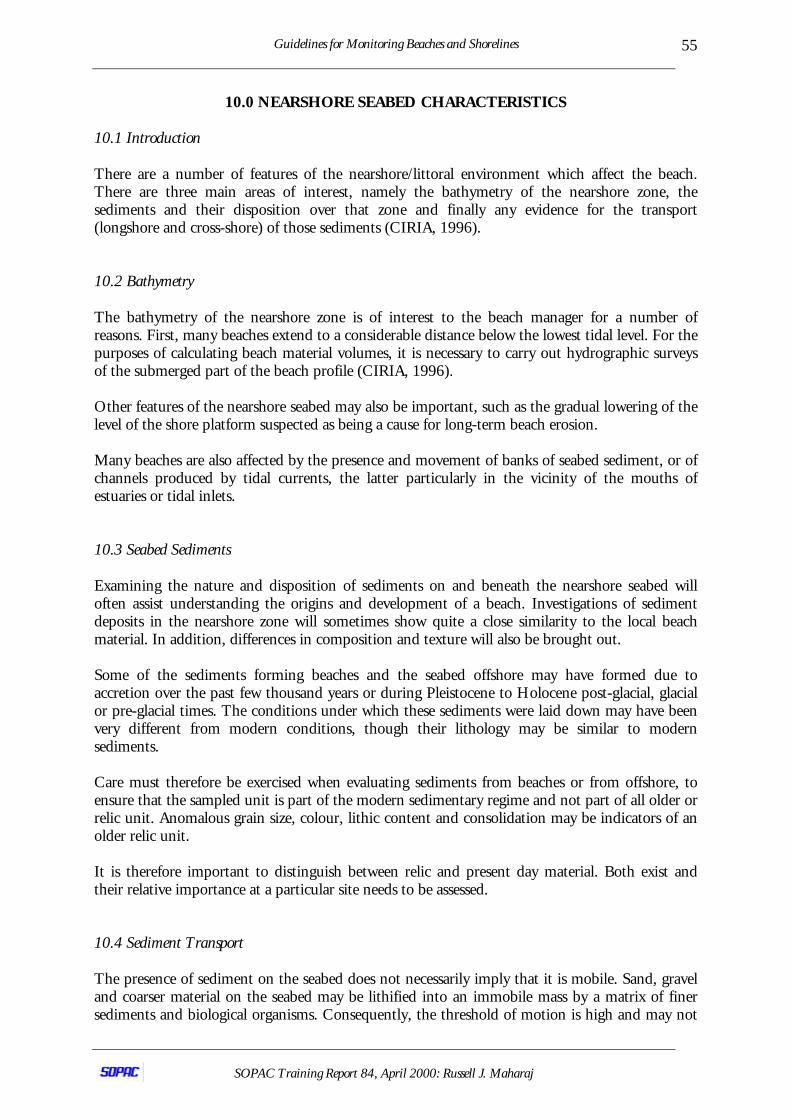
Guidelines for Monitoring Beaches and Shorelines
SOPAC Training Report 84, April 2000: Russell J. Maharaj
55
10.0 NEARSHORE SEABED CHARACTERISTICS
10.1 Introduction
There are a number of features of the nearshore/littoral environment which affect the beach.There are three main areas of interest, namely the bathymetry of the nearshore zone, thesediments and their disposition over that zone and finally any evidence for the transport(longshore and cross-shore) of those sediments (CIRIA, 1996).
10.2 Bathymetry
The bathymetry of the nearshore zone is of interest to the beach manager for a number ofreasons. First, many beaches extend to a considerable distance below the lowest tidal level. For thepurposes of calculating beach material volumes, it is necessary to carry out hydrographic surveysof the submerged part of the beach profile (CIRIA, 1996).
Other features of the nearshore seabed may also be important, such as the gradual lowering of thelevel of the shore platform suspected as being a cause for long-term beach erosion.
Many beaches are also affected by the presence and movement of banks of seabed sediment, or ofchannels produced by tidal currents, the latter particularly in the vicinity of the mouths ofestuaries or tidal inlets.
10.3 Seabed Sediments
Examining the nature and disposition of sediments on and beneath the nearshore seabed willoften assist understanding the origins and development of a beach. Investigations of sedimentdeposits in the nearshore zone will sometimes show quite a close similarity to the local beachmaterial. In addition, differences in composition and texture will also be brought out.
Some of the sediments forming beaches and the seabed offshore may have formed due toaccretion over the past few thousand years or during Pleistocene to Holocene post-glacial, glacialor pre-glacial times. The conditions under which these sediments were laid down may have beenvery different from modern conditions, though their lithology may be similar to modernsediments.
Care must therefore be exercised when evaluating sediments from beaches or from offshore, toensure that the sampled unit is part of the modern sedimentary regime and not part of all older orrelic unit. Anomalous grain size, colour, lithic content and consolidation may be indicators of anolder relic unit.
It is therefore important to distinguish between relic and present day material. Both exist andtheir relative importance at a particular site needs to be assessed.
10.4 Sediment Transport
The presence of sediment on the seabed does not necessarily imply that it is mobile. Sand, graveland coarser material on the seabed may be lithified into an immobile mass by a matrix of finersediments and biological organisms. Consequently, the threshold of motion is high and may not
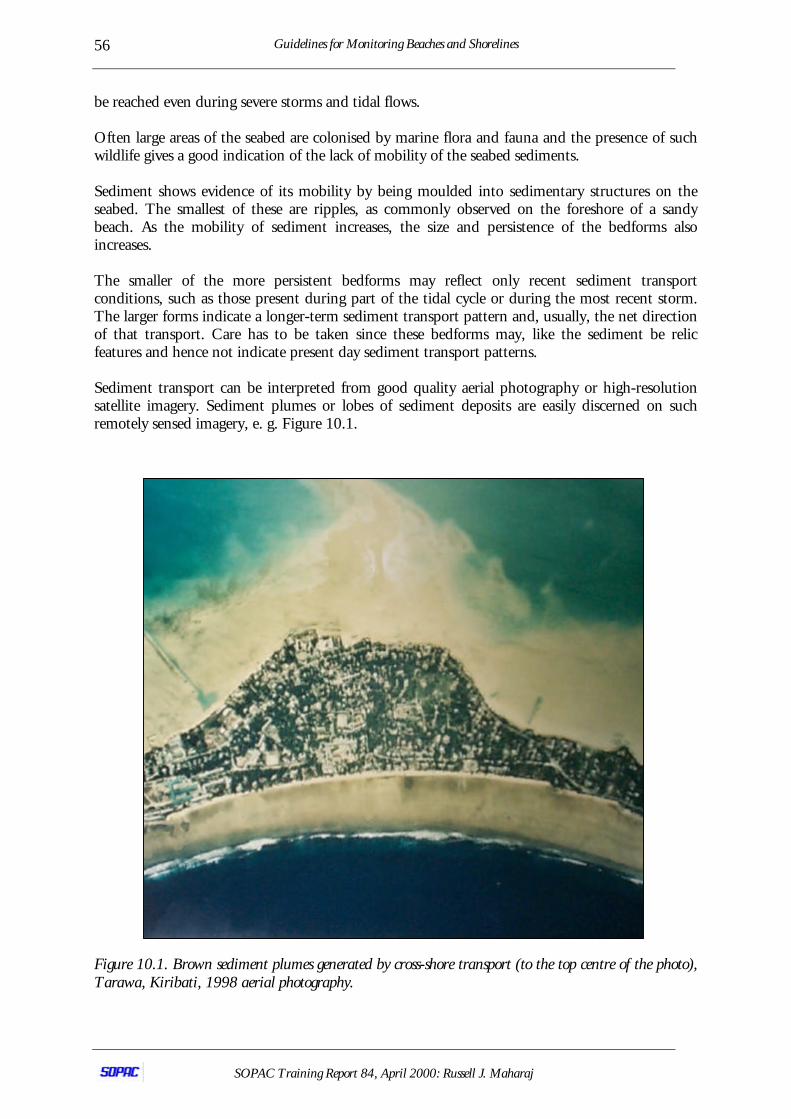
Guidelines for Monitoring Beaches and Shorelines
SOPAC Training Report 84, April 2000: Russell J. Maharaj
56
be reached even during severe storms and tidal flows.
Often large areas of the seabed are colonised by marine flora and fauna and the presence of suchwildlife gives a good indication of the lack of mobility of the seabed sediments.
Sediment shows evidence of its mobility by being moulded into sedimentary structures on theseabed. The smallest of these are ripples, as commonly observed on the foreshore of a sandybeach. As the mobility of sediment increases, the size and persistence of the bedforms alsoincreases.
The smaller of the more persistent bedforms may reflect only recent sediment transportconditions, such as those present during part of the tidal cycle or during the most recent storm.The larger forms indicate a longer-term sediment transport pattern and, usually, the net directionof that transport. Care has to be taken since these bedforms may, like the sediment be relicfeatures and hence not indicate present day sediment transport patterns.
Sediment transport can be interpreted from good quality aerial photography or high-resolutionsatellite imagery. Sediment plumes or lobes of sediment deposits are easily discerned on suchremotely sensed imagery, e. g. Figure 10.1.
Figure 10.1. Brown sediment plumes generated by cross-shore transport (to the top centre of the photo),Tarawa, Kiribati, 1998 aerial photography.
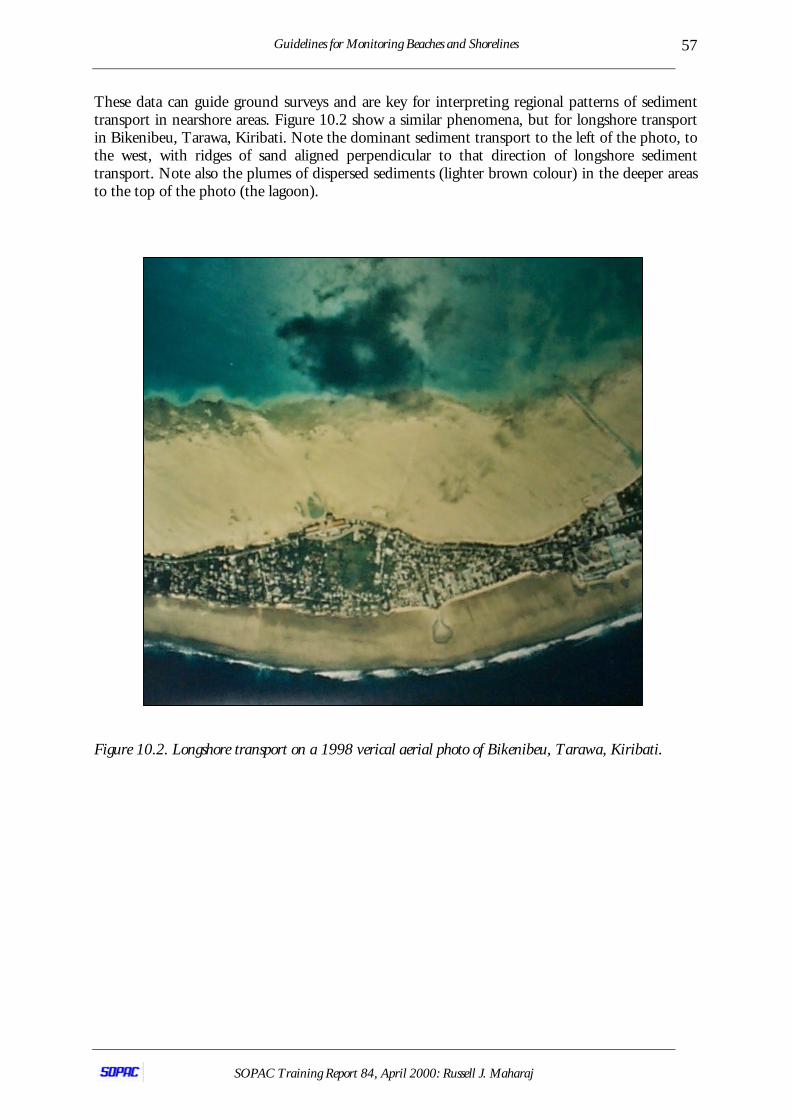
Guidelines for Monitoring Beaches and Shorelines
SOPAC Training Report 84, April 2000: Russell J. Maharaj
57
These data can guide ground surveys and are key for interpreting regional patterns of sedimenttransport in nearshore areas. Figure 10.2 show a similar phenomena, but for longshore transportin Bikenibeu, Tarawa, Kiribati. Note the dominant sediment transport to the left of the photo, tothe west, with ridges of sand aligned perpendicular to that direction of longshore sedimenttransport. Note also the plumes of dispersed sediments (lighter brown colour) in the deeper areasto the top of the photo (the lagoon).
Figure 10.2. Longshore transport on a 1998 verical aerial photo of Bikenibeu, Tarawa, Kiribati.
Guidelines for Monitoring Beaches and Shorelines
SOPAC Training Report 84, April 2000: Russell J. Maharaj
58
11.0 SEA STATE AND OCEANOGRAPHIC DATA COLLECTION
11.1 Introduction
The importance of the hydraulic processes of waves, winds and tides on the development ofbeaches is clearly essential. These are key boundary conditions that affect the development oferosions forces, which cause stress to develop in the littoral environment, causing erosion andland loss. Therefore, characterising these parameters are key items which must be incorporated inany beach monitoring programme.
The initial step is always to establish what information is already available and what informationis likely to be available in future (CIRIA, 1996).
In addition, for the interpretation of beach profile data, the lack of these boundary conditions donot allow proper assessment of the reasons for beach changes, through time and space. This isessential, especially in light of the fact that beach hydraulics is an important element, which affectthe equilibrium of beaches (Figures 11.1 and 11.2). The key processes to note here are follows.
Breaking waves impact and run-up on the beach. Some of it drains downslope, on the beach, dueto gravity, while some of the water seeps into the sediments, also under the influence of gravity.Seepage contributes to the shallow beach water table and then adds to shallow groundwater flow,below the beach, or interflow/thoroughflow. This thoroughflow, will drain downslope, alsotowards the sea, and into the surf zone. However, some of it will also seep to the surface of theseabed. This process is facilitated by high pore-water pressure within the sediments, especially asit is below the seawater level and saturated. This reduces the effective stresses between thesediment grains and causes some buoyancy of the sediment grains and lift forces to develop,eventually resulting in exfiltration of the thoroughflow and dislodgement of sediment particles.This dislodgement causes erosion and removal of sediment in the water column.
11.2 Wave and Current Measurements Near Structures and the Nearshore
The interaction, between waves, currents and coastal structures are complex (see Section 5.7) andnot well-defined in theory. Local beach response is, therefore difficult to predict, even with theuse of numerical or wave tank bed physical models. It is significant to note that models, which aredevelopment, must be a true analogue of the actual physical conditions and correspondingboundary condition. In addition, models must be validated to ensure that they represent trueconditions. This of course can only be done with appropriate site specific data and validationprogrammes. In the absence of such validation, model results may not be useful.
Bearing in mind that the beach is a continuously evolving dynamic environment and is difficultto predict and part of an open system, models which are run for specific temporal and spatialcoverage, are valid only for those coverage. Should site conditions and processes change, then newboundary conditions must be specific and used to re-run the model to obtain the new predictiveanalysis. For that very reason, when not validated, model test results have very limitedapplications.
The experienced practitioner and professional should exercise expert judgement when usingmodel test results, especially those derived from commercial modelling software (written for“global” use).
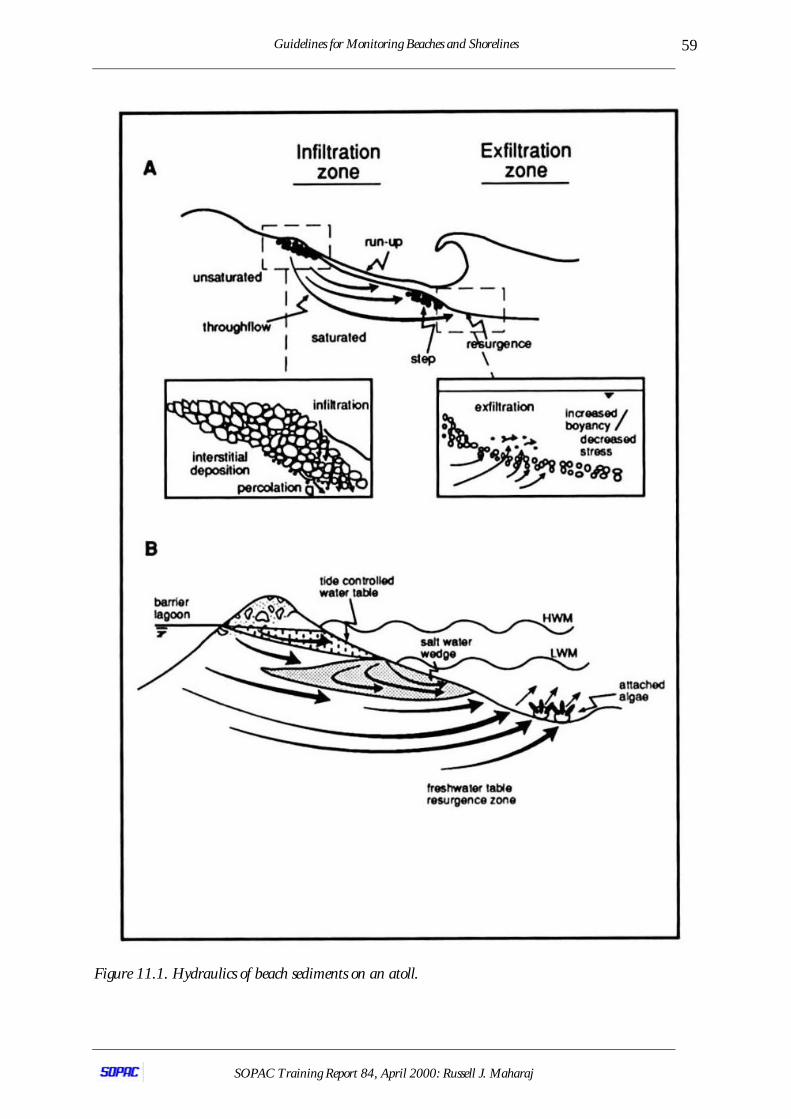
Guidelines for Monitoring Beaches and Shorelines
SOPAC Training Report 84, April 2000: Russell J. Maharaj
59
Figure 11.1. Hydraulics of beach sediments on an atoll.
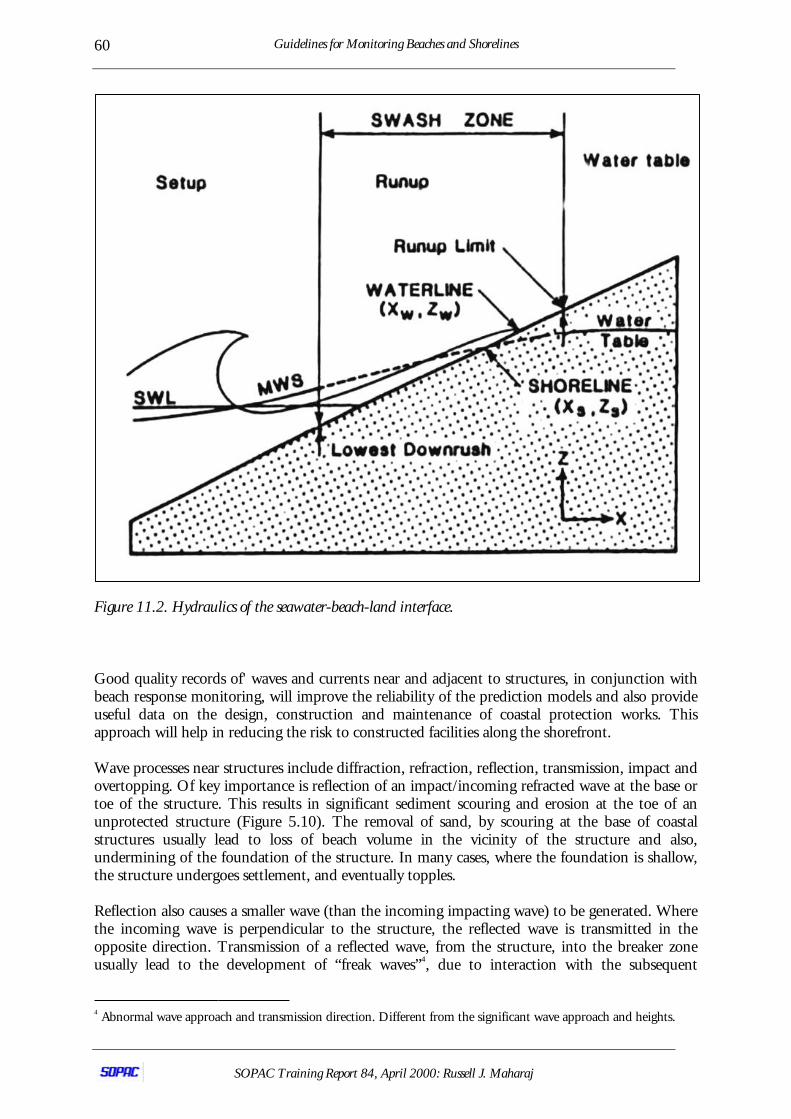
Guidelines for Monitoring Beaches and Shorelines
SOPAC Training Report 84, April 2000: Russell J. Maharaj
60
Figure 11.2. Hydraulics of the seawater-beach-land interface.
Good quality records of' waves and currents near and adjacent to structures, in conjunction withbeach response monitoring, will improve the reliability of the prediction models and also provideuseful data on the design, construction and maintenance of coastal protection works. Thisapproach will help in reducing the risk to constructed facilities along the shorefront.
Wave processes near structures include diffraction, refraction, reflection, transmission, impact andovertopping. Of key importance is reflection of an impact/incoming refracted wave at the base ortoe of the structure. This results in significant sediment scouring and erosion at the toe of anunprotected structure (Figure 5.10). The removal of sand, by scouring at the base of coastalstructures usually lead to loss of beach volume in the vicinity of the structure and also,undermining of the foundation of the structure. In many cases, where the foundation is shallow,the structure undergoes settlement, and eventually topples.
Reflection also causes a smaller wave (than the incoming impacting wave) to be generated. Wherethe incoming wave is perpendicular to the structure, the reflected wave is transmitted in theopposite direction. Transmission of a reflected wave, from the structure, into the breaker zoneusually lead to the development of “freak waves”4, due to interaction with the subsequent
4 Abnormal wave approach and transmission direction. Different from the significant wave approach and heights.
Guidelines for Monitoring Beaches and Shorelines
SOPAC Training Report 84, April 2000: Russell J. Maharaj
61
incoming waves. These cause the development of eddys and bottom currents near the seabed,leading to scouring and erosion of loose sediment. Reflecting waves cause the subsequentimpact/incoming wave to be much larger waves, causing greater scouring when they impact oncoastal structures. Examination of the seaside aspect of coastal structures reveal large sedimentplumes and sediment entrained backwash.
Overtopping is also important, as is run-up, as these phenomena affect coastal flooding, splashand spray way beyond the shorefront. These also cause damage to adjacent structures andinfrastructure by abrasion and scouring (Figure 5.1). In addition, spray and splash lead to damageand deteroriation of concrete structures along the shorefront. This usually results, due to ingressof seawater into the concrete. Most concrete cast with Portland cement (ASTM Type I) are notresistant to chemical attack by sulphate and chloride ions. These ions which are common inseawater, react with cement and cause the precipitation of ettringite, an expansive sulphate,within the concrete matrix. This leads to swell pressure/tensile stress within the concrete, whichdue to its very low/no tensile strength, causes cracking and eventually spalling5 of the concrete(See Section 5.2). Many coastal concrete structures in the Pacific are affected by this process.
Important information on wave processes can also be gathered from direct observation. Thisapplies particularly to overtopping and wave transformation around and through structures. Theuse of digital filed video recording is also very useful. These types of observation are best takenduring high spring tides, or if possible during storm events. Since it is extreme conditions whichcause the most damage, the collection of data during these events are crucial.
If such data is being collected the time of the day, the date, tidal cycle and compass direction ofthe view of the photography should be recorded. In addition, all photographs should have a clearscale. If photography is being taken at different times of the month, of different seasons and years,then the same view direction (compass direction) must be maintained, unless it is impossible, dueto a significant change in the shoreline morphology.
Coastal protection works, which are damaged, should be instrumented and damage intensitiesnoted. Failure analysis/forensic engineering is an important tool for optimising design in thefuture. In addition, learning from missed predictions and oversights in design is one of the bestways of improving the effectiveness of coastal protection works. Instrumentation can be fromsimple scour and abrasion measurements, including surface area, depth, volume and locationalong the structure to more complex structural cross sections and profiles of the structure. Inaddition, settlement and tilting of structures, like large breakwater and wharf segments can beinstrumented with inclinometers and settlement gauges. Displacement in the X and Y planes canbe surveyed with precise levels, theodolites or high-resolution differential GPS.
Measuring and observing currents around structures can be undertaken more easily than wavemeasurements. They can be measured over time at discrete points or as flow paths. Ameasurement programme that combines both methods is most appropriate in the presence ofstructures (CIRIA, 1996).
Flow paths can be monitored by deploying surface floats, drifters or sub-surface drogues. Thesecan be anything from oranges to PVC buoys to sophisticated devices which can be tracked byradar or other electronic pulse signalling systems.
As the purpose of monitoring is to provide flow velocity and corresponding vector data forpredicting beach response, then sub-surface drogues are more useful as they follow near-seabed
5 Flaking of the surface of concrete after cracking.
Guidelines for Monitoring Beaches and Shorelines
SOPAC Training Report 84, April 2000: Russell J. Maharaj
62
current flow, rather than surface flow. For deeper nearshore areas, like atoll reef lagoons (greaterthan 15 m), there are in many cases clearly differentiated surface, mid-water and bottom currentflows. It is important to identify from early on, which currents are crucial to your programdesign. Not all measurements may be needed.
Apart from drifter and drogue studies, current metres may be used to assess flow velocities anddirection. If a large array of meters are available for deployment at various depths in the watercolumn and for a full spatial coverage, a good representation of 3-D flow can be obtained.However, where this is commonly not the case, then drogue and drifter studies are crucial foradequate spatial and temporal tidal coverage. In many cases, one of two current metres deployedin atoll lagoons cannot give good representation of current flow vector and magnitude. In thoseinstances, it is more desirable to use a large array of drogues than one or two metres only. Thatspatial and temporal coverage will more than likely produce better results, than the data from asingle metre. This is bearing in mind the varied nature of seawater flow in surface, mid andbottom layers, under rising and falling tides and under varied wind and wave set-up.
Single-point measurements can be made by deploying directional current meters for one or twoor more (depending on needs) spring and neap-tidal cycles. Current monitoring must becombined with measurements of incident wave heights, approach and period (storm waves, swellsand wind waves), water levels, wind velocities and directions.
In almost all cases, a combination of current metres and drogues and drifter is desirable. Wherecurrent metres are not available, as in many Pacific islands; excellent data can be procured fromdrifter and drogue studies. For such programmes, it is necessary to obtain accurate position andtime and the various trajectories the drogue or drifter takes. This can be done with the aid of ahigh-resolution differential GPS and proper timer. Where GPS is not available a theodolite isexcellent. In addition, navigation equipment can be used for more remote offshore locations.
It is important to consider that the accuracy of positioning depends on the model and resolutionof the survey equipment. For high-resolution studies, it is necessary to use high-resolution surveyequipment. For regional and general studies, lesser accuracy is tolerable, though not desirable.
Site-specific studies using equipment with low resolution in the X and Y planes (like 100 m) maynot be very useful. It is important to select the appropriate tools for the particular job. Too often,this is a major problem in project execution and yields poor-quality results and interpretation.The frequent problem of trying to solve site-specific problems with regional and general or lowresolution data can be avoided, if these aspects are considered at the project planning stage.
For the above mentioned reasons, the field programme must be extensive enough to allow tidalcurrents to be monitored over complete ebb and flood-cycles, on both spring and neap tides, andmust allow observation of currents over a “substantial area.” The “substantial area” is ideally thecirculation cell of the littoral environment being investigated. This represents the systemapproach to process studies. For that reason, it is important to identify the extent of coastalcirculation cells or the discreteness of littoral systems in the area of interest. If this is notidentified, then the instrumentation programme will not be optimised.
Where possible, the programme should also attempt to monitor wave-induced currents, whichare generally only of interest close to the structure. The adoption of such a process will facilitate arational approach to understanding the dynamics of the area of interest.
Guidelines for Monitoring Beaches and Shorelines
SOPAC Training Report 84, April 2000: Russell J. Maharaj
63
12.0 GEOTECHNICAL DATA COLLECTION
12.1 Introduction
The principal objective in undertaking geotechnical data collection for a beach managementproject is to derive a comprehensive understanding of the engineering-geological andgeomorphological make up of the coast, beach and foreshore areas.
Such information will be used to:
1. Facilitate analysis of coastal processes (e.g. to assess engineering performance ofsoils or the nature of processes that contribute to their distribution),
2. Aid in the assessment of coastal erosion and deposition patterns,3. Assessment of the hydraulic properties of sediments and soils, and4. Provide input parameters and geotechnical boundary conditions for the design
of foundations, reclamation and fill works.
Some geotechnical parameters are presented in Figure 9.1.
12.2 Site investigation
Good site/ground investigation practice follows standard procedures6. These guidelines can besummarised to four easily definable steps which are now described in turn.
12.2.1 Desk study
The purpose of' a desk study is to assemble all the available existing and published data on aparticular site for the project. This is the first part of the data collection exercise for any projectwhich is done. Of particular interest in the preliminary phases of an investigation for a beachmanagement project are:
1. Published technical papers, journals, books, reports and theses,2. Present-day and historical Ordnance Survey topographic maps3. Cadastral maps (showing property ownership and layout),4. Geological maps and memoirs,5. Soil survey reports and maps,6. Admirality and hydrographic charts,7. Recent and historical aerial photographs,8. Satellite imagery (high-resolution, appropriate to the project needs),9. Consultant reports from previous engineering developments,10. Any geotechnical model data from previous studies,11. Local Government information (library and museum records) and12. Existing ground investigations.
6 There are several standards available. Use internationally accepted guidelines which can be repeated by anyone inthe future e.g. ASTM.
Guidelines for Monitoring Beaches and Shorelines
SOPAC Training Report 84, April 2000: Russell J. Maharaj
64
12.2.2 Site Reconnaissance
A rigorous visual examination of the site should be undertaken at the earliest opportunity and becarried out by a suitably qualified and experienced geotechnical engineer or engineering geologist.
A site reconnaissance is best performed on foot and it is essential to carry a site or district planwhich can be marked with observations as the reconnaissance progresses.
Particular attention should be paid to omissions or alterations to the features described on mapsor plans, including topographical, geological or man made. Photographs taken during a sitereconnaissance often identify details missed by the naked eye and are always more cost effectivethan a return visit.
Detailed observations should be made of the nature and characteristics of the exposed strata onthe beach, foreshore or coastal cliff and a preliminary judgement made on the susceptibility of theforeshore strata to erosion. Any evidence of surface water, springs or groundwater flow should berecorded.
12.3 Detailed Examination and Special Studies
Based on the results of the site reconnaissance and the data available from the desk study, anevaluation will be made of the need for a more detailed examination or special study of theground conditions, geology or geomorphology. The most appropriate methodology will bedetermined by the scope of the project, problems to be addressed and available budget.
Further detailed examination might include, topographic surveys, geological mapping, aerialphotography, and more rarely, geophysical surveys.
The desk study and site reconnaissance may have revealed that a more detailed groundinvestigation is required with field work incorporating the drilling, logging and sampling ofboreholes and trial pits.
12.4 Interpretation
The final step of the investigation is to assimilate, review, correlate and interpret all the recovereddata. The key factors that may affect design decisions will be:
1. The lateral extent and depth of beach deposits,2. The geotechnical properties of the beach deposits and underlying material,3. Characteristics of beach substrata, their origin and weathering profile,4. Coastal cliff or beach stability and rates of erosion,5. Beach water table, and6. Tidal lag in the variation in groundwater levels, saline intrusion and
groundwater conditions.
Guidelines for Monitoring Beaches and Shorelines
SOPAC Training Report 84, April 2000: Russell J. Maharaj
65
13.0 DATA STORAGE AND ANALYSIS
13.1 Introduction
To manage a beach successfully, an accurate picture of the actual response of the coastal processesis required.
Data are required in four (4) key areas:
1. Understanding the past: data are required to identify short-term variability andlong-term trends,
2. Identification of present problems: data are required to monitor alarm levels3. Predicting the future solution: data are required to calibrate and validate
physical and numerical models for future solutions and4. Monitoring the future solution: data are required to monitor the solution,
particularly with soft engineering schemes (CIRIA, 1996).
The collection of data in a dynamic system, such as a beach, is necessarily a continuous task as thesystem state and response are continuously changing. It involves measuring a large number ofvariables over a larger geographic area than of immediate concern to the present-day manager.The result is that, in well planned monitoring programmes, a large amount of data will becollected from a variety of sources. It is, therefore, essential to plan carefully the storage of thesedata in a form which makes further query and analysis most efficient. The following is based onguidelines from CIRIA (1996).
13.2 Software
Many people are familiar with spreadsheet programs, such as Microsoft Excel, and it is possible todevelop worksheets to perform required tasks. Visualisation of the data is extremely easy, howevernumeric and report analysis is more difficult. The disadvantage is that spreadsheets are notoptimised to manipulate large amounts of data. As the database increases in size the speed of thespreadsheet may be reduced. In addition, spreadsheets lack some of the functionality associatedwith database programs.
CAD programs can be used to store information with geographical locations plus details of'attributes. The presentation of geographical data is very easy. Other types of display, such as timeseries and comparison between variables is more difficult. The database functionality of CADprograms may be limited.
Both spreadsheet and CAD programs are simple and flexible; however they are more limited infunctionality that a bespoke database with routines written specifically to analyse and presentbeach data. This may also include simple predictive models to allow the identification of alarmlevels and forecasting of future beach response, such as future beach volumes and level.
13.3 Geographical Information Systems (GIS)
A GIS is a software package for the acquisition, storage, retrieval, manipulation and analysis of
Guidelines for Monitoring Beaches and Shorelines
SOPAC Training Report 84, April 2000: Russell J. Maharaj
66
spatially referenced data. The most sophisticated GISs are expensive and require considerableprocessing power and storage capacity, whilst basic systems are also available for use on desktopPCs at a modest cost.
Despite this wide cost range, all systems are based on two essential components:
1. A database capable of' storing and retrieving information about the mappeddata, which is referenced by (geographical position and other search criteria.Some systems include an internal database but most now include interfaces toexternal relational database (RDBMS).
2. A visualisation system capable of displaying spatially-referenced data (e.g.maps) and interrogating the mapped data for co-ordinate information. Othergraphics, such as graphs, photographs and video images may also be displayed.
It is important to distinguish how a GIS represents data, either as raster or vector, and also todistinguish whether the data are structured or unstructured. The method of representation isfundamental to the type of information that can be recorded and the analysis that is possible.
The functionality of the GIS must be considered when selecting a GIS system. Again, there mustbe a clear understanding of the proposed use before a system is purchased and of how, and bywhom, the system will be maintained, updated and accessed.
13.4 Data input
There is a large number of different data storage and transfer formats, both for raster and vectordata. It is essential that the input and output formats supported by the selected GIS arecompatible with those used by external suppliers of data (e.g. OS map format). Similarly, theability to input and output Data Exchange Format (DXF) files allows a direct interaction withComputer assisted Design (CAD) packages.
The GIS must also provide efficient methods for inputting data derived from site surveys andmodelling studies. This information could be in the form of figures, photography, maps, tables,text as well as computer files.
13.5 Data management and processing
Before data input to a GIS can be analysed for a particular purpose it is usually necessary toperform some type of pre-processing. This may include co-ordinate transformation, rescaling,joining, clipping and edge-matching of polygons, conversion to raster data or to vector data.
Guidelines for Monitoring Beaches and Shorelines
SOPAC Training Report 84, April 2000: Russell J. Maharaj
67
13.6 Data analysis
Examples of standard GIS spatial analysis functions based on vector data are:
1. Area and perimeter calculations,2. Overlaying and merging of polygons,3. Summing of spatially coincident values,4. Generation of Thiessen polygons (assigning area characteristics using point
data),5. Buffering of features (defining zones of influence around a point, line or area)
and6. Point-in-polygon (the geographical occurrence of one feature within another).
13.7 Database operations
The ability to carry out spatial queries is what differentiates a GIS from conventional databases.These processes include simple data retrieval using spatial delimiters (windows or proximitymeasures) and Boolean operators (AND, OR, NOT, etc.) to locate, display and tabulate caseswhere particular conditions are satisfied.
The following questions are typical of the types of queries a GIS may be used to perform:
1. Are there any wave measurements within 10 km of this location?2. What are the seabed surface deposits at this location?3. Where is survey station 24-B?4. What type of sea wall is at this location?5. What type of sediments are found near revetments?
13.8 Three-Dimensional Surface Modelling
Surface modelling can provide three-dimensional representation of recorded data or modeloutput. This may be used for further analysis such as contouring, slope analysis and volumeestimation (e.g. volume above some threshold such as (MHWS) or for visualization purposes.
13.9 Applications
It is vital to recognise that whatever GIS product is selected, for whatever application, that thebasic GIS functions, described above, must be used to build the specialist processes needed tomeet the requirements of that application. This may involve building links between the GIS andexternal software and numerical models. It may also be necessary to develop completely newfunctions tailored to a particular application.
Guidelines for Monitoring Beaches and Shorelines
SOPAC Training Report 84, April 2000: Russell J. Maharaj
68
14.0 APPRAISAL OF MONITORING RESULTS
14.1 Introduction
The principal objective of the monitoring described above is to provide information of value inthe efficient management of a beach. More precisely, this involves:
1. Reviewing, the information obtained,2. Deciding what further monitoring is necessary and3. Deciding whether any (different) management of the beach is necessary.
14.2 Review of information obtained
A first step in appraising a monitoring exercise is to decide whether the required information hasactually been collected and whether it has then been analysed and the results made available tothe correct audience. In this context, it is important to have a clear statement of the requirementsof a monitoring exercise beforehand, by means of a pre-determined set of quality criteria. Inmany cases, specialist advice on the initial specification of surveys should be sought before startingmonitoring.
It is equally important that any information collected should be analysed promptly and the resultsof that analysis stored safely, as well as the information itself. The former requirement allowspossible re-surveying to be carried out if results are unusual (e.g. in comparison to other surveys.).The latter is often neglected, but it is important in the context of beach management since it maybe many years before the full value of a data set can be appreciated.
Long-term trends in beach levels, for example, may be effectively masked by the effects of a fewyears of untypical weather. As already noted, therefore great care is required in selectingappropriate baseline and monitoring beach profile "envelopes".
It is therefore best to set up, at the same time as setting up the monitoring programme and as partof' the beach management strategy, a clearly-defined approach to analysis of results.
Finally, as with many other aspects of beach management, it is likely that the cost effectiveness ofa monitoring exercise will come under scrutiny from time to time. Much of the value inmonitoring lies in its ability to demonstrate the behaviour of a beach to a wide audience, perhapsto provide reassurance that a particular management strategy is succeeding, or to show that otheraction needs to be taken.
14.3 Deciding on further monitoring
If a beach is being actively managed, for example by periodic nourishment or recycling, somebeach monitoring is likely to be carried out indefinitely. In a few other situations, however, amonitoring campaign may only need to last for a limited period. For example, with pocketbeaches; although this does not eliminate the possibility of repeating such a campaign at somestage in the future.
In practice, the decision about the nature and frequency of further monitoring will depend bothon what is monitored and the specific character of the site.

Guidelines for Monitoring Beaches and Shorelines
SOPAC Training Report 84, April 2000: Russell J. Maharaj
69
15.0 LECTURES
15.1 Appraisal and Management of Erosion Risks in Coastal Engineering and Management
70 Guidelines for Monitoring Beaches and Shorelines
SOPAC Training Report 84, April 2000: Russell J. Maharaj
Slide 1
A P P R A I S A L & M A NA G E M E NT OFE R OSION RISKS IN COASTALENGINEERING AND MANAGEMENT
Rus s e ll J . Maharaj , Ge o lo g is t & Eng ine e r
Commonwea l t h S e c r e ta r ia t /CF TC Expert
Sou th Pac i f i c App l i ed Geo s c i enc e Commi s s i on (SOPAC)
Suva, F iji
M S 2 1 1 - U S P , F ijiM S 2 1 1 - U S P , F ijiN e a r s h o r e N e a r s h o r e E nvironmentE nvironment
and C oas ta l E ng ineeringand C oas ta l E ng ineering2 7 th-31st M a r c h 2 0 0 02 7 th-31st M a r c h 2 0 0 0
Guidelines for Monitoring Beaches and Shorelines
SOPAC Training Report 84, April 2000: Russell J. Maharaj
71
Slide 2
SCOPE OF THE LECTURESCOPE OF THE LECTURE
++ What is coastal management andWhat is coastal management andengineering?engineering?
++ Concept of risk?Concept of risk?
++ What is risk assessment and management?What is risk assessment and management?
++ Why do we need to evaluate risk?Why do we need to evaluate risk?
++ How do we evaluate risks?How do we evaluate risks?
++ Approaches to risk management?Approaches to risk management?
Guidelines for Monitoring Beaches and Shorelines
SOPAC Training Report 84, April 2000: Russell J. Maharaj
72
Slide 3
COASTAL ENGINEERINGCOASTAL ENGINEERING
b Coastal engineering is the collective termencompassing most of the engineering activitiesrelated to works along the coasts: coastalmorphology and hydraulic s , harbour and offs horeengineering.
b Among the problems facing the coastal engineerare, the interactions between moving water andloose beach and sea bed materials, and thehydrodynamic forces exerted by waves andcurrents on various constructions.
Guidelines for Monitoring Beaches and Shorelines
SOPAC Training Report 84, April 2000: Russell J. Maharaj
73
Slide 4
PERCEPTION OF RISK?PERCEPTION OF RISK?
++ People perceive risks differently ,People perceive risks differently ,depending on the likelihood of a hazarddepending on the likelihood of a hazardhaving adverse effects; how widespread,having adverse effects; how widespread,familiar, and dreaded the effects are;familiar, and dreaded the effects are;how a hazard affects indiv iduals personallyhow a hazard affects indiv iduals personallyand whether they have agreed to bear theand whether they have agreed to bear therisks.risks.
Guidelines for Monitoring Beaches and Shorelines
SOPAC Training Report 84, April 2000: Russell J. Maharaj
74
Slide 5
WHAT IS RISK?WHAT IS RISK?
++ Risk is defined as the po ssibility o f sufferin gRisk is defined as the po ssibility o f sufferin gharm from a hazard.harm from a hazard.
++ A hazard is a source o f r i sk and re fers to aA hazard is a source o f r i sk and re fers to asubstanc e , or ac t ions that can c ause harmsubstanc e , or ac t ions that can c ause harm ..
Guidelines for Monitoring Beaches and Shorelines
SOPAC Training Report 84, April 2000: Russell J. Maharaj
75
Slide 6
THE NEED TO MANAGETHE NEED TO MANAGECOASTAL RISKSCOASTAL RISKS…..WHY ?…..WHY ?
++ Historically, the coast is an area ofHistorically, the coast is an area ofconcentration of social & economicconcentration of social & economicactivities.activities.
++ Most country development takes place inMost country development takes place inthe coastal zone.the coastal zone.
++ In the Pacific, almost all countries areIn the Pacific, almost all countries areinsular and entirely coastal by definitioninsular and entirely coastal by definitionand system interaction.and system interaction.
++ There is a need to manage investments.There is a need to manage investments.

Guidelines for Monitoring Beaches and Shorelines
SOPAC Training Report 84, April 2000: Russell J. Maharaj
76
Slide 7
THE UNCERTAIN SEATHE UNCERTAIN SEA
++ Typhoons , cyc lone s and s tormsTyphoons , cyc lone s and s torms
Guidelines for Monitoring Beaches and Shorelines
SOPAC Training Report 84, April 2000: Russell J. Maharaj
77
Slide 8
COASTAL RISKS…..COASTAL RISKS…..HAZARDS INVOLVED?HAZARDS INVOLVED?
++ The variability and vagaries of storms, waves,The variability and vagaries of storms, waves,winds, swells, currents, tides and surges.winds, swells, currents, tides and surges.
++ The need to work in water rather than onThe need to work in water rather than onfirm ground.firm ground.
++ The lack of adaptation of land-based clients,The lack of adaptation of land-based clients,contractors, designers, insurers, procedurescontractors, designers, insurers, proceduresand contracts to these special circumstances.and contracts to these special circumstances.
Guidelines for Monitoring Beaches and Shorelines
SOPAC Training Report 84, April 2000: Russell J. Maharaj
78
Slide 9
WATERLEVELS - IWATERLEVELS - I
b Fluctuations of the water levels (vertical tide) canbe computed from the predictions made bycountry Hydrographic Services.
b For estimation of extreme high (or low) levels, thesame tidal constants as used.
b An extreme tidal level is given by adding theamplitudes of the known tidal constituents withregard to Mean Sea Level (MSL).
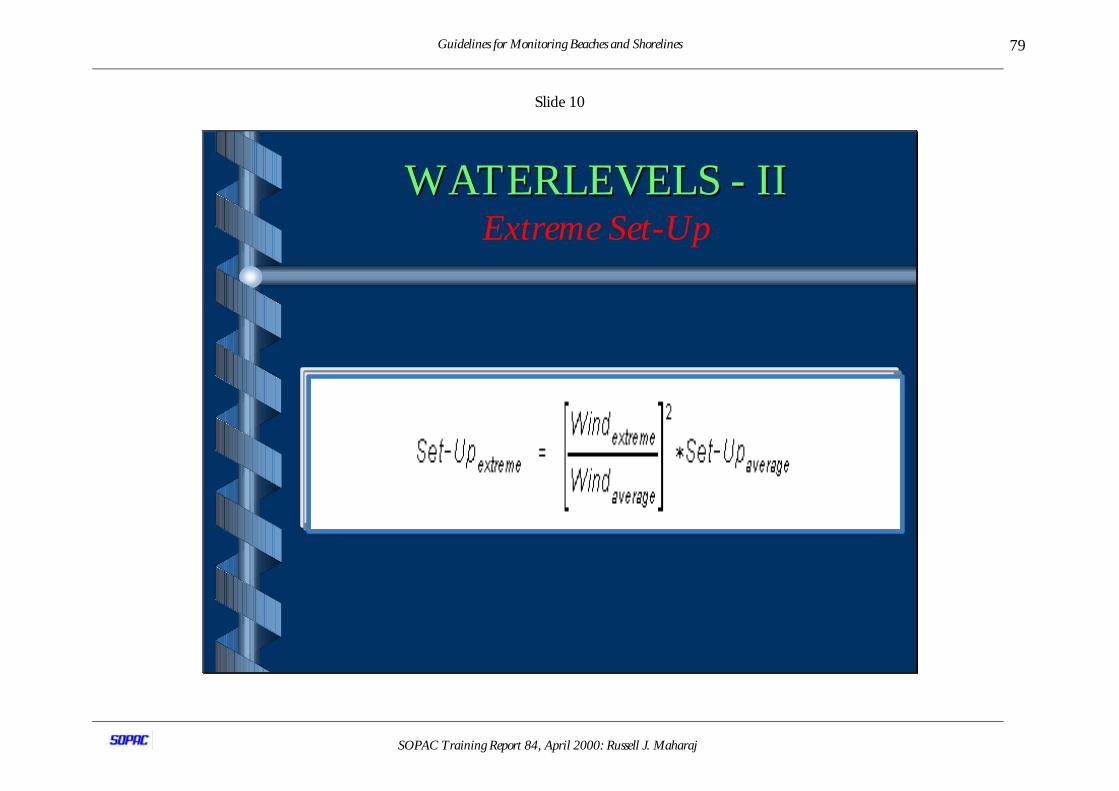
Guidelines for Monitoring Beaches and Shorelines
SOPAC Training Report 84, April 2000: Russell J. Maharaj
79
Slide 10
WATERLEVELS - IIWATERLEVELS - IIExtreme Set-Up
Guidelines for Monitoring Beaches and Shorelines
SOPAC Training Report 84, April 2000: Russell J. Maharaj
80
Slide 11
CURRENTS - ICURRENTS - I
b Tidal currents are measured and predicted at onlyvery few places.
b Information on tidal currents for a certain locationcan be obtained by direct measurements of thevelocities.
b These velocities change from day to day, whilealso the coastal works to be executed can givechanges.
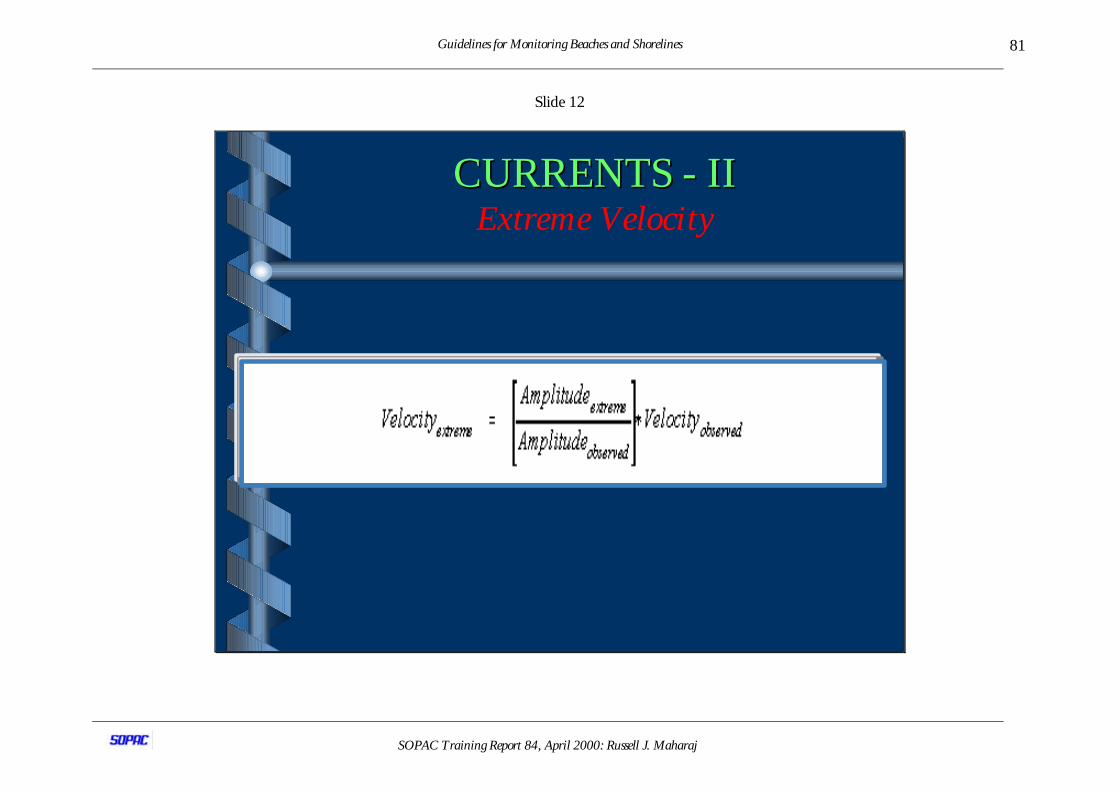
Guidelines for Monitoring Beaches and Shorelines
SOPAC Training Report 84, April 2000: Russell J. Maharaj
81
Slide 12
CURRENTS - IICURRENTS - IIExtreme Velocity
Guidelines for Monitoring Beaches and Shorelines
SOPAC Training Report 84, April 2000: Russell J. Maharaj
82
Slide 13
TIDAL COMPUTATIONSTIDAL COMPUTATIONS
b In this section the meaning of tidal computationsis that one computes water levels, especiallycurrents using some kind of mathematical model.
b Tidal computations can be used to calculate waterlevels and velocities for existing or for newsituations. They are based on a numerical solutionof the so-called long wave equations. A tidalmodel always has to be calibrated with measureddata in order to proof that the model is reliable.
Guidelines for Monitoring Beaches and Shorelines
SOPAC Training Report 84, April 2000: Russell J. Maharaj
83
Slide 14
TIDAL MEASUREMENTS - ITIDAL MEASUREMENTS - I
b Tidal measurements can be focussed on waterlevel or velocities or both and can be very simpleor very advanced.
b Measurement of a water level can be done with awooden pole on which a ruler is attached. Thereadings are written down every 15 or 30 minutes.
b When water level information at a certain locationis needed only once, there is no reason to do itmore advanced.
Guidelines for Monitoring Beaches and Shorelines
SOPAC Training Report 84, April 2000: Russell J. Maharaj
84
Slide 15
TIDAL MEASUREMENTS - IITIDAL MEASUREMENTS - II
b When statistical information on water levels isneeded, an automatic device can be applied whichrecords the water level over a long period.
b HWST, HWNT, MSL, LWNT, LWST,LAT/DATUM…Extreme events.
b Velocities can be measured with a floating pieceof wood and a stopwatch or a electronic gauge.
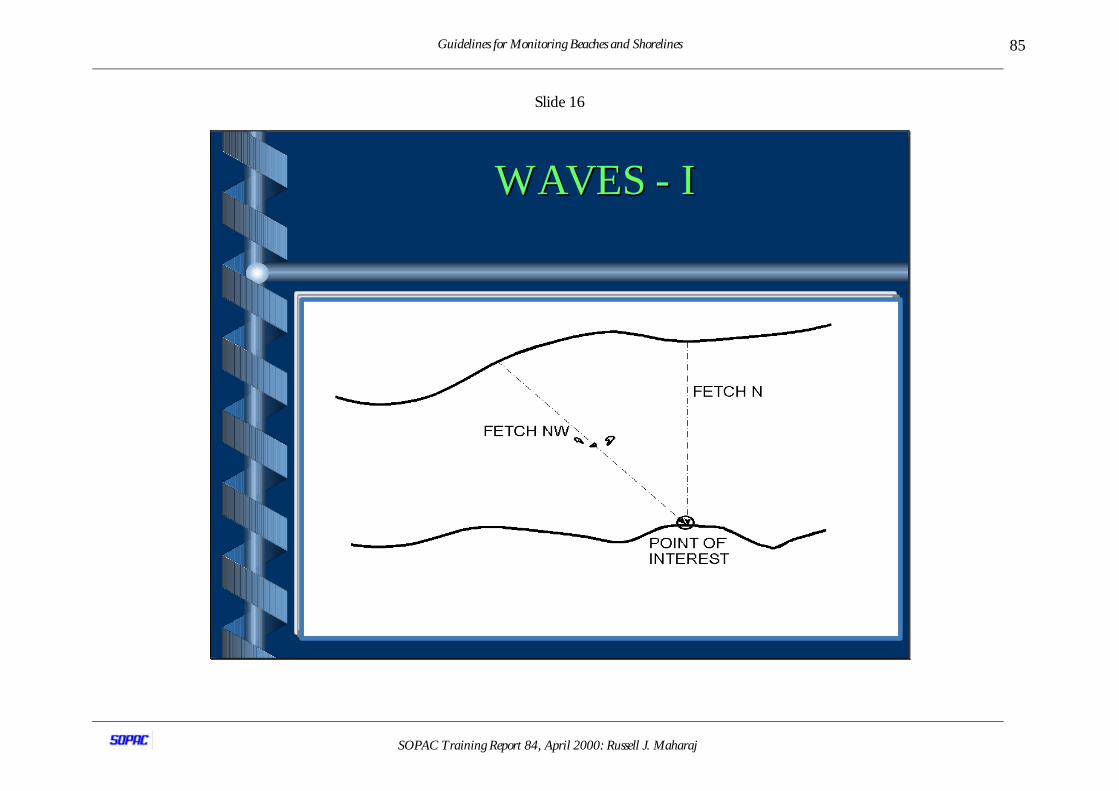
Guidelines for Monitoring Beaches and Shorelines
SOPAC Training Report 84, April 2000: Russell J. Maharaj
85
Slide 16
WAVES - IWAVES - I
Guidelines for Monitoring Beaches and Shorelines
SOPAC Training Report 84, April 2000: Russell J. Maharaj
86
Slide 17
WAVES - IIWAVES - IIWaves and Swells
+ "Fresh" waves are usually named wind waves, whilewaves from other areas are called swells. The length ofwater where the wind can blow freely is the fetch.
+ Swells are not related to local wind. Swells areimportant, since the period is usually large, and cancause much shoaling. Also the breaker parameterdiffers considerably from "fresh" wind waves, whichcan be important in stability relations. Swell data canonly be collected with direct wave measurements atthe point of interest.
Guidelines for Monitoring Beaches and Shorelines
SOPAC Training Report 84, April 2000: Russell J. Maharaj
87
Slide 18
WAVES - IIIWAVES - IIIBreaker Parameter
+ The breaker parameter, gives the relation betweenthe steepness of the shore and the steepness of thewaves.
+ It determines the type of wave breaking on the shoreand is important in several stability relations.
+ The steepness of the shore is expressed as thetangent of the slope: tan a.
+ The wave steepness is given by Hs/Lo. Hs is the so-called significant wave height and Lo the deep waterwave length.
Guidelines for Monitoring Beaches and Shorelines
SOPAC Training Report 84, April 2000: Russell J. Maharaj
88
Slide 19
WAVES - IVWAVES - IVShoaling
+ Waves slow when they reach shallow water. If nobreaking occurs, the energy of a single wave remainconstant.
+ Slower waves are by definition shorter waves. Thisimplies that the energy of the wave has to becompressed in a shorter distance.
+ Consequently the wave becomes higher. This processof becoming higher due to the slowing down of thewave is called shoaling.
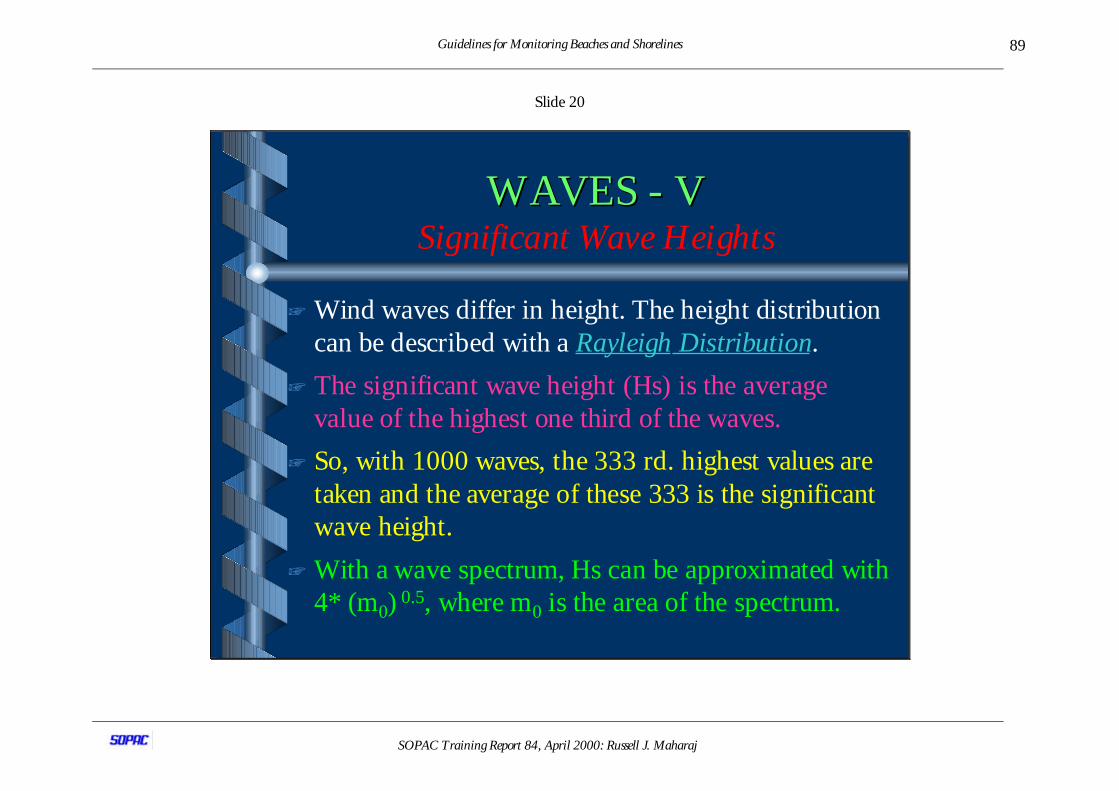
Guidelines for Monitoring Beaches and Shorelines
SOPAC Training Report 84, April 2000: Russell J. Maharaj
89
Slide 20
WAVES - VWAVES - VSignificant Wave Heights
+ Wind waves differ in height. The height distributioncan be described with a Rayleigh Dis tribution.
+ The significant wave height (Hs) is the averagevalue of the highest one third of the waves.
+ So, with 1000 waves, the 333 rd. highest values aretaken and the average of these 333 is the significantwave height.
+ With a wave spectrum, Hs can be approximated with4* (m0) 0.5, where m0 is the area of the spectrum.
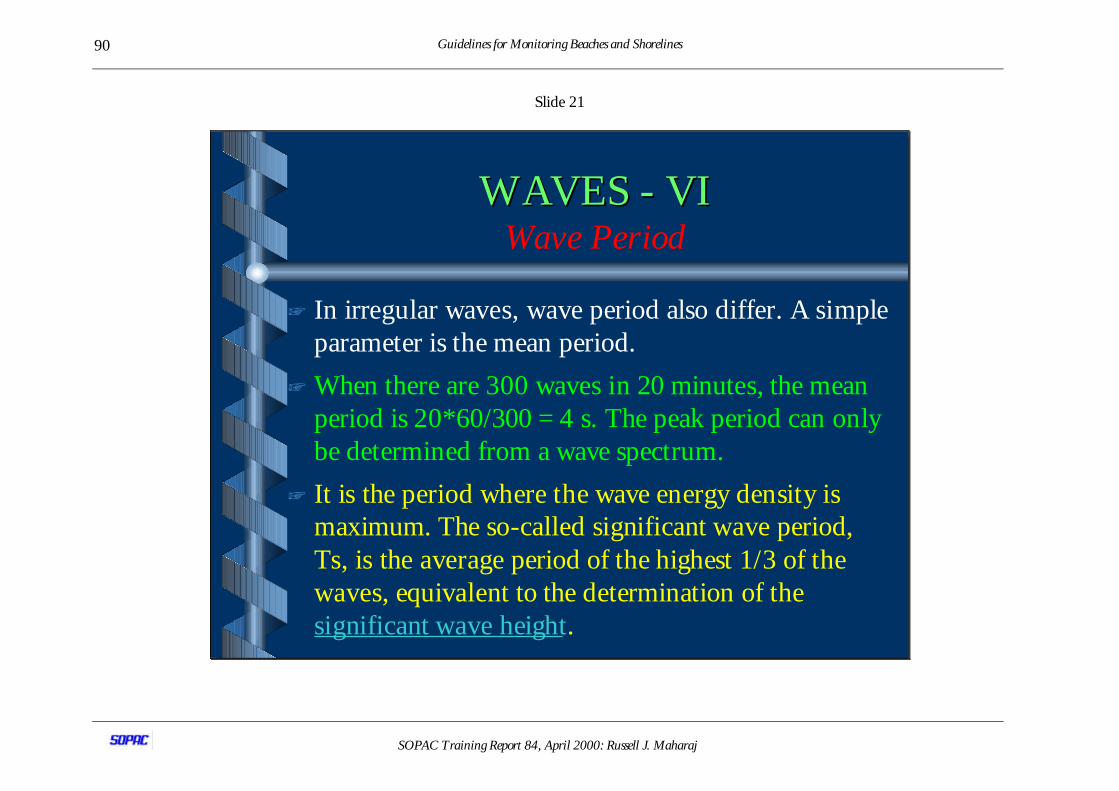
Guidelines for Monitoring Beaches and Shorelines
SOPAC Training Report 84, April 2000: Russell J. Maharaj
90
Slide 21
WAVES - VIWAVES - VIWave Period
+ In irregular waves, wave period also differ. A simpleparameter is the mean period.
+ When there are 300 waves in 20 minutes, the meanperiod is 20*60/300 = 4 s. The peak period can onlybe determined from a wave spectrum.
+ It is the period where the wave energy density ismaximum. The so-called significant wave period,Ts, is the average period of the highest 1/3 of thewaves, equivalent to the determination of thesignificant wave height.
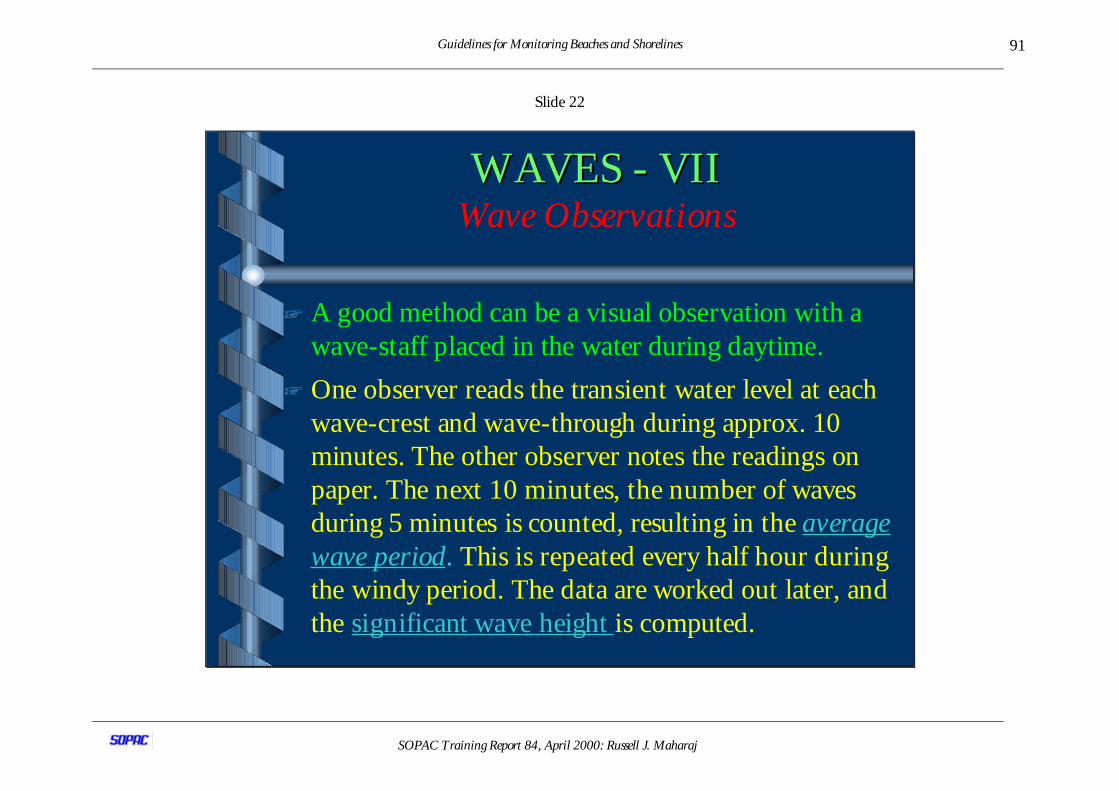
Guidelines for Monitoring Beaches and Shorelines
SOPAC Training Report 84, April 2000: Russell J. Maharaj
91
Slide 22
WAVES - VIIWAVES - VIIWave Observations
+ A good method can be a visual observation with awave-staff placed in the water during daytime.
+ One observer reads the transient water level at eachwave-crest and wave-through during approx. 10minutes. The other observer notes the readings onpaper. The next 10 minutes, the number of wavesduring 5 minutes is counted, resulting in the averagewave period. This is repeated every half hour duringthe windy period. The data are worked out later, andthe significant wave height is computed.

Guidelines for Monitoring Beaches and Shorelines
SOPAC Training Report 84, April 2000: Russell J. Maharaj
92
Slide 23
WAVES - VIIIWAVES - VIIIWave Statis tic s
+ After an observation of waves (during usually 10- 20minutes) the significant wave height of that momentis known.
+ If one has a number of such observations available,one can work out a statistic of distribution of Hs.
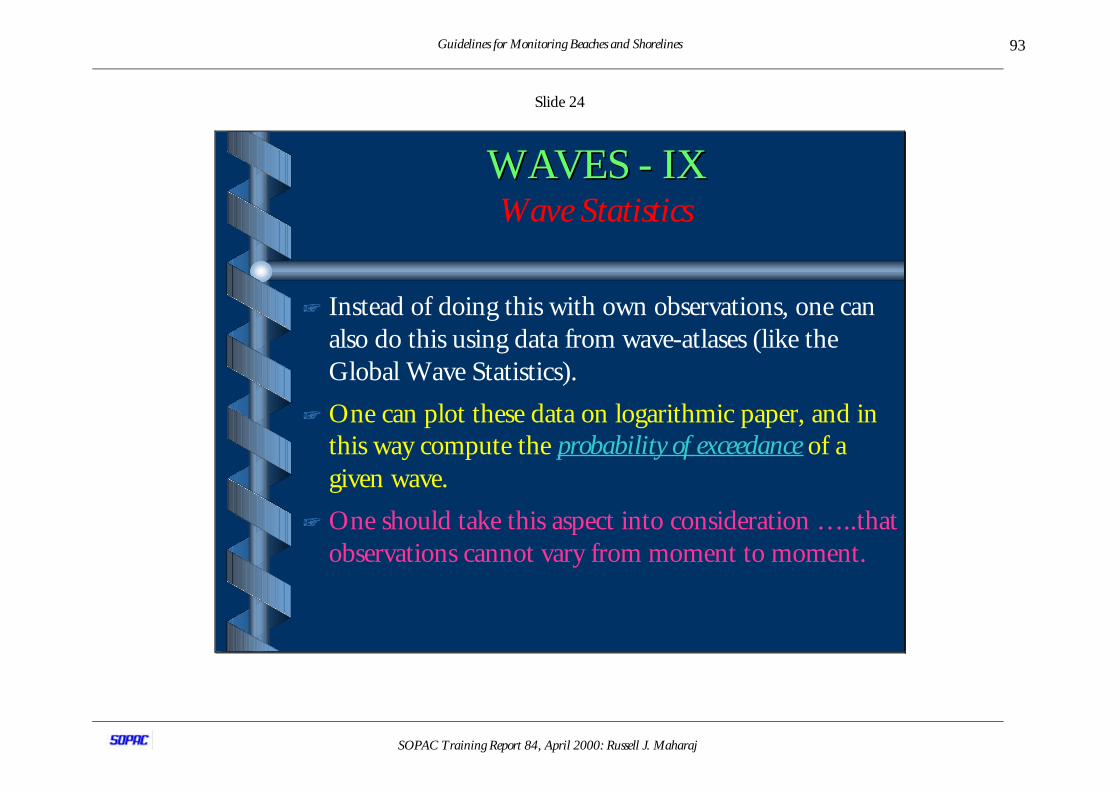
Guidelines for Monitoring Beaches and Shorelines
SOPAC Training Report 84, April 2000: Russell J. Maharaj
93
Slide 24
WAVES - IXWAVES - IXWave Statistics
+ Instead of doing this with own observations, one canalso do this using data from wave-atlases (like theGlobal Wave Statistics).
+ One can plot these data on logarithmic paper, and inthis way compute the probability of exceedance of agiven wave.
+ One should take this aspect into consideration …..thatobservations cannot vary from moment to moment.
Guidelines for Monitoring Beaches and Shorelines
SOPAC Training Report 84, April 2000: Russell J. Maharaj
94
Slide 25
WAVES - XWAVES - XWave Statis tic s
b Sometimes the exceedance is expressed in a"return period", for example a once in a 10 yearstorm.
b This does not mean that the interval between twoof these storms is ten years, but that the averageinterval between two of these storms is 10 years.
b It might even happen that you have two of thesestorms in one single year.
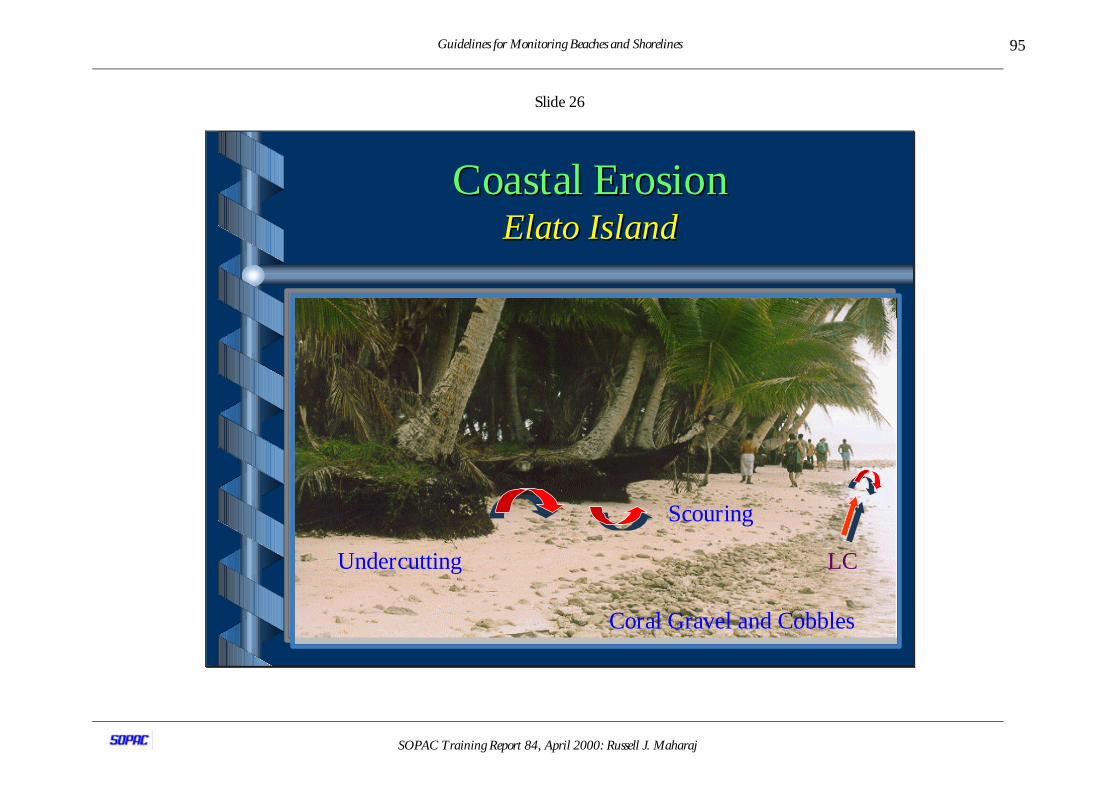
Guidelines for Monitoring Beaches and Shorelines
SOPAC Training Report 84, April 2000: Russell J. Maharaj
95
Slide 26
Coastal ErosionCoastal ErosionElato Is landElato Is land
S couring
C oral G rav el and C obbles
U ndercutting L C
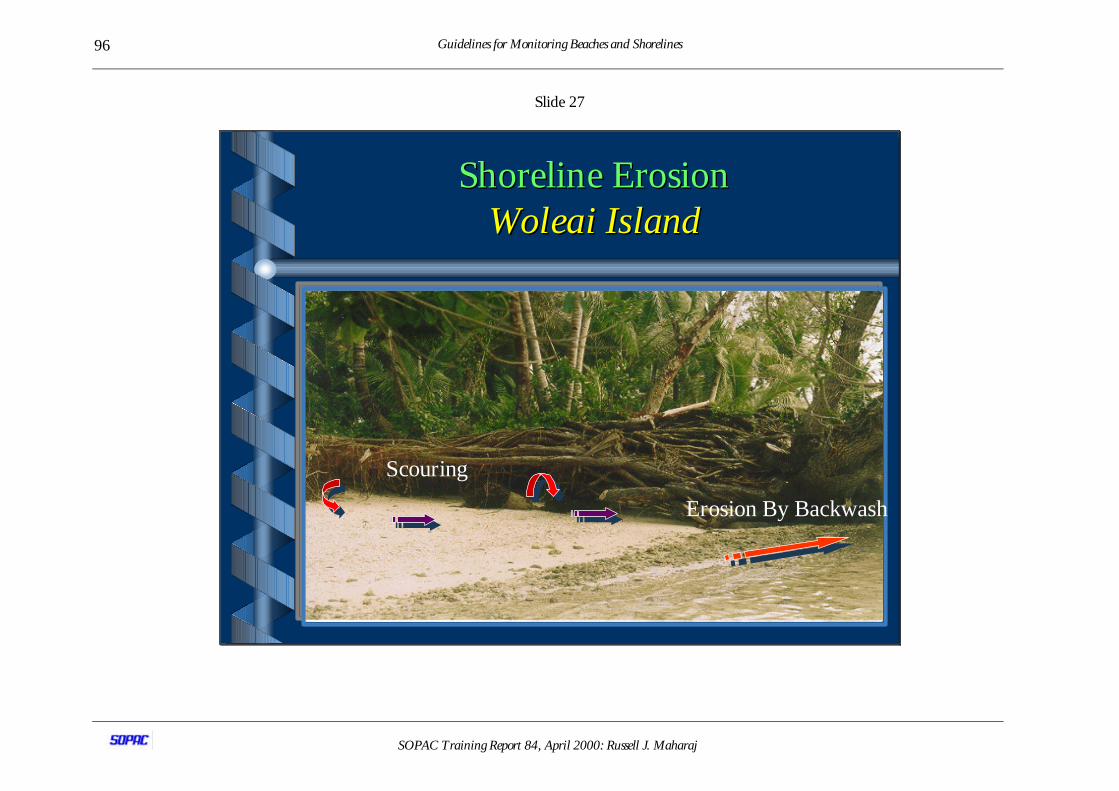
Guidelines for Monitoring Beaches and Shorelines
SOPAC Training Report 84, April 2000: Russell J. Maharaj
96
Slide 27
Shoreline ErosionShoreline ErosionWoleaiWoleai Is land Is land
S couring
E rosion B y B ackw ash
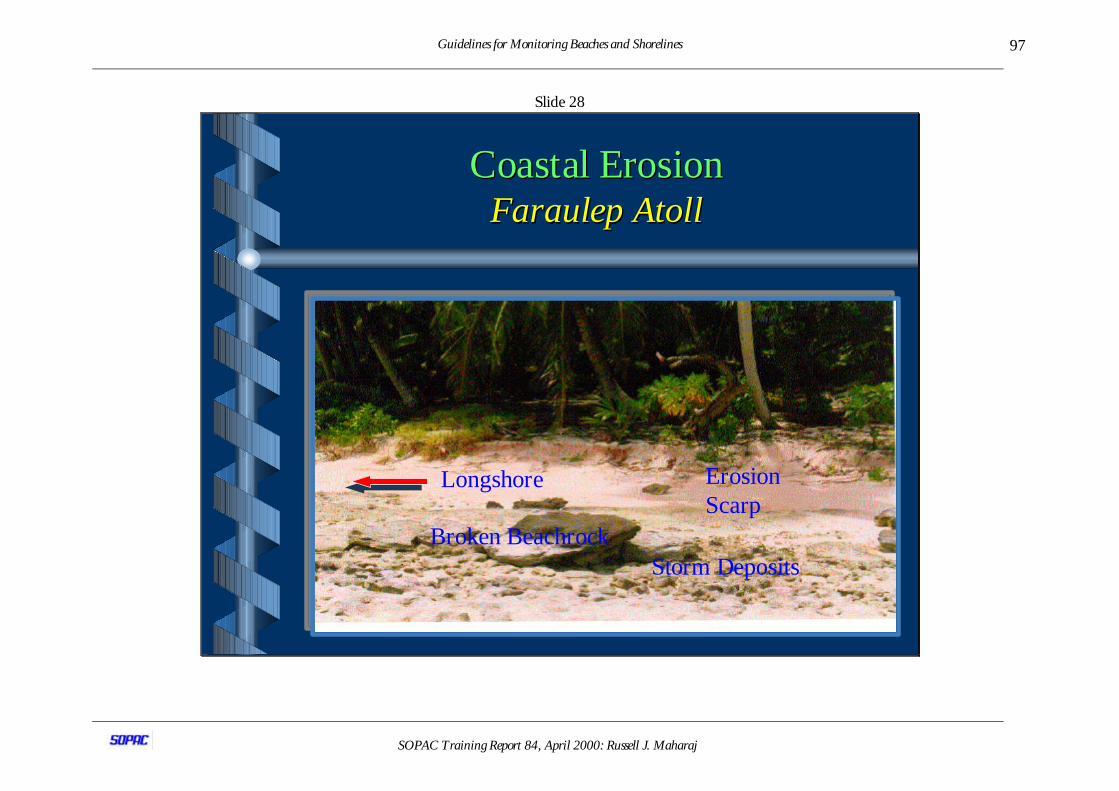
Guidelines for Monitoring Beaches and Shorelines
SOPAC Training Report 84, April 2000: Russell J. Maharaj
97
Slide 28
Coastal ErosionCoastal ErosionFaraulep AtollFaraulep Atoll
E rosionS carp
S torm D eposits
L ong shore
B roken B eachrock
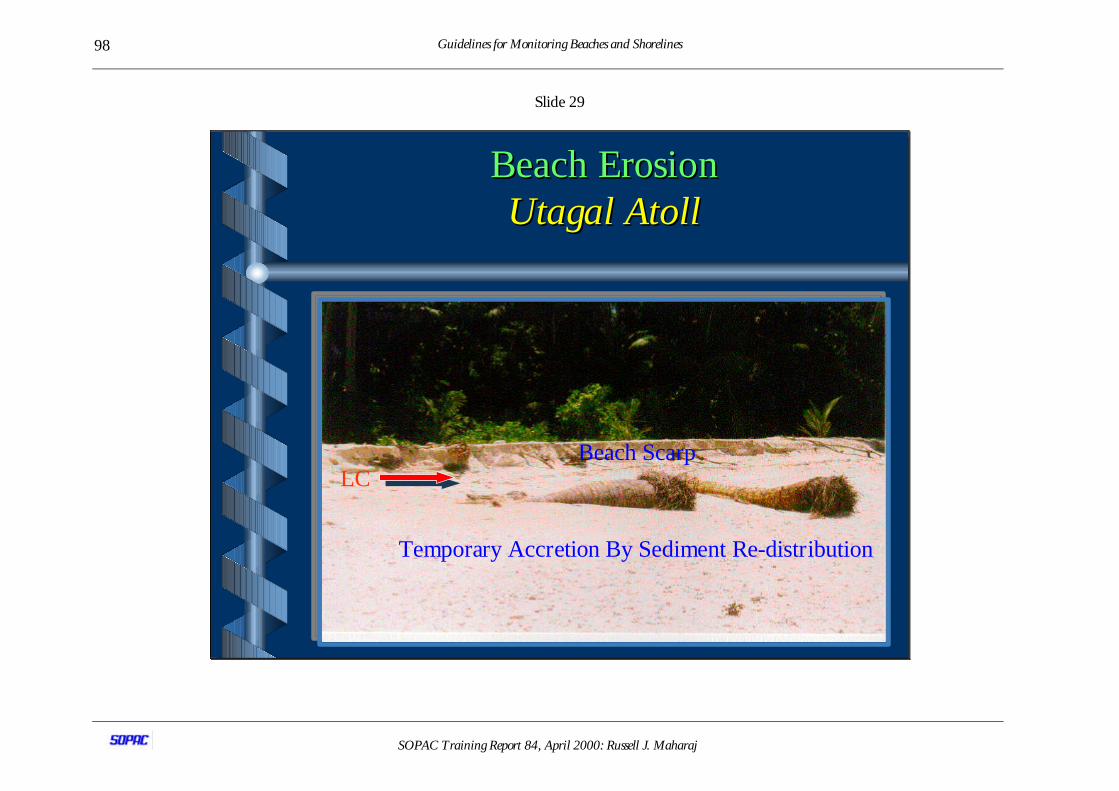
Guidelines for Monitoring Beaches and Shorelines
SOPAC Training Report 84, April 2000: Russell J. Maharaj
98
Slide 29
Beach ErosionBeach ErosionUtagalUtagal Atoll Atoll
B each S carp
T emporary A ccretion B y S ediment R e-distribution
L C
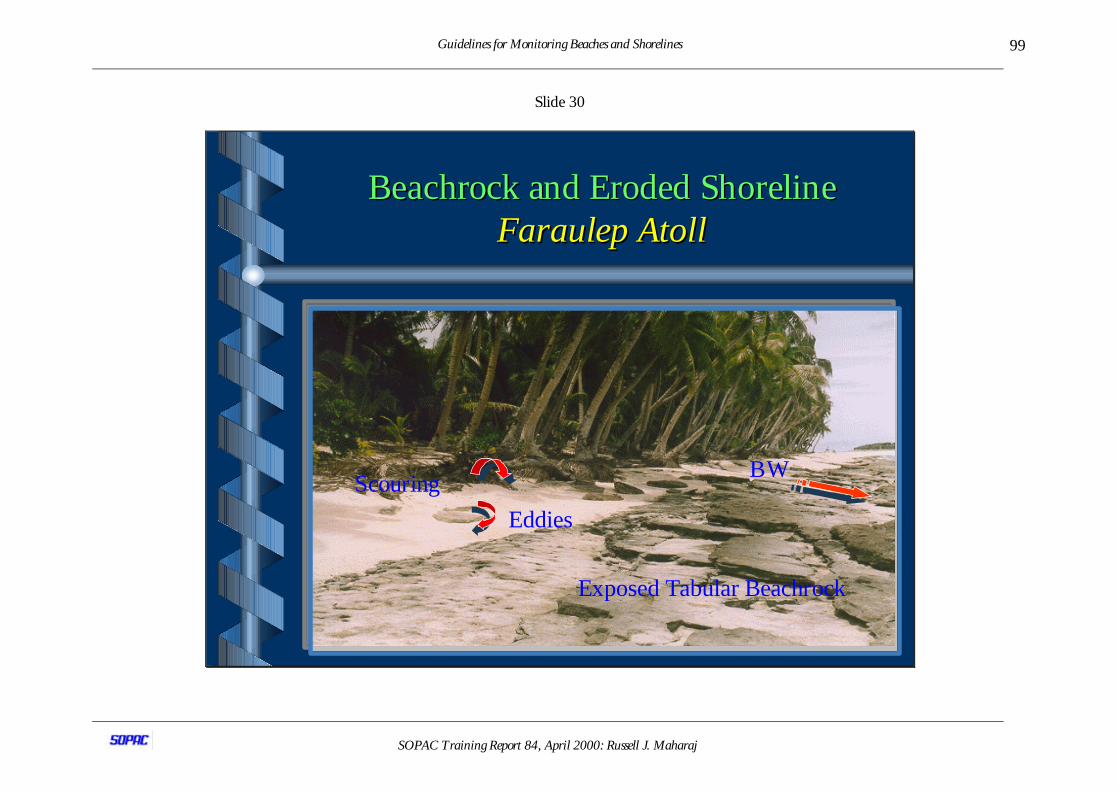
Guidelines for Monitoring Beaches and Shorelines
SOPAC Training Report 84, April 2000: Russell J. Maharaj
99
Slide 30
BeachrockBeachrock and Eroded Shoreline and Eroded ShorelineFaraulepFaraulep Atoll Atoll
S couring
E x posed T abular B eachrock
E ddies
B W
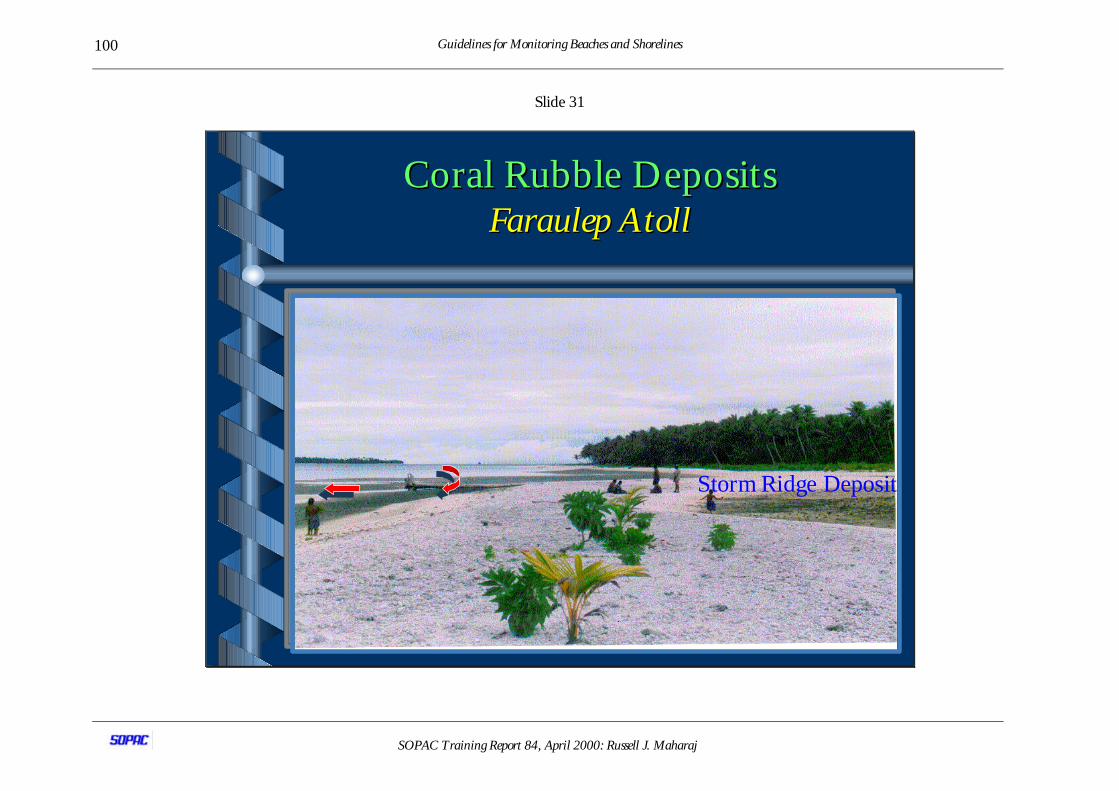
Guidelines for Monitoring Beaches and Shorelines
SOPAC Training Report 84, April 2000: Russell J. Maharaj
100
Slide 31
Coral Rubble DepositsCoral Rubble DepositsFaraulepFaraulep Atoll Atoll
S torm R idge D eposit
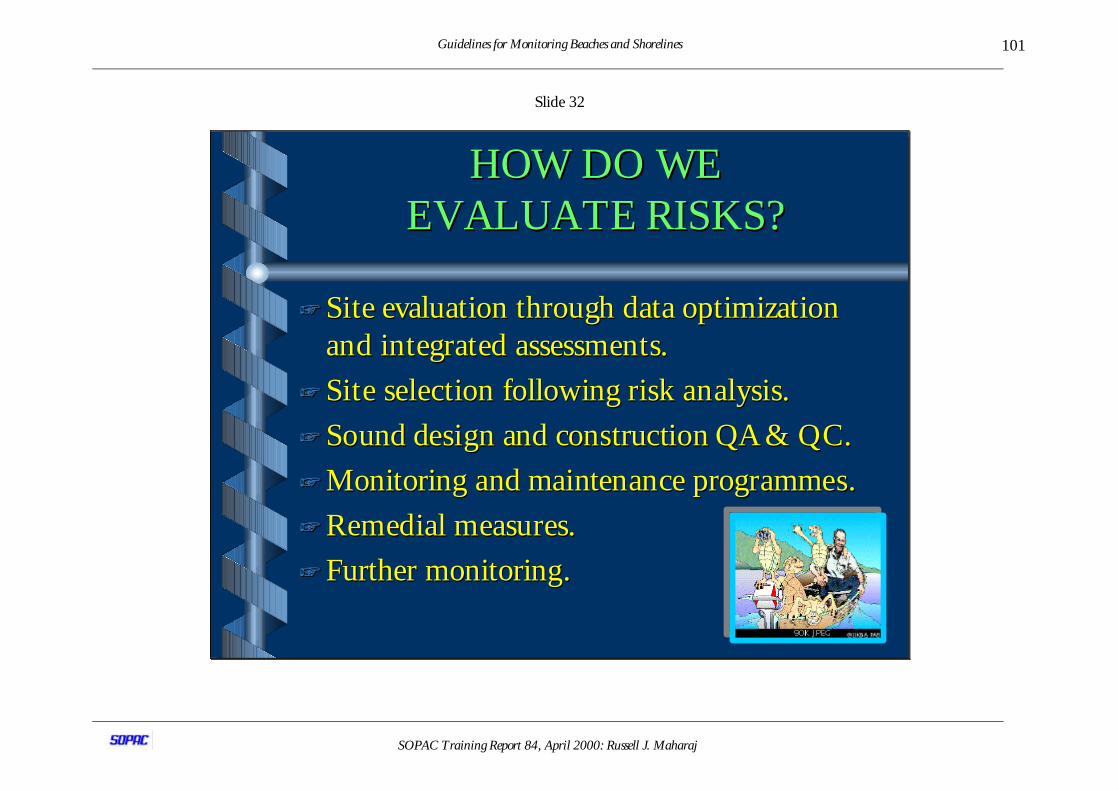
Guidelines for Monitoring Beaches and Shorelines
SOPAC Training Report 84, April 2000: Russell J. Maharaj
101
Slide 32
HOW DO WEHOW DO WEEVALUATE RISKS?EVALUATE RISKS?
++ Site evaluation through data optimizationSite evaluation through data optimizationand integrated assessments.and integrated assessments.
++ Site selection following risk analysis.Site selection following risk analysis.
++ Sound design and construction QA & QC.Sound design and construction QA & QC.
++ Monitoring and maintenance Monitoring and maintenance programmesprogrammes..
++ Remedial measures.Remedial measures.
++ Further monitoring.Further monitoring.
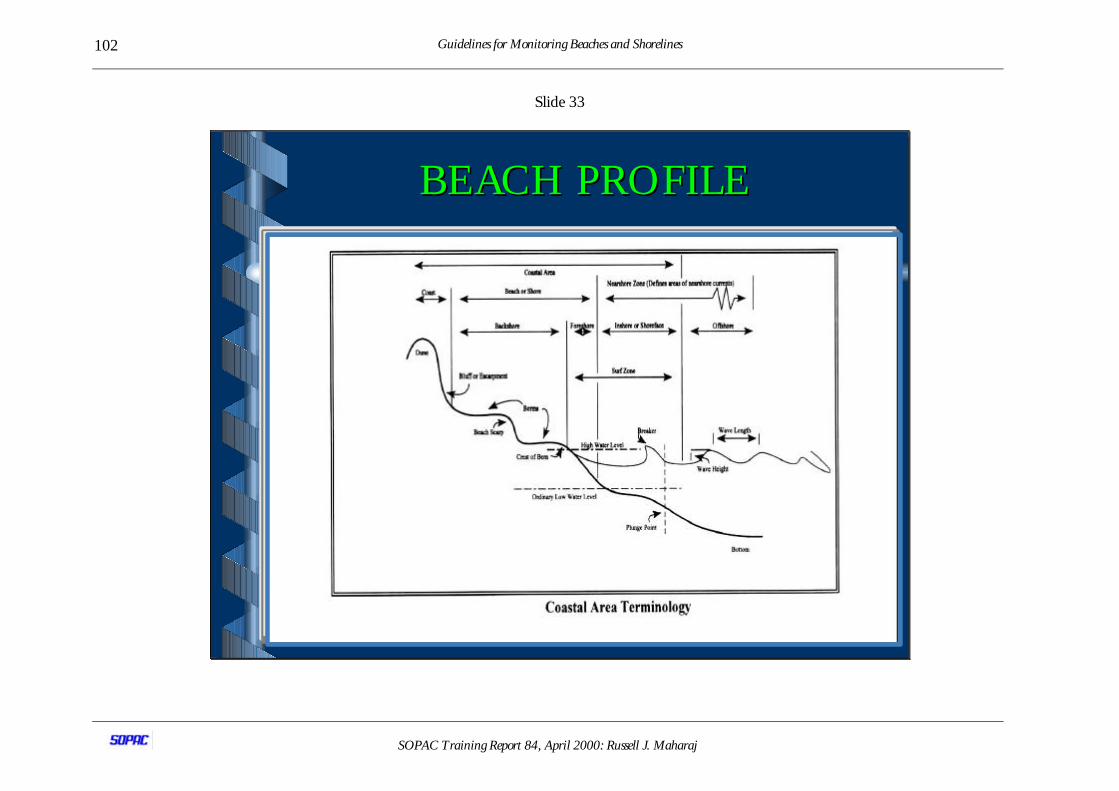
Guidelines for Monitoring Beaches and Shorelines
SOPAC Training Report 84, April 2000: Russell J. Maharaj
102
Slide 33
BEACH PROFILEBEACH PROFILE
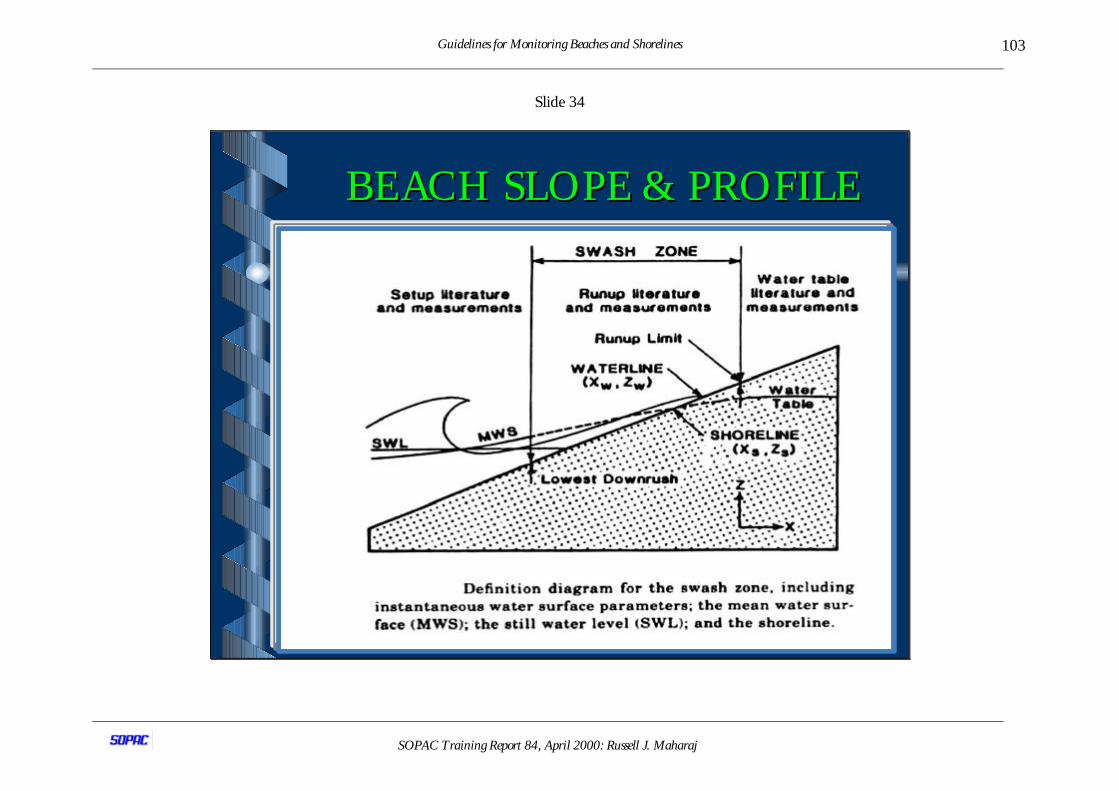
Guidelines for Monitoring Beaches and Shorelines
SOPAC Training Report 84, April 2000: Russell J. Maharaj
103
Slide 34
BEACH SLOPE & PROFILEBEACH SLOPE & PROFILE
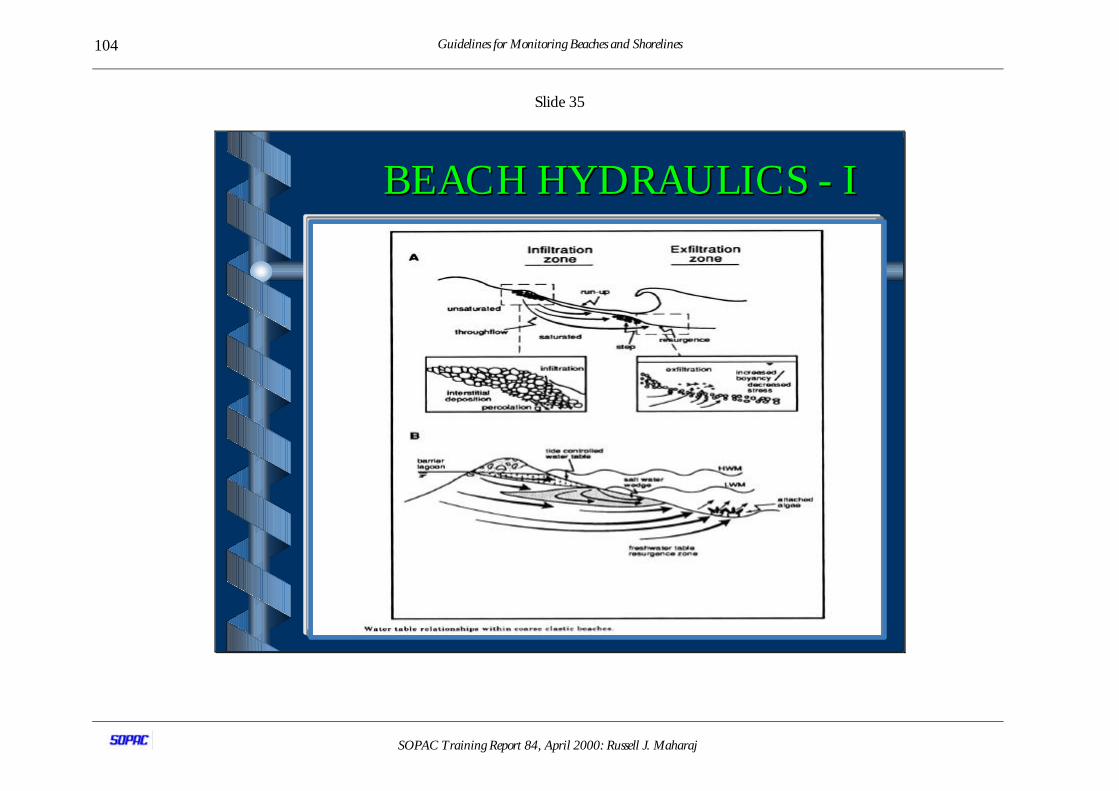
Guidelines for Monitoring Beaches and Shorelines
SOPAC Training Report 84, April 2000: Russell J. Maharaj
104
Slide 35
BEACH HY DRAULICS - IBEACH HY DRAULICS - I
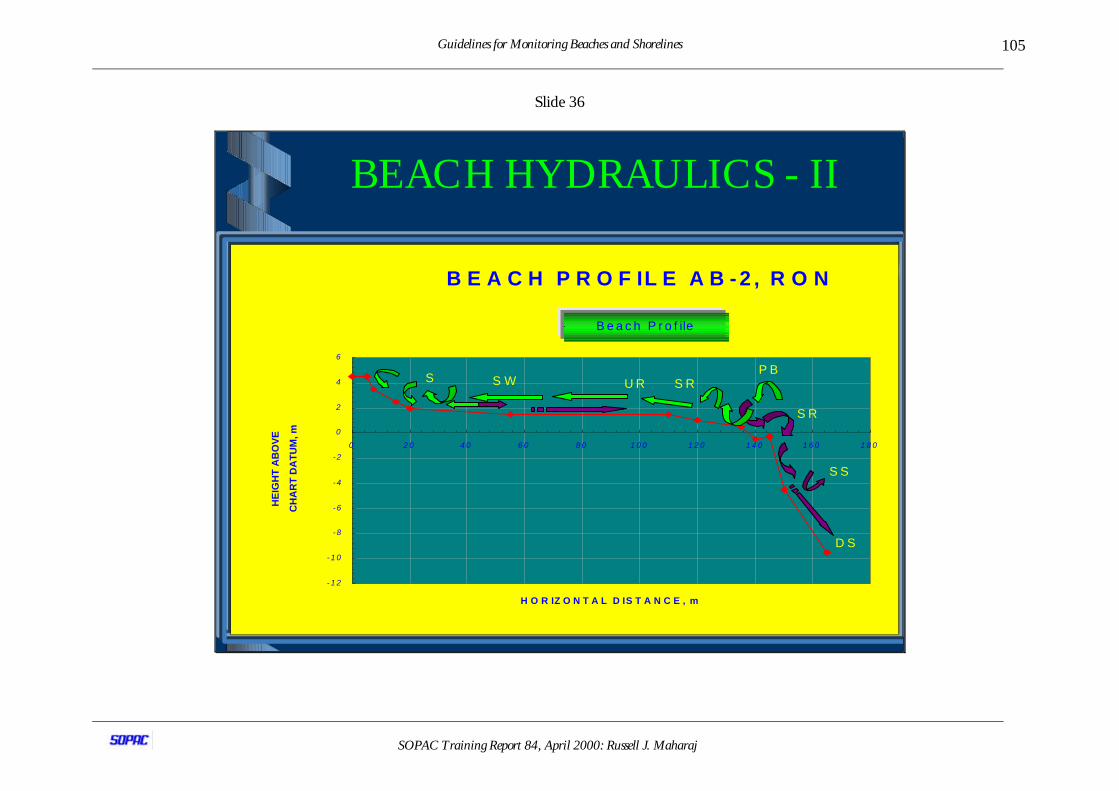
Guidelines for Monitoring Beaches and Shorelines
SOPAC Training Report 84, April 2000: Russell J. Maharaj
105
Slide 36
BEACH HY DRAULICS - II
B E A C H P R O F IL E A B - 2 , R O N
- 1 2
- 1 0
-8
-6
-4
-2
0
2
4
6
0 2 0 4 0 6 0 8 0 1 0 0 1 2 0 1 4 0 1 6 0 1 8 0
H O R IZ O N T A L D IS T A N C E , m
HE
IGH
T A
BO
VE
CH
AR
T D
AT
UM
, m
S
S S
S W U R S RP B
S R
D S
B e a c h P r o f ile
B E A C H P R O F IL E A B - 2 , R O N
- 1 2
- 1 0
-8
-6
-4
-2
0
2
4
6
0 2 0 4 0 6 0 8 0 1 0 0 1 2 0 1 4 0 1 6 0 1 8 0
H O R IZ O N T A L D IS T A N C E , m
HE
IGH
T A
BO
VE
CH
AR
T D
AT
UM
, m
S
S S
S W U R S RP B
S R
D S
B e a c h P r o f ile
B E A C H P R O F IL E A B - 2 , R O N
- 1 2
- 1 0
-8
-6
-4
-2
0
2
4
6
0 2 0 4 0 6 0 8 0 1 0 0 1 2 0 1 4 0 1 6 0 1 8 0
H O R IZ O N T A L D IS T A N C E , m
HE
IGH
T A
BO
VE
CH
AR
T D
AT
UM
, m
S
S S
S W U R S RP B
S R
D S
B e a c h P r o f ile
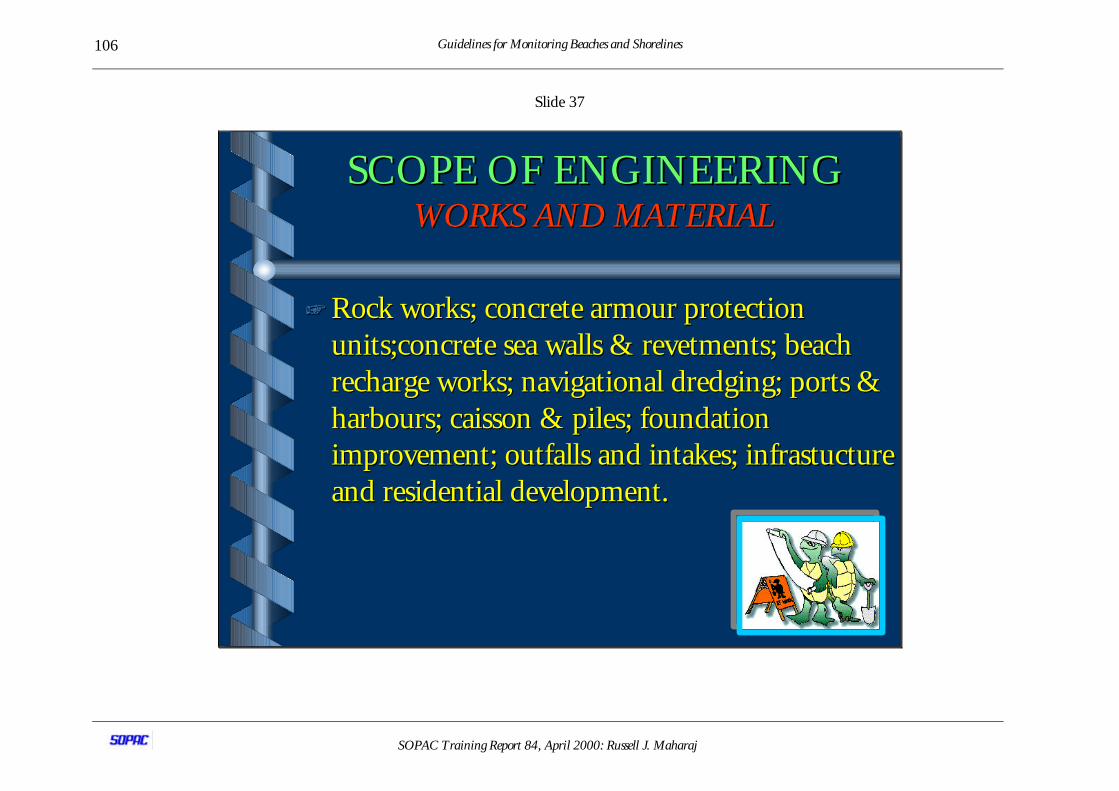
Guidelines for Monitoring Beaches and Shorelines
SOPAC Training Report 84, April 2000: Russell J. Maharaj
106
Slide 37
SCOPE OF ENGINEERINGSCOPE OF ENGINEERINGWORKS AND MATERIALWORKS AND MATERIAL
++ Rock works; concreteRock works; concrete armour armour protection protectionunits;concrete sea walls & revetments; beachunits;concrete sea walls & revetments; beachrecharge works; navigational dredging; ports &recharge works; navigational dredging; ports &harboursharbours; caisson & piles; foundation; caisson & piles; foundationimprovement; improvement; outfallsoutfalls and intakes; and intakes; infrastuctureinfrastuctureand residential development.and residential development.
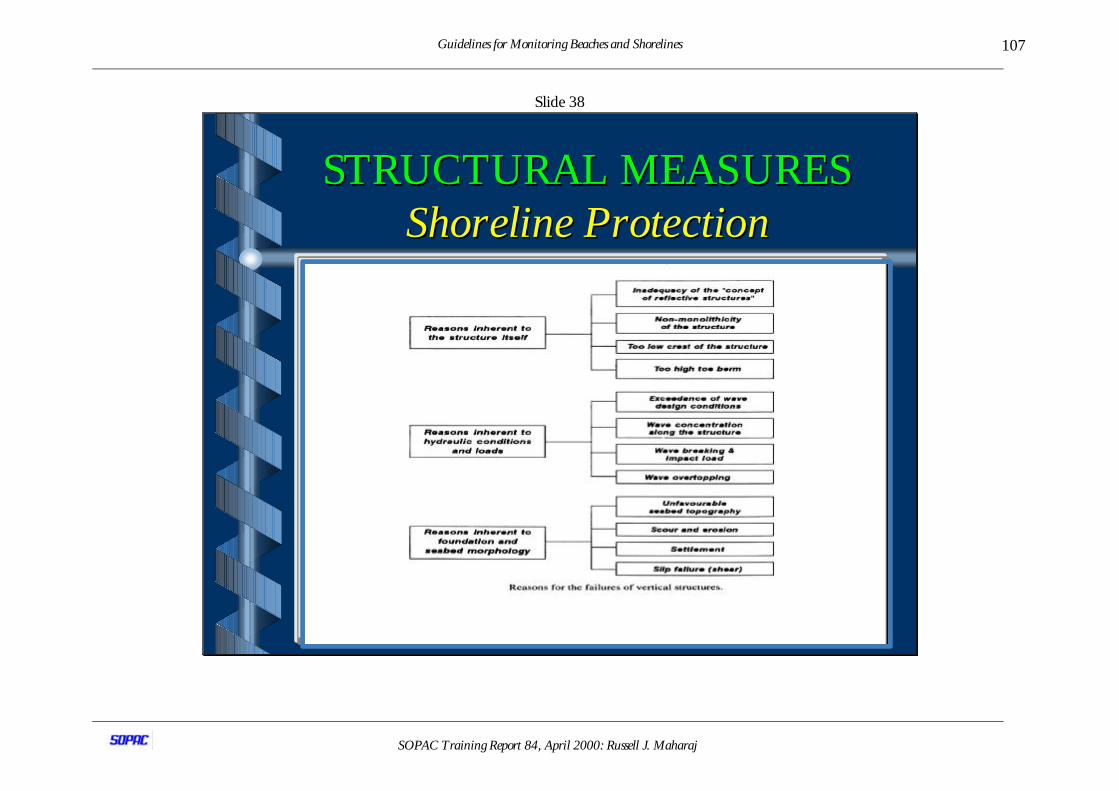
Guidelines for Monitoring Beaches and Shorelines
SOPAC Training Report 84, April 2000: Russell J. Maharaj
107
Slide 38
STRUCTURAL MEASURESSTRUCTURAL MEASURESShoreline Protec tionShoreline Protec tion

Guidelines for Monitoring Beaches and Shorelines
SOPAC Training Report 84, April 2000: Russell J. Maharaj
108
Slide 39
STRUCTURAL MEASURESSTRUCTURAL MEASURESPartial Protec tionPartial Protec tion

Guidelines for Monitoring Beaches and Shorelines
SOPAC Training Report 84, April 2000: Russell J. Maharaj
109
Slide 40
STRUCTURAL MEASURESSTRUCTURAL MEASURESGroyne Groyne De s ignDes ign
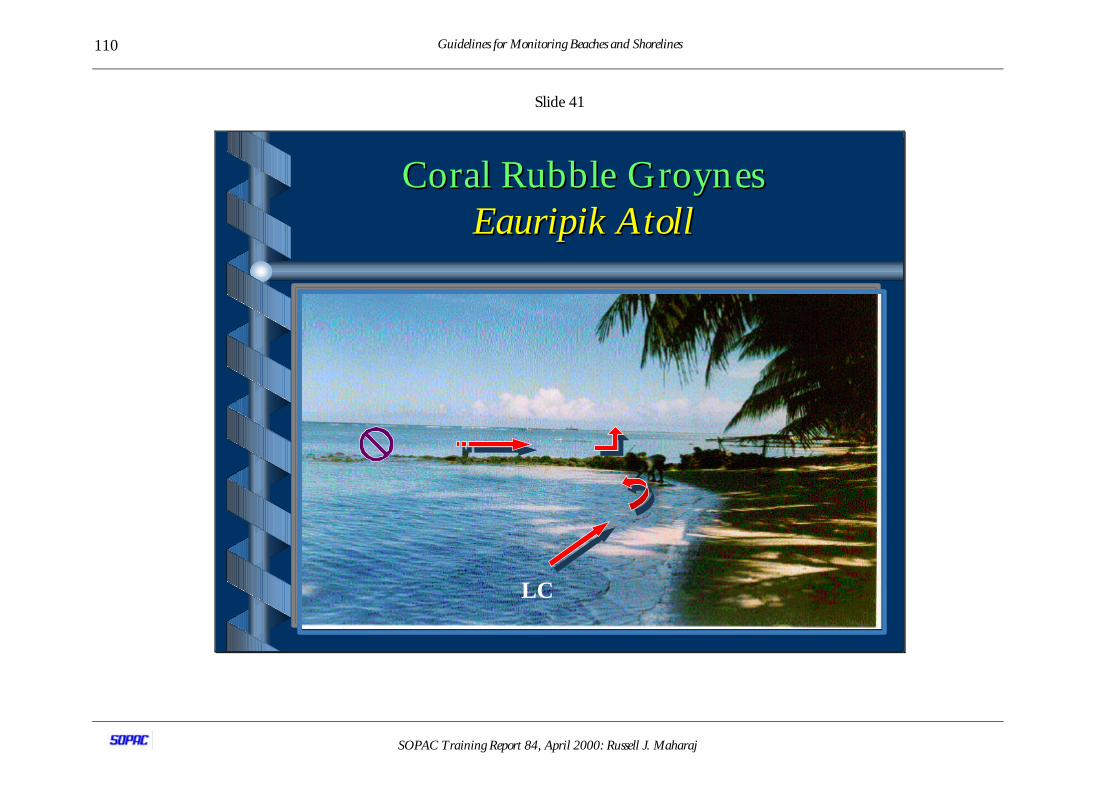
Guidelines for Monitoring Beaches and Shorelines
SOPAC Training Report 84, April 2000: Russell J. Maharaj
110
Slide 41
Coral Rubble Coral Rubble GroynesGroynesEauripikEauripik Atoll Atoll
L C

Guidelines for Monitoring Beaches and Shorelines
SOPAC Training Report 84, April 2000: Russell J. Maharaj
111
Slide 42
STRUCTURAL MEASURESSTRUCTURAL MEASURESRS-Concrete WallRS-Concrete Wall

Guidelines for Monitoring Beaches and Shorelines
SOPAC Training Report 84, April 2000: Russell J. Maharaj
112
Slide 43
RISKS ASSOCIATED WITHRISKS ASSOCIATED WITHCONCRETE SEAWALLS AND REVETMENTSCONCRETE SEAWALLS AND REVETMENTS
++ Concrete seawalls and revetments shareConcrete seawalls and revetments sharemany risks, common in narrow tidallymany risks, common in narrow tidallyinfluenced strips of land or coastal areas.influenced strips of land or coastal areas.
++ The objectives in providing these facilitiesThe objectives in providing these facilitiesare executed through contract drawings andare executed through contract drawings andspecifications.specifications.
++ There should not be any compromise inThere should not be any compromise inachieving the design objectives, without theachieving the design objectives, without theclients approval.clients approval.
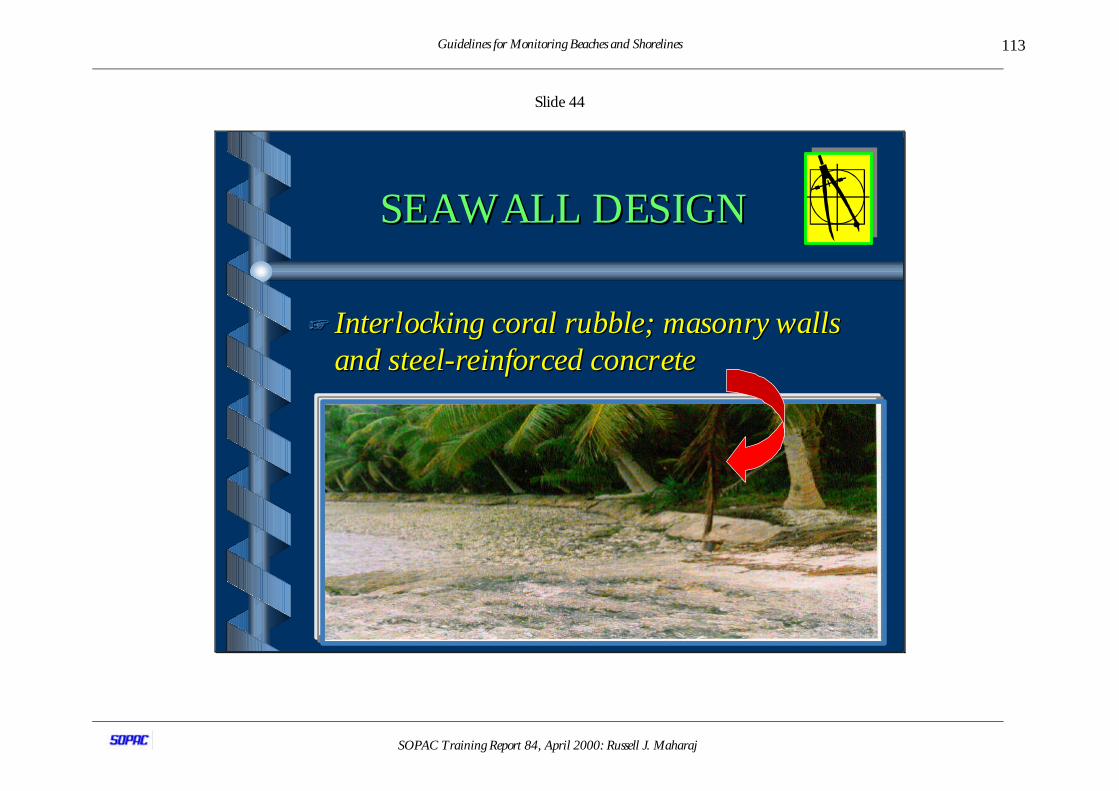
Guidelines for Monitoring Beaches and Shorelines
SOPAC Training Report 84, April 2000: Russell J. Maharaj
113
Slide 44
SEAWALL DESIGNSEAWALL DESIGN
++ Interlocking coral rubble; masonry wallsInterlocking coral rubble; masonry wallsand s tee l-re inforced concreteand s tee l-re inforced concrete
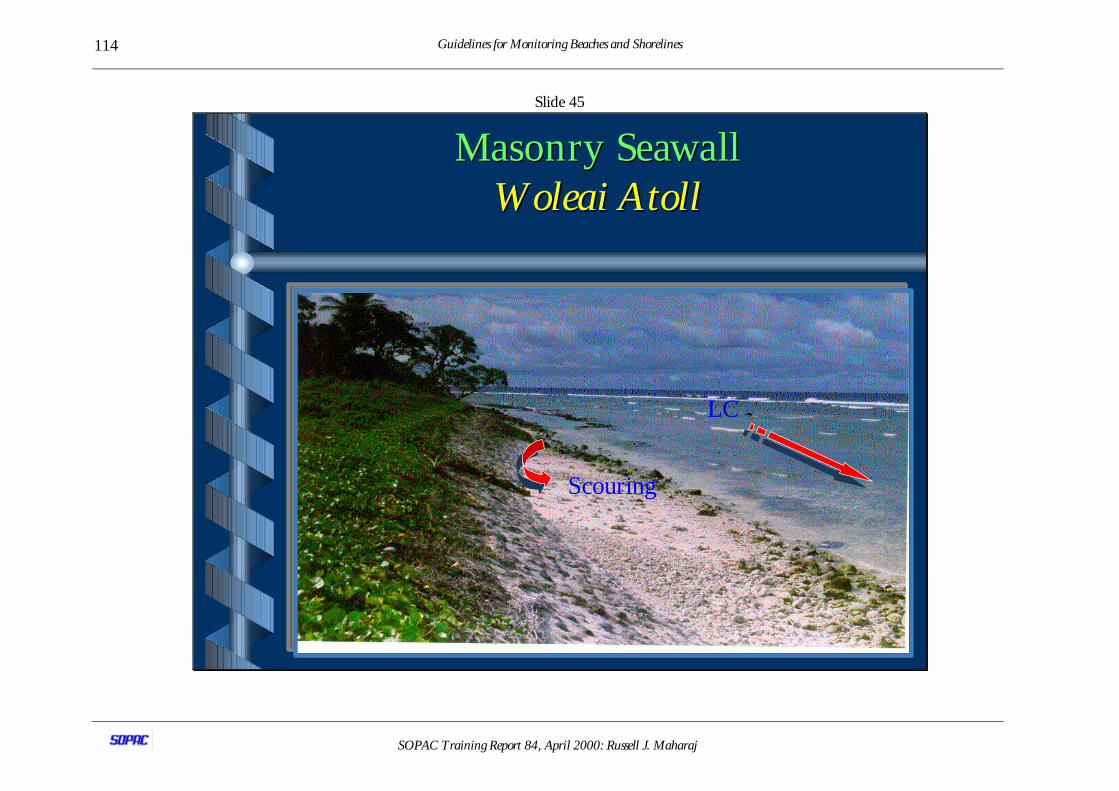
Guidelines for Monitoring Beaches and Shorelines
SOPAC Training Report 84, April 2000: Russell J. Maharaj
114
Slide 45
Masonry SeawallMasonry SeawallWoleaiWoleai Atoll Atoll
S couring
L C
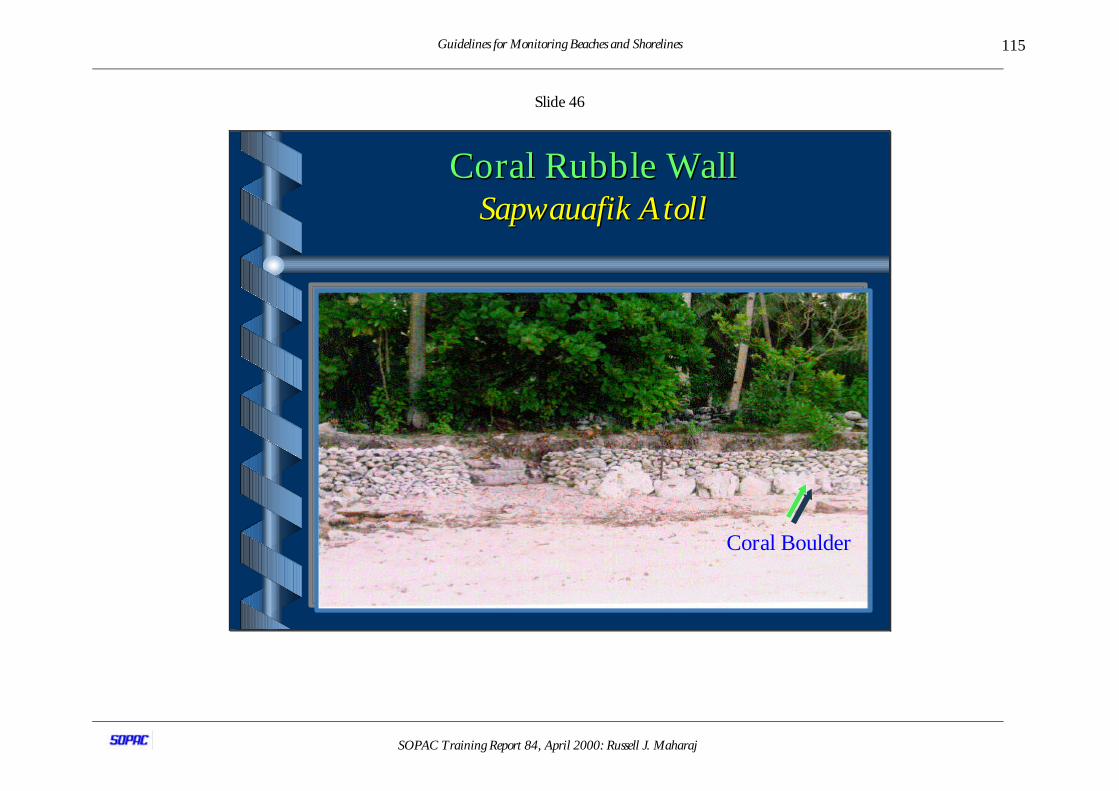
Guidelines for Monitoring Beaches and Shorelines
SOPAC Training Report 84, April 2000: Russell J. Maharaj
115
Slide 46
Coral Rubble WallCoral Rubble WallSapw auafik AtollSapw auafik Atoll
C oral B oulder
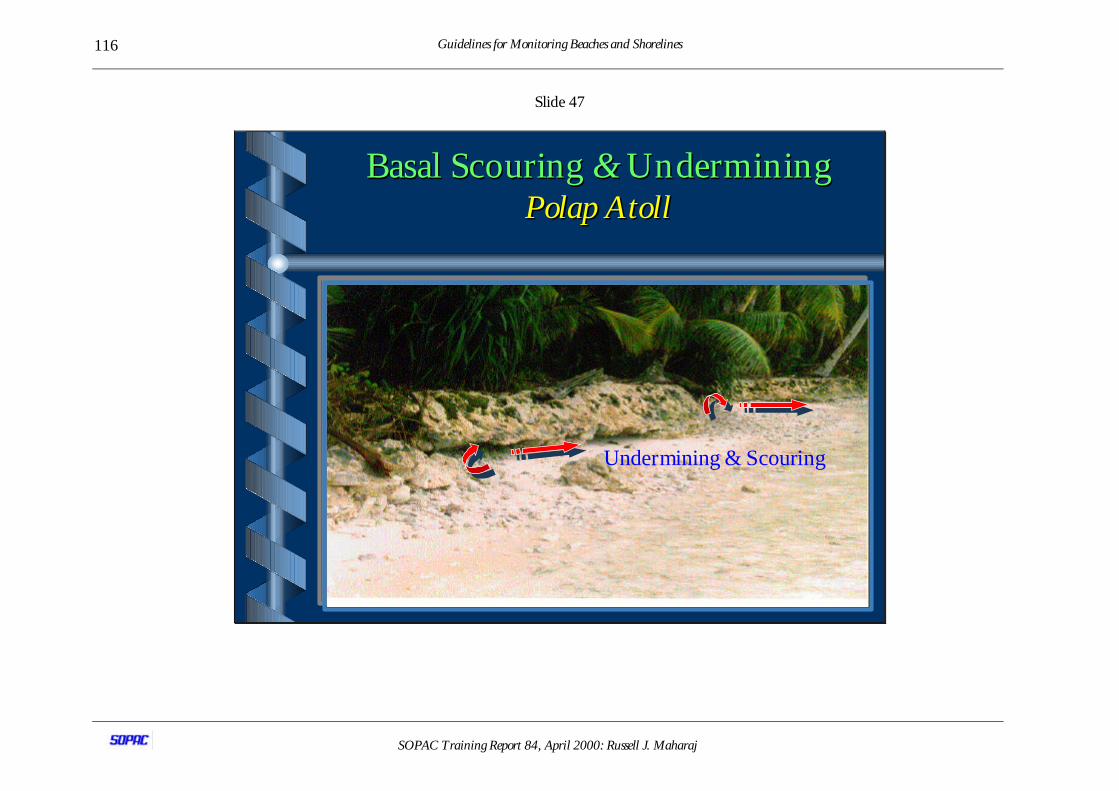
Guidelines for Monitoring Beaches and Shorelines
SOPAC Training Report 84, April 2000: Russell J. Maharaj
116
Slide 47
Basal Scouring Basal Scouring && Undermining UnderminingPolap AtollPolap Atoll
U ndermining & S couring
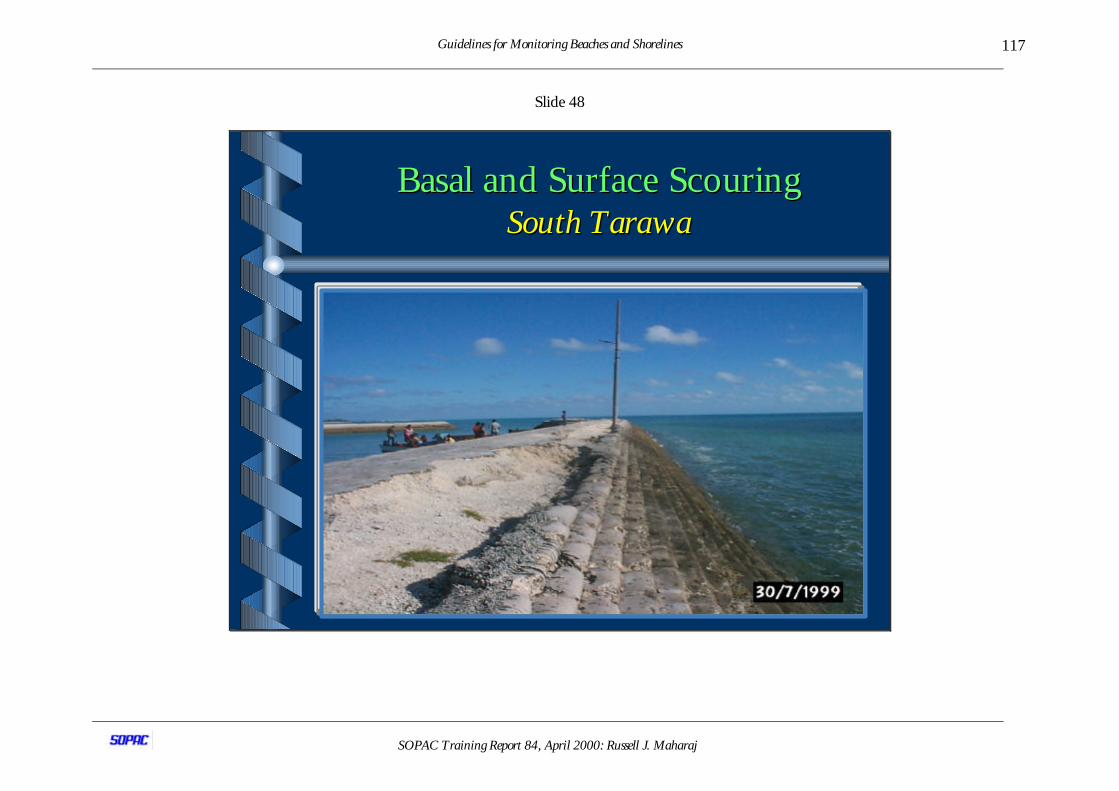
Guidelines for Monitoring Beaches and Shorelines
SOPAC Training Report 84, April 2000: Russell J. Maharaj
117
Slide 48
Basal and Surface ScouringBasal and Surface ScouringSouth Sou th Taraw aTaraw a
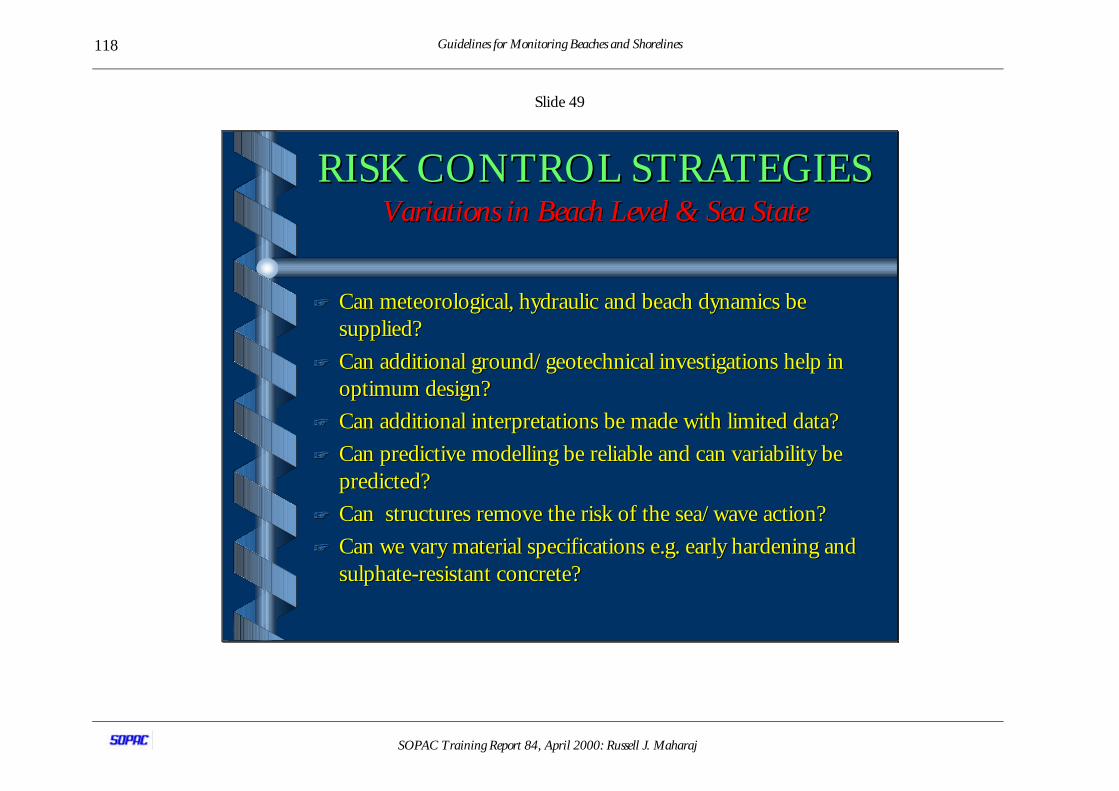
Guidelines for Monitoring Beaches and Shorelines
SOPAC Training Report 84, April 2000: Russell J. Maharaj
118
Slide 49
RISK CONTROL STRATEGIESRISK CONTROL STRATEGIESVariations in Beach Level & Sea StateVariations in Beach Level & Sea State
++ Can meteorological, hydraulic and beach dynamics beCan meteorological, hydraulic and beach dynamics besupplied?supplied?
++ Can additional ground/Can additional ground/geotechnical geotechnical investigations help ininvestigations help inoptimum design?optimum design?
++ Can additional interpretations be made with limited data?Can additional interpretations be made with limited data?
++ Can predictive Can predictive modelling modelling be reliable and can variability bebe reliable and can variability bepredicted?predicted?
++ Can structures remove the risk of the sea/wave action?Can structures remove the risk of the sea/wave action?
++ Can we vary material specifications e.g. early hardening andCan we vary material specifications e.g. early hardening andsulphatesulphate-resistant concrete?-resistant concrete?
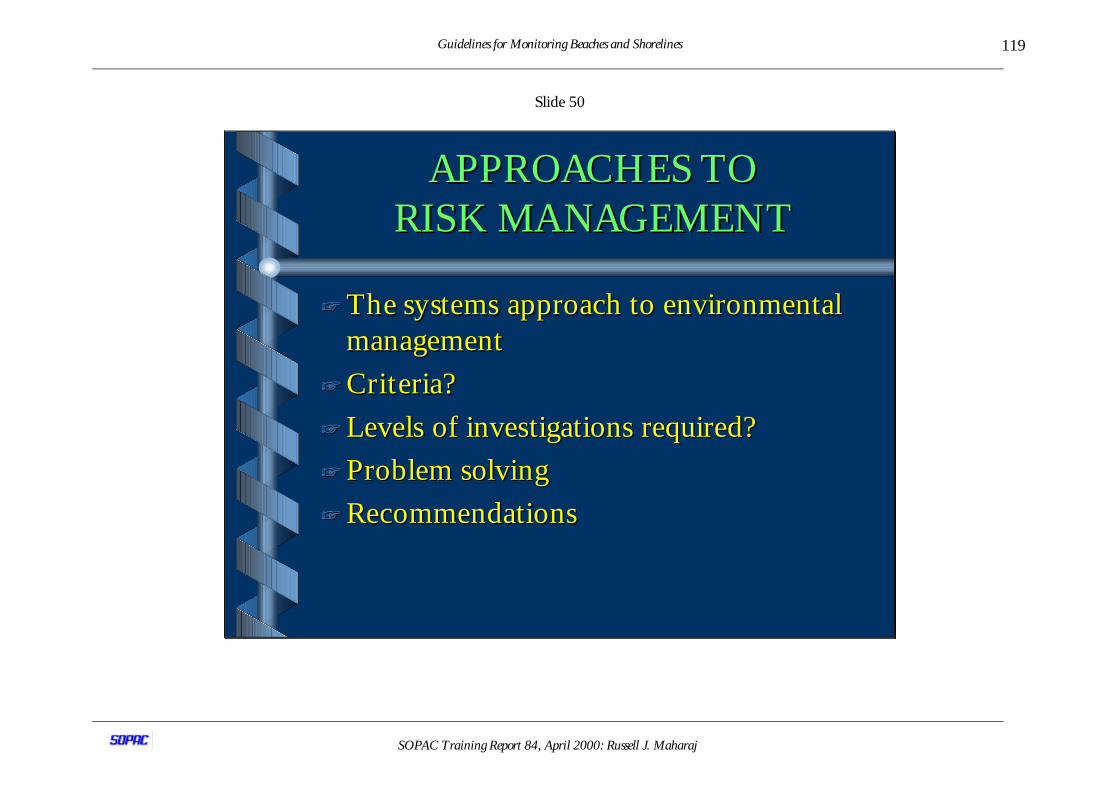
Guidelines for Monitoring Beaches and Shorelines
SOPAC Training Report 84, April 2000: Russell J. Maharaj
119
Slide 50
APPROACHES TOAPPROACHES TORISK MANAGEMENTRISK MANAGEMENT
++ The sy stems approach to environmentalThe sy stems approach to environmentalmanagementmanagement
++ Criteria?Criteria?
++ Levels of investigations required?Levels of investigations required?
++ Problem solvingProblem solving
++ RecommendationsRecommendations

Guidelines for Monitoring Beaches and Shorelines
SOPAC Training Report 84, April 2000: Russell J. Maharaj
120
Slide 51
BENEFITS AND AIMS OFBENEFITS AND AIMS OFRISK MANAGEMENTRISK MANAGEMENT
++ Risk management should make risksRisk management should make risksexplicit, formally describing them andexplicit, formally describing them andmaking them easier to manage.making them easier to manage.
++ Reduce the possible impacts (cost, time,Reduce the possible impacts (cost, time,quality , safety and environmental aspects)quality , safety and environmental aspects)associated with uncertainty .associated with uncertainty .
++ Present mitigation strategies, fromPresent mitigation strategies, frominception, development, construction andinception, development, construction andpost-project evaluation.post-project evaluation.
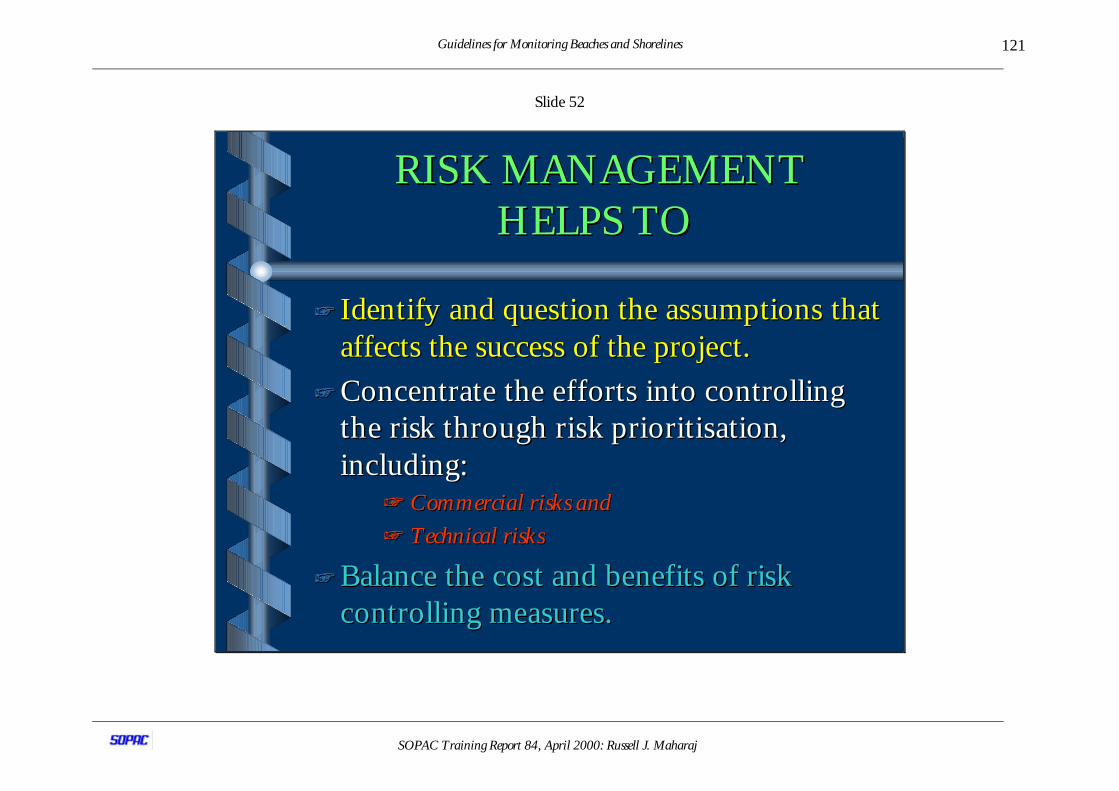
Guidelines for Monitoring Beaches and Shorelines
SOPAC Training Report 84, April 2000: Russell J. Maharaj
121
Slide 52
RISK MANAGEMENT RISK MANAGEMENTHELPS TOHELPS TO
++ Identify and question the assumptions thatIdentify and question the assumptions thataffects the success of the project.affects the success of the project.
++ Concentrate the efforts into controllingConcentrate the efforts into controllingthe risk through risk the risk through risk prioritisationprioritisation,,including:including:
++ Com m ercial risks and Com m ercial risks and
++ Techn ical risks Techn ical risks
++ Balance the cost and benefits of riskBalance the cost and benefits of riskcontrolling measures.controlling measures.
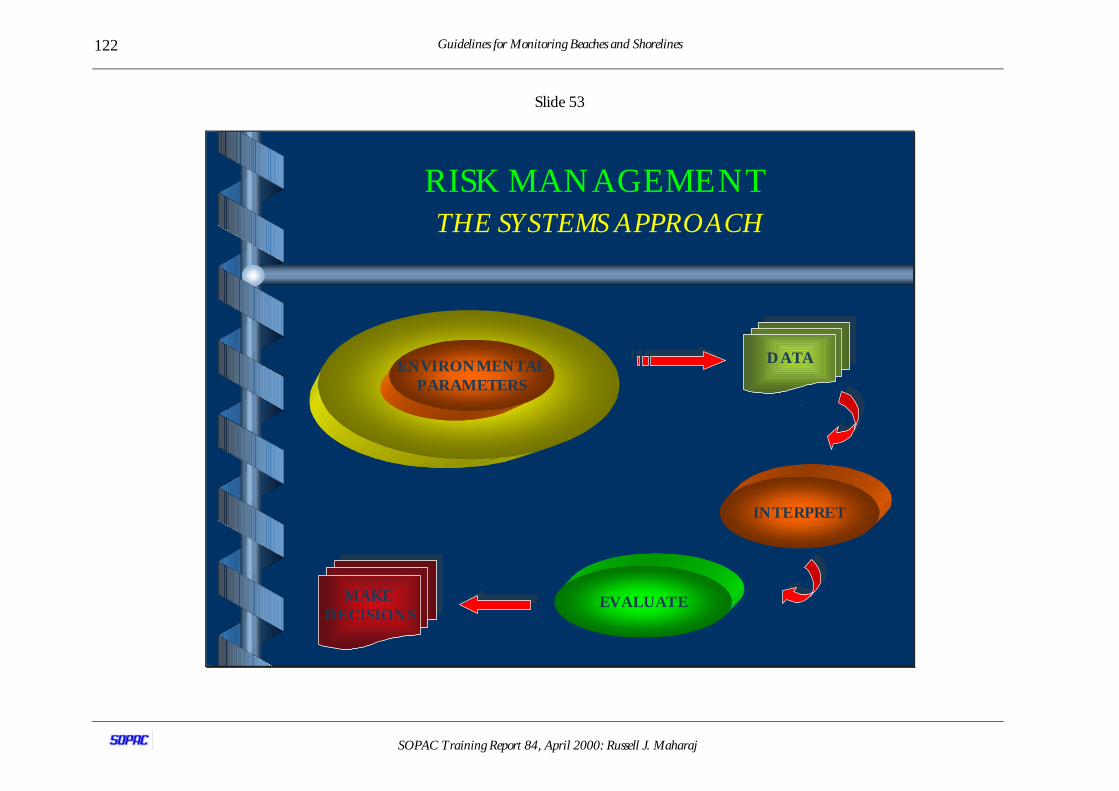
Guidelines for Monitoring Beaches and Shorelines
SOPAC Training Report 84, April 2000: Russell J. Maharaj
122
Slide 53
RISK MANAGEMENT THE SYSTEMS APPROACH
ENVIRONMENTALPARAMETERS
EVALUATE
INTERPRET
DATADATA
MAKE DECISIONS
MAKE DECISIONS
Guidelines for Monitoring Beaches and Shorelines
SOPAC Training Report 84, April 2000: Russell J. Maharaj
123
Slide 54
SPATIAL LEVELS IN SITESPATIAL LEVELS IN SITEINVESTIGATIONSINVESTIGATIONS
R E G I O N A L S C A L ER E G I O N A L S C A L E
P R O B L E M S C A L EP R O B L E M S C A L E
L O C A L SC A L EL O C A L SC A L E
SIT E S T U D YSIT E S T U D Y
C O A S T A L Z O N E
L E V E L S
Guidelines for Monitoring Beaches and Shorelines
SOPAC Training Report 84, April 2000: Russell J. Maharaj
124
Slide 55
COMPONENTS OF THECOMPONENTS OF THEENVIRONMENTENVIRONMENT
ANTHROPOGENICCOMPONENT
BIO-CHEMICAL ENVIRONMENT
PHYSICALENVIRONMENT
Guidelines for Monitoring Beaches and Shorelines
SOPAC Training Report 84, April 2000: Russell J. Maharaj
125
Slide 56
CRITERIACRITERIAQUALIFICATIONQUALIFICATION
PA R A M E T E R S
DA T A
C R IT E R IA
S O L U T I O NS O L U T I O NS O L U T I O N

Guidelines for Monitoring Beaches and Shorelines
SOPAC Training Report 84, April 2000: Russell J. Maharaj
126
Slide 57
DESIGN DESIGN && QCQC PROCESS PROCESS
DATA ANALYSIS/MODELLING
PROBLEM SOLVING
POSSIBLE SOLUTIONS
OPTIMUM SELECTION
FINAL DESIGN
MANAGEMENT
MONITORING
DESIGN MODIFICATION
CONSTRUCTION
POST-CONSTRUCTION MANAGEMENT
POST-CONSTRUCTION MONITORING
MAINTENANCE AND REPAIR
FAILURE ANALYSIS
PROJECT IDENTIFICATION: PROBLEM

Guidelines for Monitoring Beaches and Shorelines
SOPAC Training Report 84, April 2000: Russell J. Maharaj
127
Slide 58
PROBLEM SOLVING - IPROBLEM SOLVING - IDESIGN & CONSTRUSTIONDESIGN & CONSTRUSTION
PROBLEM
FOLLOW-UPPLANS
DEFINEOBJECTIVES
ACTIONS
Guidelines for Monitoring Beaches and Shorelines
SOPAC Training Report 84, April 2000: Russell J. Maharaj
128
Slide 59
PROBLEM SOLVING - IIPROBLEM SOLVING - IIMAINTENANCEMAINTENANCE
FOLLOW-UPPLANS
DEFINEOBJECTIVES
ACTIONS
Guidelines for Monitoring Beaches and Shorelines
SOPAC Training Report 84, April 2000: Russell J. Maharaj
129
Slide 60
COASTAL EROSION ANDCOASTAL EROSION ANDPROTECTIONPROTECTION
++ Ev aluatin g c on struct ion r isk for coastalEv aluatin g c on struct ion r isk for coastaleng ineer ing in ree f env iron m entseng ineer ing in ree f env iron m ents..
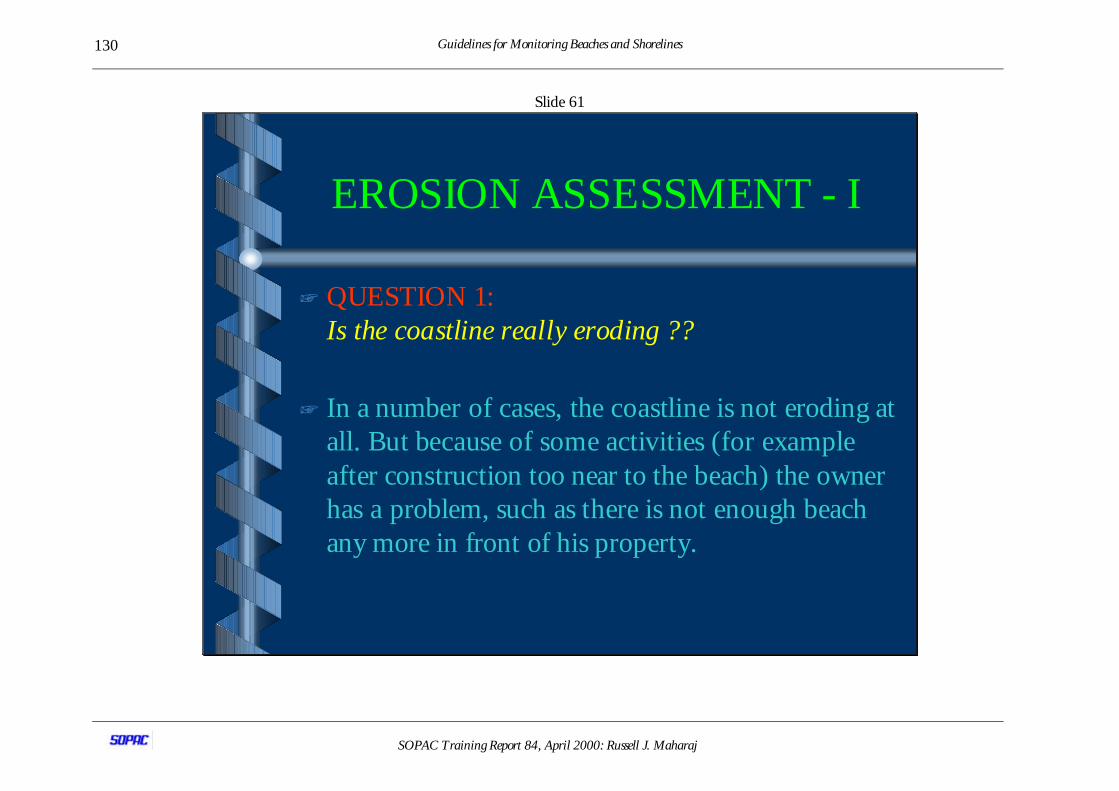
Guidelines for Monitoring Beaches and Shorelines
SOPAC Training Report 84, April 2000: Russell J. Maharaj
130
Slide 61
EROSION ASSESSMENT - I
+ QUESTION 1:Is the coastline really eroding ? ?
+ In a number of cases, the coastline is not eroding atall. But because of some activities (for exampleafter construction too near to the beach) the ownerhas a problem, such as there is not enough beachany more in front of his property.
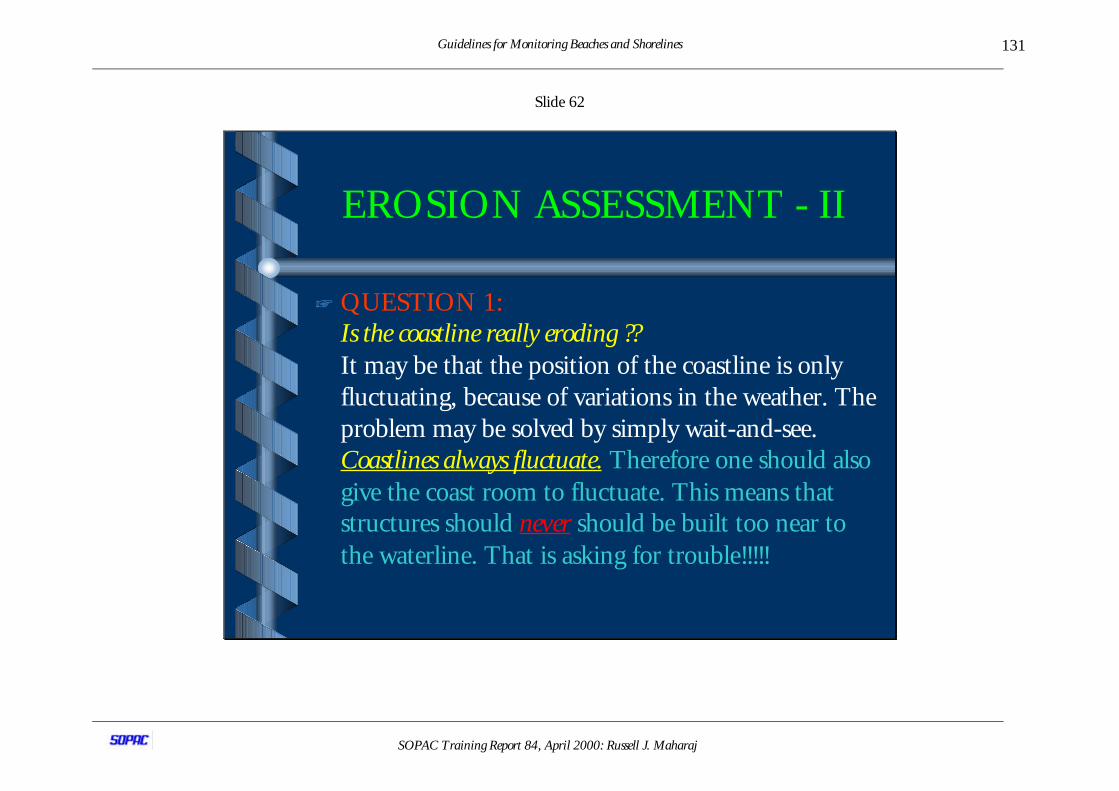
Guidelines for Monitoring Beaches and Shorelines
SOPAC Training Report 84, April 2000: Russell J. Maharaj
131
Slide 62
EROSION ASSESSMENT - II
+ QUESTION 1:Is the coastline really eroding ??It may be that the position of the coastline is onlyfluctuating, because of variations in the weather. Theproblem may be solved by simply wait-and-see.Coastlines always fluctuate. Therefore one should alsogive the coast room to fluctuate. This means thatstructures should never should be built too near tothe waterline. That is asking for trouble!!!!!
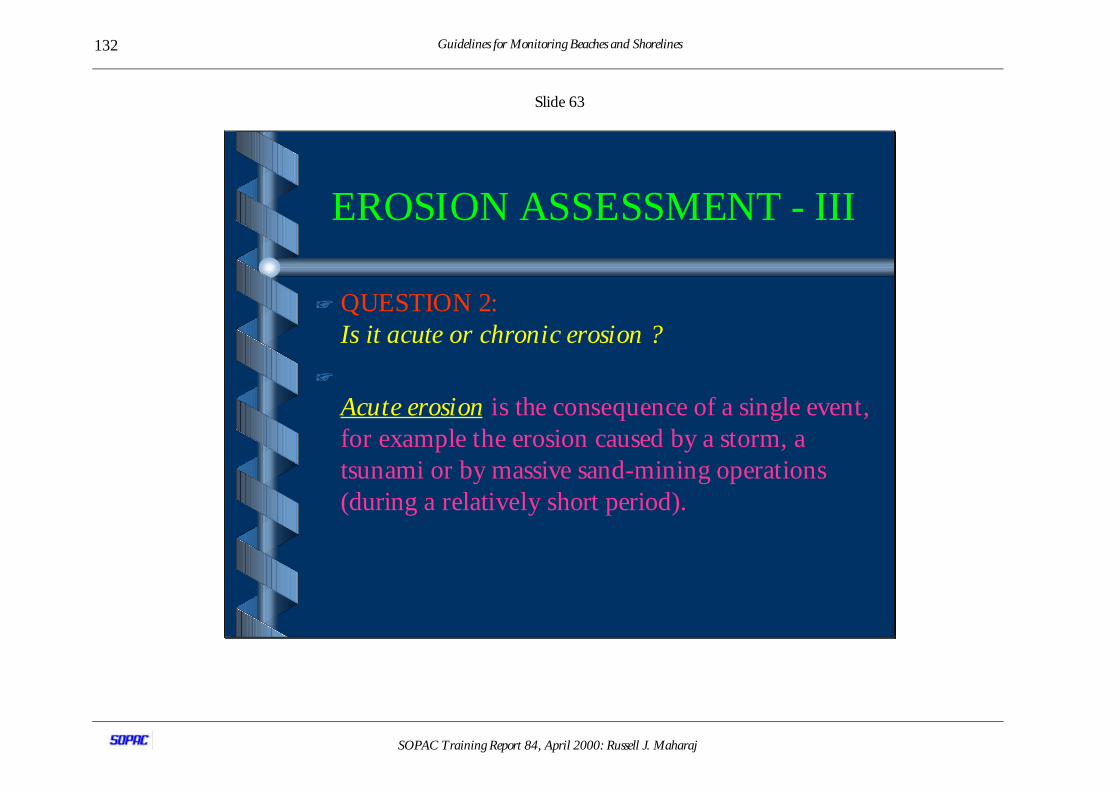
Guidelines for Monitoring Beaches and Shorelines
SOPAC Training Report 84, April 2000: Russell J. Maharaj
132
Slide 63
EROSION ASSESSMENT - III
+ QUESTION 2:Is it acute or chronic erosion ?
+
Acute erosion is the consequence of a single event,for example the erosion caused by a storm, atsunami or by massive sand-mining operations(during a relatively short period).
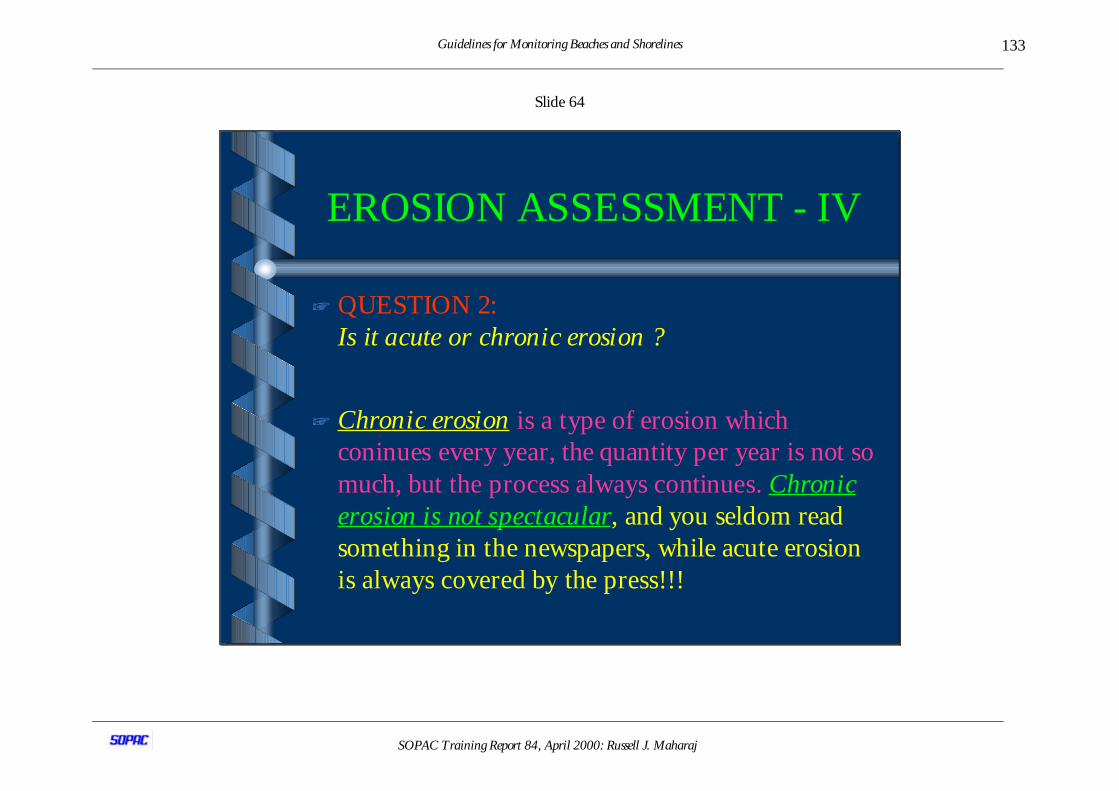
Guidelines for Monitoring Beaches and Shorelines
SOPAC Training Report 84, April 2000: Russell J. Maharaj
133
Slide 64
EROSION ASSESSMENT - IV
+ QUESTION 2:Is it acute or chronic erosion ?
+ Chronic erosion is a type of erosion whichconinues every year, the quantity per year is not somuch, but the process always continues. Chroniceros ion is not s pectacular, and you seldom readsomething in the newspapers, while acute erosionis always covered by the press! ! !
Guidelines for Monitoring Beaches and Shorelines
SOPAC Training Report 84, April 2000: Russell J. Maharaj
134
Slide 65
EROSION ASSESSMENT - V
+ QUESTION 3:
+ What kind of erosion do you have:
4chronic erosion
4acute erosion
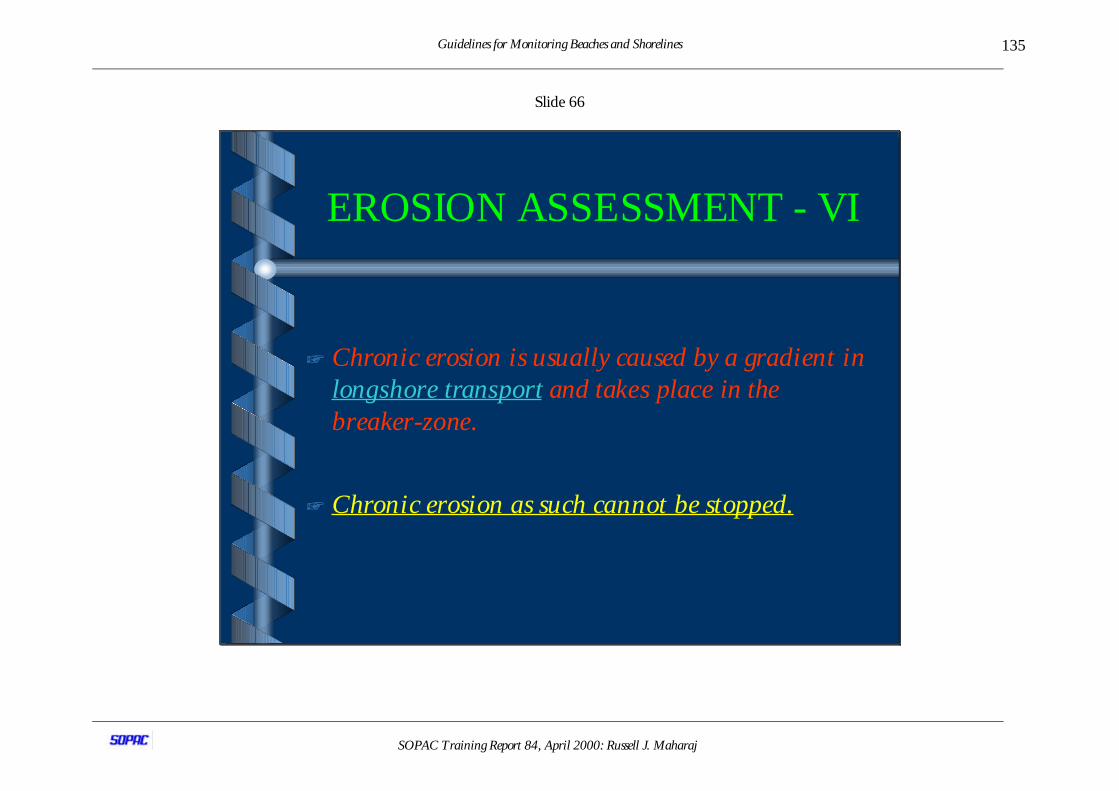
Guidelines for Monitoring Beaches and Shorelines
SOPAC Training Report 84, April 2000: Russell J. Maharaj
135
Slide 66
EROSION ASSESSMENT - VI
+ Chronic erosion is usually caused by a gradient inlong s hore trans port and take s place in thebreaker-zone.
+ Chronic erosion as such cannot be stopped.
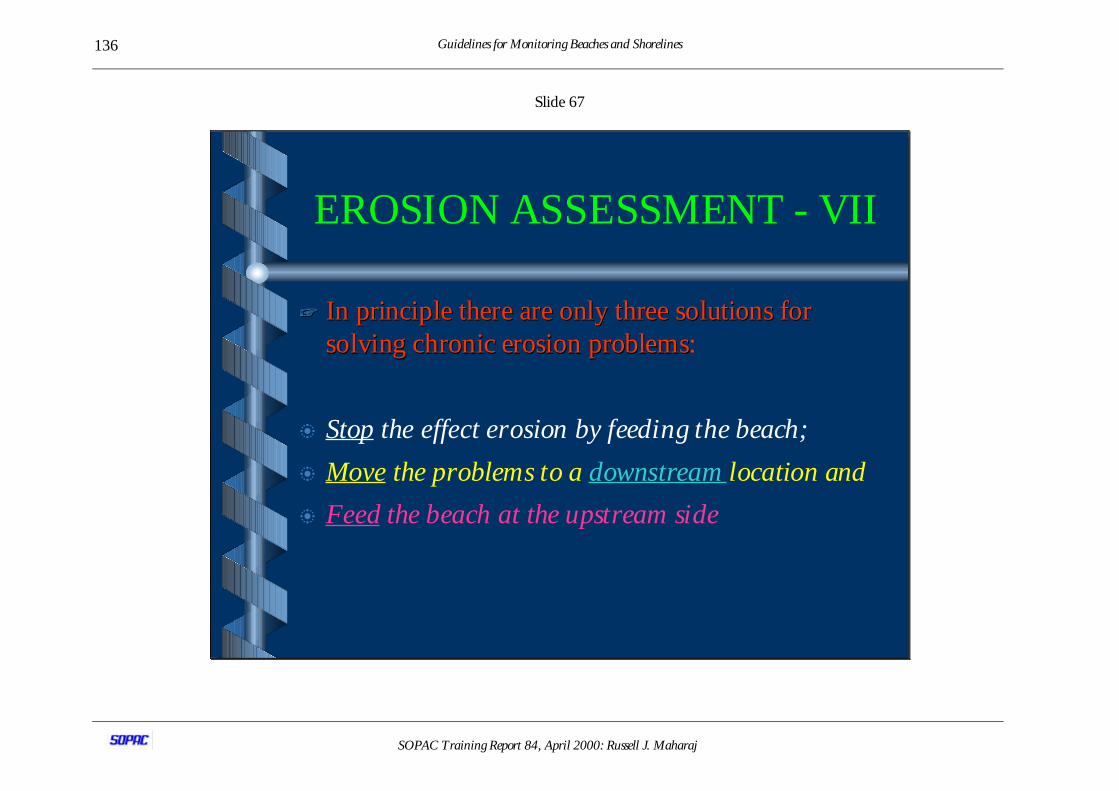
Guidelines for Monitoring Beaches and Shorelines
SOPAC Training Report 84, April 2000: Russell J. Maharaj
136
Slide 67
EROSION ASSESSMENT - VII
++ In principle there are only three solutions forIn principle there are only three solutions forsolving chronic erosion problemssolving chronic erosion problems:
b Stop the e ffec t erosion by feeding the beach;
b Move the problems to a downs tream location and
b Feed the beach at the upstream side
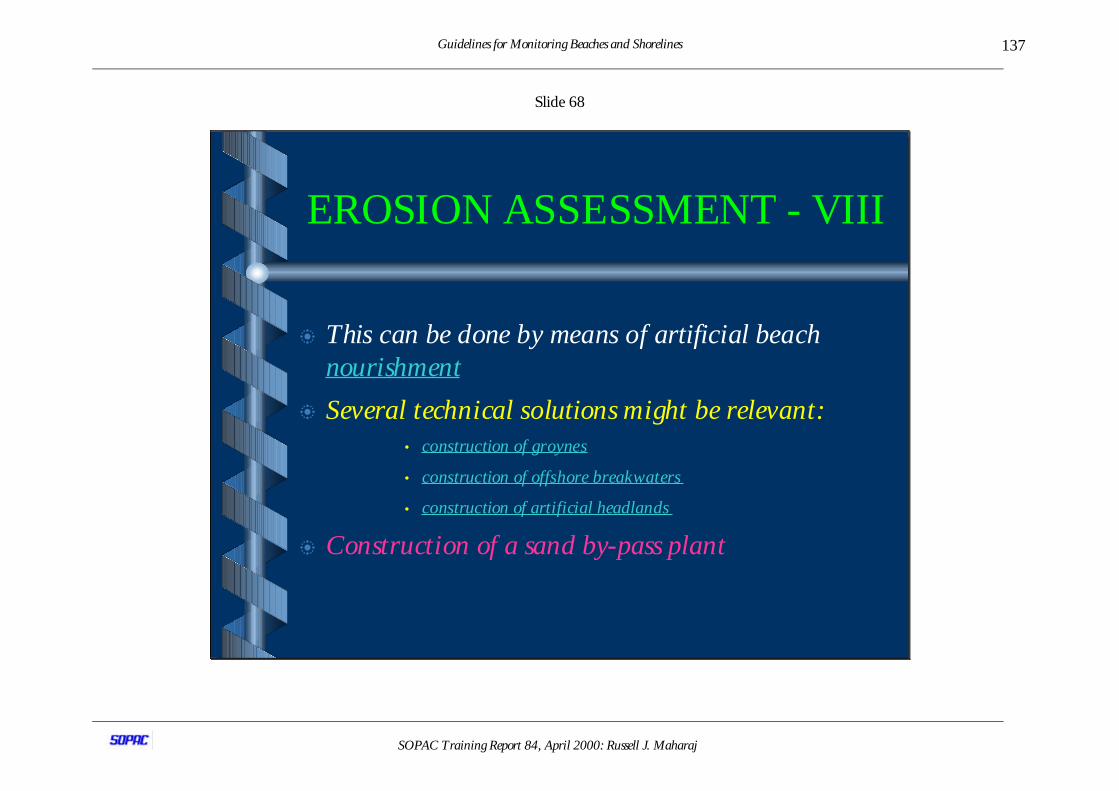
Guidelines for Monitoring Beaches and Shorelines
SOPAC Training Report 84, April 2000: Russell J. Maharaj
137
Slide 68
EROSION ASSESSMENT - VIII
b This can be done by means o f artific ial beachnourishment
b Several technical s o lutions might be relevant:• cons truc tion of groyne s
• cons truc tion of offs hore breakwaters
• cons truc tion of artificial headlands
b Construction of a sand by-pass plant
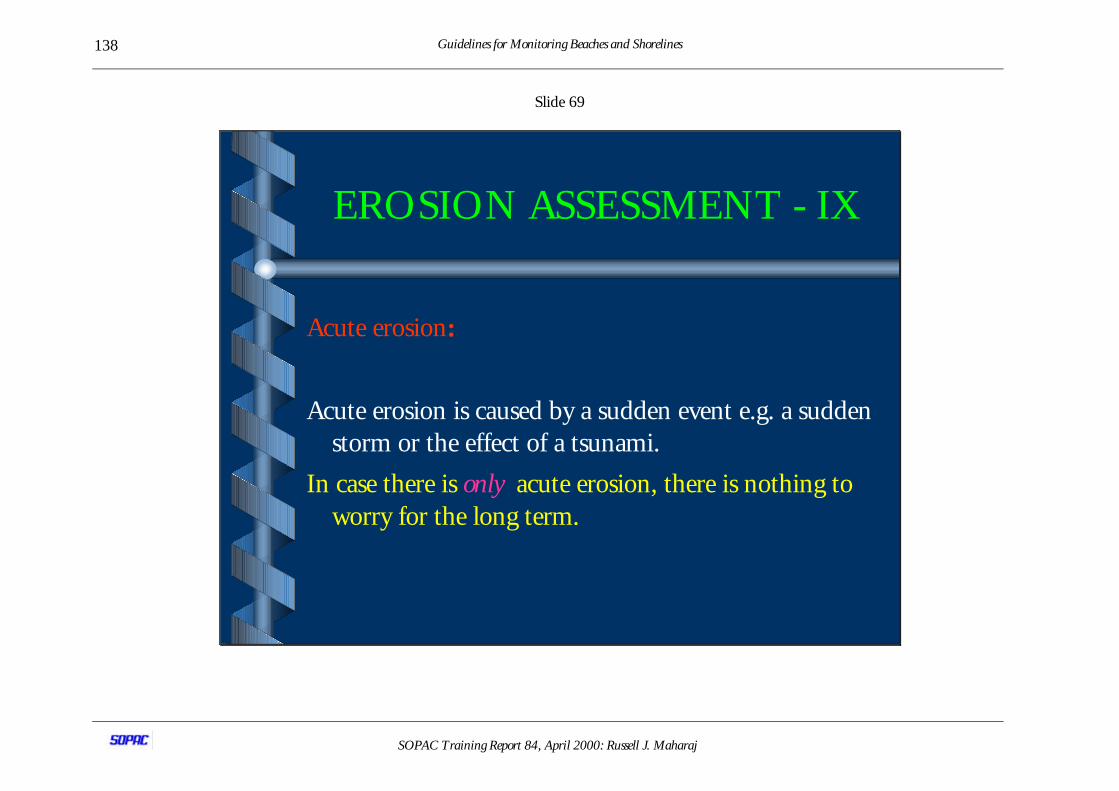
Guidelines for Monitoring Beaches and Shorelines
SOPAC Training Report 84, April 2000: Russell J. Maharaj
138
Slide 69
EROSION ASSESSMENT - IX
Acute erosion:
Acute erosion is caused by a sudden event e.g. a suddenstorm or the effect of a tsunami.
In case there is only acute erosion, there is nothing toworry for the long term.
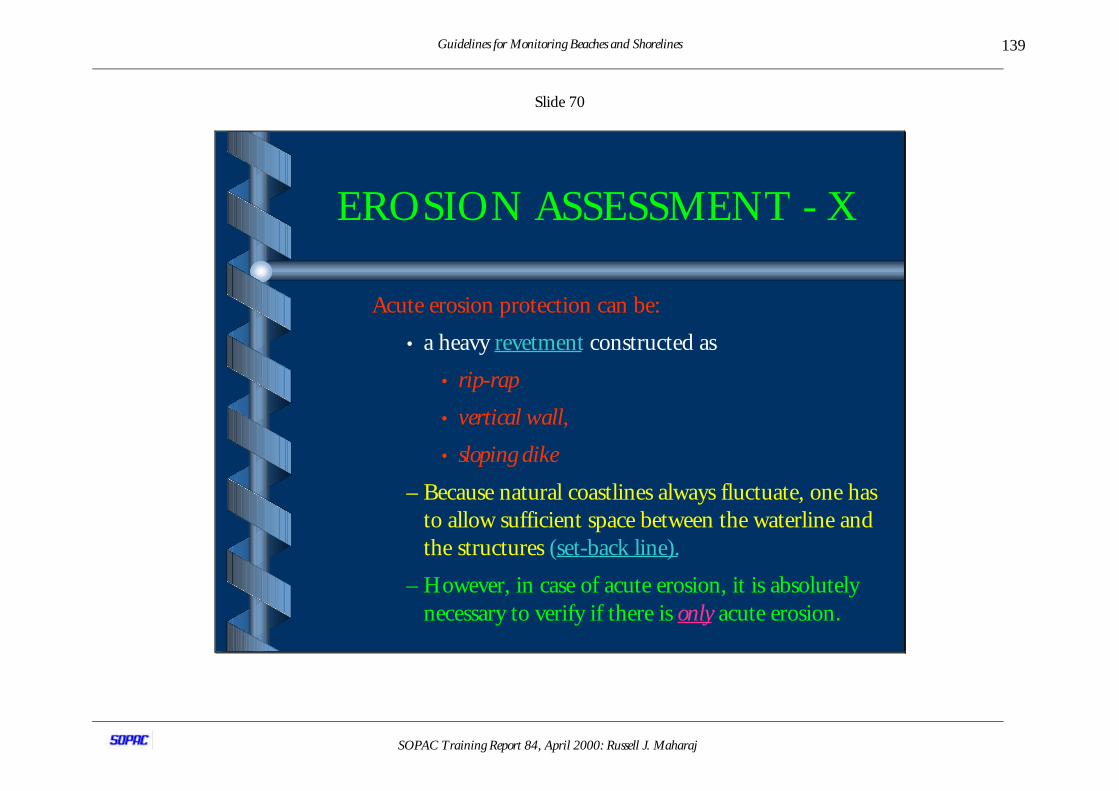
Guidelines for Monitoring Beaches and Shorelines
SOPAC Training Report 84, April 2000: Russell J. Maharaj
139
Slide 70
EROSION ASSESSMENT - X
Acute erosion protection can be:
• a heavy revetment constructed as
• rip-rap
• vertical wall,
• sloping dike
– Because natural coastlines always fluctuate, one hasto allow sufficient space between the waterline andthe structures (set-back line).
– However, in case of acute erosion, it is absolutelynecessary to verify if there is only acute erosion.
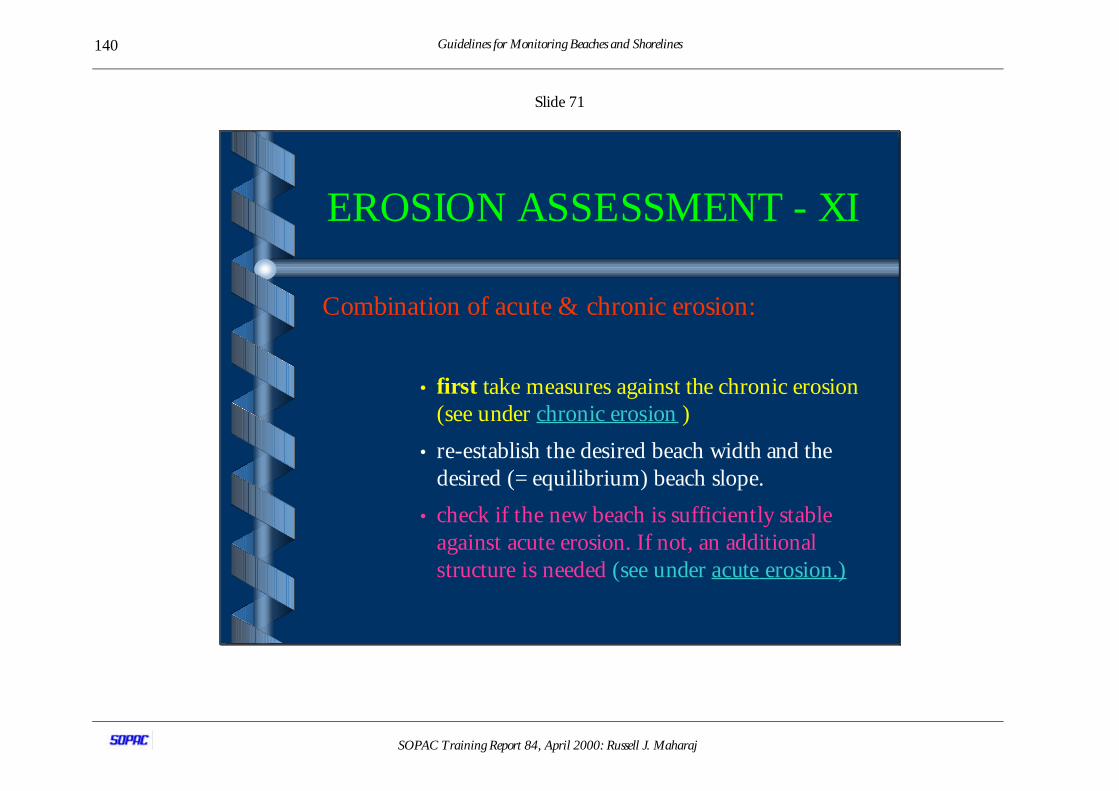
Guidelines for Monitoring Beaches and Shorelines
SOPAC Training Report 84, April 2000: Russell J. Maharaj
140
Slide 71
EROSION ASSESSMENT - XI
Combination of acute & chronic erosion:
• first take measures against the chronic erosion(see under chronic erosion )
• re-establish the desired beach width and thedesired (= equilibrium) beach slope.
• check if the new beach is sufficiently stableagainst acute erosion. If not, an additionalstructure is needed (see under acute erosion.)
Guidelines for Monitoring Beaches and Shorelines
SOPAC Training Report 84, April 2000: Russell J. Maharaj
141
Slide 72
EROSION ASSESSMENT - XII
When did the erosion start ?
+ Eros ion never s tarts without a reason.
+ In many cases the eros ion always exis ted, but wasnever a problem.
Guidelines for Monitoring Beaches and Shorelines
SOPAC Training Report 84, April 2000: Russell J. Maharaj
142
Slide 73
EROSION ASSESSMENT - XIII
How much is the erosion ?
, Both for the analys is o f the problem as well as forde s igning the s o lution, it is nece s sary to quantifythe eros ion rate .
, This c an be done in the eas ie s t way by analys ingbeach measurements. Compare former coastalprofile s with pre s ent day profile s .
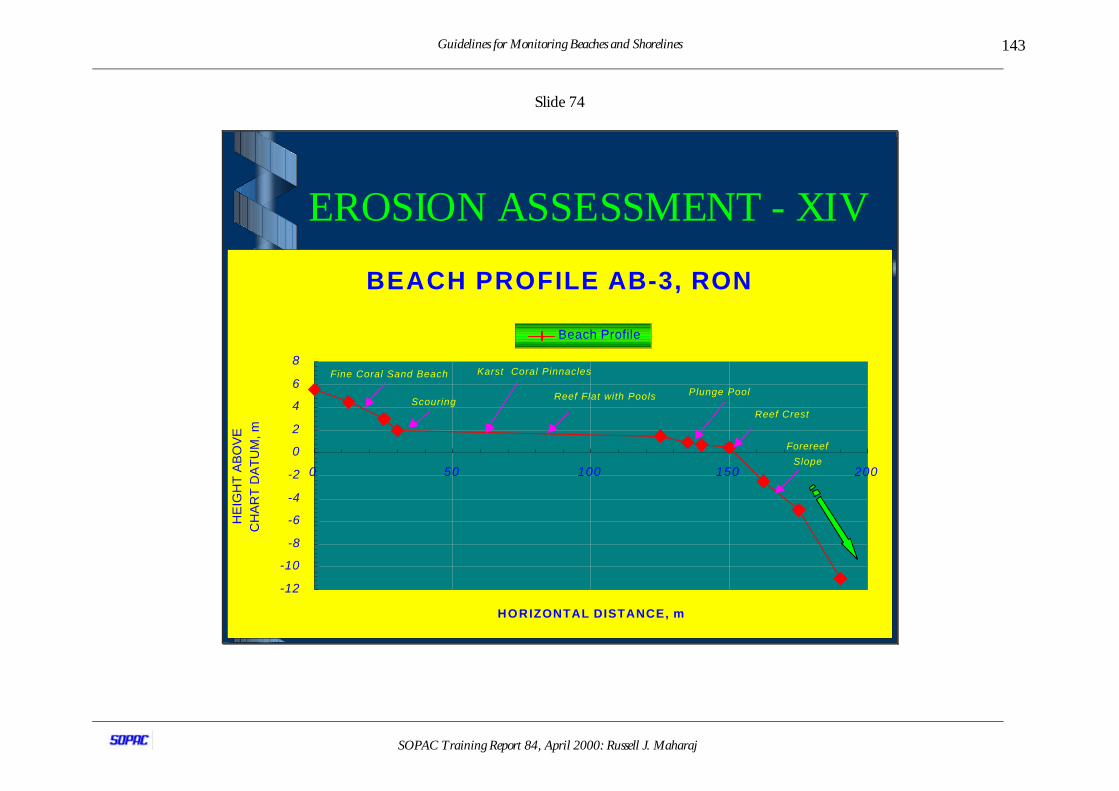
Guidelines for Monitoring Beaches and Shorelines
SOPAC Training Report 84, April 2000: Russell J. Maharaj
143
Slide 74
EROSION ASSESSMENT - XIV
BEACH PROFILE AB-3, RON
-12
-10
-8
-6
-4
-2
0
2
4
6
8
0 50 100 150 200
HORIZONTAL DISTANCE, m
HE
IGH
T A
BO
VE
C
HA
RT
DA
TU
M, m
Beach Profile
Reef Crest
Reef Flat with Pools
Forereef
Slope
Plunge Pool
Karst Coral PinnaclesFine Coral Sand Beach
Scouring
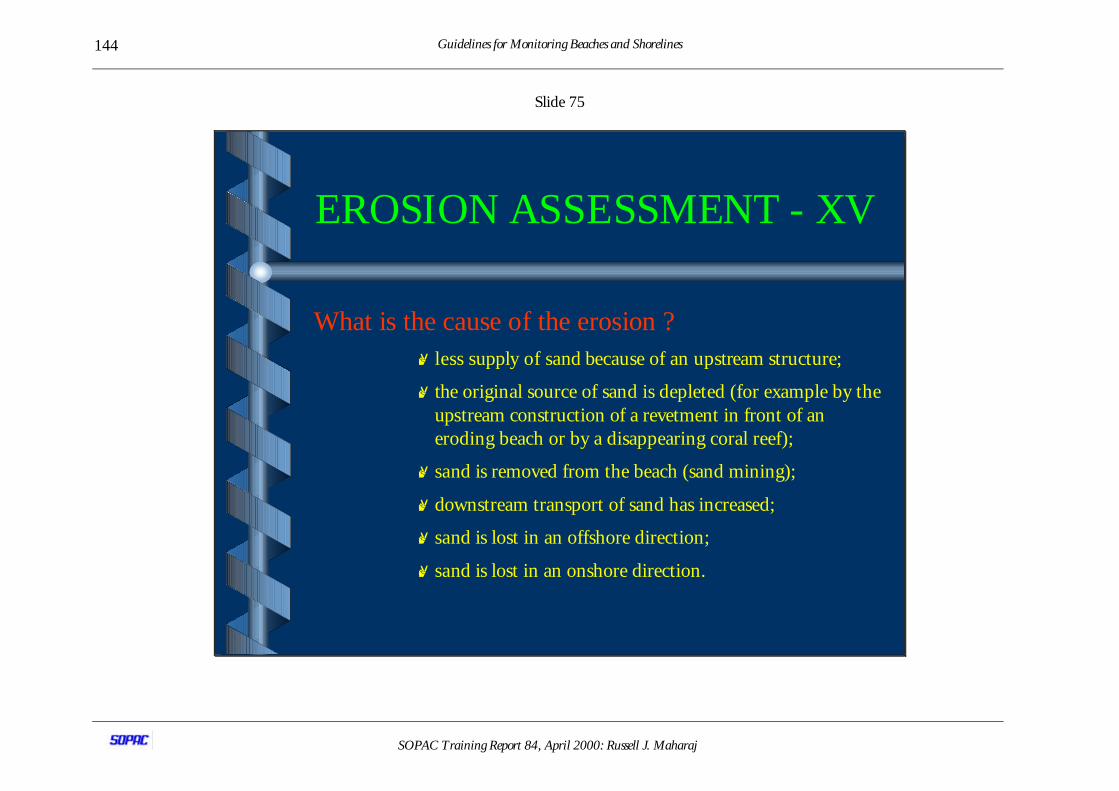
Guidelines for Monitoring Beaches and Shorelines
SOPAC Training Report 84, April 2000: Russell J. Maharaj
144
Slide 75
EROSION ASSESSMENT - XV
What is the cause of the erosion ?, less supply of sand because of an upstream structure;
, the original source of sand is depleted (for example by theupstream construction of a revetment in front of aneroding beach or by a disappearing coral reef);
, sand is removed from the beach (sand mining);
, downstream transport of sand has increased;
, sand is lost in an offshore direction;
, sand is lost in an onshore direction.
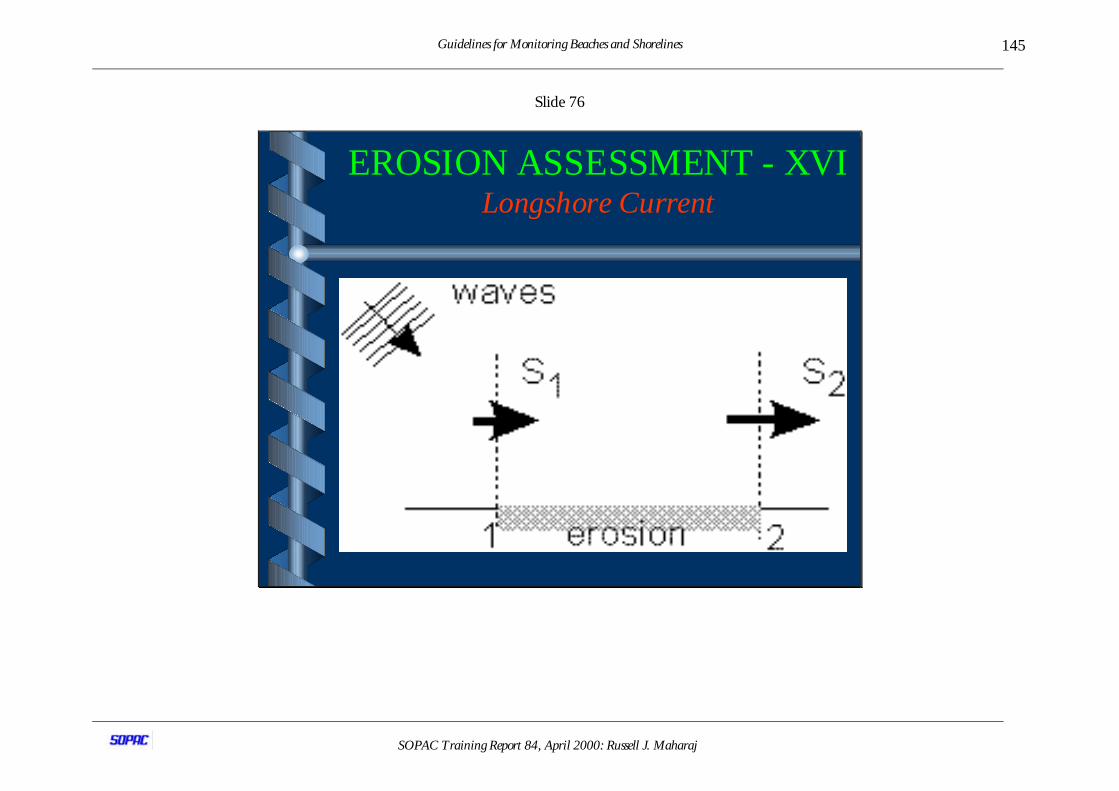
Guidelines for Monitoring Beaches and Shorelines
SOPAC Training Report 84, April 2000: Russell J. Maharaj
145
Slide 76
EROSION ASSESSMENT - XVILong shore Current
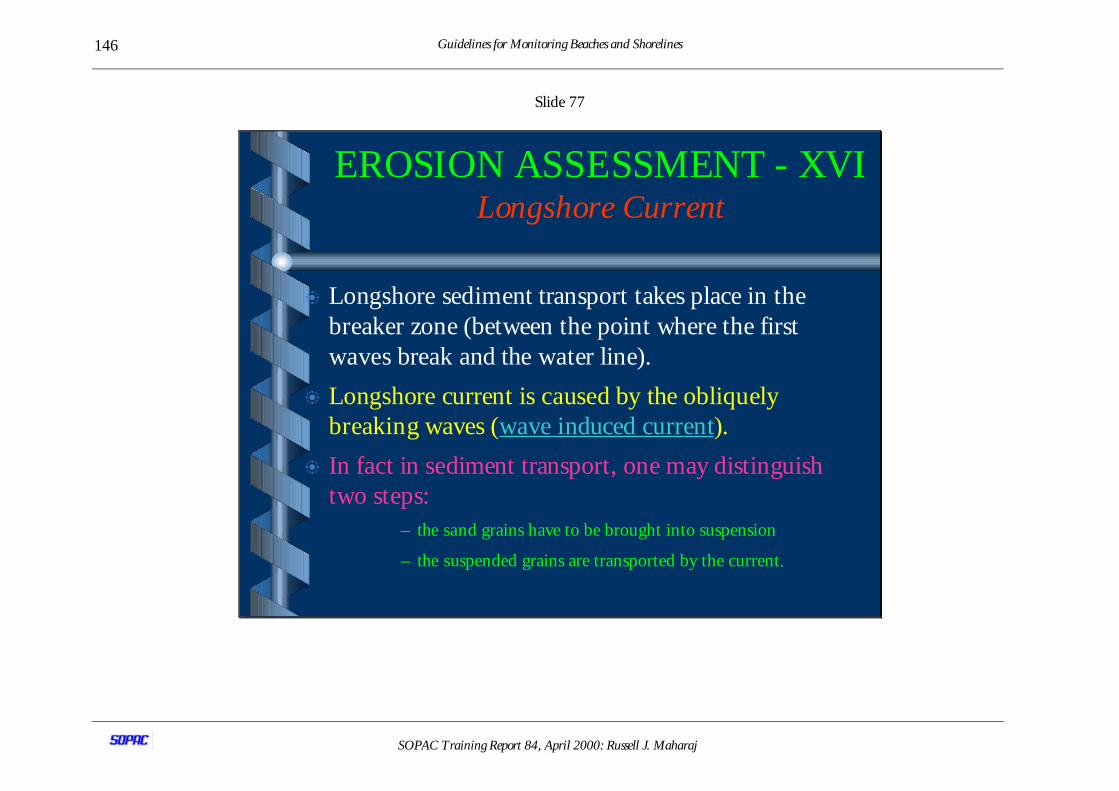
Guidelines for Monitoring Beaches and Shorelines
SOPAC Training Report 84, April 2000: Russell J. Maharaj
146
Slide 77
EROSION ASSESSMENT - XVILong shore Current
b Longshore sediment transport takes place in thebreaker zone (between the point where the firstwaves break and the water line).
b Longshore current is caused by the obliquelybreaking waves (wave induced current).
b In fact in sediment transport, one may distinguishtwo steps:
– the sand grains have to be brought into suspension
– the suspended grains are transported by the current.
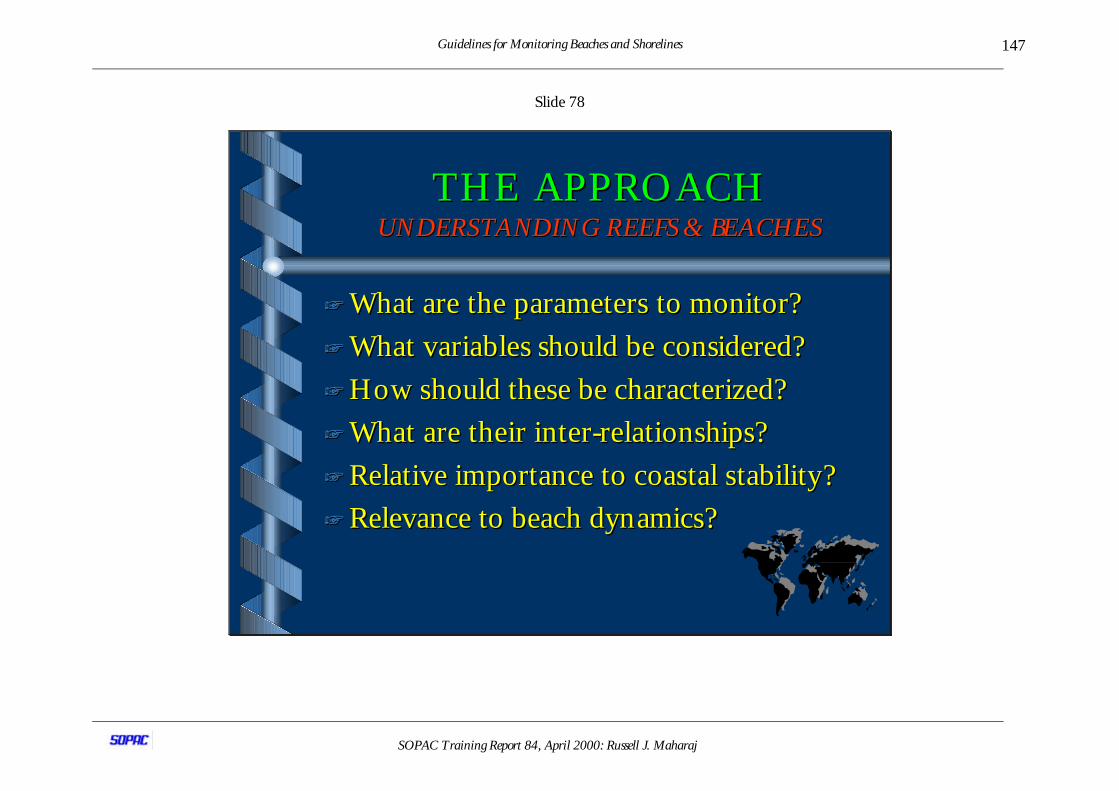
Guidelines for Monitoring Beaches and Shorelines
SOPAC Training Report 84, April 2000: Russell J. Maharaj
147
Slide 78
THE APPROACHTHE APPROACHUNDERSTANDING REEFS & BEACHESUNDERSTANDING REEFS & BEACHES
++ What are the parameters to monitor?What are the parameters to monitor?
++ What variables should be considered?What variables should be considered?
++ How should these be characterized?How should these be characterized?
++ What are their inter-relationships?What are their inter-relationships?
++ Relative importance to coastal stability?Relative importance to coastal stability?
++ Relevance to beach dynamics?Relevance to beach dynamics?
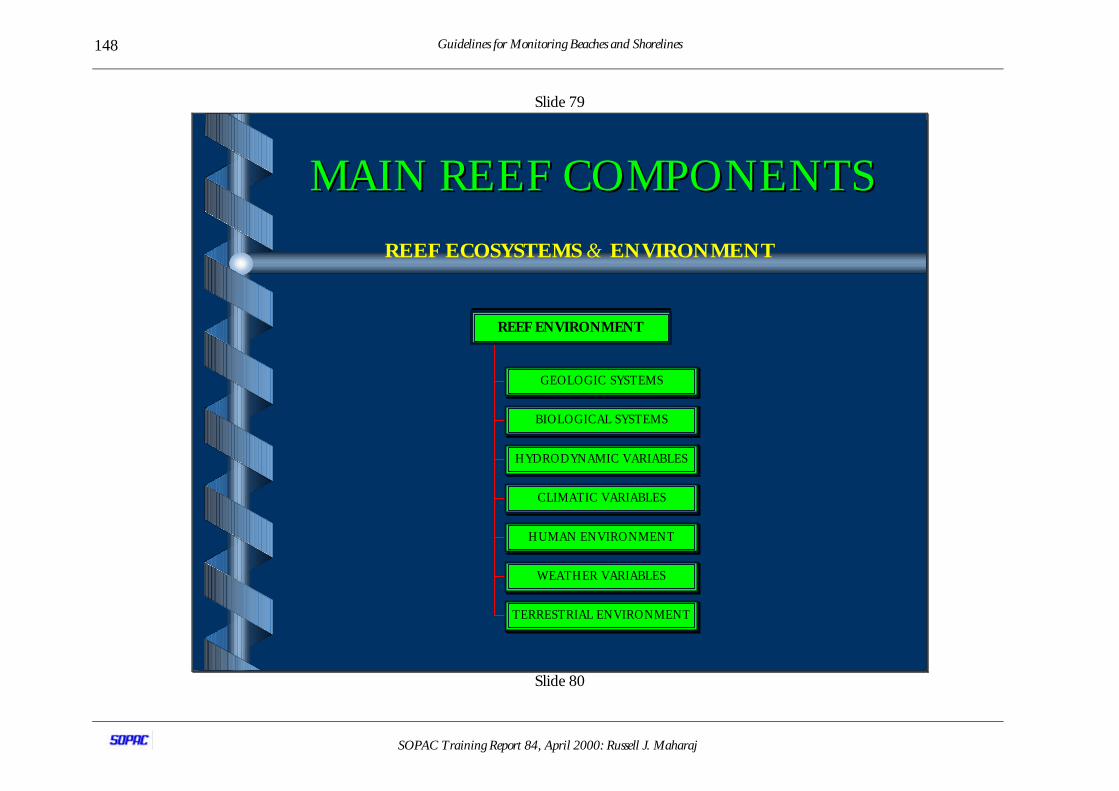
Guidelines for Monitoring Beaches and Shorelines
SOPAC Training Report 84, April 2000: Russell J. Maharaj
148
Slide 79
MAIN REEF COMPONENTSMAIN REEF COMPONENTS
REEF ECOSYSTEMS & ENVIRONMENT
GEOLOGIC SYSTEMS
BIOLOGICAL SYSTEMS
HYDRODYNAMIC VARIABLES
CLIMATIC VARIABLES
HUMAN ENVIRONMENT
WEATHER VARIABLES
TERRESTRIAL ENVIRONMENT
REEF ENVIRONMENT
Slide 80
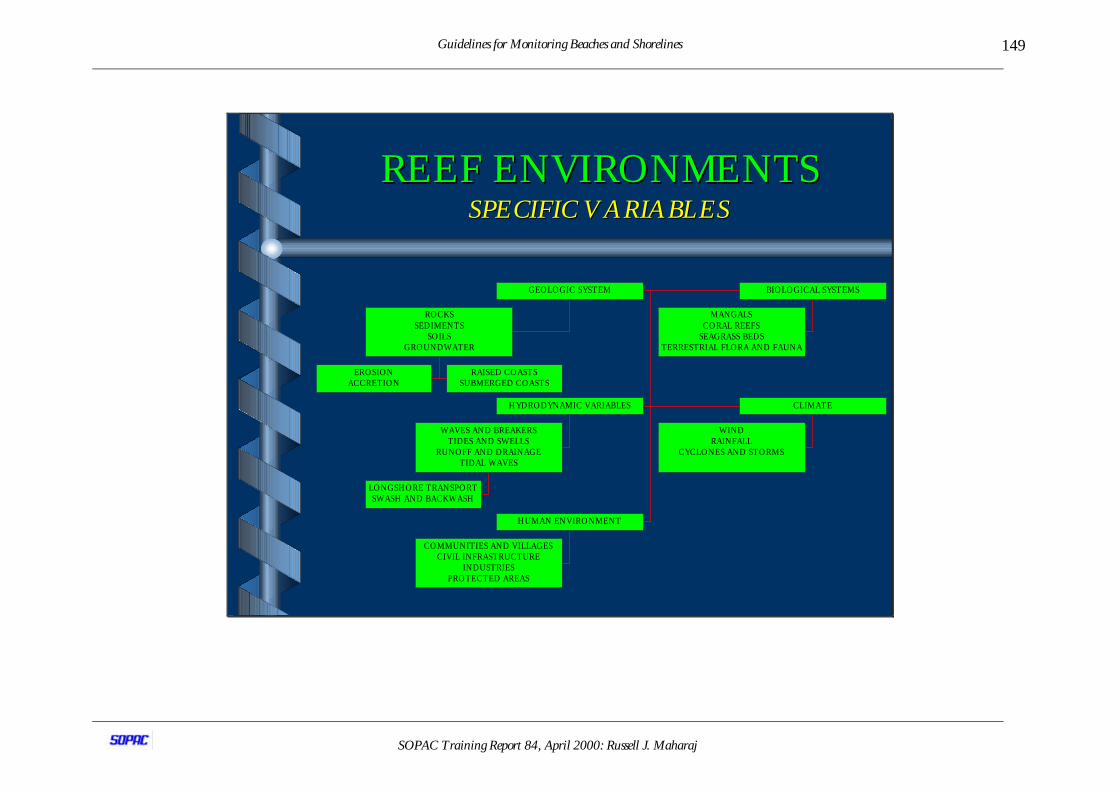
Guidelines for Monitoring Beaches and Shorelines
SOPAC Training Report 84, April 2000: Russell J. Maharaj
149
REEF ENVIRONMENTSREEF ENVIRONMENTSSPECIFIC VARIABLESSPECIFIC VARIABLES
EROSIONACCRETION
RAISED COASTSSUBMERGED COASTS
ROCKSSEDIMENTS
SOILSGROUNDWATER
GEOLOGIC SYSTEM
MANGALSCORAL REEFS
SEAGRASS BEDSTERRESTRIAL FLORA AND FAUNA
BIOLOGICAL SYSTEMS
LONGSHORE TRANSPORTSWASH AND BACKWASH
WAVES AND BREAKERSTIDES AND SWELLS
RUNOFF AND DRAINAGETIDAL WAVES
HYDRODYNAMIC VARIABLES
WINDRAINFALL
CYCLONES AND STORMS
CLIMATE
COMMUNITIES AND VILLAGESCIVIL INFRASTRUCTURE
INDUSTRIESPROTECTED AREAS
HUMAN ENVIRONMENT
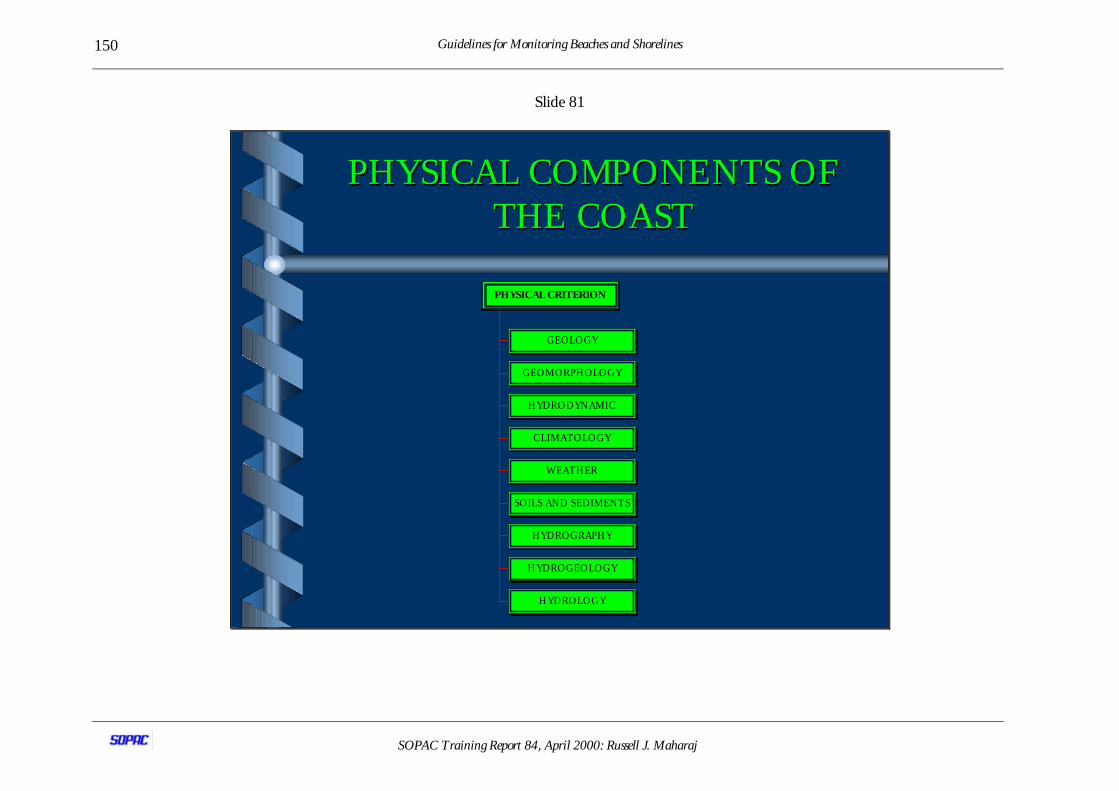
Guidelines for Monitoring Beaches and Shorelines
SOPAC Training Report 84, April 2000: Russell J. Maharaj
150
Slide 81
PHYSICAL COMPONENTS OFPHYSICAL COMPONENTS OFTHE COASTTHE COAST
GEOLOGY
GEOMORPHOLOGY
HYDRODYNAMIC
CLIMATOLOGY
WEATHER
SOILS AND SEDIMENTS
HYDROGRAPHY
HYDROGEOLOGY
HYDROLOGY
PHYSICAL CRITERION
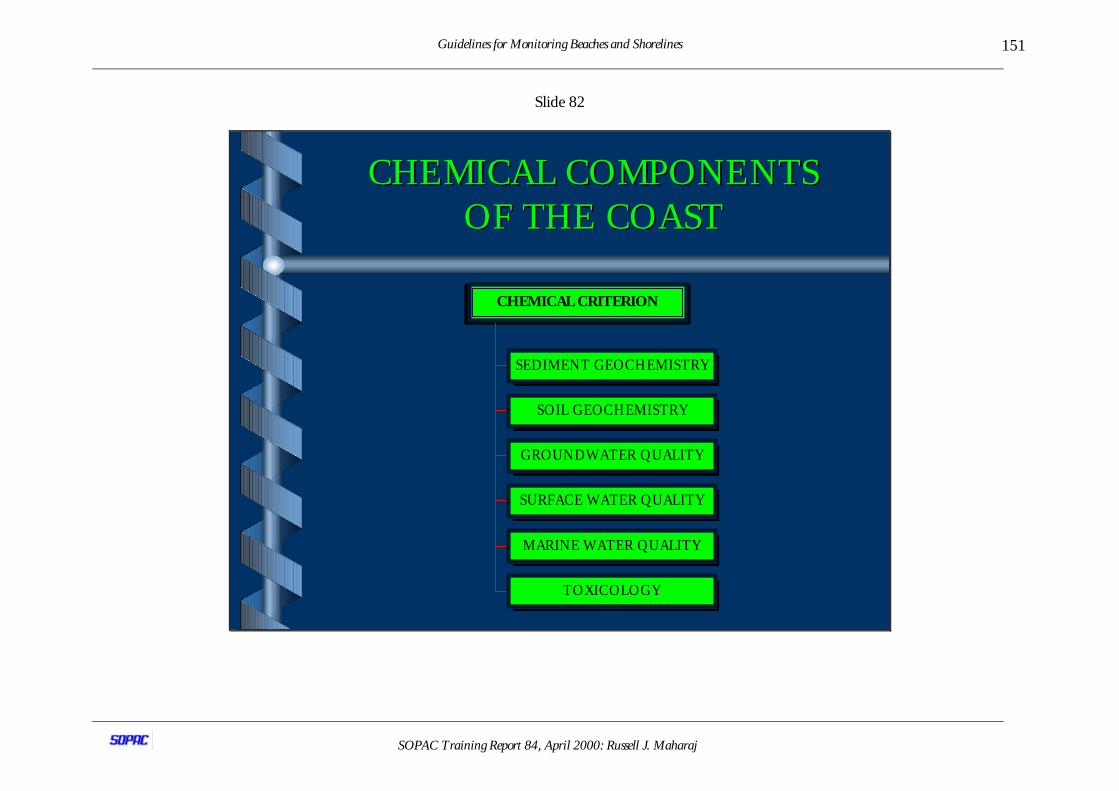
Guidelines for Monitoring Beaches and Shorelines
SOPAC Training Report 84, April 2000: Russell J. Maharaj
151
Slide 82
CHEMICAL COMPONENTSCHEMICAL COMPONENTSOF THE COASTOF THE COAST
SEDIMENT GEOCHEMISTRY
SOIL GEOCHEMISTRY
GROUNDWATER QUALITY
SURFACE WATER QUALITY
MARINE WATER QUALITY
TOXICOLOGY
CHEMICAL CRITERION
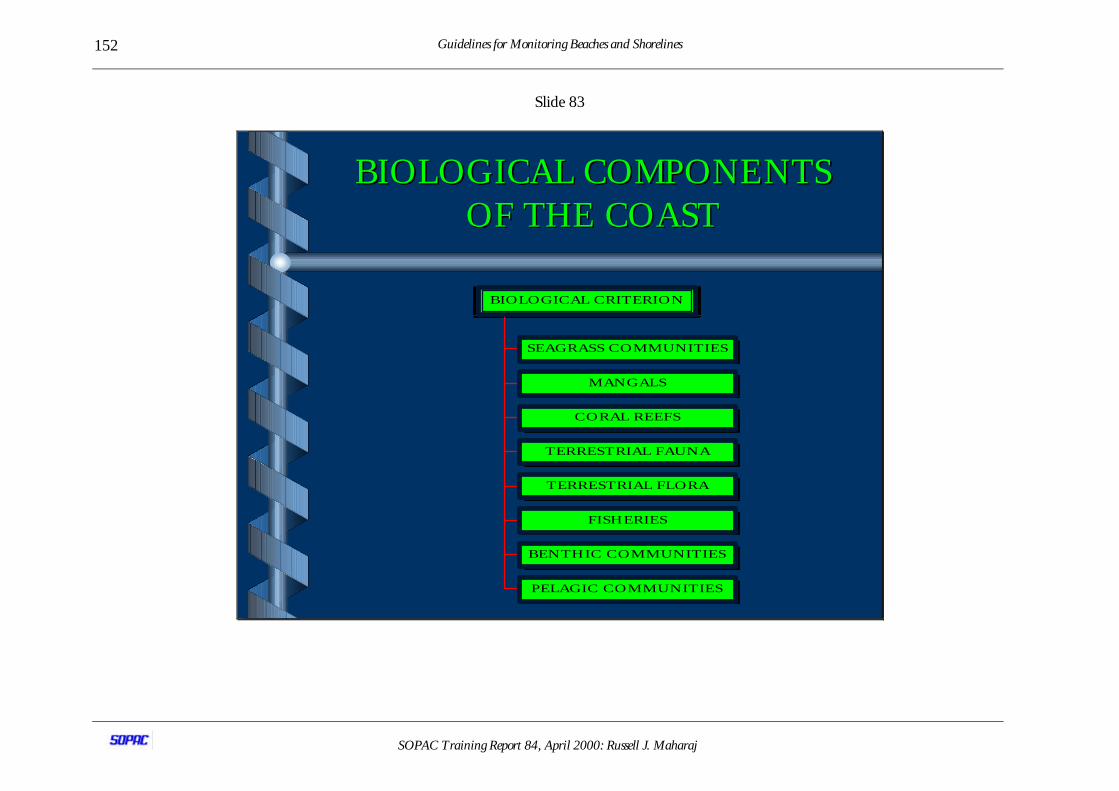
Guidelines for Monitoring Beaches and Shorelines
SOPAC Training Report 84, April 2000: Russell J. Maharaj
152
Slide 83
BIOLOGICAL COMPONENTSBIOLOGICAL COMPONENTSOF THE COASTOF THE COAST
SEAGRASS COMMUNITIES
MANGALS
CORAL REEFS
TERRESTRIAL FAUNA
TERRESTRIAL FLORA
FISHERIES
BENTHIC COMMUNITIES
PELAGIC COMMUNITIES
BIOLOGICAL CRITERION
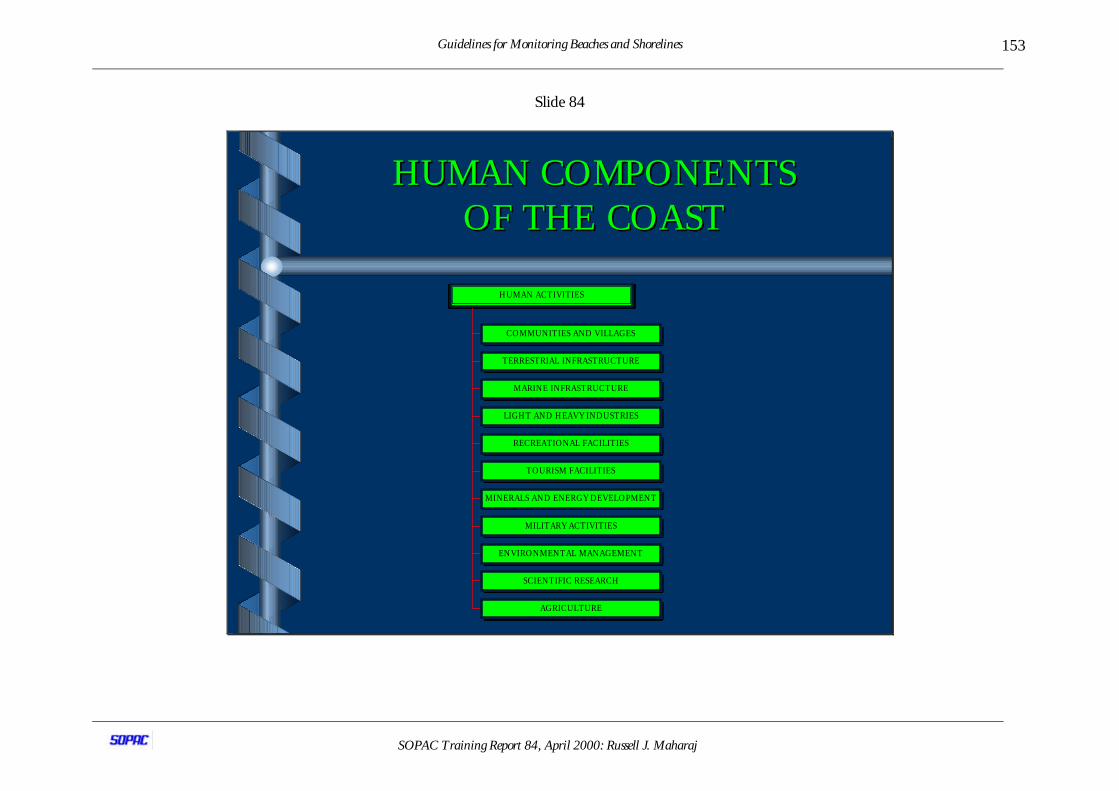
Guidelines for Monitoring Beaches and Shorelines
SOPAC Training Report 84, April 2000: Russell J. Maharaj
153
Slide 84
HUMAN COMPONENTSHUMAN COMPONENTSOF THE COASTOF THE COAST
COMMUNITIES AND VILLAGES
TERRESTRIAL INFRASTRUCTURE
MARINE INFRASTRUCTURE
LIGHT AND HEAVY INDUSTRIES
RECREATIONAL FACILITIES
TOURISM FACILITIES
MINERALS AND ENERGY DEVELOPMENT
MILITARY ACTIVITIES
ENVIRONMENTAL MANAGEMENT
SCIENTIFIC RESEARCH
AGRICULTURE
HUMAN ACTIVITIES
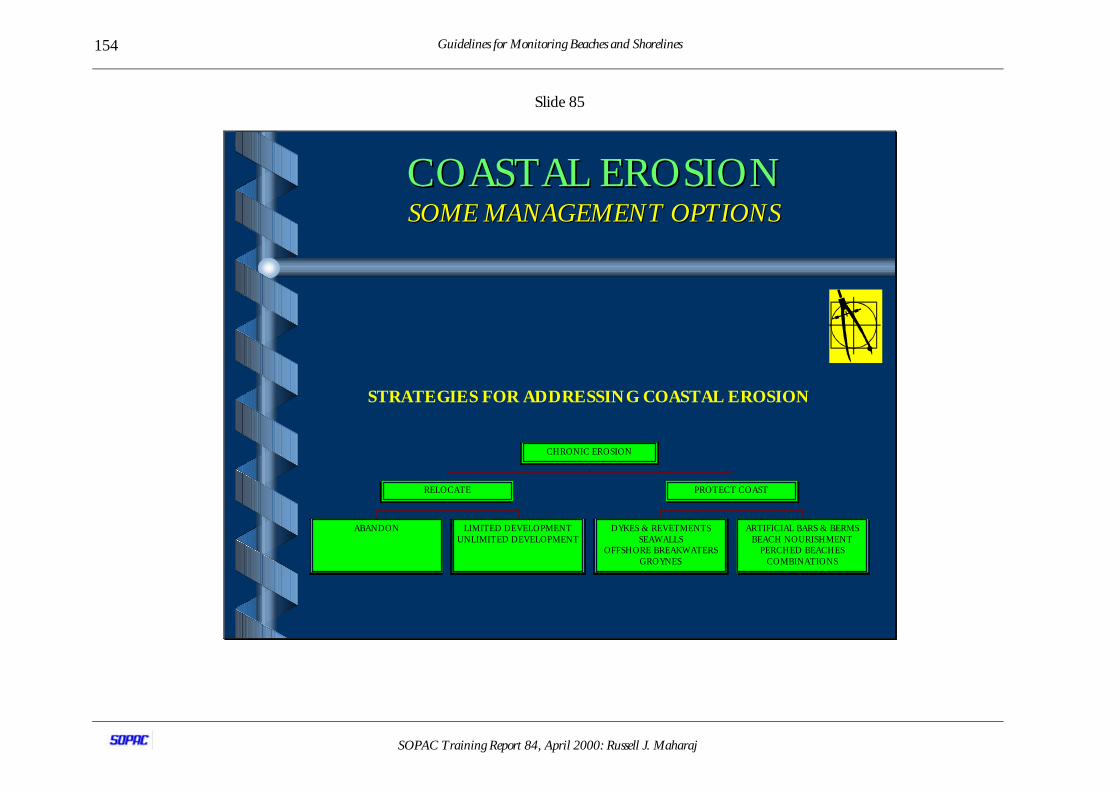
Guidelines for Monitoring Beaches and Shorelines
SOPAC Training Report 84, April 2000: Russell J. Maharaj
154
Slide 85
COASTAL EROSIONCOASTAL EROSIONSOME MANAGEMENT OPTIONSSOME MANAGEMENT OPTIONS
STRATEGIES FOR ADDRESSING COASTAL EROSION
ABANDON LIMITED DEVELOPMENTUNLIMITED DEVELOPMENT
RELOCATE
DYKES & REVETMENTSSEAWALLS
OFFSHORE BREAKWATERSGROYNES
ARTIFICIAL BARS & BERMSBEACH NOURISHMENT
PERCHED BEACHESCOMBINATIONS
PROTECT COAST
CHRONIC EROSION
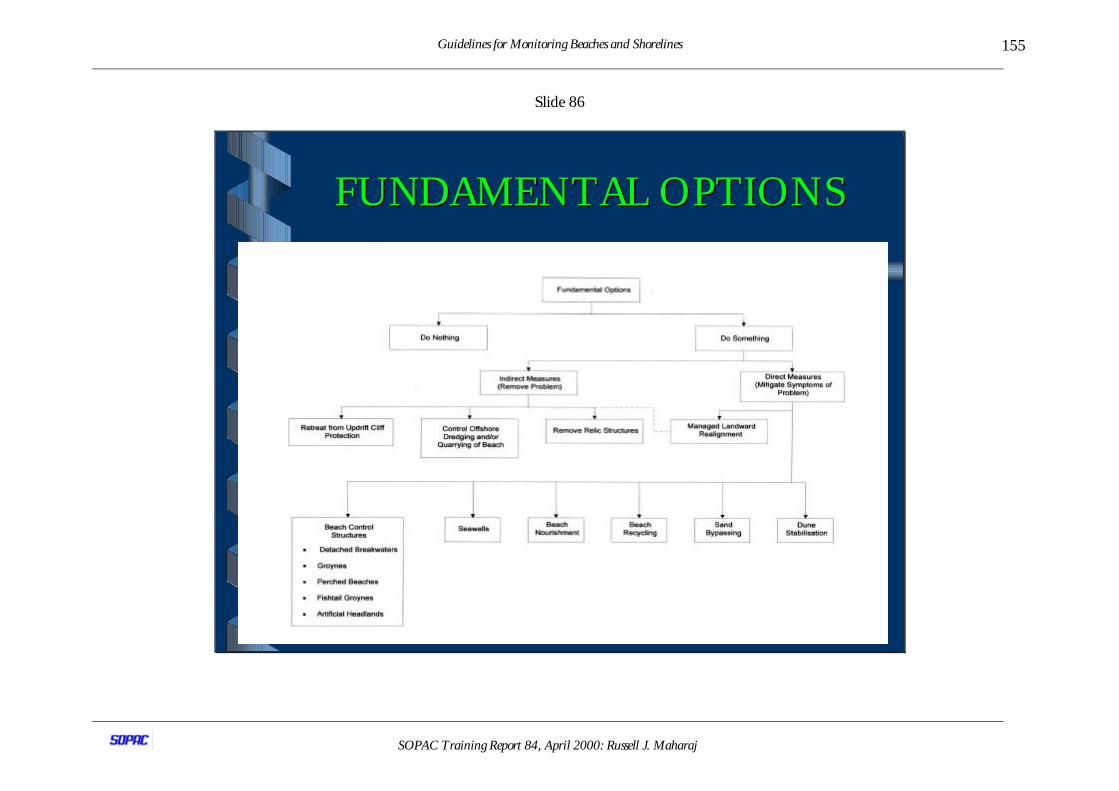
Guidelines for Monitoring Beaches and Shorelines
SOPAC Training Report 84, April 2000: Russell J. Maharaj
155
Slide 86
FUNDAMENTAL OPTIONSFUNDAMENTAL OPTIONS
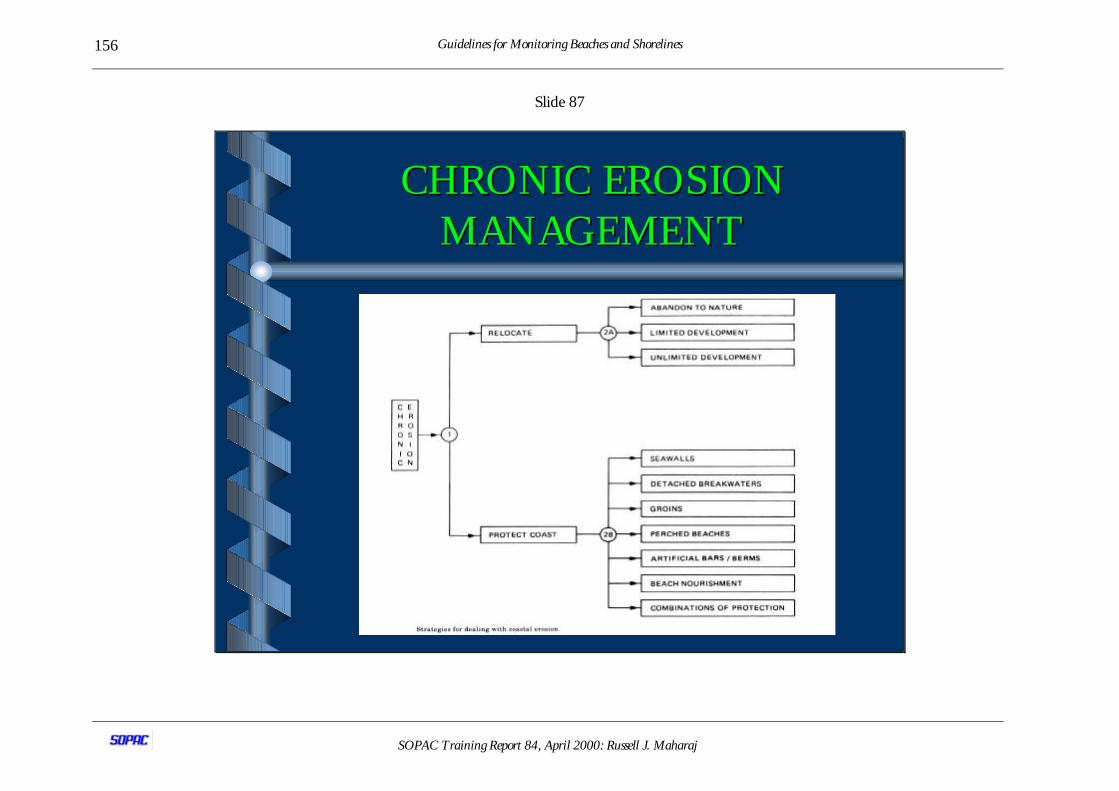
Guidelines for Monitoring Beaches and Shorelines
SOPAC Training Report 84, April 2000: Russell J. Maharaj
156
Slide 87
CHRONIC EROSIONCHRONIC EROSIONMANAGEMENTMANAGEMENT
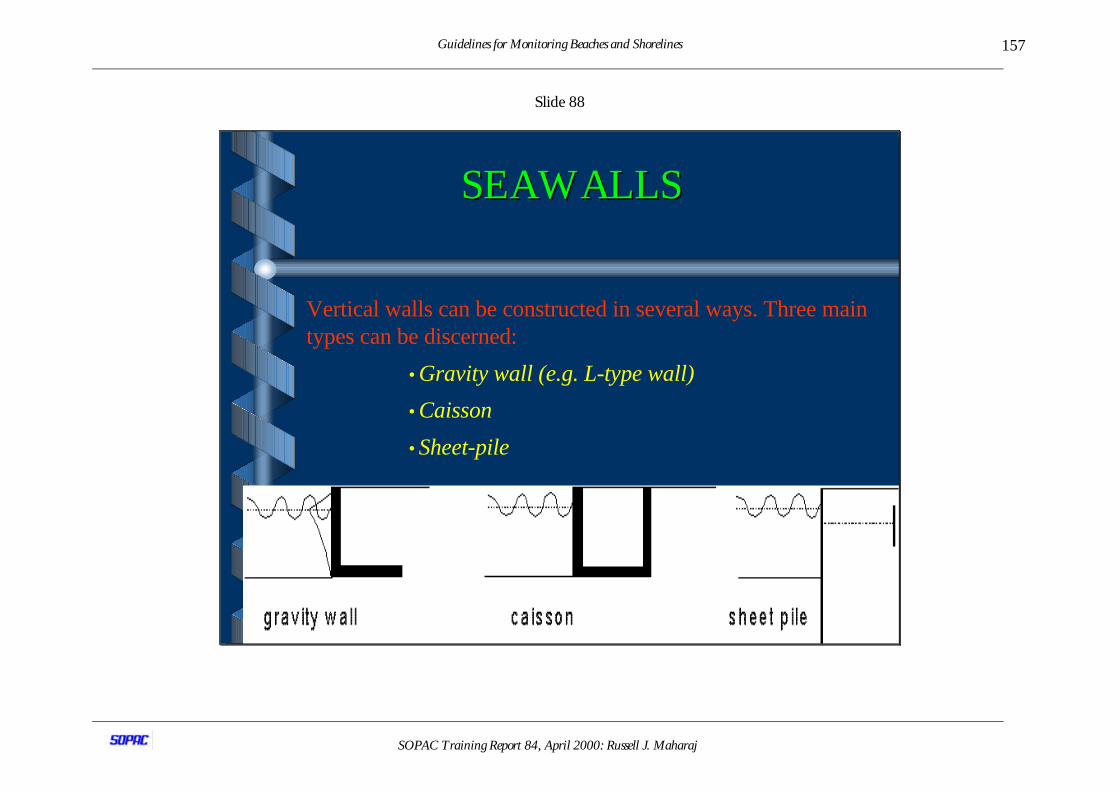
Guidelines for Monitoring Beaches and Shorelines
SOPAC Training Report 84, April 2000: Russell J. Maharaj
157
Slide 88
SEAWALLSSEAWALLS
Vertical walls can be constructed in several ways. Three maintypes can be discerned:
•Gravity wall (e.g. L-type wall)
•Caisson
•Sheet-pile
Guidelines for Monitoring Beaches and Shorelines
SOPAC Training Report 84, April 2000: Russell J. Maharaj
158
Slide 89
REVETMENTS - IREVETMENTS - I
Revetments for protection against wave action:
, There are many types of revetment-structures for theprotection against waves.
, For all types of protection, one has to determine theboundary conditions. Basically this is the design wavecondition.
, For most revetment-structures you need to know thesignificant design wave height (Hs) and the accompanyingwave period.
Guidelines for Monitoring Beaches and Shorelines
SOPAC Training Report 84, April 2000: Russell J. Maharaj
159
Slide 90
REVETMENTS - IIREVETMENTS - II
When you have your wave boundary conditions available,the next step is to select a type of revetment. This can be:
•a rip-rap structure
•a construction with placed blocks
•a vertical wall
•a structure with an asphalt slope
•a structure with gabions
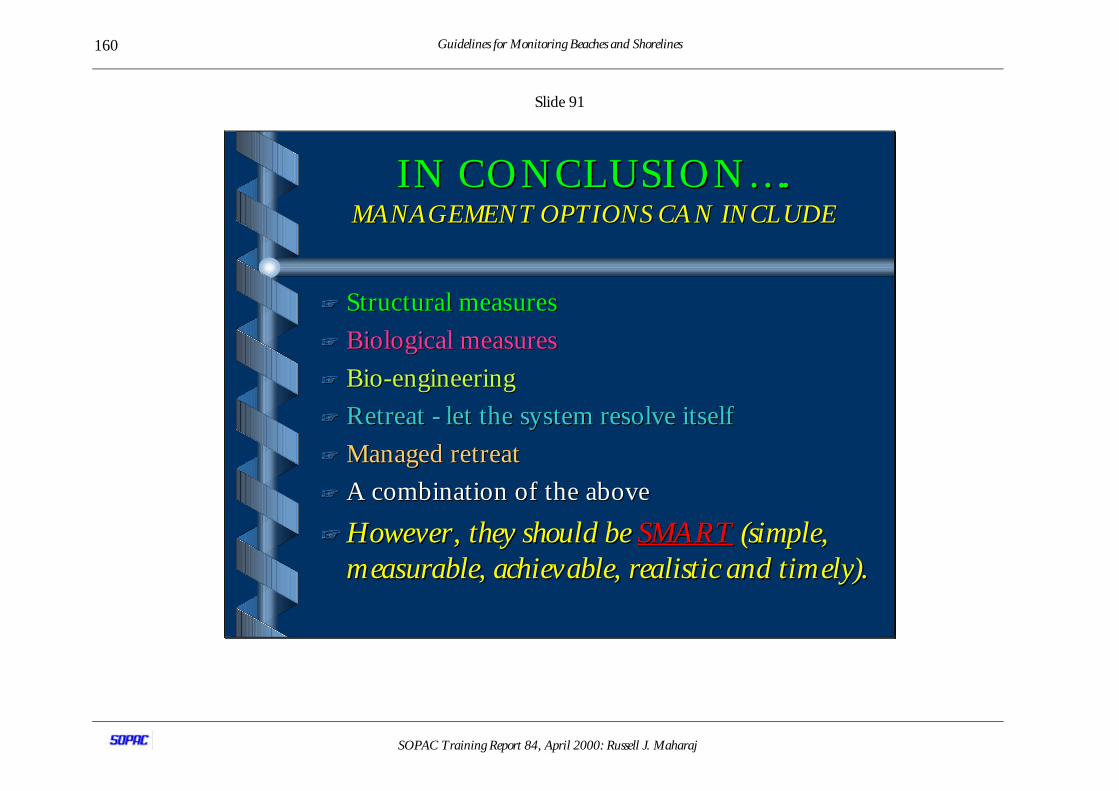
Guidelines for Monitoring Beaches and Shorelines
SOPAC Training Report 84, April 2000: Russell J. Maharaj
160
Slide 91
IN CONCLUSION….IN CONCLUSION….MANAGEMENT OPTIONS CAN INCLUDEMANAGEMENT OPTIONS CAN INCLUDE
++ Structural measuresStructural measures
++ Biological measuresBiological measures
++ Bio-engineeringBio-engineering
++ Retreat - let the sy stem resolve itselfRetreat - let the sy stem resolve itself
++ Managed retreatManaged retreat
++ A combination of the aboveA combination of the above
++ Howev e r , they should be Howe v e r , they should be SMARTSMART (simple, (simple,m easurable, achiev able, realistic and tim ely).m easurable, achiev able, realistic and tim ely).
Guidelines for Monitoring Beaches and Shorelines
SOPAC Training Report 84, April 2000: Russell J. Maharaj
161
Slide 92
FURTHER REFERENCESFURTHER REFERENCES
+US Army Waterways Experiment Station, 1999. ACES. Vicksburg, USA.+Clark, J. 1995. Coastal Zone Management Handbook. CRC Press, USA.+Environmental & technical guidelines: EIS & EIA’s - various publications.+Science, Vol. 239, 1986, 280-285.+ NRC, 1989. Communication in Risk Management. Washington/DC.+ Carter et al, 1995. Introducing RISKMAN Methodology. Blackwell, UK.+ T M Willimas Int. J. Proj. Mangt., Vol, 14, 1996, 129-130 & 185-186.+ CIRIA, 1996. Control of risk: a guide to the sy stematic management of riskfrom construction. CIRIA Report 125.+CIRIA, 1991. Manual on the use of rock in coastal and shoreline engineering.CIRIA Report 83.+ CIRIA, 1996. Beach management manual. CIRIA Report 153.+ Simon et al, 1997. Project risk analy sis and management (PRAM) guide.APM, High. Wycombe.
Guidelines for Monitoring Beaches and Shorelines
SOPAC Training Report 84, April 2000: Russell J. Maharaj
162
Slide 93
FURTHER REFERENCESFURTHER REFERENCES
+Sims, I. 1999. Construction risks in coastal engineering. Thomas Telford,London.+ ICE & IOA, 1998. Risk analysis and management for projects. ThomasTelford, UK.+Van Rijn, T. 1999. Beaches Handbook. Aqua Publications, USA.+Van Rijn, T. 1995. Handbook of Sediment Transport. Delft Hydraulics.
15.2Coastal Adaptation Technologies: Response to Sea-Level Changes
Guidelines for Monitoring Beaches and Shorelines
SOPAC Training Report 84, April 2000: Russell J. Maharaj
163
Slide 1
COASTAL ADAPTATION TECHNOLOGIESRESPONSE TO SEA LEVEL CHANGES
Russell J. Maharaj
Commonwealth Secretariat /CFTC Expert
South Pacific Applied Geoscience Commission (SOPAC)
Suva, Fiji
LectureThe Climate Change:
Vulnerability and Adaptation CourseMarine Studies Programme
The University of the South PacificSuva, Fiji
15th September, 1999
SOPACSOPAC
Slide 2
Guidelines for Monitoring Beaches and Shorelines
SOPAC Training Report 84, April 2000: Russell J. Maharaj
164
OUTLINE OF THE LECTURE
+Background
+Adaptation Technologies: needs and concerns
+What are coastal adaptation technologies
+Coastal adaptation technology transfer
Slide 3
Guidelines for Monitoring Beaches and Shorelines
SOPAC Training Report 84, April 2000: Russell J. Maharaj
165
BACKGROUND
+Global mean sea level is expected to rise in theorder of 20 - 86 cm by 2100, assuming the IS-92aemissions scenario (IPCC)
+There are big uncertainties in sea-level changepredictions?
+…issues not just SLR/ASLR - also ClimateVariability in the short term
Slide 4

Guidelines for Monitoring Beaches and Shorelines
SOPAC Training Report 84, April 2000: Russell J. Maharaj
166
A PACIFIC PERSPECITVE
+Concerns of Pacific SIDS in relation toSLR/ASLR
+What makes them vulnerable?
Slide 5
Guidelines for Monitoring Beaches and Shorelines
SOPAC Training Report 84, April 2000: Russell J. Maharaj
167
PACIFIC CONCERNS -PEOPLE & ENVIRONMENT
+Population/communities, industries andinfrastructure located along the coastline and onsmall oceanic islands.
+Pacific SIDS are small, flat, low-lying,geologically young, affected by frequent naturalhazards and face severe erosion problems:Communities are vulnerable to sea-level changes
Slide 6
Guidelines for Monitoring Beaches and Shorelines
SOPAC Training Report 84, April 2000: Russell J. Maharaj
168
BIOPHYSICAL EFFECTSOF SLR/ASLR
+Increase in coastal floods, erosion and land loss,damage to agriculture
+Increase in salt water intrusion; risinggroundwater tables
+Loss of coastal (terrestrial and marine) flora andfauna: biological productivity
+Damage to and loss of infrastructure,residential facilities: investments
Slide 7
Guidelines for Monitoring Beaches and Shorelines
SOPAC Training Report 84, April 2000: Russell J. Maharaj
169
CLIMATE CHANGE AGGRAVATECOASTAL PROBLEMS
+Climate change is usually blamed for coastalproblems…why?
+But often the problem is related touncontrolled development at eroding coastlines
+Sea state and hydrodynamicsconditions…affect directions of winds andwaves and ultimately coastline evolution
Slide 8
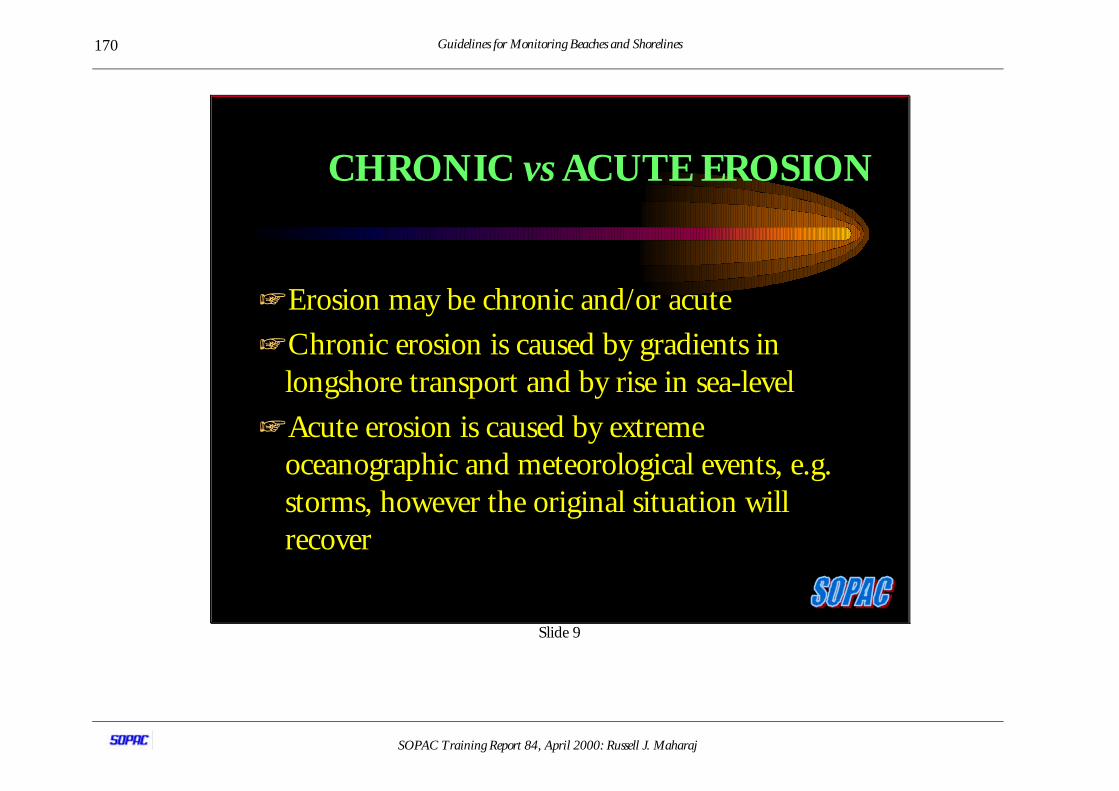
Guidelines for Monitoring Beaches and Shorelines
SOPAC Training Report 84, April 2000: Russell J. Maharaj
170
CHRONIC vs ACUTE EROSION
+Erosion may be chronic and/or acute
+Chronic erosion is caused by gradients inlongshore transport and by rise in sea-level
+Acute erosion is caused by extremeoceanographic and meteorological events, e.g.storms, however the original situation willrecover
Slide 9
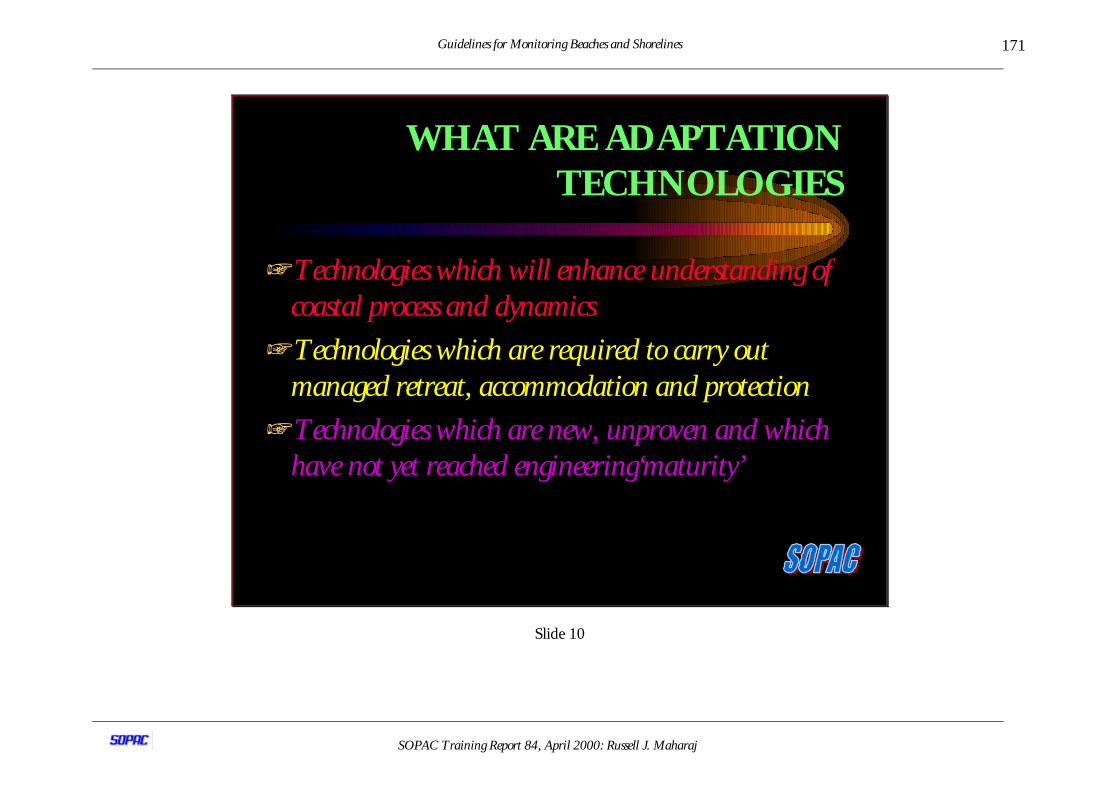
Guidelines for Monitoring Beaches and Shorelines
SOPAC Training Report 84, April 2000: Russell J. Maharaj
171
WHAT ARE ADAPTATIONTECHNOLOGIES
+Technologies which will enhance understanding ofcoastal process and dynamics
+Technologies which are required to carry outmanaged retreat, accommodation and protection
+Technologies which are new, unproven and whichhave not yet reached engineering‘maturity’
Slide 10
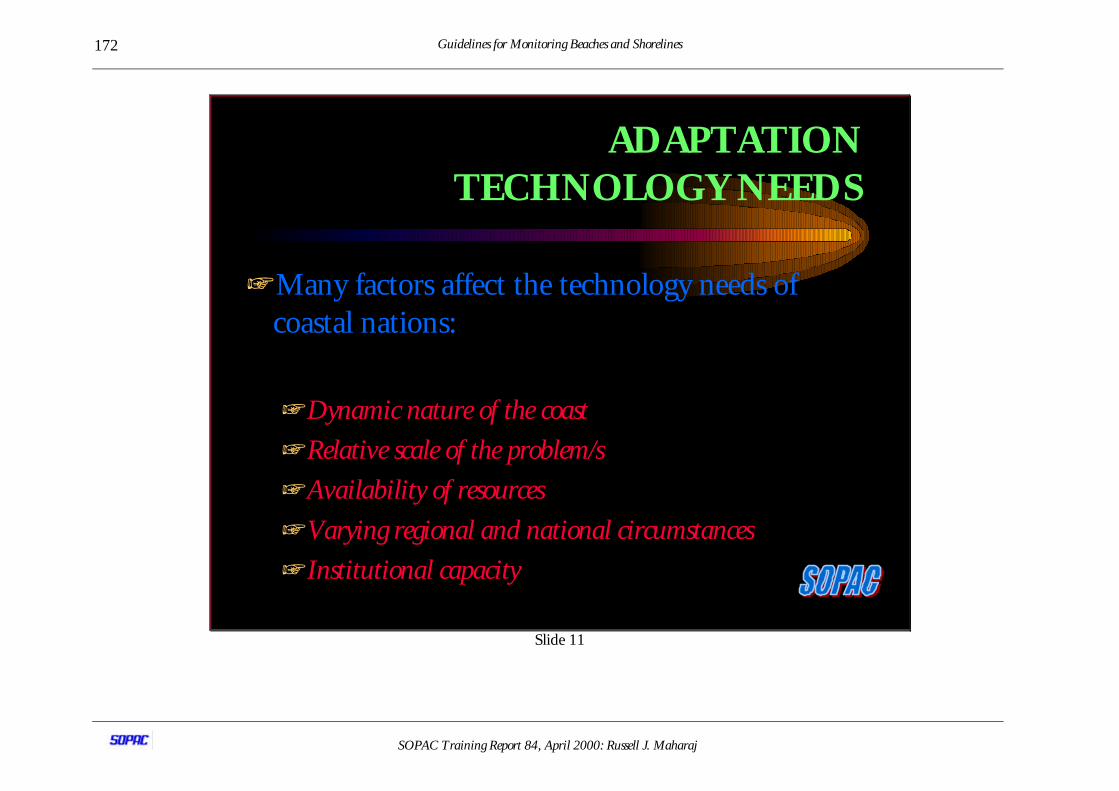
Guidelines for Monitoring Beaches and Shorelines
SOPAC Training Report 84, April 2000: Russell J. Maharaj
172
ADAPTATIONTECHNOLOGY NEEDS
+Many factors affect the technology needs ofcoastal nations:
+Dynamic nature of the coast
+Relative scale of the problem/s
+Availability of resources
+Varying regional and national circumstances
+Institutional capacity
Slide 11
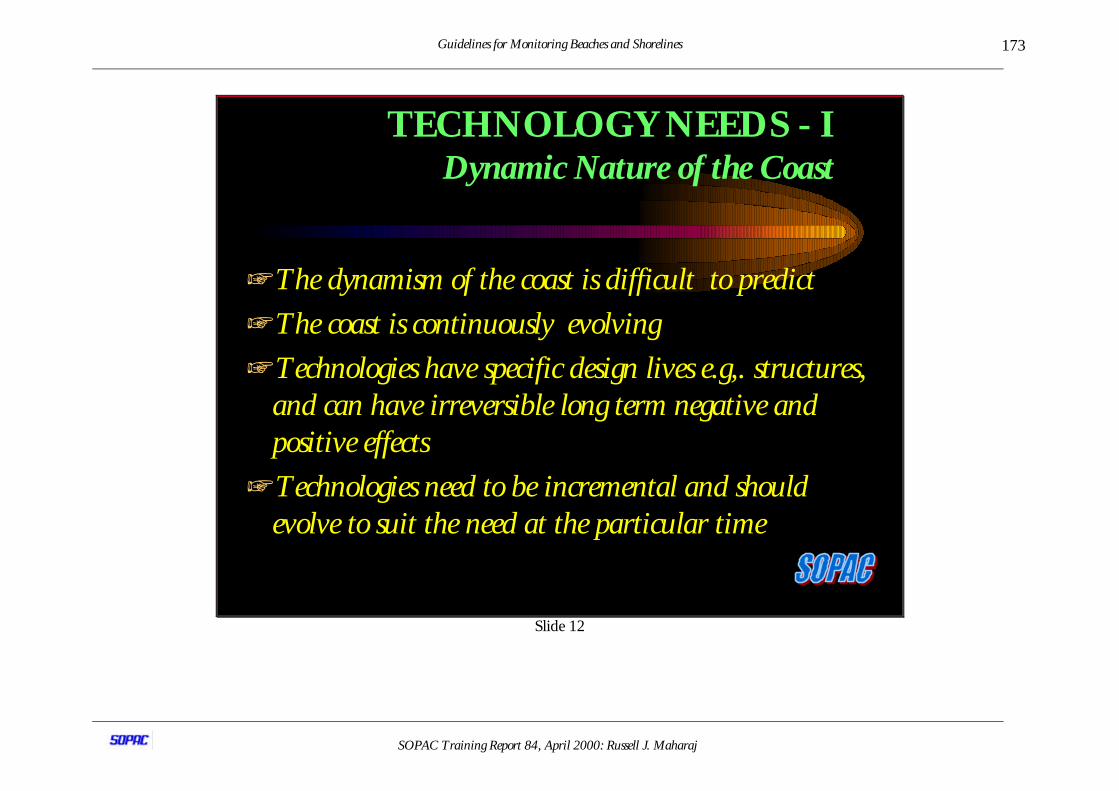
Guidelines for Monitoring Beaches and Shorelines
SOPAC Training Report 84, April 2000: Russell J. Maharaj
173
TECHNOLOGY NEEDS - IDynamic Nature of the Coast
+The dynamism of the coast is difficult to predict
+The coast is continuously evolving
+Technologies have specific design lives e.g,. structures,and can have irreversible long term negative andpositive effects
+Technologies need to be incremental and shouldevolve to suit the need at the particular time
Slide 12
Guidelines for Monitoring Beaches and Shorelines
SOPAC Training Report 84, April 2000: Russell J. Maharaj
174
TECHNOLOGY NEEDS - IIScale of the Problem
+Since sea-level rise is a global phenomena, the scaleof the challenge it poses to scientists, engineers,planners is greater than for ‘normal’ processes
+However, at a site-to-site level, the effects areunlikely to be more severe than those currently facedduring chronic or even acute erosion
Slide 13

Guidelines for Monitoring Beaches and Shorelines
SOPAC Training Report 84, April 2000: Russell J. Maharaj
175
TECHNOLOGY NEEDS - IIIAvailability of Resources
+When not constrained by funding, materialavailability and work force, construction of allconceivable protection can be done in short timeframes
+However, the prospects for significant changes inhard technologies used in coastal engineering are notgreat, largely because they are not scalable
Slide 14
Guidelines for Monitoring Beaches and Shorelines
SOPAC Training Report 84, April 2000: Russell J. Maharaj
176
TECHNOLOGY NEEDS - IVVarying Regional & National Circumstances
+Needs vary from site to site, country to country andregion to region
+Regional problems may be common, but site-specificsolutions are different
+Solutions to local and regional problems cannot befound by searching the literature or reviewing state-of-practice in other parts of the world
Slide 15
Guidelines for Monitoring Beaches and Shorelines
SOPAC Training Report 84, April 2000: Russell J. Maharaj
177
TECHNOLOGY NEEDS - IVVarying Regional & National Circumstances
+For SIDS, with sensitive ecosystems, small land areasand vulnerable coastal communities, adaptationtechnologies must be carefully selected to reflect actualsite ecology, geomorphology, geology andhydrodynamic conditions.
+They must also consider the human element
Slide 16
Guidelines for Monitoring Beaches and Shorelines
SOPAC Training Report 84, April 2000: Russell J. Maharaj
178
TECHNOLOGY NEEDS - IVVarying Regional & National Circumstances
+In addition, managed retreat in response toSLR/ASLR is rarely an option for many SIDS, as aresome types of shore protection structures: due to cost,ecological and environmental risks
+Accommodation and protection may be viable, onlyfor the short term
+In other extreme cases, retreat may be the only viableoption in the medium to long term
Slide 17

Guidelines for Monitoring Beaches and Shorelines
SOPAC Training Report 84, April 2000: Russell J. Maharaj
179
TECHNOLOGY NEEDS - VInstitutional Capacity
+The effective implementation of adaptationtechnologies requires local scientific and technicalexpertise, expert judgement and intitution
+The lack of or availability of institutional capacitycan dictate technologies for various countries andregion
Slide 18
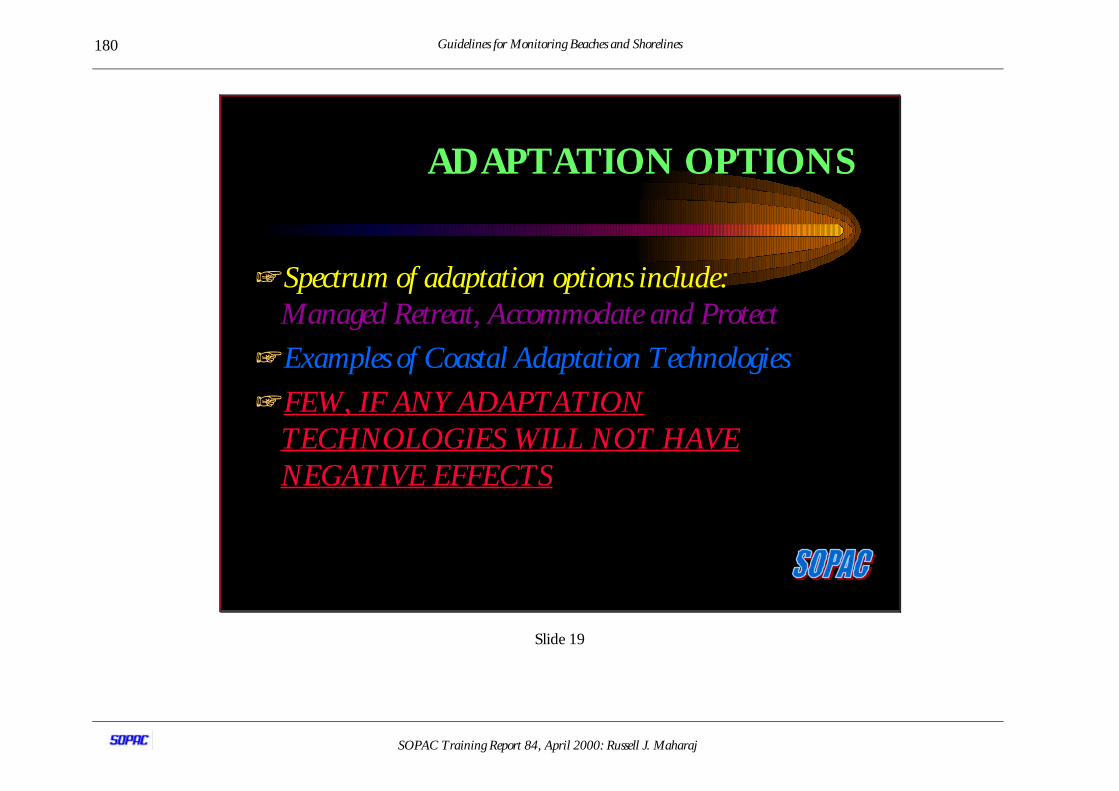
Guidelines for Monitoring Beaches and Shorelines
SOPAC Training Report 84, April 2000: Russell J. Maharaj
180
ADAPTATION OPTIONS
+Spectrum of adaptation options include: Managed Retreat, Accommodate and Protect
+Examples of Coastal Adaptation Technologies
+FEW, IF ANY ADAPTATIONTECHNOLOGIES WILL NOT HAVENEGATIVE EFFECTS
Slide 19

Guidelines for Monitoring Beaches and Shorelines
SOPAC Training Report 84, April 2000: Russell J. Maharaj
181
ONCE AND FOR ALL SOLUTIONS
+These do not exist
+Need local capabilities to maintain yourprotection in a sustainable way
+The major mistake is trying to solve chronicerosion problems with solutions for acuteerosion
Slide 20
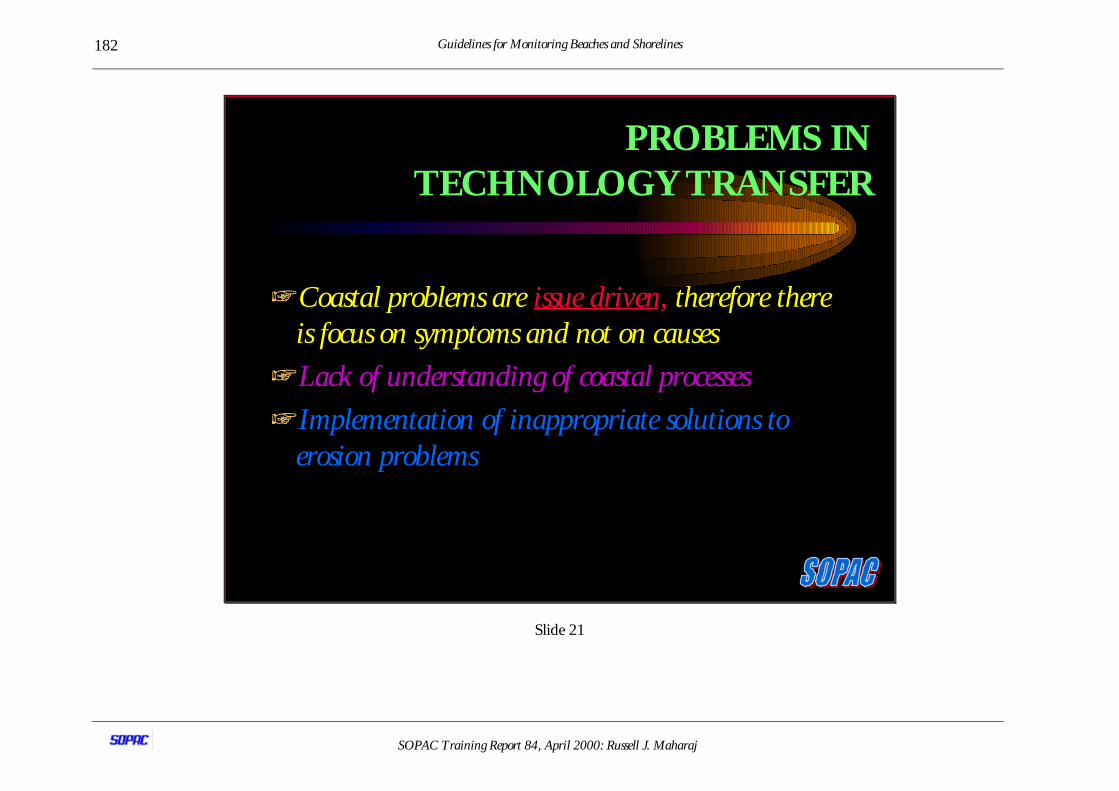
Guidelines for Monitoring Beaches and Shorelines
SOPAC Training Report 84, April 2000: Russell J. Maharaj
182
PROBLEMS INTECHNOLOGY TRANSFER
+Coastal problems are issue driven, therefore thereis focus on symptoms and not on causes
+Lack of understanding of coastal processes
+Implementation of inappropriate solutions toerosion problems
Slide 21
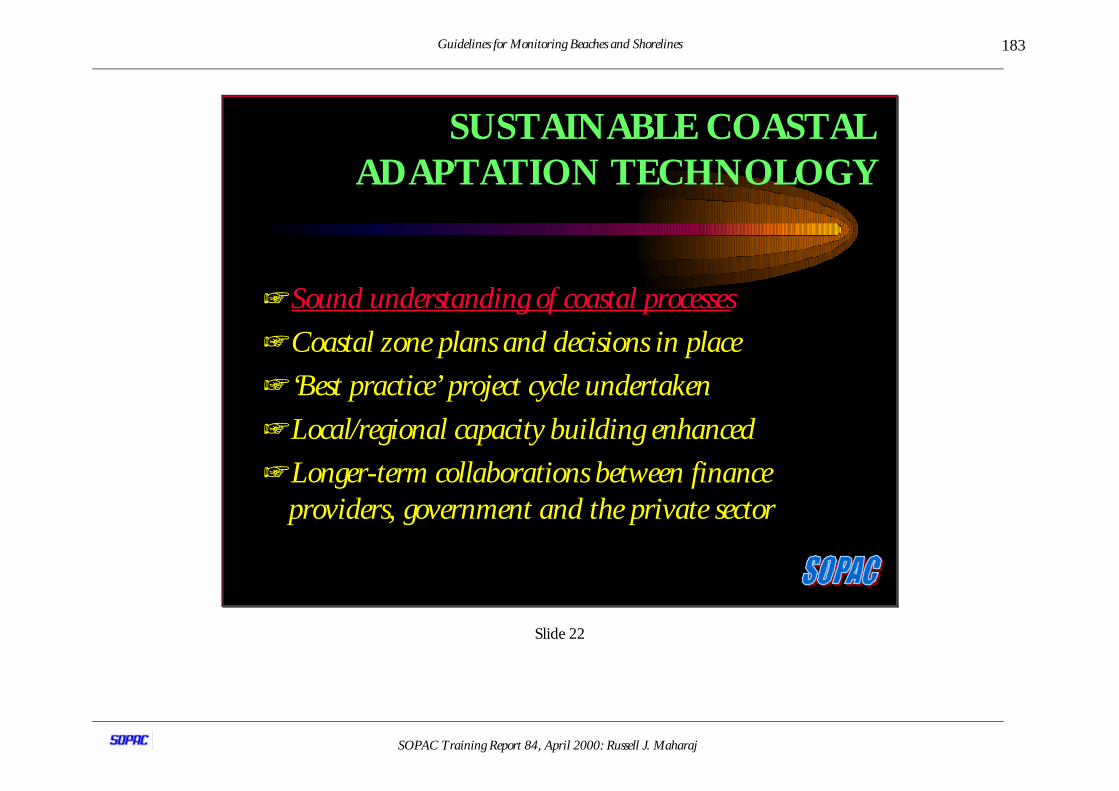
Guidelines for Monitoring Beaches and Shorelines
SOPAC Training Report 84, April 2000: Russell J. Maharaj
183
SUSTAINABLE COASTALADAPTATION TECHNOLOGY
+Sound understanding of coastal processes
+Coastal zone plans and decisions in place
+‘Best practice’ project cycle undertaken
+Local/regional capacity building enhanced
+Longer-term collaborations between financeproviders, government and the private sector
Slide 22
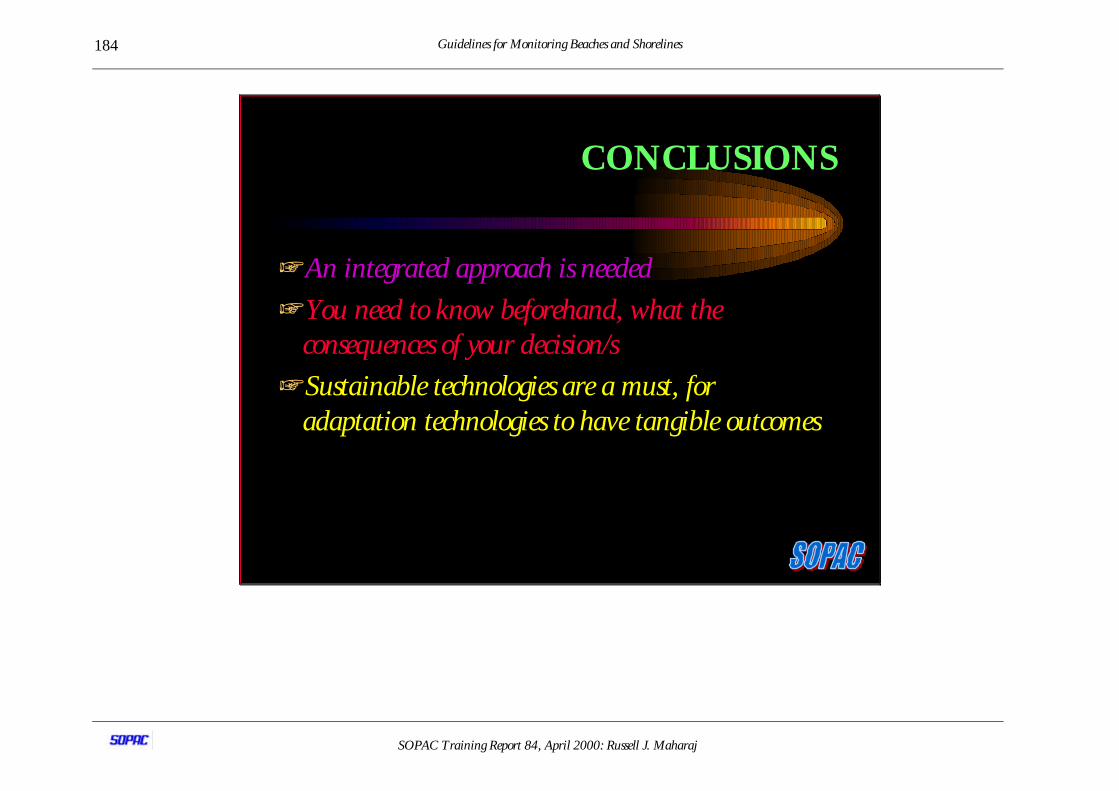
Guidelines for Monitoring Beaches and Shorelines
SOPAC Training Report 84, April 2000: Russell J. Maharaj
184
CONCLUSIONS
+An integrated approach is needed+You need to know beforehand, what the
consequences of your decision/s
+Sustainable technologies are a must, foradaptation technologies to have tangible outcomes
185 Guidelines for Monitoring Beaches and Shorelines
SOPAC Training Report 84, April 2000: Russell J. Maharaj
Coastal adaptation technologies include technologies to gather information about coastalcharacteristics and processes, (e.g. gauges, monitoring technologies), decision tools (models,software) and technologies included in the design, construction and maintenance of projectsdesigned to retreat, accommodate or protect a particular part of the coastal strip.
The suitability of a particular adaptation technology is highly sensitive to local conditions,priorities and social choices, economy and finance (GDP/GNP). In turn, as this paper stresses,coastal zone planning and decision-making require adequate institutional and technical capacity.Nevertheless, the development and transfer of appropriate coastal adaptation technologies(appropriate technology) can potentially help to lower the cost and expand the scope of optionsavailable to adapt to possible sea-level rise and associated effects.
It was emphasised during the lecture that the technologies themselves are sub-components of thewider framework of coastal zone management (CZM/ICZM), rather than traditional coastalengineering. In addition, the following were highlighted:
Ø coastal adaptation technologies should be developed based on local expertiseand knowledge;
Ø local data collection, instrumentation and monitoring are essential to projectimplementation;
Ø coastal projects pursued should be pursued from a more regional approach,inter-disciplinary and holistic;
Ø transfer of technology should be based on local and site-specific conditions;Ø post project monitoring and evaluation is necessary, as well as failure
analysis/forensic engineering of coastal development projects, which willfacilitate optimum project appraisal and refine project execution in the futureand
Ø training (institutional strengthening and capacity building) of technical peoplein practical aspects of CZM/ICZM and engineering needs to be pursued.
In addition, it was also emphasised that South Pacific SIDS need to consider the following for thesuccessful implementation of adaptation technologies:
Ø Local and regional governments need to make firm commitments to retainingtrained professionals in the profession,
Ø Local and regional governments should have specialised agencies ordepartments/units to address the various problems in the coastal zone,
Ø The cost of technologies should be based on local economy/finance and localGND/GDP,
Ø Funding agencies, in particular, bi-lateral and multi-lateral aid agencies shouldexamine the possibilities of longer-term funding of coastal projects, as opposedto the shorter 2-3 or 3-5 year cycles,
Ø Longer-tern funding facilitates longer-term coastal monitoring, optimum datacollection and more informed decision making (key to sustainable economicdevelopment),
Indeed most, if not all, technical responses to sea-level rise and associated effects have social,

Guidelines for Monitoring Beaches and Shorelines
SOPAC Training Report 84, April 2000: Russell J. Maharaj
186
economic and/or environmental drawbacks. It was pointed out that applying technologies whichare not properly understood or have been simply copied and applied to a new location withoutdue attention usually results in an exaggeration of such drawbacks. In many cases, experience hasdemonstrated that taking action can be worse than doing nothing.
Nevertheless, in specific situations where coastal processes are understood and clear politicaldecisions have been taken in the context of an integrated coastal plan, technologies are availableto attenuate or avoid particular coastal impacts.
The coastal project cycle was presented as a practical framework within which to understand anddescribe the development and in particular the transfer, of coastal adaptation technologies
Guidelines for Monitoring Beaches and Shorelines
SOPAC Training Report 84, April 2000: Russell J. Maharaj
187
16.0 BIBLIOGRAPHY
Allsop, N. W. H. (ed.) 1998. Coastlines, Structures and Breakwaters. Thomas Telford. London.
ASTM, 1998. Annual Book of ASTM Standards. Soil, Rock, Building Stones and Geotextiles.ASTM, Philadelphia.
CIRIA, 1991. Manual of the Use of Rock in Coastal and Shoreline Engineering. CIRIA SpecialPublication 83 & CUR Report 154. A. A. Balkema, Rotterdam.
CIRIA, 1996. Beach Management Manual. CIRIA Special Publication 153. CIRIA, London.
Emery, K. and Thompson, R. E. 1997. Data Analysis Methods in Physical Oceanography.Pergamon, New York.
Geological Society of London (GSL), 1999. Stone: Building Stone, Rock, Fill and Armourstone inConstruction. Geological Society of London Engineering Geology Special Publication, 16.
Herbich, J. B. 1991. Handbook of Coastal and Ocean Engineering. Volumes 1 & 2. GulfPublishing, New York.
IHE-Delft, 1999. CRESS: Coastal and River Engineering Support System, Version 7.00. IHE, Delft.A. A. Balkema, Rotterdam.
Julien, P. Y. 1995. Erosion and Sedimentation. Cambridge University Press, Cambridge.
Latham, J.P. (ed.) 1998. Advances in Aggregate and Armourstone Evaluation. Geological Society,London, Engineering Geology Special Publication, 13.
Maharaj, R. J. 1998. Assessment of Coastal Erosion Problems in the Outer Atoll Islands ofPohnpei, Chuuk and Yap States, Federated States of Micronesia. SOPAC Technical Report 268.
Maharaj, R. J. 1999a. Coastal erosion in Pacific Small Island Developing States (SIDS) – theneed for an approach to integrated coastal management (ICM). CoGeoenvironment News, IUGSCommission on the Environment, June 1999, 15- 19.
Maharaj, R. J. 1999b. Coastal Erosion and Shoreline Protection: Needs for an Approach toSustainable Development and Integrated Coastal Zone Management (ICZM) in Pacific SmallIsland Developing States (SIDS). Proc. 42nd Annual Mtg. Assoc. Eng. Geol., Salt Lake City, Utah,USA, September 26-29, 1999: 77-78.
Maharaj, R. J. 1999c. Coastal Erosion and Management in the Federated States of Micronesia(FSM). SOPAC Miscellaneous Report 347.
Maharaj, R. J. 1999d. Risk assessment in coastal engineering and management in Pacific SIDS.In: K. Crook and P. Rodda (eds). SOPAC 28th STAR Annual Meeting, Abstract Volume. SOPACMiscellaneous Report 355.
Maharaj, R. J. 1999e. Assessment of onshore aggregate resources, Pohnpei, Federated States ofMicronesia (FSM). SOPAC Preliminary Report 111.
Guidelines for Monitoring Beaches and Shorelines
SOPAC Training Report 84, April 2000: Russell J. Maharaj
188
Maharaj, R. J. 1999f . Engineering geological assessment of onshore aggregate resources, Pohnpei,Federated States of Micronesia (FSM). SOPAC Technical Report 301.
Maharaj, R. J. 1999g. Report of Presentation of a United Nations Framework Convention onClimate Change (UNFCCC) Technical Paper on Coastal Adaptation Technologies(FCCC/TP/1999/1). SOPAC Miscellaneous Report 332.
Maharaj, R. J. 1999h. Report of a United Nations Framework Convention on Climate Change(UNFCCC) Experts Meeting on Coastal Adaptation Technologies. SOPAC Miscellaneous Report322.
Maharaj, R. J. 1999i. Coral reef mining and coastal risks in Pacific Small Island DevelopingStates (SIDS). Paper accepted for the 31st International Geological Congress (31-IGC), Rio deJaneiro, Brazil, 6th – 17th August 2000.
Maharaj, R. J. 1999j. Appraisal and management of risk in coastal engineering and management.Lecture delivered for the Integrated Coastal Management Course, MS-302, Marine StudiesProgramme, University of the South Pacific, Laucala Bay, Fiji, 30th August, 1999. 53 MB
Maharaj, R. J. 1999k. Coastal adaptation technologies: response to sea level changes. SOPACTraining Report 79.
Maharaj, R. J. 1999l. Assessment of the vulnerability of coastal resources in Viti Levu, Fiji to sealevel rise and climate change. SOPAC Consultant Report prepared for the International GlobalChange Institute (IGCI), University of Waikato and the World Bank. Part of the World BankRegional Biennial Economic Review (RER) for the Pacific Region for June 2000.
Maharaj, R. J. 2000a. Coastal adaptation technologies: Pacific Island countries needs andconcerns. Paper presented at the Pacific Islands Conference on Climate Change, Climate Variabilityand Sea-Level Rise. Rarotonga, Cook Islands, 3rd - 7th April 2000.
Maharaj, R. J. 2000b. Assessment of Pacific Island Countries (PICs) in relation to climate changeand sea-level rise. SOPAC Miscellaneous Report 371.
Maharaj, R. J. 2000c. Monitoring and control of dredging in Pacific Small Island DevelopingStates (SIDS): environmental and engineering implications. Paper submitted for the 16th WorldCongress on Dredging, Kuala Lumpur, April 2001.
Maharaj, R. J. 2000d. Coral reef mining in Pacific atoll environment. Paper accepted for theICRI Regional Symposium on Coral Reefs in the Pacific: Status and Monitoring; Resources andManagement, 22-24 May 2000. Noumea, New Caledonia.
Maharaj, R. J. 2000e. Impact of dredging on reefs in Micronesia. Paper accepted for the ICRIRegional Symposium on Coral Reefs in the Pacific: Status and Monitoring; Resources andManagement, 22-24 May 2000. Noumea, New Caledonia.
McConnel, K. 1998. Revetment Systems Against Wave Attack-A Design Manual. ThomasTelford, London.
Guidelines for Monitoring Beaches and Shorelines
SOPAC Training Report 84, April 2000: Russell J. Maharaj
189
Peake, S., Maharaj, R. J. and Verhagen, H. J. 1999. UNFCCC Technical Paper on CoastalAdaptation Technologies - FCCC/TP/1999/1. Paper presented at a Special Session of the 10th
Meeting, Subsidiary Body on Science and Technology (SBSTA), Bonn, Germany, 9th June, 1999.
RIKZ, 1996. COSMO-BIO, Version 2.0. RIKZ, Delft.
Smith, M. R. and Collins, L. 1993. Aggregates. Geological Society, London, Engineering GeologySpecial Publication, 9.
Soulsby, R. 1998. Dynamics of Marine Sands. Thomas Telford, London.
Thorne, C. R., Abt, S. R., Barends, F. B. J., Maynord, S. T. and Pilarczyk, K. Y. 1995. River,Coastal and Shoreline Protection. Erosion Control Using Riprap and Armourstone. John Wiley, NewYork.
U. S. Navy, 1996. Global Tropical/Extratropical Cyclone Climatic Atlas. CD-ROM, Version 2.0,September 1996. U. S. Fleet Numerical Meteorology and Oceanography Detachment, NationalClimatic Data Centre, NOAA & U. S. Naval Meteorology and Oceanography Command.
Van Loon, H. 1984. Climates of the Oceans, Volume 15. Elsevier, Amsterdam.
VanRijn, L. C. 1989. Handbook of Sediment Transport by Currents and Waves. 2nd Edition. DelftHydraulics, Netherlands.
VanRijn, L. C. 1998. Principles of Coastal Morphology. Aqua Publications, Netherlands.
Watling, D. 1985. A mangrove management plan for Fiji (Phase 1). SPC and Fiji Government,Suva, 67 p. and Maps.
Guidelines for Monitoring Beaches and Shorelines
SOPAC Training Report 84, April 2000: Russell J. Maharaj
190
APPENDIX 1MONITORING AND EVALUATION IN SOPAC SIDS
ALL MEMBER COUNTRIES
Task: RT 99.040 SOPAC Unit: Coastal Work Program:1999
Proposed: 09-Jul-99 Started: Cancelled:Approved: Deferred: Completed:
Objectives:Prepare technical guidelines for the assessment of beach erosion and dynamics, toassist in the sustainable use and management of the coastal zone in SOPAC small islanddeveloping states (SIDS).
Proposed: SOPAC Technical Reports and in-country presentations detailing the achievedobjectives.
Background:Coastal erosion and shoreline management continues to be a chronic problem formany SOPAC SIDS. While this silent natural hazard has plagued the region for years, technicalinformation to evaluate various apsects of erosion and management of coastlines are unavailableat the local level. Where information is available, it issometimes too technical and complex oreven over-simplified.
The objective of this task is to prepare technical guidelines which can be used for the evaluationof beach and shoreline change in these Pacific SIDS. The guidelines will discuss the variousaspects of coastal erosion, how to identify and characterise erosion, what data should be collected,how to collect, process and manage data and how to utilise the data sets for coastal management.
In addition, practical aspects of erosion and beach monitoring will be presented, which arefeasible for Pacific Island countries.
Equipment Needs: Desktop computing resources.
Work Plan: 1. Review coastal problems in SOPAC SIDS.2. Review existing technical guidelines and manuals.3. Prepare appropriate guidelines and draft report.4. Publish report.5. Present and distribute to member countries.
Information: N/A
Clients: All SOPAC SIDS
SOPAC: Russell J. Maharaj
Report: SOPAC Technical Reports.