Embed Size (px)
Citation preview
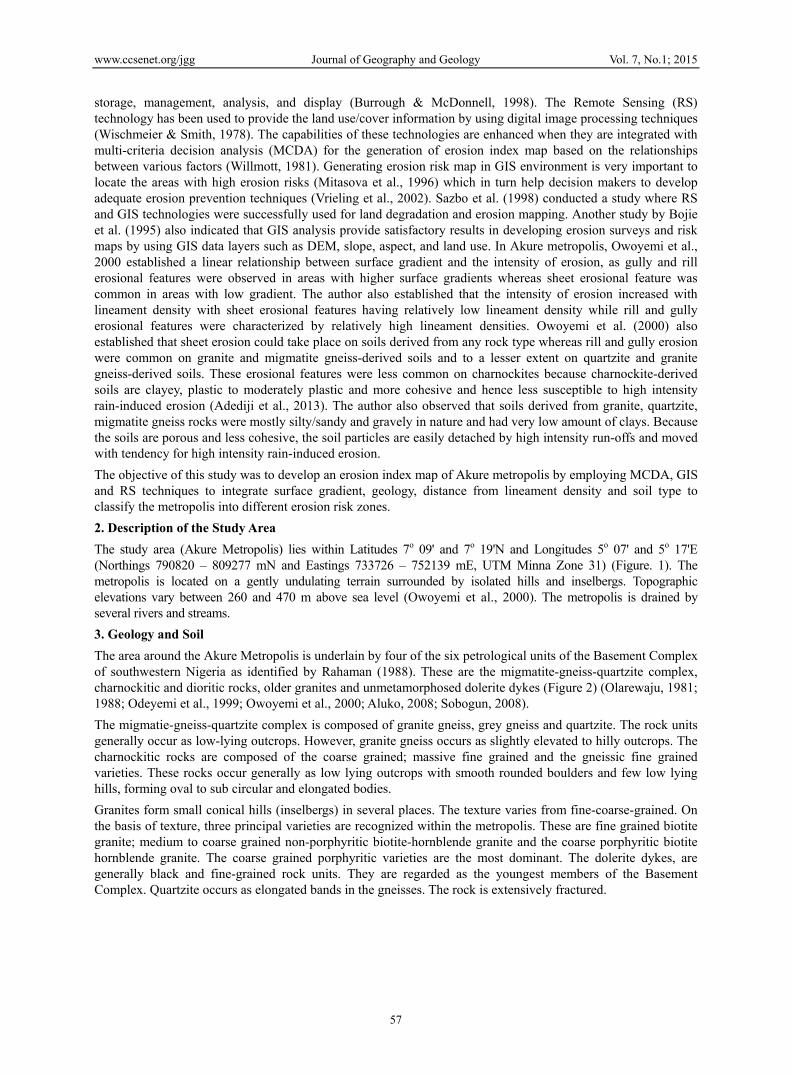
Journal of Geography and Geology; Vol. 7, No. 1; 2015 ISSN 1916-9779 E-ISSN 1916-9787
Published by Canadian Center of Science and Education
56
Evaluating Soil Erosion Risk in the Basement Complex Terrain of Akure Metropolis, Southwestern Nigeria
John S. Ojo1, Matins O. Olorunfemi2, Francis O. Akinluyi1, Sunday Bayode1, Olaoluwa J. Akintorinwa1 & Gregory O. Omosuyi1
1 School of Earth and Mineral Sciences, The Federal University of Technology, Akure, Ondo State, Nigeria 2 Faculty of Science, Obafemi Awolowo University, Ile-Ife, Osun State, Nigeria
Correspondence: Francis O. Akinluyi, School of Earth and Mineral Sciences, The Federal University of Technology, P.M.B. 704, Akure, Ondo State, Nigeria. Tel: 234-803-359-6566. E-mail: [email protected]
Received: October 28, 2014 Accepted: November 10, 2014 Online Published: February 23, 2015
doi:10.5539/jgg.v7n1p56 URL: http://dx.doi.org/10.5539/jgg.v7n1p56
Abstract Erosion index map of Akure Metropolis was developed using an integrated remotely sensed, geological and soil data. This was with a view to classifying the metropolis into different erosion risk zones. Administrative and topographic maps, geologic and soil maps, Landsat ETM+, Aster DEM and thirty two (32) erosion types data were acquired. Landsat ETM+ was pre-processed for geometric correction, haze reduction and re-sampling. Optimum index factor and covariance analysis were carried out in order to determine the least correlated bands and these bands were subjected to convolution filters, texture analysis at 3X3 window size, histogram equalization, de-correlation stretch, principal component analysis (PCA) and the Aster DEM to topographic analysis such as sink fill and shielded relief to generate slope map and lineament map. All the derived maps including the soil map were reclassified and given risk values according to their order of degree of contribution to either accelerate or decelerate soil erosion. Using weighted index overlay raster tool in ArcGIS software, all thematic maps were captured in GIS environment to produce a composite erosion index map of the study area. Existing erosion type data were used to establish the reliability of the erosion index map. The erosion index map classified the Akure Metropolis into three zones – very low risk (57.5%); low risk (33.9%) and moderate risk (8.6%). Most parts (91.4%) of the metropolis fell within the very low to low risk zones with tendency for sheet/reel erosional features. Areas with moderate risk with tendency for gully erosion were located on the high slope region.
Keywords: Akure metropolis, erosion index, geology, gradient, buffered lineament, soil
1. Introduction Erosion is a serious ecological problem worldwide. It results from the removal of soil particles by water or wind and the subsequent transportation and deposition of same elsewhere (Morgan, 1986; Hill et al., 1995). Soil erosion is a prominent geo-hazard phenomenon in a typical urban area with high population growth and high rainfall intensity. The phenomenon could also be precipitated by other factors such as type, depth, geological and engineering properties of the soil, inappropriate land use and land cover patterns, surface drainage, lineament and lineament density, terrain gradient and flooding (Jeje, 1988; 2005; Renschler, et al., 1999; Owoyemi, et al., 2000; Adedeji, et al., 2013).
The intensity of soil erosion is mainly affected by vegetation cover, topographic features, climatic variables, and soil characteristics. Human activities and large-scale developments in urban areas alter the vegetation cover, thereby influencing soil erosion rate (Droogers & Kite, 2002). Topographic features such as ground slope, slope length, and shape mostly accelerate rill and interrill erosion (Yassoglou et al., 2002). The most important climatic variables are rainfall amount and precipitation intensity. Erosion could lead to significant soil loss and degradation, siltation of water ways, precipitation of failure of infrastructures such as buildings, roads, bridges and loss of life and properties. Some of these effects are generally irreversible.
Assessing the soil erosion risk index is essential for the development of adequate erosion prevention measures for sustainable management of land, water and other resources. Geographic Information System (GIS) technologies are valuable tools in developing environmental models through their advance features of data
www.ccsenet.org/jgg Journal of Geography and Geology Vol. 7, No.1; 2015
57
storage, management, analysis, and display (Burrough & McDonnell, 1998). The Remote Sensing (RS) technology has been used to provide the land use/cover information by using digital image processing techniques (Wischmeier & Smith, 1978). The capabilities of these technologies are enhanced when they are integrated with multi-criteria decision analysis (MCDA) for the generation of erosion index map based on the relationships between various factors (Willmott, 1981). Generating erosion risk map in GIS environment is very important to locate the areas with high erosion risks (Mitasova et al., 1996) which in turn help decision makers to develop adequate erosion prevention techniques (Vrieling et al., 2002). Sazbo et al. (1998) conducted a study where RS and GIS technologies were successfully used for land degradation and erosion mapping. Another study by Bojie et al. (1995) also indicated that GIS analysis provide satisfactory results in developing erosion surveys and risk maps by using GIS data layers such as DEM, slope, aspect, and land use. In Akure metropolis, Owoyemi et al., 2000 established a linear relationship between surface gradient and the intensity of erosion, as gully and rill erosional features were observed in areas with higher surface gradients whereas sheet erosional feature was common in areas with low gradient. The author also established that the intensity of erosion increased with lineament density with sheet erosional features having relatively low lineament density while rill and gully erosional features were characterized by relatively high lineament densities. Owoyemi et al. (2000) also established that sheet erosion could take place on soils derived from any rock type whereas rill and gully erosion were common on granite and migmatite gneiss-derived soils and to a lesser extent on quartzite and granite gneiss-derived soils. These erosional features were less common on charnockites because charnockite-derived soils are clayey, plastic to moderately plastic and more cohesive and hence less susceptible to high intensity rain-induced erosion (Adediji et al., 2013). The author also observed that soils derived from granite, quartzite, migmatite gneiss rocks were mostly silty/sandy and gravely in nature and had very low amount of clays. Because the soils are porous and less cohesive, the soil particles are easily detached by high intensity run-offs and moved with tendency for high intensity rain-induced erosion.
The objective of this study was to develop an erosion index map of Akure metropolis by employing MCDA, GIS and RS techniques to integrate surface gradient, geology, distance from lineament density and soil type to classify the metropolis into different erosion risk zones.
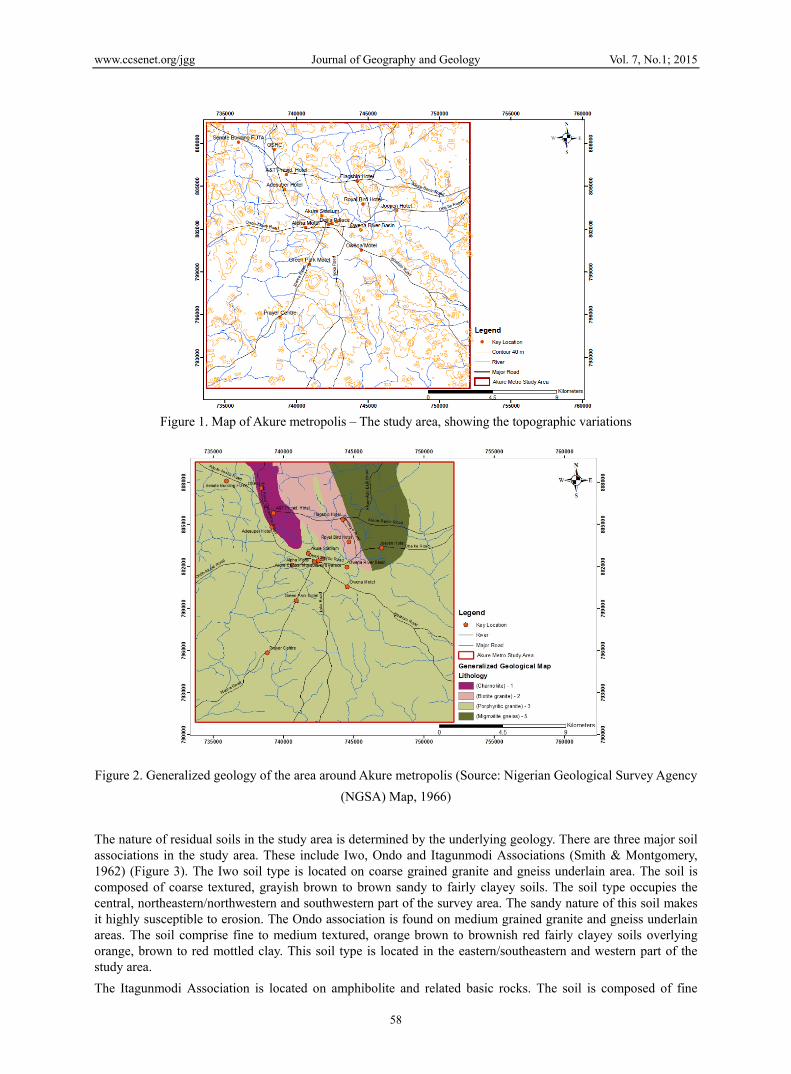
2. Description of the Study Area The study area (Akure Metropolis) lies within Latitudes 7o 09' and 7o 19'N and Longitudes 5o 07' and 5o 17'E (Northings 790820 – 809277 mN and Eastings 733726 – 752139 mE, UTM Minna Zone 31) (Figure. 1). The metropolis is located on a gently undulating terrain surrounded by isolated hills and inselbergs. Topographic elevations vary between 260 and 470 m above sea level (Owoyemi et al., 2000). The metropolis is drained by several rivers and streams.
3. Geology and Soil The area around the Akure Metropolis is underlain by four of the six petrological units of the Basement Complex of southwestern Nigeria as identified by Rahaman (1988). These are the migmatite-gneiss-quartzite complex, charnockitic and dioritic rocks, older granites and unmetamorphosed dolerite dykes (Figure 2) (Olarewaju, 1981; 1988; Odeyemi et al., 1999; Owoyemi et al., 2000; Aluko, 2008; Sobogun, 2008).
The migmatie-gneiss-quartzite complex is composed of granite gneiss, grey gneiss and quartzite. The rock units generally occur as low-lying outcrops. However, granite gneiss occurs as slightly elevated to hilly outcrops. The charnockitic rocks are composed of the coarse grained; massive fine grained and the gneissic fine grained varieties. These rocks occur generally as low lying outcrops with smooth rounded boulders and few low lying hills, forming oval to sub circular and elongated bodies.
Granites form small conical hills (inselbergs) in several places. The texture varies from fine-coarse-grained. On the basis of texture, three principal varieties are recognized within the metropolis. These are fine grained biotite granite; medium to coarse grained non-porphyritic biotite-hornblende granite and the coarse porphyritic biotite hornblende granite. The coarse grained porphyritic varieties are the most dominant. The dolerite dykes, are generally black and fine-grained rock units. They are regarded as the youngest members of the Basement Complex. Quartzite occurs as elongated bands in the gneisses. The rock is extensively fractured.
www.ccsenet.org/jgg Journal of Geography and Geology Vol. 7, No.1; 2015
58
Figure 1. Map of Akure metropolis – The study area, showing the topographic variations
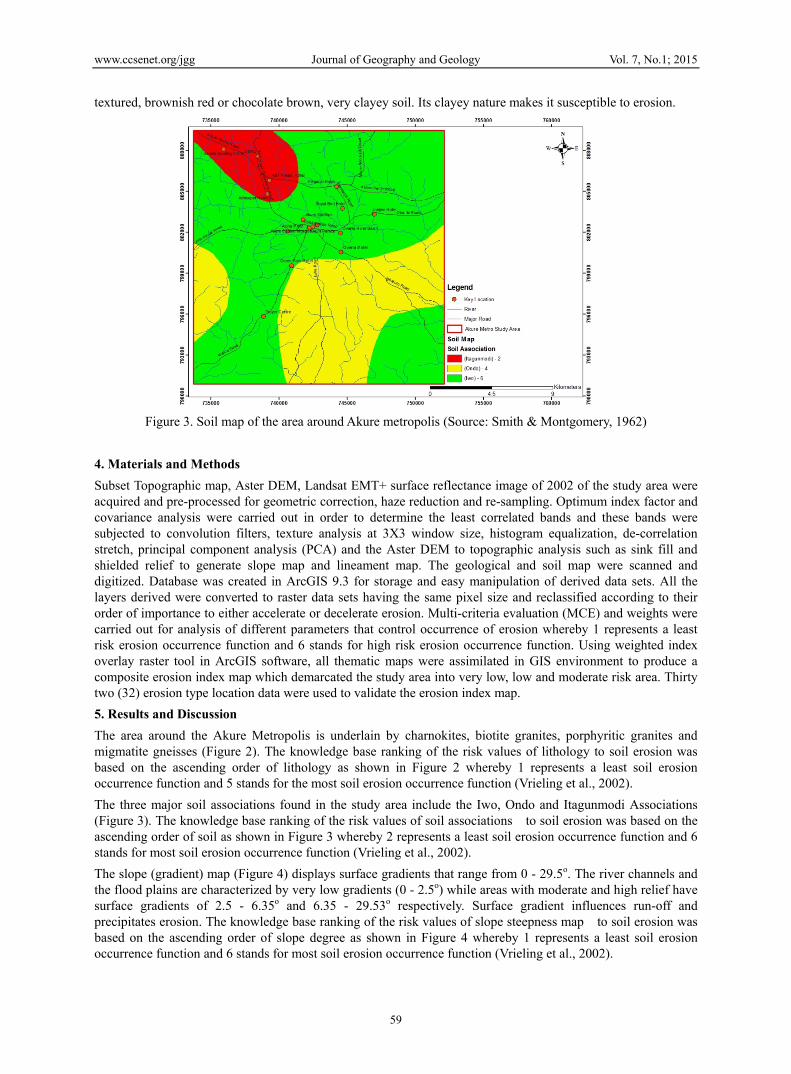
Figure 2. Generalized geology of the area around Akure metropolis (Source: Nigerian Geological Survey Agency
(NGSA) Map, 1966)
The nature of residual soils in the study area is determined by the underlying geology. There are three major soil associations in the study area. These include Iwo, Ondo and Itagunmodi Associations (Smith & Montgomery, 1962) (Figure 3). The Iwo soil type is located on coarse grained granite and gneiss underlain area. The soil is composed of coarse textured, grayish brown to brown sandy to fairly clayey soils. The soil type occupies the central, northeastern/northwestern and southwestern part of the survey area. The sandy nature of this soil makes it highly susceptible to erosion. The Ondo association is found on medium grained granite and gneiss underlain areas. The soil comprise fine to medium textured, orange brown to brownish red fairly clayey soils overlying orange, brown to red mottled clay. This soil type is located in the eastern/southeastern and western part of the study area.
The Itagunmodi Association is located on amphibolite and related basic rocks. The soil is composed of fine
www.ccsenet.org/jgg Journal of Geography and Geology Vol. 7, No.1; 2015
59
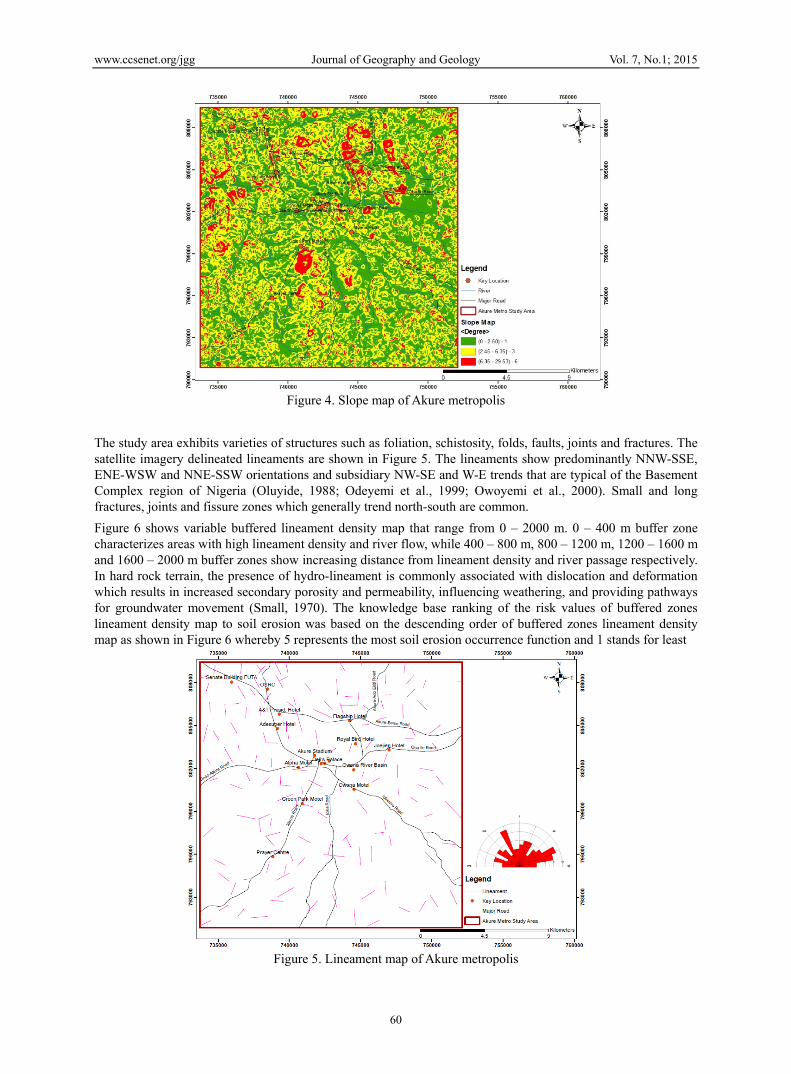
textured, brownish red or chocolate brown, very clayey soil. Its clayey nature makes it susceptible to erosion.
Figure 3. Soil map of the area around Akure metropolis (Source: Smith & Montgomery, 1962)
4. Materials and Methods Subset Topographic map, Aster DEM, Landsat EMT+ surface reflectance image of 2002 of the study area were acquired and pre-processed for geometric correction, haze reduction and re-sampling. Optimum index factor and covariance analysis were carried out in order to determine the least correlated bands and these bands were subjected to convolution filters, texture analysis at 3X3 window size, histogram equalization, de-correlation stretch, principal component analysis (PCA) and the Aster DEM to topographic analysis such as sink fill and shielded relief to generate slope map and lineament map. The geological and soil map were scanned and digitized. Database was created in ArcGIS 9.3 for storage and easy manipulation of derived data sets. All the layers derived were converted to raster data sets having the same pixel size and reclassified according to their order of importance to either accelerate or decelerate erosion. Multi-criteria evaluation (MCE) and weights were carried out for analysis of different parameters that control occurrence of erosion whereby 1 represents a least risk erosion occurrence function and 6 stands for high risk erosion occurrence function. Using weighted index overlay raster tool in ArcGIS software, all thematic maps were assimilated in GIS environment to produce a composite erosion index map which demarcated the study area into very low, low and moderate risk area. Thirty two (32) erosion type location data were used to validate the erosion index map.
5. Results and Discussion The area around the Akure Metropolis is underlain by charnokites, biotite granites, porphyritic granites and migmatite gneisses (Figure 2). The knowledge base ranking of the risk values of lithology to soil erosion was based on the ascending order of lithology as shown in Figure 2 whereby 1 represents a least soil erosion occurrence function and 5 stands for the most soil erosion occurrence function (Vrieling et al., 2002).
The three major soil associations found in the study area include the Iwo, Ondo and Itagunmodi Associations (Figure 3). The knowledge base ranking of the risk values of soil associations to soil erosion was based on the ascending order of soil as shown in Figure 3 whereby 2 represents a least soil erosion occurrence function and 6 stands for most soil erosion occurrence function (Vrieling et al., 2002).
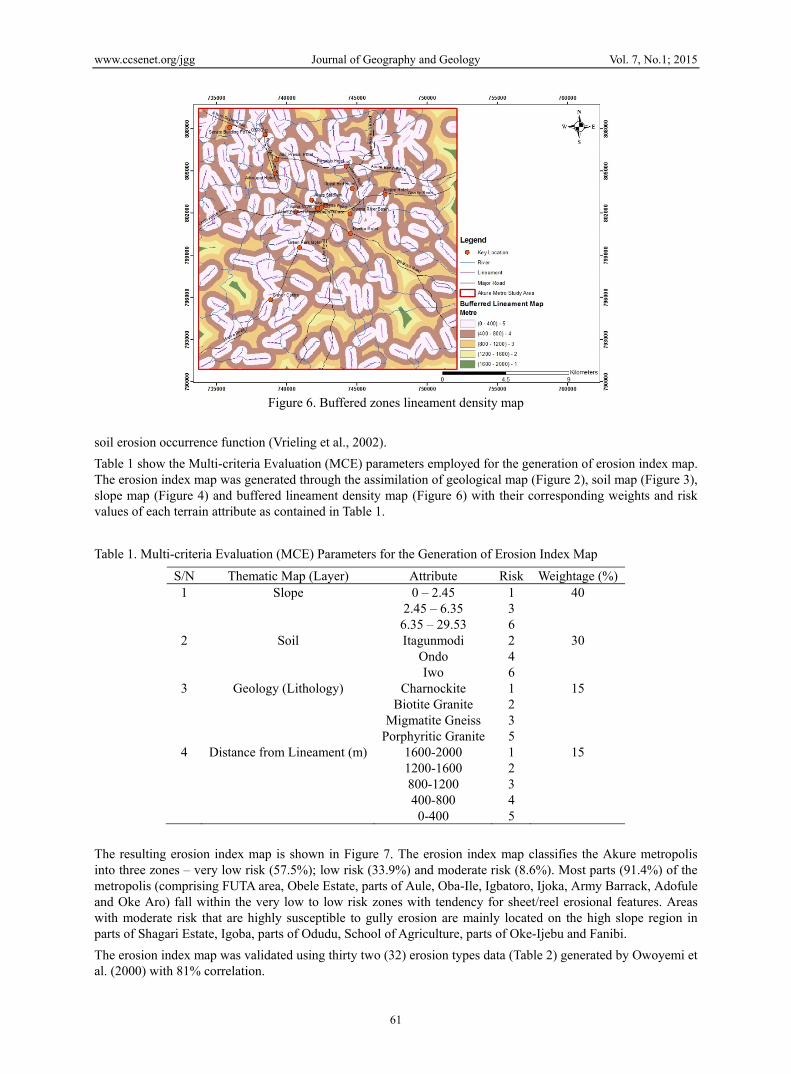
The slope (gradient) map (Figure 4) displays surface gradients that range from 0 - 29.5o. The river channels and the flood plains are characterized by very low gradients (0 - 2.5o) while areas with moderate and high relief have surface gradients of 2.5 - 6.35o and 6.35 - 29.53o respectively. Surface gradient influences run-off and precipitates erosion. The knowledge base ranking of the risk values of slope steepness map to soil erosion was based on the ascending order of slope degree as shown in Figure 4 whereby 1 represents a least soil erosion occurrence function and 6 stands for most soil erosion occurrence function (Vrieling et al., 2002).
www.ccsenet.org/jgg Journal of Geography and Geology Vol. 7, No.1; 2015
60
Figure 4. Slope map of Akure metropolis
The study area exhibits varieties of structures such as foliation, schistosity, folds, faults, joints and fractures. The satellite imagery delineated lineaments are shown in Figure 5. The lineaments show predominantly NNW-SSE, ENE-WSW and NNE-SSW orientations and subsidiary NW-SE and W-E trends that are typical of the Basement Complex region of Nigeria (Oluyide, 1988; Odeyemi et al., 1999; Owoyemi et al., 2000). Small and long fractures, joints and fissure zones which generally trend north-south are common.
Figure 6 shows variable buffered lineament density map that range from 0 – 2000 m. 0 – 400 m buffer zone characterizes areas with high lineament density and river flow, while 400 – 800 m, 800 – 1200 m, 1200 – 1600 m and 1600 – 2000 m buffer zones show increasing distance from lineament density and river passage respectively. In hard rock terrain, the presence of hydro-lineament is commonly associated with dislocation and deformation which results in increased secondary porosity and permeability, influencing weathering, and providing pathways for groundwater movement (Small, 1970). The knowledge base ranking of the risk values of buffered zones lineament density map to soil erosion was based on the descending order of buffered zones lineament density map as shown in Figure 6 whereby 5 represents the most soil erosion occurrence function and 1 stands for least
Figure 5. Lineament map of Akure metropolis
www.ccsenet.org/jgg Journal of Geography and Geology Vol. 7, No.1; 2015
61
Figure 6. Buffered zones lineament density map
soil erosion occurrence function (Vrieling et al., 2002).
Table 1 show the Multi-criteria Evaluation (MCE) parameters employed for the generation of erosion index map. The erosion index map was generated through the assimilation of geological map (Figure 2), soil map (Figure 3), slope map (Figure 4) and buffered lineament density map (Figure 6) with their corresponding weights and risk values of each terrain attribute as contained in Table 1.
Table 1. Multi-criteria Evaluation (MCE) Parameters for the Generation of Erosion Index Map
S/N Thematic Map (Layer) Attribute Risk Weightage (%) 1 Slope 0 – 2.45 1 40 2.45 – 6.35 3 6.35 – 29.53 6
2 Soil Itagunmodi 2 30 Ondo 4 Iwo 6
3 Geology (Lithology) Charnockite 1 15 Biotite Granite 2 Migmatite Gneiss 3 Porphyritic Granite 5
4 Distance from Lineament (m) 1600-2000 1 15 1200-1600 2 800-1200 3 400-800 4 0-400 5
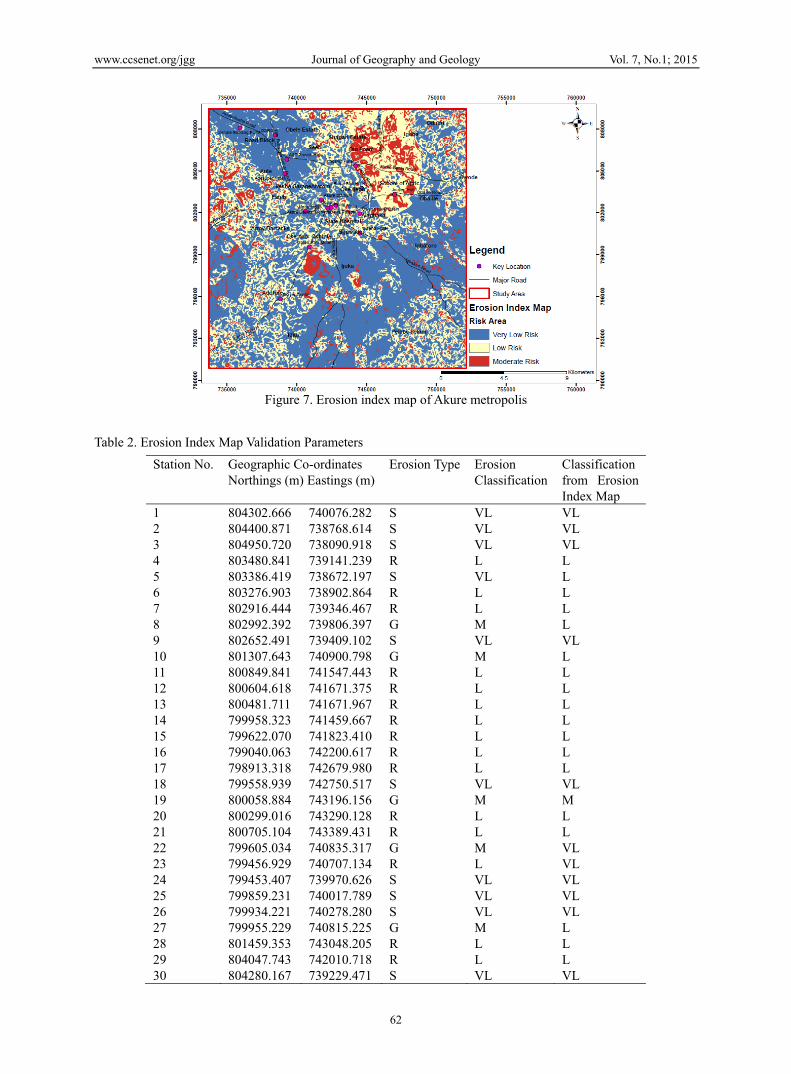
The resulting erosion index map is shown in Figure 7. The erosion index map classifies the Akure metropolis into three zones – very low risk (57.5%); low risk (33.9%) and moderate risk (8.6%). Most parts (91.4%) of the metropolis (comprising FUTA area, Obele Estate, parts of Aule, Oba-Ile, Igbatoro, Ijoka, Army Barrack, Adofule and Oke Aro) fall within the very low to low risk zones with tendency for sheet/reel erosional features. Areas with moderate risk that are highly susceptible to gully erosion are mainly located on the high slope region in parts of Shagari Estate, Igoba, parts of Odudu, School of Agriculture, parts of Oke-Ijebu and Fanibi.
The erosion index map was validated using thirty two (32) erosion types data (Table 2) generated by Owoyemi et al. (2000) with 81% correlation.
www.ccsenet.org/jgg Journal of Geography and Geology Vol. 7, No.1; 2015
62
Figure 7. Erosion index map of Akure metropolis
Table 2. Erosion Index Map Validation Parameters
Station No. Geographic Co-ordinates Northings (m) Eastings (m)
Erosion Type Erosion Classification
Classification from Erosion Index Map
1 804302.666 740076.282 S VL VL 2 804400.871 738768.614 S VL VL 3 804950.720 738090.918 S VL VL 4 803480.841 739141.239 R L L 5 803386.419 738672.197 S VL L 6 803276.903 738902.864 R L L 7 802916.444 739346.467 R L L 8 802992.392 739806.397 G M L 9 802652.491 739409.102 S VL VL 10 801307.643 740900.798 G M L 11 800849.841 741547.443 R L L 12 800604.618 741671.375 R L L 13 800481.711 741671.967 R L L 14 799958.323 741459.667 R L L 15 799622.070 741823.410 R L L 16 799040.063 742200.617 R L L 17 798913.318 742679.980 R L L 18 799558.939 742750.517 S VL VL 19 800058.884 743196.156 G M M 20 800299.016 743290.128 R L L 21 800705.104 743389.431 R L L 22 799605.034 740835.317 G M VL 23 799456.929 740707.134 R L VL 24 799453.407 739970.626 S VL VL 25 799859.231 740017.789 S VL VL 26 799934.221 740278.280 S VL VL 27 799955.229 740815.225 G M L 28 801459.353 743048.205 R L L 29 804047.743 742010.718 R L L 30 804280.167 739229.471 S VL VL
www.ccsenet.org/jgg Journal of Geography and Geology Vol. 7, No.1; 2015
63
31 804362.259 743500.535 S VL VL 32 804113.485 742894.160 S VL VL
S: Sheet Erosion; R: Reel Erosion; G: Gully Erosion.
VL: Very Low Risk; L: Low Risk; M: Moderate Risk.
6. Conclusion Thematic maps of surface gradient, buffered zones lineament density, geology and soil of the area around Akure Metropolis were captured in the GIS environment to produce a composite erosion index map of the study area. The generated map was validated with existing erosion type data.
The erosion index map classifies the Akure Metropolis into three soil erosion risk zones namely, moderate, low and very low risk. Moderate risk area covers 8.6% of the land mass while low and very low risk cover 33.9% and 57.5% of the land mass respectively. Most parts (91.4%) of the metropolis (comprising FUTA area, Obele Estate, parts of Aule, Oba-Ile, Igbatoro, Ijoka, Army Barrack, Adofule and Oke Aro) fall within the very low to low risk zones with tendency for sheet/reel erosional features. Areas with moderate risk that are highly susceptible to gully erosion are mainly located on the high slope region in parts of Shagari Estate, Igoba, parts of Odudu, School of Agriculture, parts of Oke-Ijebu and Fanibi.
Acknowledgement This research was funded by the Educational Trust Fund (ETF) through the University Research Grant of The Federal University of Technology, Akure, Nigeria. The authors are immensely grateful.
References Adediji, A., Jeje, L. K., & Ibitoye, M. O. (2013). Urban development and informal drainage pattern: Gully
dynamics in Southwestern Nigeria. Applied Geography, 40, 90-102. http://dx.doi.org/10.1016/j.apgeog.2013.01.012
Aluko, A. B. (2008). Geology of Akure area Southwestern Nigeria (Unpublished bachelor’s thesis). Federal University of Technology, Akure, Nigeria.
Bojie, F., Xilin, W., & Gulinck, H. (1995). Soil erosion types in the Loess Hill and gully area of China. Journal of Environmental Sciences, 7, 266-272.
Burrough, P. A., & McDonnell, R. A. (1998). Principles of geographic information systems. New York, NY: Oxford Science Publications.
Droogers, P., & Kite, G. (2002). Remotely sensed data used for modelling at different hydrological scales. Hydrological Processes, 16, 1543-1556. http://dx.doi.org/10.1002/hyp.1019
Egbuniwe, O. I. G., Ajibade, A. C., & Umeji, A. C. (Eds.), Precambrian geology of Nigeria (pp. 93-98). Geological Survey of Nigeria Special Publication.
Hill, J., Megier, J., & Mehl, W. (1995). Land degradation, Soil Erosion and Desertification Monitoring in Mediterranean Ecosystems. Remote Sensing Review, 12, 107-130. http://dx.doi.org/10.1080/02757259509532278
Jeje, L. K. (1988). Soil erosion characteristics, processing and extent in the lowland rain forest of Southwestern.
Jeje, L. K. (2005). Urbanization and accelerated erosion: Examples from Southwestern Nigeria. Environmental Management Journal, 2, 1-17.
Mitasova, H., Hofierka, J., Zlocha, M., & Iverson, R. L. (1996). Modeling topographic potential for erosion and deposition using GIS. International Journal of Geographical Information Science, 10(5), 629-641. http://dx.doi.org/10.1080/02693799608902101
Morgan, R. P. C. (1986). Soil Erosion and Conservation. United Kingdom, UK: Longman Group.
Odeyemi, I. B., Asiwaju-Bello, Y. A., & Anifowose, A. Y. B. (1999). Remote sensing fracture characteristics of the Pan African granite batholiths in the Basement Complex of parts of Southwestern Nigeria. Journal of Techno-Science, 3, 56-60.
Olarewaju, V. O. (1981). Geochemistry of charnockitic and granitic rocks of the Basement Complex around Ado-Ekiti – Akure, Southwestern Nigeria (Unpublished doctoral dissertation). University of London, London.
www.ccsenet.org/jgg Journal of Geography and Geology Vol. 7, No.1; 2015
64
Olarewaju, V. O. (1988). REE in the charnockitic and associated granitic rocks of Ado-Ekiti – Akure area, Southwestern Nigeria. In: Oluyide, P. O., Mbonu, W. C., Ogezi, A. E., Egbuniwe, I. G., Ajibade, A. C., & Umeji, A. C. (Eds.), Precambrian geology of Nigeria (pp. 231-239). Geological Survey of Nigeria Special Publication.
Oluyide, P. O. (1988). Structural trends in the Nigerian Basement Complex. In: Oluyide, P. O., Mbonu, W. C., Ogezi, A. E., Egbuniwe, I. G., Ajibade, A. C., & Umeji, A. C. (Eds.), Precambrian geology of Nigeria (pp. 93-98). Geological Survey of Nigeria Special Publication.
Owoyemi, F. B., Olorunfemi, M. O., & Ojo, J. S. (2000). Geological and geophysical investigation of rain-induced erosion features: A case study of Akure town, Southwestern Nigeria. Geo Research Journal, 5, 54-82.
Rahaman, M. A. (1988). Recent advances in the study of the Basement Complex of Nigeria. In Oluyide, P. O., Mbonu, W. C., Ogezi, A. E., Egbuniwe, I. G., Ajibade, A. C., & Umeji, A. C. (Eds.), Precambrian geology of Nigeria (pp. 11-41). Geological Survey of Nigeria Special Publication.
Renschler, C. S., Mannaerts, C., & Diekkrüger, B. (1999). Evaluating spatial and temporal variability in soil erosion risk - rainfall erosivity and soil loss ratios in Andalusia, Spain. Catena, 34, 209-225. http://dx.doi.org/10.1016/S0341-8162(98)00117-9
Sagua, V. O., Enabor, E. E., Ofomata, G. E. K., Olonge, K. O., & Oyebade, L. (Eds.), Ecological disaster in Nigeria (pp. 69-83). Federal Ministry of Science and Technology, Lagos, Nigeria.
Sazbo, J., Pasztor, L., Suba, Z., & Varallyay, G. (1998). Integration of Remote Sensing and GIS techniques in land degradation mapping. Proceedings of the 16th International Congress of Soil Science, Montpellier, France, 63-75.
Small, J. R. (1970). The study of landforms. Cambridge: Cambridge Press.
Smith, A. J., & Montgomery, R. F. (1962). Soils and land use in Central Western Nigeria. The Government of Western Nigeria, Ibadan Publication.
Sobogun, A. A. (2008). Geology of parts of Akure area, Southwestern Nigeria (Unpublished bachelor’s thesis). Federal University of Technology, Akure, Nigeria.
Vrieling, A., Sterk G., & Beaulieu, N. (2002). Erosion risk mapping: A methodological case study in the Colombian Eastern Plains. Journal of Soil and Water Conservation, 57(3), 158-163.
Willmott, C. J. (1981). On the validation of models. Physical Geography, 2(2), 184-194.
Wischmeier, W. H., & Smith, D. P. (1978). Predicting Rainfall Erosion Losses - a Guide for Selection for Conservation Planning. Agricultural Handbook (U.S. Dept of Agriculture) 537, 69 pp.
Yassoglou, N., Kosmas, C., Tsara, M., Meliadou, A., & Gavriil, P. (2002). Second National Report of Greece on the Implementation of the United Nations Convention to Combat Desertification. Greek National Committee for Combating Desertification (Athens). Retrieved from http://www.unccd.int/cop/reports/ northmed/national/2002/greece-eng.pdf
Copyrights Copyright for this article is retained by the author(s), with first publication rights granted to the journal.
This is an open-access article distributed under the terms and conditions of the Creative Commons Attribution license (http://creativecommons.org/licenses/by/3.0/).