Embed Size (px)
Citation preview

www.naturalresourceswales.gov.uk www.naturalresourceswales.gov.uk
Guidance on Best Practice for Marine and Coastal Physical Processes Baseline Survey and Monitoring Requirements to Inform EIA of Major Development Projects Anthony Brooks Peter Whitehead David Lambkin Report No 243 Date
Page 1 www.naturalresourceswales.gov.uk www.naturalresourceswales.gov.uk
About Natural Resources Wales Natural Resources Wales’ purpose is to pursue sustainable management of natural resources. This means looking after air, land, water, wildlife, plants and soil to improve Wales’ well-being, and provide a better future for everyone.
Evidence at Natural Resources Wales Natural Resources Wales is an evidence based organisation. We seek to ensure that our strategy, decisions, operations and advice to Welsh Government and others are underpinned by sound and quality-assured evidence. We recognise that it is critically important to have a good understanding of our changing environment. We will realise this vision by:
• Maintaining and developing the technical specialist skills of our staff;
• Securing our data and information;
• Having a well resourced proactive programme of evidence work;
• Continuing to review and add to our evidence to ensure it is fit for the challenges facing us; and
• Communicating our evidence in an open and transparent way. This Evidence Report series serves as a record of work carried out or commissioned by Natural Resources Wales. It also helps us to share and promote use of our evidence by others and develop future collaborations. However, the views and recommendations presented in this report are not necessarily those of NRW and should, therefore, not be attributed to NRW.

Page 2 www.naturalresourceswales.gov.uk www.naturalresourceswales.gov.uk
Report series: NRW Evidence Report Report number: 243 Publication date: June 2018 Contract number: Marine and Coastal Casework Framework 362 ACCW 13
Lot3_07 Contractor: ABPmer Contract Manager: Seaton CG. Title: Guidance on Best Practice for Marine and Coastal
Physical Processes Baseline Survey and Monitoring Requirements to inform EIA of Major Development Projects
Author(s): Brooks AJ, Whitehead, PA, Lambkin DO. Technical Editor: Seaton CG. Peer Reviewer(s) Rimington, N., Ibrahim, J., Haines, L., Ramsay, K., Evans,
S., Vince, S., Moon, J., Robinson, K., Lindenbaum, C. Approved By: Seaton CG. Restrictions: None Distribution List (core) NRW Library, Bangor 2 National Library of Wales 1 British Library 1 Welsh Government Library 1 Scottish Natural Heritage Library 1 Natural England Library (Electronic Only) 1 Distribution List (others) Interagency Geomorphology Group Recommended citation for this volume: Brooks, AJ., Whitehead, PA., Lambkin, DO. 2018. Guidance on Best Practice for Marine and Coastal Physical Processes Baseline Survey and Monitoring Requirements to inform EIA of Major Development Projects. NRW Report No: 243, 119 pp, Natural Resources Wales, Cardiff.
Page 3 www.naturalresourceswales.gov.uk www.naturalresourceswales.gov.uk
Contents (This is automatic)
Crynodeb Gweithredol ............................................................................................................ 9
1. Executive Summary ...................................................................................................... 11
1. Report Scope and Purpose ........................................................................................... 13
1.1. Overview ...........................................................................................................................13
1.2. Aims and objectives ..........................................................................................................13
2. Background .................................................................................................................. 14
3. Literature Review of EIA Baseline Survey and Monitoring Requirements ..................... 19
3.1. Overview ...........................................................................................................................19
3.2. EIA guidance for major development projects ..................................................................20
3.3. National policy assessment guidance for major development projects ............................20
3.4. Generic data collection and data requirements guidance ................................................22
3.5. Industry specific guidance .................................................................................................26
3.5.1. Ports and harbours .........................................................................................................26
3.5.2. Aggregates .....................................................................................................................26
3.5.3. Power stations ................................................................................................................27
3.5.4. Offshore wind ..................................................................................................................27
3.5.5. Marine renewables (tidal range, stream and wave) .......................................................28
3.5.6. Subsea Cables ...............................................................................................................29
4. Review of EIA Project Information ................................................................................ 36
5. Potential Impacts .......................................................................................................... 37
5.1. Overview ...........................................................................................................................37
5.2. Port and harbour developments .......................................................................................39
5.3. aggregate extraction .........................................................................................................40
5.4. Power stations (including nuclear) ....................................................................................41
5.5. Offshore wind ....................................................................................................................41
5.6. Tidal range ........................................................................................................................42
5.7. Tidal stream ......................................................................................................................43
5.8. Wave .................................................................................................................................44
5.9. Subsea cables ..................................................................................................................45
5.10. Impacts summary ..............................................................................................................46
6. Data Requirements for EIA Baseline Characterisation .................................................. 49
6.1. Overview ...........................................................................................................................49
6.2. Objectives of data collection .............................................................................................49
6.3. Hydrodynamics .................................................................................................................53
6.3.1. Water levels and currents ...............................................................................................53
6.3.2. Salinity and temperature .................................................................................................54
6.3.3. Waves .............................................................................................................................55
6.4. Sediments and geology ....................................................................................................57
6.4.1. Sediment grain properties and bulk geotechnical properties .........................................57
6.4.2. Suspended sediment properties .....................................................................................59

Page 4 www.naturalresourceswales.gov.uk www.naturalresourceswales.gov.uk
6.4.3. Sediment transport .........................................................................................................60
6.5. Topography/ morphology ..................................................................................................60
6.5.1. Seabed bathymetry ........................................................................................................60
6.5.2. Coastal frontage .............................................................................................................62
6.6. Baseline data requirements checklist ...............................................................................63
6.7. Good practice for baseline survey design .........................................................................67
7. Good Practice for Marine and Coastal Physical Processes Monitoring ......................... 70
7.1. Overview ...........................................................................................................................70
7.2. Monitoring objectives ........................................................................................................70
7.3. Parameters to be investigated ..........................................................................................71
7.4. Measurement of parameters .............................................................................................74
7.5. Timing and frequency of monitoring .................................................................................75
7.6. Establishment of review periods .......................................................................................75
7.7. Identification of appropriate thresholds .............................................................................75
7.8. Identification of remedial action ........................................................................................76
8. Survey Techniques ....................................................................................................... 76
8.1. Overview ...........................................................................................................................76
8.2. Hydrodynamics .................................................................................................................77
8.3. Sediments .........................................................................................................................78
8.3.1. Seabed sampling ............................................................................................................78
8.3.2. Water column sampling ..................................................................................................79
8.3.3. Sediment transport measurement ..................................................................................79
8.4. Topography/ morphology ..................................................................................................79
8.4.1. Beach/ inter-tidal .............................................................................................................79
8.4.2. Bathymetry ......................................................................................................................80
8.4.3. Remote sensing ..............................................................................................................80
References ........................................................................................................................... 81
Appendices .......................................................................................................................... 87
Appendix A Industry Specific Guidance .......................................................................... 88
Appendix B Summary of Marine and Coastal Processes Surveying Techniques, Including Strengths, Weaknesses and Best Practice ........................................................................... 97
Data Archive Appendix ....................................................................................................... 117

Page 5 www.naturalresourceswales.gov.uk
List of Figures (These are automatic)
Figure 1 Summary of stages of development of conceptual model (from ABPmer & HR Wallingford, 2008) ................................................................................................................ 16
Figure 2 Examples of relationships between marine and coastal physical processes and other EIA topic receptors. (Adapted from Emu, 2012) .......................................................... 18
List of Tables (These are automatic)
Table 1 Summary of baseline data requirements for marine and coastal physical processes studies (adapted from ODPM, 2005) .................................................................................... 15
Table 2 Summary of key documents to inform marine and coastal physical processes assessments ........................................................................................................................ 31
Table 3 Definitions for magnitude of change ......................................................................... 48
Table 4 Summary of potential changes associated with major marine developments ........... 48
Table 5 Checklist to help determine the suitability of data for informing marine, coastal and estuarine physical processes investigations ......................................................................... 64
Table 6 Example metocean sufficiency criteria for a proposed new build nuclear development (taken from ABPmer, 2015) .................................................................................................. 69
Table 7 Potential options available for monitoring surveys for marine and coastal physical processes studies. (Adapted from The Crown Estate, 2013) ................................................ 72
Acknowledgements
Thanks are extended to Cai Bird (Marlan Maritime Technologies Ltd) and Paul Bell (National Oceanography Centre, Liverpool) for their input to the discussions associated with the application of radar to hydrodynamic and morphological monitoring. We are also grateful to Stuart McVey (Channel Coastal Observatory) for his expert knowledge associated with the use of laser scanning for beach surveys.

Page 6 www.naturalresourceswales.gov.uk
List of Acronyms and Abbreviations
ABPmer ABP Marine Environmental Research Ltd ABS Acoustic Backscatter ADCP Acoustic Doppler Current Profiler AEMP Adaptive Environmental Monitoring Plan AGDS Acoustic Ground Discrimination Systems AWAC Acoustic Wave and Current BEIS Business, Energy and Industrial Strategy BERR Department for Business, Enterprise and Regulatory Reform BMAPA British Marine Aggregate Producers Association BODC British Oceanographic Data Centre BSI British Standards Institute CCO Channel Coastal Observatory Cefas Centre for Environment, Fisheries and Aquaculture Science CERC Coastal Engineering Research Center CIRIA The Construction Industry Research and Information Association CIS Coastal Impact Studies COWRIE Collaborative Offshore Wind Research into the Environment CPTM Mechanical Cone. Penetration Test cSAC candidate Special Area of Conservation CTD Conductivity, Temperature and Depth CTD Conductivity, Temperature and Depth D&A D&A Instrument Company DCLG Department for Communities and Local Government DECC Department of Energy and Climate Change Defra Department for Environment, Food & Rural Affairs DEM Digital Elevation Models DfT Department for Transport DGPS Differential Global Positioning Systems DTI Department of Trade and Industry EA Environment Agency EGA Expert Geomorphological Assessment EIA Environmental Impact Assessment ES Environmental Statement ESA European Space Agency EU European Union FCERM Flood and Coastal Erosion Risk Management FRA Flood Risk Assessment GIS Geographical Information System GN Guidance Note GPS Global Positioning System GRADISTAT Particle Size Analysis Software GW Gigawatt HDD Horizontal Directional Drill HRA Habitats Regulations Assessment Hs Significant wave height HS&E Health and Safety Executive HSE Health and Safety Executive HTA Historic Trend Analysis IEMA Institute of Environmental Management and Assessment

Page 7 www.naturalresourceswales.gov.uk
IHO International Hydrographic Organization ISO International Organization for Standardization ISSMGE International Society for Soil Mechanics and Geotechnical Engineering JNCC Joint Nature Conservation Committee LiDAR Light Detection and Ranging MAFF Ministry of Agriculture, Fisheries and Food MALSF The Marine Aggregate Levy Sustainability Fund MBES Multibeam Echo-Sounder MDE Marine Data Exchange MEDIN The Marine Environmental Data and Information Network MEMG The Marine Environment Monitoring Group MESH Mapping European Seabed Habitats MLWS Mean Low Water Spring MMO Marine Management Organisation MOLF Marine Offloading Facility MUMM Management Unit of the North Sea Mathematical Models MW Megawatt N/A Not Applicable NMBAQC Northeast Atlantic Marine Biological Analytical Quality Control NNRCMP National Network of Regional Coastal Monitoring Programmes NOAA National Oceanic and Atmospheric Administration NPS National Policy Statement NRW Natural Resources Wales NSIP Nationally Significant Infrastructure Project OBS Optical Backscatter ODPM Office of the Deputy Prime Minister OGP Oil and Gas Producers. OWF Offshore Wind Farm OWPB Offshore Wind Farm Programme Board PAH Poly Aromatic Hydrocarbons PCB Poly Chlorinated Biphenyl PPK Post Processed Kinematic PSA Particle Size Analysis R.V. Research Vessel ROG Recommended Operating Guidelines RSMP Regional Seabed Monitoring Programme RTK Real Time Kinematic SAC Special Area of Conservation SAR Synthetic Aperture Radar SBA Sediment Budget Analysis SBES Single Beam Echo-Sounder SCI Site of Community Importance SDB Satellite Derived Bathymetry SMP Shoreline Management Plan SNH Scottish Natural Heritage SSC Suspended Sediment Concentrations Tp Peak wave period UAS Unmanned aircraft system UAV Unmanned Aerial Vehicles UK United Kingdom

Page 8 www.naturalresourceswales.gov.uk
UKHO United Kingdom Hydrographic Office USGS United States Geological Survey WFD Water Framework Directive WNMP Welsh National Marine Plan

Page 9 www.naturalresourceswales.gov.uk
Crynodeb Gweithredol Pwrpas yr adroddiad hwn yw rhoi canllawiau ar arolwg sylfaenol yr Asesiad o'r Effaith Amgylcheddol ar gyfer prosesau ffisegol morol, arfordirol ac aberol a gofynion monitro ar gyfer prosiectau datblygu mawr, sef:
• Datblygiadau mewn porthladdoedd;
• Cloddio cerrig mân;
• Gorsafoedd pŵer (gan gynnwys gorsafoedd niwclear);
• Gwynt ar y môr;
• Datblygiadau ynni adnewyddadwy eraill gan gynnwys: amrediad llanw ffrwd lanw tonnau
• Ceblau o dan y môr (yn enwedig lle y byddant yn dod i olwg tir).
Cyflawnwyd hyn drwy adolygu canllawiau presennol a gyhoeddwyd sy'n berthnasol i astudiaethau'r Asesiad o'r Effaith Amgylcheddol ar gyfer prosesau ffisegol, ystyried enghreifftiau o brosiectau (gan gynnwys datblygiadau a gynlluniwyd a datblygiadau gweithredol) ac o brofiad yr awduron yn ystod y gwaith ar ddatblygiadau morol mawr. O ran y datblygiadau mawr a nodir uchod, mae llwybrau ar gyfer newid a'r effeithiau posibl ar gyfer pob cam datblygu wedi cael eu nodi ar eu cyfer (h.y gwaith adeiladu, gweithredu a dadgomisiynu). Cafwyd ymgais i ganfod effaith posibl y datblygiadau hyn (yn ansoddol), gan nodi'r mathau o ddatblygu a'r camau datblygu y byddant yn debygol o effeithio arnynt fwyaf. Canllaw yn unig yw hyn gan fod angen rhoi ystyriaeth benodol i'r safle a'r raddfa ar gyfer pob datblygiad penodol. Mae'r adroddiad hefyd yn nodi'r gofynion data sy'n debygol o fod yn ofynnol ar gyfer nodweddu sylfaenol yr Asesiad o'r Effaith Amgylcheddol, o dan y penawdau canlynol:
• Hydrodynameg (tonnau, cerrynt llanw a lefelau dŵr);
• Gwaddodion, trosglwyddo gwaddod a Daeareg;
• Topograffi / morffoleg. Disgrifir yr amcanion ar gyfer casglu'r data a darperir canllawiau o ran manylion gofodol a thymhorol lle y bo'n bosibl. Un o'r prif nodau yw helpu i ganfod digonolrwydd gwybodaeth arolwg bresennol, bylchau data, y gofyniad (neu fel arall) a'r cyfle i gasglu data newydd. Gan fod rhai darnau o ddata newydd yn debygol o fod yn ofynnol ar gyfer y datblygiadau mawr a gaiff eu hystyried yn y crynodeb hwn, rhoddir canllawiau ar arfer da ar gyfer llunio arolwg sylfaenol. Nodir trosolwg o'r prif dechnegau y gellir eu defnyddio i gasglu gwybodaeth sylfaenol ar brosesau ffisegol morol, arfordirol ac aberol, gan gynnwys arfarnu galluoedd a chyfyngiadau pob techneg. Oherwydd yr ansicrwydd sy'n aml yn gynhenid wrth ragfynegi unrhyw newid morffolegol yn y dyfodol, mae monitro weithiau yn ofyniad angenrheidiol ar gyfer prosiectau seilwaith mawr. Yn unol â hynny, caiff arfer da ar gyfer monitro ei nodi. Mae hyn yn cynnwys trafodaeth er mwyn mynd i'r afael â'r canlynol:

Page 10 www.naturalresourceswales.gov.uk
• Beth yw'r amcanion/damcaniaethau monitro;
• Ba baramedrau y dylid eu harchwilio;
• Sut y dylid mesur y paramedrau o ddiddordeb;
• Amser y flwyddyn/amlder y caiff y paramedr ei fesur ag ef;
• Sefydlu cyfnodau adolygu sy'n darparu'r gallu i atal neu addasu'r broses o fonitro os bydd y mesuriadau yn awgrymu nad oes unrhyw newid;
• Nodi trothwyon newid perthnasol;
• Nodi camau gweithredu adferol.

Page 11 www.naturalresourceswales.gov.uk
1. Executive Summary The purpose of this report is to provide guidance on marine, coastal and estuarine physical processes Environmental Impact Assessment (EIA) baseline survey and monitoring requirements for major development projects, namely:
• Port and harbour developments;
• Aggregate extraction;
• Power stations (including nuclear);
• Offshore wind;
• Other renewable energy developments including: tidal range tidal stream wave
• Sub-sea cables (especially where they make landfall).
This has been achieved through a review of existing published guidance relevant to physical processes EIA studies, consideration of project examples (including both planned and operational developments) and from the experience gained by the authors during work on large scale marine developments. For the major developments identified above, pathways for change and potential impacts have been identified for each of the development stages (i.e. construction, operation and decommissioning). An attempt has been made to (qualitatively) determine the potential magnitude of these changes, identifying for which development types and development stages they are likely to be greatest. This is provided as a guide only as site and scale specific consideration is required for each specific development. The report also sets out the likely data requirements for EIA baseline characterisation, under the following topics:
• Hydrodynamics (waves, tidal currents and water levels);
• Sediments, sediment transport and Geology; and
• Topography/ morphology. The objectives for collecting the data are described and where possible, guidance is given with regards to the spatial and temporal coverage. A key aim here is to help determine the adequacy of existing survey information, data gaps and the requirement (or otherwise) and scope for new data. Since some new data is likely to be required for the major developments considered herein, guidance is provided with regards to good practice for baseline survey design. An overview of the main techniques which may be used to gather baseline information on marine, coastal and estuarine physical processes is set out, including an appraisal of the capabilities and limitations of each technique.

Page 12 www.naturalresourceswales.gov.uk
Given the uncertainty which is often inherent with any prediction of future morphological change, monitoring is sometimes a necessary requirement for large infrastructure projects. Accordingly, good practice for monitoring is identified. This includes discussion to address the following:
• What are the monitoring objectives/ hypotheses;
• Which parameters should be investigated;
• How should the parameters of interest be measured;
• The time of year/ frequency with which the parameter will be measured;
• The establishment of review periods providing the ability to stop or modify the monitoring exercise if the measurements suggest no change;
• The identification of appropriate thresholds of change; and
• Identification of remedial action.

Page 13 www.naturalresourceswales.gov.uk
1. Report Scope and Purpose 1.1. Overview Major developments within the marine environment have the potential to cause physical changes to water column properties as well as morphological change to the sub-tidal, inter-tidal and supra-tidal environment. In order to provide robust estimates of the temporal and spatial scale of these changes in advance of project construction and operation, it is essential that marine and coastal physical processes in the vicinity of the development are well understood. This understanding is typically achieved through the analysis of new and existing field data along with existing studies, complemented (where necessary) through numerical modelling. Whilst a wealth of existing literature exists, there is not one document that co-ordinates coherent and clear best practice guidance on baseline survey and monitoring design, data acquisition techniques, and standards in terms of data quality and coverage. This report therefore seeks to address this knowledge gap by providing marine and coastal physical processes guidance for all major marine development projects relevant to Welsh waters. The projects that require Environmental Impact Assessment (EIA) which are given specific focus in this guidance include major marine developments and installations which have the potential to introduce discernible effects to the marine, coastal and estuarine environment, namely:
• Port and harbour developments;
• Aggregate extraction;
• Power stations (including nuclear);
• Offshore wind;
• Other renewable energy developments including: tidal range tidal stream wave
• Sub-sea cables (especially where they make landfall). The new and emerging developments within the marine renewable energy sector (including tidal range, tidal stream and wave energy devices) are of particular interest since there is limited established guidance related to these. This is especially relevant since the Welsh Government is strongly committed to unlocking the energy potential from Welsh waters, which offer particularly favourable opportunities for harnessing wave and tidal energy (Marine Energy Wales, 2016). It is intended that the advice provided in this report is used directly by Natural Resources Wales (NRW) as well as being shared with developers and stakeholders to help inform data collection and monitoring requirements. 1.2. Aims and objectives The aims of this project, as stated in the project brief issued by NRW, are to:

Page 14 www.naturalresourceswales.gov.uk
• Review existing best practice guidance and EIA project information to determine baseline and monitoring data requirements for major developments of different types, over different development stages for physical processes parameters;
• Provide a summary of available survey techniques and key information regarding their use; and
• Create a product which assists provision of NRW advice to developers in designing and undertaking robust baseline survey and monitoring programmes and to subsequently streamline the regulatory review and consultation process.
In order to achieve these aims, a number of tasks are identified:
• Undertake a literature review of relevant, published EIA baseline survey and monitoring requirements and existing guidance for marine and coastal physical processes relevant for major development projects and summarise key findings;
• Review available, relevant, key EIA project information for different development types on marine and coastal physical processes survey and monitoring requirements, identify any lessons learnt and summarise key findings;
• For each development type and each development stage, summarise key findings and provide an expert view on: Potential impacts to physical processes receptors/parameters Objectives of data requirements Scope and design of data requirements for the data types identified How the data should be collected in terms of survey technique
• Create a checklist of key principles to help determine if available data is appropriate to help fulfil data requirements; and
• Create a table to communicate information regarding survey techniques.
(It is noted that whilst sediment contaminants may be an issue for consideration within physical processes EIA studies, water quality parameters are outside the scope of this guidance.)
In order to achieve these aims and objectives, the report has been structured as follows:
• Background;
• Literature Review of EIA Baseline Survey and Monitoring Requirements;
• Review of EIA Project Information;
• Potential Impacts;
• Data Requirements for EIA Baseline Characterisation;
• Good Practice for Marine and Coastal Physical Processes Monitoring; and
• Survey techniques.
2. Background The term marine and coastal physical processes is generally used as a collective for the following themes:
• Hydrodynamics (waves, tidal currents and water levels);
• Sediments, sediment transport and geology; and
• Topography/ morphology.

Page 15 www.naturalresourceswales.gov.uk
The specific types of parameters that need to be covered by a baseline characterisation exercise are shown in Table 1Table 1. Combined knowledge of these parameters is central to developing ‘conceptual understanding’ of a system, which describes how the processes of a system link together and evolve in response to applied forces. Survey data (both new and existing) as well as outputs from numerical models (e.g. considering waves, tides, salinity and sediment transport) can be used to support the development, quantification and testing of the conceptual understanding although any numerical modelling should be viewed as a supporting tool, rather than as a substitute. This concept is illustrated in Figure 1 and is also discussed in further detail within NRW publication No. 162 ‘Advice on Assessment and Monitoring of Coastal and Estuarine Habitat Creation Schemes’ (Brew and Adnitt, 2016). Table 1 Summary of baseline data requirements for marine and coastal physical processes studies (adapted from ODPM, 2005)
Theme Parameter
Hydrodynamics
Tidal regime (water level range, current speed and direction)
Wind wave and swell wave conditions (wave height, period and direction)
Residual water movement
Surge water levels and currents
Temperature, salinity and stratification
Sediments and Geology
Characteristics of seabed sediments (including contaminants)
Particle size and density
Lithology (origin, composition)
Thickness of sediment units (inc. consolidation and change over time)
Suspended sediment concentrations
Seabed mobility
Sediment transport pathways and rates
Topography/ morphology
Bathymetry
Bedforms and notable seabed features
Coastal topography, configuration and notable features
It is noted here that sediment contaminants are often considered within the EIA physical processes topic since marine sediments are commonly a sink for contaminants. If mobilised, they may affect water quality and influence spatial and temporal patterns of benthic communities. Key sediment contaminants that require analysis include organics, Poly Aromatic Hydrocarbons (PAH), Priority Hazardous Substances List I and List II metals and specific pollutants under the Water Framework Directive (WFD). Given that numerical modelling is very often used as a supporting tool in the assessment of major development projects, any guidance with respect to the collection of marine and coastal physical processes baseline survey data must also give due consideration to modelling data requirements. Best practice guidance on the use of numerical modelling to inform marine and coastal physical processes

Page 16 www.naturalresourceswales.gov.uk
assessments is the focus of a separate NRW report (Pye et al. 2017) and was also considered in Lambkin et al. (2009). Section 5 of the Pye et al. report gives specific consideration to establishing marine and coastal physical processes baseline understanding to support modelling and is cross referenced throughout this document.
Figure 1 Summary of stages of development of conceptual model (from ABPmer & HR Wallingford, 2008)

Page 17 www.naturalresourceswales.gov.uk
The development of marine and coastal physical processes conceptual understanding is central to any marine EIA. This is because changes to marine and coastal physical processes have the potential to directly and indirectly impact a wide range of environmental receptor groups as a result of disturbance to the ongoing processes. For instance:
• The creation of sediment plumes (which are typically reported in the marine and coastal physical processes section of an Environmental Statement) may lead to settling of material onto benthic habitats, causing smothering or affecting filter feeders, thus impacting sensitive receptors. The plumes themselves may also affect WFD water body status and impact ecological receptors through issues related to light attenuation;
• Scour around marine infrastructure may lead to a loss or modification of a seabed habitat and the requirement for scour protection (which itself is likely to represent a change of habitat);
• Increased water column turbulence due to the presence of seabed infrastructure may alter water column stratification which is known to influence the productivity of the food web and therefore the diversity of marine life (e.g. Carpenter et al. 2016); and
• Morphological alterations have the potential to change the existing and ongoing baseline environment and influences on water quality and therefore can be a relevant consideration in EIA, Habitats Regulations Assessment (HRA) and WFD assessments. This is because changes to hydrodynamic conditions in response to the presence of infrastructure and/or the modification of seabed geomorphology can cause a feedback creating short, medium and longer term effects which change the disturbance and subsequent dispersion characteristics over time.
In most cases, marine and coastal physical processes are not identified as receptors within an EIA but instead are classified as 'pathways' which have the potential to indirectly impact other environmental receptors. This concept of interaction between marine and coastal physical processes and other EIA topics is illustrated in Figure 2. Notwithstanding the above, some marine and coastal physical processes may be recognised as receptors warranting an assessment of impact significance within EIA reporting. These primarily include morphological features such as the coastline, estuaries, sand banks and navigation channels. However in some circumstances, water column features (such as water levels, currents and tidal mixing fronts) may also be considered as receptors. Such an example is the Severn Estuary Special Area of Conservation (SAC) where the physical processes themselves are notified as being a significantly important part of the feature:

Page 18
Figure 2 Examples of relationships between marine and coastal physical processes and other EIA topic receptors. (Adapted from Emu, 2012)

Page 19 www.naturalresourceswales.gov.uk
3. Literature Review of EIA Baseline Survey and Monitoring Requirements
3.1. Overview A considerable body of literature is available which is relevant to marine and coastal physical processes EIA studies for major infrastructure projects. All of these are relevant to baseline survey and monitoring requirements, either directly (through prescribing the types of data needed to inform the assessment) or indirectly (such as through the identification of potential impacts which may inform the survey scope). A list of the key identified documents is provided in Table 2, with entries broadly divided into one of four categories:
• EIA guidance for major development projects;
• National Policy assessment guidance for major development projects;
• Generic data collection and data requirements guidance; and
• Industry specific guidance. Within Table 2, an attempt has been made to identify the industries for which each guidance document/ report is most relevant:
• Where the identified guidance documents are targeted at a particular industry or group of industries, this is highlighted via darker red shading of the cells; and
• Where the identified guidance documents are of wider relevance to other industries (e.g. due to similarities in construction/ operation related activities and potential impacts), this is highlighted via lighter red shading of the cells.
This approach also helps to identify where guidance is available and where it may be lacking. With regards to the second bullet (above), analogous activities may be identified between each of the various major infrastructure projects listed in Table 2. For example, the construction of any large infrastructure project is likely to require extensive seabed preparation activities, carried out via dredging. These operations could be very similar (if not identical) to those carried out for the aggregate industry, for which detailed guidance is already available with regards to undertaking coastal impact studies (e.g. The Crown Estate, 2013). Recognising this overlap between the various industry activities, operations and potential impacts is important because it will allow those carrying out EIA studies to make use of a potentially wider evidence base to underpin and guide the assessment. This is particularly relevant for emerging technologies such as wave and tidal energy projects where the existing guidance and evidence base from operational projects is more limited. The list of documents summarised in Table 2 and discussed in this section is not exhaustive, with other potential useful documents also available. However, it is the author’s assertion that the documents considered here are amongst the most important and relevant at the time of writing and therefore have been prioritised over others.

Page 20 www.naturalresourceswales.gov.uk
3.2. EIA guidance for major development projects All of the projects set out in Table 2 will require an EIA to be undertaken and therefore should follow EIA best practice, as set out by the Institute of Environmental Management and Assessment (IEMA) (IEMA, 2004; 2015). Although this guidance is generic to all EIA topics, it does provide both an indication of what is expected to achieve regulatory compliance and what the aims are behind such compliance. Part of this process includes the development of a robust baseline and guidance is provided with regards to how this should be achieved (e.g. the role of consultees, the timing of surveys and consideration of uncertainty.) NRW has recently published a Guidance Note (GN) for developers and NRW staff on Scoping and Environmental Impact Assessment for Marine Developments (GN13) (NRW, 2017), which is available on NRW’s website. This document sets out Natural Resources Wales’s (NRW) guidance on how to identify the key impacts of marine development projects in Wales that require assessment under the Environmental Impact Assessment (EIA) Directive. It describes matters that we consider will need to be scoped in when undertaking an EIA. GN13 does not comprise legal advice and should not be interpreted as such. Project proposers should seek their own independent legal advice on any matters arising in connection with this note in respect of a specific activity or development project. GN13 provides guidance on good practice relating to the EIA scoping process. It does not comprise a formal Scoping Opinion and does not prejudice any advice that NRW might provide as part of a Scoping Opinion or during EIA for a specific activity or development project. Scottish Natural Heritage (SNH, 2013) provides those involved in the EIA process with practical guidance. Of note are Annexes 3 and 6 which describe potential effects on geodiversity interests and the marine environment, respectively. Geodiversity interests include particular morphological features and/or rocks/sedimentary deposits and are often identified as receptors within marine and coastal physical processes EIA studies. Finally, the British Standards Institute (BSI, 2015) provides EIA guidance tailored to offshore renewable energy projects (specifically offshore wind, wave and tidal stream renewable energy.) As well as containing a useful bibliography of offshore renewable energy guidance documents (Annex A), the report also contains practical information regarding the use of evidence plan meetings to agree project data requirements as well as establishing monitoring strategies. 3.3. National policy assessment guidance for major development projects With the exception of aggregate dredging, Industrial developments listed in Table 2 which are over 100MW would currently be classified as Nationally Significant Infrastructure Projects (NSIP) which require both a Development Consent Order determined by the UK Secretary of State, and a Marine Licence determined by NRW on behalf of Welsh Ministers. However it is important to note here that the Wales Act will bring in changes shortly that mean that some of these projects will fall under a new licencing regime.

Page 21 www.naturalresourceswales.gov.uk
• Marine licensing and species licensing functions will extend to the offshore region (in addition to current inshore). (The transfer of function will occur on 1st April 2018);
• On 1 April 2019, the Welsh Ministers will receive devolved powers for on- and offshore generating stations up to 350 MW. Should a project promoter wish to apply for consent on a project of between 1 MW and 350 MW on or after this date, the Welsh Ministers will be responsible for deciding the application under section 36 of the Electricity Act 1989, rather than the Secretary of State. This is in addition to the requirement for a marine licence from NRW. (A marine license alone will continue to be required for projects below 1MW);
• Welsh Government will receive regulatory and policy functions for ports on 1st April 2018. For non-works Harbour Orders, Welsh Government will determine these applications; and
• Longer term, Welsh Government are seeking to provide a ‘one-stop shop’ for development projects, to include the marine licence and to capture harbours and ports.
Developers and practitioners are advised to keep up to date with these licencing changes as details are announced and implemented over the next two years. Because the projects listed in Table 2 are considered key to national infrastructure development, each of the identified industries has an associated relevant National Policy Statement (NPS). These sit alongside the Welsh National Marine Plan (discussed later in this section) in providing advice for sector-specific developments. Although at a relatively high level, these documents do set out generic impacts which should be assessed for marine and coastal processes. For instance:
• The implications of the proposed project on strategies for managing the coast as set out in Shoreline Management Plans (SMPs)…any relevant Marine Plans…and capital programmes for maintaining flood and coastal defences (paragraph 5.5.7 of the Department of Energy and Climate Change (DECC) (2011a));
• The vulnerability of the proposed development to coastal change, taking account of climate change, during the project’s operational life and any decommissioning period (paragraph 5.5.7 of DECC (2011a));
• Increased suspended sediment loads in the intertidal zone during installation (paragraph 2.6.81 of DECC (2011b)); and
• Predicted rates at which the intertidal zone might recover from temporary effects (paragraph 2.6.81 of DECC (2011b)).
In addition to the above, The Planning Inspectorate has published a series of advice notes which are relevant to the planning process for NSIPs. These National infrastructure advice notes are published to provide advice and information on a range of issues arising throughout the whole life of the application process. Although non-statutory, in many cases they include recommendations from the Planning Inspectorate about the approach to particular matters of process, which developers and others are encouraged to consider carefully. Whilst not directly applicable to the consideration of data requirements for EIA, they may be of wider (indirect) relevance. For example, Advice Note 9 (The Planning Inspectorate, 2012) sets out the principles of the Rochdale Envelope approach to EIA, helping to define the degree of flexibility that would be considered appropriate with regards to an application for a NSIP. This

Page 22 www.naturalresourceswales.gov.uk
may well have implications for the spatial and temporal extent of baseline surveys that may be required for a project. Marine Scotland (2012) has produced licensing policy guidance for developers, regulators and statutory advisors to assist offshore renewable energy developers (wave, wind and tide developments) in Scottish waters. Although the document itself is obviously not directly applicable to developments in Welsh waters, it does provide useful advice with respect to developing a robust baseline, including a discussion of common inadequacies associated with gathering environmental baseline data. These include:
• Data-gaps not identified;
• Reliance on out-of-date data;
• Omission of important data that are available;
• Narrow focus on the development site, omitting the wider area;
• Inappropriate/inadequate survey methodologies;
• Changing survey methodologies without consultation;
• Inadequate acknowledgement of data limitations;
• Inadequate knowledge of the assessment process and work required;
• Insufficient time allocated in project schedules to ensure the collection of robust data;
• Insufficient funds allocated for surveys; and
• No consideration of presentation and analysis requirements. Appendix B of Marine Scotland (2012) also contains useful baseline information sources relating to marine and coastal physical processes studies which may be used in support of EIA/ HRA. Finally, the Welsh National Marine Plan (which at the time of writing is a draft document out for consultation) sets out Welsh Government’s policy for the next 20 years for the sustainable development of the Welsh marine planning area. The final document will set out ambitions for the future use of marine natural resources and how various marine users should interact and consider each other’s activities and future plans. Sector specific policies are provided for nearly all of the marine developments considered in this guidance document whilst general policies (including that related to climate change) are also set out. 3.4. Generic data collection and data requirements guidance Much of the data required to inform baseline understanding of marine and coastal physical processes is also of direct relevance to other EIA/ HRA/ WFD topics. This is particularly the case with data relating to sediment characteristics which is needed in marine and coastal physical processes studies to inform understanding of (amongst other things) sediment mobility/ transport on the bed and in the water column and in benthic studies to support biological/ ecological analysis. Because survey design, sediment sampler type and sample processing techniques can substantially affect resulting biological and physico-chemical measurements, a number of relevant guidance documents have been produced (e.g. JNCC, 2004; Ware and Kenny, 2011; Noble James et al., 2017). Although primarily written for habitat characterisation and monitoring purposes, the guidance with respect to the collection and subsequent

Page 23 www.naturalresourceswales.gov.uk
analysis of sediment samples is broadly applicable to marine and coastal physical processes studies. Of particular relevance is the Northeast Atlantic Marine Biological Analytical Quality Control (NMBAQC) Scheme guidance for the processing of sediment samples (Mason, 2016). The NMBAQC is a membership scheme for sediment laboratories with regulators requiring that samples be analysed by a participant laboratory. The motivation for this was the realisation that substantial variation in the methods of sediment sample collection, analysis and reporting was apparent between the laboratories who are involved in national level marine monitoring in the UK. In the NMBAQC Annual Report, guideline procedures are described for sampling and sediment Particle Size Analysis (PSA). Procedures are recommended for sample collection, sample analysis, data recording and quality assurance. In addition to the NMBAQC guidelines, the aggregate industry has also produced its own protocol for sample collection to support the Regional Seabed Monitoring Programme (RSMP) baseline assessment (Cooper and Mason, 2014; Cooper et al. 2017). The RSMP stipulates where and what sampling should be undertaken, and how often (with an overarching aim to help Cefas develop links between habitat type and benthic abundance). The RSMP protocol relies heavily on the use of sieves because the aggregate industry’s historic data has been generated primarily using this method. This approach is justified by the generally coarse nature of sediments found in aggregate extraction areas (sands and gravels). The RSMP PSA methodology has been standardised to take into account previous work, as well as to ensure the data will be useful in a wider context. Both the NMBAQC scheme and RSMP co-exist without one being fundamentally at odds with the other. In this way samples can be collected and analysed in accordance with RSMP guidelines whilst also satisfying the requirements of NMBAQCs. PSA may not necessarily meet the performance criteria for the NMBAQC scheme (since it is dependent on a range of aspects) but just because the RSMP approach is being followed, it doesn’t mean that the NMBAQC criteria won’t be met. For the large (NSIP) developments which are the focus of this report, it is generally the case that the developer will commission project specific hydrographic surveys involving single beam echo-sounder (SBES) or multibeam echo-sounder (MBES) equipment. Typically, such surveys will be carried out in accordance with International Hydrographic Organization (IHO) standards (S44 and S57) for hydrographic surveys (IHO, 2008). Although designed to provide a set of standards for the execution of hydrographic surveys for navigation, the guidance is equally relevant for surveys undertaken for environmental purposes. IHO (2008) also provides a (quantitative) method for the calculation of uncertainty, metadata recommendations, guidelines for quality control and defines the main sources of error associated with hydrographic surveying. Of particular value are Annexes A and B which provide guidelines for quality control for specific equipment types (e.g. SBES, MBES and bathymetric Light Detection and Ranging (LiDAR)) and Data Processing. Further information on the concepts involved in hydrography as well as guidance to plan and execute hydrographic surveys can also be found in The Manual on Hydrography (IHO Publication M-13) (IHO, 2011). It is noted that Chapter

Page 24 www.naturalresourceswales.gov.uk
6 of IHO (2011) also includes detailed information on topographic surveying, both for ground surveying and remote sensing techniques. A key element of IHO (2008) is the specification of the ‘orders’ of survey that are considered acceptable to allow hydrographic offices / organizations to produce navigational products allowing safe navigation across the surveyed area. These orders range from ‘Special Order’ (highest accuracy – for shallow water depths where under keel clearance is critical) to ‘Order 2’ (least stringent - where only a general description of the seabed is required). For each of these orders, quantitative definitions are provided for minimum survey standards, including:
• Total horizontal uncertainty;
• Total vertical uncertainty;
• Feature size that can be detected; and
• Line spacing. Numerical models are routinely used within environmental assessment, including for EIAs, HRAs, and WFD Assessments, to help understand potential changes to the hydrodynamic and sediment transport regime arising from a proposed development over a range of timescales (Pye et al. 2017). High quality data which appropriately characterises the geographical area of interest is critical to robust calibration and validation of these numerical models and therefore existing numerical modelling guidance typically contains highly relevant discussions concerning data provenance, accuracy and suitability. Of potential relevance to all developments considered in this document is NRW publication No. 208 ‘Advice to inform development of guidance on marine, coastal and estuarine physical processes numerical modelling assessments’ (Pye et al. 2017). The purpose of this report is to inform the development of NRW best practice guidance to organisations who may be considering the use of numerical modelling to support an EIA, HRA or WFD assessment related to a development within the coastal zone or adjoining marine area. Of particular relevance to this study is section 5 from Pye et al. (2017), which provides guidelines for establishing a physical processes baseline to support modelling. This includes discussion of the types of data used to inform the baseline, as well as more specific consideration of bathymetric, hydrodynamic, seabed characterisation and sediment transport data requirements. A number of the major developments identified (including power stations, ports and harbours) may be situated in estuarine settings and therefore require understanding about past, ongoing and future morphological change. Of relevance to such investigations is the Estuary Guide (ABPmer & HR Wallingford, 2008) which aims to provide an overview of how to identify and predict morphological change within estuaries, as a basis for sound management. Of particular interest is the ‘Data Requirements’ guide which presents a discussion of the data requirements for estuary analysis and modelling, including data quality, resolution and accuracy. This document also gives consideration to data adequacy and sets out the situations in which new data collection may be required. Potential sources of error associated with bathymetric, flow, wave and sediment transport data are set out and examples are provided with regards to how survey error may potentially influence estimates of future morphological change in estuaries. These considerations of data error and uncertainty are valid for data collected in all marine settings, not just in estuarine

Page 25 www.naturalresourceswales.gov.uk
environments. HR Wallingford (2000) provides a similarly useful publication entitled ‘A guide to Prediction of Morphological Change within Estuarine Systems.’ This covers a number of similar themes to the ‘Data Requirements’ section of the Estuary Guide, including the data needed to predict morphological change, the tools and techniques that are available and discussion with respect to how results can be interpreted. Also of relevance to all major marine developments is the recent publication by Uncles and Mitchell (2017) ‘Estuarine and Coastal Hydrography and Sediment Transport.’ This publication provides a guide to the latest remote and in situ techniques used to measure sediments, quantify seabed characteristics, and understand physical properties of water and sediments and transport mechanisms in estuaries and coastal waters. It sets out how to measure important variables as well as the techniques commonly used to process and analyse the resulting data. The advantages and disadvantages of each technology are explained, and a review of recent fieldwork experiments is undertaken to demonstrate how modern methods apply in real-life estuarine and coastal campaigns. There is now a requirement for offshore developers to submit their survey data to the Marine Data Exchange (MDE), a system used to store, manage and disseminate data provided to The Crown Estate. A requirement of this system is that all submitted data is accompanied by ‘MEDIN’ compliant metadata. The Marine Environmental Data and Information Network (MEDIN) is a partnership of UK organisations committed to improving access to marine data. They have produced a Standard for marine metadata -‘Discovery metadata’ - which is a list of information that accompanies a data set, allowing other users to find out what the data set contains, where it was collected and how to get hold of it. MEDIN promotes the use of standardised field names and controlled vocabularies so that data sets are described in a consistent way for every type of marine data. The metadata is made up of a series of mandatory and optional data elements (30 in total) which are divided into the following categories:
• Elements for identifying a resource;
• Elements classifying spatial data and services;
• Elements describing data quality;
• Elements relating to data usage;
• Elements relating to Conformity; and
• Elements relating to metadata. MEDIN (2014) provides guidance on how to complete each of these elements. However, it is noted here that metadata standards may change over time and it is recommended that users check online to ensure that the most current version is in use. Finally, it is noted that a wide range of data portals exist containing potentially useful physical processes baseline information. This information may be used to help develop conceptual understanding and (in some circumstances) reduce the requirement for new data (Section 6). A number of useful data repositories are listed in Lambkin et al. (2009) and Pye et al. (2017). The Lle Geo-Portal also includes a
Page 26 www.naturalresourceswales.gov.uk
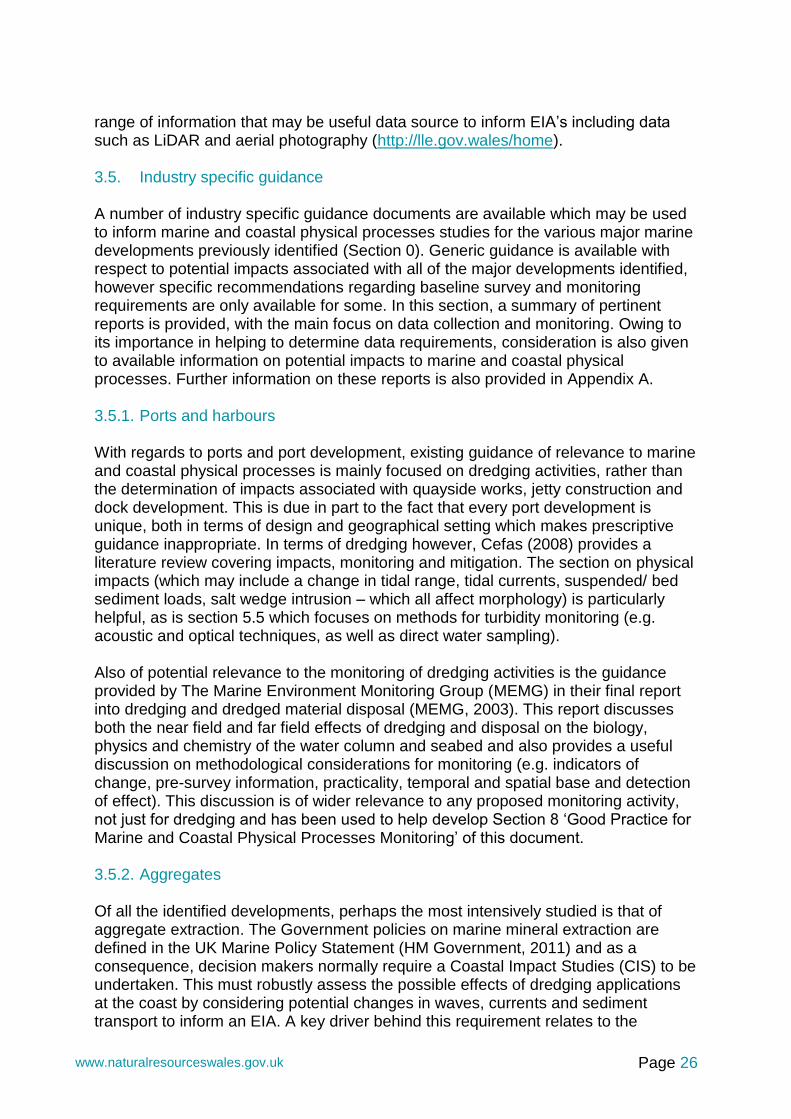
range of information that may be useful data source to inform EIA’s including data such as LiDAR and aerial photography (http://lle.gov.wales/home). 3.5. Industry specific guidance A number of industry specific guidance documents are available which may be used to inform marine and coastal physical processes studies for the various major marine developments previously identified (Section 0). Generic guidance is available with respect to potential impacts associated with all of the major developments identified, however specific recommendations regarding baseline survey and monitoring requirements are only available for some. In this section, a summary of pertinent reports is provided, with the main focus on data collection and monitoring. Owing to its importance in helping to determine data requirements, consideration is also given to available information on potential impacts to marine and coastal physical processes. Further information on these reports is also provided in Appendix A. 3.5.1. Ports and harbours With regards to ports and port development, existing guidance of relevance to marine and coastal physical processes is mainly focused on dredging activities, rather than the determination of impacts associated with quayside works, jetty construction and dock development. This is due in part to the fact that every port development is unique, both in terms of design and geographical setting which makes prescriptive guidance inappropriate. In terms of dredging however, Cefas (2008) provides a literature review covering impacts, monitoring and mitigation. The section on physical impacts (which may include a change in tidal range, tidal currents, suspended/ bed sediment loads, salt wedge intrusion – which all affect morphology) is particularly helpful, as is section 5.5 which focuses on methods for turbidity monitoring (e.g. acoustic and optical techniques, as well as direct water sampling). Also of potential relevance to the monitoring of dredging activities is the guidance provided by The Marine Environment Monitoring Group (MEMG) in their final report into dredging and dredged material disposal (MEMG, 2003). This report discusses both the near field and far field effects of dredging and disposal on the biology, physics and chemistry of the water column and seabed and also provides a useful discussion on methodological considerations for monitoring (e.g. indicators of change, pre-survey information, practicality, temporal and spatial base and detection of effect). This discussion is of wider relevance to any proposed monitoring activity, not just for dredging and has been used to help develop Section 8 ‘Good Practice for Marine and Coastal Physical Processes Monitoring’ of this document. 3.5.2. Aggregates Of all the identified developments, perhaps the most intensively studied is that of aggregate extraction. The Government policies on marine mineral extraction are defined in the UK Marine Policy Statement (HM Government, 2011) and as a consequence, decision makers normally require a Coastal Impact Studies (CIS) to be undertaken. This must robustly assess the possible effects of dredging applications at the coast by considering potential changes in waves, currents and sediment transport to inform an EIA. A key driver behind this requirement relates to the

Page 27 www.naturalresourceswales.gov.uk
concerns by some stakeholder groups (in particular local residents) that marine aggregate dredging from sandbanks has resulted in severe local beach erosion. (Historically, this has been a particular concern of local stakeholders along the Gower and Penarth coastlines (Phillips, 2008)). With respect to data requirements for undertaking a robust coastal impact study for aggregate extraction operations, The Crown Estate (2013) provides a guidance document for government regulators/ agencies, consultees, dredging companies and consultants which sets out a best practice approach. For each potential impact pathway identified, information requirements and appropriate assessment methods are set out. Of particular value is the section on monitoring which identifies a series of monitoring activities (e.g. bathymetry, beach topography, sediment transport etc.) and highlights appropriate spatial and temporal extents for data acquisition. This guidance is of wider relevance to most of the major developments which are the subject of this NRW report and this point is expanded upon further, in Section 7.2. Newell and Woodcock (2013) also provide a helpful overview of current industry practice with respect to marine aggregate dredging and the environment. This report does not specifically concentrate on marine and coastal physical processes but instead provides a more generic discussion of wider environmental and socio economic impacts, as well as regulation and management. Nevertheless, section 5 provides a good discussion on the impact of aggregate dredging on the physical environment, summarising the types of survey techniques typically used to inform baseline studies, as well as setting out the potential direct and indirect impacts of aggregate dredging, which is important is defining appropriate monitoring methods. 3.5.3. Power stations Whilst prescriptive guidance exists with regards to the modelling and assessment of thermal plumes associated with power stations (e.g. Environment Agency, 2010), no specific guidance is available regarding the assessment of coastal processes. As for ports and harbours, this is due in part to the fact that every development is unique, both in terms of design and geographical setting which makes prescriptive guidance inappropriate. However, many new build power stations typically require dredging to enable access to (and berthing at) a marine offloading facility and therefore the aforementioned discussion provided in Cefas (2008) may be of relevance. 3.5.4. Offshore wind An extensive body of literature and guidance is also available for informing offshore wind farm marine and coastal processes EIA studies. One of the earliest studies was that provided by ABPmer & Metoc in 2002, which provides guidelines for site specific data collection to inform marine and coastal processes studies, as well as identifying potential impacts. However, it is noted here that whilst this report remains of wider value in informing offshore wind farm assessments, it was based on relatively small developments which pre-date the (much larger) Round 2 and Round 3 projects currently being built/ going through the consenting process. Accordingly, the scales of impact referred to in ABPmer & Metoc (2002) are likely to be smaller than those potentially associated with the more recent Offshore Wind Farms (OWFs) (both built and proposed).

Page 28 www.naturalresourceswales.gov.uk
Perhaps of most relevance to informing understanding of data requirements for offshore wind farm marine and coastal processes studies are the guidance documents provided by Lambkin et al. (2009) and Judd (2011). Whilst the particular focus of the Lambkin et al. study is guidance for the application of coastal processes models in offshore wind farm studies, the document contains significant discussion regarding data requirements and adequacy. All marine and coastal physical processes data categories are covered (e.g. hydrodynamics, sediments, topography) with an appraisal of the strengths and weaknesses of various data types and collection methods (e.g. the merits of acoustic versus optical methods in the determination of water column turbidity). Judd (2011) provides information on site characterisation for ‘physical and sedimentary processes studies’. The remit of the study covered all offshore renewable developments (e.g. offshore wind, tidal stream and wave) and also gives consideration to other environmental topics (e.g. marine mammals, benthic, underwater noise and historic seascape) and therefore is also useful guidance for other development types. There are now a large number of operational wind farms in UK and north European waters the earliest of which have been in place for approximately 15 years. This means there is an extensive body of monitoring evidence from which to inform understanding of potential impacts. Much of the earlier monitoring information has been disseminated through the Collaborative Offshore Wind Research into the Environment (COWRIE) initiative with COWRIE (2007 and 2010). These reports provide a synthesis of findings from monitoring suspended sediments, seabed morphology and scour at operational UK wind farms. The Royal Belgian Institute of Natural Sciences provide similar information from built wind farms in the Belgium sector of the southern North Sea (Degraer et al .2013) with discussions on morphodynamic monitoring of dredged foundation pit recovery and turbidity effects during wind farm construction phases. The most recent offshore wind farm monitoring synthesis provided by the Marine Management Organisation (MMO, 2014) presents lessons learned from the monitoring of scour, Suspended Sediment Concentrations (SSCs), current/ wake and coastal topography. A series of recommendations and lessons learned are presented with respect to the applicability of the various monitoring techniques which are also of relevance to other offshore renewable developments. The discussion on suitable coastal monitoring strategies (contained in section 5.1 of MMO (2014)) and the requirement (or otherwise) for long term monitoring potentially throughout the project lifetime, rather than in the first few months/ years following construction are particularly relevant. 3.5.5. Marine renewables (tidal range, stream and wave) There is presently a large range in types of wave energy converters and tidal stream energy converters, and it remains probable that more than one type will emerge as market leader. Wave and tidal stream devices are still predominantly in the demonstration phase. This means that very limited monitoring information is available to inform understanding of potential impacts, especially at the array scale. However, several publications are available which provide good information with regards to (i)

Page 29 www.naturalresourceswales.gov.uk
data requirements for baseline characterisation and monitoring; and (ii) potential impacts. These are summarised below. The aforementioned publication by Judd (2011) provides guidance on the design, review and implementation of environmental data collection and analytical activities for offshore marine renewable projects (including wave and tidal energy technologies). The report also provides advice on where more detailed guidance can be found. CIRIA (2008) is similarly useful although the remit is restricted to metocean information and not specially focused on EIA studies. The Carbon Trust (2015) provides specific guidance with respect to best practice measurement of turbulent flows associated with tidal stream devices. This is primarily for developers and engineers, rather than EIA practitioners. However, the guidance does aid further understanding of potential zones of influence (e.g. turbulent wake fields) associated with the operation of tidal energy devices. SNH (2011) provides a very helpful summary of the main wave and tidal energy devices presently under consideration and sets out the ways in which these may directly impact the seabed and influence the surrounding physical environment. Although the focus is on ecological receptors (including cetaceans, seals, birds) a lot of the information contained within the volume devoted to monitoring of benthic habitats is of relevance to marine and coastal physical process investigations. This is because some of the surveys used to inform these two topics are the same (e.g. grab sampling, acoustic mapping) and therefore the survey strengths and weaknesses (which are identified by SNH for the benthic topic) are also applicable to marine and coastal physical processes studies. There are now several peer reviewed journal papers which consider potential array scale impacts arising from marine renewable energy devices, Of particular note is the publication by Roche et al. (2016) which reviews present knowledge of potential impacts associated with emerging renewable energy technologies, including physical, ecological and societal dimensions. The study outlines research priorities to provide a scientific basis on which to base decisions influencing the trajectory of Welsh marine renewable energy development. Also of relevance is the work by Dominicis et al. (2017), which involved numerical modelling of the potential hydrodynamic impacts of a theoretical array of tidal stream turbines within the Pentland Firth (UK). This study considers (amongst other things) the potential for changes in vertical mixing and therefore water column stratification, as well as the possibility of cumulative interaction between separate arrays of tidal stream turbines. 3.5.6. Subsea Cables Generic information requirements for the assessment of cable installation works for marine offshore renewable projects are provided in Judd (2011) and BERR (2008). The focus of both reports is on offshore areas rather than on considerations at the landfall. BERR (2008) provides an excellent review of cabling techniques and associated environmental effects and provides concise discussion regarding (for instance) the levels of disturbance associated with various cable trenching tools. The report also includes discussion of monitoring evidence of SSC during cable installation as well as identifying key areas of uncertainty (such as the quantification

Page 30 www.naturalresourceswales.gov.uk
of material arising from various differing burial operations). The focus of this report is on the offshore wind farm industry, however the guidance is relevant to all sub-sea cable projects. The Offshore Wind Farm Programme Board (OWPB) provides an overview of good practice for geophysical and geotechnical marine surveys for offshore wind transmission cables in the UK (OWPB, 2015). This document is not specifically focused on EIA considerations but does contain relevant information with regards to appropriate methods for surveying the landfall as well as highlighting some commonly encountered issues. Although written for the offshore wind industry, it also provides information for survey planning at landfalls for other types of cables. The extensive use of cable protection measures (especially rock protection designs) is of increasing interest to nature conservation bodies. This is due to the potential for impacts to physical and biological processes particularly within areas designated for Annex I sandbank habitats, as well as to habitats within the nearshore and inter-tidal areas where cables make landfall. The potential impacts associated with rock protection have recently been the subject of an investigation by JNCC (Pidduck et al. 2017). This report provides discussion on potential impact pathways (e.g. tidal flow, sediment supply disturbance and scour etc.) and presents some field evidence from post construction seabed surveys. However, the report highlights the lack of a robust evidence base covering a range of environmental settings and design types and recommends further work to address this knowledge gap.

Page 31
Table 2 Summary of key documents to inform marine and coastal physical processes assessments
Report Report title Organisation
Po
rts a
nd
ha
rbo
urs
Ag
gre
gate
extr
acti
on
Po
wer
sta
tio
ns
Off
sh
ore
Win
d
Tid
al ra
ng
e
Tid
al
str
eam
Wave
Cab
les
Comments
EIA Guidance
IEMA (2004) Guidelines for Environmental Impact Assessment
Institute of Environmental Management and Assessment (IEMA)
Best practice guide to the whole EIA process. Sets out the fundamentals of practice and goes through each step of the EIA process providing both an indication of what is expected to achieve regulatory compliance and what the aims are behind such compliance.
IEMA (2015) Climate change resilience and adaptation
IEMA This guide provides a framework for the effective consideration of climate change resilience and adaptation in the EIA process, in line with the 2014 European Union (EU) Directive (implemented May 2017)
SNH (2013) A handbook on environmental impact assessment Guidance for Competent Authorities, Consultees and others involved in the Environmental Impact Assessment Process in Scotland
SNH Provides an overview of the EIA process in Scotland. This includes the coastal process elements that need to be considered as part of the application process.
Marine Scotland (2012)
Marine Scotland Licensing and Consents Manual Covering Marine Renewables and Offshore Wind Energy Development
Marine Scotland Provides an overview of the marine consenting process, from the legislative framework through to the coastal processes that need to be considered as part of the application process.
BSI (2015) Environmental Impact Assessment for Offshore Renewable Energy Projects - Guide
BSI Provides an overview of the EIA process only, with limited specific reference to marine and coastal physical processes.
National Policy Guidance
The Planning Inspectorate, (2015a)
Advice Note Seven: Environmental Impact Assessment, screening and scoping.
The Planning Inspectorate
The Planning Inspectorate National infrastructure advice notes are non-statutory and are published to provide advice and information on a range of issues arising throughout the whole life of the application process.
The Planning Inspectorate, (2012)
Advice Note Nine: Using the Rochdale Envelope.
The Planning Inspectorate
The Planning Inspectorate, (2015b)
Advice Note Twelve: Development with significant transboundary impacts consultation.
The Planning Inspectorate
The Planning Inspectorate, (2015c)
Advice note seventeen: Cumulative effects assessment
The Planning Inspectorate
DECC (2012) National Policy Statement for Ports
Department for Energy and Climate
The National Policy Statements (NPSs) are produced by Government and include the Government’s

Page 32
Report Report title Organisation
Po
rts a
nd
ha
rbo
urs
Ag
gre
gate
extr
acti
on
Po
wer
sta
tio
ns
Off
sh
ore
Win
d
Tid
al ra
ng
e
Tid
al
str
eam
Wave
Cab
les
Comments
DECC (2011a) National Policy Statement EN-1 - Overarching National Policy Statement for Energy
Change (DECC), now the Department for Business, Energy and Industrial Strategy (BEIS)
objectives for the development of NSIP in a particular sector and consider (amongst other things) circumstances where it would be particularly important to address the adverse impacts of development. DECC (2011b) National Policy Statement EN-3 -
National Policy Statement for Renewable Energy Infrastructure
DECC (2011c) National Policy Statement EN-4 - National Policy Statement for Gas Supply Infrastructure and Gas and Oil Pipelines
DECC (2011d) National Policy Statement EN-6 - National Policy Statement for Nuclear Power Generation
DCLG (2015) Planning Act 2008: guidance on the pre-application process for major infrastructure projects
Department for Communities and Local Government (DCLG)
Sets out the requirements and procedures for the pre-application process and consultation for major infrastructure projects
Welsh Government (2017b)
Draft Welsh National Marine Plan Welsh Government The WNMP sets out Welsh Government’s policy for the next 20 years for the sustainable development of the Welsh marine planning area for both the inshore and offshore regions. It will set out ambitions for the future use of marine natural resources and how various marine users should interact and consider each other’s activities and future plans.
Generic Data Collection and Data Requirements Guidance
MEDIN (2011) Brief guidance notes for the production of discovery metadata for the Marine Environmental Data and Information Network (MEDIN)
MEDIN Discovery metadata is a list of information that accompanies a data set. MEDIN have produced a Standard for marine metadata and a set of tools to create metadata records that comply with the MEDIN Metadata Standard.
IHO (2008) IHO Standards for Hydrographic Surveys: Special Publication No. 44
IHO Guidance providing a set of standards for the execution of hydrographic surveys for the collection of data which will primarily be used to compile navigational charts but also for the protection of the marine environment.
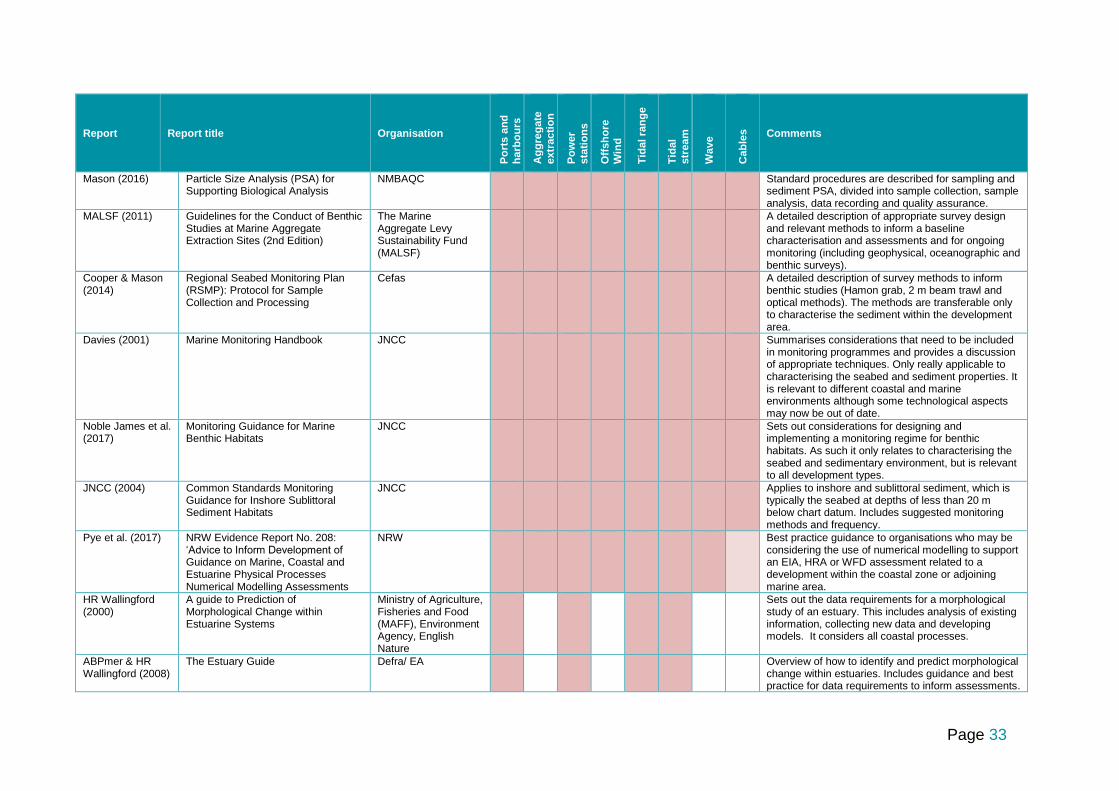
Page 33
Report Report title Organisation
Po
rts a
nd
ha
rbo
urs
Ag
gre
gate
extr
acti
on
Po
wer
sta
tio
ns
Off
sh
ore
Win
d
Tid
al ra
ng
e
Tid
al
str
eam
Wave
Cab
les
Comments
Mason (2016) Particle Size Analysis (PSA) for Supporting Biological Analysis
NMBAQC Standard procedures are described for sampling and sediment PSA, divided into sample collection, sample analysis, data recording and quality assurance.
MALSF (2011) Guidelines for the Conduct of Benthic Studies at Marine Aggregate Extraction Sites (2nd Edition)
The Marine Aggregate Levy Sustainability Fund (MALSF)
A detailed description of appropriate survey design and relevant methods to inform a baseline characterisation and assessments and for ongoing monitoring (including geophysical, oceanographic and benthic surveys).
Cooper & Mason (2014)
Regional Seabed Monitoring Plan (RSMP): Protocol for Sample Collection and Processing
Cefas A detailed description of survey methods to inform benthic studies (Hamon grab, 2 m beam trawl and optical methods). The methods are transferable only to characterise the sediment within the development area.
Davies (2001) Marine Monitoring Handbook JNCC Summarises considerations that need to be included in monitoring programmes and provides a discussion of appropriate techniques. Only really applicable to characterising the seabed and sediment properties. It is relevant to different coastal and marine environments although some technological aspects may now be out of date.
Noble James et al. (2017)
Monitoring Guidance for Marine Benthic Habitats
JNCC Sets out considerations for designing and implementing a monitoring regime for benthic habitats. As such it only relates to characterising the seabed and sedimentary environment, but is relevant to all development types.
JNCC (2004) Common Standards Monitoring Guidance for Inshore Sublittoral Sediment Habitats
JNCC Applies to inshore and sublittoral sediment, which is typically the seabed at depths of less than 20 m below chart datum. Includes suggested monitoring methods and frequency.
Pye et al. (2017) NRW Evidence Report No. 208: ‘Advice to Inform Development of Guidance on Marine, Coastal and Estuarine Physical Processes Numerical Modelling Assessments
NRW Best practice guidance to organisations who may be considering the use of numerical modelling to support an EIA, HRA or WFD assessment related to a development within the coastal zone or adjoining marine area.
HR Wallingford (2000)
A guide to Prediction of Morphological Change within Estuarine Systems
Ministry of Agriculture, Fisheries and Food (MAFF), Environment Agency, English Nature
Sets out the data requirements for a morphological study of an estuary. This includes analysis of existing information, collecting new data and developing models. It considers all coastal processes.
ABPmer & HR Wallingford (2008)
The Estuary Guide Defra/ EA Overview of how to identify and predict morphological change within estuaries. Includes guidance and best practice for data requirements to inform assessments.

Page 34
Report Report title Organisation
Po
rts a
nd
ha
rbo
urs
Ag
gre
gate
extr
acti
on
Po
wer
sta
tio
ns
Off
sh
ore
Win
d
Tid
al ra
ng
e
Tid
al
str
eam
Wave
Cab
les
Comments
Uncles & Mitchell (2017)
Estuarine and Coastal Hydrography and Sediment Transport
- A practical guide to the latest remote and in situ techniques used to measure sediments, quantify seabed characteristics, and understand physical properties of water and sediments and transport mechanisms in estuaries and coastal waters.
Industry Specific Guidance
Cefas (2008) Development of Approaches, Tools and Guidelines for the Assessment of the Environmental Impact of Navigational Dredging in Estuaries and Coastal Waters. Literature Review of Dredging Activities: Impacts, Monitoring and Mitigation
Cefas, Defra Review of dredging practices and recommendations for monitoring of turbidity in relation to dredging activities. It does not cover all coastal processes, but mainly relates to consideration of suspended sediment. Sets out available monitoring method relevant the topic.
Marine Environment Monitoring Group (MEMG) (2003)
Group Co-ordinating Sea Disposal Monitoring. Final Report of the Dredging and Dredged Material Disposal Monitoring Task Team.
Cefas Summarises the coastal process parameters and the relevant survey techniques and methodologies to enable monitoring of the parameters. It however excludes waves.
The Crown Estate (2013)
Marine aggregate dredging and the coastline: a guidance note
The Crown Estate, British Marine Aggregate Producers Association (BMAPA)
Summarises the requirements for coastal impact studies (CIS), as part of an ES. It is therefore transferrable across sectors. It provides an overview of the information required but not the survey methods by which it can be obtained.
Newell & Woodcock (2013)
Aggregate Dredging and the Marine Environment: an overview of recent research and current industry practice
The Crown Estate, BMAPA
Summarises the industry good practice in completing studies in support of EIA. Sets out the data requirements and different survey and sampling techniques available to enable the baseline characterisation and impact assessments for the prospective development areas.
MMO (2014) Review of environmental data associated with post-consent monitoring of licence conditions of offshore wind farms
MMO, Defra Provides recommendations for scour, suspended sediment concentration, current and coastal monitoring. Mostly pertains to infrastructure that interacts with the seabed, therefore only relates to some types of development.
ABPmer & Metoc (2002)
Potential Effects of Offshore Wind Developments on Coastal Processes
Department of Trade and Industry (DTI)
Sets out the information for the baseline characterisation, including the coastal process parameters.
COWRIE (2010) Further review of sediment monitoring data (ScourSed-09).
COWRIE Review of sediment monitoring data from built and currently being constructed offshore wind farms, including recommendations on future sediment monitoring practices and procedures.
COWRIE (2007) Review of Round 1 Sediment process monitoring data - lessons learnt (Sed01).
COWRIE

Page 35
Report Report title Organisation
Po
rts a
nd
ha
rbo
urs
Ag
gre
gate
extr
acti
on
Po
wer
sta
tio
ns
Off
sh
ore
Win
d
Tid
al ra
ng
e
Tid
al
str
eam
Wave
Cab
les
Comments
Lambkin et al. (2009)
Coastal Process Modelling for Offshore Wind Farm Environmental Impact Assessment: Best Practice Guide.
COWRIE Best practice guidance on the application and use of numerical models to predict the potential impact from offshore wind farms on coastal processes. Includes recommendations for data requirements
BERR (2008) Review of Cabling Techniques and Environmental Effects applicable to the Offshore Wind farm Industry.
Department for Business Enterprise and Regulatory Reform (BERR) in association with Defra
Information on the range of cable installation techniques available, their likely environmental effects and potential mitigation, drawing on wind farm and other marine industry practice and experience.
Degraer et al. (2013)
Environmental Impacts of Offshore Wind Farms in the Belgium Part of the North Sea.
Royal Belgian Institute of Natural Sciences (MUMM)
Review of monitoring data from built and constructed offshore wind farms in Belgium waters, including morphodynamic monitoring of the seabed.
Judd (2011) Guidelines for data acquisition to support marine environmental assessments of offshore renewable projects.
Cefas, MMO and Defra
Sets out the information required to undertake the baseline characterisation and impact assessment of coastal processes. It lists data acquisition methods for different coastal processes and the considerations that need to be included in carrying out field surveys. Although it does not include a detailed description of survey methods, data acquisition and processing, it does cross-refer to reports that provide this information.
SNH (2011) Guidance on survey and monitoring in relation to marine renewables deployments in Scotland.
SNH Summarises the different devices that exist for marine renewables and sets out the legislative framework for monitoring. Sets out what should be considered as part of the monitoring programme, including the key questions, survey and sampling methodology, spatial extents. Applies mainly to the assessment of benthic habitats and not all coastal processes.
CIRIA (2008) Guidelines for the use of metocean data through the lifecycle of a marine renewable energy development
CIRIA Developed to identify and recommend on the uses of metocean data through the life cycle of a marine renewable energy development. Relevant to both EIA and engineering applications.
Carbon Trust (2015)
Turbulence: Best Practices for the Tidal Power Industry
Carbon Trust Guidance for the collection of high quality, marine turbulence data.
Pidduck et al. (2017)
Identifying the possible impacts of rock dump from oil and gas decommissioning on Annex I mobile sandbanks
JNCC Initial conclusions regarding the implications of rock dump in the North Norfolk Sandbanks and Saturn Reef cSAC/SCI for impact assessment of plans and/or projects. Relevant to the wider consideration of potential impacts associated with cable protection measures.

Page 36 www.naturalresourceswales.gov.uk
4. Review of EIA Project Information A brief review of available, relevant, EIA project information for the different development types identified in Section 0 has been carried out. This review considered marine and coastal physical processes survey and monitoring requirements, key findings and the identification of any lessons learnt. Where possible, consented projects with available monitoring evidence were selected. Although many of the ‘lessons learnt’ are project specific, some generic findings are apparent. These lessons learnt are primarily derived from the expert judgment of the authors and are summarised below:
• The first stage of any project should be to review historical/ existing data to develop understanding and knowledge of data gaps and to understand whether existing data is sufficient (i.e. representative of present day conditions and of key processes.). A conceptual model should be established at this stage, as set out in Figure 1 and in Pye et al. (2017). New field surveys/ monitoring should be focused on addressing these data gaps and directly linked to the project objectives, rather than simply achieving ‘blanket’ coverage;
• Appropriate consideration should be given to the frequency of any monitoring and the accuracy of equipment used to measure change. The latter is important since the magnitude of expected change may be less than the specified accuracy of the equipment for the period between surveys hence robust conclusions cannot be made and monitoring costs will be substantial for little gain in knowledge;
• For ‘first-of-a-kind’ projects, the data requirements to inform the assessment (baseline characterisation and monitoring data collection) may be greater than might usually be considered sufficient;
• There is value in adopting a Rochdale Envelope approach to the assessment of a development which has the potential to be associated with a very wide range of potential designs (such as wind farms and wave energy and tidal energy devices). This will help the original EIA to remain valid, despite the potential for a significant period of time elapsing between consent, design finalisation and first operation; The application of an Adaptive Environmental Monitoring Plan (AEMP) approach to monitoring (which defines the type and frequency of monitoring surveys) is useful for large projects with long lifespans and which often have no consensus view on the magnitude of potential impacts at EIA stage. The approach relies heavily on up-front data collection, to set the baseline against which future monitoring surveys can be compared. The identification of thresholds/ triggers is an important element in helping to determine when remedial measures may be required. With future surveys, the ongoing requirements are then defined by the results of the monitoring, allowing for focus to be applied where necessary, whilst also providing for a reduced monitoring campaign where no evidence of longer-term effects are being observed e.g. there may be effects arising from a project that are predicted to occur over a medium-longer term timescale that may not be apparent over the short term e.g. large scale morphological changes. Therefore, caution should be exercised when looking to reduce monitoring in the short term;
• The requirement for new survey data shouldn’t simply increase with the scale of the development. Instead, it should be specifically tailored to addressing existing knowledge gaps which could inhibit robust assessment of possible significant effects across the potential zone of influence of the project. The survey and monitoring requirements should also take into consideration the proximity of

Page 37 www.naturalresourceswales.gov.uk
sensitive receptors and the existence of pathway(s) connecting the impact source to the receptor.
5. Potential Impacts 5.1. Overview As previously discussed in Section 3, major developments may either temporarily or permanently alter marine and coastal physical processes, potentially leading to morphological change. These changes may come about directly (such as through the installation of infrastructure upon a designated sandbank) or indirectly as a consequence of a change to a pathway (Figure 2). Impacts may also be exacerbated via projects acting cumulatively (with other developments) or in-combination (with other aspects of the same development). Examples of such changes/ impacts include:
• More spatially extensive and/ or higher concentration sediment plumes arising from multiple coincident dredging operations;
• Greater modification of the baseline wave regime due to the combined influence of built structures and seabed lowering via dredging; and
• Increased morphological alteration to a seabed feature arising from the combined influence of sediment removal via dredging and potential changes to sediment transport pathways arising from the presence of built structures.
The potential for cumulative and in-combination impacts will be project specific and will require assessing on a case by case basis. For most of the major development types listed in Section 0, it is possible to categorise the range of potential changes to marine and coastal physical processes into three broad categories, namely:
• ‘Sediment disturbance’ related changes;
• ‘Blockage’ related changes; and
• ‘Bed level’ related changes. Sediment disturbance related activities are generally most pronounced during the construction and decommissioning phase of the development in response to activities such as dredging, drilling and piling. The main issues requiring consideration are typically associated with:
• Elevations in suspended sediment concentrations; and
• Associated changes in seabed level or sediment type due to resettling of the sediment elsewhere.
Blockage related changes associated with the installed infrastructure are present throughout the operational lifetime of the development but can also be present at an intermediate level during construction and decommissioning. Construction and decommissioning activities can also cause temporary and localised blockage effects.

Page 38 www.naturalresourceswales.gov.uk
The main issues typically requiring consideration are:
• Changes to the current/flow regime;
• Changes to the wave regime;
• Changes to the sediment transport regime; and
• Scour development around infrastructure/ plant. Bed level related changes are those primarily associated with seabed levelling, excavation and associated disposal activities. These may occur during the construction, operation and/or decommissioning phase. A decrease in bed level (e.g. due to dredging) or an increase in bed level (e.g. due to dredge material disposal) may give rise to secondary effects. These include:
• Changes to the current/ flow regime;
• Changes to the wave regime; and
• Changes to the sediment transport regime. The spatial and temporal scale of the potential changes/ impacts may differ greatly. Some (such as scour) will be operational at the structure-scale (metres to tens of metres) and may be restricted to a relatively short period of time at the start of the operational phase of the project (order of weeks to months). Others (such as changes to the wave and tidal regime) may, (depending upon the scale of the development) potentially extend some distance away (hundreds of metres to kilometres) and persist for the duration of the development (order of years to decades). Very large-scale tidal barrage developments such as that previously proposed for the Severn Estuary have the potential to introduce far-field changes to tidal water levels that extend several tens of kilometres outside of the barrage (e.g. Angeloudis and Falconer, 2017). It is important to note that whilst the construction and operation of a major development has the potential to alter marine and coastal physical process pathways, it does not follow that a change to these pathways is always significant, warranting further action (e.g. mitigation and/or monitoring). Usually, it is the sensitivity of the surrounding receptors and the presence of a pathway connecting the source of the impact to these receptors which will determine the relevance of any changes. For instance, a large (circa 20%) reduction in significant wave heights on the downwind boundary of a substantial offshore wind farm development (that recovers with distance) will have limited potential to cause a significant effect if the wind farm array is sited far offshore, away from the coast and potentially sensitive receptors such as sand banks. Conversely, more minor changes to the wave regime associated with a smaller offshore development could be of much greater concern if (for instance) if it were located close inshore, adjacent to an eroding coastline. This concept is relevant when considering appropriate survey and monitoring strategies, which should be tailored to the sensitivities of the receptors (belonging to any topic directly or indirectly influenced by marine and coastal physical processes) scoped into the assessment. These topics potentially include marine and coastal ecology, water quality and flood and coastal erosion risk (Figure 2). The relevance of any changes to marine and coastal physical process pathways also needs to be considered in the context of baseline conditions and naturally occurring

Page 39 www.naturalresourceswales.gov.uk
variability within the system. For instance in highly turbid settings such as the Severn Estuary, suspended sediment plumes associated with sediment disturbance activities are likely to be of less concern than in areas characterised by relatively low turbidity. Again, such factors need to be taken into consideration assessing impacts and determining appropriate survey and monitoring strategies (Section 7). Whilst the above discussion has provided an overview of generic changes typically associated with most major developments, the potential for change to marine and coastal physical processes will be highly site specific and dependent upon the details of the proposed development. The remainder of this section therefore focuses upon some of the key questions which are likely to require addressing for specific developments and development activities. These have been separated out into construction related impacts and operation related impacts. (It is noted here that potential changes/ impacts during decommissioning are rarely of greater magnitude than impacts during construction/ operation.) 5.2. Port and harbour developments Wales has a small number of major ports such as Milford Haven, Port Talbot and Holyhead (which handle circa 35 million, 8 million and 5 million tonnes of freight/year, respectively1), as well as several medium sized ports such as Newport and Swansea (which handle circa 2.8 million and 0.5 million tonnes of freight/year, respectively). Some of these ports have aspirations to expand in the future. For the deep water ports such as Milford Haven and Holyhead, future developments are likely to be focused on quayside works and dock development and will probably have relatively limited need for extensive approach channel deepening/ widening. Conversely, in other areas were water depths may place a restriction upon vessel access, it is likely that future port expansion will also involve more extensive dredging to accommodate deeper draught vessels. The location of the ports also differ, with some ports located in estuarine settings (e.g. Milford Haven) and others in more exposed, open coast environments (e.g. Holyhead). This may present different questions with regards to potential impacts. Key questions often associated with this type of development include:
• Will dredge material disposal alter the sedimentary character of the sea bed at and around the disposal site? (Relevant to construction and operation phase);
• Will the construction of new infrastructure cause a significant increase in suspended sediment concentrations and associated changes in bed levels? (Relevant to construction phase);
• To what extent will suspended sediment concentrations be altered as a consequence of sediment runoff during de-watering activities associated with reclamation works (Relevant to construction and operation phase);
• Could the presence of principal and/or ancillary infrastructure present during construction (e.g. coffer dams, construction plant etc.) give rise to morphological change (either directly such as through plant transport routes or indirectly, through modification of the wave regime)? (Relevant to construction phase);
1 Based on the Department for Transport Port Statistics for 2016 (DfT, 2017)

Page 40 www.naturalresourceswales.gov.uk
• Will sediment disturbed by the dredging and disposal operations disperse and how far will it travel? Will it affect sediment transport and what will be the effects on the wider area? (Relevant to construction and operation phase);
• What are the anticipated maintenance dredging requirements expected to be? (Relevant to operation phase);
• Will the completed structures encourage medium to long-term scour of the adjacent sea bed, and/ or interfere with the transport of sediment, alongshore, on-offshore at the bed and/or suspended in the water column? (Relevant to operation phase);
• How will tidal levels within the estuary be affected in response to dredging activities, construction of jetties/ wharves and (especially) channel deepening and reclamation? (Relevant to operation phase);
• How will flood and ebb tidal current speeds and directions be affected in response to dredging and disposal, as well as locally around the constructional elements of the development, particularly with respect to changing sediment transport pathways? (Relevant to operation phase);
• How will bed shear stresses, sediment erosion / deposition potential and water column properties (e.g. SSC, salinity etc.) be affected (a) within and adjacent to the dredging area/ development) and (b) within and adjacent to the disposal area? (Relevant to operation phase);
• How will the wave climate be affected by changes in bathymetry/ presence of new infrastructure and what will the effect be on adjacent inter-tidal areas and shorelines? (Relevant to operation phase);
• How will the combination of the above changes affect the morphology of the system (including any offshore banks), both in the short and long term? (Relevant to construction and operation phase); and
• How will the ongoing morphological evolution be altered? (This is likely to be a potentially greater effect for an estuarine tidal barrage where the existing bathymetry is a braid of banks and channels.) (Relevant to operational phase).
It is noted here that for very large developments which have different elements present over long time periods during the construction phase (e.g. years), many of the above questions associated with the operational phase will need to be assessed for the construction phase as well. 5.3. Aggregate extraction The Bristol Channel represents an important resource for marine aggregates, with over 1 million tonnes extracted annually (The Crown Estate, 2014). Aggregate dredging also takes place off the north coast of Wales in Liverpool Bay (Hilbre Swash), with the existing licence allowing for the extraction of up to 800,000 tonnes/year. The physical effects of aggregate extraction have been well studied and a large body of monitoring evidence is available to underpin assessments of potential impacts. Notwithstanding this, dredging companies should expect to provide information on the following (as set out in The Crown Estate, 2013):
• The likely production of a sediment plume (from the drag-head at the seabed, from hopper overflow, or on-board screening) and its subsequent transportation within the water column or along the seabed;
• Implications for coastal erosion (through a coastal impact study), including:

Page 41 www.naturalresourceswales.gov.uk
Potential for direct beach draw down due to infilling of the dredge area if aggregate extraction takes place to close to shore;
Will the proposed dredging interrupt the natural supply of materials to nearshore areas through modification of waves, tides and currents?;
What is the likely effect on bars and banks which provide protection to the coast by absorbing wave energy, and the potential impact on local tidal patterns and currents which could lead to erosion?;
What is the likely change to the height of waves passing over dredged areas and the potential effect on the refraction of waves which could lead to significant changes in the wave pattern?;
What is the likely effect on the seabed of removing material? In particular the nature of the sediment to be left once dredging ceases, and the likely nature and scale of the resulting topography (e.g. ridges, furrows and ‘pockmarks’);
What are the implications for local water circulation resulting from the removal or creation of topographical features on the seabed?;
What are the implications of a permanent loss of sediment from the system?; Are the above impacts also affected by other active or proposed dredging
operations in other areas of the seabed? 5.4. Power stations (including nuclear) Wales has a number of operational gas and coal fired power-stations in coastal settings and there are also plans in place for development of a 2700 MW nuclear power station at Wylfa, on the Isle of Anglesey. Various proposals for new biomass power stations have also previously been discussed. Developments are likely to be quite different and present varying impact pathways. For instance, for some large developments it may be necessary to construct either a temporary or permanent Marine Offloading Facility (MOLF) which can involve substantial dredging and the installation of infrastructure across the beach and adjacent shallow sub-tidal areas. Other developments may be able to use existing port facilities or transport building materials and component parts via road/rail instead. Depending on the location and power station design, associated works such as breakwaters and shoreline defences may also be required, as well as cooling water intake and outfall structures. For the most part, the range of issues which require consideration for power stations are the same as for ports and harbour developments (Section 5.2). However, the potential for discharge of large volumes of water at a higher temperature than the receiving environment is unique to power stations and requires particular consideration:
• Will the discharge of warm cooling water from the operational plant have a significant impact on local hydrodynamics and sediment properties of the water column that could affect sediment transport processes? (Relevant to operation phase).
5.5. Offshore wind There are three operational wind farms in Welsh Waters (Rhyl Flats, North Hoyle and Gwynt y Môr). A number of other projects have previously been put forward by developers (Scarweather Sands, Atlantic Array, Rhiannon) although these have not

Page 42 www.naturalresourceswales.gov.uk
been pursued for technical and financial reasons. However, significant reductions in technology costs mean offshore wind is becoming an increasingly more economical renewable resource and therefore it is feasible that previously unviable projects may be revisited. The following questions typically need to be addressed by developers with respect to the wind farm array. (Potential impacts associated with electricity transmission infrastructure are discussed separately, within Section 5.9):
• Will the construction of the offshore and onshore infrastructure have a significant impact on suspended sediment concentrations? (This could be produced from drilling/ pile driving disturbance, preparation for turbine foundations and any sediment disposal that may be required.) (Relevant to construction phase) If drilling is required, it may be necessary to consider this activity separately to
dredging since it has the potential to introduce different sediments of a different characteristic into the local environment
• Could modification/ removal of sandwaves adversely impact adjacent bank systems? (Relevant to construction phase);
• What is the spatial extent of projected changes to the wave regime downwind of the array and could reductions in significant wave height at adjacent coastlines be sufficient to affect morphological processes? (Relevant to operation phase);
• Are there any sandbanks located sufficiently close to the array as to be impacted by changes to waves, hydrodynamics and sediment transport? (Relevant to operation phase);
• Are there water column features such as tidal mixing fronts nearby to the array and could these be impacted via a change to hydrodynamic conditions? (Relevant to operation phase); and
• What is the potential extent of scour around foundations (and therefore how much scour protection may be required?) (Relevant to operation phase).
5.6. Tidal range Wales experiences some of the largest tides in the world with potential for substantial electricity generation. If built, Tidal Lagoon Power’s Swansea Bay Tidal Lagoon project would be the world's first tidal lagoon power plant and the viability of further projects in the Bristol Channel/ Severn Estuary as well as the North Wales coast are also being investigated. Given the typical scale of tidal range developments and their location in coastal/ estuarine settings, they generally have a high potential to modify marine and coastal processes (although as with all developments, the significance of these changes will vary with location.) Because of this, the range of potential impacts may be quite extensive. The range of potential impacts requiring assessment is expected to be very similar to that for port and harbour developments. Key questions to be answered in relation to this type of proposal are:
• Will the construction of the offshore and onshore infrastructure cause a significant increase in suspended sediment concentrations and associated changes in bed levels inside and outside the development? (Relevant to construction phase);

Page 43 www.naturalresourceswales.gov.uk
• How is the distribution of seabed sediments and topography expected to change inside and outside of the development? (Relevant to operational phase);
• What rate of sedimentation can be expected within the impounded area, and what will the maintenance dredging and disposal requirements be? (Relevant to operational phase);
• How will sediment supply to nearby receptors (including the coast and any nearshore banks) as well as the overall sediment budget be altered? (Relevant to construction and operation phase);
• Will there be changes to water levels inside and outside of the tidal range scheme? (Relevant to construction and operation phase);
• Will the phasing and timing of the tidal cycle be affected inside and outside of the tidal range scheme? (Relevant to construction and operation phase);
• What changes are anticipated to occur to the wave climate due to (for example) local sheltering effects from the barrage/ lagoon and wave reflection and what is the potential for associated changes to physical processes of the system/ coastal and estuarine morphology (Relevant to operational phase);
• What will be the magnitude of change to hydrodynamics and sediment transport within the near and far field? (Relevant to operational phase);
• Will the magnitude, timing and pattern of flood and/or ebb current speeds and directions change and if so by how much? (Relevant to operational phase);
• Will the increased tidal current speeds (particularly those close to the turbines) result in significant changes in bed shear stresses and changed patterns of intertidal and subtidal erosion and accretion? (Relevant to operational phase);
• Is the principal infrastructure (e.g. barrage/ lagoon walls etc.) likely to cause any significant adverse effect on the estuary/ embayment and its surroundings including sub-tidal, inter-tidal and supra-tidal habitat features? (Relevant to operational phase);
• Will the normal tidal limit be altered, altering the saline influence and flood risk within the estuary and adjacent rivers? (Relevant to operational phase); and
• How might the presence of the principal infrastructure affect wind-blown sand transport? (Relevant to construction and operational phase).
5.7. Tidal stream Much of the Welsh coastline is characterised by strong tidal currents, and this is especially the case within the waters off Anglesey, Pembrokeshire and in the Bristol Channel (e.g. ABPmer et al. 2008). Anglesey in particular, has huge potential for tidal stream energy with a peak spring velocity of over 3 m/s. These tidal current speeds combined with water depth and seabed topography provide some of the most suitable conditions for the harnessing of tidal stream energy in Europe (Marine Energy Wales, 2016) and preparatory and consent work for the West Anglesey Demonstration Zone is presently being undertaken. The effects that tidal turbines may have on the marine environment can depend on the device design, location, animals and habitat present and scale of development. While the potential environmental impacts of tidal barrages has been more extensively studied in the past, present knowledge of how tidal current turbines interact with the marine environment is relatively limited (Dominicis et al. 2017). EIA investigations associated with the deployment of devices in Ramsey Sound (Pembrokeshire) and off Holyhead are publically available; however these studies

Page 44 www.naturalresourceswales.gov.uk
are largely desk based and associated with a very small number of structures. Accordingly, the findings are of only limited wider applicability. Environments which are conducive to the deployment of tidal stream energy devices will by definition be characterised by fast tidal flows (and therefore highly dispersive) and are very likely to have a scoured bed with little surficial sediment present. Accordingly, the potential for changes associated with sediment disturbance (either during the construction or operational phase) is likely to be very limited (i.e. there will be relatively little sediment to disturb, or any disturbed sediment will be quickly and widely distributed at relatively low concentrations). Effects on the local flow, at the scale of the single device include flow deceleration/acceleration and modification of intensity and spatial variability of turbulence around the devices. Little is known about region-wide impacts of energy extraction by large arrays of tidal stream turbines and it is reasonable to assume that the environmental impact of energy extraction will not necessarily be restricted to the vicinity of the turbine site. Field studies focusing on energy removal effects and changes in flow caused by tidal stream turbines are not possible until commercial sized arrays are deployed and operated for a period of years (Dominicis et al. 2017). Although the range of impacts is expected to be more limited than for other offshore renewable developments, the following questions will still need to be addressed:
• How far downstream from the array/ individual devices could additional turbulence effects occur within the water column? (Relevant to operation phase) (Such considerations are only likely to be relevant to ecological receptors since it is very unlikely that areas characterised by fast flow will contain water column features such as tidal fronts);
• How is the magnitude and direction of current/flow expected to change within and nearby to the individual devices and the array as a whole? (Relevant to operation phase);
• Could the tidal energy devices modify wave characteristics as they propagate through the array/ past individual devices? If yes, do these changes extend to the coast/ boundaries of estuaries to change erosion and accretion patterns? (Relevant to operation phase); and
• Will associated infrastructure such as anchor blocks or any seabed penetrating foundations impact the morphology and features of the seabed? (Relevant to operation phase).
5.8. Wave Pembrokeshire has the highest concentration of wave resource in Wales equating to an indicative capacity of up to 5.6 GW providing a significant opportunity for development (Marine Energy Wales, 2016). It is expected that the future deployment of devices in welsh waters will be concentrated in this area. The potential magnitude of impacts arising from the deployment of wave energy devices is expected to be highly variable between developments, owing to the huge range of device designs presently being considered. These may involve relatively large structures built on the bed through to floating structures held in place via

Page 45 www.naturalresourceswales.gov.uk
anchors. Regardless of precise design, they will all obviously be extracting wave energy and therefore will variously modify the wave regime in the lee of the array. The following questions typically need to be addressed by developers:
• Could construction related activities (e.g. foundation installation / bed preparation works) cause a significant increase in suspended sediment concentrations and associated changes in bed levels? (Relevant to construction phase);
• What will be the spatial extent and magnitude of change to wave characteristics as result of the deployment of the wave energy devices (Relevant to operation phase);
• Could changes to the wave regime extend to the coast and could they influence coastal morphology through modifying rates of erosion, sediment transport (on and offshore) and accretion? (Relevant to operation phase);
• Could seabed morphology and features (especially sandbanks) be altered as a result of a reduction in wave induced bed shear stress (Relevant to operation phase);
• Could the seabed sediment characteristics in the lee of the array alter in response to a more benign wave regime? (Relevant to operation phase);
• Could there be a change in the effects of wave-current interaction which could change the energy distribution at the bed and/or at the coastline? (Relevant to operation phase); and
• Will associated infrastructure such as anchor blocks or any seabed penetrating foundations impact the morphology and features of the seabed? (Relevant to operation phase).
5.9. Subsea cables Many of the major developments described above are likely to be associated with electricity transmission infrastructure, linking the development to the shore. Where surficial sediments are of suitable thickness (typically 1 to 3 m), cable protection is likely to be achieved via burial. The potential for elevated levels of suspended sediment concentrations in the water column and associated changes in bed level as a consequence of cable installation has been extensively studied, both through field monitoring and numerical modelling (e.g. BERR, 2008; James et al. 2017). These studies demonstrate that the observed changes are typically highly localised and of short term duration, with sediment plume modelling undertaken for the purposes of EIA providing highly conservative estimates. In areas where it is impractical to achieve cost effective burial (e.g. where bedrock is exposed at or very close to the surface) or where there is a high risk of exposure or damage, cables may be protected through use of (for example) rock placement or concrete mattresses. Depending upon which cable protection measures are implemented, this has the potential to cause a permanent direct loss of habitat. Cables and associated protection measures located in offshore settings will have limited potential to influence marine and coastal physical processes provided they are buried beneath the surface. However, nearshore environments may be highly dynamic, leading to an increased risk of asset exposure at the seabed and a greater requirement for additional surface laid protection. These protection measures may

Page 46 www.naturalresourceswales.gov.uk
alter hydrodynamics and sediment transport, with potential for associated morphological impacts. The following questions typically need to be addressed by developers with respect to plans for offshore areas and/or the landfall, noting that some sedimentary environments may be more sensitive to these changes than others, and may experience different recovery rates:
• To what extent will sensitive areas of seabed/ substratum (and species) be disturbed during cable installation in offshore (sub-tidal) areas, as well as in intertidal and supratidal areas at the landfall? (Relevant to construction phase);
• To what extent will the near-seabed environmental conditions be changed including SSC and resulting abrasion? (Relevant to construction phase);
• To what extent will seabed areas adjacent to the cable be smothered by the settling of disturbed material released into the water column? (Relevant to construction phase);
• What is the anticipated spatial extent of change to sediment type and how long are these changes expected to persist? (Relevant to construction phase);
• If sandwave clearance is required prior to cable installation, could this activity (as well as any material disposal) influence patterns of sediment transport, resulting in morphological change? (Relevant to construction phase);
• Could the presence of ancillary infrastructure present during construction (e.g. coffer dams) give rise to change in waves and/or current flows, affecting sediment transport and resulting in morphological change? (Relevant to construction phase);
• Could seabed excavation within shallow nearshore areas (e.g. for Horizontal Directional Drill (HDD) exit pits or cable laying vessel floatation pits) modify hydrodynamic conditions, giving rise to morphological change? (Relevant to construction phase);
• Could the presence of cable protection measures in shallow nearshore areas cause morphological change (including to dunes, cliffs, saltmarshes and mudflats) through modification of the nearshore hydrodynamic regime, (through blockage) or via diversion of sediment transport pathways? (Relevant to operation phase);
• Could cable exposure and/or protection measures result in scour (or secondary scour) and therefore removal of seabed sediments? (Relevant to operation phase);
• Could cable protection measures result in interruption of seabed sediment transport and resulting in morphological change? (Relevant to operation phase); and
• How may the coast at the landfall alter throughout the lifetime of the development, both in terms of vertical change in beach profile (relevant for cable burial) and coastal retreat (relevant for the siting of jointing bay infrastructure etc.)? (Relevant to operation phase). (NB a detailed burial assessment should not be necessary at EIA stage although it is reasonable to expect some initial quantitative estimates regarding the potential range of change in inter-tidal elevation and coastal retreat over the lifetime of the development).
5.10. Impacts summary

Page 47 www.naturalresourceswales.gov.uk
This section provides a summary of the potential changes described above, for each of the various identified industries. These potential changes are based on a realistic worst case set of design parameters:
• Ports and Harbours – extensive port development including capital dredge, quayside reconfiguration and reclamation, jetty construction and harbour breakwaters, followed by maintenance dredging during the operational phase. Larger/ higher number of vessels during operational phase (potentially generating temporary suspended sediment plumes);
• Aggregate extraction – extraction of resource over wide area with creation of sediment plumes during dredging process;
• Power stations – extensive shoreside works including large Marine Offloading Facility (MOLF) present throughout all project phases (potentially requiring maintenance dredging), intake/ outfall structures and coastal defences;
• Offshore wind - assumes large array (i.e. Round 2 or Round 3 development) with turbines supported by large (e.g. gravity base) foundations with extensive bed preparation works/ piling/ drilling required during construction;
• Tidal range energy devices – large impounded area (covering many km2) with requirement for maintenance dredging throughout project life cycle which may be greater than 100 years. May require large temporary structures during construction (e.g. caissons and breakwaters);
• Tidal stream - assumes large array (many tens of turbines) fixed on large piles or supported by caisson-like structures within the water column;
• Wave energy devices – supported by large caisson-like structures providing (full water column) blockage to the passage of waves and currents; and
• Cables – either buried into the seabed and/or protected by cable protection measures such as rock dump. Requirement for temporary construction plant/ infrastructure and pits at the landfall.
For each of the identified changes, a qualitative judgement of the scale of potential impact has been made, with change determined as being of ‘high, ‘medium’, ‘low’ or ‘very low’ relative to baseline levels. Definitions for these judgements are provided in Table 3 and are consistent with the guidelines set out in IEMA (2004) and those routinely used by ABPmer in physical processes EIA studies. The judgements take into consideration the following:
• Extent Transboundary National Regional Local Site-specific
• Duration Long (> 5 years) Medium (1 to 5 years) Short (<1 year)
• Frequency High (continuous during construction/ operation and/or decommissioning) Medium (regular occurrence during construction/ operation and/or
decommissioning)

Page 48 www.naturalresourceswales.gov.uk
Low (occasional episodes during construction/ operation and/or decommissioning).
Table 3 Definitions for magnitude of change
Magnitude Definition
High
Change to key environmental characteristics which are well in excess of the natural range of variability. Change occurs throughout associated project development phase (i.e. construction/ operation and/or decommissioning) and likely to occur some distance away from the development area.
Medium
Change to key environmental characteristics which are in excess of the natural range of variability but largely restricted to the development area. Change occurs throughout associated project development phase (i.e. construction/ operation and/or decommissioning).
Low
Change to key environmental characteristics which are similar to but occasionally in excess of the natural range of variability. Change occurs intermittently during associated project development phase (i.e. construction/ operation and/or decommissioning). Change restricted to development area.
Very low Changes which are not discernible from background conditions.
A summary of potential changes associated with major marine developments is set out in Table 4. Importantly, all judgements of impact scale set assume a large (NSIP scale) project and therefore are conservative. It is noted that the potential changes summarised in Table 4 only relate to marine and coastal physical processes pathways, rather than morphological features (which may be considered as receptors). This is because the scale of impact to these features will be project and location specific and it would therefore be inappropriate to summarise within the table. Table 4 Summary of potential changes associated with major marine developments
Dir
ect
ph
ysic
al
dis
turb
an
ce
Ch
an
ges t
o
SS
C a
nd
bed
levels
Ch
an
ges t
o
wate
r le
vels
/
cu
rren
ts
Ch
an
ges t
o
waves
Ch
an
ges t
o
sed
imen
t
tran
sp
ort
Ch
an
ges t
o
tem
pera
ture
/
salin
ity
Sco
ur1
Constr
uction
Ports and harbours
Aggregate extraction N/A N/A N/A N/A N/A N/A N/A
Power stations
Offshore Wind
Tidal range
Tidal stream 2 3 4
Wave 2
Cables 5 6
Opera
ti
on
Ports and harbours
Aggregate extraction 7
Power stations
Offshore Wind 8

Page 49 www.naturalresourceswales.gov.uk
Dir
ect
ph
ysic
al
dis
turb
an
ce
Ch
an
ges t
o
SS
C a
nd
bed
levels
Ch
an
ges t
o
wate
r le
vels
/
cu
rren
ts
Ch
an
ges t
o
waves
Ch
an
ges t
o
sed
imen
t
tran
sp
ort
Ch
an
ges t
o
tem
pera
ture
/
salin
ity
Sco
ur1
Tidal range 9
Tidal stream 10
Wave 11
Cables
Decom
mis
sio
nin
g Ports and harbours
Aggregate extraction N/A N/A N/A N/A N/A N/A N/A
Power stations
Offshore Wind
Tidal range
Tidal stream 2
Wave 2
Cables 5
High
Medium
Low
Very low
1 Expected to primarily occur shortly after installation of structures 2 Development located in highly dispersive environment 3 Currents mainly 4 Structures likely to be situated on erosion resistance, (previously) scoured bed 5 Changes in SSC/ bed levels expected to be limited unless requirement for sandwave clearance operations using mass flow excavation techniques 6 Assumes exposed cable at seabed 7 Potential for limited scour around dredge pockets 8 Unless regional scale development across multiple wind farm zones (e.g. Carpenter et al. 2016; Cazenave et al. 2016). 9 Associated with maintenance dredging and disposal 10 Assumes tidal energy converter supported by monopile foundations 11 Possibility for localised disturbance to bed from anchors
6. Data Requirements for EIA Baseline Characterisation 6.1. Overview Within this section, data requirements for marine and coastal processes baseline characterisation are discussed first, followed by those for monitoring in Section 7. From the outset, it is important to recognise the linkage between the two phases of data collection and the importance of appropriate baseline characterisation. If the baseline provides insufficient coverage, the subsequent monitoring may have limited value. Similarly, the baseline surveys should be repeatable so that meaningful comparison with any subsequent surveys (i.e. during construction/ operation etc.) can be undertaken. Finally, the linkages with numerical modelling requirements should also be recognised, as set out in Section 1.2 and expanded upon in Pye et al. (2017). 6.2. Objectives of data collection As previously stated in Section 2, in order to assess the potential impacts of a proposed major development, a full conceptual understanding of the natural physical

Page 50 www.naturalresourceswales.gov.uk
environment baseline of the site and surrounding area must first be established. A sufficient quantity of accurate field data which adequately describes both contemporary conditions within the study area as well as longer-term historical change is essential to the development of this conceptual understanding. It is broadly the case that regardless of the development type or environmental setting, similar types of data will be required. These data types have previously been set out in Table 1 under the following headings:
• Hydrodynamics;
• Sediments and geology; and
• Topography/ morphology. Importantly, whilst the collection and analysis of individual types of data may help address a specific question about a particular aspect of the system, it is the collective analysis and assessment of the data as a whole which is critical to developing overall system understanding (Figure 1). The key themes of baseline understanding are summarised below and the overall objective of collecting the baseline data should be to ensure these themes are understood. (These themes are similar to those set out in Cefas, 2004 and are relevant to at least some degree for all of the major development types identified). Alongside each issue/ question, some brief comments are provided with regards to the challenges presented by moving from an estuarine setting, to near coastal (<5 km from land) to a more exposed offshore environment. These observations are similar to those previously set out in Lambkin et al. (2009). Identification of the processes maintaining the system, the reasons for any past changes, and sensitivity of the system to changes in the controlling processes.
• Estuarine – Potentially highly dynamic depending on estuary type, with large volumes of material transferred (both in suspension and as bed load) over tidal cycles. Importance of salinity gradients in controlling fine grained sediment erosion, transport and depositional processes, especially flocculation;
• Coastal – More dynamic and complex than offshore areas, may be contained within discrete coastal cells and may be relatively more sensitive to change than offshore areas;
• Offshore – Potentially less dynamic due to deeper water and therefore less frequent exposure of the seabed to wave action, potentially more spatially uniform or homogeneous, evolving on longer time-scales. Larger scale of sources and sinks, gradual transfer of sediment along broader transport pathways. May be less sensitive to change as a result.
Identification and quantification of the relative importance of high-energy, low frequency (“episodic” events), versus low-energy, high frequency processes.
• Estuarine – Both tidal and wave forcing may provide important controls on morphology although wave action generally likely to be of increasing relevance towards the estuary mouth. Potential importance of long term tidal cycles (especially the 18.6 year lunar nodal cycle) in controlling patterns of sedimentation and channel migration (e.g. Townend and Whitehead, 2003);
• Coastal – Tides typically important to some degree in most areas. Generally provide the ‘vehicle’ to allow wave energy to rapidly change the coastal

Page 51 www.naturalresourceswales.gov.uk
morphology over short time-scales, from episodic events. Higher frequency events tend to re-establish the coastline, where sediment supply is available. Waves can be important for sediment transport due to shoaling and the effect on longshore drift at the coast itself;
• Offshore – Most regions around the UK are tidally dominated (Kenyon and Cooper, 2005); however, some relatively shallow offshore parts of the North Sea are tidally benign and are rather storm dominated.
Identification of the processes controlling temporal and spatial morphological change (e.g. longevity and stability of bedforms; cliff recession; loss of beach volume; or bank and channel migration; inter-tidal accretion/ erosion), which may require a review of bathymetric and topographic data.
• Estuarine – Detailed historical charts are likely to be available, especially where estuaries have a history of industrial use (involving shipping). (The majority of surveys, however, will only cover navigable areas and may be composite over time. Frequency and density of data over inter-tidal areas is often lacking.) Banks (mud and/or sand) potentially highly dynamic depending on estuary type;
• Coastal – Detailed historical charts more likely to be available than for offshore areas (especially in dynamic areas close to navigation routes), with reasonable positional accuracy. Bedforms are likely to be smaller and more dynamic than offshore;
• Offshore – Detailed bathymetry or charts may not be available for areas further offshore, particularly in deeper water which is greater than navigable depths. Previous reports may only provide information at the regional level. Bathymetric surveys are almost certainly likely to be required as part of the initial data gathering exercise.
The identification of sediment sources, pathways and sinks, and quantification of transport fluxes.
• Estuarine - Networks of sources, pathways and sinks are potentially highly complex, with inputs of both terrestrial (fluvial) and marine sources of new material and ‘re-working’ of sediment within the estuary over time. Typically mixed sediment regimes (muds and sands) with spatial and temporal variations in their respective importance, with significant variability flood to ebb on spring and neap tides;
• Coastal – Networks of sources, pathways and sinks may be more numerous and complex than offshore areas, likely also on a smaller spatial scale;
• Offshore – Historical direct evidence may be limited due to infrequent or spatially limited surveys. Scale of the development, may be small in comparison to the scale of the sediment transport pathway; there is a larger scale of sources and sinks compared to coastal environments. Sediment transport pathways are likely to remain offshore and not intersect with sensitive coastal receptors.
The identification of the inherited geological, geophysical and geotechnical properties of the sediments at the site, and the depth of any sediment strata.
• Estuarine – Likely to be some data gaps although in many areas it may be possible to make broad inferences regarding depths of underlying sediment strata

Page 52 www.naturalresourceswales.gov.uk
through extrapolation from terrestrial borehole records or previous marine developments;
• Coastal – Generally greater degree of understanding than offshore areas due to greater interest in the coastal zone and more intensive previous study. More data is likely to be available from areas where previous port development has occurred;
• Offshore – Direct historical evidence may be limited due to infrequent or spatially limited surveys. The seabed is more likely to be more stable at deeper offshore sites. Mobile seabed material more likely to be more heterogeneous or in equilibrium with the hydrodynamic conditions in offshore locations due to the longer transport distances and the resulting sorting process.
Interaction of waves and tides and the subsequent quantification of the extent to which seabed sediment is mobilised.
• Estuarine - Waves within an estuary are likely to be strongly modulated by the shape/ type of estuary and the nature of any tidal influences. Significant wave height and period are mainly controlled by time-varying water depth, and wave induced currents may influence residual circulation profile (e.g. Brown et al. 2014). Most waves are likely to be locally generated with less effect from swell. Wave effects likely to be less significant than offshore except at estuary entrance;
• Coastal – Wave action is more likely to extend to the bed, more often, in shallower coastal areas than deeper offshore areas. Sediment mobility may be more likely to be due to wave-current interaction;
• Offshore – Wave action may extend to the seabed less often at deeper water sites, however, waves may also be larger on average, so reducing this tendency. The resulting extent to which sediment is mobilised is the combined result of tidal regime, wave climate and water depth at all locations.
The assessment of the scales and magnitudes of processes controlling sediment transport rates and pathways.
• Estuarine – Sediment transport pathways may be complex and require separate consideration of cohesive and non-cohesive elements. Estuary-wide understanding likely to be required;
• Coastal – Sediment transport pathways are likely to be smaller in scale and more complex than offshore;
• Offshore – Sediment transport pathways are likely to be larger in scale and more homogeneous in local rate and direction. The rate of sediment transport is dependent upon the local forcing in both cases. The effect of sediment sorting is also site specific but should be similarly considered in all cases and can be used to indicate directions of net movement.
As previously noted in Section 1, the typical data requirements for developing robust conceptual understanding will be very similar to that required for numerical modelling analyses of marine and coastal physical processes. This is because numerical modelling (alongside other assessment techniques such as Sediment Budget Analysis (SBA), Historic Trend Analysis (HTA) and Expert Geomorphological Assessment (EGA)) is often used to provide quantitative information supporting the conceptual understanding. It is for this reason that the data collection requirements previously set out in the coastal processes modelling guidance provided by Lambkin

Page 53 www.naturalresourceswales.gov.uk
(2009) and Pye et al. (2017) are directly relevant here. These two documents have been extensively drawn upon to develop the advice provided in this section. 6.3. Hydrodynamics 6.3.1. Water levels and currents Patterns in tidal water level repeat on different timescales, e.g.:
• 12.42 hours: semi-diurnal/diurnal cycle (flood and ebb, high water and low water);
• 13.89 days: spring-neap cycle (spring tides generally higher, neap tides generally lower);
• 6 months: seasonal cycles (greater exaggeration of spring-neap cycle at the equinox, springs and neaps more equal at the solstice); and
• 18.6 years lunar nodal cycle: longer term cycles in the movements of the sun and moon produces inter-annual variability in the spring-neap cycle.
Due to their typically large impact on many marine environmental processes in Welsh waters, tidal behaviour at any site needs to be understood as part of the EIA. In particular, the range and shape of the local tidal curve is important because it controls:
• The strength, asymmetry and direction of tidal currents; and
• The total water depth and therefore the change of water volume in an area (e.g. affecting dilution and dispersion rates, sediment fluxes and flushing characteristics.)
The strength, asymmetry and direction of local tidal currents are important because they control, in part:
• The rate and direction of bedload sediment transport;
• The speed and direction of transport for suspended sediment and other passively transported substances; and
• Patterns of net sediment erosion and deposition, particularly within estuaries. The requirement to understand this behaviour involves the detailed evaluation of water levels and tidal currents both within and adjacent to the development site and how these propagate in the estuarine situation. It is unlikely that measurements of tidal height and tidal currents will exist in the required format and at all of the locations required, especially in offshore locations. It is more likely that discrete measurement data sets may be available in the general area of the development from previous studies or as a result of dedicated data collection in support of the EIA. These data can be used to calibrate and validate tidal models, which can be used in turn to extend the spatial and temporal extent of the available data set, see below. The measured tidal data should be at regular intervals sufficient to resolve the peak values (typically every 10-20 minutes); tidal current data should ideally consist of measurements made throughout the water column, converted to a depth mean value
Page 54 www.naturalresourceswales.gov.uk
unless significant three dimensional effects are considered to be important (e.g. in areas of stratified water such as in the eastern Irish Sea). There is no specific number of locations at which tidal height and current data must be measured, but they must be sufficient to describe the broad flow characteristics of the wider area and also any areas of complexity which are considered important to the study. By necessity, this is site specific to the development and will vary depending on the scale of the likely effects. Spatial variability in current speed and direction is likely to be greater in areas where the seabed is complex, especially where such complexity results in significant changes to the overall water depth. Vertical variability in currents can occur in response to spatially variable seabed roughness, sea surface wind stresses and superimposed wave action as well as freshwater flows into estuaries (in particular). The potential for spatial variability in tidal behaviour is increased with the extent of the development (offshore and at the coast and with dynamism (in an estuary situation), even if the bathymetry is relatively uniform. The useful length of measured data sets depends upon the application for which it is required. For example:
• For harmonic analysis of tidal heights or currents (useful for making predictions of the same at other dates and times), a minimum of two spring-neap cycles are typically required; these data must be of suitable quality (1 hour time-step or better, with minimal effect of wind, waves, storm surges, etc.) otherwise a longer data set might be required;
• For calibration of local models, again typically two spring-neap cycles are required as a minimum, one for calibration and one for validation; and
• For statistical analysis of water levels (e.g. for return period water levels in flood risk assessments), many years of data might be required in order to capture infrequent extreme events.
Owing to their versatility, acoustic doppler devices are perhaps the most widely used for characterising hydrodynamic conditions for specific sites. Despite their versatility, it is important that the instrument settings are tailored to best address the key data gaps which the survey is aiming to fill. For instance, if the main knowledge gap relates to currents, it may be appropriate to limit the sample burst number for waves since currents can’t be measured during this period. 6.3.2. Salinity and temperature Changes in either temperature and/or salinity may potentially be important considerations in marine and coastal physical processes investigations:
• Within estuaries, it has been long understood that the combination and balance of freshwater input from rivers and tidal energy controls, or strongly influences net non-tidal circulation, water column stratification, and sedimentation (Ward and Bub, 2005); and
• The balance between thermal buoyancy, freshwater input and turbulent mixing may also lead to stratification in coastal/ offshore areas. Where stratification

Page 55 www.naturalresourceswales.gov.uk
occurs it may be important in controlling local currents and this is evident within the eastern Irish Sea, off the north Wales coast.
Temperature and salinity vary on seasonal cycles. Because of their importance in controlling primary productivity, variations in both temperature and salinity have now been extensively mapped throughout UK waters, via vessel based measurements, satellite observations and more recently, oceanographic modelling. Indeed, long-term (circa 30 years) temperature and salinity hindcasts are now available from the Met Office North West Shelf Model which provide understanding of variation with depth at an approximate horizontal resolution of 7 km. Although relatively coarse datasets such as this may be of limited applicability within estuarine settings, they represent a potentially valuable resource for informing studies in open coast and offshore. In offshore areas, it is generally the case that the existing available information will be of sufficient temporal and spatial resolution to adequately characterise the temperature and salinity regime with respect to its influence on marine and coastal physical processes. However in some coastal and especially estuarine environments, a very complex picture may emerge, with temperature and salinity variations emerging in response to (amongst other things):
• Tidal cycles (ebb/flood and spring/ neap);
• Large freshwater inputs (e.g. following storms); and
• Water column turbulence (e.g. due to wave activity or water depth/ bed conditions. The relevance (or otherwise) of this variability to individual projects will vary greatly, depending upon the identified impact pathways (Section 5) and therefore it is not possible to specify numbers of measurement locations or a required measurement density for a specific area. However given that seasonal variations are typically the most pronounced signal in the record, observations covering spring, summer, autumn and winter should be separately analysed in those instances where consideration of temperature and salinity is deemed necessary. In estuary situations, measurements of freshwater flow inputs should be made (or extracted from existing gauging stations) for all river inputs of reasonably large magnitude, for the same period of flow, salinity and temperature measurement and over a longer period to establish the character of more episodic events. These flows will influence salinity, temperature and together affect the settling rates and flocculation characteristics of cohesive sediments in particular. 6.3.3. Waves Waves represent a relatively high-energy, low-frequency event (in comparison to frequent periodic tidal action). If the water depth becomes less than the depth to which wave action is felt (the depth of closure), waves are said to be in shallow water. Shallow water potentially causes wave refraction and gradually shoaling water depths can result in wave steepening, wave breaking and energy loss due to friction which may modify the wave field locally. Structures may also reduce the height and affect the period of waves passing around them through wave reflection or diffraction.

Page 56 www.naturalresourceswales.gov.uk
The local wave climate is important because it controls, in part (for the coastal and offshore locations), the:
• Patterns and rates of sediment transport in intermediate and shallow water depths (typically <10 to 15 m depth but potentially deeper during large storms); and
• Longshore drift rates and directions at the coast if the development interacts significantly with the coast.
In estuaries, wave impacts are generally less important (except in large open estuaries, such as the Bristol Channel leading to the Severn Estuary, which would act more like a coastal environment. However, small local waves, in shallow water do cause disturbance of sediment, preventing accretion and causing erosion of mud flats and create cliffed saltmarsh edges. This prevents the mudflat elevation increasing with sea level rise, so increased water depths over time are likely to increase mud flat erosion rates in the future. Detailed long term data sets may be obtained for point locations from real-time and archive data sources such as the Channel Coastal Observatory (CCO), the Wavenet programme and the British Oceanographic Data Centre (BODC) for offshore and coastal locations. (Far fewer wave records exist from estuaries.) The data set should ideally consist of measurements made at regular intervals of around 3 hours or less (in order to capture peak values) and extend over many years (in order to describe inter-annual variability). Unfortunately, this is rarely the situation, especially in offshore locations, and other approaches have to be considered. It is more likely that short-term measurements (order of 1-12 months, at a similar temporal resolution) are available in the general area of the development, either as a result of dedicated data collection in support of the EIA or from existing records. These data can be used to calibrate and validate wave models, which can be used to extend the data set spatially and temporally (see Pye et al., 2017). There is no specific number of locations from which wave data must be provided, but they must be sufficient to describe the broad characteristics of the wider area and also resolve any areas of complexity which are considered important to the study. The period of data collection should also be representative of a broad range of wave conditions, including calm, intermediate and annually significant storm events which are seasonal in nature; therefore, the deployment period is most likely to be during the late autumn/winter/early spring months when storm events are more likely. Offshore wave conditions can be predicted or ‘hindcast’ using historical wind data. The main benefit of regional hindcast models is that they are available over long time-scales and therefore are capable of describing the baseline variability which will not be fully described in short term deployments. The information provided by this data source includes spectral characteristics of wave height, period and direction, which are important for the process of transforming the predicted waves to the local development position. It is noted here that, in addition to its importance in informing understanding of wave conditions, wind data also has a wider importance to marine and coastal physical processes assessments. In particular, accurate description of longer term patterns in

Page 57 www.naturalresourceswales.gov.uk
wind strength and direction is an important component of aeolian sediment transport assessments in beach/ dune settings. 6.4. Sediments and geology The sediment characteristics at each site will include:
• Sediment grain properties (e.g. grain size, shape, particle density, distribution and settling velocity) and bulk geotechnical properties (e.g. cohesivity, strength, erodibility and bulk density);
• Concentrations held in suspension; and
• Transport (flux, direction). 6.4.1. Sediment grain properties and bulk geotechnical properties Sediment grain properties and bulk geotechnical properties are important because they control, in part:
• Patterns and rates of sediment transport, erosion and accretion;
• The magnitude and persistence of suspended sediment concentrations;
• Susceptibility to scour;
• The susceptibility of the seabed to morphological change and the rate of change (e.g. bedform movement offshore, bank and channel configuration in estuaries); and
• Dispersion of disturbed sediment. Nutrients, biota and biofilms on sediment are also of interest since they may affect erodability. This is often difficult to account for within quantitative analyses but may be a relevant consideration in some settings. Seabed sediment data may be derived from geotechnical studies (including grab samples and boreholes – which both require a marine licence) and geophysical survey (including side-scan and sub-bottom profiler). Requirements associated with these surveys are summarised below. It is typically the case that sediment sampling is undertaken in conjunction with/ as part of the benthic ecology surveys with this same information also used to inform marine and coastal physical processes assessments. Although in most instances the survey design for both topics is likely to be broadly similar with regards to (amongst other things) survey extent and sampling frequency, the particle size analysis requirements may differ. Accordingly, if (as is typically the case for large NSIPs) the sediment sampling and analysis is being coordinated by the benthic ecology topic, it is important that the any specific requirements from the marine coastal processes topic (set out below) are communicated prior to the sample analysis being undertaken. For example, to establish sedimentary and erosional effects as well as sediment dispersion in modelling the scheme, properties such as d10, d50, d90 etc. are required as opposed to the mere percentages of clay, silt and sand etc. which may be suitable for some benthic analysis.

Page 58 www.naturalresourceswales.gov.uk
The sediment sampling survey design should be informed by existing seabed survey information and/or any preliminary results from the project specific seabed acoustic surveys. Samples are often collected on a regular grid across the proposed development area although increased sampling frequencies are recommended in areas where known seabed variations occur (e.g. in the vicinity of banks). As a general aim, seabed samples should be collected with a density of at least 1 sample per km2 within the project boundary and in adjacent areas anticipated to be affected by the development. This sampling resolution should increase in areas of known seabed complexity. Increased sampling density would be required in dredge and disposal areas and likely erosion and deposition areas. Importantly, the survey should be proportional to the scale of the development and the anticipated magnitude of effect. For the large developments which are the focus of this report and which cover many km2 of seabed, this may mean that many tens to a few hundred new grab samples may need collecting. Fewer samples may be required if benthic characterisation is also achieved via interpretation of acoustic survey data and/ or if the area of interest has previously been subject to detailed survey. Regarding the latter point, the BGS do hold a large record of seabed grab sample data for Welsh waters and metadata associated with this may be viewed online (www.BGS.ac.uk). However, it should be noted that many of these records are relatively old (pre 1980’s) and depending upon the degree of seabed mobility in the area of interest, may not be representative of the current baseline. Moreover, many of the records are only qualitative or in nature with quantitative information limited to the percentage composition of mud, sand and gravel. This is unlikely to provide the necessary information required to inform more detailed analysis of (for example) potential rates of sediment transport, as discussed above and below. Particle size analysis of any collected samples should be undertaken by laboratories which operate through recognised Quality Control schemes such as the NMBAQC. Indeed, it is important for marine and coastal processes investigations that the full distribution of sediments contained within each sample is described with sufficient precision and this generally means reporting at a minimum of half phi intervals (Pye et al. 2017). This will enable robust statistical analysis using bespoke sediment analysis programmes (such a GRADISTAT) which can provide cumulative frequency percentiles, as well as other sediment properties such as modal distribution and sorting. The ability to determine these associated parameters shouldn’t be overlooked as they may provide important information with regards to the degree to which the seabed is mobile and the process mechanisms in operation. For most (if not all) of the major developments identified in this report, it will be necessary to have some understanding of the sub-seabed conditions. This may be relevant for a number of reasons:
• To inform understanding of any geological controls on future morphological change (e.g. the elevation to which a beach could lower or to which scour may develop around a structure);
• To inform potential seabed mobility of unconsolidated units;
• To understand the nature of sub-surface material that may be disturbed during project construction and released into the water column;

Page 59 www.naturalresourceswales.gov.uk
• To determine dredge methodology, likely rates of sediment input to the water column from drag head disturbance and dredger overflow; and
• To assess whether the sediment is contaminated with heavy metals (e.g. mercury, cadmium and lead) and Poly Chlorinated Biphenyl (PCBs).
The latter may become increasingly important if the characteristics of the underlying sediments differ greatly from those at the seabed (e.g. a coarse sandy bed overlying a diamicton containing a high percentage of fines). The length of the cores should be determined by the potential depth to which the seabed may be impacted by the development. Determining an appropriate sampling frequency is likely to be difficult as the underlying depth to rock head is often poorly understood. However if sub-bottom geophysical data is available, it should be used to guide core locations and allow calibration of the geophysical data. It should be noted here that the collection of cores is considerably more time intensive (and therefore more costly) than the collection of grab samples. Accordingly, the requirement for new survey data needs to be fully justified and in proportion to the scale of any impacts. In some circumstances, it may still be possible to undertake a full and robust impact assessment without the need to collect new cores. For instance, often cores are collected to help characterise the nature of sediments which could be disturbed and subsequently released into the water column during construction. In the absence of new survey data, the assessment could adopt a precautionary approach which considers ‘end member’ scenarios involving 100% release of mud, sand or gravel sized sediments. This will enable worst case scenarios to be determined in terms of maximum sediment plume concentration, extent and persistence, as well as associated changes in bed level. This approach has been successfully adopted to inform aspects of the marine and coastal processes EIA topic for several Round 3 OWF developments (e.g. DONG Energy, 2013a,b; Navitus Bay Development Ltd, (2014). Finally, in addition to the geotechnical surveys outlined above, a variety of geophysical methods can also be used to characterise seabed and sub-seabed sediments. These include: sub-bottom seismic profiling, to ascertain both local and a more regional view of sediment type and thickness; and, side-scan sonar to describe seabed surface sediment distribution and the form and extent of mobile bedforms. However, any seabed interpretation derived from acoustic surveying techniques must always be ground-truthed through a programme of grab sampling or coring, followed by laboratory particle size analysis. 6.4.2. Suspended sediment properties Suspended Sediment Concentrations are important because:
• The marine environment has evolved to be tolerant of naturally occurring levels, which can influence water chemistry, feeding, seabed character and rate of seabed accumulation;
• Naturally occurring levels will fall within a typical range which, if significantly exceeded, may cause change (detrimental or beneficial) to the local environment; and

Page 60 www.naturalresourceswales.gov.uk
• Advection and accumulation of natural and anthropogenic sediment in suspension can result in high concentrations of suspended sediment.
Offshore environments tend to be more consistent and have generally lower concentrations due to the reduced influence of wave action in deeper water and being more remote from coastal sources (e.g. rivers and coastal erosion). Conversely, coastal and especially estuarine settings may be highly turbid with considerable volumes of material advected (i.e. transported with the flow) during each tide. This spatial variation in SSC, as well as the nature of material held in suspension has important implications for the choice of measurement device. This is explored further in Section 8 and Appendix B. Measured data and/ or samples should be collected throughout the full water column over several tidal cycles which are representative of a range of tidal (neap / spring) and wave conditions. The number and locations of measuring points should be determined by the size of the area likely to be affected by the scheme, and by the environmental complexity of the area (Pye et al. 2017). Where possible, the aim should be to have simultaneous records of SSC, water levels, currents and waves to understand the process controls and drivers behind sediment mobilisation events. 6.4.3. Sediment transport Sediment transport is important because it controls, in part:
• The potential extent and magnitude of the effect of the development; and
• The direction of propagation and the likely destination of any effect. Sufficient information is required to characterise the range of sediment transport rates of both bedload and suspended load on semi-diurnal, spring-neap and seasonal/annual time scales. This information is used to inform understanding and modelling of the magnitude and variability of the driving forces behind sediment transport and also to place any predictions made regarding the impact of the development into a local context. Sufficient information is also required to characterise the particle size distribution (proportion of sediment volume in each size grading) and any variation of the grading or mixture with depth. This information is used to inform predictions of the rate, extent or fate of any material re-suspended by construction activities (dredging/bed preparation, drilling, cable laying, etc.) or by the presence of the development (regional and local sediment transport, including scour). If the site potentially interacts with the coast, information is required about the naturally occurring sediment transport along adjacent beaches or coastlines. Information may exist which provides estimates of longshore transport rates (e.g. through historical beach profile change or rates of accumulation of material against fixed structures such as groynes.) 6.5. Topography/ morphology 6.5.1. Seabed bathymetry

Page 61 www.naturalresourceswales.gov.uk
At a large scale (100’s to 1000’s metres) bathymetry describes the shape of the basin (e.g. embayment/ estuary) which largely controls processes of tidal wave propagation and the resulting tidal currents, also large scale wave refraction, shoaling and breaking. At a relatively finer resolution (0.1 to 100’s of metres), bathymetry controls the same processes to a finer degree but also provides information about the dynamic nature of the seabed through sediment bedform size, orientation and asymmetry as well as bank and channel configuration. Bathymetry is important because:
• It controls the way in which tides and waves behave both locally and regionally; and
• It is a physical reflection of other locally occurring sedimentary processes. For large offshore developments, it is common place for MBES (and side-scan) data to be used to characterise the seabed. Where the seabed is characterised by a general lack of mobile bed forms and surficial sediment, pre-existing older (probably single beam) surveys may provide adequate bathymetric information for EIA. (However, in such instances it will need to be demonstrated that they remain representative of current conditions). Conversely in areas where the bed is known to be mobile, new (project-specific) survey information is likely to be required. In shallow estuarine settings, single-beam survey is regularly used. This is due to practical issues of achieving full seabed coverage (i.e. fully overlapping survey tracks) with MBES and the risk of (costly) damage to the MBES equipment. Regardless, of the development location, a survey (either SBES or MBES) covering the full extent of the development / license area as well as the associated zone of direct impact are likely to be necessary for large infrastructure projects. In addition to the standards recommended for bathymetric surveys of this type (see Section 8 and Appendix B), some specific guidelines for MBES and side-scan survey required are provided below:
• When collecting MBES data, an appropriate overlap should be maintained to ensure that 100% coverage is achieved without any data gaps or holes. Appropriate statistical analysis of cross line/ main line intersections should be made to assess the quality of the data;
• The data processing routines of converting the raw sounding data to the final smooth sounding values are critical in producing quality bathymetric data from which biological habitats can be discriminated. Any methods used to derive final depths such as cleaning filters, sounding suppression/data decimation, binning parameters etc. should be done with care and reported in full;
• Where existing bathymetry is being used alongside new bathymetry, a comparison of elevations should be undertaken to determine any systematic offsets. This should be carried out by targeting areas which are not expected to alter in elevation over time (e.g. areas of exposed bedrock);
• The vertical resolution of bathymetric surveys will be improved by undertaking the survey in calmer weather. Relative depth measurements should be converted to an absolute datum using a local reference tide gauge or through highly accurate

Page 62 www.naturalresourceswales.gov.uk
Real Time Kinematic (RTK) / Post Processed Kinematic (PPK) Global Positioning System (GPS) technology;
• A broad scale understanding of the distribution of different seabed types should be obtained prior to survey, e.g. using side scan sonar survey and/or existing mapping data; with the survey then planned in order to characterise (with multiple measurements) each of the distinct seabed types and regions identified;
• Repeat surveys can be compared to assess the mobility of bedforms and features, as well as rates of accretion (e.g. in dredged channels or in lagoons). However, the interval should be long enough to capture displacement or change, but not so long that bed features have moved more than ½ wave length; and
• Where there is a requirement to collect inter-tidal and sub-tidal bathymetric/topographic data, these datasets should be joined so as to avoid data gaps within the lower inter-tidal area.
The detection of habitats is mentioned above in the context of data soundings and processing. Because of these linkages between the physical and biological interpretations it is recommended that ecological factors are given due consideration at the survey planning stage. 6.5.2. Coastal frontage The morphology of the coastal frontage is important because:
• It is a physical reflection of other locally occurring sedimentary processes;
• It may be designated in its own right and/or provide a natural flood defence; and
• It may represent a source, store and/or sink of material, with changes in volume potentially impacting adjacent areas.
A key element of the baseline characterisation process will be to establish both historic and more recent trends in morphological change at the coast, so as to help establish its potential sensitivity to any scheme impacts and to help understand how it may evolve naturally, over the life time of the project. This includes determining natural variability, namely:
• Temporal variability (daily, seasonal, and annual beach change); and
• Spatial variability (alongshore and across shore). In terms of beaches, intra-annual variability is important and may be far greater than longer term inter-annual changes. For this reason, it is important that this range is captured through consideration of both post-winter and post-summer profiles. This may be achieved through either ground survey techniques or via remote sensing (Section 8; Appendix B). Regardless of which technique is used, it is important that surveys are undertaken at (or close to) mean low water springs so as to ensure that the majority of the inter-tidal area is captured. It is not possible to state how many years of baseline data should be used in the assessment of trigger thresholds of change since all settings are largely unique and subject to different rates of change and different forcing factors. The seaward position of dunes and cliff toes may undergo very rapid transformation (retreat) during storm events. In the case of dunes, this may be followed by longer

Page 63 www.naturalresourceswales.gov.uk
periods of progradation. Accordingly, it is important that recent (i.e. last few months) datasets are analysed alongside longer term records (i.e. years) to set any observed change in context. This will typically involve consideration of a range of data, including ground topographic survey, remotely sensed data and historic mapping. Remote sensing techniques (which include terrestrial laser scanning, drones and LiDAR) potentially enable 100% coverage of the coastal frontage. Conversely, whilst potentially more accurate ground based topographic surveys typically provide more limited spatial coverage and/or measurement density. The adequacy or otherwise of this ground based data will be determined by the complexity of the coastal frontage. For instance, on wide linear beaches, profile spacing’s of several hundreds of metres may be appropriate. Conversely, where multiple bars are present, profile spacing of a few tens of metres may be required to capture the complexity. 6.6. Baseline data requirements checklist Data collection requirements need to be determined on a site-specific basis, depending on the hydrodynamics and sediment transport regime at each site and the identified impact pathways (Section 5). However, the following general considerations are relevant to all sites:
• The data should provide appropriate temporal and spatial coverage and resolution;
• The data should be collected and analysed in accordance with recognised standards (See Section 8 and Appendix B for further discussion);
• The type of data collected should be appropriate for EIA and for the objectives of data requirements set out in Section 6.2;
• The data should be accompanied by sufficient metadata (descriptions of the data source, location, date, time, time-step, instrument used, etc.) such that their context and limitations are understood. These requirements are set out in MEDIN (2014) and summarised in Section 3.4;
• Quality Control procedures should be undertaken on any data used (an assessment of the data quality, checking whether the data conform to the expected ranges of values; non-conforming data are flagged or excluded) to reduce uncertainty;
• Data must also be of sufficiently high accuracy that potential inherent error in the field data is small in comparison to the absolute values (e.g. the tidal range) and the natural range of the parameter in question (e.g. spring-neap variability in tidal range); and
• The distance between the location(s) of the measurement(s) and the location(s) of interest should be minimized: the greater the offset distance and the greater the spatial complexity, the less representative the data will be of the key site of interest.
More specific considerations to help determine the suitability of hydrodynamic, sediments/ geology topographic data for informing marine and coastal physical processes investigations is provided in Table 5.

Page 64
Table 5 Checklist to help determine the suitability of data for informing marine, coastal and estuarine physical processes investigations
Parameter Requirement
Hydrodynamics
Water levels and currents
Tidal parameters should be measured over at least 2 spring-neap cycles (approximately 30 days) in order to have sufficient data to characterise the long-term tidal signature at the measurement location.
The data must have sufficient temporal resolution to resolve changes on a suitable time scale. In general, tidal behaviour should be monitored at a time-step of no more than 10 to 20 minutes in order to capture peak values.
A longer tidal data set is useful if the wind or wave climate is severe during the deployment, so that the purely tidal part can be confidently extracted and any surge effects characterised.
In areas where the water column has the potential to become stratified, some understanding of the potential for vertical changes in current profile through the water column is desirable.
Time series of tidal and wave data should ideally be collected coincidentally in time at multiple sites enabling understanding of spatial variation in patterns of waves/ tides as well as potentially identifying erroneous data.
In estuarine settings, measurements should be undertaken to reflect the bank and channel configuration and representative of the main flows. Where bed conditions allow, shorter term measurements on representative tides (over a full flood / ebb cycle, 12.42 hours) may also be necessary across strategic sections using mobile Acoustic Doppler Current Profiler (ADCP) techniques to determine the local detail of the flow structure.
The requirement for measurements will depend on the complexity of the environment under investigation and whether numerical models (informed by the measured data) will also be developed to provide additional data.
Salinity and temperature
Observations should ideally cover annual variation (spring, summer, autumn and winter) and should be separately analysed in locations where vertical stratification or variation in longitudinal structure is anticipated.
Observations should cover spring/neap flood/ebb cycles in locations where stratification is anticipated.
Observations should cover times of high/ low freshwater flow in locations where stratification is anticipated.
Waves Observed data must be at least long enough to provide calibration / validation data for a wave model or hindcast data (at least two distinct storm events (one for calibration, one for validation) as well as other intermediate intensity and calmer periods. At least one of the storm events should ideally be associated with

Page 65
Parameter Requirement
waves of height equal to (or greater than) the 1%ile exceedance level for peak wave heights. (Indicative percentage exceedance statistics enabling the characterisation of ‘extreme’ and ‘average’ conditions can be determined through analysis of available longer term (decadal) wave hindcast information (e.g. www.seastates.net/)).
Wave data should be provided at a time-step of every 3 hours (or less) to resolve the peak of storm events. Wave data in areas strongly influenced by wave-current interaction should ideally be closer to the recommended temporal resolution for tidal data.
If ADCP devices have been used to measure waves, sample durations should be 100 times the wave period required. For example, if one needed to measure waves with a period of up to 10s it is recommended to gather 1000 samples. In this instance, the burst setting should be set to 1024 samples (which corresponds to sampling over a ~17 minute time frame at 1hz). For an ADCP device, typically at least 1024 samples should be collected to analyse the sea state via spectral analysis.
Sediments and geology
Sediment grain properties and bulk geotechnical properties
Maps of seabed sediment type may already be available (typically based on a limited number of historical sediment samples). New acoustic seabed and sub-seabed surveys should ideally be used to update and supplement such regional scale information with greater resolution within the development area and other areas of interest. Both historical and newly created maps of seabed type should be ground truthed using seabed grab samples and cores.
For side-scan sonar data acquisition, the height of the towfish above the seabed should be between 5 and 10% of the horizontal range setting (this usually allows a good level of seabed feature discrimination. The overlap between tracks should be at least 50% and include appropriate cross tracks. Where complete seabed coverage is required for detailed feature or habitat mapping, 200% coverage is recommended.
A sufficient number and suitable distribution of grab sampling locations should be used in order to characterise areas with notably different sediment types. This sampling resolution should increase in areas of known seabed complexity (Pye et al. 2017) and where potential for relevant variation in sediment type occurs.
The collected [sediment] samples should be large enough to be representative (a 1 litre pot, or approximately 1.5 kg as a minimum for predominantly sandy sediments, 0.5 litre pot, or 0.75 kg for predominantly muddy samples, and much larger samples (>5 kg for predominantly gravel sediments) (Pye et al. 2017).

Page 66
Parameter Requirement
Sediment sample distributions should be reported at a minimum of half phi intervals.
PSA should be undertake by laboratories which operate through recognised Quality Control schemes (e.g. the NMBAQC; Mason, 2016) Dry sieving should be performed in accordance with recognised technical requirements and testing e.g. ISO 3310 (2000).
Suspended sediment properties
SSC measurements should be collected throughout the full water column over of a range of representative tidal (flood / ebb, neap / spring), seasonal and wave conditions. Where possible, the aim should be to have simultaneous records of SSC, water levels, currents and waves.
Where SSC is inferred from optical/ acoustic methods, the equipment should be calibrated using locally sourced seabed/ water column samples (collected immediately adjacent to the sensor and over a spring tidal cycle) analysed for both concentration and sediment characteristics. The collection of cohesive sediment samples is especially important in estuarine environments in order to determine particle fall velocities, where flocculation is a major contributing factor.
Sediment transport Where bed load movement predominates, consideration should be given to undertaking sediment tracer studies, sediment trend analysis (e.g. McLaren, 1999) and the installation of sediment traps.
Topography/ morphology
Seabed bathymetry Water depths should be measured to a stated fixed datum, following established surveying practises (e.g. IHO, 2011). Relative depth measurements should be converted to an absolute datum using a local reference tide gauge or suitably accurate RTK/PPK GPS technology. Data sets are available for converting between certain satellite/GPS and tidal reference datums in offshore areas.
Any methods used to derive final depths such as cleaning filters, sounding suppression/data decimation, binning parameters etc. should be done with care and reported in full.
The resolution requirements of bathymetric surveys will vary depending upon the end use. Where observation of individual small-scale bedforms (e.g. ripples and mega-ripple sized) and/or biogenic habitats is required, high resolution MBES surveys will be necessary.
If (on the basis of the developed conceptual understanding) the seabed is understood to be mobile, multiple bathymetry datasets from different time periods should be sought to better inform quantification of (amongst other things) bed form migration rates and trends in erosion/ accretion.
Coastal frontage Information on inter-annual beach variability should be considered including post-winter and post-summer surveys.
Survey data (either from ground based or remote sensing surveys) should provide coverage of the full inter-tidal area (down to approximately MLWS).

Page 67 www.naturalresourceswales.gov.uk
6.7. Good practice for baseline survey design It is highly recommended that prior to the commissioning of any project specific surveys, the developer should seek the advice of the regulator (e.g. NRW, EA, MMO) with regards to the requirements for data and early confirmation of survey design. This approach may well lead to considerable cost savings for the developer as well as having significant benefits for programme. In particular, a large cost element with any survey is associated with mobilisation: if the survey programme is agreed in advance, the number of site visits is likely to be kept to a minimum. The survey design will be unique to each project and in order to inform discussions, it is recommended that the developer ideally presents information on the following so the regulator has the necessary information to determine if the survey design is adequate:
• Understanding of the approximate geographical scale of the development and realistic worst case aspects of the design;
• Anticipated maximum zone of influence of the development. This may be difficult to define precisely and will vary between projects but could reasonably draw on information such as: Spring tidal excursion ellipses to estimate the potential extent of direct changes
to flows as well as the zone of greatest influence for sediment plumes; Numerical modelling and field evidence from analogous developments to
understand the likely overall spatial extent of changes to wave conditions, whilst also taking account of the pattern of prevailing conditions and the likelihood of exposure of distant areas to the potential effect;
Littoral sub-cell boundaries (mapped in Motyka and Brampton, 1993) to determine the potential spatial extent of changes to adjacent coastlines.
• A high level conceptual understanding of the system (based on existing available information) which enables at least some system understanding (e.g. spatial variation in water levels, prevailing wave direction, regional scale sediment transport pathways);
• A source-pathway-receptor map (both for marine and coastal physical processes receptors as well as for other dependent environmental receptors);
• A list of the key relevant questions which require considerations. (This should be agreed during Scoping although they are likely to be similar to those identified within Section 5); and
• A map showing the geographic locations of existing (accessible) data holdings as well as key metrics (e.g. temporal duration of wave record, parameters measured etc.).
The use of existing regional scale information to help develop the survey design is important and may be used to highlight areas requiring detailed consideration (e.g. mobile sand banks and channel systems) as well as gradients in wave/ tidal energy across the study area. The latter is important since it may have a direct bearing on the number of instruments that should be deployed, as well as their location (e.g. to capture areas of greatest tidal range etc.)
Page 68 www.naturalresourceswales.gov.uk
The availability of existing information may sometimes be used as an argument to pare back the scope of the survey requirements. In some circumstances, this may be entirely valid, for instance:
• New bathymetry data may not be required if the seabed has recently (e.g. last 5 years) been mapped using high resolution MBES survey techniques. However, in some highly dynamic estuary situations (e.g. Humber and Dee) sub-annual surveys may be required to understand the on-going morphological change in some areas); and
• New wave data may not be required if historical records are available from other suitably located wave buoys, especially when used in conjunction with an adequately calibrated and validated wave hindcast dataset.
However, it is more typically the case the available records may have some residual uncertainty regarding precision/ accuracy (e.g. due to age and/or equipment type) or the spatial/ temporal coverage is of debatable suitability. Accordingly, if existing records are to be used in place of new survey information their suitability will need to be clearly demonstrated.
As set out in Judd (2011), technical specifications for any new proposed surveys should also be described in detail, namely:
• Spatial and temporal coverage;
• Sampling density;
• Data collection techniques;
• Data standards;
• Analytical techniques;
• Statistical techniques; and
• Quality control.
The survey design should also be accompanied by a series of ‘sufficiency criteria’ to ensure that the agreed aims of the survey are met. This is particularly relevant to the collection of metocean data where information is being gathered over a period of time to ensure a range of baseline conditions are adequately captured. Table 6 provides the metocean survey sufficiency criteria agreed with Regulators to inform EIA studies for the Moorside New Build Nuclear project on the west Cumbria coast (ABPmer, 2015). The survey included the deployment of four Acoustic Wave and Current (AWAC) devices, the collection of Optical Backscatter (OBS) data and the release of drogues, with the data used for:
• Marine and coastal physical processes assessments (which included sediment transport and morphological modelling); and
• Calibration and validation of hydrodynamic and wave models to inform assessments of thermal plume behaviour and enable calculation of extreme wave/ water level return periods for input to the Flood Risk Assessment (FRA).
It is often the case that the metocean survey information will be collected over a period of several months (or even years) and it is therefore recommended that where relevant, the progress of these surveys is reported to the regulator for discussion/ approval. Typically this will be done on a quarterly basis (or following a service visit), with the following key information disseminated:
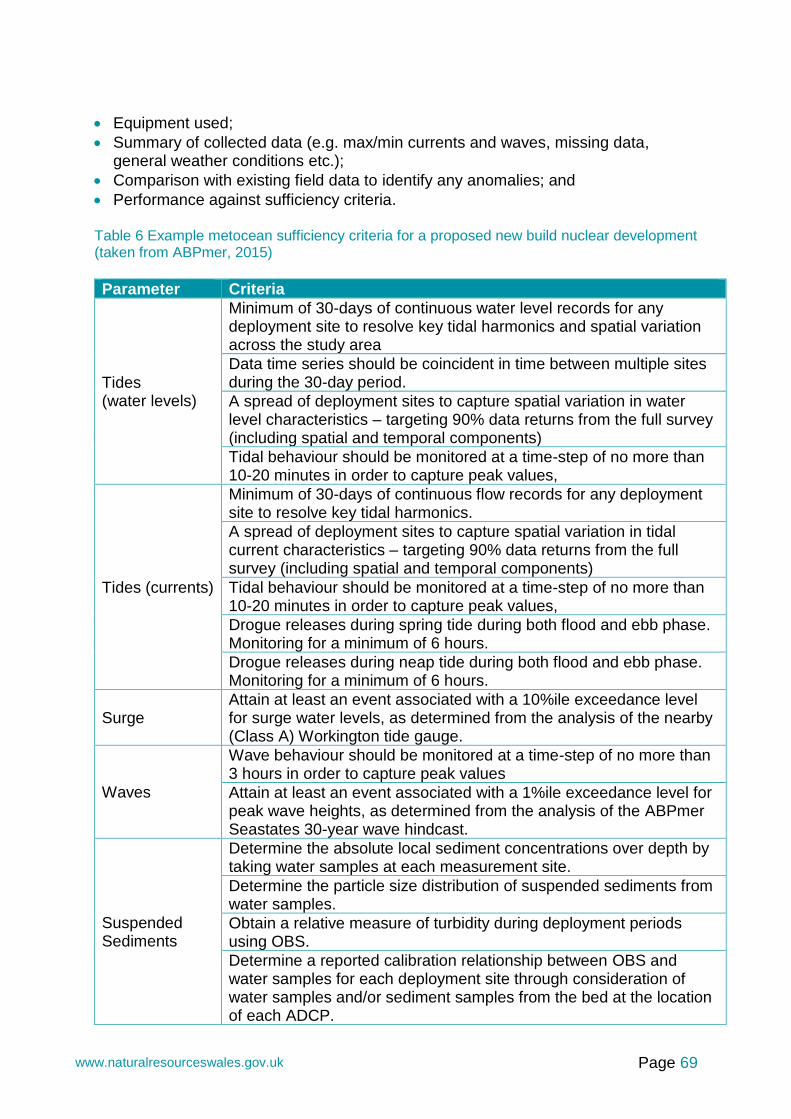
Page 69 www.naturalresourceswales.gov.uk
• Equipment used;
• Summary of collected data (e.g. max/min currents and waves, missing data, general weather conditions etc.);
• Comparison with existing field data to identify any anomalies; and
• Performance against sufficiency criteria. Table 6 Example metocean sufficiency criteria for a proposed new build nuclear development (taken from ABPmer, 2015)
Parameter Criteria
Tides (water levels)
Minimum of 30-days of continuous water level records for any deployment site to resolve key tidal harmonics and spatial variation across the study area
Data time series should be coincident in time between multiple sites during the 30-day period.
A spread of deployment sites to capture spatial variation in water level characteristics – targeting 90% data returns from the full survey (including spatial and temporal components)
Tidal behaviour should be monitored at a time-step of no more than 10-20 minutes in order to capture peak values,
Tides (currents)
Minimum of 30-days of continuous flow records for any deployment site to resolve key tidal harmonics.
A spread of deployment sites to capture spatial variation in tidal current characteristics – targeting 90% data returns from the full survey (including spatial and temporal components)
Tidal behaviour should be monitored at a time-step of no more than 10-20 minutes in order to capture peak values,
Drogue releases during spring tide during both flood and ebb phase. Monitoring for a minimum of 6 hours.
Drogue releases during neap tide during both flood and ebb phase. Monitoring for a minimum of 6 hours.
Surge Attain at least an event associated with a 10%ile exceedance level for surge water levels, as determined from the analysis of the nearby (Class A) Workington tide gauge.
Waves
Wave behaviour should be monitored at a time-step of no more than 3 hours in order to capture peak values
Attain at least an event associated with a 1%ile exceedance level for peak wave heights, as determined from the analysis of the ABPmer Seastates 30-year wave hindcast.
Suspended Sediments
Determine the absolute local sediment concentrations over depth by taking water samples at each measurement site.
Determine the particle size distribution of suspended sediments from water samples.
Obtain a relative measure of turbidity during deployment periods using OBS.
Determine a reported calibration relationship between OBS and water samples for each deployment site through consideration of water samples and/or sediment samples from the bed at the location of each ADCP.

Page 70 www.naturalresourceswales.gov.uk
7. Good Practice for Marine and Coastal Physical Processes Monitoring
7.1. Overview Whereas data collection for baseline characterisation gives consideration to all (relevant) aspects of the marine and coastal physical environment, monitoring is a more focused activity, typically undertaken to help address areas of uncertainty identified during the assessment phase. Given the uncertainty which is often inherent with any predictions of future morphological change, monitoring is sometimes a necessary requirement for large infrastructure projects. In the majority of instances, this monitoring will focus on the receptor itself (e.g. a beach, cliff, shoreline platform, inter-tidal mudflat, sandbanks etc.). However, where uncertainty exists regarding the potential magnitude of change to a pathway (e.g. wave propagation), the focus of the monitoring may also potentially encompass both the pathway and receptor. For instance, at Rhyl Flats Offshore Wind Farm, current and wave monitoring was included as a licence condition to validate predictions made in numerical models used to inform the EIA. It is important that before embarking upon a programme of monitoring, a clear approach is agreed between the Developer and Regulators to ensure that the monitoring strategy is adequate for the needs and that the hypotheses under consideration are testable. For this reason, it is recommended that a monitoring strategy document is set out which addresses the following:
• What are the monitoring objectives/ hypotheses;
• Which parameters should be investigated;
• How should the parameters of interest be measured;
• The time of year/ frequency with which the parameter will be measured;
• The establishment of review periods providing the ability to stop or modify the monitoring exercise if the measurements suggest no change;
• The identification of appropriate thresholds of change; and
• Identification of remedial action. Where possible, survey design should also incorporate monitoring requirements across the different drivers/ Directives (i.e. EIA, HRA and WFD). For instance, sediment grabs may also be of relevance for benthic invertebrate monitoring whilst gathering of aerial imagery may also be of value for intertidal plant surveys. The above survey elements are briefly discussed in the following section. 7.2. Monitoring objectives The fundamental monitoring objective for any of the major developments identified will be to ascertain whether the human activity associated with the installation and/or operation of the project has caused any morphological change beyond natural fluctuations. In order to address this objective, it is advisable to begin with three planning prerequisites, as set out and discussed by SNH (2011):

Page 71 www.naturalresourceswales.gov.uk
• Baseline data (prior to installation); Good pre-impact survey data should be collected (Section 6). The likely
requirement for future monitoring should be given consideration at this stage since this may have a bearing on how the baseline surveys are undertaken and reported.
• Establishing a good understanding of the prevailing conditions of the area; The physical characteristics and operating conditions of the site will likely
dictate the methods and equipment used in any monitoring programme and may rule out particular methods.
• Identification of the project-specific impact concerns; Given unlimited time, logistical resources and funding a highly detailed
assessment of change throughout the area could be undertaken. However, compromises will need to be made in which the priority consideration is the selection of a method, or a suite of methods, that is/are most likely to capture any measurable change to a parameter if it has occurred. The best way to achieve this is to directly target a proportionally greater share of the monitoring effort to the locations that will be expected to receive the major part of the impact and would therefore provide the best chance of detecting that change (SNH, 2011).
It is important to note that in some instances monitoring programmes may be required to be sensitive enough to identify change before adverse effects to a designated feature have occurred. 7.3. Parameters to be investigated As previously stated in Section 7.1, it is generally the case that monitoring associated with marine and coastal physical processes focuses on identifying change to the receptor (typically a morphological feature although may also be a water column feature) rather than the pathway connecting the source and receptor. Exceptions to this may occur when uncertainty exists regarding the magnitude of change to the pathway, perhaps due to a limited existing evidence base or as a consequence of structure complexity which may introduce uncertainty with modelling predictions. The precise monitoring specifications will be unique to each development and will be informed by the outcome of the EIA and sensitivity of nearby receptors. Notwithstanding this, there may be a requirement to consider the following:
• Changes to topography/ morphology Bathymetry (bank and channel configuration) Coastal frontage (including beach / inter-tidal) Cliffs
• Changes to sediments Sediment distribution Sediment transport
• Changes to hydrodynamics Tidal currents Water levels (relevant to tidal range developments) Waves

Page 72 www.naturalresourceswales.gov.uk
A summary of the various potential monitoring activities for marine and coastal physical processes are set out below, in Table 7. Table 7 Potential options available for monitoring surveys for marine and coastal physical processes studies. (Adapted from The Crown Estate, 2013)
Monitoring activity
Data acquisition Frequency Reason Notes and Best Practice
Topography/ morphology
Bathymetry Survey of development area or targeted to individual structures (e.g. foundations). For nearshore developments, transects between the receptor (e.g. beach/ sandbank/ inter-tidal) and the development may be required.
May be biennial, annual, bi-annual or every four years depending on location sensitivity.
To ensure there are no unexpected changes, especially to adjacent receptors such as sand banks.
Survey using swath bathymetry system to ensure total seabed coverage to an appropriate standard. Comparison reports produced. Monitoring frequency could reduce with time depending on results.1
Coastal frontage (including supra-tidal areas)
Overflight of coastal/ estuary corridor using LiDAR.
Typically annual or biannual.
To ensure there are no unexpected changes on the coast/ estuary.
Rapid regional survey option. Comparison reports produced. Monitoring frequency could reduce with time depending on results.1 Use of Rapid Geomorphological Assessment.2
Coastal frontage (including supra-tidal areas where coastal features such as sand dunes are present)
Series of repeated profile transects from back of the beach/ dunes to Mean Low Water Spring (where possible).
Typically biannual/annual.
To ensure there are no unexpected changes in dune/ beach/ inter-tidal morphology.
Reasonable accuracy onshore is typically assumed to be +/- 0.01 to 0.05m. Comparison reports produced. Beach/ inter-tidal profiles should join with offshore transects for maximum value. Monitoring frequency could reduce with time depending on results.1
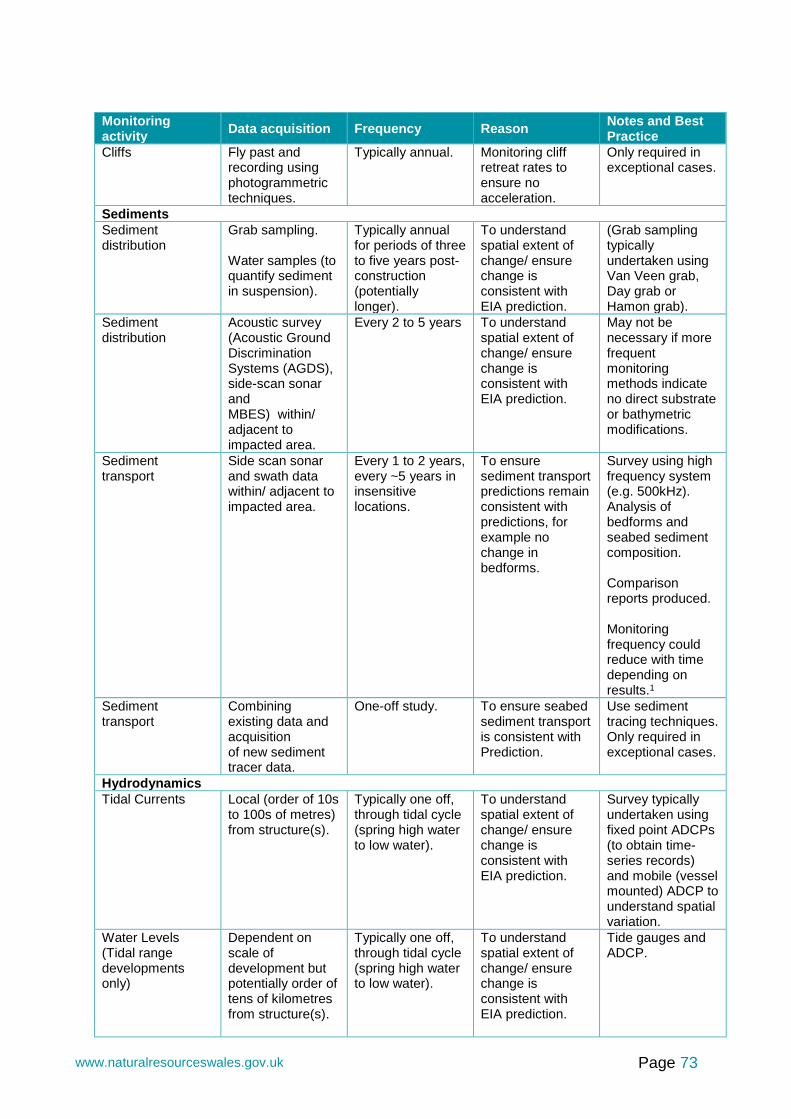
Page 73 www.naturalresourceswales.gov.uk
Monitoring activity
Data acquisition Frequency Reason Notes and Best Practice
Cliffs Fly past and recording using photogrammetric techniques.
Typically annual. Monitoring cliff retreat rates to ensure no acceleration.
Only required in exceptional cases.
Sediments
Sediment distribution
Grab sampling. Water samples (to quantify sediment in suspension).
Typically annual for periods of three to five years post-construction (potentially longer).
To understand spatial extent of change/ ensure change is consistent with EIA prediction.
(Grab sampling typically undertaken using Van Veen grab, Day grab or Hamon grab).
Sediment distribution
Acoustic survey (Acoustic Ground Discrimination Systems (AGDS), side-scan sonar and MBES) within/ adjacent to impacted area.
Every 2 to 5 years To understand spatial extent of change/ ensure change is consistent with EIA prediction.
May not be necessary if more frequent monitoring methods indicate no direct substrate or bathymetric modifications.
Sediment transport
Side scan sonar and swath data within/ adjacent to impacted area.
Every 1 to 2 years, every ~5 years in insensitive locations.
To ensure sediment transport predictions remain consistent with predictions, for example no change in bedforms.
Survey using high frequency system (e.g. 500kHz). Analysis of bedforms and seabed sediment composition. Comparison reports produced. Monitoring frequency could reduce with time depending on results.1
Sediment transport
Combining existing data and acquisition of new sediment tracer data.
One-off study. To ensure seabed sediment transport is consistent with Prediction.
Use sediment tracing techniques. Only required in exceptional cases.
Hydrodynamics
Tidal Currents Local (order of 10s to 100s of metres) from structure(s).
Typically one off, through tidal cycle (spring high water to low water).
To understand spatial extent of change/ ensure change is consistent with EIA prediction.
Survey typically undertaken using fixed point ADCPs (to obtain time-series records) and mobile (vessel mounted) ADCP to understand spatial variation.
Water Levels (Tidal range developments only)
Dependent on scale of development but potentially order of tens of kilometres from structure(s).
Typically one off, through tidal cycle (spring high water to low water).
To understand spatial extent of change/ ensure change is consistent with EIA prediction.
Tide gauges and ADCP.

Page 74 www.naturalresourceswales.gov.uk
Monitoring activity
Data acquisition Frequency Reason Notes and Best Practice
Waves Local to regional (order of 100s of metres to a few kilometres) from structure(s).
Single deployment/ survey campaign to capture range of conditions (high frequency low magnitude and low frequency high magnitude).
To understand spatial extent of change/ ensure change is consistent with EIA prediction.
Survey typically undertaken using X-band radar or acoustic wave and current measurement devices. Depending on the nature of the potential impact and receptor sensitivities, wave rider buoy(s) may be required for larger developments.
1 It should considered that there may be effects arising from a project that are predicted to occur over a medium-longer term timescale that may not be apparent over the short term e.g. large scale morphological changes. Therefore caution should be exercised when looking to reduce monitoring in the short term. 2 Rapid Geomorphological Assessment is a largely field-based method used to characterise the ‘condition’ of geomorphological systems. To date it has been used principally in the context of fluvial systems, notably to quantify the degree of stability / instability of river channels (e.g. Heeren et al., 2012), but potentially it can be applied in any geomorphological context including quantification of the dynamism of stability of frontal dune and beach systems. The method is particularly useful in reconnaissance surveys of areas for which no background information or recent aerial photographs are available, as a method of quantifying the erosion / accretion status, and of monitoring temporal change by serial surveys (NRW, 2014).
7.4. Measurement of parameters The methodology to be used for measurement of the agreed parameters should also be discussed and agreed in advance. Choices regarding instrumentation and usage methodology will depend primarily on the nature of the parameter of interest and the aims of the monitoring, but should also reflect site specific considerations and be reasonable in terms of practicality and cost. The following example considers monitoring of local morphological change. Morphological change as a result of project construction/ operation may occur quickly (e.g. scour around piles) or slowly, over a period of many years (e.g. infilling of a dredged area). In the latter case, absolute changes may be very small relative to the accuracy of the survey equipment and therefore it is very important to ensure that suitably accurate equipment is chosen. This is particularly relevant to the monitoring of seabed levels since the error term when comparing repeat surveys will typically be in the order of decimetres in comparison to centimetres for inter-tidal/ supratidal settings. Detailed information on temporal changes in seabed elevation can best be determined from repeat MBES surveys with net changes in elevation calculated by comparison of successive surveys. Where the highest resolution vertical and horizontal accuracies (sub-decimetre level) are required, increased accuracy may be achieved through the use of RTK or differential GPS systems where possible. The collection and analysis of this bathymetric survey data should follow fully consistent methodologies involving (for instance) the same surveying equipment, the

Page 75 www.naturalresourceswales.gov.uk
same measurement protocols and the same data processing approach (see Appendix B for further details). It may be desirable for MBES survey data to be accompanied by side-scan survey data which will provide acoustic interpretation of seabed texture. This supplementary information may help distinguish the cause of any observed change such as the movement of surficial sediments. 7.5. Timing and frequency of monitoring The timing and frequency of monitoring should also be discussed and agreed in advance. Again, choices will depend primarily on the nature of the parameter of interest and the aims of the monitoring, but should also reflect site specific considerations and be reasonable in terms of practicality and cost. The following example considers monitoring of local morphological change. The frequency with which measurement is required will primarily be influenced by the anticipated rate of change. For beaches, it is typically the case the monitoring is carried out biannually, after winter (approximately April) and after summer (approximately September). Seabed surveys are generally carried out less frequently (see Table 7) although this will depend upon the sensitivity of the feature being considered. If the EIA studies indicate the potential for increased sensitivity to specific events (e.g. storms) it may be necessary to conduct a targeted survey campaign to capture the pre- and post-storm beach/ seabed profile.
7.6. Establishment of review periods For any monitoring campaign, it is necessary to establish review periods to determine whether continued monitoring is necessary. The timing of the review period will vary depending on the nature of change under consideration and the potential driver behind this change. A typical review period for beach monitoring associated with an operational development is approximately 5 years (although this interval will vary depending on the parameter being monitored and the reason for monitoring.) The review period should be discussed and agreed from the outset to ensure the developer isn’t unfairly bound to an indefinite period of (potentially very costly) monitoring which exceeds the need to answer the question that the monitoring was original required to address. 7.7. Identification of appropriate thresholds Finally, it is also necessary to consider appropriate (quantified) threshold levels which if exceeded, constitute the potential for remedial action. These threshold levels will be project specific although are often linked to the upper and lower limits of observed natural variability in the baseline. Alternatively, it may be more appropriate to agree quantified limits of change (e.g. x metres above/below an agreed baseline level). It is noted that the range of natural variability can be relatively wide and it may be difficult in a practical (or contractual) sense to confidently attribute some types of observed change to the potential effects of a single development. Uncertainty in the degree of linkage between a potential cause and actual effect is greater where the

Page 76 www.naturalresourceswales.gov.uk
mechanism is either confidently not anticipated, or poorly defined and understood. Uncertainty increases with the distance between the development and the affected area; also, if there are multiple developments present which could potentially also have contributed to the effect. Changes from a particular baseline condition might be the natural result of atypical periods of weather (e.g. higher storm activity in the winter of 2013/14), possibly influenced in the longer term by global or regional patterns of climate change. 7.8. Identification of remedial action If monitoring thresholds are exceeded and the change can be clearly linked to the development, remedial action is likely to be required. The most appropriate type of remedial action will vary between projects but could (for example) include
• Beach re-charge;
• Construction of new/additional sea defence structures; and
• Re-burial of assets (e.g. in the case of cable exposure at the seabed.)
8. Survey Techniques 8.1. Overview A very wide range of survey techniques and sampling methods are available to collect information which may be used to characterise the baseline physical environment. The most commonly used of these various techniques are set out in Appendix B, which provides:
• A description of the survey techniques including capabilities and limitations;
• Their application and suitability for different marine and coastal environments; and
• Reference to associated standards and best practice guidance regarding. The techniques reviewed are as follows:
• Hydrodynamics d Acoustic Doppler Current Profiler Current meter Wave Buoy X-Band Radar (waves) X-Band Radar (Currents) Satellite (waves - Synthetic Aperture Radar (SAR) and Satellite Altimeter) Conductivity, Temperature and Depth (CTD) casts
• Sediments Grab sampling Side-scan sonar Multibeam Echo-Sounder Acoustic Ground Discrimination Sub-bottom profiler Vibrocore

Page 77 www.naturalresourceswales.gov.uk
Borehole Cone Penetration Testing Optical Backscatter sensor Acoustic Doppler Current Profiler Sediment Transport Bed Samplers
• Topography/ morphology Multi-beam echo sounder Single beam echo sounder Topographic LiDAR Bathymetric LiDAR Drones Laser scan Aerial photography Total station theodolite Kinematic Global Positioning System X-Band Radar (sub-tidal bathymetry X-Band Radar (inter-tidal topography) X-band radar (morphological monitoring) Satellite derived bathymetry
8.2. Hydrodynamics With regards to the collection of hydrodynamic data, the versatility of acoustic doppler devices (which offer the capability of measuring waves currents and water levels) makes them very popular for oceanographic surveys in estuarine coastal and offshore (up to ~100 m) settings. The instruments have the potential to deliver highly accurate measurements of currents throughout almost the full depth profile (with the exception of very close to the bed and surface). They may be mounted on a bed frame and used to gather eulerian current measurements or towed behind a vessel to measure lagrangian flows. The acoustic echo intensity from the devices may also be used to infer suspended sediment concentrations (with appropriate calibration from sediment samples). The simultaneous collection of information on water levels, waves, currents and SSC is extremely valuable since it provides the means to better understand process controls on sediment mobilisation events and subsequent transport. Despite their versatility, they may not always represent the most appropriate instrument for measuring hydrodynamic parameters and may be appropriate to deploy them alongside other instruments. For instance, where there is a requirement to obtain accurate, continuous longer term (i.e. >3 month) records of waves, it may be desirable to deploy a directional waverider. This is because the wave records provided by dedicated wave buoys tend to have fewer data reliability issues. More recently, considerable advances have been made with regards to remote sensing of hydrodynamic parameters. Whilst these techniques may only provide information about the ocean surface, they offer far greater spatial coverage than the point source data provided by acoustic doppler devices, wave riders and current meters. Although marine radar has been used as an oceanographic tool for several decades, recent advances in computing power, data storage, video digitisation and new data processing algorithms has greatly increased the accuracy with which

Page 78 www.naturalresourceswales.gov.uk
currents and waves may be measured (e.g. Bird et al. 2017a). Tools such as X-band radar provide a means by which to monitor how wave fields may alter in the lee of structures (e.g. Cefas, 2005) and may be used to test numerical model predictions of scheme induced changes. Other remote sensing techniques such as SAR and satellite altimeter may also provide valuable hydrodynamic information (such as significant wave height, direction, period and water level elevation) and have also been subject to significant methodological advances over the last decade or so (e.g. Gommenginger, 2016). However, the intermittent nature of sampling as well as the increased ‘noise’ near to land means such satellite derived records tend to be of most value in calibrating and validating regional scale models. 8.3. Sediments 8.3.1. Seabed sampling With regards to sediments, one of the main ways in which the composition of the seabed is established is through recovering sediment samples using a grab. Grabs are lowered to the seabed and a sample is typically obtained by automatically or manually closing the jaws of the grab. A wide range of grabs have been developed with varying capabilities in terms of recovery of different sediment types, penetration depth, volume reproducibility and reliability. In the UK, the most frequently used devices are the van Veen grab, the Day grab and the Hamon grab. It is generally the case that most grab types will obtain suitable samples from sediments ranging from muds to medium sands. However, sampling of coarse sand and mixed gravel may prove more problematic and the success of obtaining a full or complete sample might be reduced (SNH, 2011). Direct sampling of the seabed may be achieved via boreholes and vibrocores or indirectly via cone penetration testing. The collection and analysis of these records may be very expensive (especially for boreholes obtained from offshore locations): however, this information is valuable and necessary for ground truthing of acoustic sub-seabed surveys. A wide range of acoustic seabed and sub-seabed mapping technologies are available. The most commonly used systems are side-scan sonar, MBES bathymetric devices and AGDS. A description of these techniques is provided by Kenny et al. (2003) and key information from this publication is summarised below. Modern high (dual) frequency digital side-scan sonar devices offer high-resolution images of the seabed on which objects on the order of tens of cm may potentially be detected at a range of up to 100 m either side of the tow fish (total swath width 200 m). Once several side-scan swaths have been mosaiced, geological and sedimentological features are recognisable and their interpretation provides a valuable qualitative insight into the dynamics of the seabed. Echo-strength data (reflectance) from MBES systems can also be extracted and presented as seabed backscatter maps that display information on sediment types. From a combination of both shaded-relief bathymetry, slope analysis and backscatter maps, the seabed can be interpreted enabling discrimination between relict and recent processes. AGDS may also provide valuable information on substrate although this requires intensive calibration.

Page 79 www.naturalresourceswales.gov.uk
The use of acoustic sub-bottom profilers (CHIRP and boomer) provide high-resolution definition of sediments down to a depth of >100 m. CHIRP systems enable high-resolution mapping of relatively shallow deposits but generally have less penetration than the impulse-type systems such as boomer. Newer CHIRP systems are able to penetrate to comparable levels as the boomer, but provide greater resolution. CHIRP penetration depths range from about 3 m in coarse sand to about 200 m in finer-grained sediments, depending on the frequency range of the outgoing signal and the system employed (USGS, 2017). 8.3.2. Water column sampling As discussed in Pye et al. (2017), many different types of instrumentation are available for the collection of suspended sediment data, including bottle samplers, optical backscatter sensors, acoustic backscatter sensors, impact sensors, nephelometers and other types of turbidity meters. Of particular interest are the concentration of suspended sediment, the particle size distribution, density and the propensity for flocculation. OBS and Acoustic Backscatter (ABS) derived measurements of SSC are both widely used to inform EIA studies. However, accurate instrument calibration is notoriously difficult and both methods require the collection of numerous local water and sediment samples. 8.3.3. Sediment transport measurement Direct measurements of the rate of sediment transport may be determined from field evidence such as through the use of sediment traps or consideration of bedform migration rates. However, often for EIA it estimated through shear stress exceedance analysis (e.g. Soulsby, 1997) which requires hydrodynamic data inputs of tidal currents and waves as well as sediment characteristics (e.g. median grain size and bed roughness). The Shore Protection Manual (CERC, 1984) and Beach Management Manual (CIRIA, 2010) also provide similarly useful empirical methods for quantifying specific coastal processes such as potential rates of littoral sediment transport and long term changes to beach morphology. 8.4. Topography/ morphology 8.4.1. Beach/ inter-tidal A variety of methods for measuring elevations of the beach and near-shore zones exist. These include traditional ground survey monitoring methods (such as the use of Total Stations) and modern mapping technologies such as laser altimetry (LiDAR), RTK GPS, digital photogrammetry and X-Band radar. Ground surveys traditionally consisted of measurements along shore-normal transects spaced at roughly regular intervals along the beach, using traditional surveying techniques employing theodolites or total stations. Accretion and erosion was then measured by repeating surveys at periodic time intervals. However, the more modern survey techniques such as LiDAR greatly enhance the capabilities to gather 3D georeferenced data at unprecedented spatial and temporal resolutions. The efficiency of these automated technologies enables repeated surveys in relatively short time intervals over large areas and this is often a key requirement for monitoring in areas characterised by highly dynamic topography. Increasingly, drones are being used to collect coastal
Page 80 www.naturalresourceswales.gov.uk
topographic data from such areas. Applications are varied but include erosion monitoring, assessing cliff stability and changes in beach volume. Of particular interest are the recent advances being made with regards to the use of shore-based marine radar for monitoring of erosion and accretion in the dynamic nearshore area. This has been made possible through the development of new data-processing algorithms and enables rapid cost effective surveying across relatively wide areas (Bird et al. 2017b). While the absolute accuracy of this method is currently lower than modern LiDAR, differences in elevation are consistent between surveys and this means that observed changes over time are a good reflection of actual morphological change being observed by the radar. This allows moving sedimentary features to be determined and areas of erosion and accretion detected with high sensitivity. 8.4.2. Bathymetry The most accurate and detailed seabed bathymetric surveys are provided by MBES which offers the potential for high resolution imaging of the seabed. Micro and meso scale bedforms (such as ripples, megaripples and sandwaves) can be imaged in full enabling critical information such as bedform migration rate and direction to be determined. This level of detail is typically not available from surveys undertaken using single beam which only provide partial coverage of the seabed. However, in very shallow water (i.e. a few metres), MBES loses efficiency and survey contractors may be reluctant to use it, owing to the risk of instrument damage. 8.4.3. Remote sensing The suitability of various satellite and airborne remote sensing techniques is increasingly being explored owing to the difficulties and cost of using vessels to survey extensive shallow nearshore areas. Bathymetric LiDAR has been around for several years and has been used relatively extensively in the USA by the National Oceanic and Atmospheric Administration (NOAA). However despite this the technique is still beset with a number of technical difficulties, in particular that associated with water column turbidity which inhibits accurate determination of the seabed. The value of satellite data for the determination of bathymetry has also been explored (e.g. UKHO, 2015). However, its use is currently restricted to shallow (< ~20m water depth) nearshore areas and the vertical accuracy is some way off that of MBES and single beam echo sounders. Availability of satellite data for inter-tidal areas is also likely to be a problem as it relies on the overhead passing of the satellite in good weather at low water.

Page 81 www.naturalresourceswales.gov.uk
References ABPmer 2015. Moorside Oceanographic Survey, Derivation of data success criteria for EIA. A report produced by ABPmer for Amec Foster Wheeler (on behalf of NuGen), November 2015. ABPmer, Met Office and POL 2008. Atlas of UK Marine Renewable Energy Resources: Atlas Pages. A Strategic Environmental Assessment Report, March 2008. Produced for BERR. Report and associated GIS layers available at: http://www.renewables-atlas.info/. ABPmer & HR Wallingford 2008. The Estuary Guide. Environment Agency & Defra. http://www.estuary-guide.net/. Accessed on 12/12/2017. ABPmer & Metoc 2002. Potential effects of offshore wind developments on coastal processes. ETSU W/35/00596/00/REP. Angeloudis, A., Falconer, RA. 2017. Sensitivity of tidal lagoon and barrage hydrodynamic impacts and energy outputs to operational characteristics, Renewable Energy. Vol 114(A) 337 – 351. BERR 2008. Review of Cabling Techniques and Environmental Effects applicable to the Offshore Wind farm Industry.’ Department for Business Enterprise and Regulatory Reform in association with Defra. Bird CO., Sinclair C., Bell, P., Plater A. 2017a. Radar-based Nearshore Hydrographic Monitoring. Hydro International. https://www.hydro-international.com/content/article/radar-based-nearshore-hydrographic-monitoring. Accessed on 15/12/2017. Bird CA., Bell PS., Plater AJ. 2017b. Application of marine radar to monitoring seasonal and event-based changes in intertidal morphology. Geomorphology 285: 1–15. Brew, D., Adnitt, C. 2016. Advice on Assessment and Monitoring of Coastal and Estuarine Habitat Creation Schemes. NRW Report No:162, 86pp, Natural Resources Wales, Cardiff. Brown, J.M., Bolaños, R. & Souza, A.J. 2014. Process contribution to the time-varying residual circulation in tidally dominated estuarine environments. Estuaries and Coasts, 37(5) 1041-1057. https://doi.org/10.1007/s12237-013-9745-6. BSI 2015 Environmental Impact Assessment for Offshore Renewable Energy Projects – Guide. PD 6900:2015. Carbon Trust 2015. Turbulence: Best Practices for the Tidal Power Industry. Funded by the Scottish Government and managed by the Carbon Trust through the Marine Renewables Commercialisation Fund (MRCF) Array.

Page 82 www.naturalresourceswales.gov.uk
Carpenter JR., Merckelbach, L., Callies, U., Clark, S., Gaslikova L., Baschek B. 2016. Potential Impacts of Offshore Wind Farms on North Sea Stratification. PLoS ONE 11(8): e0160830. doi:10.1371/journal.pone.0160830 Cefas 2008. Development of Approaches, Tools and Guidelines for the Assessment of the Environmental Impact of Navigational Dredging in Estuaries and Coastal Waters: Literature Review of Dredging Activities: Impacts, Monitoring and Mitigation. Project ME1101. Cefas 2004. Offshore Wind Farms: Guidance note for Environmental Impact Assessment in respect of FEPA and CPA requirements, Version 2. June 2004. CERC 1984. Shore Protection Manual. Vol. I, CERC Dept. of the Army, U.S. Army Corps of Engineers, Washington. CIRIA 2010. Beach Management Manual (second edition). CIRIA C685. London. CIRIA 2008. Guidelines in the use of metocean data through the lifecycle of a marine renewables development. ABP Marine Environmental Research Ltd, Met Office and SeaRoc UK Ltd for CIRIA. Document C666. Cooper, K. M. & Barry, J. 2017. A big data approach to macrofaunal baseline assessment, monitoring and sustainable exploitation of the seabed. Scientific Reports 7, doi: 10.1038/s41598-017-11377-9. Cooper K & Mason C. 2014. Regional Seabed Monitoring Plan (RSMP): Protocol for Sample Collection and Processing. Version 4.0. COWRIE 2010. COWRIE ScourSed-09: A Further Review of Sediment Monitoring Data. ABP Marine Environmental Research Ltd (ABPmer), the Centre for Environment, Fisheries and Aquaculture Science (CEFAS) and HR Wallingford Ltd. COWRIE 2007, Review of Round 1 sediment process monitoring data – lessons learnt. ABP Marine Environmental Research Ltd (ABPmer), the Centre for Environment, Fisheries and Aquaculture Science (CEFAS) and HR Wallingford Ltd. A report for the Research Advisory Group DECC 2011a. National Policy Statement EN-1 - Overarching National Policy Statement for Energy. DECC 2011b. National Policy Statement EN-3 - National Policy Statement for Renewable Energy Infrastructure. Degraer, S.; Brabant, R.; Rumes, B. 2013. Environmental Impacts of Offshore Wind Farms in the Belgian Part of the North Sea: Learning from the Past to Optimise Future Monitoring Programmes. Report by Royal Belgian Institute of Natural Sciences (RBINS). pp 239.

Page 83 www.naturalresourceswales.gov.uk
Department for Transport (DfT) 2017. Port freight statistics: 2016 final figures (revised). https://www.gov.uk/government/statistics/port-freight-statistics-2016-final-figures. Accessed on 07/02/2018. Dominicis MD., Murray RO., Wolf J. 2017. Multi-scale ocean response to a large tidal stream turbine array. Renewable Energy 114: 1160-1179. DONG Energy 2013a. Burbo Bank Extension Environmental Statement. http://www.burbobankextension.co.uk/en/application-for-consents/environmental-statement. Accessed on 13 March 2017. DONG Energy 2013b. Walney Extension Environmental Statement. https://infrastructure.planninginspectorate.gov.uk/. Accessed on 13 March 2017. EMU Limited 2012. South Coast Marine Aggregate Regional Environmental Assessment, Volume 1 and 2. Report for the South Coast Dredging Association. Environment Agency 2010. Nuclear New Build – Guidance on Hydrodynamic Modelling Requirements. Gommenginger C. 2016. Measuring Ocean Waves from Space. Presentation at the Royal Meteorological Society National Meeting ‘The Importance of Ocean Waves’. 20/04/2016, London. Heeren, D.M., Mittelset, A.R., Fox, G.A., Storm, D.E., Al-Madhachi, A.T., Midgeley, T.L., Stringer, A.F., Stunkel, K.B. & Tejral, R.D. 2012. Using Rapid Geomorphic Assessments to assess streambank stability in Oklahoma Ozark Streams. Transactions of the American Society of Agricultural and Biological Engineers 55, 957-968. HM Government 2011. UK Marine Policy Statement. The Stationery Office Ltd. 47pp. ISBN: 978 0 10 851043 4. Available on http://www.official-documents.gov.uk/. HR Wallingford 2000. A guide to Prediction of Morphological Change within Estuarine Systems. Version 1B. EMPHASYS Consortium. MAFF Project FD1401 Institute of Environmental Management & Assessment (IEMA) 2004. Guidelines for Environmental Impact Assessment. Institute of Environmental Management & Assessment (IEMA) 2015 Climate change resilience and adaptation. International Hydrographic Organization (IHO) 2008. IHO Standards for Hydrographic Surveys, 5th Edition, February 2008. Special Publication No. 44. International Hydrographic Organization (IHO). 2011. Manual on Hydrography. (IHO Publication M-13)

Page 84 www.naturalresourceswales.gov.uk
James, E.; Smith, K.; Gallien, D.; Khan, A. 2017. Observing Cable Laying and Particle Settlement During the Construction of the Block Island Wind Farm. Report by HDR Engineering Inc. pp 225. JNCC, 2004. Common Standards Monitoring Guidance for Inshore Sublittoral Sediment Habitats. Version: August 2004. ISSN 1743-8160 Judd 2011. Guidelines for data acquisition to support marine environmental assessments for offshore renewable energy projects. Cefas contract report: ME5403 – Module 15 Kenyon NH. and Cooper WS. 2005. Sandbanks, sand transport and offshore wind farms. DTI SEA 6 Technical Report. Lambkin, D.O., Harris, J.M., Cooper, W.S., Coates, T.. 2009. Coastal Process Modelling for Offshore Wind Farm Environmental Impact Assessment: Best Practice Guide. COWRIE. Marine Energy Wales, 2016. http://www.marineenergywales.co.uk/. Accessed on 12/12/2017. Mason, 2016. NMBAQC’s Best Practice Guidance: Particle Size Analysis (PSA) for Supporting Biological Analysis Marine Scotland 2012. Marine Scotland Licensing and Consents Manual Covering Marine Renewables and Offshore Wind Energy Development. McLaren, P. 1999. Transport analysis (STA) of Camarthen Bay in support of the Bristol Channel Marine Aggregates Resources and Constraints Research Project. Report to the National Assembly for Wales. MEMG 2003. Group Co-ordinating Sea Disposal Monitoring. Final Report of the Dredging and Dredged Material Disposal Monitoring Task Team. Sci. Ser., Aquat. Environ. Monit. Rep., CEFAS, Lowestoft, (55): 52pp. MEDIN 2014. Brief guidance notes for the production of discovery metadata for the Marine Environmental Data and Information Network (MEDIN). MMO 2014. Review of Post-Consent Offshore Wind Farm Monitoring Data Associated with Licence Conditions. MMO Project No: 1031 Motyka, J.M. & Brampton, A.H. 1993. Coastal management. Mapping of littoral cells. Unpublished report to the Ministry of Agriculture, Fisheries and Food, Report no. SR 328. Natural Resources Wales (NRW) 2014. A Note on the use of Rapid Geomorphological Assessment (RGA) to characterise the geomorphological condition of dune and beach systems. Proposed Tidal Lagoon Swansea Bay (Generating Station), Development Consent Order Written Representation By The Natural Resources Body For Wales (NRW) For Deadline IV Of The Examination.

Page 85 www.naturalresourceswales.gov.uk
Natural Resources Wales (NRW) 2017. Scoping an Environmental Impact Assessment for Marine Developments. Guidance Note GN13. Navitus Bay Development Ltd 2014. Navitus Bay Wind Park Environmental Statement. Volume B – Offshore: Chapter 5 – Physical Processes. Document 6.1.2.5. Newell, R.C. and Woodcock, T.A. (eds.). 2013. Aggregate. Dredging and the Marine Environment: an overview of recent research and current industry practice. The Crown. Estate, 165pp ISBN: 978-1-906410-41-4. Noble-James, T., Jesus, A. & McBreen, F. 2017. Monitoring guidance for marine benthic habitats. JNCC Report No. 598. JNCC, Peterborough. ODPM (Office of the Deputy Prime Minister) 2005. Marine Aggregate Extraction: Approaching Good Practice in Environmental Impact Assessment. OWPB 2015. Overview of geophysical and geotechnical marine surveys for offshore wind transmission cables in the UK. Report by the Offshore Wind Programme Board. Phillips, M. R. 2008. Beach erosion and marine aggregate dredging: a question of evidence? The Geographical Journal, 174 (4): 332-343. Pidduck, E., Jones, R., Daglish, P., Farley, A., Morley, N., Page, A. & Soubies, H. 2017. Identifying the possible impacts of rock dump from oil and gas decommissioning on Annex I mobile sandbanks. JNCC Report No. 603. JNCC, Peterborough. Pye, K., Blott, S., Brown, J. 2017. Advice to Inform Development of Guidance on Marine, Coastal and Estuarine Physical Processes Numerical Modelling Assessments. NRW Report No: 208, 139 pp, Natural Resources Wales, Cardiff. Roche, RC., Walker-Springett, K., Robins, PE., Jones, J., Veneruso, G., Whitton, TA., Piano, M., Ward, SL., Duce, CE., Waggitt, JJ., Walker-Springett, GR., Neill, SP., Lewis, MJ., King, JW. 2016. Research priorities for assessing potential impacts of emerging marine renewable energy technologies: Insights from developments in Wales (UK), Renewable Energy. 99: 1327-1341. SNH 2013. A handbook on environmental impact assessment Guidance for Competent Authorities, Consultees and others involved in the Environmental Impact Assessment Process in Scotland. 4th Edition. SNH 2011. Guidance on survey and monitoring in relation to marine renewables deployments in Scotland. Scottish Natural Heritage. Soulsby, R.L. 1997. Dynamics of marine sands. A manual for Practical Applications. Thomas Telford, London.
Page 86 www.naturalresourceswales.gov.uk
The Crown Estate 2014. Marine Aggregates. http://www.thecrownestate.co.uk/media/389767/ei-marine-aggregates-2014.pdf. Accessed on 15/12/2017. The Crown Estate, 2013 Marine aggregate dredging and the coastline: a guidance note. The Crown. Estate. The Planning Inspectorate, 2012. Advice Note Nine: Using the Rochdale Envelope. Townend, I.H. and Whitehead, P. 2003. A preliminary net sediment budget for the Humber Estuary Science of Total Environment, (314-316), pp. 755-767. UKHO 2015. Satellite Derived Bathymetry. Paper for Consideration by the Chart Standardization & Paper Chart Working Group (CSPCWG). Uncles RJ., Mitchell SB. 2017. Estuarine and Coastal Hydrography and Sediment Transport. Cambridge University Press. ISBN: 9781107040984. USGS, 2017. Seismic Profiling systems. https://woodshole.er.usgs.gov/operations/sfmapping/chirp.htm. Accessed on 15/12/2017. Wall, G.R., Nystrom, E.A., and Litten, S. 2006, Use of an ADCP to compute suspended-sediment discharge in the tidal Hudson River, New York: U.S. Geological Survey Scientific Investigations Report 2006-5055, 16p. Ward LG., Bub FL. 2005. Temporal Variability in Salinity, Temperature and Suspended Sediments in a Gulf of Maine Estuary (Great Bay Estuary, New Hampshire). In: FitzGerald D.M., Knight J. (eds) High Resolution Morphodynamics and Sedimentary Evolution of Estuaries. Coastal Systems and Continental Margins, vol 8. Springer, Dordrecht Ware, S.J., Kenny, A., Curtis, M., Barrio Frojan, C., Cooper, K., Reach, I., Bussell, J., Service, M., Boyd, A., Sotheran, I., Egerton, J., Seiderer, L.J., Pearce, B. 2011. Guidelines for the Conduct of Benthic Studies at Marine Aggregate Extraction Sites (2nd Edition) (Section 6 and Annex A). Welsh Government 2017a. Draft Welsh National Marine Plan. https://consultations.gov.wales/consultations/draft-welsh-national-marine-plan. Accessed on 12/02/2018. Welsh Government, 2017b. Developments of National Significance. http://gov.wales/topics/planning/developcontrol/developments-of-national-significance/?lang=en. Accessed on 23/02/2018.

Page 87 www.naturalresourceswales.gov.uk
Appendices

Page 88 www.naturalresourceswales.gov.uk
Appendix A Industry Specific Guidance
Report Title Development of Approaches, Tools and Guidelines for the Assessment of the Environmental Impact of Navigational Dredging in Estuaries and Coastal Waters. Literature Review of Dredging Activities: Impacts, Monitoring and Mitigation
Report Reference Cefas 2008
Most relevant sections/ pages Section 1 ‘Dredging, dredger types and associated impacts’ Section 5. ‘The impacts and monitoring of maintenance dredging - related to turbidity’ Section 6 ‘Capital dredging impacts’
Synopsis Useful literature review which contains wide ranging discussion of potential impacts associated with dredging activity. Also contains extensive review of existing dredge mitigation measures and their efficacy in addressing these impacts. Whilst much of the review focusses on biological and chemical considerations, Section 5 provides a useful overview of turbidity monitoring techniques, whilst Section 6.2 presents an excellent concise summary of the physical effects of dredging.
Report Title Group Co-ordinating Sea Disposal Monitoring. Final Report of the Dredging and Dredged Material Disposal Monitoring Task Team
Report Reference MEMG 2003
Most relevant sections/ pages Section 2.4 ‘Monitoring – methodological considerations Section 4 ‘Monitoring methodology’ Section 5 ‘Case studies and examples’
Synopsis This report discusses both the near field and far field effects of dredging and disposal on the biological, physical and chemical characteristic of the receiving environment. The methods that may be used for monitoring are outlined (Section 4), as well as the objectives to be met by a monitoring programme. The report provides generic examples to encompass a cross-section of potential operations and a number of case studies of monitoring dredged material disposal operations (Section 5). Each ‘real life’ case study is accompanied by a number of impact hypotheses (such as the degree to which deposited material will be mobilised) and the outcome of the monitoring/testing of these hypotheses. In addition to the above, Section 2.4 on the methodological considerations of dredge monitoring is a useful contribution, setting out the considerations for a monitoring plan (e.g. sequence, practicality, temporal and spatial basis, detection

Page 89 www.naturalresourceswales.gov.uk
of effect etc.). These generic considerations are relevant to all coastal processes monitoring strategies, not just those associated with dredging activities.
Report Title Marine aggregate dredging and the coastline: a guidance note
Report Reference The Crown Estate, 2013
Most relevant sections/ pages (All sections but Section 5 ‘Assessment methods: technical review’ particularly useful for data requirements)
Synopsis Extremely useful publication that provides best practice guidelines on carrying out a Coastal Impact Study as part of an application to dredge marine aggregates from the seabed around the English/ Welsh coasts. The document outlines the terms of reference and essential elements of a Coastal Impact Study ; including the data required to undertake a study, key components and their analysis, consideration of cumulative and in-combination impacts, as well as mitigation and monitoring options. Importantly, although aimed at the aggregate dredging industry, much of the guidance is equally applicable to all major marine developments considered in this NRW report, especially Section 5 ‘Assessment methods: technical review.’
Report Title Aggregate Dredging and the Marine Environment: an overview of recent research and current industry practice
Report Reference Newell & Woodcock, 2013
Most relevant sections/ pages Section 2; pp 28: ‘Seabed grabs’ Section 5: ‘Impacts on the physical environment’
Synopsis Helpful summary publication discussing (amongst other things) existing aggregate industry practice for assessing potential environmental impacts. Section 5 ‘Impacts on the physical environment is of particular relevance, especially the overview of methods used for baseline characterisation and data collection. Also contains a good overview of potential dredging impacts, both direct (e.g. changes in bathymetry and sediment character) and indirect (e.g. changes in waves, tides and sediment transport).

Page 90 www.naturalresourceswales.gov.uk
Report Title Review of environmental data associated with post-consent monitoring of licence conditions of offshore wind farms
Report Reference MMO, 2014
Most relevant sections/ pages Section 5.1 ‘Synthesis of post consent monitoring on consented UK OWFs – Physical processes’ Section 11.1 ‘ Recommendations on Realistic Post-consent Monitoring Aims and Objectives – Physical processes Section 12.3 ‘ Recommendations on Guiding Principles Associated with the Spatial and Temporal Scale of Monitoring – Physical processes’
Synopsis This report examines outcomes and conclusions from monitoring regimes undertaken as a result of statutory requirements imposed on developers of OWFs in UK waters through consent conditions. The report gives specific consideration to physical processes monitoring, with a focus on scour, SSC, current/wave effects and monitoring of coastal morphology. A review is provided of the extent to which data collected through the post-consent monitoring has enhanced the evidence base on direct and indirect impacts of OWFs both at the site, and generic level. Finally, the report provides useful recommendations on guidance realistic post consent monitoring associated with the aforementioned parameters (e.g. frequency of post construction surveys for scour etc.). Given that several of the construction/ operation activities for OWF are analogous to other offshore developments, this section has wider applicability for other marine industry sectors.
Report Title Potential Effects of Offshore Wind Developments on Coastal Processes
Report Reference ABPmer & Metoc, 2002
Most relevant sections/ pages Section 4 ‘Guidelines for site specific studies’
Synopsis This report identifies, reviews and assesses the potential effects on coastal processes related to the development of offshore wind farms. Of particular relevance is the discussion of appropriate baseline characterisation to enable robust assessment of potential effects (Section 4).Key data requirements for each coastal process parameter are set out in this section, including information on measurement frequency and duration. It is noted here that whilst this report remains of wider value in informing OWF assessments, it pre-dates the (much larger) Round 2 and Round 3 projects. Accordingly, the scales of impact referred to in the publication may be on a much smaller scale to that potentially associated with the more recent OWFs (both built and proposed).

Page 91 www.naturalresourceswales.gov.uk
Report Title Further review of sediment monitoring data (ScourSed-09).
Report Reference COWRIE, 2010
Most relevant sections/ pages (All sections but Section 7 ‘Recommendations’ particularly useful)
Synopsis This report builds on the results of COWRIE (2007) and provides a review of available physical processes monitoring data, any lessons learnt and offers recommendations for future sediment monitoring. The review focuses on three technical categories, namely suspended sediments, seabed morphology and scour. The focus here is on monitoring data available from within built arrays and not from coastal settings adjacent to some operational OWFs (where beach profiles have been monitored as a consent requirement). The monitoring evidence presented in Sections 3 to 5, is extremely useful for supporting predictions of seabed change at other development sites. However, perhaps of most relevance is Section 7 ‘Recommendations’: this gives useful advice for refining monitoring strategies (e.g. that associated with bathymetric survey timing, consistency and extent) to enable robust determination of change between pre- and post-construction surveys
Report Title Review of Round 1 Sediment process monitoring data - lessons learnt (Sed01).
Report Reference COWRIE, 2007
Most relevant sections/ pages Section 3 ‘Lessons learnt’ Section 4 ‘Recommendations’
Synopsis The aim of SED01 is to draw together the sediment process monitoring work carried out on Round 1 developments and review the methods, data, results and impacts in order to identify lessons learnt and to provide relevant recommendations for monitoring of Round 2 developments. Even though the focus is on Round 1 OWF sites – (some of which have now been operational for over 10 years) - many of the lessons learnt and recommendations in relation to appropriate monitoring strategies for SSC and morphology are valid for most major marine developments. For instance, for SSC monitoring these recommendations include: (i) the number of water samples required for more robust calibration of OBS time series; and (ii) the preference for deployment of a turbidity sensor at a fixed height above the bed and

Page 92 www.naturalresourceswales.gov.uk
additional vessel deployed sensor sampling through the water column at times of equipment deployment, servicing and recovery.
Report Title Coastal Process Modelling for Offshore Wind Farm Environmental Impact Assessment: Best Practice Guide.
Report Reference Lambkin et al. 2009
Most relevant sections/ pages Section 2.3 ‘The role and requirements of EIA’ Section 4.2 ‘Data in support of modelling’ Section 5 ‘Definition of coastal seabed issues’ Appendix C ‘Data in support of modelling and EIA’
Synopsis This is an extremely useful report that provides best practice guidance on the application and use of numerical models to predict the potential impact from offshore wind farms on coastal processes. The focus of this report is on the development and application of numerical models. However, the supporting sections on key issues for assessment (Section 2.3), data requirements (Section 4.2) and appropriate characterisation of the baseline (Section 5) are of great value in informing coastal processes EIA studies for OWF, as well as other offshore renewable developments
Report Title Environmental Impacts of Offshore Wind Farms in the Belgium Part of the North Sea
Report Reference Degraer et al. 2013
Most relevant sections/ pages Chapter 4 ‘All quiet on the sea bottom front?’ Lessons from morphodynamic monitoring’
Synopsis This report presents an integrated overview of all scientific findings of the Belgian offshore wind farm monitoring programme, with the specific aim of drawing lessons from these findings to optimise future monitoring programmes. The primary focus is on ecological receptors although Chapter 4 provides a useful discussion of monitoring activities associated with assessing raised turbidity, scour formation, the recovery of dredged foundation pits, evolution of sediment storage mounds and continued burial of export cables. Although to a certain extent the findings presented here are site specific, they may represent using analogues for similar industry activities elsewhere. Importantly, many of the construction related activities described are generic (often relating to dredging operations) and are therefore not unique to the OWF industry.

Page 93 www.naturalresourceswales.gov.uk
Report Title Review of Cabling Techniques and Environmental Effects applicable to the Offshore Wind farm Industry.
Report Reference BERR (2008)
Most relevant sections/ pages Section 4 ‘Physical change’
Synopsis This report describes the range of techniques used to install and maintain subsea cables. Information is also provided on a range of commonly applied cable protection measures. In addition to the technical information on cable design and installation, the physical changes or effects to the seabed and sub-surface sediments expected to occur during cabling activities are also described. This includes consideration of the level of sediment disturbance that is likely to occur during cable burial for each technique as well as potential sediment plume characteristics. The latter is discussed with reference to direct field monitoring during cable installation activities.
Report Title Guidelines for data acquisition to support marine environmental assessments of offshore renewable projects
Report Reference Judd, 2011
Most relevant sections/ pages Section 4.7 ‘Site characterisation and impact assessment (EIA) - Physical and Sedimentary Processes Studies’ Section 5.7 ‘Monitoring (Construction and Operation) - Physical and Sedimentary Processes Studies’ Annex 1 ‘Benthic studies’ Annex 2 ‘Seabed mapping’ Annex 6 ‘Physical and Sedimentary Processes’
Synopsis This report provides guidance in the design, review and implementation of environmental data collection and analytical activities associated with all stages of offshore renewable energy developments (main focus on OWF but with applicability to all other offshore renewable energy technologies). It provides a synthesis of existing relevant guidance for data acquisition activities and also advises where more detailed guidance can be found. The report gives explicit focus to marine and coastal physical processes studies, setting out (amongst other things) what parameters should be investigated, what spatial and temporal scales should be considered, what aspects of the baseline environment need describing and what impacts should be assessed. Survey design for both baseline characterisation and monitoring is presented, supported by excellent accompanying annexes providing guidance on: the appropriate use of grabs/ corers and laboratory processing of sediment samples (Annex 1), seabed mapping using acoustic techniques (Annex 2) and various other marine processes

Page 94 www.naturalresourceswales.gov.uk
parameters (currents, tidal elevation, SSC, waves, temperature and salinity) (Annex 6).
Report Title Guidance on survey and monitoring in relation to marine renewables deployments in Scotland.
Report Reference SNH, 2011
Most relevant sections/ pages Volume 1. Context and General Principles Section 1.4 ‘Introduction to wave and tidal devices and their environmental requirements’ Section 3.2 ‘Guiding principles for survey and monitoring’ Volume 5.Benthic Habitats. Section 4 ‘Potential impacts’ Section 9 ‘survey methods for site characterisation and establishment of pre installation baseline condition of a wet renewables site for benthic habitats and species’ Section 10 ‘monitoring methods to establish impacts of construction and operation of wave devices’ Section 10 ‘monitoring methods to establish impacts of construction and operation of tidal devices’
Synopsis This report provides context and guidance on the need for and conduct of site characterisation surveys and impact monitoring programmes for marine (wave and tidal) renewables developments in Scotland. Although the focus is on ecological receptors and change, several of the sections are also of wider relevance to marine and coastal physical processes studies. In particular, Volume 1 (Section 1.4) provides an extremely useful summary table of the various tidal and wave device technologies, noting industry examples, physical aspects of the device and the environmental conditions to which they are most suited (especially water depth). Several sections within Volume 5 also provide detailed discussions regarding the collection of benthic survey data for baseline characterisation and monitoring. This data includes grab samples, acoustic mapping data and drop down video evidence. Much of this information is also often used directly to inform marine and coastal processes EIA investigations and the discussion of data limitations contained in this report is therefore equally relevant to all data users.

Page 95 www.naturalresourceswales.gov.uk
Report Title Guidelines for the use of metocean data through the life cycle of a marine renewable energy development
Report Reference CIRIA 2008
Most relevant sections/ pages Section 3 ‘Metocean data’ Section 6 ‘Pre-consent issues’
Synopsis This guide has been developed to identify and recommend on the uses of metocean data through the life cycle of a marine renewable energy development. The document includes a review of metocean data types, data sources and identifies the importance for good data management. Of particular relevance is section 6 since the focus here is on the use of metocean information to inform EIA. Later sections are of wider interest although are more focused upon engineering applications.
Report Title Turbulence: Best Practices for the Tidal Power Industry
Report Reference Carbon Trust 2015
Most relevant sections/ pages Section 2 ‘Instrumentation for Measurement of Turbulence’ Section 3 ‘Instrument configuration and deployment’ Section 4 ‘Survey planning and operations’ Section 6 ‘Data management and quality control’
Synopsis This report provides quality assured survey guidance for the collection of quality, marine turbulence data. It addresses: - Commercially available (acoustic and non-acoustic) instruments for measurement of marine turbulence; - Instrument selection and limitations; - Instrument set up for turbulence investigation; - Site characterisation; - Survey planning and operations; and - Data pre-processing, quality control and management. The guidance is primarily aimed at developers and engineers although the appropriate characterisation of turbulence is of wider relevance to assessing the potential impacts arising from the operation of tidal energy devices on the marine environment.

Page 96 www.naturalresourceswales.gov.uk
Report Title Identifying the possible impacts of rock dump from oil and gas decommissioning on Annex I mobile sandbanks
Report Reference Pidduck et al. 2017
Most relevant sections/ pages Section 3.3.2 ‘Potential effects of rock dump from oil and gas decommissioning on Annex I Habitats ‘Sandbanks slightly covered by water all the time’ Section 3.3.3 ‘Supporting physical processes’ Section 4 ‘Recommendations’
Synopsis This report provides initial conclusions regarding the implications of rock dump on Annex I mobile sandbanks for impact assessment of plans and/or projects. Although the focus is on the North Norfolk Sandbanks and Saturn Reef cSAC/SCI , the report is of relevance to all projects which may adversely impact Annex I sand banks via rock dump activities. This report provides a review of existing literature, publicly available data, and a qualitative evaluation of the impacts of rock dump on Annex I habitats. Particular consideration is given to current and tidal flow disturbance, sediment supply disturbance and scour. However, a key conclusion of the report is that there is currently a lack of understanding regarding potential impacts and this is due (at least in part) to a lack of publically available survey information from the oil and gas industry. Accordingly a strategy of long term monitoring is proposed as part of future decommissioning plans to better understand associated changes.

Page 97
Appendix B Summary of Marine and Coastal Processes Surveying Techniques, Including Strengths, Weaknesses and Best Practice
Method Description and Setting Capabilities Limitations Best Practice/ Supporting Information
Hydrodynamics
Acoustic Doppler Devices
Description: Hydro-acoustic current meter used to measure water current velocities over a depth range using the Doppler effect of sound waves scattered back from particles within the water column. May be seabed mounted, deployed at a fixed depth on a mooring string, or mounted to a vessel for mobile survey. Devices may also be capable of recording waves and turbidity. Setting: Estuarine, coastal and offshore (up to ~100 m depth).
• Cost efficient as able to simultaneously measure water levels, currents, waves (and suspended sediments)
• Potential to provide a profile of measurements throughout the water column.
• Potential to capture long-term (period of circa 3 months) records between equipment service visits;
• Good accuracy for water levels with devices typically <0.25% of the water column depth (e.g. ±7.5 cm at 30 m depth)
• Good accuracy for currents with devices typically <1% ±0.5cm/s (e.g. ±0.01m/s for
0.5m/s flow). Directions within ±2to 5.
• Can measure extremely fast currents (up to circa 10 m/s but TBC with equipment manufacturers)
• Absolute accuracy for waves difficult to evaluate. During tests, relative agreement between certain surface deployed and seabed instruments was found to be: wave height within 0.1m; period within 1 to 2s; direction within 2 to 5º (Lambkin et al. 2009).
• Directional wave spectra obtained from acoustic doppler devices tend to be sharper than those from directional wave buoys and because of the greater number of degrees of freedom in the measurement, the device can resolve complex multidirectional wave distributions (Pandian et al. 2010).
• May also be used to measure turbulence: the presence of air bubbles leads to a weakened signal and an increase in the error intensity which is an indirect measure of turbulence being present.
• Generally not be able collect current/ water level data in the period of time when wave measurements are being collected. (However, if the device has a pressure sensor and in shallow enough water then the pressure sensor might be able to measure surface waves.)
• Currents are not measured very near bed (<0.5 m) and near surface (within 10% of the water depth) Potential issues with erroneous data collection (currents and waves) due to very low SSC (causing low acoustic return) or excessive amounts of bubbles within the water column Bed mounted frames potentially vulnerable to burial in mobile bedforms and impact from trawling.
• Limited ability to measure very short period waves.
• Bed frames may be buried in areas where sediment is highly mobile
• Where seabed is highly undulating/ rocky the instrument may be tilted >11 degrees which is in excess of the optimum angle that an ADCP can operate at.
• Potential for anchor weights (as well as other metallic objects on the seabed) to cause magnetic interference with the device compass if the device is not adequately calibrated in its frame.
• OGP, (2011) ‘HSE guidelines for metocean and Arctic surveys, Report No. 477, International Association of Oil and Gas Producers’
• NORSOK, (2010) ‘NORSOK Standard N-002: Collection of metocean data’ Edition 2 (October 2010), Standards Norway (Norway)
• CIRIA (2008) ‘ Guidelines for the use of metocean data through the lifecycle of a marine renewable energy development’
• OGP, (2003) ‘HS&E guidelines for metocean surveys’ Report No. 348, International Association of Oil and Gas Producers
Useful background information on the measurement of waves can be found in:
• Wolf (2017) ‘Measurement and analysis of waves in estuarine and coastal waters’ (in Uncles & Mitchell, 2017)
There is typically best practice information on the instrument manufacturers’ websites (e.g. RD, Nortek, Sontek etc.) which provides guidance for instrument calibration and deployment procedures in different environmental settings.
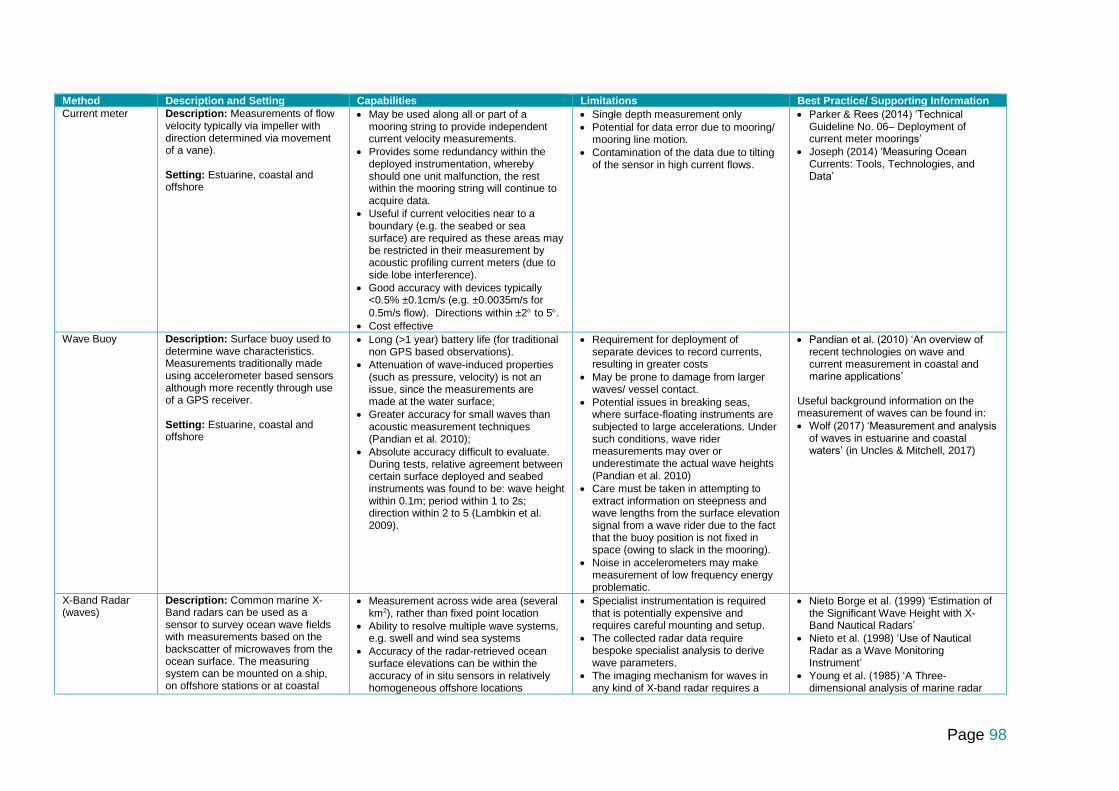
Page 98
Method Description and Setting Capabilities Limitations Best Practice/ Supporting Information
Current meter Description: Measurements of flow velocity typically via impeller with direction determined via movement of a vane). Setting: Estuarine, coastal and offshore
• May be used along all or part of a mooring string to provide independent current velocity measurements.
• Provides some redundancy within the deployed instrumentation, whereby should one unit malfunction, the rest within the mooring string will continue to acquire data.
• Useful if current velocities near to a boundary (e.g. the seabed or sea surface) are required as these areas may be restricted in their measurement by acoustic profiling current meters (due to side lobe interference).
• Good accuracy with devices typically <0.5% ±0.1cm/s (e.g. ±0.0035m/s for
0.5m/s flow). Directions within ±2 to 5.
• Cost effective
• Single depth measurement only
• Potential for data error due to mooring/ mooring line motion.
• Contamination of the data due to tilting of the sensor in high current flows.
• Parker & Rees (2014) ‘Technical Guideline No. 06– Deployment of current meter moorings’
• Joseph (2014) ‘Measuring Ocean Currents: Tools, Technologies, and Data’
Wave Buoy Description: Surface buoy used to determine wave characteristics. Measurements traditionally made using accelerometer based sensors although more recently through use of a GPS receiver. Setting: Estuarine, coastal and offshore
• Long (>1 year) battery life (for traditional non GPS based observations).
• Attenuation of wave-induced properties (such as pressure, velocity) is not an issue, since the measurements are made at the water surface;
• Greater accuracy for small waves than acoustic measurement techniques (Pandian et al. 2010);
• Absolute accuracy difficult to evaluate. During tests, relative agreement between certain surface deployed and seabed instruments was found to be: wave height within 0.1m; period within 1 to 2s; direction within 2 to 5 (Lambkin et al. 2009).
• Requirement for deployment of separate devices to record currents, resulting in greater costs
• May be prone to damage from larger waves/ vessel contact.
• Potential issues in breaking seas, where surface-floating instruments are subjected to large accelerations. Under such conditions, wave rider measurements may over or underestimate the actual wave heights (Pandian et al. 2010)
• Care must be taken in attempting to extract information on steepness and wave lengths from the surface elevation signal from a wave rider due to the fact that the buoy position is not fixed in space (owing to slack in the mooring).
• Noise in accelerometers may make measurement of low frequency energy problematic.
• Pandian et al. (2010) ‘An overview of recent technologies on wave and current measurement in coastal and marine applications’
Useful background information on the measurement of waves can be found in:
• Wolf (2017) ‘Measurement and analysis of waves in estuarine and coastal waters’ (in Uncles & Mitchell, 2017)
X-Band Radar (waves)
Description: Common marine X-Band radars can be used as a sensor to survey ocean wave fields with measurements based on the backscatter of microwaves from the ocean surface. The measuring system can be mounted on a ship, on offshore stations or at coastal
• Measurement across wide area (several km2), rather than fixed point location
• Ability to resolve multiple wave systems, e.g. swell and wind sea systems
• Accuracy of the radar-retrieved ocean surface elevations can be within the accuracy of in situ sensors in relatively homogeneous offshore locations
• Specialist instrumentation is required that is potentially expensive and requires careful mounting and setup.
• The collected radar data require bespoke specialist analysis to derive wave parameters.
• The imaging mechanism for waves in any kind of X-band radar requires a
• Nieto Borge et al. (1999) ‘Estimation of the Significant Wave Height with X-Band Nautical Radars’
• Nieto et al. (1998) ‘Use of Nautical Radar as a Wave Monitoring Instrument’
• Young et al. (1985) ‘A Three-dimensional analysis of marine radar

Page 99
Method Description and Setting Capabilities Limitations Best Practice/ Supporting Information
locations to scan the sea surface in real time. Setting: Estuarine, coastal and offshore (but shore based systems limited to estuarine/ coastal settings)
(e.g. Dankert and Rosenthal, 2004) although Hs accuracy generally estimated at ±10% and Tp at 0.5 s (e.g. Nieto Borge et al. 1999).
• Wave fields can be imaged to provide information about reflectance, diffraction and areas exposed to high energy events.
• Radar can also be used to derive directional spectra. The ability to determine the directional information from multiple wave systems from different directions is a particular strength.
minimum wind speed of ~3 m/s, otherwise the waves are not large enough to be visible to the radar.
• Significant wave heights below ~0.5 m cannot be resolved.
• Heavy persistent rain showers will not allow for wave measurements, as those disturb the reflecting ripple waves on the sea surface and the radar reflections become very strong.
• Greater potential for inaccuracy in near shore coastal settings. This is due to non-uniform bathymetry, current and wind fields which can complicate the estimation of the hydrodynamic parameters (i.e., the direction, the period and the wavelength of the dominant waves) (Ludeno et al. 2015)
• May provide underestimates for small significant wave heights (e.g. Dankert and Rosenthal, 2004).
images for the determination of ocean wave directionality and surface currents’
• Horstmann, et al. (2015) ‘Wind, wave and current retrieval utilizing X-band marine radars’
X-Band Radar (Currents)
Description: X-band radar can be used to image wave fields as described above. Waves under the influence of a current exhibit a Doppler shift that can detected by an analysis of the radar data. The wave spectrum detected by the radar is locally offset from the background value by an amount that is proportional to the magnitude of the difference in current speed and in a direction that indicates the direction of the current. Setting: Estuarine, coastal and offshore (but shore based systems limited to estuarine/ coastal settings)
• Measurements across a large area, providing a current vector field rather than a point measurement.
• Provides many measurements from a single sensor deployment.
• ~50 to 200 m spatial resolution depending on wavelength and radar being used and site conditions.
• Gives estimate of direction and magnitude of the current which the waves are ‘feeling’ (this is a surface biased current, but in shallow depths often correlates well with depth-mean currents derived from ADCPs).
• Able to derive results from very high energy environments where traditional device deployment would not be safe or practical, or where devices would be damaged or at risk of loss.
• When depths are constrained (e.g. using known bathymetry) the accuracy of current estimates can be improved. Works best in moderate to high sea states with multiple wave directions and wave periods.
• Specialist instrumentation is required that is potentially expensive and requires careful mounting and setup.
• The collected radar data require bespoke specialist analysis to derive wave and current parameters.
• Relies on radar imaging of the wave field. If no waves are imaged, then no currents are estimated.
• Does not detect changes across the current depth profile, presents an average current estimate.
• Reduced accuracy in very shallow (<3 m) water depths.
• Does not give spot measurement, gives an average over the spatial resolution of an analysis cell (e.g. 50 to 200 m).
• Current measurements can be compromised where there is a highly monochromatic sea state with little wave directional spread
• Results can be compromised by rain and also by the passage of large ships
• Bell et al. (2012) ‘Determining currents from marine radar data in an extreme current environment at a tidal energy test site’
• McCann & Bell (2014) ‘Marine radar-derived current vector mapping at a planned commercial tidal stream turbine array in the Pentland Firth UK’
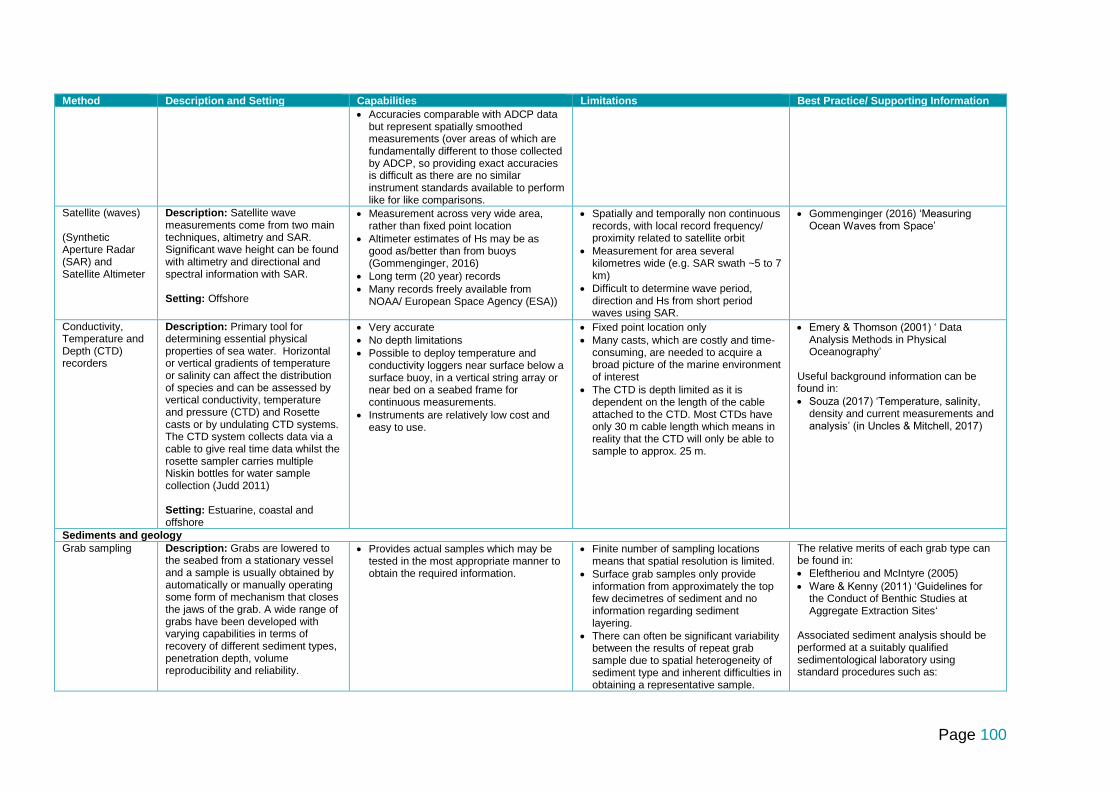
Page 100
Method Description and Setting Capabilities Limitations Best Practice/ Supporting Information
• Accuracies comparable with ADCP data but represent spatially smoothed measurements (over areas of which are fundamentally different to those collected by ADCP, so providing exact accuracies is difficult as there are no similar instrument standards available to perform like for like comparisons.
Satellite (waves) (Synthetic Aperture Radar (SAR) and Satellite Altimeter
Description: Satellite wave measurements come from two main techniques, altimetry and SAR. Significant wave height can be found with altimetry and directional and spectral information with SAR. Setting: Offshore
• Measurement across very wide area, rather than fixed point location
• Altimeter estimates of Hs may be as good as/better than from buoys (Gommenginger, 2016)
• Long term (20 year) records
• Many records freely available from NOAA/ European Space Agency (ESA))
• Spatially and temporally non continuous records, with local record frequency/ proximity related to satellite orbit
• Measurement for area several kilometres wide (e.g. SAR swath ~5 to 7 km)
• Difficult to determine wave period, direction and Hs from short period waves using SAR.
• Gommenginger (2016) ‘Measuring Ocean Waves from Space’
Conductivity, Temperature and Depth (CTD) recorders
Description: Primary tool for determining essential physical properties of sea water. Horizontal or vertical gradients of temperature or salinity can affect the distribution of species and can be assessed by vertical conductivity, temperature and pressure (CTD) and Rosette casts or by undulating CTD systems. The CTD system collects data via a cable to give real time data whilst the rosette sampler carries multiple Niskin bottles for water sample collection (Judd 2011) Setting: Estuarine, coastal and offshore
• Very accurate
• No depth limitations
• Possible to deploy temperature and conductivity loggers near surface below a surface buoy, in a vertical string array or near bed on a seabed frame for continuous measurements.
• Instruments are relatively low cost and easy to use.
• Fixed point location only
• Many casts, which are costly and time-consuming, are needed to acquire a broad picture of the marine environment of interest
• The CTD is depth limited as it is dependent on the length of the cable attached to the CTD. Most CTDs have only 30 m cable length which means in reality that the CTD will only be able to sample to approx. 25 m.
• Emery & Thomson (2001) ‘ Data Analysis Methods in Physical Oceanography’
Useful background information can be found in:
• Souza (2017) ‘Temperature, salinity, density and current measurements and analysis’ (in Uncles & Mitchell, 2017)
Sediments and geology
Grab sampling Description: Grabs are lowered to the seabed from a stationary vessel and a sample is usually obtained by automatically or manually operating some form of mechanism that closes the jaws of the grab. A wide range of grabs have been developed with varying capabilities in terms of recovery of different sediment types, penetration depth, volume reproducibility and reliability.
• Provides actual samples which may be tested in the most appropriate manner to obtain the required information.
• Finite number of sampling locations means that spatial resolution is limited.
• Surface grab samples only provide information from approximately the top few decimetres of sediment and no information regarding sediment layering.
• There can often be significant variability between the results of repeat grab sample due to spatial heterogeneity of sediment type and inherent difficulties in obtaining a representative sample.
The relative merits of each grab type can be found in:
• Eleftheriou and McIntyre (2005)
• Ware & Kenny (2011) ‘Guidelines for the Conduct of Benthic Studies at Aggregate Extraction Sites‘
Associated sediment analysis should be performed at a suitably qualified sedimentological laboratory using standard procedures such as:

Page 101
Method Description and Setting Capabilities Limitations Best Practice/ Supporting Information
The devices most frequently used for UK marine survey work are the van Veen grab, the Day grab and the Hamon grab (SNH, 2011) Setting: Estuarine, coastal and offshore
• Those specified by the British Marine Aggregate Producers Association (Cooper & Mason, 2011); or,
• By, the NMBAQC methodology (Mason, 2016) (if the data are also to be used for biological characterization and monitoring purposes)
The JNCC website also provides best practice methodology and handling for taking sediment samples in estuarine and coastal environments. (http://jncc.defra.gov.uk/page-7123)
Side-scan sonar Description: Provides an acoustic image of the seafloor approximately 100 to 200m width behind the survey vessel, Measurement of the amplitude of backscatter (varying with the relative orientation of the seabed to the instrument and the roughness of that surface) enables information about seabed morphology and substrate content to be determined, as well as the surficial seabed texture and hardness. Setting: Estuarine, coastal and offshore
• High resolution seafloor images over comparatively wide swath widths
• Allows for imaging of relatively small scale relief
• Cost effective. Time-consuming calibration procedures are not normally required for an established system.
• May be used to infer sediment transport pathways (through consideration of bedform asymmetry).
• Does not record bathymetry information
• Acoustic shadows (no data return) behind high relief terrain
• Accurate navigational information and handling of the towed array required to correctly geolocate the data.
• Sediment grab samples are required to fully interpret the results. Difficulties or limitations in interpretation of uncalibrated backscatter information.
• Interpretation of the images is time consuming and requires an experienced eye.
Detailed background information on the principles of side-scan sonar, data acquisition and processing are provided by:
• Klaucke (2017) ‘Side-scan Sonar.’ Bennel (2001) ‘Procedural Guideline No. 1–5 Mosaicing of side-scan sonar images to map seabed features’
An excellent discussion of the strengths and weaknesses of various seabed-mapping technologies for marine habitat classification is provided by:
• Kenny et al. (2003) ‘An overview of seabed-mapping technologies in the context of marine habitat classification’
• Davies et al. (2001) ‘Marine Monitoring Handbook’
Useful background information on acoustic seabed survey techniques can be found in:
• Jones et al. (2017) ‘Acoustic seabed survey methods, analysis and applications’ (in Uncles & Mitchell, 2017)
Multibeam Echo sounder (for determining sediment properties)
Description: Most MBES systems can collect acoustic backscatter information with echo strength data (reflectance) extracted and presented as seabed back-scatter maps that display information on sediment types (Kenny et al. 2003).
• Fast tracking speeds and therefore more cost effective
• Ability to export complimentary outputs that are geographically coincident into software for classification
• Versatility in the display of Digital Elevation Models (DEM) for feature detection, and
• Experienced field operators with a high degree of technical competence are required.
• Large data volumes. Considerable post processing is required.
• Quality of backscatter information dependent upon metocean conditions at the time of data collection.
An excellent discussion of the various strengths and weaknesses of various seabed-mapping technologies for marine habitat classification is provided by:
• Kenny et al. (2003) ‘An overview of seabed-mapping technologies in the context of marine habitat classification’

Page 102
Method Description and Setting Capabilities Limitations Best Practice/ Supporting Information
Setting: Estuarine, coastal and offshore
• DEMs acting as a backdrop for draping other layers of information and facilitating the integration of data for assessment purposes.
• Automated classification possible
• Relationship between grain size and backscatter strength likely to change between different MBES systems owing to different beam angles, pulse length and frequency.
• Davies et al. (2001) ‘Marine Monitoring Handbook’
A useful concise summary is provided by:
• Judd (2011) ’Guidelines for data acquisition to support marine environmental assessments of offshore renewable energy projects’
Useful background information on acoustic seabed survey techniques can be found in:
• Jones et al. (2017) ‘Acoustic seabed survey methods, analysis and applications’ (in Uncles & Mitchell, 2017)
Acoustic Ground Discrimination Systems (AGDS)
Description: AGDS are based upon single beam echo-sounders and are designed to detect different substrata by their acoustic reflection and absorption properties. Hard surfaces result in strong echoes while soft surfaces absorb sound and give weak echoes (Judd 2011) Setting: Estuarine, coastal and offshore
• Coverage of a wide area
• Can help inform direct sampling survey design
• Cost effective
• Not complete coverage of seafloor;
• Large acoustic footprints in deep water
• Need to be appropriately set up,
• The raw data is not intuitive,
• Careful editing is required.
• The quality of the data is prone to the effects of poor weather conditions, and changes in acoustic properties (e.g. tide and suspended load) even more so than other acoustic systems.
• Resolution of AGDS is poor as compared to swath systems
Sub-bottom profiler
Description: Boomer and CHIRP sub bottom profilers are typically used to identify geological structures and sedimentary sequences at shallow depths below the seabed surface. The higher frequencies of operation associated with CHIRP systems provide a higher vertical resolution, but a more limited penetration depth. Usually ground truthed in discrete locations using subsurface cores. Setting: Estuarine, coastal and offshore
• Ability to map large areas of sub seabed geology in a far more time/ cost efficient manner than via direct sampling (e.g. via boreholes/ vibracores)
• Ability to map sub-seabed geology to depths far greater than (realistically) achievable via boreholes/ vibracores
• High potential for inaccurate interpretation if not ground truthed.
• Detection of sediment horizons between acoustically similar units difficult.
Detailed background information on the principles of reflection and refraction sub-bottom profiling methods are provided by:
• Crutchley and Kopp (2017) ‘Reflection and refraction seismic methods’
Vibracore Description: Sampling method for retrieving continuous, undisturbed cores. Use of high frequency, low amplitude vibration that is transferred from the vibracore head down through the attached barrel or core tube Setting: Estuarine, coastal and offshore (but where sediments are unconsolidated)
• Quick
• Less labour intensive / costly than for collection of boreholes
• Restricted to areas largely characterised by unconsolidated sediments at or close (< ~5 m) to the seabed)
• Potential for loss of upper (loose) surface material due to re-suspension from the action of the vibracore tube as it penetrates.
• Hoyt & Demarest II (1981) ‘Vibracoring in coastal environments; the R.V. Phryne II barge and associated coring methods.’ University of Delaware, Sea Grant Program, Newark, DE, DEL-SG-01-81, 34 p.
Borehole Description: Collection of cores typically via cable percussive techniques or rotary drill (for harder material).
• Enables direct sampling of recovered material
• Ability to penetrate dense material (rock) to a depth of many tens of metres
• Expensive
• Physical characteristics of the rock/ sediment may be altered during the boring process. Grain size distribution may also be altered.
• Hailwood & Kidd (1990) ‘Marine Geological Surveying and Sampling’

Page 103
Method Description and Setting Capabilities Limitations Best Practice/ Supporting Information
Setting: Estuarine, coastal and offshore
Cone Penetration Test
Description: Method used to determine sub-seabed geotechnical properties by pressing a cone of standard dimensions into the soil under a known load and measuring the penetration. Setting: Estuarine, coastal and offshore
• In situ test
• Cost effective
• Measures certain soil strength properties in the native conditions that the soil is in
• Minimal operator influence on the data
• Potential for restricted application in areas of very dense soils/ lithology;
• Not directly sampling the underlying geology and no physical sample is collected to verify interpretation.
Relevant internationals standards are provide by the International Society for Soil Mechanics and Geotechnical Engineering (ISSMGE) and the International organisation for Standardisation ( ISO):
• ISSMGE International Reference Test Procedure for the Cone Penetration Test (CPT) and the Cone Penetration Test with pore pressure (CPTU)
• ISO/DIS 22476-1:2005 Geotechnical investigation and testing - Field testing - Part 1: Electrical cone and piezocone penetration tests
• ISO 22476-12:2009 Geotechnical investigation and testing - Field testing - Part 12: Mechanical cone penetration test (CPTM)
Optical Backscatter (OBS) sensor
Description: Optical sensor for measuring turbidity and suspended solids concentrations by detecting infra-red light scattered from suspended matter. Setting: Estuarine, coastal and offshore
• OBS sensor easily mounted to bed frame OBS response to clay is far higher than to sand (e.g. Battisto et al. 1999).
• Accuracy of calibration can be good if suitably controlled in the laboratory.
• Finite number of sampling locations means that the spatial resolution is limited.
• Measurements restricted to single depth level; vertical profile not resolved.
• Organic material contribution is also measured
• Data highly susceptible to error associated with biofouling of the sensor (although can use hydro wipers to minimise effect).
• Requirement for sensor to be calibrated using locally derived water and sediment samples.
• Turbulent flow around the sensor and frame can artificially increases the suspended sediment concentration above natural levels
• Suspended sediment concentration can be variable over small distances which will not be resolved by a fixed (single point) instrument.
• Can be very difficult to accurately calibrate sensor.
• Connor et al. (1992) ‘A laboratory investigation of particle size effects of an optical backscatterance sensor’
• Battisto (2000) ‘Field Measurement Of Mixed Grain Size Suspension in the Nearshore Under Waves’
Useful background information on the measurement of suspended particulate matter can be found in:
• Mitchell et al. (2017) ‘Suspended particulate matter: sampling and analysis’ (in Uncles & Mitchell, 2017)
The D&A Instruments OBS manual provides a good description of Optical properties and how they are influenced by natural conditions.
• D&A Instruments (1989) ‘Optical Backscatterance Turbidity Monitor. Instruction Manual Tech. Note 3’. 2428, 39th Street, N.W., Washington, D.C., 20007, USA.

Page 104
Method Description and Setting Capabilities Limitations Best Practice/ Supporting Information
Acoustic Doppler Current Profiler
Description: Although not designed to measure SSC, ADCPs can be used to assess the vertical SSC profile. Can be mounted on a seabed frame or vessel mounted, carried out at different locations and times of the year. Setting: Estuarine, coastal and offshore (up to ~100 m depth).
• Provides a time-series of vertical profiles at the sampling locations.
• Better at detecting coarse grained sediment fractions than OBS.
• Simultaneous records of SSC, water levels, currents and waves, potentially enabling process drivers of key sediment mobilisation events to be determined.
• Measuring SSC using ADCP backscatter data is difficult and requires specialist software such as Sediview to convert the data.
• Not routinely used in survey studies due to its complexity. Easier to deploy an array of OBS sensors.
• Finite number of sampling locations means that the spatial resolution is limited.
• ADCPs are single-frequency instruments and as such are unable to resolve whether changes in echo intensity are associated with changes in sediment concentration or changes in particle-size distribution
• Error in SSC estimates has been found to increase as the ratio of particle circumference to acoustic wavelength approaches 1.
• Bed mounted frames potentially vulnerable to burial or overturning due to mobile bedforms and impact from trawling.
• Calibration of backscatter to SSC is notoriously difficult and often only quoted as qualitative.
• Acoustic backscatter signal poor at detecting fine grained material held in suspension.
• Instrument requires calibration using high number of water/SSC samples from the same site during data collection, ideally covering a range of SSC conditions (spring/neap tides, stormy weather, etc.).
• There is a need for data corrections to account for the loss of acoustic energy with distance from the ADCP
General discussion regarding the use of an ADCP device to determine SSC (including limitations) is provided in:
• Wall et al. (2006) ‘Use of an ADCP to Compute Suspended Sediment Discharge’
Useful background information on the measurement of suspended particulate matter can be found in:
• Mitchell et al. (2017) ‘Suspended particulate matter: sampling and analysis’ (in Uncles & Mitchell, 2017)
Niskin bottle/ trap sampler
Description: Containers to collect water samples from specific depths, with which to measure properties such as SSC, water chemistry, etc. Usually, the bottle is initially open at both ends and is mounted vertically on a weighted wire or rosette frame and lowered to the sampling point,
• Provides actual samples which may be tested in the most appropriate manner to obtain the required information. Organic material contribution can be removed prior to analysis
• Particle size distribution may (potentially) be determined in real time using portable laser diffraction systems
• Finite number of sampling locations means that the spatial resolution is limited.
• Suspended sediment concentration can be variable over small distances or over short time periods.
Useful background information on the measurement of suspended particulate matter can be found in:
• Mitchell et al. (2017) ‘Suspended particulate matter: sampling and analysis’ (in Uncles & Mitchell, 2017)

Page 105
Method Description and Setting Capabilities Limitations Best Practice/ Supporting Information
where the bottle is closed by a mechanism (mechanical or electrical) before being retrieved to the surface. Setting: Estuarine, coastal and offshore
• Differences between the sampler intake velocity and local flow velocity may result in sampling errors.
• van Rijn, (2007) ‘ Manual of Sediment Transport Measurements in Rivers, Estuaries and Coastal Seas’
Sediment Transport Bed Samplers
Description: A number of different bed samplers are available to determine rates of bed load transport, including the widely used Helley-Smith sampler, which is applicable for sediment sizes ranging from 0.5 to 16 mm, and the Delft Nile bed load and suspended load sampler, which can collect across the full range of sizes up to medium gravel (Pye et al. 2017) Setting: Estuarine, coastal and offshore
• Direct measurement of sediment transport rate, rather than inferred
• Only really suitable for short deployments because the traps can fill relatively quickly.
• The presence of the trap and its mounting frame can cause bed scour or otherwise modify the sediment transport processes taking place.
• Subject to high temporal and spatial variability
A full description of the various equipment types is provided in:
• van Rijn, (2007) ‘Manual of Sediment Transport Measurements in Rivers, Estuaries and Coastal Seas’
Associated sediment analysis should be performed at a suitably qualified sedimentological laboratory using standard procedures (e.g. those specified by the British Marine Aggregate Producers Association (Cooper & Mason, 2011), or, if the data are also to be used for biological characterization and monitoring purposes, the NMBAQC methodology (Mason, 2016). Useful background information on the measurement of sediment transport can be found in:
• Black et al. (2017) ‘Sediment transport: instrumentation and methodologies’ (in Uncles & Mitchell, 2017)
Owen Tube Description: Device used to determine the in situ settling properties of flocculated mud. Collected water samples are extracted from the bottom of the tube at pre-selected time intervals and the settling velocity is inferred from gravimetric analysis. Setting: Estuarine, coastal
• Straightforward method
• Widely used
• Larger flocs may be broken up during the capture of water samples and this tends to lead to significant underestimation of settling velocity.
• Not able to resolve settling velocities for concentrations below circa 0.1 kg/m-3
• Generally less accurate than alternative methods including those from Laser In Situ Scattering and Transmissometry and halographic instruments (that measure particle sizes directly) and measurements from video techniques.
Useful background information contained in:
• Manning et al. (2017) ‘Suspended particulate matter: the measurement of flocs.’ (in Uncles & Mitchell, 2017)
• Manning et al. (2011) ‘Cohesive Sediment Flocculation and the Application to Settling Flux Modelling’
• Dearnley et al. (1995) ‘Inter comparison of in-situ particle size and settling velocity measurements’
• Whitehouse et al. (2000) ‘Dynamics of Estuarine Muds: A Manual for Practical Applications’

Page 106
Method Description and Setting Capabilities Limitations Best Practice/ Supporting Information
Topography/ morphology
Multi-beam echo sounder (for determining bathymetry)
Description: Multibeam echo-sounders (MBES) collect bathymetric soundings in a swath perpendicular to the ship track. This is done by electronically forming a series of transmit and receive beams in the transducer hardware which measure the depth to the seafloor in discrete angular increments or sectors across the swath (Hughes-Clarke et al. 1996). Setting: Estuarine, coastal and offshore. (Unlikely to be deployed in very shallow (i.e. less than a few metres) owing to risk of transducer damage and limited advantages over single beam technologies)
• Ability to obtain 3D surface
• Far denser survey coverage than achieved via single beam techniques
• Able to achieve up to 100% bottom coverage
• Potential to resolve short wavelength (order of metres) and low amplitude (order of a few decimetres) bedforms
• May be used to infer sediment transport pathways (through consideration of bedform asymmetry).
• Potentially more sources of errors and biases exist in multibeam surveying than found in single beam surveying (see Hopkins, 2007)
• More front end calibration required than for single beam surveys
• Surveys may be very time consuming in very shallow areas and offer few advantages over single beam
• Owing to the large datasets, automated ‘de-spiking’ and filtering will be required. This may potentially remove sharp or uncharacteristic seabed features.
• Requirement for bespoke software to view large datasets.
Two main international standards apply when deciding on survey type: IHO Standards for Hydrographic Surveying (S44) and LINZ 2003 Hydrographic MBES Survey Standards Consideration should also be given to the guidance provided in the Mapping European Seabed Habitats (MESH) Recommended Operating Guidelines (ROG) for swath bathymetry surveys (Hopkins, 2007) Useful background information on bathymetric surveying can be found in:
• Abbott (2017) ‘Bathymetric and tidal measurements and their processing’ (in Uncles & Mitchell, 2017)
Detailed background information on the principles of MBES are provided by:
• Hughes Clarke (2017) ‘Multibeam Echo-sounders’
Single beam echo sounder
Description: A single beam echosounder measures the depth to the seafloor by using the properties of acoustic waves. It can measure only one point per acoustic echo wave, with the specifications defined by (amongst other things) beam angle and frequency of transmitted acoustic wave from the transducer. Setting: May be used to measure water depth from less than 1 m to depths >5000 m.
• More rapid processing of results than for MBES
• Less expensive than MBES
• Spatial coverage far less than for MBES surveys.
• Characteristics of small bed forms likely to be poorly resolved.
• Line spacing’s typically several tens (or even hundreds) of metres apart. Interpolation is required to generate a surface and this introduces error.
Two main international standards apply when deciding on survey type: IHO Standards for Hydrographic Surveying (S44) and LINZ 2003 Hydrographic MVBES Survey Standards Useful background information on bathymetric surveying can be found in:
• Abbott (2017) ‘Bathymetric and tidal measurements and their processing’ (in Uncles & Mitchell, 2017)
Topographic LiDAR
Description: LIDAR is a remote sensing method that uses light in the form of a pulsed laser to measure ranges (variable distances) to the Earth. Setting: Terrestrial/ inter-tidal
• Potential to achieve high levels of accuracy (<5 cm vertical)
• Multiple elevation readings per square meter
• Rapid high resolution survey across very large area
• Because a DEM can be produced within hours of the overflight, results can be viewed rapidly.
• Reasonably good weather (cloud level above flight level) is needed to combine with tidal levels at or below MLWS to provide maximum possible coverage;
• Surveys are costly;
• Data in the vicinity of the waterline at the time of survey are often sparse and noisy due to low backscatter from wet surfaces when operating at near-infrared wavelengths;
LiDAR surveys undertaken for coastal monitoring (in England) are carried out using the following guidance:
• National Network of Regional Coastal Monitoring Programmes (NNRCMP) (2015) ‘Specification for LiDAR surveys’

Page 107
Method Description and Setting Capabilities Limitations Best Practice/ Supporting Information
• LiDAR may not penetrate to the ground surface in densely vegetated areas, producing an anomalous elevation at those points that may be significantly higher than the actual elevation.
Bathymetric LiDAR
Description: Bathymetric LiDAR can, with a different wavelength, penetrate the water surface and provide nearshore depth information. Setting: (Potentially) Estuarine and coastal
• There are several combined topographic and bathymetric LiDAR systems that have been used extensively to map shoreline and nearshore areas.
• Ability to survey areas which can’t easily be accessed via vessel;
• Reasonably good weather is needed, with no cloud below the flight level;
• Difficult to collect accurate bathymetry information in coastal areas due to the effects of wave breaking and high turbidity.
• LiDAR systems are far more complex (and therefore costly) than topographic systems
• Vertical resolution less than for vessel based surveys
• The spacing for bathymetric points is fairly wide compared to the tight spacing of topographic points
Useful guidance with regards to the strengths and weakness of LiDAR systems can be found in:
• NOAA (2012) ‘Lidar 101: An Introduction to Lidar Technology, Data, and Applications’
• Parrish (2012) ‘Shoreline mapping’
Drones Description: Survey via drone (or unmanned aerial vehicle (UAV))) which requires a ground-based controller and a system of communications between the two. The flight of drones may operate with various degrees of autonomy: either under remote control by a human operator or autonomously by on board computer. Now widely used to consider (amongst other things):
• Pre- and post-storm beach morphology
• Cliff position
• Changes in habitat Setting: Terrestrial/ inter-tidal
• Cost effective alternative to more conventional aerial platforms, such as manned aircraft;
• Denser coverage than from traditional levelling methods
• Can be rapidly deployed (e.g. to collect pre- and post-storm cliff profiles)
• Potential to achieve relatively high levels of accuracy (<5 cm horizontal; 5 to10 cm vertical)
• Ability to programme the flight path allows effective data capture with highly accurate repeatability
• Difficulties in deriving accurate measurements in areas of reflective objects (e.g. sea surface) and dense vegetation
• Requirement for ground control points to ensure absolute accuracy and enable data to be confidently combined with/ compared against other surveys
• Not as suitable as LiDAR for estuary wide surveys as likely to require re-deployment from multiple locations.
An assessment of drone survey accuracy is provided by:
• Barry and Coakley (2015) ‘Accuracy of UAV photogrammetry compared with network RTK GPS’; and
• Elsner et al. (2018) ‘Coincident beach surveys using UAS, vehicle mounted and airborne laser scanner: Point cloud inter-comparison and effects of surface type heterogeneity on elevation accuracies.’
Laser scan Description: Terrestrial laser scanning is typically used May be with automated analytical software to give a continuous and frequent capture of data Setting: Terrestrial/ inter-tidal
• Much denser survey coverage than achieved via traditional levelling methods
• May be used with automated analytical software to give a continuous and frequent capture of data
• Can be used to generate raster surfaces in GIS
• Can also be used for analysis of both cliff subsidence and coastal structures (i.e. seawalls/revetments)
• Measurement restricted to a radius of circa 200m from the scanner therefore relatively time consuming to survey long stretches of coast.
• Point clouds can contain considerable noise if sections of coastline are either vegetated (upper beach) or have a high level of anthropogenic use
• Data quality can be affected due to rain and relatively high winds.
An overview of laser scanning (predominantly terrestrial aspects) provided by:
• English Heritage (2011): ‘3D Laser Scanning for Heritage’
An assessment of accuracy (in comparison to other beach survey techniques) is provided by:

Page 108
Method Description and Setting Capabilities Limitations Best Practice/ Supporting Information
• Elsner et al. (2018) ‘Coincident beach surveys using UAS, vehicle mounted and airborne laser scanner: Point cloud inter-comparison and effects of surface type heterogeneity on elevation accuracies.’
Aerial photography and Photogrammetric Profiling
Description: Photographs at a scale of about 1:5000 taken with appropriate overlaps will allow photogrammetric analysis to produce digital ground models, from which changes can be measured with a resolution of circa ±10 cm. Photogrammetry requires ground control points that are carefully surveyed for position (x, y, z), visible from the air and can be replaced at the exact position for subsequent flights (SNH, 2000). Setting: Terrestrial/ inter-tidal
• Relatively high vertical accuracy (±10 cm), provided reference points are available
• Spatial data can be mapped
• Large areas can be mapped synoptically
• It can be difficult to obtain reference points on flat featureless areas
• Data can only be collected in good weather and good light
• Near-shore zone cannot be mapped,
• Hard to obtain full tidal range over large areas
• Considerable manual intervention is required (e.g. to identify break lines).
A good summary of the strengths and weaknesses of this technique are provided in:
• Mason et al. (2000) ‘Beach topography mapping – a comparison of techniques’
Total station theodolite
Description: Total Stations use electronic theodolites in conjunction with a distance meter to read any slope distance from the instrument to any particular spot, using electro-optical scanning techniques. Setting: Terrestrial/ inter-tidal
• Technology is well proven and efficient method for collection of inter-tidal data.
• XYZ co-ordinate data can be collected; profiles can be located in 3-dimensions;
• Vertical heights and position accuracies of 1cm can be obtained at surveyed points on the beach,
• GPS technology provides the ability to re-survey along exactly the same transect;
• Summer and winter surveys repeated annually are possible, as well as supplemental surveys after big storms to determine their effects;
• Items other than height can be monitored, e.g. beach material type
• Accuracy degrades with distance from the instrument.
• Restricted by line of sight from the instrument to the measuring staff
• Difficulties in covering a large area
• Labour intensive method requiring two people to survey a profile.
• Large areas can be sampled only sparsely and relatively infrequently.
• On large intertidal areas, ground survey may be logistically difficult and even dangerous.
• For large areas the method only gives a 1-D view – it does not give a contour map, making it difficult to map spatial data
• There may also be difficulties in choosing a transect which is sufficiently representative of the beach in its local vicinity;
• Difficulties in poor weather, short daylight and certain tide conditions
A good summary of the strengths and weaknesses of this technique are provided in:
• Mason et al. (2000) ‘Beach topography mapping – a comparison of techniques’
A good review of the beach transect measurements given in
• Gorman et al. (1998) ’Monitoring the coastal environment; Part IV: Mapping, shoreline changes, and bathymetric analysis’
Real-Time Kinematic Global positioning system (RTK GPS)
Description: Topographic survey technique based on GPS technology. A minimum of two GPS receivers, linked by radio, are required.
• Faster speed of data capture than for total station providing higher spatial resolution
• More limited than in terms of coverage below water level, than either levelling or total station, since the systems
Summary provided by:
• CCO (2003) ‘Survey Techniques’ (www.channelcoast.org/)

Page 109
Method Description and Setting Capabilities Limitations Best Practice/ Supporting Information
One receiver acts as a base station, providing corrections, the other is a mobile station used for collection of data. Setting: Terrestrial/ inter-tidal
• Particularly well suited to repetitive surveys, with ability for fairly long stretches of coastline to be surveyed from a single base station set up.
• Suitable for both profiling and also continuous data collection of spot height data.
• High vertical accuracy (approx. ±2-3 cm) and horizontal positioning at approx. double the accuracy
• System can be used in conjunction with bathymetric and laser scan survey techniques
contain electronic components that cannot be submerged.
• Consistent coverage and resolution of profiles can be dependent on individual surveyor and/or weather conditions.
• May not be well suited to sites where high, near vertical, cliffs back onto the beach owing to the geometry to the satellites.
• Radio-based setups can experience signal issues between the base and receiver if the section of coastline being surveyed contains multiple embayments and headlands.
X-Band Radar (Sub-tidal bathymetry)1
Description: X-Band radar can be used to determine bathymetry by exploiting the dispersion relation for surface gravity waves. This estimation technique is based on the correlation between the measured and the theoretical sea wave spectra. Both an estimate of depth and current are calculated in tandem using this technique. Setting: Estuarine, coastal and offshore (to depths of approximately 40 m).
• Potential for highly cost effective and automated monitoring of large-areas (~4 km radial range)
• Rapidly deployable platforms
• Spatial resolution is of the order 40 to 80 m depending on wave conditions.
• Error term expected to be less than 10% of true value in most areas (e.g. Ludeno et al. 2015) Can potentially generate a first estimate of a wide area bathymetric map shortly after a few minutes of good quality (high sea clutter) radar imagery has been collected
• Able to generate depth maps remotely through the ‘white ribbon’
• Potential for larger error terms in well sheltered areas due to lack of signal return.
• The radar may be shadowed in some areas
• Potential for high error terms in shallow water caused by the presence of breaking waves (Serafino et al. 2010). However, this can be alleviated by using the newer waterline techniques if the shallow water is intertidal.
• Reduced accuracy at limits of radar coverage.
• The assumption of linear waves (used to derive bathymetry) may lead to an over-estimation of the water depth (Ludeno et al. 2015)
• Absolute accuracy currently lower than modern MBES, but surprisingly good in shallow waters. Water depth limit of circa. 30 to 50m
• Hessner, et al. (2014) ‘High-resolution X-band radar measurements of currents, bathymetry and sea state in highly in-homogenous coastal areas’
• Ludeno et al. (2015) ‘An X-Band Radar System for Bathymetry and Wave Field Analysis in a Harbour Area’
• Bell (2010) ‘Submerged dunes and breakwater embayments mapped using wave inversions of shore-mounted marine X-band radar data’
• Bell & Osler (2011) ‘Mapping bathymetry using X-band marine radar data recorded from a moving vessel’
X-Band Radar (inter-tidal topography)1
Description: X-band radar can effectively image a spatially transgressing wave breaker line as the tide rises and falls. The image intensity is analysed at each pixel through time and shows peaks and troughs as the waterline passes across it. A known tidal record (from a model or from an in-situ gauge) is then used to match each pixel to an elevation resulting in a topographical survey over a large area.
• Covers very large intertidal areas currently between 4 to 6 km maximum radial range from the shore-based radar system.
• Automatically produces surveys every 2 weeks (every spring neap cycle)
• Can be used to isolate impacts of individual storms.
• Can be used in conjunction with other radar techniques to clarify the processes driving sediment migration and
• Specialist instrumentation is required that is potentially expensive and requires careful mounting and setup.
• The collected radar data require bespoke specialist analysis to derive other parameters.
• There is a trade-off between range and resolution, which degrades due to the azimuthal projection of the radar beam.
• Long (2 weeks) warm up time while the tidal pattern is locked on to. Best suited
• Bell et al. (2016) ‘A temporal waterline approach to mapping intertidal areas using X-and marine radar ’
• Bird et al. (2017) ’Radar-based Nearshore Hydrographic Monitoring’
• Bird et al. (2017) ‘Application of marine radar to monitoring seasonal and event-based changes in intertidal morphology’

Page 110
Method Description and Setting Capabilities Limitations Best Practice/ Supporting Information
Setting: Inter-tidal
morphological evolution due to the continuous nature of radar monitoring.
• Pixel-based analysis gives an elevation estimate at each pixel within a radar scan, can be very high resolution if the correct radar antenna is used.
• Potential to achieve high spatial resolution (~3 m) outputs
• Residual changes between surveys are able to quantify volumetric sediment movement, including erosion and accretion.
• Recent methodological advances achieving elevations within ±20 cm of LiDAR across most of the survey area (Bird et al. 2017)
• Although absolute accuracies are lower than LiDAR, the radar provides a continuous time-series of elevation change that is consistent from survey to survey, allowing real changes in morphology to be detected.
for long term deployments where a critical area must be monitored.
• Not as accurate as LiDAR or DGPS surveys.
• Shadowing at longer ranges means deployment site must be ~10 m high. (Although mobile deployment platforms are operated by Marlan Maritime Technologies Ltd.)
X-band radar (Morphological monitoring)
Description: X-Band radar can simultaneously monitor hydrodynamics and morphological change across the nearshore zone over long periods of time. The radar is not as accurate as multibeam subtidal surveys, LiDAR intertidal surveys or in-situ deployments measuring hydrodynamics, but provides comparable data products over a wide area cost-effectively. Setting: Estuarine, coastal and offshore (to depths of approximately 40 m).
• Large stretches of the coast can be continuously monitored for long periods of time in most weather conditions.
• Automated production of data products saves manpower time and cost spent processing data, can be used for data interpretation instead.
• Several radars can be combined to monitor entire sediment cells.
• Sedimentary bedform migration can be tracked.
• Can support survey campaigns by identifying dynamic areas on which to focus in-situ surveys.
• Radar also provides ancillary/ complimentary data products including vessel, bird and mammal (including human) movement within the area observed.
• There are other imaging mechanisms within radar data that potentially allow other oceanographic features to be detected, such as subtidal dune fields, submerged obstructions etc.
• Specialist instrumentation is required that is potentially expensive and requires careful mounting and setup.
• The collected radar data require bespoke specialist analysis to derive other parameters.
• Lower overall accuracy than some established techniques.
• Longer deployment time and required infrastructure means it is not the best option if only snapshot surveys are required and continued monitoring is not of interest.
• Not yet tested on tidal rivers in very sheltered areas.
• Sefton county council winter storm erosion monitoring 2016/17

Page 111
Method Description and Setting Capabilities Limitations Best Practice/ Supporting Information
• Could potentially be mounted on a moving vessel to survey large shallow water areas – in development.
Satellite (Sub-tidal bathymetry)
Description: Satellite Derived Bathymetry (SDB) refers to depths processed from optical satellite imagery, based on the expectation that deeper water appears darker than shallower water. Unlike “active” depth measurement techniques such as echo sounders or LiDAR, where controlled signals are transmitted and received, satellite derived bathymetry is a “passive” technology and is simply measuring the reflected sunlight intensity. Because of this, results are affected by many more uncontrollable environmental factors.(UKHO, 2015) Setting: Coastal
• Good coverage (within depth and image limitations) and better than single-beam echo sounders and lead line
• Better object detection than lead line,
• Good positional accuracy (similar to MBES and SBES) and better than historic lead line.
• Convenient as a tool for examining near shore coastal area before a high resolution hydrographic survey is carried
• Not as good coverage as multi-beam echo sounder and some objects may be missed,
• Depths may only be accurate to approximately ±2 to 3 m (although often better than this) (UKHO, 2015)
• Not as good object detection as single-beam echo sounders used with side scan sonar or a multibeam echo sounder.
• Lesser depth accuracy than multibeam echo sounder, single beam echo sounder and lead line.
• Limited to shallow depths (< approximately 20 m) although ‘cut-off’ depth is different for data acquired in different areas and from different imagery
• Environmental conditions such as water clarity, cloud cover, a sun-glint needs to be considered as it can degrade the accuracy of estimated depth
An excellent overview of the applicability of satellite derived bathymetry (including recommendations for its use in charting) is provided by:
• UKHO (2015) ‘Satellite Derived Bathymetry’
1 There are two separate techniques for surveying bathymetry and topography, one using the dispersion relation equation is used to derive subtidal bathymetry down to ~30-40 m depending on waves. The other (newer) technique is used to derive intertidal topography using the ‘temporal waterline method’ (Bell, 2016). This method tracks the rising and falling waterline in accordance with the tide and use the sequence of pixel intensity changes to match each pixel to a given elevation provided by a tidal record.

Page 112 www.naturalresourceswales.gov.uk
References Abbott VJ. 2017. Bathymetric and tidal measurements and their processing’ In Uncles R., Mitchell S (eds). Estuarine and Coastal Hydrography and Sediment Transport. (pp. 35-53). Cambridge: Cambridge University Press. Barry P., Coakley, R. 2015. Accuracy of UAV photogrammetry compared with network RTK GPS. http://www.c-astral.com/media/uploads/file/Bramor%20Accuracy%20compare_RTK_GPS.pdf. Accessed on 10/01/2018. Battisto, GM. 2000. Field Measurement Of Mixed Grain Size Suspension in the Nearshore Under Waves. MSc Thesis. The College of William and Mary in Virginia. Battisto, G.M., Friedrichs, C.T., Miller, H.C. and Resio, D.T., 1999. Response of OBS to mixed grain size suspensions during Sandy Duck’97. Coastal Sediment Conference 99, ASCE, New York. pp. 297-312. Bell, PS., Bird, CO., Plater, AJ. 2016. A temporal waterline approach to mapping intertidal areas using X-band marine radar, Coastal Engineering, 107: 84-101. Bell PS., Lawrence J., Norris JF. 2012. Determining currents from marine radar data in an extreme current environment at a tidal energy test site. Geoscience and Remote Sensing Symposium (IGARSS), 2012 IEEE International. Bell, P. Osler, J. 2011. Mapping bathymetry using X-band marine radar data recorded from a moving vessel. Ocean Dynamics, 61 (12): 2141-2156. Bell, P. 2010. Submerged dunes and breakwater embayments mapped using wave inversions of shore-mounted marine X-band radar data. Geoscience and Remote Sensing Symposium (IGARSS), 2010 IEEE International. USA, IEEE Geoscience & Remote Sensing Society, 4334 -4337. Bennel JD. 2001. Procedural Guideline No. 1–5 Mosaicing of sidescan sonar images to map seabed features. In Davies, J., Baxter, J., Bradley, M., Connor, D., Khan, J., Murray, E., Sanderson, W., Turnbull, C. & Vincent, M., (eds), Marine Monitoring Handbook, 405 pp. Bird, CO., Sinclair, A., Bell, P., Plater, AJ. 2017. Radar-based Nearshore Hydrographic Monitoring. Hydro International. https://www.hydro-international.com/content/article/radar-based-nearshore-hydrographic-monitoring. Accessed on 09/01/2018. Bird, CO., Bell, P., Plater, A. 2017. Application of marine radar to monitoring seasonal and event-based changes in intertidal morphology. Geomorphology. 285: 1-15. Black K., Poleykett, J., Uncles RJ., Wright MR. 2017. Sediment transport: instrumentation and methodologies. In Uncles R., Mitchell S (eds). Estuarine and Coastal Hydrography and Sediment Transport. (pp. 261-292). Cambridge: Cambridge University Press.

Page 113 www.naturalresourceswales.gov.uk
CCO 2003. Survey Techniques’ (www.channelcoast.org/). Accessed on 08/01/2018. CIRIA 2008. Guidelines for the use of metocean data through the lifecycle of a marine renewable energy development. CIRIA Publication C666. Conner CS., De Visser AM. 1992. A laboratory investigation of particle size effects on an optical backscatterance sensor, In Marine Geology, Volume 108, Issue 2, 1992, Pages 151-159. Cooper K., Mason, C. 2014. Regional Seabed Monitoring Plan (RSMP): Protocol for Sample Collection and Processing. Version 4.0. Crutchley, GJ., Kopp, H. 2017. Reflection and Refraction Seismic Methods. In: Submarine Geomorphology. ed. by Micallef, A. Springer, Cham, pp. 43-62. Davies, J., Baxter, J., Bradley, M., Connor, D., Khan, J., Murray, E., Sanderson, W., Turnbull, C. & Vincent, M., (2001), Marine Monitoring Handbook, 405 pp Dankert, H., Rosenthal, W. 2004, Ocean surface determination from X-band radar-image sequences, J. Geophys. Res.,109, . Dearnley MP., Spearman JR., Feates NG. 1995. Inter comparison of in-situ particle size and settling velocity measurements. HR Wallingford Report SR444. Eleftheriou A., McIntyre, A. 2005. Methods for the Study of Marine Benthos, Third Edition. Blackwell Science Ltd, Oxford, UK. Elsner P., Dornbusch U., Thomas I., Amos D., Bovington J., Horn D. 2018. Coincident beach surveys using UAS, vehicle mounted and airborne laser scanner: Point cloud inter-comparison and effects of surface type heterogeneity on elevation accuracies. Remote Sensing of Environment 208: 15-26. Emery WJ., Thomson RE. 2001. Data Analysis Methods in Physical Oceanography. Elsevier, 654pp. English Heritage 2011. 3D Laser Scanning for Heritage. English Heritage 42pp. Gommenginger C. 2016. Measuring Ocean Waves from Space. Presentation at the Royal Meteorological Society National Meeting ‘The Importance of Ocean Waves’. 20/04/2016, London. Gorman L., Morang A., Larson R. 1998.Monitoring the coastal environment; Part IV: Mapping, shoreline changes, and bathymetric analysis. Journal of Coastal Research 14: 61-92. Hailwood EA., Kidd, R. 1990. Marine Geological Surveying and Sampling. Springer, 168 pp.

Page 114 www.naturalresourceswales.gov.uk
Hessner, K., Reichert, K., Borge, J.C.N. et al. 2014. High-resolution X-band radar measurements of currents, bathymetry and sea state in highly inhomogenous coastal areas. Ocean Dynamics 64(7): 989–998. Hopkins, A. 2007. Recommended operating guidelines (ROG) for swath bathymetry. Manning AJ., Whitehouse RJS., Uncles RJ. 2017. Suspended particulate matter: the measurement of flocs. In Uncles R., Mitchell S (eds). Estuarine and Coastal Hydrography and Sediment Transport. (pp. 211-260). Cambridge: Cambridge University Press. Manning AJ., Baugh JV., Soulsby RJ., Spearman JR., Whitehouse RJS. 2011. Cohesive Sediment Flocculation and the Application to Settling Flux Modelling. In Ginsberg SS (ed). Sediment Transport. InTech. MESH Project. Available from: http://www.emodnet-seabedhabitats.eu/PDF/GMHM3_Swath_Bathymetry_ROG.pdf. Accessed on 08/01/2018. Horstmann, J.; Nieto-Borge, J.C.; Seemann, J.; Carrasco, R.; Lund, B. 2015. Wind, wave, and current retrieval utilizing X-band marine radars. In Coastal Ocean Observing Systems; Liu, Y., Kerkering, H., Weisberg, R.H., Eds.; Academic Press: London, UK, 2015; pp. 281–304. Hoyt, WH., J. M. Demarest II. 1981. Vibracoring in coastal environments; the R.V. Phryne II barge and associated coring methods. University of Delaware, Sea Grant Program, Newark, DE, DEL-SG-01-81, 34 p. Hughes Clarke, JE. 2017. Multibeam Echosounders’ In: Submarine Geomorphology. ed. by Micallef, A. Springer, Cham, pp. 25-41. Hughes Clarke, JE., Mayer, L.A. & Wells, D.E. 1996. Shallow-water imaging multibeam sonars: A new tool for investigating seafloor processes in the coastal zone and on the continental shelf. Marine Geophysical Researches 18: 607-629. Jones GE., Abbott VJ., Manning AJ., Jakt M. 2017. Acoustic seabed survey methods, analysis and applications. In Uncles R., Mitchell S (eds). Estuarine and Coastal Hydrography and Sediment Transport. (pp. 54-91). Cambridge: Cambridge University Press. Joseph, J. 2014. Measuring Ocean Currents: Tools, Technologies, and Data. Elsevier, 448 pp. Judd A. 2011. Guidelines for data acquisition to support marine environmental assessments for offshore renewable energy projects. Cefas contract report: ME5403 – Module 15. Kenny, AJ., Cato, A., Desprez, M., Fader, G., Schüttenhelm, RTE., Side, J. 2003. An overview of seabed-mapping technologies in the context of marine habitat classification , ICES Journal of Marine Science, Volume 60, Issue 2, 1 pp 411–418.

Page 115 www.naturalresourceswales.gov.uk
Klaucke I. 2017 Sidescan Sonar. In Micallef A., Krastell S., Savini A (eds). Submarine Geomorphology. (pp. 13-24). Springer. Lambkin, D.O., Harris, J.M., Cooper, W.S., Coates, T. 2009. Coastal Process Modelling for Offshore Wind Farm Environmental Impact Assessment: Best Practice Guide. COWRIE. Ludeno G., Reale F., Dentale F., Carratelli EP., Natale A., Soldovieri, F., Serafino F. 2015. An X-Band Radar System for Bathymetry and Wave Field Analysis in a Harbour Area. Sensors 2015, 15, 1691-1707. Mason, C. 2016. NMBAQC’s Best Practice Guidance: Particle Size Analysis (PSA) for Supporting Biological Analysis Mason DC., Gurney C., Kennett, M. 2000. Beach topography mapping – a comparison of techniques. Journal of Coastal Conservation 6: 113-124. McCann, DL., Bell PS. 2014. Marine radar derived current vector mapping at a planned commercial tidal stream turbine array in the Pentland Firth, U.K. Oceans - St. John's, St. John's, NL, 2014, pp. 1-4. Mitchell S., Uncles R., Stephens J. 2017. Suspended particulate matter: sampling and analysis. In Uncles R., Mitchell S (eds). Estuarine and Coastal Hydrography and Sediment Transport. (pp. 1-34). Cambridge: Cambridge University Press. Nieto Borge, JC., Hessner, K., Reichert, K. 1999. Estimation of the Significant Wave Height with X-Band Nautical Radars. OMAE99/OSU-3063. Nieto JC., Reichert, K., Dittmer J. 1999. Use of Nautical Radar as a Wave Monitoring Instrument. Coastal Engineering 37, 331–342 NOAA. 2012. LiDAR 101:An Introduction to LiDAR Technology, Data, and Applications. National Oceanic and Atmospheric Administration (NOAA) Coastal Services Center: Coastal Geospatial Services Division Coastal Remote Sensing Program NORSOK 2010. NORSOK Standard N-002: Collection of metocean data, Edition 2 (October 2010), Standards Norway (Norway) OGP 2011. HSE guidelines for metocean and Arctic surveys, Report No. 477, International Association of Oil and Gas Producers OGP, 2003, HS&E guidelines for metocean surveys, Report No. 348, International Association of Oil and Gas Producers. Pandian, P., Emmanuel, O., Ruscoe, J., Side, J., Harris, R., Kerr, S., Bullen, CR. 2010. An overview of recent technologies on wave and current measurement in coastal and marine applications. J. Oceanogr. Mar. Sci.. 1.

Page 116 www.naturalresourceswales.gov.uk
Parker, J., Rees, J. 2014. Technical Guideline No. 06– Deployment of current meter moorings. PREMIAM Report by Cefas. Parrish CE. 2012. Shoreline Mapping. in Advances in Mapping from Remote Sensor Imagery: Techniques and Applications, Boca Raton, Florida: CRC Press, Taylor and Francis Group, 2012. Pye, K., Blott, S., Brown, J. 2017. Advice to Inform Development of Guidance on Marine, Coastal and Estuarine Physical Processes Numerical Modelling Assessments. NRW Report No: 208, 139 pp, Natural Resources Wales, Cardiff. SNH 2011. Guidance on survey and monitoring in relation to marine renewables deployments in Scotland. Scottish Natural Heritage. SNH, 2000. A guide to managing coastal erosion in beach/dune systems. http://www.snh.org.uk/publications/on-line/heritagemanagement/erosion/appendix_2.shtml. Accessed on 08/01/2018. Souza AJ. 2017. Temperature, salinity, density and current measurements and analysis. In Uncles R., Mitchell S (eds). Estuarine and Coastal Hydrography and Sediment Transport. (pp. 92-114). Cambridge: Cambridge University Press. UKHO 2015. Satellite Derived Bathymetry. Paper for Consideration by the Chart Standardization and Paper Chart Working Group 11th CSPWG Meeting. Uncles R., Mitchell, S. 2017. Estuarine and coastal hydrography and sediment transport. Cambridge University Press. 366pp van Rijn, LC. 2007. Manual of Sediment Transport Measurements in Rivers, Estuaries and Coastal Seas. Aqua Publications, Amsterdam. Wall GR., Nystrom EA., Litten S. 2006. Use of an ADCP to Compute Suspended Sediment Discharge in the Tidal Hudson River, New York. U.S. Geological Survey Scientific Investigations Report 2006-5055. Ware S., Kenny AJ. 2011. Guidelines for the Conduct of Benthic Studies at Aggregate Extraction Sites. MEPF. Whitehouse RJS., Soulsby RL., Roberts W., Mitchener HJ. 2000. Dynamics of Estuarine Muds: A Manual for Practical Applications. Thomas Telford, London 210pp. Wolf, J. 2017. Measurement and analysis of waves in estuarine and coastal waters. In Uncles R., Mitchell S (eds). Estuarine and Coastal Hydrography and Sediment Transport. (pp. 115-152). Cambridge: Cambridge University Press. Young, IR., Rosenthal, W., Ziemer, F. 1985. A Three-dimensional analysis of marine radar images for the determination of ocean wave directionality and surface currents. Journal of Geophysical Research 90: 1049-1059.

Page 117 www.naturalresourceswales.gov.uk
Data Archive Appendix No data outputs were produced as part of this project.

Published by: Natural Resources Wales Cambria House 29 Newport Road Cardiff CF24 0TP 0300 065 3000 © Natural Resources Wales [2018] All rights reserved. This document may be reproduced with prior permission of Natural Resources Wales Further copies of this report are available from: Email: [email protected]