Embed Size (px)
Citation preview
GT Sim Sickness Screening Protocol - 1
Georgia Tech School of Psychology Tech Report GT-PSYC-TR-2013-01
Georgia Tech Simulator Sickness Screening Protocol
Georgia Tech School of Psychology Tech Report GT-PSYC-TR-2013-01
Thomas M. Gable & Bruce N. Walker
[email protected], [email protected]
October 21, 2013
Sonification Lab
School of Psychology
Georgia Institute of Technology
654 Cherry Street
Atlanta, GA, USA
http://sonify.psych.gatech.edu
Phone: +1-404-894-8265
GT Sim Sickness Screening Protocol - 2
Georgia Tech School of Psychology Tech Report GT-PSYC-TR-2013-01
ABSTRACT
We discuss the development of the Georgia Tech Simulator Sickness Screening Protocol
(GTSSSP), a new, efficient, and effective driving simulator sickness screening method.
Simulator sickness can cause a small but significant proportion of driving research participants to
feel ill. In addition to the unpleasant symptoms and discomfort, simulator sickness can impact
driving performance, and may lead to withdrawal from a study and the loss of time and data.
There is an ongoing need for an efficient prospective method to identify participants who are
likely to experience simulator sickness, before it happens. Existing screening methods have been
either purely survey-based, relying on reported tendencies to experience motion sickness; or they
can identify when a participant is becoming ill, but are not designed to predict illness. Thus, we
developed a screening procedure that includes a baseline survey (administered via an in-vehicle
touchscreen interface), a brief but effective screening drive in the simulator, and a post-drive
follow-up survey. The survey software automatically scores the participant’s pre- and post-drive
responses, leading to a recommendation for continuing or exiting the driving study; and data are
logged for later analysis and longitudinal evaluations. The GTSSSP was developed for the
simulator at Georgia Tech, but is intended to be made available for deployment elsewhere. This
paper points to previous work in the area through a short literature review, and then discusses the
process of creating the screening procedure, followed by instructions for how to use the GTSSSP
protocol.
Keywords: Driving, Driving Simulator, Simulator Sickness

GT Sim Sickness Screening Protocol - 3
Georgia Tech School of Psychology Tech Report GT-PSYC-TR-2013-01
1. INTRODUCTION
Driving simulators are becoming increasingly pervasive and popular, as they enable more
affordable and safe driving research than real vehicle driving, Simulators can place participants
in driving situations that would otherwise be too dangerous, logistically complicated, or
expensive to replicate in real life [1]. Technological advances are further expanding the
capabilities and realism of simulators, and bringing down costs and complexity. While there are
many positives about driving simulators, a major drawback in their use, and what some believe
could prevent virtual environments from reaching their full potential, is simulator sickness (SS)
[7].
1.1 Simulator Sickness
SS is similar to motion sickness (MS) but the physical and mental feelings are usually
somewhat less severe, and SS does not occur in as high a proportion of people [6]. SS symptoms
can include headache, dry mouth, drowsiness, disorientation, dizziness, and in some cases nausea
and vomiting [1, 2, 6]. There is an ongoing debate about the causes of SS; for a thorough
overview see the excellent overview by Brooks and colleagues [1]. Most researchers agree that
in fixed-based simulators, SS is related to elements of the visual experience. However, there
remains some debate as to whether SS can be completely eliminated through technological
improvements to the simulator, or whether some people will always be susceptible to illness [6,
7]. SS can have adverse consequences on an experiment. Side effects such as decreases in
psychomotor control can potentially affect performance data, and can also affect participant drop
out rates [2]. Any loss of participants, and therefore data, can be particularly costly (both in time
and money) to the research project.
GT Sim Sickness Screening Protocol - 4
Georgia Tech School of Psychology Tech Report GT-PSYC-TR-2013-01
SS is also an important topic for researchers to consider for ethical reasons. IN all
research—including studies involving driving simulators—there is a need to avoid harming the
subjects in any way [1]. Thus, it is important to monitor participants, and regularly check for
signs they are becoming ill from the simulated driving. If they are showing symptoms, their
participation can be halted. This is, in fact, the main goal behind the careful development of a
simulator sickness assessment survey at Clemson University [1]. However, the discomfort and
illness of SS can often have a fairly early rapid onset (especially for older drivers), and can
persist well after the end of the simulated driving [1]. Thus, it is imperative not only to monitor
the development of SS symptoms, but to proactively screen out individuals who are likely to
develop SS, before they even begin their participation in a driving study. [7] That, then, was the
impetus behind the development of the GT SSSP.
1.2 Preventing Simulator Sickness
There are a number of factors concerning the simulators themselves that can affect the
prevalence of SS. Physical factors such as the temperature of the environment where the
simulator is being used can affect the prevalence—a cooler temperature can help to decrease
levels of SS [1], and we have found that a gentle breeze from a fan can help. While researchers
have some control over these types of physical factors of the simulators they use, many factors
such as the viewing angle, simulator type, and hardware choices cannot be changed retroactively.
Some factors that researchers can control are related to the scenarios that the participants
drive. For instance, some studies have found that many turns and shallow curves may increase
levels of SS [8, 10]. Scenarios with intersections have also been found to increase SS, as have
simulations where drivers had to perform non-severe braking [10, 11]. In one study when
participants drove on a simulated highway they were found to have higher rates of SS symptoms
GT Sim Sickness Screening Protocol - 5
Georgia Tech School of Psychology Tech Report GT-PSYC-TR-2013-01
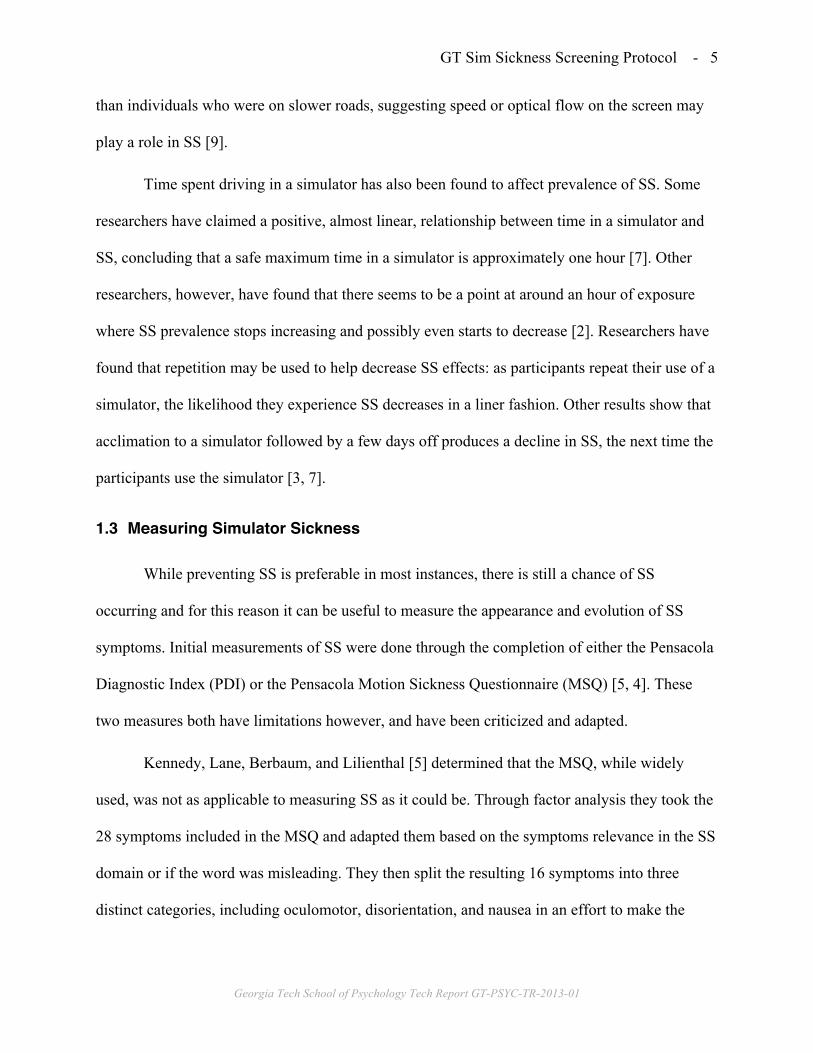
than individuals who were on slower roads, suggesting speed or optical flow on the screen may
play a role in SS [9].
Time spent driving in a simulator has also been found to affect prevalence of SS. Some
researchers have claimed a positive, almost linear, relationship between time in a simulator and
SS, concluding that a safe maximum time in a simulator is approximately one hour [7]. Other
researchers, however, have found that there seems to be a point at around an hour of exposure
where SS prevalence stops increasing and possibly even starts to decrease [2]. Researchers have
found that repetition may be used to help decrease SS effects: as participants repeat their use of a
simulator, the likelihood they experience SS decreases in a liner fashion. Other results show that
acclimation to a simulator followed by a few days off produces a decline in SS, the next time the
participants use the simulator [3, 7].
1.3 Measuring Simulator Sickness
While preventing SS is preferable in most instances, there is still a chance of SS
occurring and for this reason it can be useful to measure the appearance and evolution of SS
symptoms. Initial measurements of SS were done through the completion of either the Pensacola
Diagnostic Index (PDI) or the Pensacola Motion Sickness Questionnaire (MSQ) [5, 4]. These
two measures both have limitations however, and have been criticized and adapted.
Kennedy, Lane, Berbaum, and Lilienthal [5] determined that the MSQ, while widely
used, was not as applicable to measuring SS as it could be. Through factor analysis they took the
28 symptoms included in the MSQ and adapted them based on the symptoms relevance in the SS
domain or if the word was misleading. They then split the resulting 16 symptoms into three
distinct categories, including oculomotor, disorientation, and nausea in an effort to make the
GT Sim Sickness Screening Protocol - 6
Georgia Tech School of Psychology Tech Report GT-PSYC-TR-2013-01
measure more multidimensional [4]. The resulting measure was simpler and had improved
diagnostic capability from the MSQ and was named the simulator sickness questionnaire (SSQ).
Years later another set of researchers made an attempt to improve upon the current ways
of measuring SS. Gianaros et al. [4] argue that multiple response systems may be activated by
real or apparent motion and that when an individual states they are feeling SS they are most
likely referring to a complex set of symptoms. Additionally they stated that some of these
response systems may be more involved than others in the negative effects felt during SS.
Gianaros et al. determined that the best way to measure SS would be through a questionnaire that
created a score for each of these dimensions, not one total score, allowing the survey to address
component parts of SS. They decided to include four dimensions in their measure including
gastrointestinal, central, peripheral, and sopite (i.e., fatigue)-related, the last of which was new in
diagnosing and measuring SS. Gianaros and his fellow researchers ended up with a final list of
16 words including: sick to stomach, faint-like, annoyed/irritated, sweaty, queasy, lightheaded,
drowsy, clammy/cold sweat, disoriented, tired/fatigued, nauseated, hot/warm, dizzy, like I am
spinning, as if I may vomit, and uneasy. Each of these factors were scored from 1 to 9 on
severity and then scores were calculated. The completed questionnaire results were highly
correlated with PDI scores indicating a good measurement for motion sickness. This become
known as the motion sickness assessment questionnaire (MSAQ) and is another common
measure of SS.
As the need for more refined SS assessment and screening continued, Brooks and
colleagues evaluated the SSQ and the MSAQ surveys [1]. The researchers decided that the
MSAQ was more applicable to the identification of SS symptoms, but only after adapting the
scale used in the survey from a 1 to 9 scale to a 0 to 10 scale. This adaptation was done because
GT Sim Sickness Screening Protocol - 7
Georgia Tech School of Psychology Tech Report GT-PSYC-TR-2013-01
participants wanted to be able to rate their symptoms on a 0 (none) to 10 (maximum) range,
rather than 1 to 9 [1]. The new questionnaire was administered after an acclimation session of
driving, and after each session of driving in the research study. Brooks et al. reported that they
were able to preemptively identify individuals who were likely to discontinue their participation
in a driving study, at great than 90% accuracy [1]. While this is an effective way to know if a
participant is becoming sick during your study, and should therefore stop driving, it is not useful
as a true pre-screening tool to identify those individuals who should not even start driving in
your simulator study.
1.4 Predictive Screening for Simulator Sickness
Measuring SS symptoms as they occur can be helpful in an attempt to decrease the
likelihood of participants experiencing more severe SS, or for it to affect data, but sometimes
considering these factors is not enough; a method to truly predict sickness must be employed [1].
Asking participants about previous MS or SS episodes, or their propensity to get motion-related
illness has been used, but with only limited utility, likely because the SS that participants in a
driving study may experience are only partially related to any MS symptoms they may have
experienced in the past. [1, 11]
In our experience (and this view is shared by other researchers we have spoken to),
individuals who are going to develop symptoms of SS will often begin to do so very soon after
driving, within the first minute or two. Others have written about the use of acclimation
scenarios to help ease participants into the simulated driving experience, and to try to reduce the
SS prevalence [1]. In contrast, our approach was to create a brief driving scenario to introduce
the participant to simulated driving maneuvers that could trigger a slight feeling of SS. The key
to this is to have enough SS-inducing maneuvers or situations so that the participants who will
GT Sim Sickness Screening Protocol - 8
Georgia Tech School of Psychology Tech Report GT-PSYC-TR-2013-01
normally experience SS can quantify the increase in SS during the short drive (and thus stop, and
not even start in the main driving session); but not so much SS induction that the individual feels
particularly uncomfortable. Similarly the maneuvers should be slight enough that someone who
will not usually experience SS during an experimental driving session does not “over-induced”
into SS during the screening process. That is, the assessment needs to be both sensitive and
specific. Finally, one must consider the time constraints of a study and attempt to keep the
driving scenario brief in order to not increase overall study durations significantly.
The current protocol is an attempt to strictly define a protocol to be used for predictively
screening for SS in the National Advanced Driving Simulator (NADS) MiniSim located in the
School of Psychology at Georgia Institute of Technology. The goals for the protocol are to be
efficient with time, effective (sensitive and specific), and involve a simple implementation for
the researcher. The remainder of this paper provides more details of the creation and proper
implementation of the surveys and the scenario that are involved in this procedure.
2. PROTOCOL DEVELOPMENT
2.1 Overview
The GT Simulator Sickness Screening Protocol (GTSSSP) is a brief, efficient method of
predicting whether a research participant will experience symptoms of simulator sickness during
a subsequent research drive. The protocol involves (1) a computer-based baseline survey of the
participant’s current state, followed by (2) a brief driving scenario intended to uncover latent
tendencies toward illness, and then (3) a post-drive re-administration of the survey (with
immediate and automated scoring of the responses). Based on the score after the second survey,
GT Sim Sickness Screening Protocol - 9
Georgia Tech School of Psychology Tech Report GT-PSYC-TR-2013-01
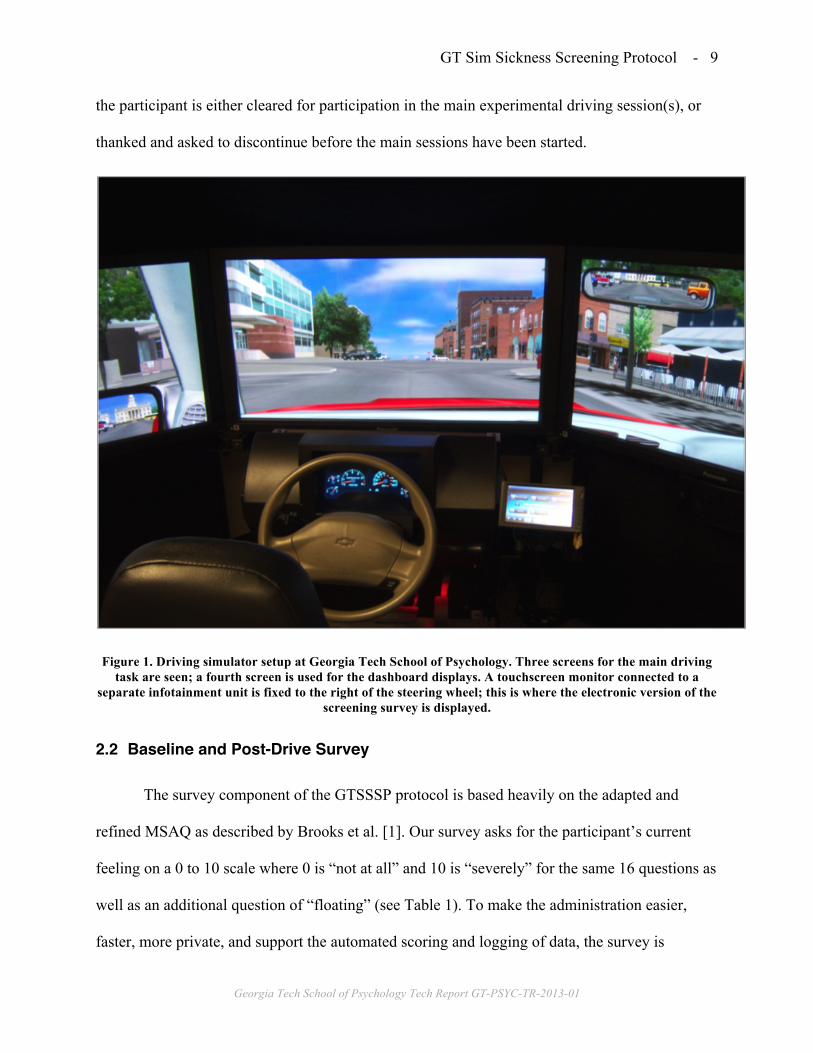
the participant is either cleared for participation in the main experimental driving session(s), or
thanked and asked to discontinue before the main sessions have been started.
Figure 1. Driving simulator setup at Georgia Tech School of Psychology. Three screens for the main driving task are seen; a fourth screen is used for the dashboard displays. A touchscreen monitor connected to a
separate infotainment unit is fixed to the right of the steering wheel; this is where the electronic version of the screening survey is displayed.
2.2 Baseline and Post-Drive Survey
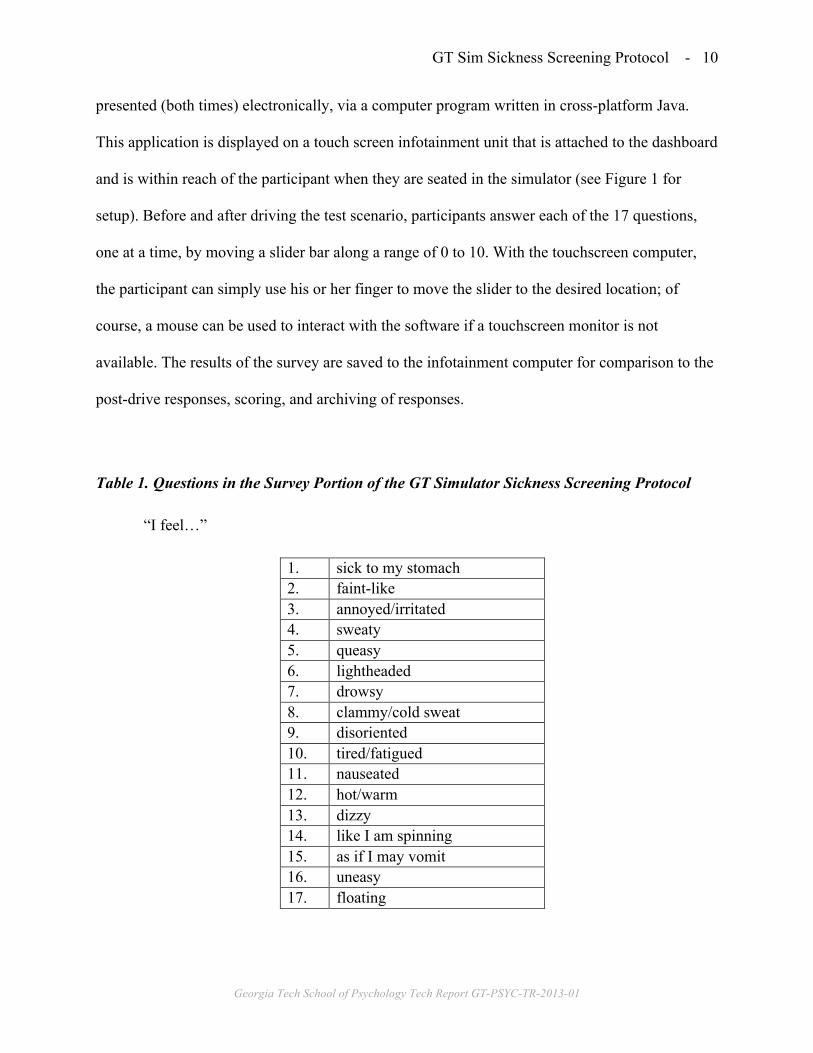
The survey component of the GTSSSP protocol is based heavily on the adapted and
refined MSAQ as described by Brooks et al. [1]. Our survey asks for the participant’s current
feeling on a 0 to 10 scale where 0 is “not at all” and 10 is “severely” for the same 16 questions as
well as an additional question of “floating” (see Table 1). To make the administration easier,
faster, more private, and support the automated scoring and logging of data, the survey is
GT Sim Sickness Screening Protocol - 10
Georgia Tech School of Psychology Tech Report GT-PSYC-TR-2013-01
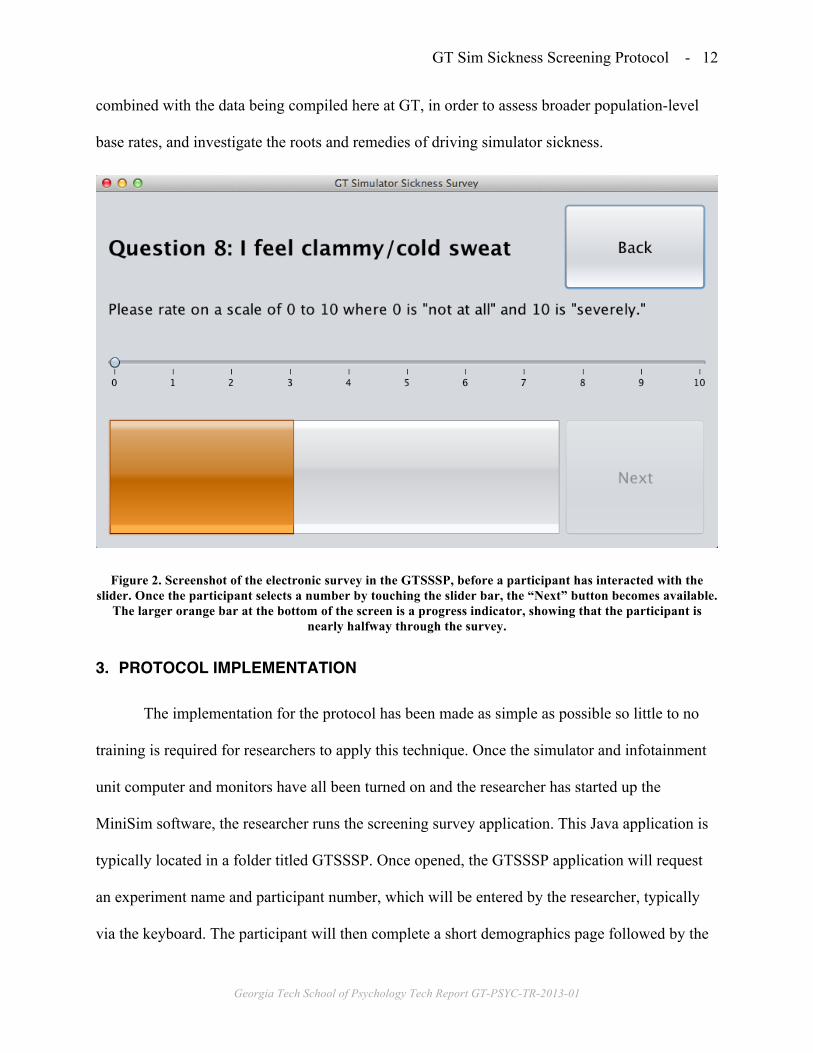
presented (both times) electronically, via a computer program written in cross-platform Java.
This application is displayed on a touch screen infotainment unit that is attached to the dashboard
and is within reach of the participant when they are seated in the simulator (see Figure 1 for
setup). Before and after driving the test scenario, participants answer each of the 17 questions,
one at a time, by moving a slider bar along a range of 0 to 10. With the touchscreen computer,
the participant can simply use his or her finger to move the slider to the desired location; of
course, a mouse can be used to interact with the software if a touchscreen monitor is not
available. The results of the survey are saved to the infotainment computer for comparison to the
post-drive responses, scoring, and archiving of responses.
Table 1. Questions in the Survey Portion of the GT Simulator Sickness Screening Protocol
“I feel…”
1. sick to my stomach 2. faint-like 3. annoyed/irritated 4. sweaty 5. queasy 6. lightheaded 7. drowsy 8. clammy/cold sweat 9. disoriented 10. tired/fatigued 11. nauseated 12. hot/warm 13. dizzy 14. like I am spinning 15. as if I may vomit 16. uneasy 17. floating
GT Sim Sickness Screening Protocol - 11
Georgia Tech School of Psychology Tech Report GT-PSYC-TR-2013-01
2.3 Scenario
The scenario used in the GTSSS protocol was created using the MiniSim creation tool
ISAT. While creating the scenario, factors that can increase SS were considered and some were
employed to increase the likelihood of an individual experiencing SS, without creating a scenario
that was going to be unrealistic or create more experiences of SS than the typical research
driving scenarios would. The scenarios include intersections, non-severe braking, and gentle
curves. Optic flow was also implemented through other traffic passing the driver, but due to
limits on time the speed was never increased to a full highway level.
The simulation begins with the participant at a stop at the side of the road. There is one
lane going in each direction, with traffic moving in both directions. Instructions on the simulator
screen instruct the driver to put the car in drive and proceed down the road amongst the traffic.
Participants then have to stop at a stoplight; when the light turns green the participants proceed
through the intersection. (We have noted that nearly all of the participants who experience any
symptoms will already begin to notice them by the time they come to the first stop light.) Soon,
the road begins to curve to the left and changes to two lanes going in each direction. After
navigating the curve, the cars ahead of the driver begin slowing down to a stop; the participant
driver does the same. Instructions then appear on the simulator screen, telling the driver to put
the car in spark and complete the post drive survey. The driver simulation ends after about two
minutes of driving time.
2.4 Data Logs
The pre- and post-drive surveys are logged in a plain text file for future analysis. These
data can be aggregated within a lab to monitor overall rates of SS symptoms. They may also be
GT Sim Sickness Screening Protocol - 12
Georgia Tech School of Psychology Tech Report GT-PSYC-TR-2013-01
combined with the data being compiled here at GT, in order to assess broader population-level
base rates, and investigate the roots and remedies of driving simulator sickness.
Figure 2. Screenshot of the electronic survey in the GTSSSP, before a participant has interacted with the slider. Once the participant selects a number by touching the slider bar, the “Next” button becomes available.
The larger orange bar at the bottom of the screen is a progress indicator, showing that the participant is nearly halfway through the survey.
3. PROTOCOL IMPLEMENTATION
The implementation for the protocol has been made as simple as possible so little to no
training is required for researchers to apply this technique. Once the simulator and infotainment
unit computer and monitors have all been turned on and the researcher has started up the
MiniSim software, the researcher runs the screening survey application. This Java application is
typically located in a folder titled GTSSSP. Once opened, the GTSSSP application will request
an experiment name and participant number, which will be entered by the researcher, typically
via the keyboard. The participant will then complete a short demographics page followed by the
GT Sim Sickness Screening Protocol - 13
Georgia Tech School of Psychology Tech Report GT-PSYC-TR-2013-01
17 questions (one per page; see Table 1) that make up the baseline pre-drive survey. On each of
the pages a single question is displayed and the participant rates their current feeling on that
factor. To respond, participants move a slider with their finger, between values of 0 and 10,
before going on to the next question. Participants must interact with the slider before being able
to move forward in the survey but can always move backwards to change previous answers if
necessary (See Figure 2 for an example).
After the survey is completed the application will instruct the participant to complete the
2-minute driving scenario; at this point the researcher initiates the simulated driving scenario via
the MiniSim control computer. The participant drives through the scenario as they would in a
regular vehicle, observing all traffic laws. Following completion of the driving scenario
participants return to the post-drive survey on the infotainment computer, and respond to the
same 17 questions (no demographics) based on their current feelings.
Once the post-drive survey is completed, the computer tallies the answers for the 17
questions and a score is calculated and displayed discreetly on the final page (see Figure 3 for
example). The score is then used to determine if an individual should continue to participate. For
the paper version of the protocol the scoring is defined as “If any single rating on the post-drive
survey is greater than or equal to 5 more than pre-drive survey, or if any three of the ratings on
the post-drive survey are above a 3 as compared to the pre-drive survey, it is recommended that
the participant not continue.” Therefore the electronic form gives a 1 for every 3-point increase
in any question and a 3 for any 5-point increase; and if any score total is higher than 3, the
participant should not continue. Additionally, if at any point during the evaluation scenario the
participant feels any symptoms of SS it is recommended the simulation be discontinued and the
participant not continue. If a participant completes this protocol without any signs of SS they
GT Sim Sickness Screening Protocol - 14
Georgia Tech School of Psychology Tech Report GT-PSYC-TR-2013-01
may then continue in the experiment sessions. However, if a participant does show any signs of
SS, attempts should be made to make them as comfortable as possible, while the symptoms
subside. This involves turning off the simulator screens, letting them stay seated (or moving
them to a more comfortable chair if they desire), and possibly giving them water. Participants
who have shown initial signs of SS during this screening protocol typically have not developed
severe symptoms or significant discomfort, due to the brevity of the screening drive (that is part
of the point of this screening protocol). As a result, their symptoms also generally fade quite
quickly and they are generally ready to be dismissed from the study in a few minutes.
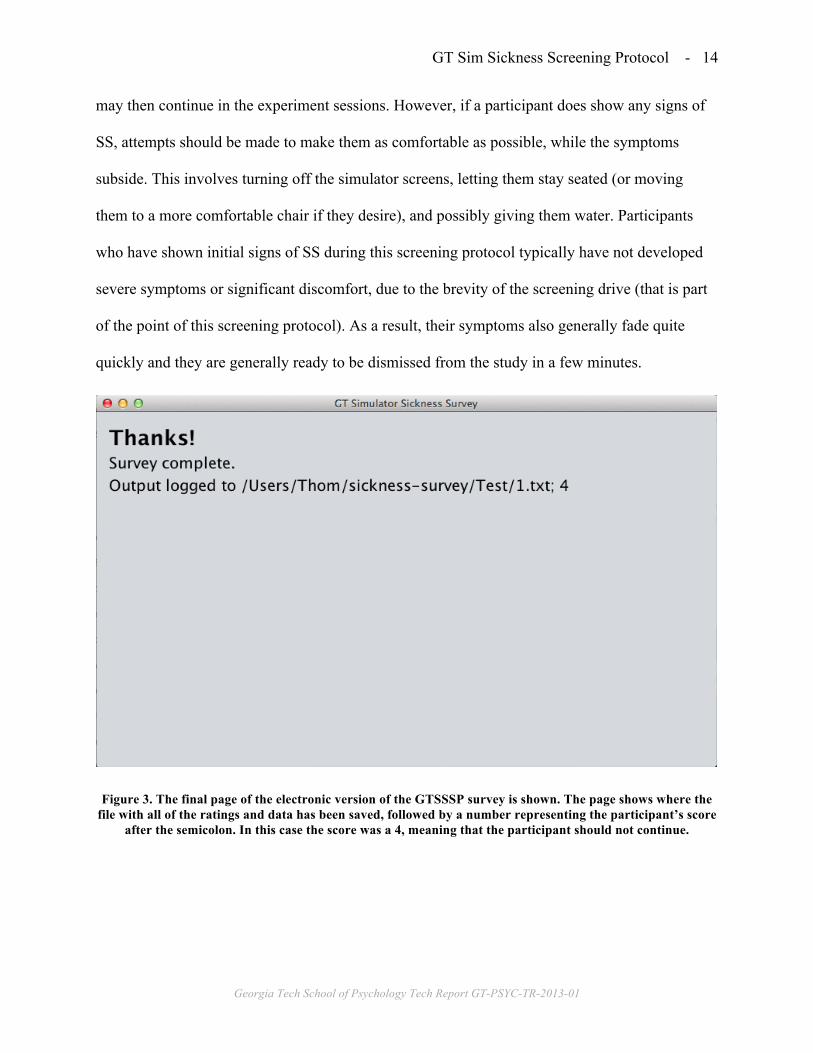
Figure 3. The final page of the electronic version of the GTSSSP survey is shown. The page shows where the file with all of the ratings and data has been saved, followed by a number representing the participant’s score
after the semicolon. In this case the score was a 4, meaning that the participant should not continue.
GT Sim Sickness Screening Protocol - 15
Georgia Tech School of Psychology Tech Report GT-PSYC-TR-2013-01
4. DISCUSSION
The application of this simulator sickness screening protocol is intended to help both
participants and experimenters who are taking part in research involving a driving simulator,
especially—but not necessarily—the NADS MiniSim. It is the authors’ expectations that by
applying this predictive screening protocol before every driving simulator study individuals who
are prone to SS will be identified quickly before the actual experiment begins with a high rate of
success and reliability. In doing so this will save participants who are sickness prone from
starting a study and then feeling the need to push on even though they feel sick. It will also assist
experimenters in saving time not only in addressing participants who will become SS part way
though the experiment but in not spending too much time attempting to screen for SS.
5. ACKNOWLEDGMENTS
Thanks to Ben Stolvitz for creating the touch screen application used in this study and to
the people at Nation Advanced Driving Simulator and Brianna Tomlinson for helping us
to finalize the driving scenario. Portions of this work are supported by a National
Science Foundation Graduate Research Fellowship (DGE-1148903).
6. REFERENCES
[1] Brooks, J. O., Goodenough, R. R., Crisler, M. C., Klein, N. D., Alley, R. L., Koon, B. L., ...
& Wills, R. F. (2010). Simulator sickness during driving simulation studies. Accident
Analysis & Prevention, 42(3), 788-796.
[2] Cobb, S. V., Nichols, S., Ramsey, A., & Wilson, J. R. (1999). Virtual reality-induced
symptoms and effects (VRISE). Presence: Teleoperators and Virtual Environments, 8(2),
169-186.

GT Sim Sickness Screening Protocol - 16
Georgia Tech School of Psychology Tech Report GT-PSYC-TR-2013-01
[3] Domeyer, J. E., Cassavaugh, N. D., & Backs, R. W. (2013). The use of adaptation to reduce
simulator sickness in driving assessment and research. Accident Analysis & Prevention.
[4] Gianaros, P. J., Muth, E. R., Mordkoff, J. T., Levine, M. E., & Stern, R. M. (2001). A
questionnaire for the assessment of the multiple dimensions of motion sickness. Aviation,
space, and environmental medicine, 72(2), 115.
[5] Graybiel, A., Wood, C. D., Miller, E. F., & Cramer, D. B. (1968). Diagnostic criteria for
grading the severity of acute motion sickness (No. NAMI-1030). NAVAL AEROSPACE
MEDICAL INST PENSACOLA FLA.
[6] Kennedy, R. S., Lane, N. E., Berbaum, K. S., & Lilienthal, M. G. (1993). Simulator sickness
questionnaire: An enhanced method for quantifying simulator sickness. The international
journal of aviation psychology, 3(3), 203-220.
[7] Kennedy, R. S., Stanney, K. M., & Dunlap, W. P. (2000). Duration and exposure to virtual
environments: Sickness curves during and across sessions. Presence: Teleoperators and
Virtual Environments, 9(5), 463-472.
[8] Lee, G. C., Yoo, Y., & Jones, S. (1997). Investigation of driving performance, vection,
postural sway, and simulator sickness in a fixed-based driving simulator. Computers &
industrial engineering, 33(3), 533-536.
[9] Mourant, R. R., & Thattacherry, T. R. (2000, July). Simulator sickness in a virtual
environments driving simulator. In Proceedings of the Human Factors and Ergonomics
Society Annual Meeting (Vol. 44, No. 5, pp. 534-537). SAGE Publications.
[10] Roe, C., Brown, T., & Watson, G. (2007). Factors Associated with Simulator Sickness in a
High-Fidelity Simulator. Education, 251, 5A.
[11] Watson, G. (2000, July). A synthesis of simulator sickness studies conducted in a high-
fidelity driving simulator. In Proceedings of Driving Simulation Conference (pp. 69-78).