Embed Size (px)
Citation preview
GSK Data Visualization:Successful Integration of Enterprise Level Delivery of Spotfire® Tools combined with Technical Expertise from Clinical Programming is Transforming Data Analytics at GlaxoSmithKline.
GSK: Data Visualization
2017 PhUSE SDERaritan, NJ08JUN17
Authors:Daniel Schramek; Manager Oncology Clinical ProgrammingJason W. Szewczyk; Head of Data Visualization Organization (DVO)
GlaxoSmithKline; Collegeville, PA
Successful Integration of Enterprise Level Delivery of Spotfire® Tools Combined with Technical Expertise from Clinical
Programming is Transforming Data Analytics at GlaxoSmithKline
GSK Data Visualization PhUSE SDE 2017 Raritan 2
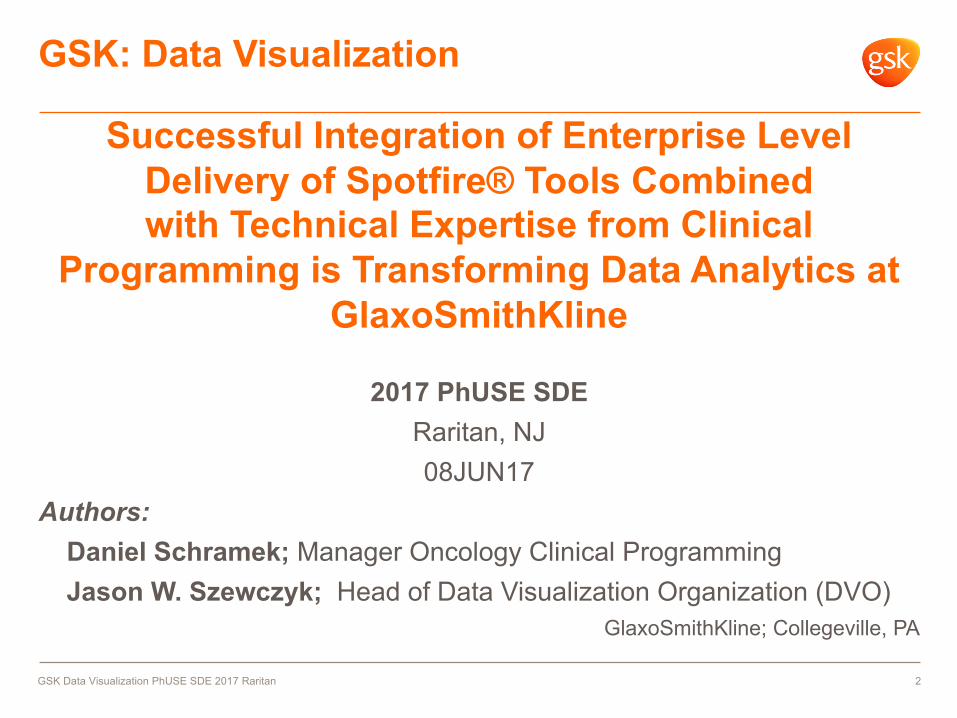
Agenda
– Data Visualization Principles – Text/Tables/Figures
– Benefits/Features of Spotfire®
– Integration of Data Visualization & Scalable Enterprise Level Delivery (ELD) Model
– Keys & Lessons Learned from Successful ELD Implementation
– Examples of Clinical Programming collaboration and integrated data analysis using Spotfire®
GSK Data Visualization PhUSE SDE 2017 Raritan 3
The graphs rendered herein are not referenced to any specific GSK study or asset, contain no personally identifiable information, and are shown for demonstrative
purposes only.
Data Visualization Principles –Text/Tables/Figures
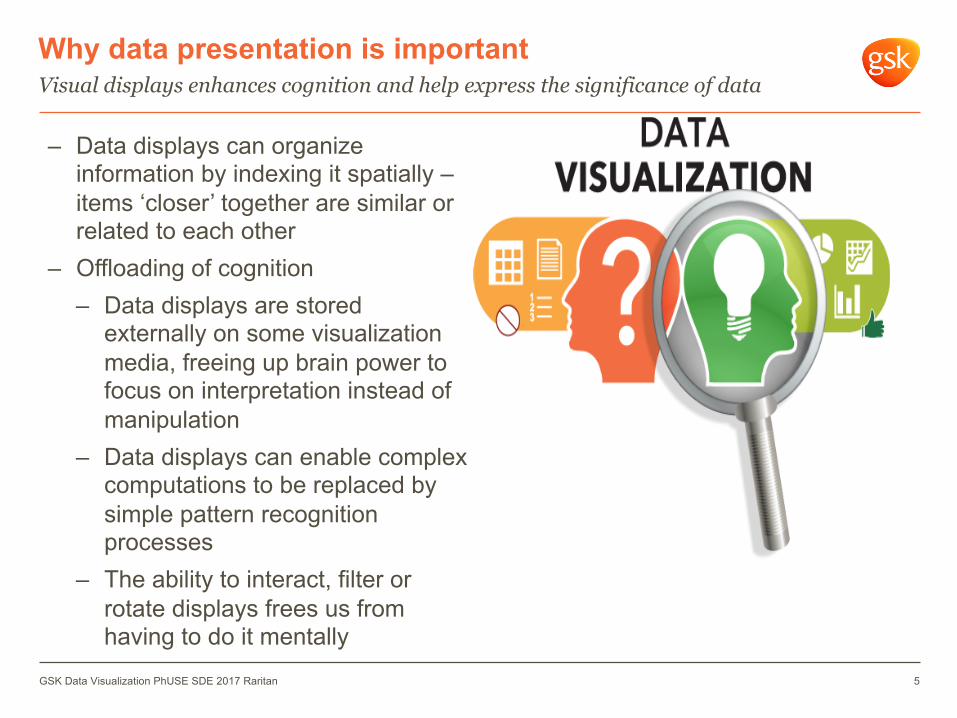
Why data presentation is importantVisual displays enhances cognition and help express the significance of data
GSK Data Visualization PhUSE SDE 2017 Raritan 5
– Data displays can organize information by indexing it spatially –items ‘closer’ together are similar or related to each other
– Offloading of cognition– Data displays are stored
externally on some visualization media, freeing up brain power to focus on interpretation instead of manipulation
– Data displays can enable complex computations to be replaced by simple pattern recognition processes
– The ability to interact, filter or rotate displays frees us from having to do it mentally
Why data visualization is important
– Upper Management, Regulators, Healthcare Providers, Patients
– The key stakeholders:– May be naïve to the details of the study design, objectives
or history of the disease– May be less quantitatively and analytically skilled than the
data analyst – The design of the data display will directly affect the ease or
difficulty of interpretation of the intended message
Communication of information to key stakeholders
GSK Data Visualization PhUSE SDE 2017 Raritan 6
Data Visualizations
– Use text for simple or headline results which can be stated in a single sentence
– Use text when a statement or written description can clearly and succinctly convey information and results without the need for tables or graphs
– When you want to leave no room for misinterpretation by the audience
– Use text when communication is limited to text
Types of data displays - Text
GSK Data Visualization PhUSE SDE 2017 Raritan 7
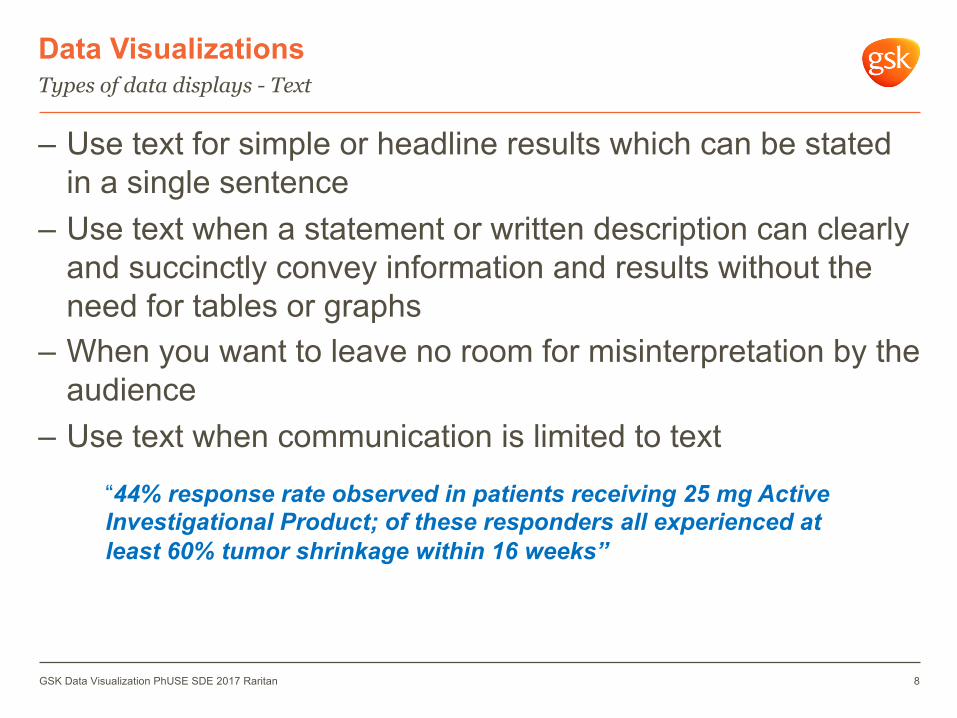
Data Visualizations
– Use text for simple or headline results which can be stated in a single sentence
– Use text when a statement or written description can clearly and succinctly convey information and results without the need for tables or graphs
– When you want to leave no room for misinterpretation by the audience
– Use text when communication is limited to text
Types of data displays - Text
GSK Data Visualization PhUSE SDE 2017 Raritan 8
“44% response rate observed in patients receiving 25 mg Active Investigational Product; of these responders all experienced at least 60% tumor shrinkage within 16 weeks”
Data Visualizations
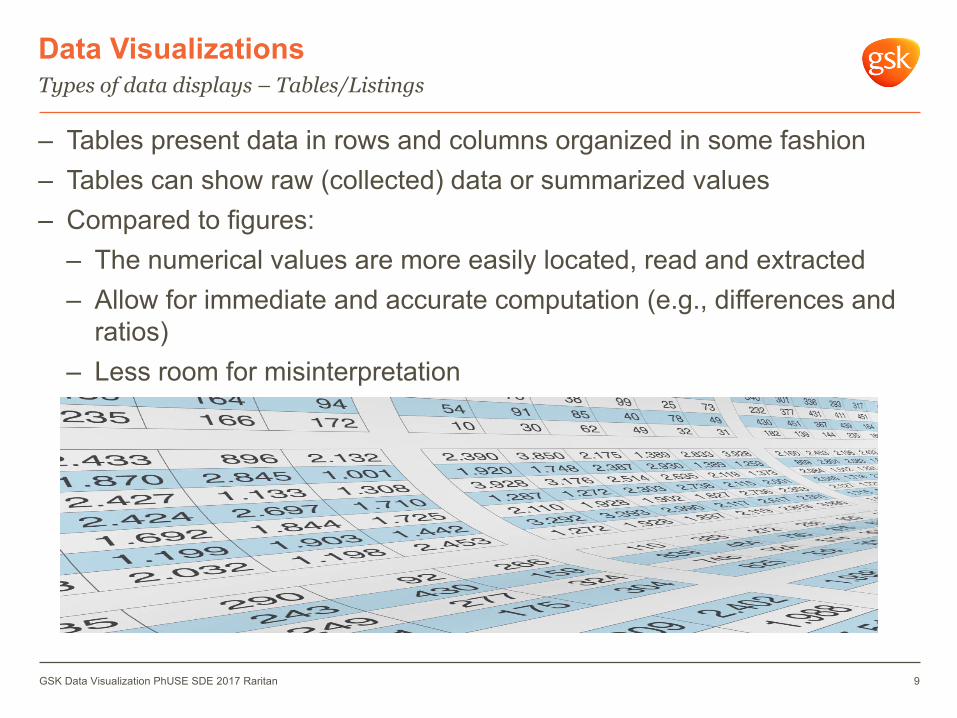
– Tables present data in rows and columns organized in some fashion– Tables can show raw (collected) data or summarized values– Compared to figures:
– The numerical values are more easily located, read and extracted– Allow for immediate and accurate computation (e.g., differences and
ratios)– Less room for misinterpretation
Types of data displays – Tables/Listings
GSK Data Visualization PhUSE SDE 2017 Raritan 9
Data VisualizationsTypes of data displays – Figures/Graphs
GSK Data Visualization PhUSE SDE 2017 Raritan 10
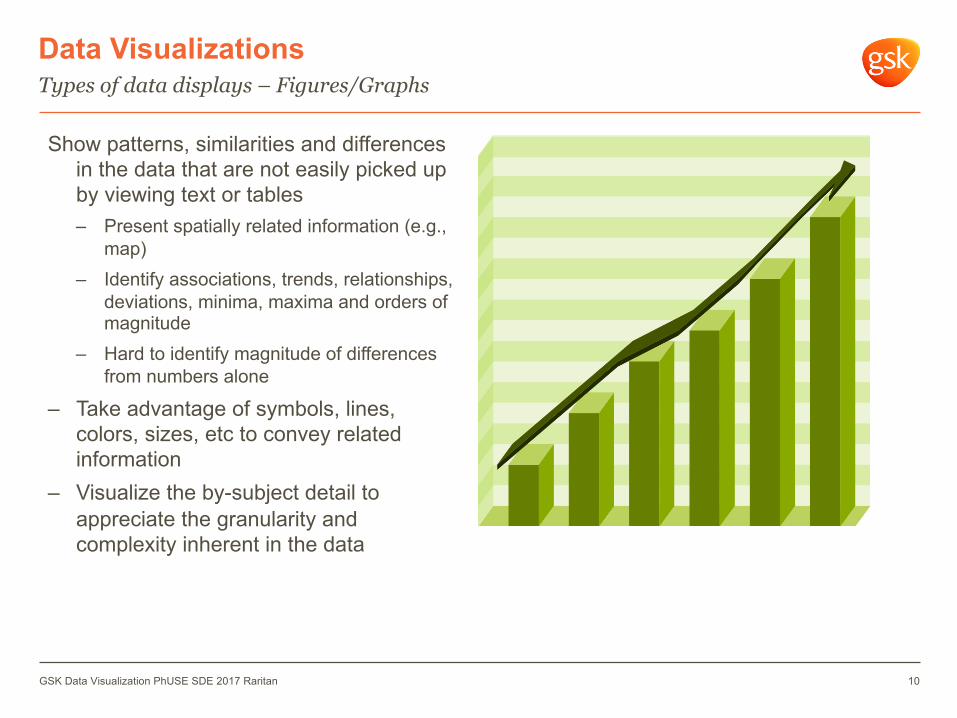
Show patterns, similarities and differences in the data that are not easily picked up by viewing text or tables– Present spatially related information (e.g.,
map)– Identify associations, trends, relationships,
deviations, minima, maxima and orders of magnitude
– Hard to identify magnitude of differences from numbers alone
– Take advantage of symbols, lines, colors, sizes, etc to convey related information
– Visualize the by-subject detail to appreciate the granularity and complexity inherent in the data
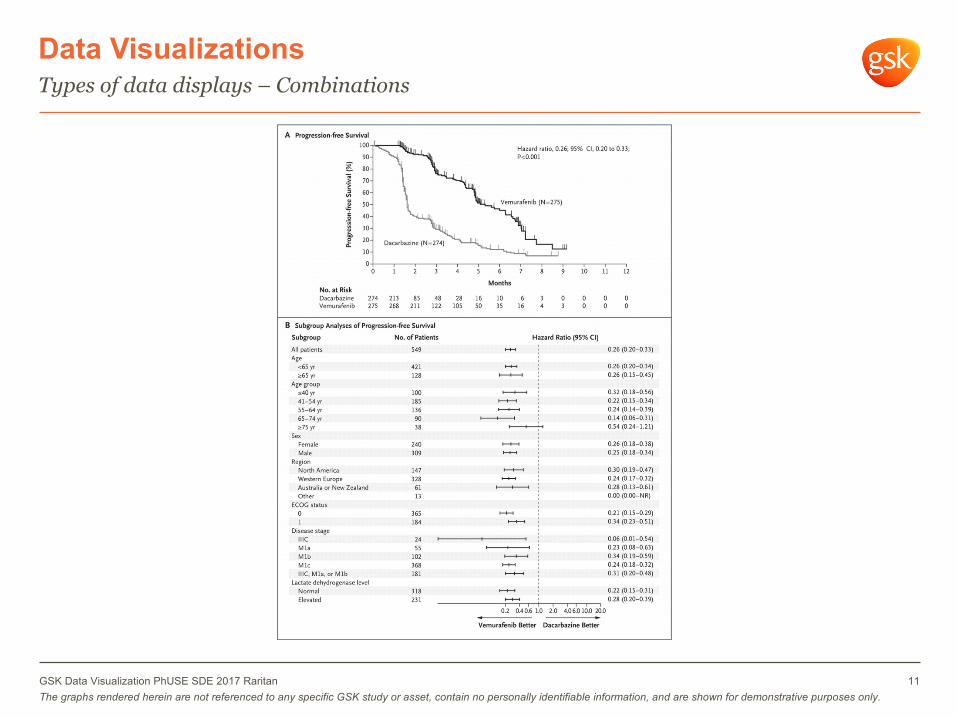
Data VisualizationsTypes of data displays – Combinations
GSK Data Visualization PhUSE SDE 2017 RaritanThe graphs rendered herein are not referenced to any specific GSK study or asset, contain no personally identifiable information, and are shown for demonstrative purposes only.
11
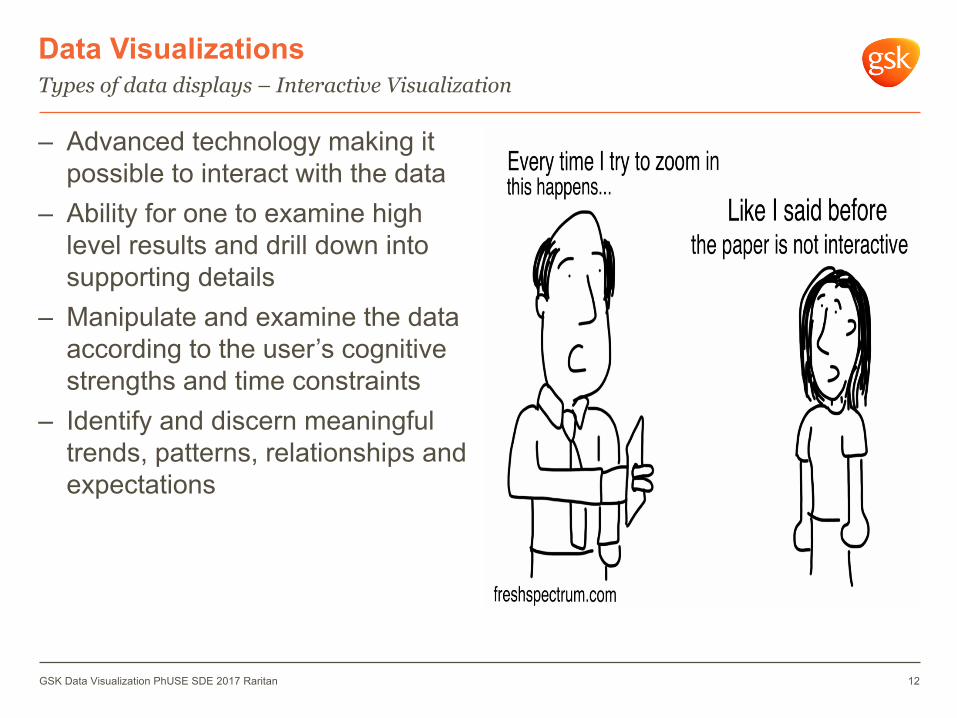
Data Visualizations
– Advanced technology making it possible to interact with the data
– Ability for one to examine high level results and drill down into supporting details
– Manipulate and examine the data according to the user’s cognitive strengths and time constraints
– Identify and discern meaningful trends, patterns, relationships and expectations
Types of data displays – Interactive Visualization
GSK Data Visualization PhUSE SDE 2017 Raritan 12
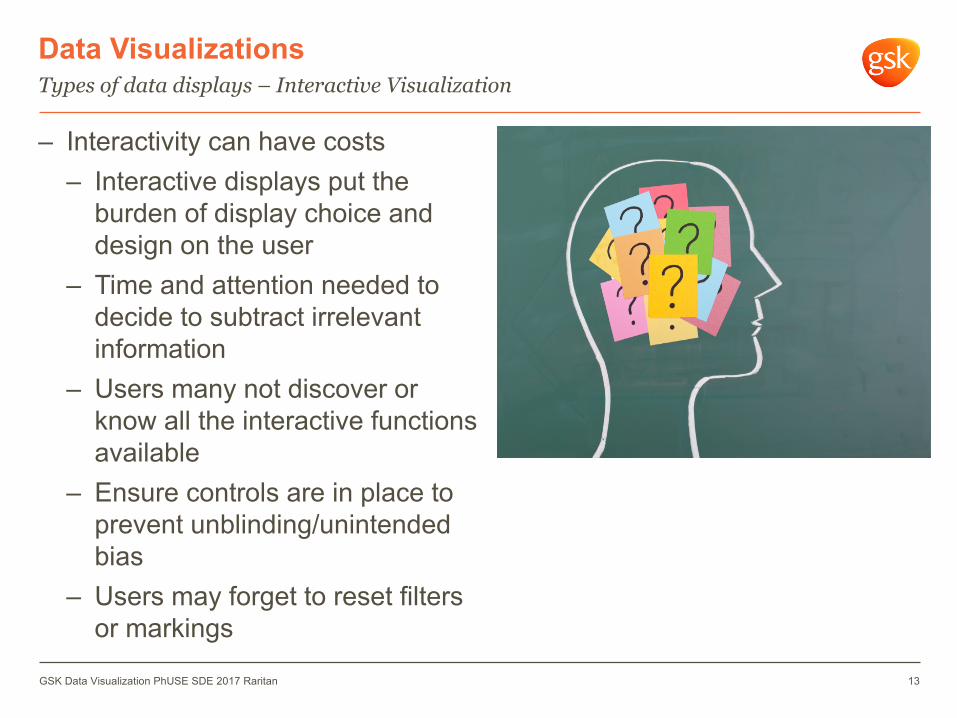
Data Visualizations
– Interactivity can have costs– Interactive displays put the
burden of display choice and design on the user
– Time and attention needed to decide to subtract irrelevant information
– Users many not discover or know all the interactive functions available
– Ensure controls are in place to prevent unblinding/unintended bias
– Users may forget to reset filters or markings
Types of data displays – Interactive Visualization
GSK Data Visualization PhUSE SDE 2017 Raritan 13

Benefits/Features of Spotfire®
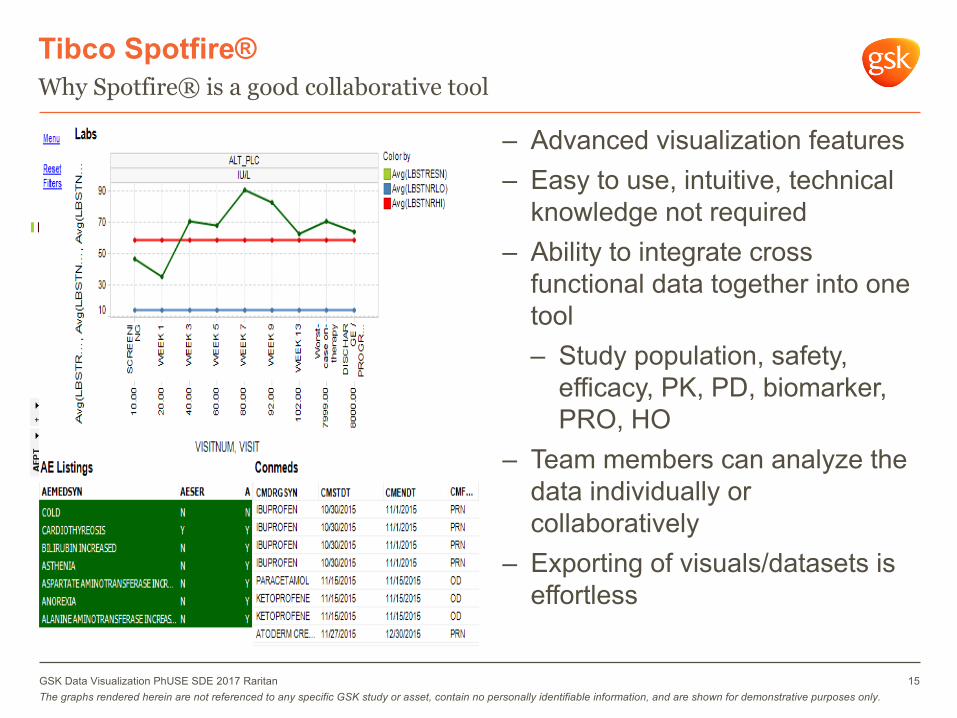
Tibco Spotfire®
– Advanced visualization features– Easy to use, intuitive, technical
knowledge not required– Ability to integrate cross
functional data together into one tool – Study population, safety,
efficacy, PK, PD, biomarker, PRO, HO
– Team members can analyze the data individually or collaboratively
– Exporting of visuals/datasets is effortless
Why Spotfire® is a good collaborative tool
15GSK Data Visualization PhUSE SDE 2017 RaritanThe graphs rendered herein are not referenced to any specific GSK study or asset, contain no personally identifiable information, and are shown for demonstrative purposes only.
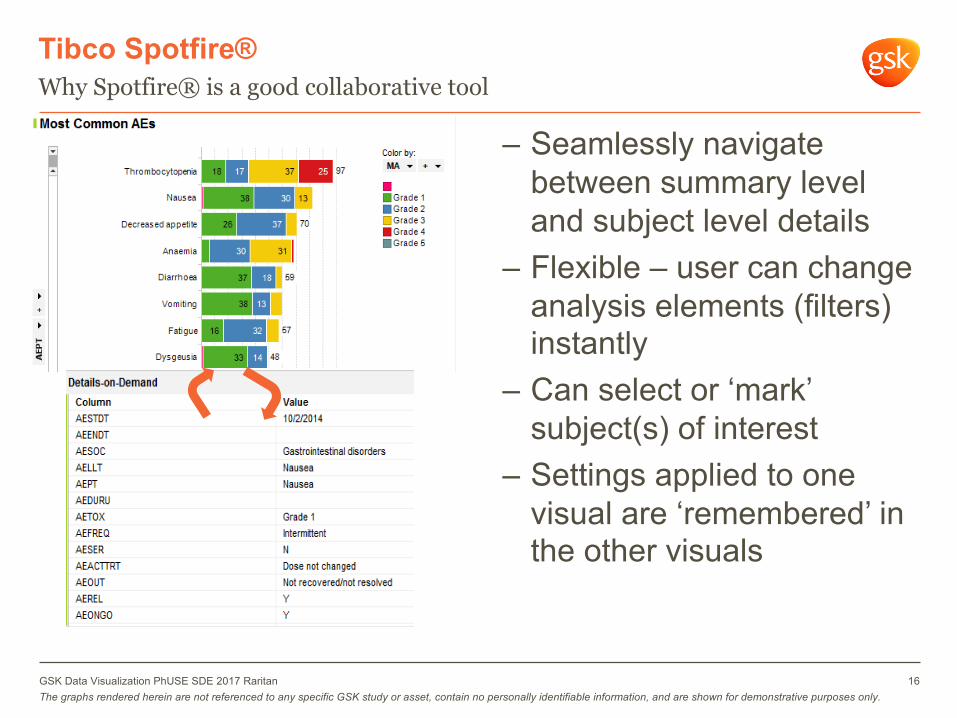
Tibco Spotfire®
– Seamlessly navigate between summary level and subject level details
– Flexible – user can change analysis elements (filters) instantly
– Can select or ‘mark’ subject(s) of interest
– Settings applied to one visual are ‘remembered’ in the other visuals
Why Spotfire® is a good collaborative tool
GSK Data Visualization PhUSE SDE 2017 RaritanThe graphs rendered herein are not referenced to any specific GSK study or asset, contain no personally identifiable information, and are shown for demonstrative purposes only.
16
Integration of Data Visualization & Scalable Enterprise Level Delivery (ELD) Model
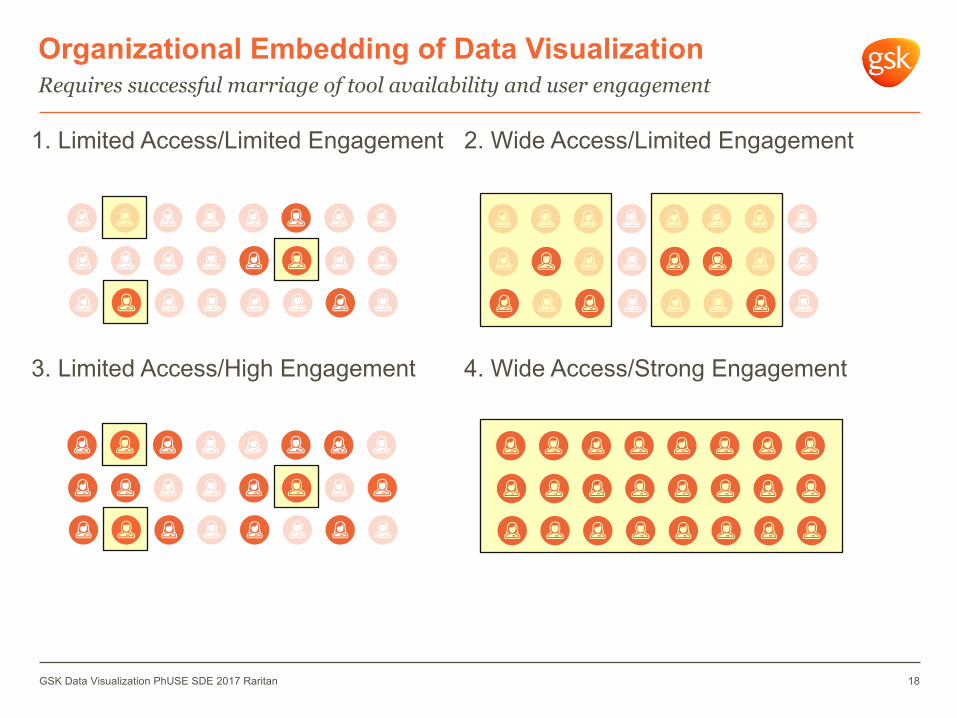
Organizational Embedding of Data VisualizationRequires successful marriage of tool availability and user engagement
GSK Data Visualization PhUSE SDE 2017 Raritan 18
1. Limited Access/Limited Engagement 2. Wide Access/Limited Engagement
4. Wide Access/Strong Engagement3. Limited Access/High Engagement
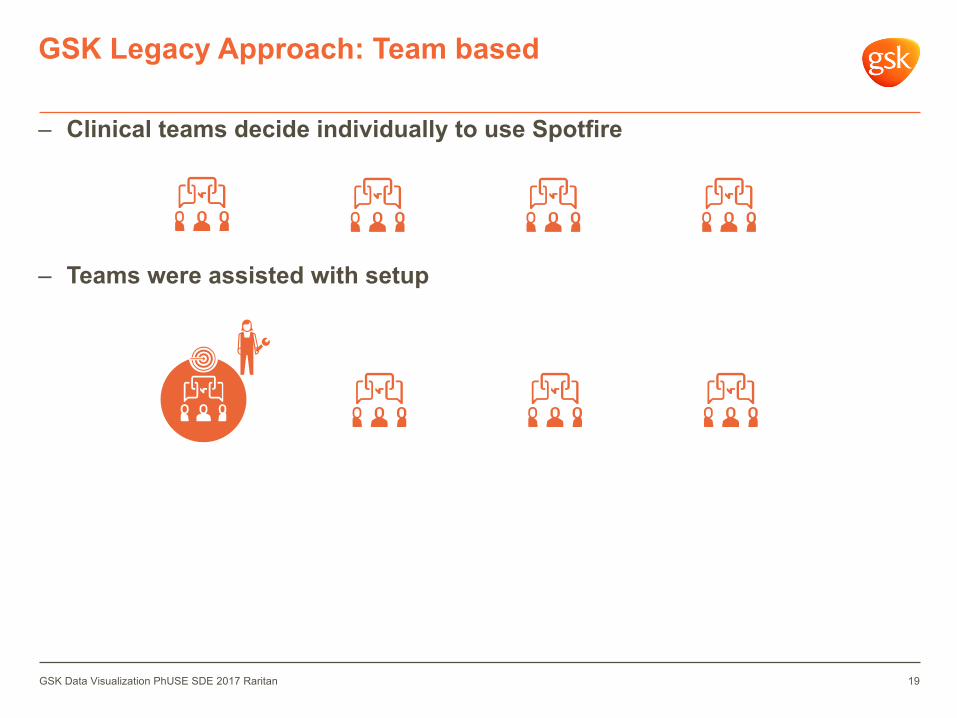
– Clinical teams decide individually to use Spotfire
– Teams were assisted with setup
GSK Legacy Approach: Team based
19GSK Data Visualization PhUSE SDE 2017 Raritan
GSK Legacy Approach: Team based
20GSK Data Visualization PhUSE SDE 2017 Raritan
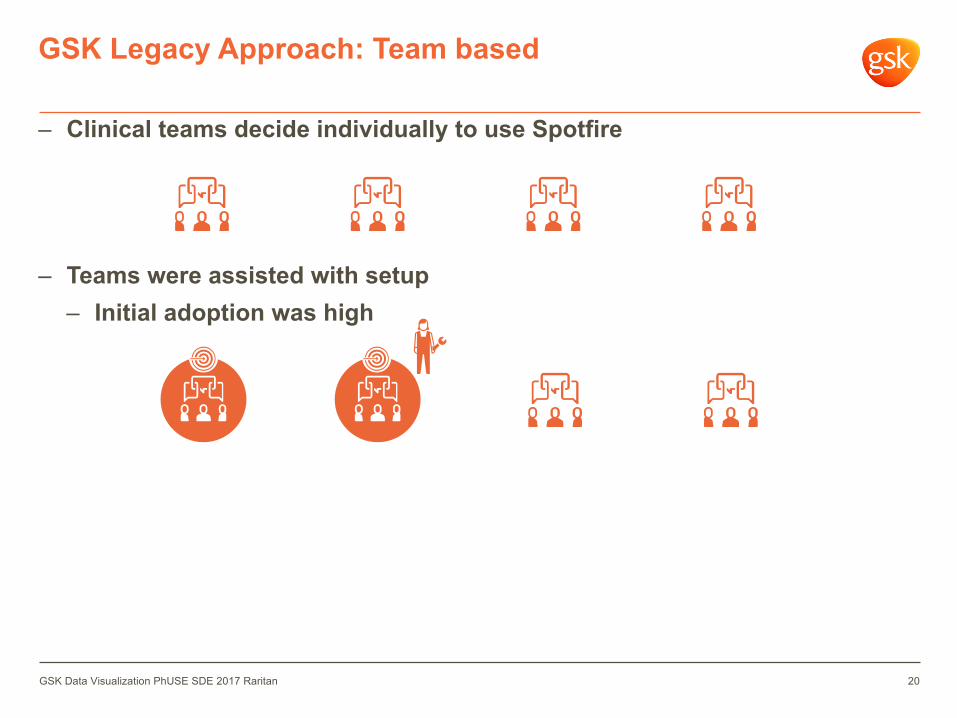
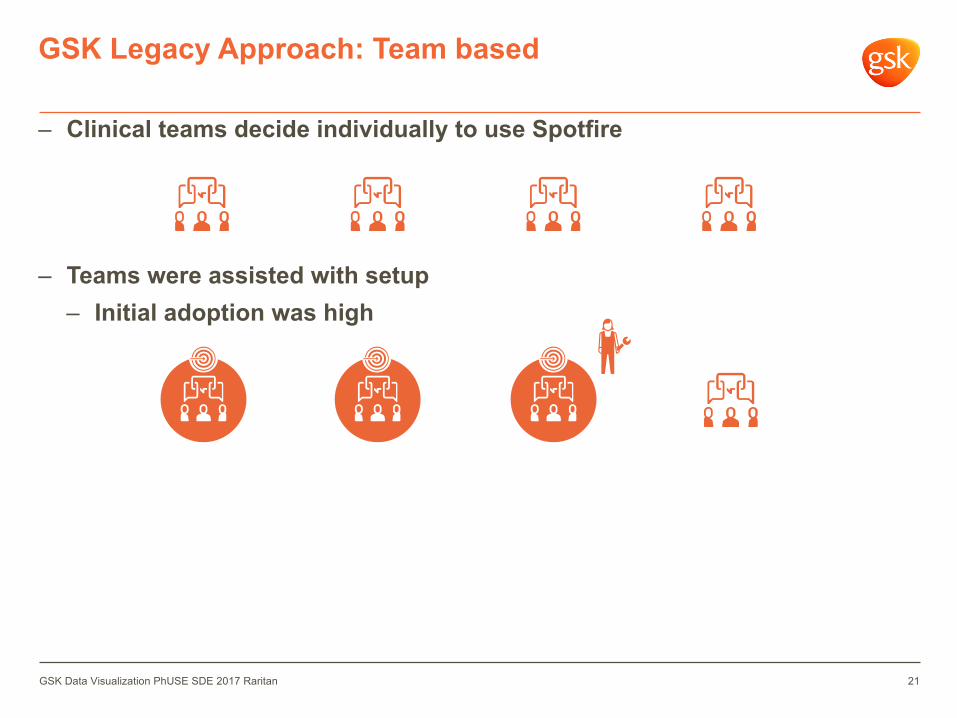
– Clinical teams decide individually to use Spotfire
– Teams were assisted with setup – Initial adoption was high
GSK Legacy Approach: Team based
21GSK Data Visualization PhUSE SDE 2017 Raritan
– Clinical teams decide individually to use Spotfire
– Teams were assisted with setup – Initial adoption was high
GSK Legacy Approach: Team based
22GSK Data Visualization PhUSE SDE 2017 Raritan
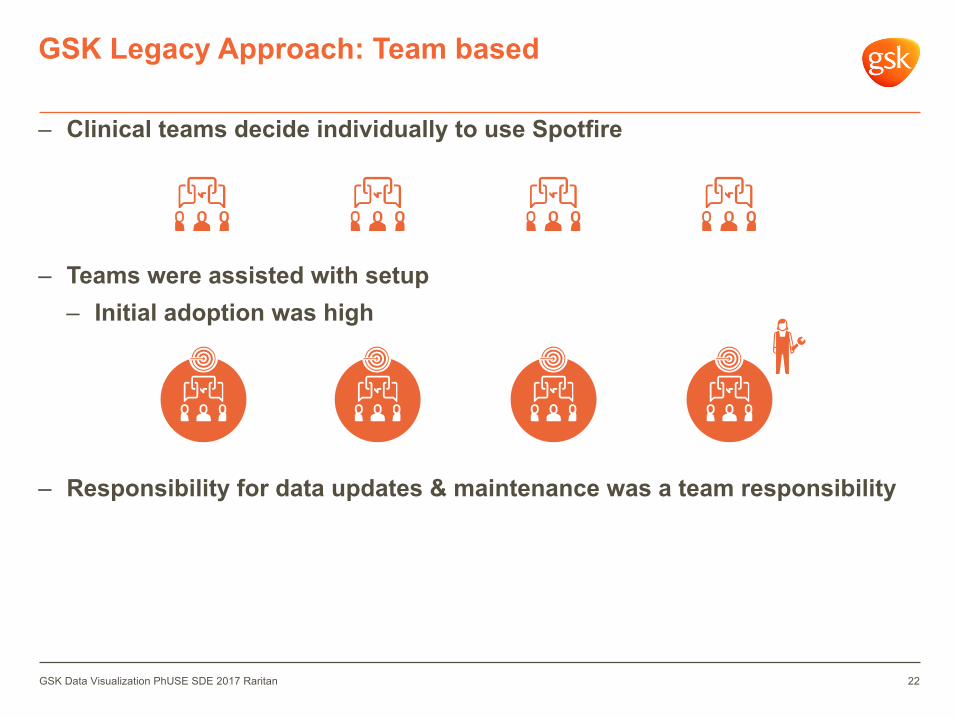
– Clinical teams decide individually to use Spotfire
– Teams were assisted with setup – Initial adoption was high
– Responsibility for data updates & maintenance was a team responsibility
GSK Legacy Approach: Team based
23GSK Data Visualization PhUSE SDE 2017 Raritan
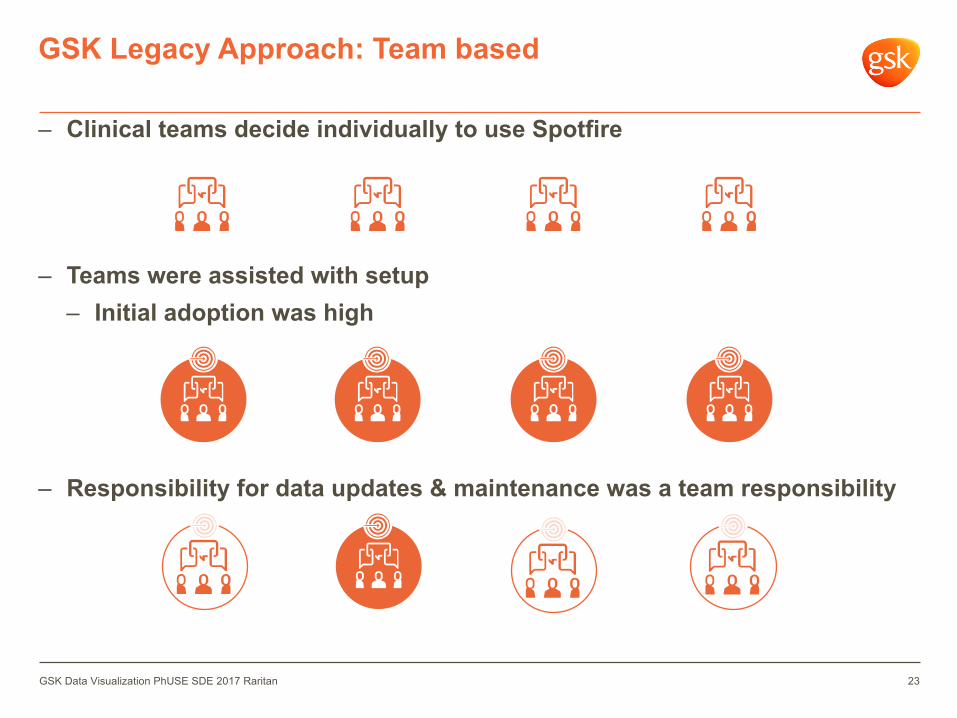
– Clinical teams decide individually to use Spotfire
– Teams were assisted with setup – Initial adoption was high
– Responsibility for data updates & maintenance was a team responsibility
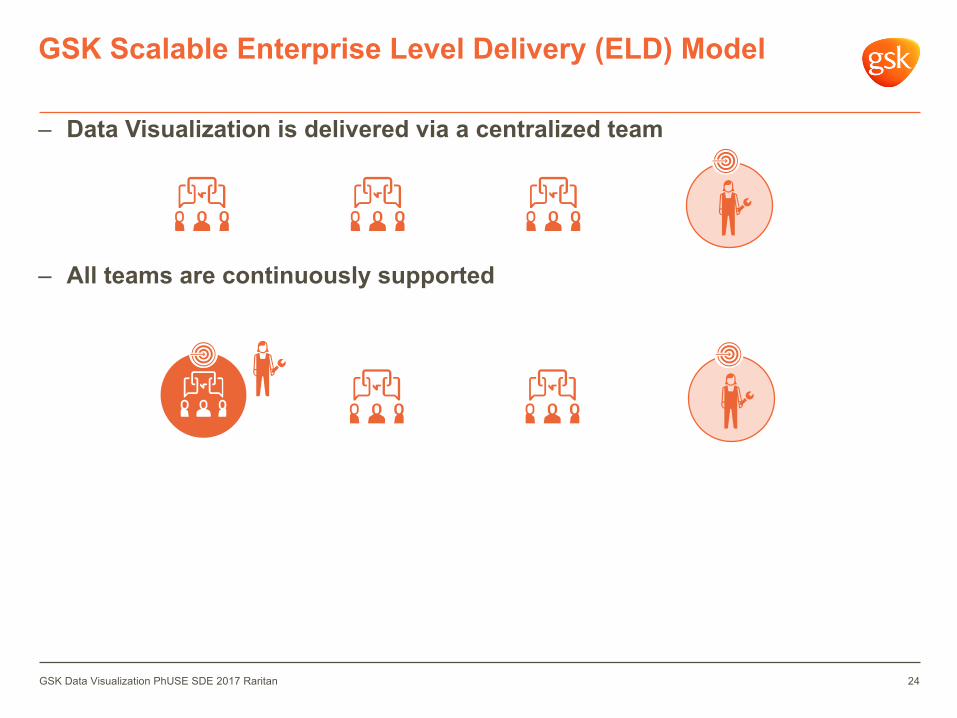
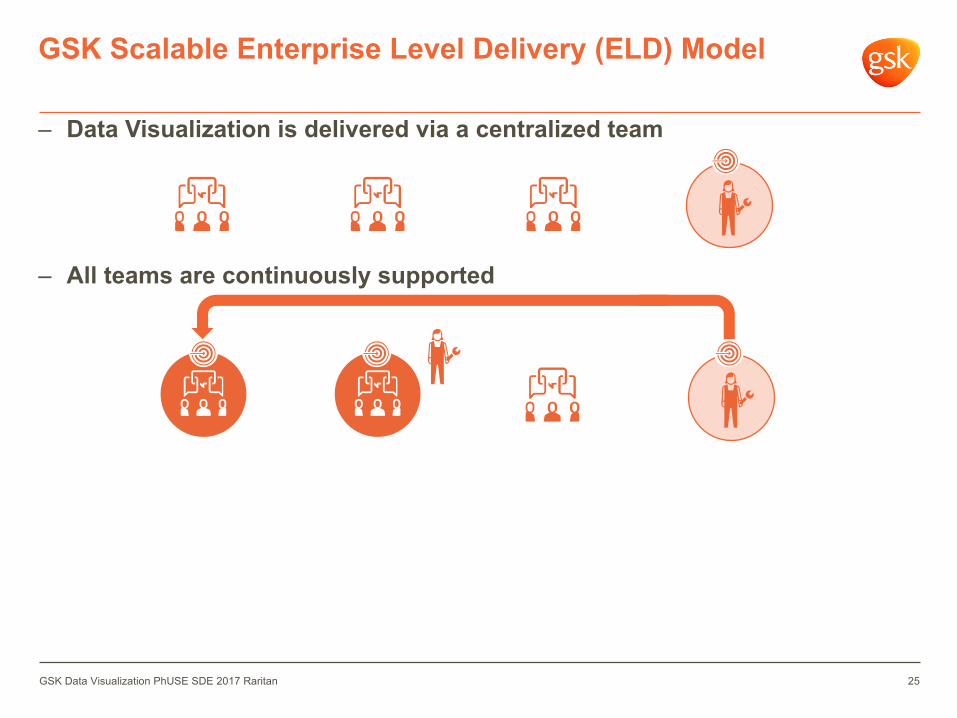
– Data Visualization is delivered via a centralized team
– All teams are continuously supported
GSK Scalable Enterprise Level Delivery (ELD) Model
24GSK Data Visualization PhUSE SDE 2017 Raritan
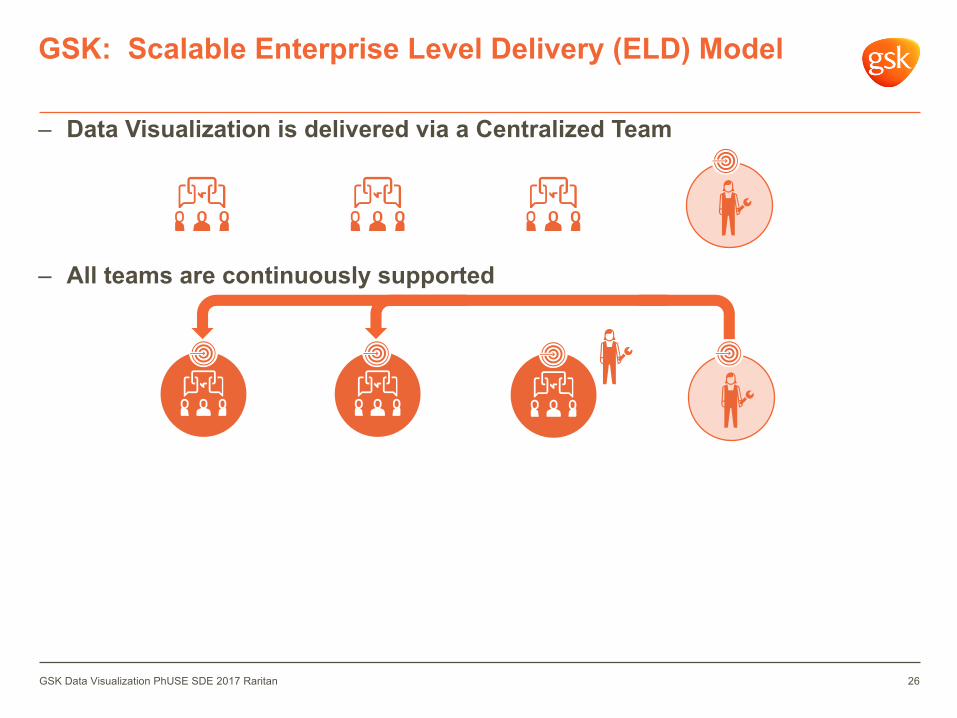
– Data Visualization is delivered via a centralized team
– All teams are continuously supported
GSK Scalable Enterprise Level Delivery (ELD) Model
25GSK Data Visualization PhUSE SDE 2017 Raritan
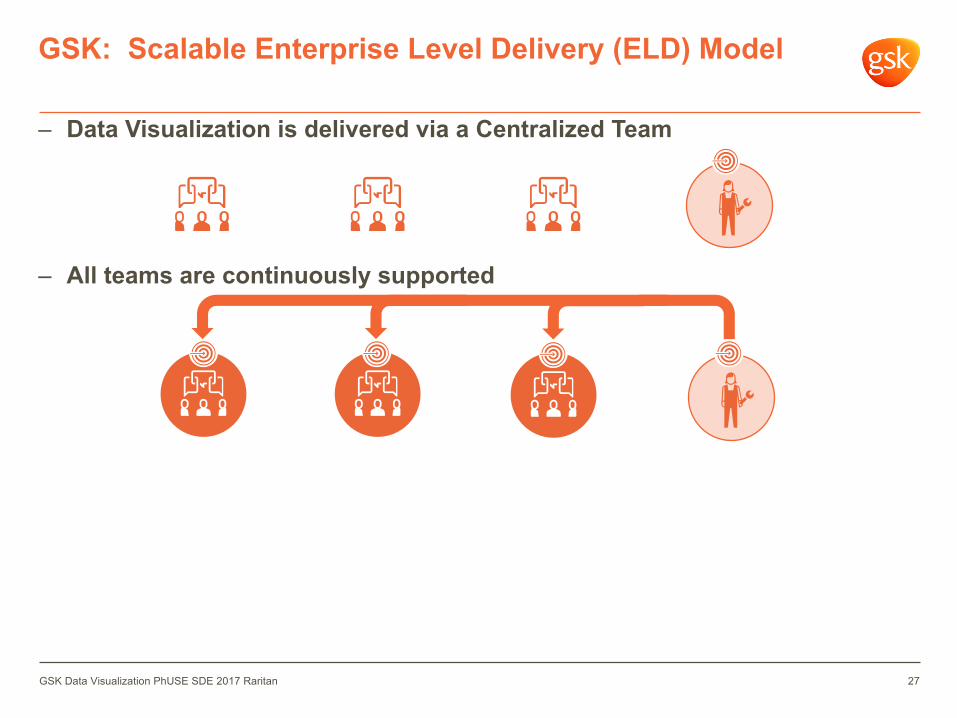
– Data Visualization is delivered via a Centralized Team
– All teams are continuously supported
GSK: Scalable Enterprise Level Delivery (ELD) Model
26GSK Data Visualization PhUSE SDE 2017 Raritan
– Data Visualization is delivered via a Centralized Team
– All teams are continuously supported
GSK: Scalable Enterprise Level Delivery (ELD) Model
27GSK Data Visualization PhUSE SDE 2017 Raritan
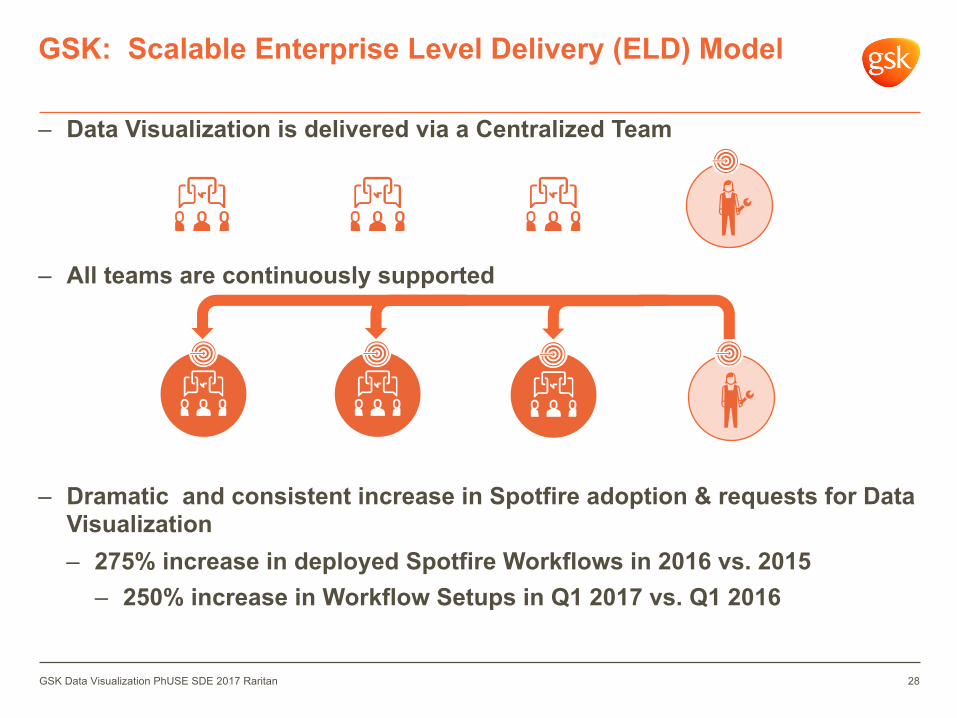
– Data Visualization is delivered via a Centralized Team
– All teams are continuously supported
– Dramatic and consistent increase in Spotfire adoption & requests for Data Visualization– 275% increase in deployed Spotfire Workflows in 2016 vs. 2015
– 250% increase in Workflow Setups in Q1 2017 vs. Q1 2016
GSK: Scalable Enterprise Level Delivery (ELD) Model
28GSK Data Visualization PhUSE SDE 2017 Raritan
Keys & Lessons Learned from Successful Enterprise Level Delivery (ELD) Implementation
GSK Data Visualization PhUSE SDE 2017 RaritanThe graphs rendered herein are not referenced to any specific GSK study or asset, contain no personally identifiable information, and are shown for demonstrative purposes only.
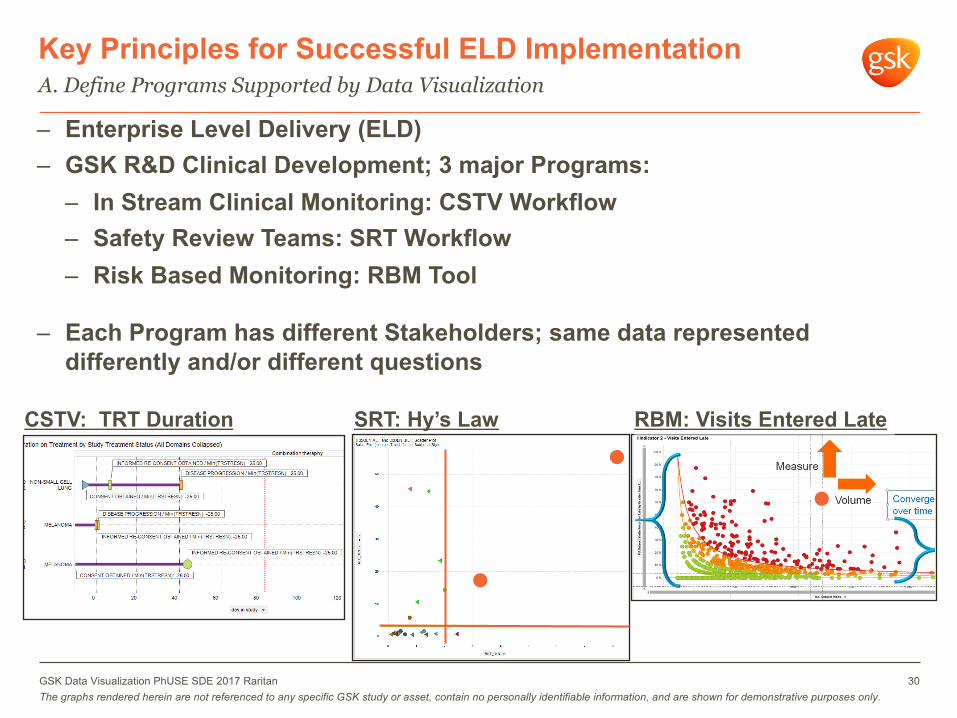
– Enterprise Level Delivery (ELD)– GSK R&D Clinical Development; 3 major Programs:
– In Stream Clinical Monitoring: CSTV Workflow– Safety Review Teams: SRT Workflow– Risk Based Monitoring: RBM Tool
– Each Program has different Stakeholders; same data represented differently and/or different questions
Key Principles for Successful ELD Implementation
30
SRT: Hy’s Law
A. Define Programs Supported by Data Visualization
RBM: Visits Entered LateCSTV: TRT Duration
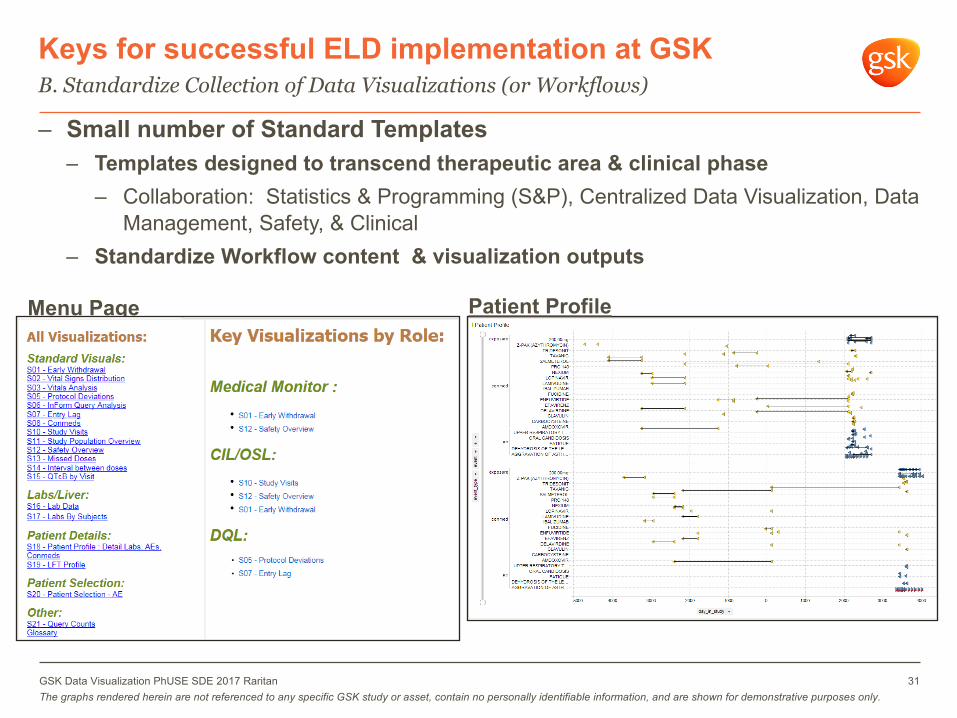
– Small number of Standard Templates– Templates designed to transcend therapeutic area & clinical phase
– Collaboration: Statistics & Programming (S&P), Centralized Data Visualization, Data Management, Safety, & Clinical
– Standardize Workflow content & visualization outputs
Keys for successful ELD implementation at GSK
31
Menu Page Patient Profile
B. Standardize Collection of Data Visualizations (or Workflows)
GSK Data Visualization PhUSE SDE 2017 RaritanThe graphs rendered herein are not referenced to any specific GSK study or asset, contain no personally identifiable information, and are shown for demonstrative purposes only.
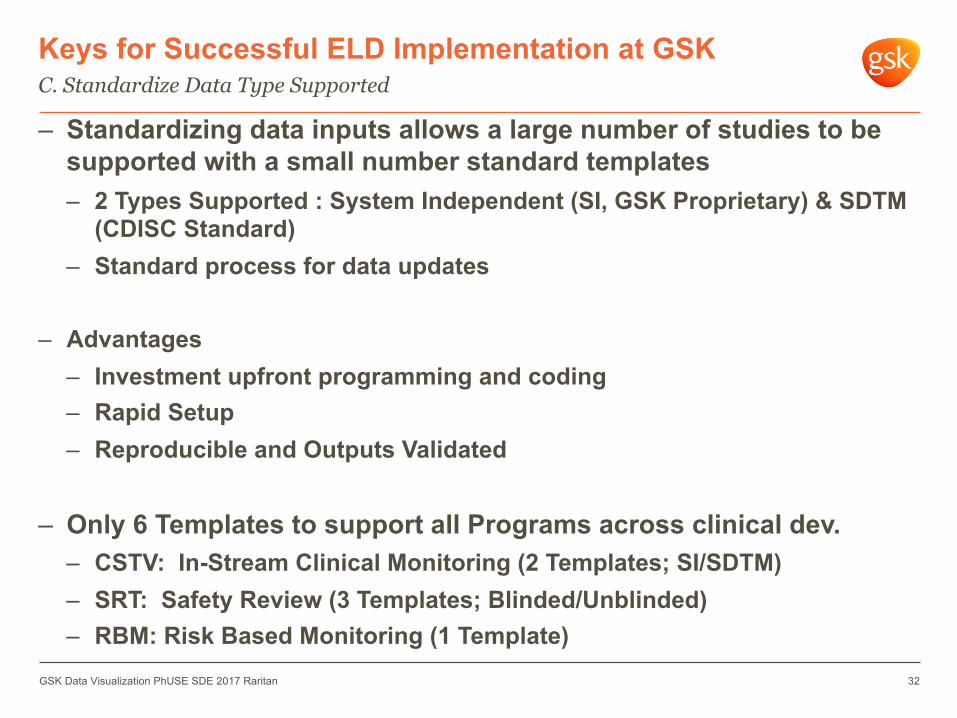
– Standardizing data inputs allows a large number of studies to be supported with a small number standard templates– 2 Types Supported : System Independent (SI, GSK Proprietary) & SDTM
(CDISC Standard)– Standard process for data updates
– Advantages– Investment upfront programming and coding– Rapid Setup– Reproducible and Outputs Validated
– Only 6 Templates to support all Programs across clinical dev.– CSTV: In-Stream Clinical Monitoring (2 Templates; SI/SDTM)– SRT: Safety Review (3 Templates; Blinded/Unblinded)– RBM: Risk Based Monitoring (1 Template)
Keys for Successful ELD Implementation at GSK
32
C. Standardize Data Type Supported
GSK Data Visualization PhUSE SDE 2017 Raritan
– Model Supports >80 Clinical Studies; >110 Production Workflows
– Single scalable process governs entire DV Support Portfolio– Define Programs in Support Portfolio– Define content of Standard Templates and visualization outputs– Defined data types
– ELD Supported Matrixed On/Off Shore Team (ON/S, OFF/S)– Flexible Resourcing Model
– Best use of resources– GSK Oversight
– Cross-Trained OFF/S staff allows demand-based expansion/contraction– GSK Staff Independent of Pipeline Changes
Scalable ELD Process Model for Data Visualization
33
D. Standardized, Scalable Process
GSK Data Visualization PhUSE SDE 2017 Raritan
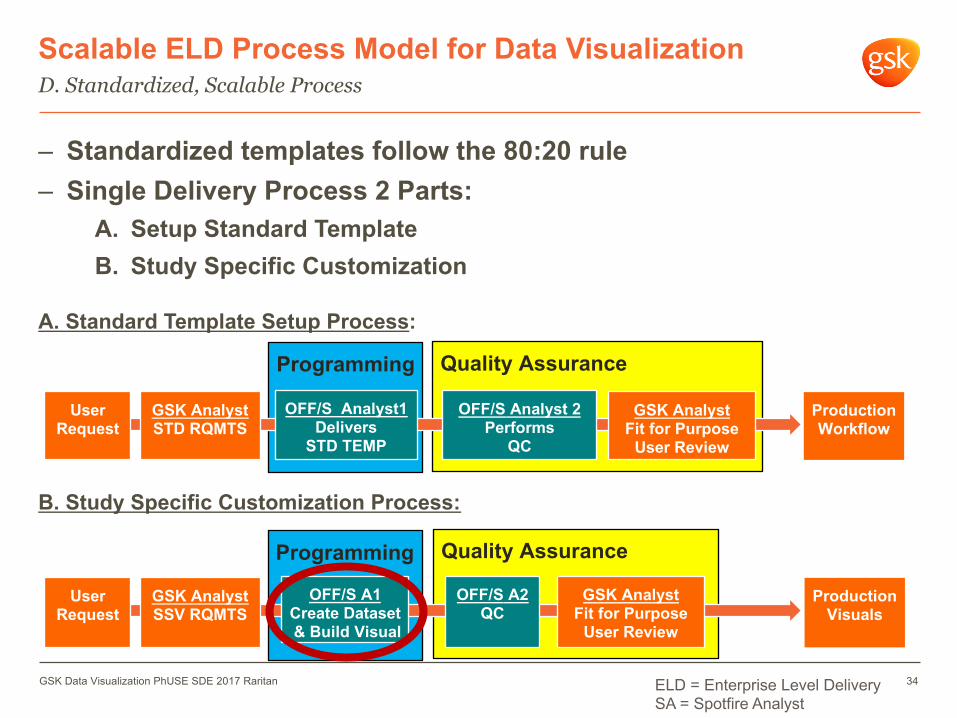
– Standardized templates follow the 80:20 rule– Single Delivery Process 2 Parts:
A. Setup Standard TemplateB. Study Specific Customization
A. Standard Template Setup Process:
B. Study Specific Customization Process:
Programming
Programming Quality Assurance
Scalable ELD Process Model for Data Visualization
34
D. Standardized, Scalable Process
Quality Assurance
OFF/S Analyst 2Performs
QC
UserRequest
GSK AnalystFit for Purpose
User Review
GSK AnalystSSV RQMTS
OFF/S A1Create Dataset& Build Visual
OFF/S A2QC
GSK AnalystFit for Purpose
User Review
ELD = Enterprise Level DeliverySA = Spotfire Analyst
GSK AnalystSTD RQMTS
UserRequest
ProductionWorkflow
ProductionVisuals
GSK Data Visualization PhUSE SDE 2017 Raritan
OFF/S Analyst1Delivers
STD TEMP
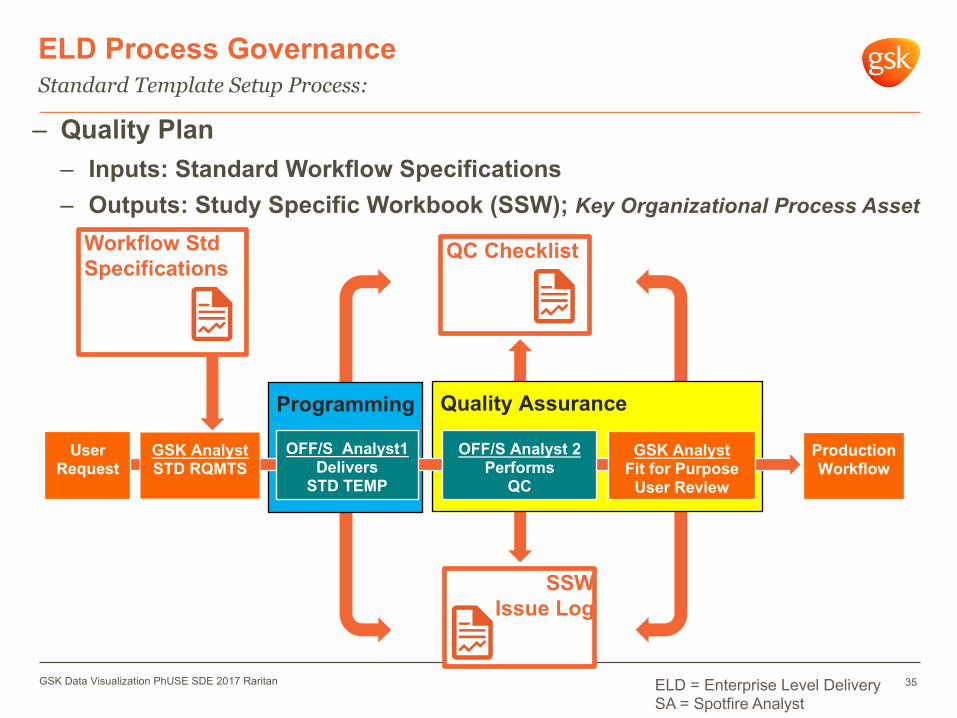
– Quality Plan– Inputs: Standard Workflow Specifications– Outputs: Study Specific Workbook (SSW); Key Organizational Process Asset
Programming
ELD Process Governance
35
Standard Template Setup Process:
Quality Assurance
OFF/S Analyst1Delivers
STD TEMP
OFF/S Analyst 2Performs
QC
UserRequest
GSK AnalystFit for Purpose
User Review
GSK AnalystSTD RQMTS
ProductionWorkflow
Workflow StdSpecifications
QC Checklist
SSWIssue Log
GSK Data Visualization PhUSE SDE 2017 Raritan ELD = Enterprise Level DeliverySA = Spotfire Analyst
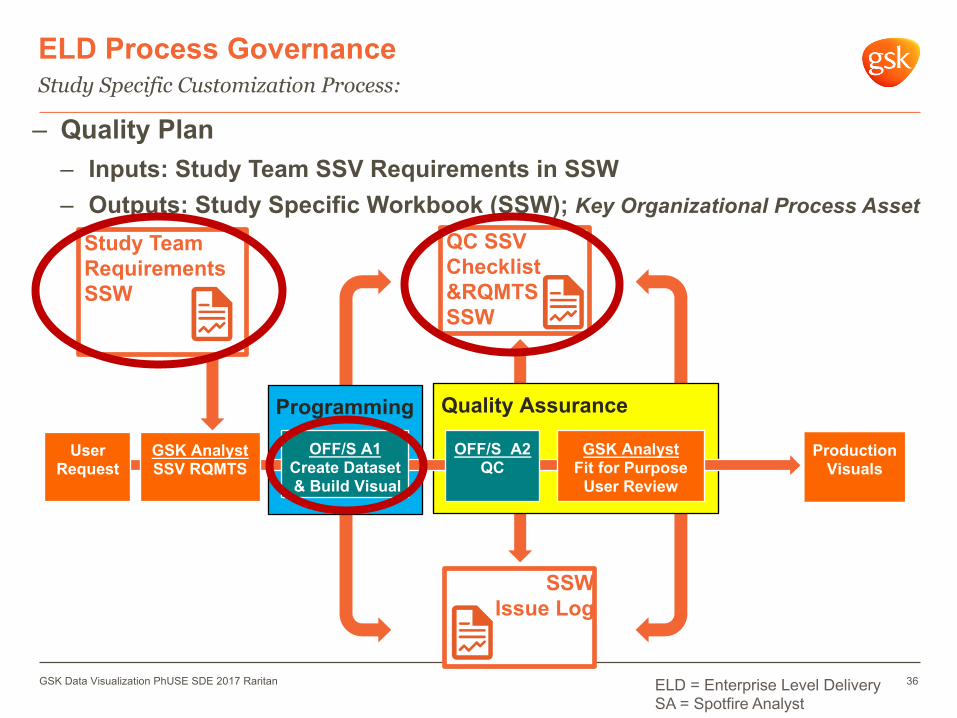
– Quality Plan– Inputs: Study Team SSV Requirements in SSW– Outputs: Study Specific Workbook (SSW); Key Organizational Process Asset
ELD Process Governance
36
Study Specific Customization Process:
Study TeamRequirements SSW
QC SSV Checklist&RQMTSSSW
Programming Quality Assurance
GSK AnalystSSV RQMTS
OFF/S A1Create Dataset& Build Visual
OFF/S A2QC
GSK AnalystFit for Purpose
User Review
UserRequest
ProductionVisuals
GSK Data Visualization PhUSE SDE 2017 Raritan ELD = Enterprise Level DeliverySA = Spotfire Analyst
SSWIssue Log
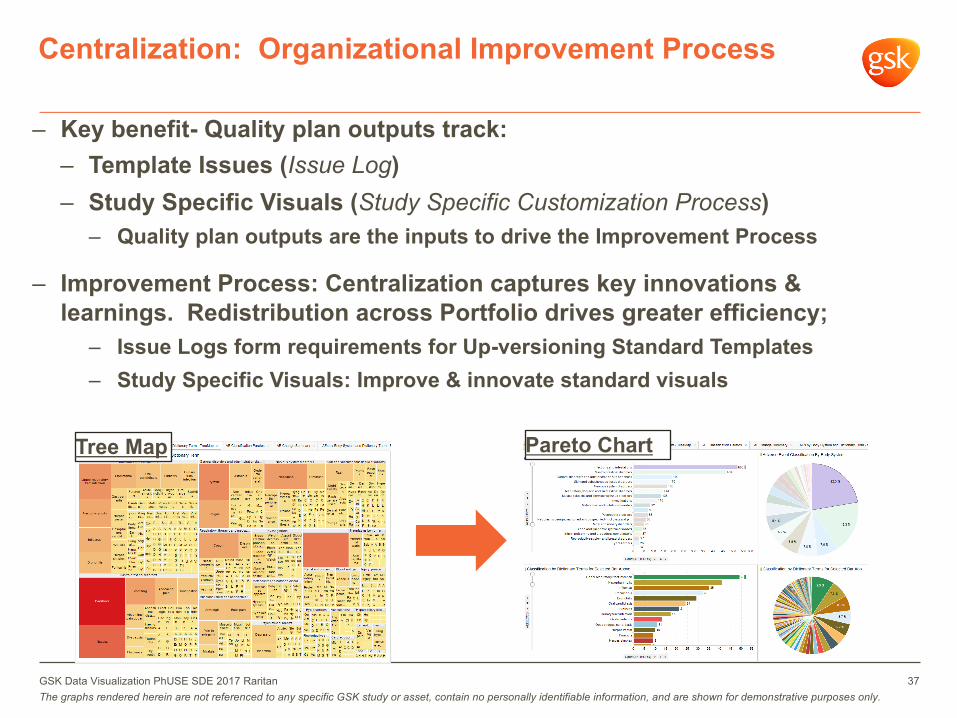
– Key benefit- Quality plan outputs track:– Template Issues (Issue Log)– Study Specific Visuals (Study Specific Customization Process)
– Quality plan outputs are the inputs to drive the Improvement Process
– Improvement Process: Centralization captures key innovations & learnings. Redistribution across Portfolio drives greater efficiency;
– Issue Logs form requirements for Up-versioning Standard Templates– Study Specific Visuals: Improve & innovate standard visuals
Centralization: Organizational Improvement Process
37
Pareto Chart
GSK Data Visualization PhUSE SDE 2017 RaritanThe graphs rendered herein are not referenced to any specific GSK study or asset, contain no personally identifiable information, and are shown for demonstrative purposes only.
Tree Map
Examples of Clinical Programming collaboration and integrated data analysis using Spotfire®
Tibco Spotfire®
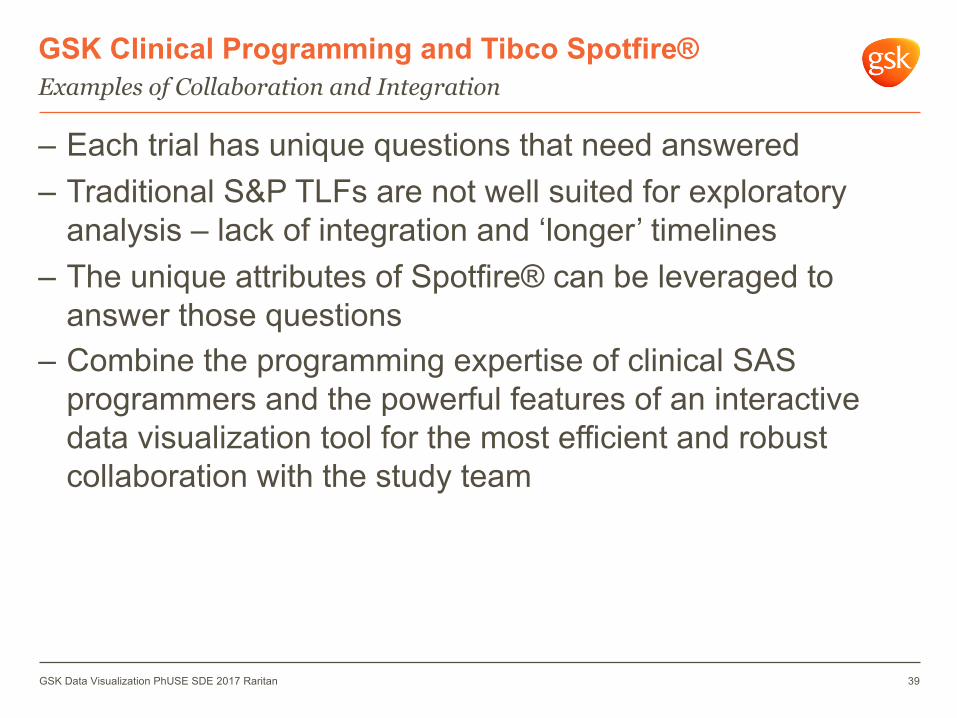
GSK Clinical Programming and Tibco Spotfire®
– Each trial has unique questions that need answered– Traditional S&P TLFs are not well suited for exploratory
analysis – lack of integration and ‘longer’ timelines– The unique attributes of Spotfire® can be leveraged to
answer those questions– Combine the programming expertise of clinical SAS
programmers and the powerful features of an interactive data visualization tool for the most efficient and robust collaboration with the study team
Examples of Collaboration and Integration
GSK Data Visualization PhUSE SDE 2017 Raritan 39
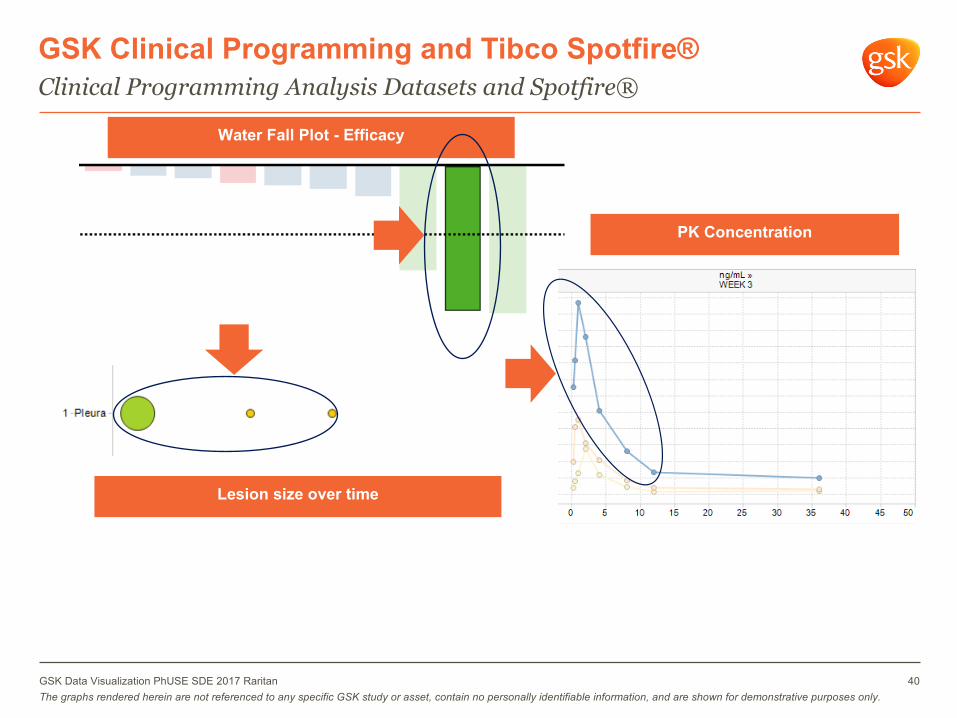
GSK Clinical Programming and Tibco Spotfire®Clinical Programming Analysis Datasets and Spotfire®
Water Fall Plot - Efficacy
Lesion size over time
PK Concentration
40GSK Data Visualization PhUSE SDE 2017 RaritanThe graphs rendered herein are not referenced to any specific GSK study or asset, contain no personally identifiable information, and are shown for demonstrative purposes only.
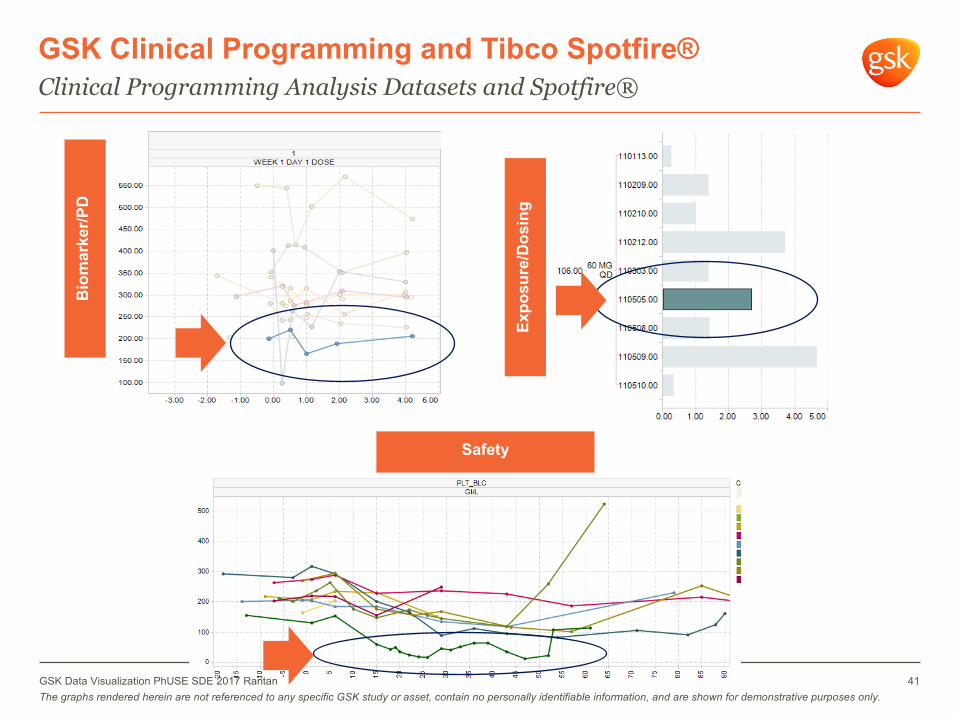
GSK Clinical Programming and Tibco Spotfire®Clinical Programming Analysis Datasets and Spotfire®
Bio
mar
ker/P
D
Expo
sure
/Dos
ing
Safety
41GSK Data Visualization PhUSE SDE 2017 RaritanThe graphs rendered herein are not referenced to any specific GSK study or asset, contain no personally identifiable information, and are shown for demonstrative purposes only.
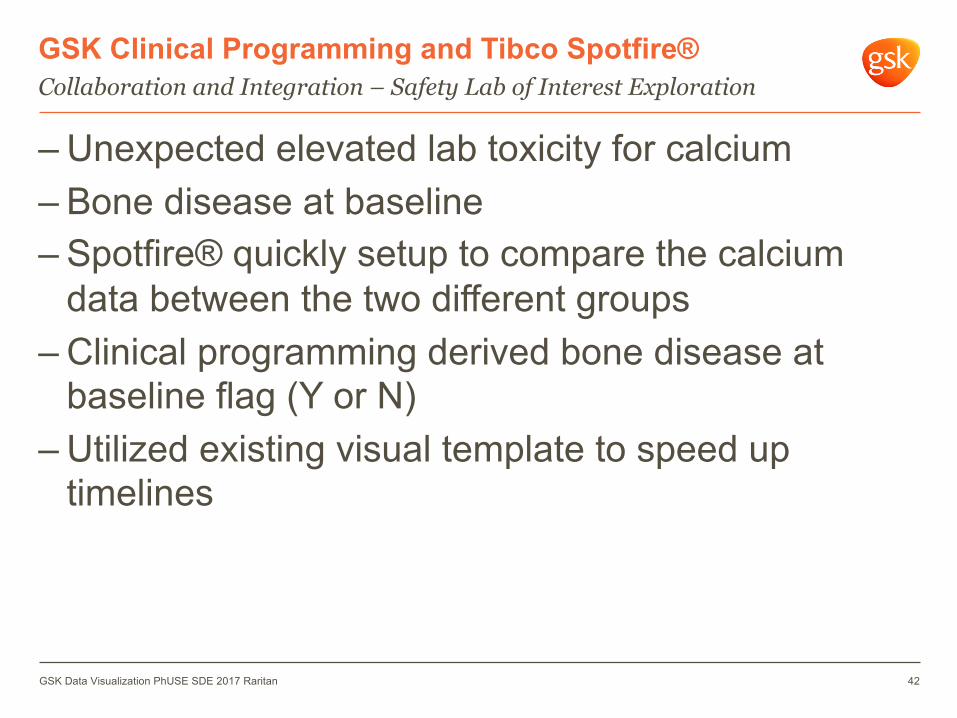
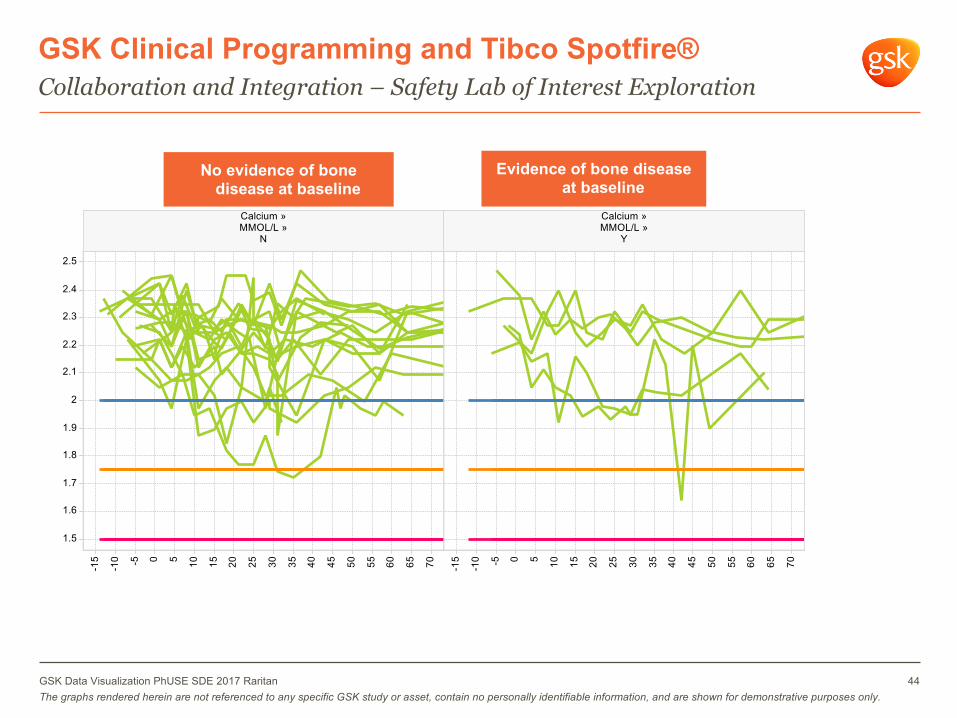
GSK Clinical Programming and Tibco Spotfire®Collaboration and Integration – Safety Lab of Interest Exploration
– Unexpected elevated lab toxicity for calcium– Bone disease at baseline– Spotfire® quickly setup to compare the calcium
data between the two different groups– Clinical programming derived bone disease at
baseline flag (Y or N)– Utilized existing visual template to speed up
timelines
GSK Data Visualization PhUSE SDE 2017 Raritan 42
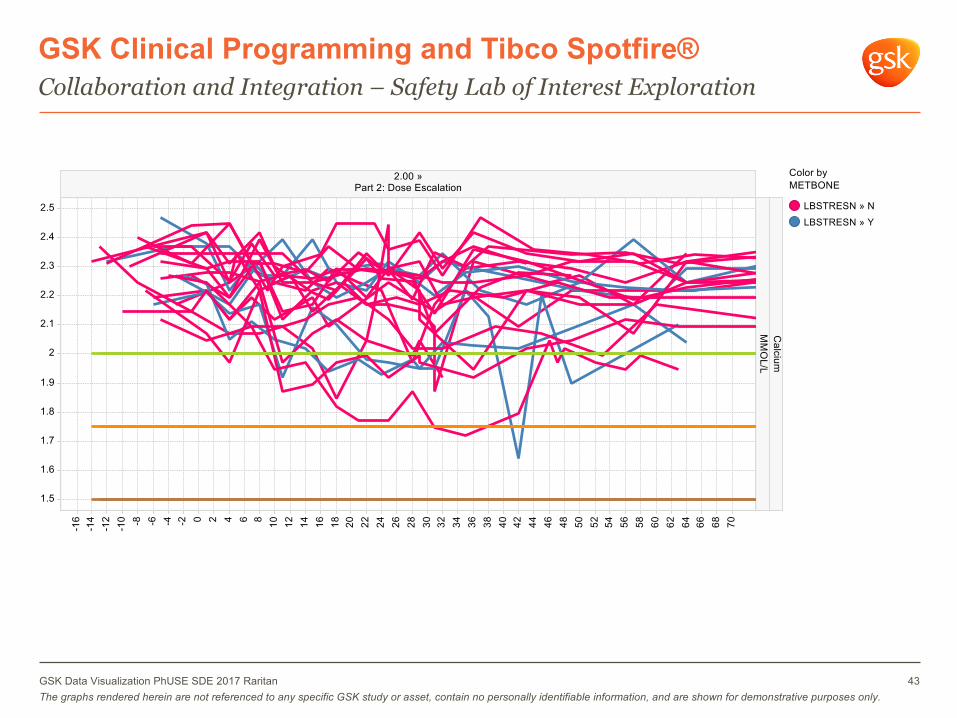
GSK Clinical Programming and Tibco Spotfire®Collaboration and Integration – Safety Lab of Interest Exploration
43GSK Data Visualization PhUSE SDE 2017 RaritanThe graphs rendered herein are not referenced to any specific GSK study or asset, contain no personally identifiable information, and are shown for demonstrative purposes only.
GSK Clinical Programming and Tibco Spotfire®Collaboration and Integration – Safety Lab of Interest Exploration
Evidence of bone disease at baseline
No evidence of bone disease at baseline
44GSK Data Visualization PhUSE SDE 2017 RaritanThe graphs rendered herein are not referenced to any specific GSK study or asset, contain no personally identifiable information, and are shown for demonstrative purposes only.
GSK Clinical Programming and Tibco Spotfire®Collaboration and Integration – LPS Cytokine Analysis
– Preclinical research showed dose dependent inhibition of LPS induced stimulation
– Expected same results in human data– Some predose samples (no drug present) showed no
inhibition– Spotfire® was used to explore and interrogate the data to
understand if there was some threshold that could be used for exclusion of samples that were not stimulated
– Collaboration with clinical programming to understand if baseline factors contributed to the issue
GSK Data Visualization PhUSE SDE 2017 Raritan 45
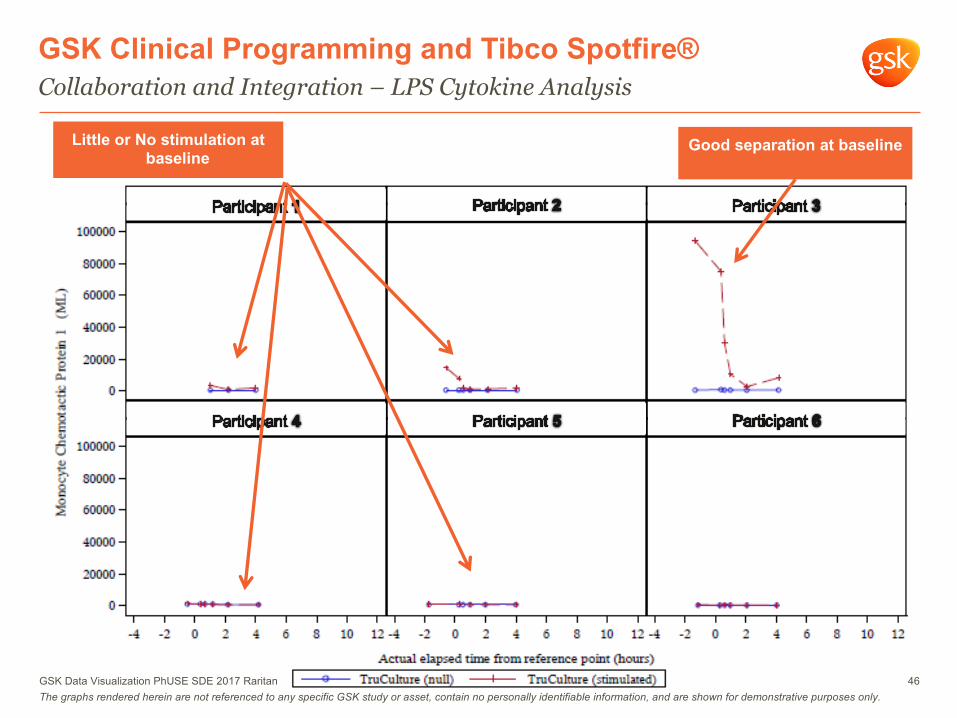
GSK Clinical Programming and Tibco Spotfire®Collaboration and Integration – LPS Cytokine Analysis
Little or No stimulation at baseline
Good separation at baseline
46GSK Data Visualization PhUSE SDE 2017 RaritanThe graphs rendered herein are not referenced to any specific GSK study or asset, contain no personally identifiable information, and are shown for demonstrative purposes only.
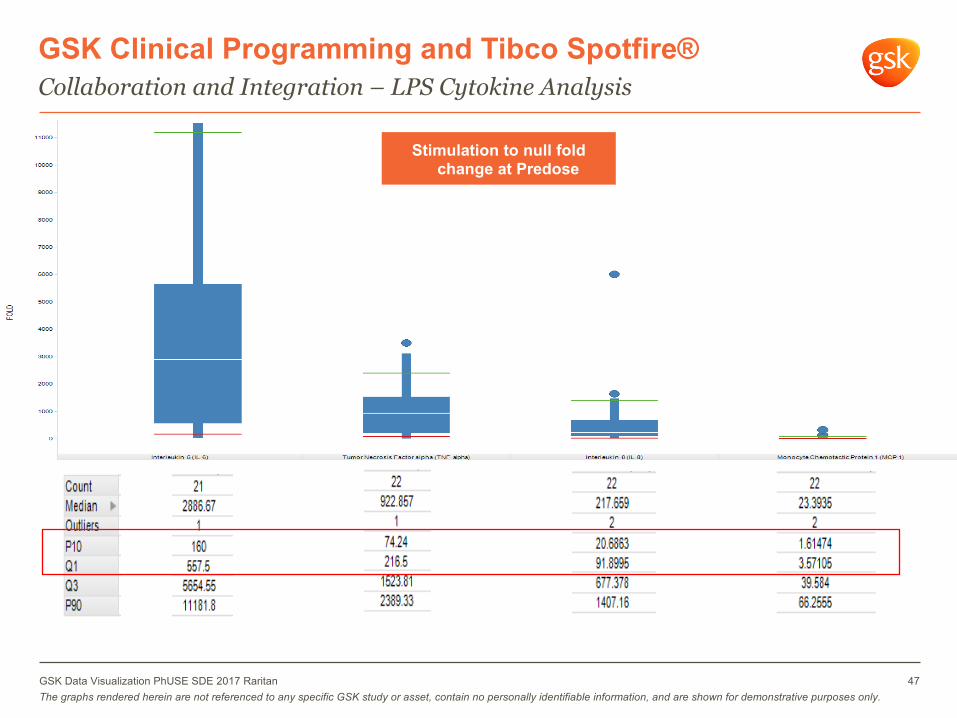
GSK Clinical Programming and Tibco Spotfire®Collaboration and Integration – LPS Cytokine Analysis
Stimulation to null fold change at Predose
47GSK Data Visualization PhUSE SDE 2017 RaritanThe graphs rendered herein are not referenced to any specific GSK study or asset, contain no personally identifiable information, and are shown for demonstrative purposes only.
GSK Clinical Programming and Tibco Spotfire®
– Baseline factors – Anti-inflammatory medications
– All AI meds– Steroids
– Tumor Type at diagnosis– White blood cell baseline values
Collaboration and Integration – LPS Cytokine Analysis
GSK Data Visualization PhUSE SDE 2017 Raritan 48
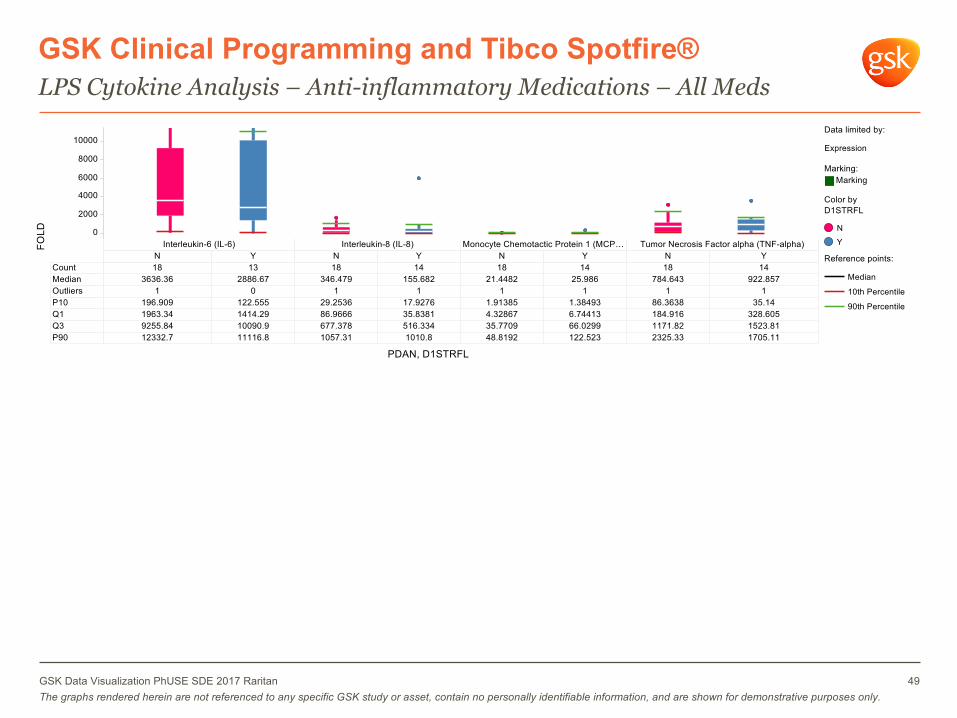
GSK Clinical Programming and Tibco Spotfire®LPS Cytokine Analysis – Anti-inflammatory Medications – All Meds
49GSK Data Visualization PhUSE SDE 2017 RaritanThe graphs rendered herein are not referenced to any specific GSK study or asset, contain no personally identifiable information, and are shown for demonstrative purposes only.

GSK Clinical Programming and Tibco Spotfire®LPS Cytokine Analysis – Anti-inflammatory Medications – All Meds
50GSK Data Visualization PhUSE SDE 2017 RaritanThe graphs rendered herein are not referenced to any specific GSK study or asset, contain no personally identifiable information, and are shown for demonstrative purposes only.
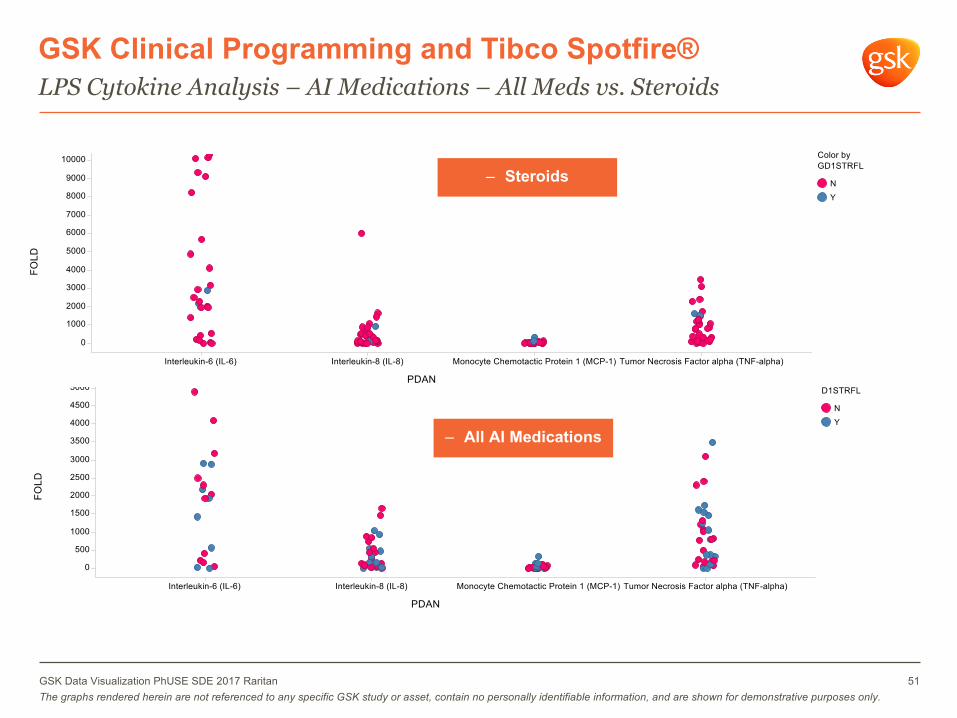
GSK Clinical Programming and Tibco Spotfire®LPS Cytokine Analysis – AI Medications – All Meds vs. Steroids
– All AI Medications
– Steroids
51GSK Data Visualization PhUSE SDE 2017 RaritanThe graphs rendered herein are not referenced to any specific GSK study or asset, contain no personally identifiable information, and are shown for demonstrative purposes only.
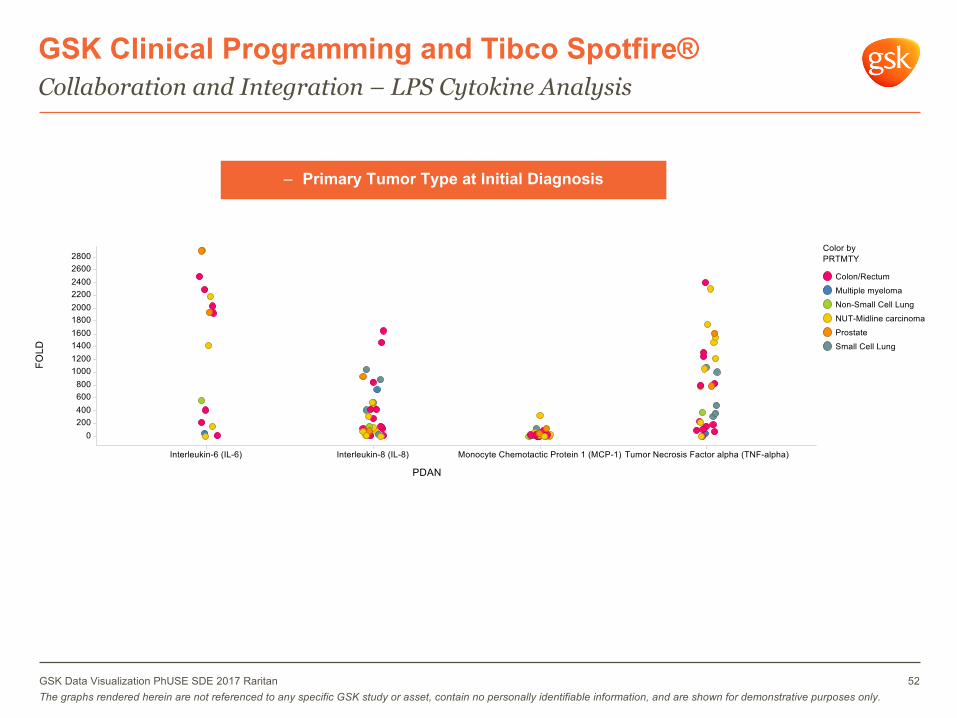
GSK Clinical Programming and Tibco Spotfire®Collaboration and Integration – LPS Cytokine Analysis
– Primary Tumor Type at Initial Diagnosis
52GSK Data Visualization PhUSE SDE 2017 RaritanThe graphs rendered herein are not referenced to any specific GSK study or asset, contain no personally identifiable information, and are shown for demonstrative purposes only.
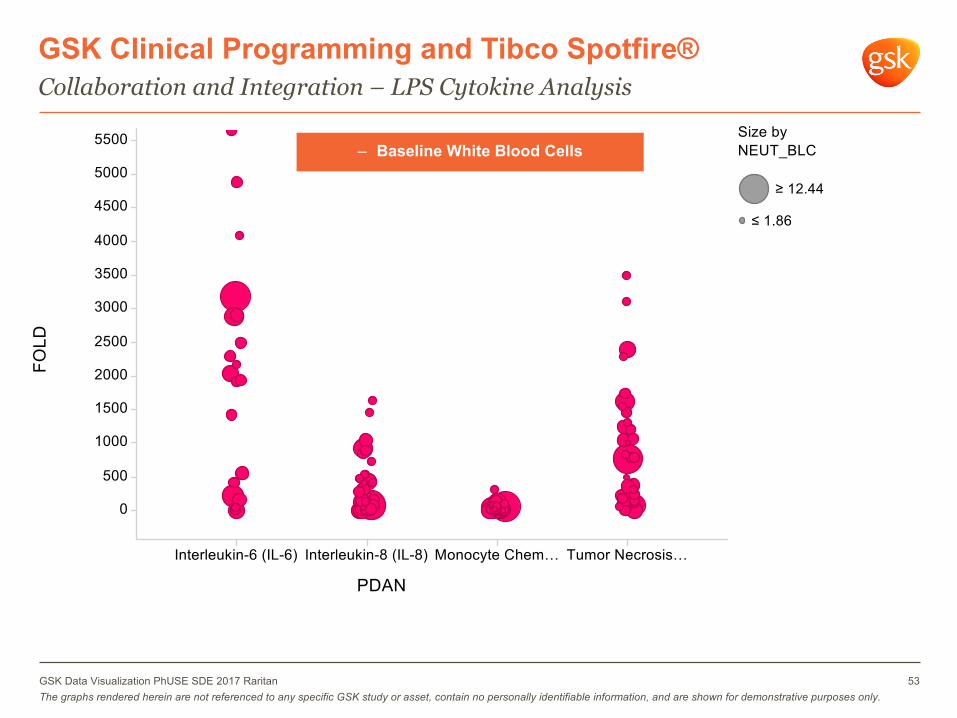
GSK Clinical Programming and Tibco Spotfire®Collaboration and Integration – LPS Cytokine Analysis
– Baseline White Blood Cells
53GSK Data Visualization PhUSE SDE 2017 RaritanThe graphs rendered herein are not referenced to any specific GSK study or asset, contain no personally identifiable information, and are shown for demonstrative purposes only.
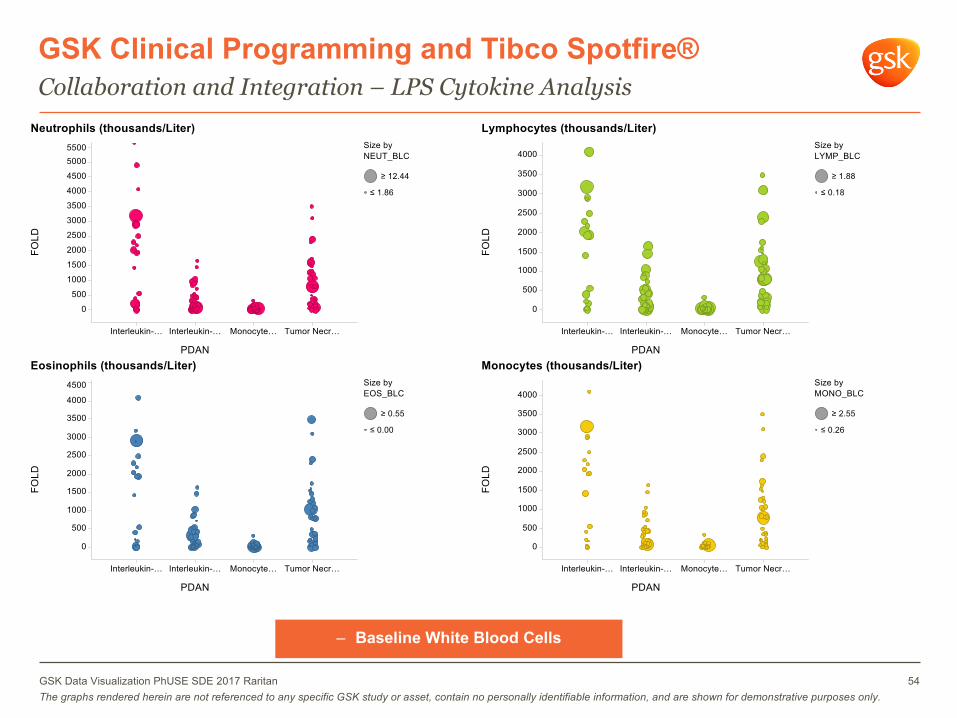
GSK Clinical Programming and Tibco Spotfire®Collaboration and Integration – LPS Cytokine Analysis
– Baseline White Blood Cells
54GSK Data Visualization PhUSE SDE 2017 RaritanThe graphs rendered herein are not referenced to any specific GSK study or asset, contain no personally identifiable information, and are shown for demonstrative purposes only.
GSK Clinical Programming and Tibco Spotfire®
– Traditional Oncology therapies –– Increase dose until MTD is found – Combine safety, study population, PK and clinical activity (if
any) into one tool– Demonstrated reduction in timelines to dose escalation
decisions– Immuno-Oncology therapies –
– treatments may not show the same toxicity as chemotherapy or targeted therapy
– Focus on PD/biomarker data and target engagement– Combine safety, PK, efficacy, and biomarker data to show PD
effects and optimal target engagement.
Collaboration and Integration – Open Label Dose Escalation Studies
GSK Data Visualization PhUSE SDE 2017 Raritan 55

Conclusion
Conclusions– Data visualization enhances cognition and expresses the significance of
data to key stakeholders
– Interactive tools like Spotfire® have helped GSK stakeholders; enabling more robust and timely decision making
– Centralized Data Visualization provides GSK rapid access to Data Visualization Tools with efficient management of Workflow Setup & custom Visualization creation
– Interactive Data Visualizations are powerful engines for data interrogation– Successful organizational embedding of Data Visualization requires scalable
plans for adoption & responsible Governance/Quality Plans ensuring risk/benefit balance maintained
– Collaboration between Centralized Data Analytics & Clinical Programming has delivered key benefits: – Knowledge capture, elegant program visualizations integrated centrally driving
innovation, and greater capability and sophisticated workflows augments in-stream analysis and enhances formal reporting
57GSK Data Visualization PhUSE SDE 2017 RaritanThe graphs rendered herein are not referenced to any specific GSK study or asset, contain no personally identifiable information, and are shown for demonstrative purposes only.

Questions?