Embed Size (px)
Citation preview

APRJ - 699
Applied Project
A Strategic Analysis of
Petroleum Refining Infrastructure in Canada
Wayne Dosman
Coach: Dr. Oliver Mack
Word Count: 19,093
Date Due: March 31, 2013

A Strategic Analysis of Petroleum Refining Infrastructure In Canada
Page 1
Abstract
Canada continues to be economically dependent on refined petroleum products even as
the world moves to constrain their use of fossil fuels. Canada has a long history of
producing more crude oil than we consume however little attention is given to the
strategic importance of the integrated supply network that gathers, transports, refines
and distributes the finished goods. The refining industry in Canada has gone through a
30 year reduction in the number refineries in production and recently various market
anomies have become more pronounced.
This study considers the research question whether this consolidated infrastructure will
be able to meet the future needs of Canadians? I use a qualitative case study format
and publicly available secondary data. The data is analyzed applying three approaches
to strategic management, an industry analysis to captured the industry’s structural
components, a competitive forces analysis that identifies the industry’s dominate forces
and a system dynamics analysis to explore how the system responds to two situations
that occur in the industry.
The industry analysis identifies major elements of the petroleum industry’s structure and
relates these elements to a review of the Canadian industry’s current structure. We
identify four major elements, crude oil slate, mid-stream infrastructure, refinery
configuration and capacity, and product slate demand as elements that structurally
shape the industry. We then review the composition of these elements in Canada’s
refining infrastructure. This review revealed Canada’s refining infrastructure is organized
into four regional supply orbits, each having defining features. These features create
substantially different constraints and requirements for each orbit. Production capacity
shortfalls, product production/demand gaps and significant mid-stream constraints were
identified in two supply orbits.
The competitive forces analysis reviewed the competitive forces surrounding the
downstream refineries which captured crude slate producers as suppliers and refined
product users as buyers. This analysis revealed that the industry’s competitive
structure consists of low buyer and supplier power while refiners possess some
bargaining power under specific mid-stream constraint circumstances. Competitor
rivalry is moderate as although an oligopoly structure exists that is conducive for intense
price competition, the lack of excess capacity and threat of imports limit refiners pricing
power. The threat of new entrants is high as although incumbents enjoy various barriers
to entry, these barriers are mitigated by existing capacity and product shortfalls, and the
diseconomies of scale that exist in certain markets. The threat of substitutes was
A Strategic Analysis of Petroleum Refining Infrastructure In Canada
Page 2
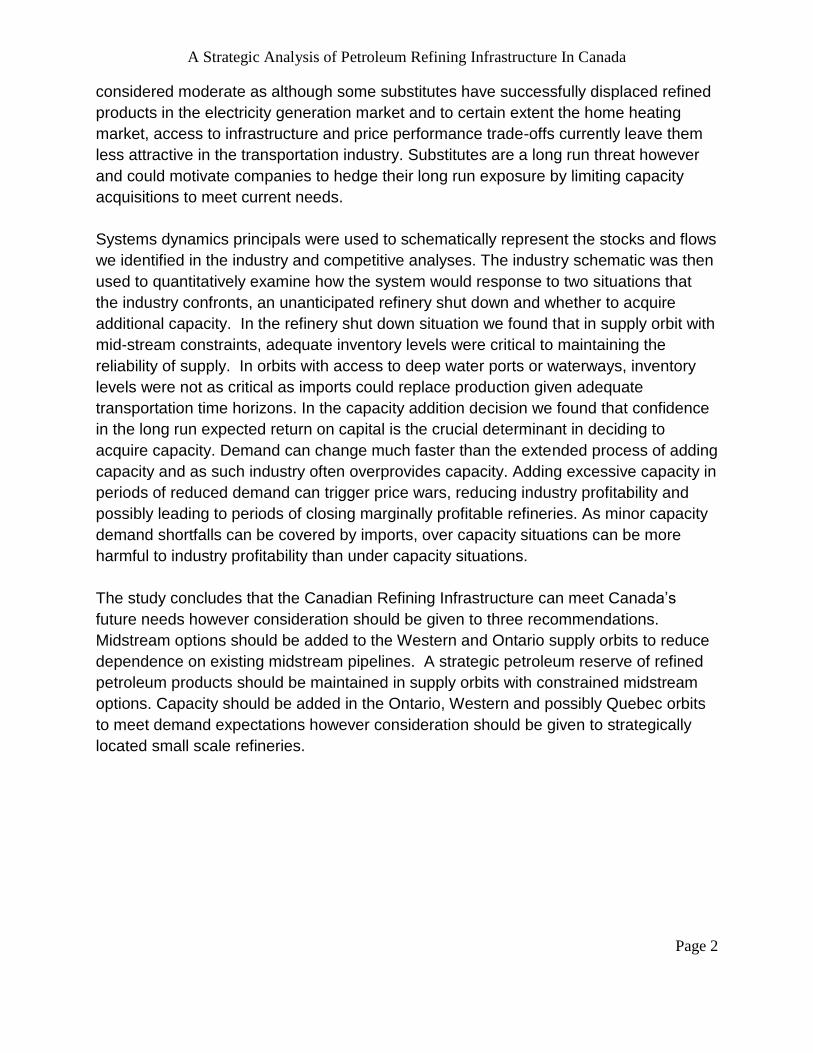
considered moderate as although some substitutes have successfully displaced refined
products in the electricity generation market and to certain extent the home heating
market, access to infrastructure and price performance trade-offs currently leave them
less attractive in the transportation industry. Substitutes are a long run threat however
and could motivate companies to hedge their long run exposure by limiting capacity
acquisitions to meet current needs.
Systems dynamics principals were used to schematically represent the stocks and flows
we identified in the industry and competitive analyses. The industry schematic was then
used to quantitatively examine how the system would response to two situations that
the industry confronts, an unanticipated refinery shut down and whether to acquire
additional capacity. In the refinery shut down situation we found that in supply orbit with
mid-stream constraints, adequate inventory levels were critical to maintaining the
reliability of supply. In orbits with access to deep water ports or waterways, inventory
levels were not as critical as imports could replace production given adequate
transportation time horizons. In the capacity addition decision we found that confidence
in the long run expected return on capital is the crucial determinant in deciding to
acquire capacity. Demand can change much faster than the extended process of adding
capacity and as such industry often overprovides capacity. Adding excessive capacity in
periods of reduced demand can trigger price wars, reducing industry profitability and
possibly leading to periods of closing marginally profitable refineries. As minor capacity
demand shortfalls can be covered by imports, over capacity situations can be more
harmful to industry profitability than under capacity situations.
The study concludes that the Canadian Refining Infrastructure can meet Canada’s
future needs however consideration should be given to three recommendations.
Midstream options should be added to the Western and Ontario supply orbits to reduce
dependence on existing midstream pipelines. A strategic petroleum reserve of refined
petroleum products should be maintained in supply orbits with constrained midstream
options. Capacity should be added in the Ontario, Western and possibly Quebec orbits
to meet demand expectations however consideration should be given to strategically
located small scale refineries.

A Strategic Analysis of Petroleum Refining Infrastructure In Canada
Page 3
Table of Contents
ABSTRACT .............................................................................................................................................................. 1
TABLE OF FIGURES ................................................................................................................................................. 4
1.0 INTRODUCTION ................................................................................................................................................ 5
1.1 SIGNIFICANCE OF THE CANADIAN REFINING INDUSTRY ................................................................................................... 5
1.2 RESEARCH QUESTIONS ............................................................................................................................................. 7
1.3 RESEARCH DESIGN AND APPROACH ............................................................................................................................ 7
1.4 SCOPE AND ASSUMPTIONS ........................................................................................................................................ 8
2.0 REVIEW OF RELATED THEORY .......................................................................................................................... 9
2.1 INDUSTRY AND COMPETITIVE ANALYSIS ..................................................................................................................... 10
2.2 SYSTEM DYNAMICS ................................................................................................................................................ 12
3.0 ANALYSIS ....................................................................................................................................................... 14
3.1 - INDUSTRY ANALYSIS ............................................................................................................................................. 14
3.2 - COMPETITIVE FORCES ANALYSIS ............................................................................................................................. 53
3.3 - SYSTEM DYNAMICS ANALYSIS ................................................................................................................................ 61
4.0 RECOMMENDATIONS AND CONCLUSIONS ..................................................................................................... 72
REFERENCES ......................................................................................................................................................... 77
APPENDIX 1 – ACRONYMS, UNITS AND CONVERSION FACTORS .......................................................................... 84

A Strategic Analysis of Petroleum Refining Infrastructure In Canada
Page 4
Table of Figures FIGURE 1 - 2009 TOTAL FINAL CONSUMPTION FOR CANADA .............................................................................. 5
FIGURE 2 - REFINING INFRASTRUCTURE SUPPLY NETWORK ............................................................................... 8
FIGURE 3 - DETERMINANTS OF COMPETITIVE FORCES ..................................................................................... 11
FIGURE 4 - PROJECTION OF CANADIAN CRUDE OIL PRODUCTION ..................................................................... 16
FIGURE 5 - PRODUCT YIELDS OF REFINERY CONFIGURATIONS USING HEAVY OIL FEEDSTOCK .......................... 19
FIGURE 6 - EXPECTED YIELD OF A CRACKING REFINERY ................................................................................. 20
FIGURE 7 - CANADIAN DOMESTIC REFINED PRODUCT SALES (2011) ................................................................ 20
FIGURE 8 - CANADIAN DOMESTIC SALES OF RPP 2002 - 2011 ........................................................................ 21
FIGURE 9 - CANADIAN PRODUCT DEMAND ...................................................................................................... 22
FIGURE 10 - MAJOR ELEMENTS OF REFINING SUPPLY NETWORK ..................................................................... 22
FIGURE 11 - REFINERY CAPACITY VERSES NUMBER OF REFINERIES ................................................................ 23
FIGURE 12 - OWNERSHIP OF CANADIAN REFINERY CAPACITY .......................................................................... 24
FIGURE 13 - THROUGHPUT CAPACITY OF CANADIAN REFINERIES ..................................................................... 25
FIGURE 14 - SUMMARY OF CANADIAN REFINED PRODUCTS PRODUCTION IN 2011 ............................................ 26
FIGURE 15 - CANADIAN REFINERY UTILIZATION ............................................................................................... 27
FIGURE 16 - 2011 REGIONAL CAPACITY VERSES DEMAND .............................................................................. 28
FIGURE 17 - CANADIAN SUPPLY ORBITS ......................................................................................................... 29
FIGURE 18 - SUMMARY OF MARITIME REFINED PRODUCTS PRODUCTION IN 2011 (BPD).................................... 30
FIGURE 19- MARITIME REFINERY CONFIGURATIONS CAPACITY ........................................................................ 32
FIGURE 20 - PRODUCT DEMAND MIX CANADA VERSE MARITIME ...................................................................... 33
FIGURE 21 - MARITIME PRODUCT DEMAND ..................................................................................................... 33
FIGURE 22 - SUMMARY OF QUEBEC ORBITS REFINED PRODUCTS PRODUCTION IN 2011 (BPD) ......................... 35
FIGURE 23 – QUEBEC ORBITS CAPACITY ....................................................................................................... 37
FIGURE 24 - CANADA VERSES QUEBEC'S PRODUCT DEMAND MIX ................................................................... 37
FIGURE 25 - QUEBEC PRODUCT DEMAND GROWTH ........................................................................................ 38
FIGURE 26 - QUEBEC'S PRODUCT BALANCE.................................................................................................... 39
FIGURE 27 – SUMMARY OF ONTARIO'S REFINED PRODUCT PRODUCTION IN 2011 (BPD) ................................... 40
FIGURE 28 - ONTARIO ORBIT'S CAPACITY ....................................................................................................... 42
FIGURE 29 - CANADA VERSES ONTARIO'S PRODUCT DEMAND MIX ................................................................... 42
FIGURE 30 - ONTARIO'S PRODUCT SUPPLY AND DEMAND BALANCE ................................................................. 43
FIGURE 31 - ONTARIO'S PRODUCT DEMAND GROWTH ..................................................................................... 44
FIGURE 32 - WESTERN ORBIT'S REFINED PRODUCT PRODUCTION IN 2011 (BPD) ............................................. 45
FIGURE 33 - WESTERN ORBIT CAPACITY ........................................................................................................ 47
FIGURE 34 - CRUDE UPGRADERS CAPACITY ................................................................................................... 48
FIGURE 35 - CANADA VERSES WESTERN'S PRODUCT DEMAND MIX .................................................................. 49
FIGURE 36 - WESTERN'S PRODUCT DEMAND GROWTH ................................................................................... 50
FIGURE 37 - WESTERN'S PRODUCT BALANCE ................................................................................................. 50
FIGURE 38 - SALIENT FEATURES OF SUPPLY ORBITS ...................................................................................... 51
FIGURE 39 - COMPETITIVE FORCES IN THE REFINING INDUSTRY ....................................................................... 60
FIGURE 40 - STOCKS AND FLOW SCHEMATIC .................................................................................................. 61
FIGURE 41 - REFINERY SHUTDOWN CAUSAL MAP ........................................................................................... 63
FIGURE 42 - ONTARIO'S ORBIT SHUTDOWN RESPONSE ................................................................................... 65
FIGURE 43 - INVENTORY RESPONSE TO SHUTDOWN ........................................................................................ 65
FIGURE 44 - CAPACITY ACQUISITION CAUSAL MAP .......................................................................................... 67
FIGURE 45 - IMPERIAL OILS DIVISIONAL RETURN ON CAPITAL EMPLOYED ......................................................... 68
A Strategic Analysis of Petroleum Refining Infrastructure In Canada
Page 5
1.0 Introduction
1.1 Significance of the Canadian Refining Industry
In spite of the growing negative sentiment towards products from crude oil being a
major source of greenhouse gas emissions, global energy demand continues to grow
each year and refined petroleum products continues to be the dominate source that
supplies the growing demand for energy.
British Petroleum’s’ (BP) Statistical Review of World Energy estimates global energy
demand grew 2.5% in 2011 which is also approximately equal to the 10 year average
growth in global energy demand (BP, 2012, p. 2). Within the mix of energy sources that
fuel this demand, oil continues to be the dominate source of energy. Even though oil’s
2011 global growth of 600 thousand barrels per day (0.7% growth) was less than the
growth in total energy demand, oil is still the largest energy source in the mix providing
41.3% of the global total final consumption of energy in 2009 (IEA, 2012, p. 28).
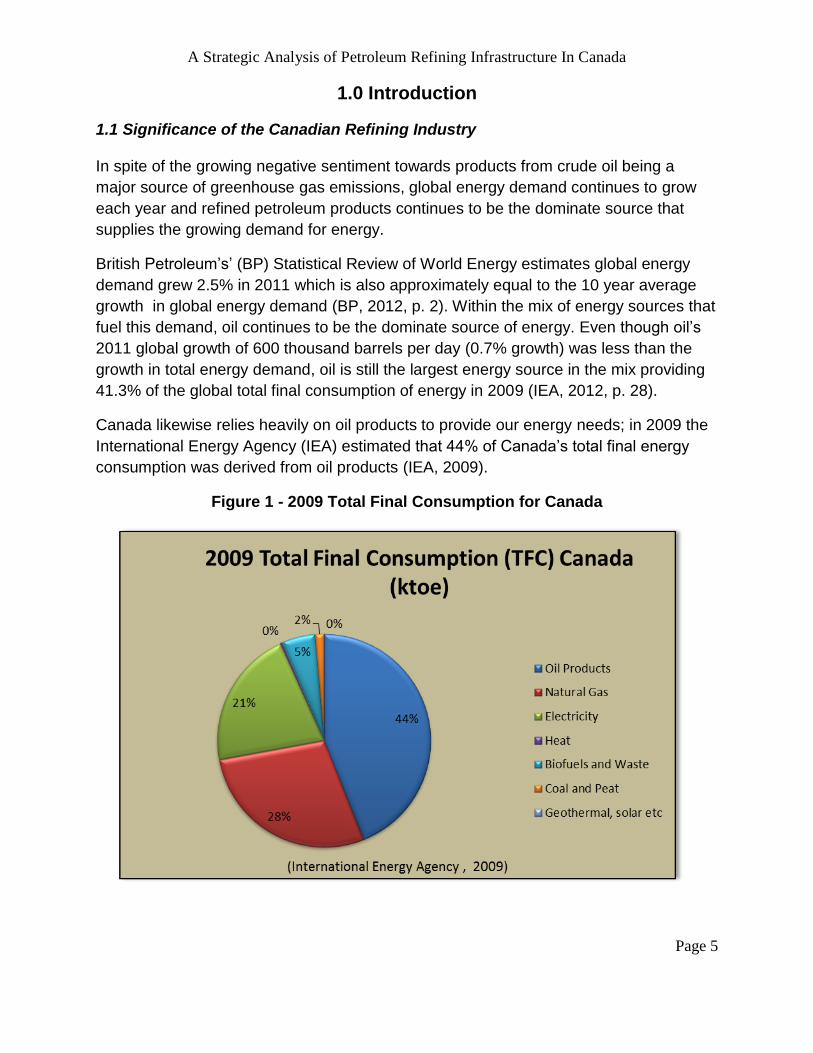
Canada likewise relies heavily on oil products to provide our energy needs; in 2009 the
International Energy Agency (IEA) estimated that 44% of Canada’s total final energy
consumption was derived from oil products (IEA, 2009).
Figure 1 - 2009 Total Final Consumption for Canada

A Strategic Analysis of Petroleum Refining Infrastructure In Canada
Page 6
Canada’s dependence oil products’ is actually growing at a faster rate than our demand
for energy. Over the past ten years, our primary energy consumption increased 8.9%
(Statistics Canada, 2012b) at the same time when oil consumption increased 12.1%
(Statistics Canada, 2012, 2003).
Barring a dramatic increase to the cost of GHG emissions, the worlds’ heavy reliance on
refined petroleum products (RPP) is expected to continue well into the future. Changes
in the global energy mix are slow to change due to the magnitude of the infrastructure
investments currently in place and the higher costs of substitute energy sources.
Canada has a long history of producing more crude oil than it needs’, BP estimated that
in 2011 Canada produced more than 1.2 million barrels of oil per day (bpd) more than it
consumed (BP, 2012a). However, crude oil is of little value itself as it is only after
refining that crude oil in vast quantities that it has an economic use. The use of RPP
permeates every market of the Canadian economy so much that any small disruption
has an immediate and negative cascading effect throughout the economy.
Notwithstanding the economic dependence that the Canadian economy has on RPP,
the industry itself makes a significant value added contribution to domestic production
while providing high paying jobs for the Canadian economy. A 2011 Conference Board
of Canada report estimated that a 10% loss in domestic refining capacity would reduce
GDP by four billion dollars and 38,300 person-years of employment over a five year
period (Conference Board of Canada, 2011, p.31). Given Canada’s economic
dependence on RPP, the production of a secure reliable supply of RPP into the
Canadian marketplace should be managed as a critical strategic resource.
The refining industry in Canada has gone through a 30 year period of reducing the
number of producing refineries even though demand constantly grew. Demand has
been balanced by building larger refineries in fewer locations and increasing throughput
utilization rates. This strategy has resulted in an industry which has historically been
reliable but is highly concentrated in specific locations across Canada. Over the past
ten years, various fundamental changes have emerged in the Petroleum Industry which
has changed the supply and demand dynamics of the North American market. These
changes seem to be manifesting in various market anomalies not previously
experienced:
- Gasoline shortages are becoming more regular occurrences even in oil
rich Western Canada (CBC News, July 28, 2010).
- Despite crude oil being structured as a financial traded global
commodity, large price differentials are developing between
A Strategic Analysis of Petroleum Refining Infrastructure In Canada
Page 7
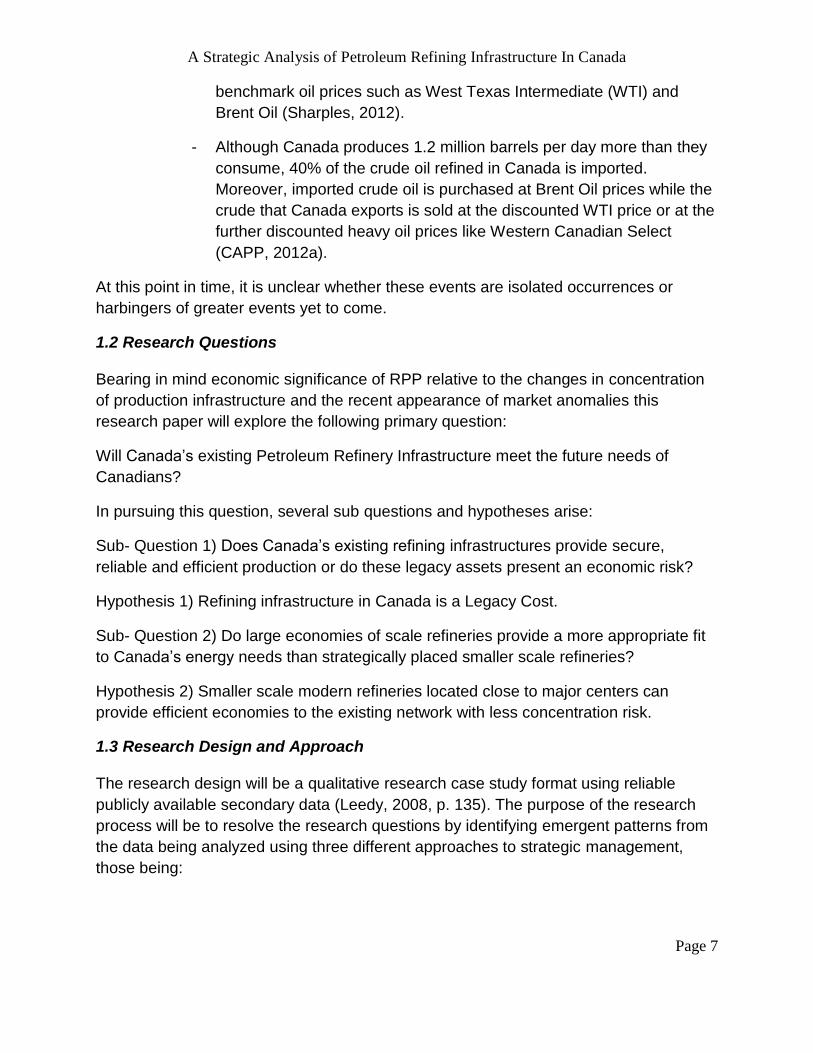
benchmark oil prices such as West Texas Intermediate (WTI) and
Brent Oil (Sharples, 2012).
- Although Canada produces 1.2 million barrels per day more than they
consume, 40% of the crude oil refined in Canada is imported.
Moreover, imported crude oil is purchased at Brent Oil prices while the
crude that Canada exports is sold at the discounted WTI price or at the
further discounted heavy oil prices like Western Canadian Select
(CAPP, 2012a).
At this point in time, it is unclear whether these events are isolated occurrences or
harbingers of greater events yet to come.
1.2 Research Questions
Bearing in mind economic significance of RPP relative to the changes in concentration
of production infrastructure and the recent appearance of market anomalies this
research paper will explore the following primary question:
Will Canada’s existing Petroleum Refinery Infrastructure meet the future needs of
Canadians?
In pursuing this question, several sub questions and hypotheses arise:
Sub- Question 1) Does Canada’s existing refining infrastructures provide secure,
reliable and efficient production or do these legacy assets present an economic risk?
Hypothesis 1) Refining infrastructure in Canada is a Legacy Cost.
Sub- Question 2) Do large economies of scale refineries provide a more appropriate fit
to Canada’s energy needs than strategically placed smaller scale refineries?
Hypothesis 2) Smaller scale modern refineries located close to major centers can
provide efficient economies to the existing network with less concentration risk.
1.3 Research Design and Approach
The research design will be a qualitative research case study format using reliable
publicly available secondary data (Leedy, 2008, p. 135). The purpose of the research
process will be to resolve the research questions by identifying emergent patterns from
the data being analyzed using three different approaches to strategic management,
those being:

A Strategic Analysis of Petroleum Refining Infrastructure In Canada
Page 8
1) An Industry Analysis Approach.
2) A Competitive Forces Approach.
3) A System Dynamics Approach.
In the Industry Analysis, the existing industry structure will be explored using data
collected from secondary sources for supply, demand, refinery capacity, ownership and
throughput data on the Canadian petroleum refinery industry. This data is available
through various governmental, national and international petroleum agencies
segregated at the national and provincial levels. All sources used will be accessed
through their respective sources websites. The data will be used to identify current
supply and demand balances, identify potential constraints and excesses, and identify
emergent patterns.
We will then use the information and data from the industry analysis section to analyse
the competitive forces that exist in this market and to establish causal relationships that
can be used to build a qualitative causal map model of refinery infrastructure.
1.4 Scope and Assumptions
In considering the scope of the Petroleum Refining Infrastructure, we will establish the
boundaries of the infrastructure to include the availability of the feedstocks, the delivery
systems used to move feedstocks to refineries, refineries, the distribution and marketing
networks of RPP, and the quantities demanded of RPP (Briggs, Tolliver and
Szmerekovsky, 2012, p.2). Throughout this study we will define this chain as the
Petroleum Refining Infrastructure Supply Network (Slack, Chambers & Johnson, 2010,
p. 375).
Figure 2 - Refining Infrastructure Supply Network
In establishing the scope boundaries we will make the following assumptions throughout
this report:
Demand for RPP will not be severely disrupted by innovation
technologies, public policy or changing societal norms other than trends
which currently exist.

A Strategic Analysis of Petroleum Refining Infrastructure In Canada
Page 9
International imports of RPP will not flood global markets with below cost
production from overcapacity and Canadian refineries can profitability
competitive with imports.
Crude slates will continue to be available internationally and domestically
without any unanticipated long run disruptions.
Taxation and government policy changes are material to the refining
industry but have not been considered within this scope.
In setting this scope and making these assumptions, there are material limitations which
could change the current supply and demand determinants:
Factors external to Canada are important and will impact the supply
demand determinants of this industry such as international capacity
additions, crude oil macro-political events, disruptive technologies, or
application of existing technologies in regions not currently employing
them.
Taxing of externalities may dampen demand or reduce energy intensity
resulting in long run demand destruction.
Innovation could make the price/performance trade-off of substitutes more
attractive.
Crude oil slate changes rapidly altering cost curve and mix of light
oil/heavy oil. Upstream activities can alter downstream operations
significantly by pushing volumes of newly discovered oil through the
supply network.
It is the intention of this study to provide a baseline framework based on current trends
and emergent patterns from which such risks and variables external to this study can be
explored.
2.0 Review of Related Theory
Strategy is a far reaching topic and the breath of its academic literature is broad.
Mintzberg, Ahlstrand, and Lampel identify ten schools of strategy that have evolved.
This study will focus on the more traditional school of positioning. The positioning school
relies on a more systematic, analytical approach to problem solving (Mintzberg,
Ahlstrand, and Lampel, 1998). In that regard, the Industry Analysis will detail the refining

A Strategic Analysis of Petroleum Refining Infrastructure In Canada
Page 10
industry’s physical structure and supply/demand balances, Porter’s Five Competitive
Forces will be used to establish the intensity of the industry’s forces and finally we will
use these findings to build a system dynamics model that can be used to qualitatively
examine market situations within the industry.
2.1 Industry and Competitive Analysis
The positioning school argues that industry structure should drive strategy as there
exists’ certain generic strategic positions in each industry which provide a sustainable
competitive advantage. Taking an industry top down perspective, this school developed
sets of analytical tools to match the right strategy to context of the industry and its
competitors. Included in this school is Porters’ theory on competitive analysis,
competitive advantage and the value chain (Mintzberg, Ahlstrand, and Lampel, 1998.
pp. - 94–106) which forms the foundation for much of this school.
The concept that industry structure impacts differences in levels of industry profitability
is rooted in Industrial Organization Economics and the Theories of Monopoly and
Perfect Competition. It has long been observed that industries with a single dominating
firm often generate above average profits and profitability between industries vary
dramatically. Although the macro-environment that businesses operate in have many
important external factors that influence profitability all industries operate in the same
macro environment hence understanding what influences profitability in the industry
environment is an important first step in strategy formation. The balance between
meeting customer demand through the intensity of competition and supplier bargaining
power results a particular level of industry profitability. It is the examination of the
structure of these relationships that gave rise to the positioning school and Porters
theory of competitive forces (Grant, 2008, pp. 66 -71).
It has been argued that an industry’s environment is a minor determinant of a firm
profitability and that inter-firm differences are much greater influence than industry
profitability. Notwithstanding that effect on profitability by industry may be more
diminished than originally thought, industry analysis is still regarded as primary step in
understanding competition and in predicting the effect that changes in an industry will
have on profitability (Grant, 2008, p. 98).
Porter proposes that it is the interactions of five competitive forces that shape the
structure and profitability of any industry. The five forces of competition are Internal
Industry Rivalry, Threat of New Entrants, Treat of Substitutes, Bargaining Power of
Suppliers and the Bargaining Power of Buyers. Competitive forces arise from the
industry’s distinctive economic and technical characteristics and each force has specific

A Strategic Analysis of Petroleum Refining Infrastructure In Canada
Page 11
determinants which govern that forces influence or power on the industry. We have
summarized some of these determinants in the following charts.
Figure 3 - Determinants of Competitive Forces
(Porter, 2008, pp. 80-86).
Porter stresses that it is the interaction of the relative strengths of these forces that
shapes industry profitability. Consequently, it is the strongest competitive forces that are
most important to strategy formation however these prominent influencers are not
always obvious (Porter, 2008, p. 80).

A Strategic Analysis of Petroleum Refining Infrastructure In Canada
Page 12
In understanding the interaction of these forces in an industry, a strategist can identify
opportunities or weaknesses in the industry structure to reposition their competitive
strategies, distinguish short term aberrations from structural market changes or identify
industry-transforming potential (Porter, 2008, pp.88-90).
Porter also cautions that it is important not to mistake industry attributes for competitive
forces. He explains that each industry has specific elements which influence the forces
but in themselves are not forces. Examples of such industry factors are technology,
complementary products, government and growth rate (Porter, 2008, p.86).
It has been argued that Porter’s five force frameworks is too narrow a view of industry
grouping (Grant, 2008, p 98). It has also been argued that where substitutes limit
profitability complements increase industry profitability and often expands an industries
market. Complements are often considered to be a sixth competitive force (Grant, 2008,
p 98).
2.2 System Dynamics
System Dynamics (SD) originated in the 1950’s by Jay Forrester in his seminal paper
“Industrial Dynamics” (Forrester, 1958). As did Michael Porter, Jay Forrester drew on
industrial organization economics and engineering disciplines along with the then recent
computing advances to proposed that industrial stock-flow-feedback designs can be
used to model business management decisions in complex systems using computer
based simulations. He found that such system models explained the unexpected
results often seen in complex systems better than the causal linear explanations in use
at that time.
System dynamics (SD) is a framework to examine the interaction of decisions with a
system structure as it changes over time. SD models look endogenously at a system to
establish causal relationships which can be used to understand how the system
operates and responds to various changes. Systems can be as large as an industry or
an economy or a much smaller grouping such as a firm. Systems are viewed as
bounded causally closed systems with continuous quantities flowing in and out (rates),
supported by various stocks (inventory or levels) that have feedback loops and circular
causal relationships. Exogenous changes are viewed as either causal loops that should
be added to the system or as triggers which modify conditions within the system
resulting in system adaptation. Models can be computer simulations expressing
relationships within the system using coupled, nonlinear, first-order differential

A Strategic Analysis of Petroleum Refining Infrastructure In Canada
Page 13
equations however they can also be expressed schematically using causal maps to
qualitatively capture the interactions between the stocks, flow and causal feedback
structure of the system (Richardson, 2009, pp. 856 -860).
SD is particularly useful in identifying elements within a system that will react to a
change or in identifying a problem and isolating the interaction of physical and
behavioral elements causing the problem. Wolstenholme suggests that successful
system thinking is predicated on being able to see the whole system in context of its
interconnections to the environment. In that regard, he suggests that the establishment
and understanding the boundaries of systems and their linkages to the physical
environment is a critical component to understanding complex systems (Wolstenholme,
2003).
John Sterman indicates that in systems time delayed responses often create oscillations
in matching production with demand. The resulting overshooting or undershooting of
demand can result in instability which explains the cyclical long term expansions and
contractions of certain industries (Sterman, 2000, pp. 791 – 800). In his 1999 MIT
doctoral thesis, Taylor found that long run capacity cycles in the pulp and paper industry
can be explained by capacity acquisition delays that create oscillations in capacity. The
pulp and paper industry shares many similar characteristics with the petroleum industry,
commodity price variations with growth, long supply chains with physical constraints and
capacity is added in large quantities with long capacity acquisition delays. Taylor found
that a four year acquisition delay in capacity lead to short run price and utilization
oscillations within a 14 year long capacity cycle (Sterman, 2000, pp. 824 -828).
SD has a long history of being applied to the dynamic systems of energy markets dating
back to the early 1970’s in the designing of various energy models used by the United
States Department of Energy such as COAL1 & 2, FOSSIL 1 & 2, the IDEAS
(Integrated Dynamic Energy Analysis Simulation) and the DOE’s current model, the
National Energy Model System or NEMS (EIA, 2009; DOE, 1997). All these models
were developed based on academic work by scholars such as Roger Naill, John
Sterman, George Richardson and Eric Wolstenholme, among others, each of which
have a long list of published contributions to SD.
We will use a SD qualitative model to explore the physical structure of the industry and
that systems feedback response to specific changes.
A Strategic Analysis of Petroleum Refining Infrastructure In Canada
Page 14
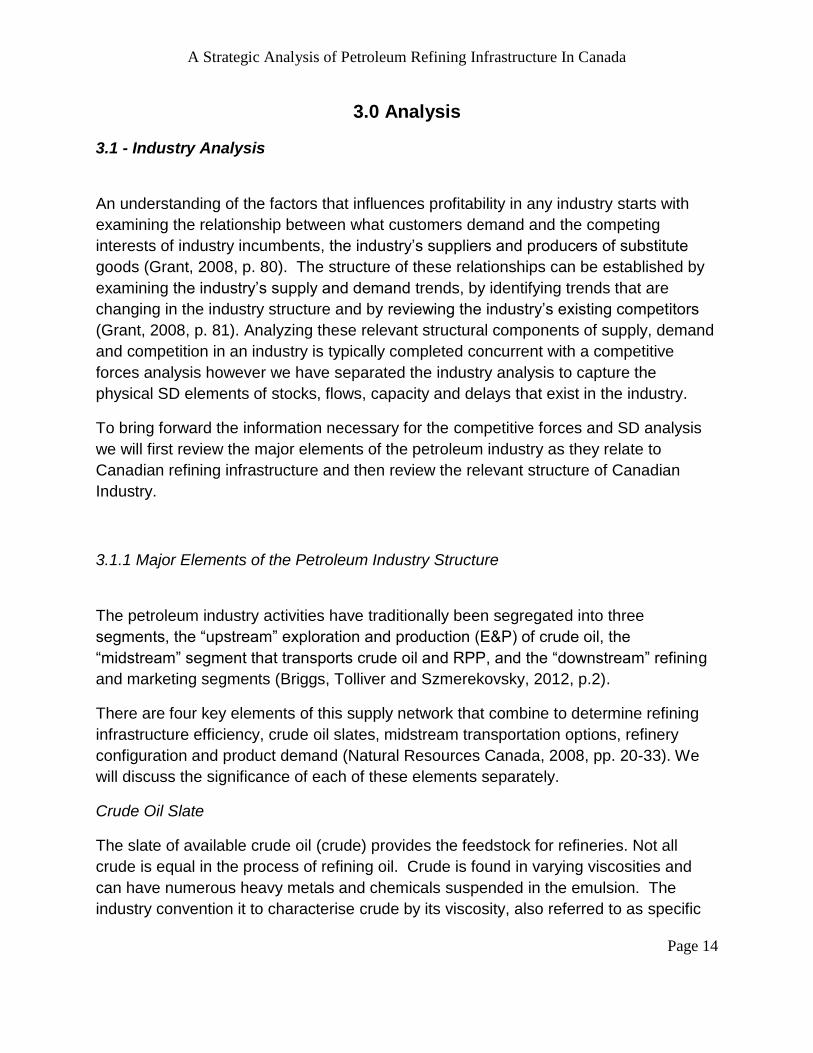
3.0 Analysis
3.1 - Industry Analysis
An understanding of the factors that influences profitability in any industry starts with
examining the relationship between what customers demand and the competing
interests of industry incumbents, the industry’s suppliers and producers of substitute
goods (Grant, 2008, p. 80). The structure of these relationships can be established by
examining the industry’s supply and demand trends, by identifying trends that are
changing in the industry structure and by reviewing the industry’s existing competitors
(Grant, 2008, p. 81). Analyzing these relevant structural components of supply, demand
and competition in an industry is typically completed concurrent with a competitive
forces analysis however we have separated the industry analysis to capture the
physical SD elements of stocks, flows, capacity and delays that exist in the industry.
To bring forward the information necessary for the competitive forces and SD analysis
we will first review the major elements of the petroleum industry as they relate to
Canadian refining infrastructure and then review the relevant structure of Canadian
Industry.
3.1.1 Major Elements of the Petroleum Industry Structure
The petroleum industry activities have traditionally been segregated into three
segments, the “upstream” exploration and production (E&P) of crude oil, the
“midstream” segment that transports crude oil and RPP, and the “downstream” refining
and marketing segments (Briggs, Tolliver and Szmerekovsky, 2012, p.2).
There are four key elements of this supply network that combine to determine refining
infrastructure efficiency, crude oil slates, midstream transportation options, refinery
configuration and product demand (Natural Resources Canada, 2008, pp. 20-33). We
will discuss the significance of each of these elements separately.
Crude Oil Slate
The slate of available crude oil (crude) provides the feedstock for refineries. Not all
crude is equal in the process of refining oil. Crude is found in varying viscosities and
can have numerous heavy metals and chemicals suspended in the emulsion. The
industry convention it to characterise crude by its viscosity, also referred to as specific

A Strategic Analysis of Petroleum Refining Infrastructure In Canada
Page 15
density or weight, and its sulfur content. Only specific refinery designs (configurations)
can process heavy or light, sweet or sour crude efficiently. Consequently, crude
supplies are segregated by weight and sulfur content and streamed to refineries that are
best suited to their characteristics based on the configuration of the refinery and the
desired yield of products (Natural Resources Canada, 2008, pp. 21-24).
The convention used by the industry to categorize crude oil viscosity is the American
Petroleum Institute’s specific gravity scale measured in degrees API. The industry
refers to light oil as being greater than 30o API, medium oil is between 27o to 30o API
and heavy oil is less than 27o API (CAPP, 2012a, p. 2). In 2011, 29% of the 3 million
barrels of Canadian crude oil production was light or medium weight and 71% was
considered heavy (CAPP, 2012a, p. 37)
Crude oil containing high sulfur content is referred to as “sour” while “sweet” crude has
low sulfur content. Sulfur content is measured as a percentage of the total volume with
sweet oil having a sulfur content of less than or equal to 0.5% and sour being above
0.5% (CAPP, 2012a, p. 2) . Sulfur is undesirable in crude oil as most refined products
are combusted resulting in the sulfur reformulating into the pollutant sulfur dioxide.
Governments continue to increase standards on polluting externalities such as sulfur.
Crude oil containing higher sulfur levels is priced at a discount to offset the additional
processing costs of removing the sulfur. Consequently, refineries are willing to pay more
for light, sweet crude than for sour heavy crude.
There are two major global standards for crude against which other crude oils are
graded and priced. West Texas Intermediate (WTI) is the primary benchmark for US
crude while North Sea Brent Oil (Brent) has become the standard for foreign oil. The
standard characteristics for WTI is an API of 40o and sulfur content of 0.5% or less while
Brent has an API of 37o and a sulfur content of 1.0%. From a refiners cost point of view
Brent should be priced less than WTI as a barrel of Brent requires more desulfurization
and refining to produce the same products as WTI however due to supply spikes from
the US Midwest and increases in Western Canadian production, WTI has traded at a
substantial discount to Brent for the past couple of years. Prior to 2005 Brent traded at a
slight discount to WTI (EIA, 2012a).
In Canada crude oil production is trending towards more heavy oil. Regionally, Western
Canada contributes 91% of all crude oil produced in Canada with the remaining majority
of Eastern Canada’s production found offshore of Atlantic Canada. Western Canadian
production totaled 2,743,000 barrels of crude oil per day in 2011 consisting of 80%
heavy and 20% light oil. Although, much of Western Canada’s production is heavy oil,
approximately 30% of it (705,000 b/d) is upgraded within Western Canada into light
synthetic oil which has refining characteristics similar to light sweet conventional, i.e.

A Strategic Analysis of Petroleum Refining Infrastructure In Canada
Page 16
greater than 30o API and less than 0.5% sulfur. The Canadian Association of
Petroleum Producers 2012 Market Forecast (CAPP, 2012a, p.37) projects growth in
both heavy and light oil production to result in total production of 3,942,000 bpd (61%)
by 2017. The majority of this growth is projected to be in heavy oil production which
CAPP has projected to grow 1,270,000 bpd (69%) over the five years ending in 2017.
Atlantic Canada oil production is light and medium oil and primarily produced offshore.
Production from existing East Coast producing fields is expected to decline by 25% over
the next five years, at which time the offshore heavy oil Hebron field is expected to go
into production to partially offset the light oil declining production (CAPP, 2012a, p. 37).
Figure 4 - Projection of Canadian Crude Oil Production
(CAPP, 2012a, p. 37)
The trend towards more heavy oil production and the asymmetrical distribution of
production across Canada creates significant logistic challenges. A substantial portion
of the oil product demand in Canada comes from Central Canada (Quebec and Ontario)
while almost all production is in the West. Existing refineries in the east are configured
for light oil refining which is the most expensive feedstock. Despite Canada producing
more than a million barrels of crude per day than it consumes, the location of the
production does not align with the location of demand. Consequently, vast quantities of
crude production or RPP need to be physically moved to meet Canada’s daily demand.

A Strategic Analysis of Petroleum Refining Infrastructure In Canada
Page 17
Mid-stream Infrastructure
Crude oil can be transported on land by pipelines, railway cars and trucks or by water
using barges or tanker ships. Inland production of crude oil is collected from the
wellhead and transported by pipeline through a field gathering system or trucked to
centralized storage tanks where it is treated, measured and stored for shipping. Once
the crude oil characteristics are determined, it is shipped through a trunk or
transmission pipeline system to a refinery or coastal port willing to purchase it. There
are more than 250,000 kilometers of field gathering pipelines and over 100,000
kilometers of transmission lines in Canada (CEPA, 2012a).
Refineries that are located close to water can receive crude by barge or large tanker
ships. Refineries with coastal water access compete with all other coastal refineries for
crude which making them a price taker of world oil prices. Inland refiners are also
typically price takers of world prices however in instances when supply dramatically
increases and outpaces the pipeline infrastructure in place to transport it, they can have
more leverage to reduce prices. Refineries with access to deep water ports compete
internationally in purchasing their crude feedstock or selling RPP’s making large
complex refineries more feasible than in inland areas as they have more options to buy
and sell.
Trucking and the use of rails cars provides flexibility to the delivery and distribution
networks. Although they are the most expensive options, they are just as critical to the
other cheaper systems as it is the combination of all three methods that makes the
global network reliable in delivering 90 million barrels of oil based products to end users
each day.
Depending on the distance and location, the transportation costs of moving a barrel of
crude or RPP over comparable distances is lowest by pipeline, then open water
shipping, followed by shipping by inland waterways, rail then trucking. Generally
speaking, open water is slightly higher than pipelines, inland waterways are moderately
higher that open water, rail is 3 to 5 times higher than pipelines with truck transportation
costs being the most expensive but over shorter distances trucking provides a
reasonable solution. The toll rate for transporting a barrel of light crude from Edmonton,
Alberta to Sarnia, Ontario in the Enbridge Mainline pipeline is $3.95 while the toll rate
from Portland, Maine to Sarnia is $4.40 (CAPP, 2012a, p.40). Rail costs from Alberta to
the East Coast can be from $12.00 to $15.00 per barrel (EIA, 2012c).
Once refined, products are shipped by pipeline, ship, rail or truck to local distribution
terminals. In the east coast Maritime region, almost all RPP are delivered by ships and
barges however in the rest of Canada it is efficient for pipelines, rail and trucks to
combine in product distribution. Due to the refinery consolidation in the Canadian

A Strategic Analysis of Petroleum Refining Infrastructure In Canada
Page 18
Industry, in many markets only one terminal is available for all marketers for loading. In
these areas, products exchange agreements are common where a refiner in one area
agrees to provide product to a competitor in that area where they do not have a refinery.
Most of the product distribution network is owned by the larger refiners, Shell, Imperial
Oil, Suncor, Ultramar, Federated Co-op, Husky and Chevron (Natural Resources
Canada, 2008, pp. 28-30).
Inventory of RPP is stored at local distribution terminals or at strategically located
storage terminals. Refiners build up inventory of crude and RPP to absorb
unanticipated supply disruptions, refinery shutdowns, regular refinery maintenance
(turnarounds) and seasonal variations in product demand. Inventory hold levels are
quite different from region to region in Canada (Natural Resources Canada, 2008, pp.
33-34).
The marketing and retailing of RPP is carried out by numerous companies and
intermediaries however they can be segregated into integrated refiner marketers or
independent marketers, companies which do not won a refinery. Of the existing eleven
companies that own refineries, nine are refiner-marketers. Refiner-marketers controlled
26% of the gasoline service stations in 2010 and 16% is under the control of the top
three, Shell, Suncor and Imperial Oil. Independent operators own the remaining 74% of
which between 15- 25% of the market is owned by a half dozen larger independent
retailers (M.J. Ervin & Associates, 2011, pp. 8-10).
Refineries
Refineries are designed with different processing configurations to efficiently refine
different weights of crude into products. Heavier crudes require more elaborate
chemical and thermal refining to optimize product yield. Refineries are categorized into
three general configurations (Natural Resources Canada, 2008, pp. 23-24);
1) Topping plants consists of crude distillation unit (CDU) and normally has a
catalytic reformer. These plants are designed to efficiently handle light sweet
crudes and condensates. Although they can process heavier crudes into
asphalt and heavy fuel oil, they are not efficient in processing heavy fuels into
lighter refined products such as gasoline.
2) Cracking refineries take the heavier middle streams of gas oils from a CDU
and “cracks” the complex gas compounds into simpler, lighter gasoline and
distillates compounds using a combination of chemical catalysts, high
temperatures and pressure.

A Strategic Analysis of Petroleum Refining Infrastructure In Canada
Page 19
3) Coking refineries processes the heaviest streams of oil and thermally cracks
the carbon bonds in heavy oils into lighter compounds using a coker or a
coker plus hydrocracker (fluid catalytic cracking unit - FCCU). Coker’s and
hydrocrackers allow the refinery to process heavier crude slates while still
yielding a high amount of lighter products. Coker’s and hydrocrackers can
operate independent of CDU complexes to upgrade heavy oil before shipping
the crude for further refining. Heavy oil upgraders create a lighter, sweeter
feedstock known as synthetic oil which has refining characteristics similar to
WTI and therefore command a higher price when sold to refineries.
In addition to these three basic configurations, each process may be paired with a
“hydrotreating” unit to reduce the sulfur and nitrogen content in crude. With the lower
sulfur content standards required by regulations more hydrotreating units are being
added to refineries as they are capable of removing up to 95% of the sulfur contained in
crude (Natural Resources Canada, 2008, p. 23-24).
These different refining configurations yield different products percentages dependant
on the weight of the crude inputted. For example, using heavy oil as a feedstock would
yield different percentage yields in each configuration.
Figure 5 - Product Yields of Refinery Configurations Using Heavy Oil Feedstock
(National Resources Canada, 2012)
Although there is some flexibility in designing the configuration to yield a higher ratio of
gasoline to distillates, or visa versa, this flexibility is limited and after a certain point
production must be increased to produce the amount of product required. Typically, a
cracking refinery will yield the following product percentages;

A Strategic Analysis of Petroleum Refining Infrastructure In Canada
Page 20
Figure 6 - Expected Yield of a Cracking Refinery
(CEPA, 2012b)
Product Slate Demand
Refining crude produces a wide array of products however it is also necessary to match
the production of products to the demand for the products.
Figure 7 - Canadian Domestic Refined Product Sales (2011)
Motor gasoline 42.00%
Diesel fuel oil 28.45%
Aviation turbo fuel, kerosene type 5.62%
Heavy fuel oil 4.59%
Petro-chemical feedstock 4.16%
Asphalt 3.84%
Light fuel oil 3.19%
Other petroleum products 2.87%
Petroleum coke 1.67%
Lubricating oils and greases 1.03%
Propane and propane mixes 1.00%
Butane and butane mixes 0.89%
Stove oil, kerosene 0.56%
Naphtha specialties 0.06%
Aviation gasoline 0.06%
Aviation turbo fuel, naphtha type 0.01%
Total RPP 100.00%
(Statistics Canada, 2012, p 11)

A Strategic Analysis of Petroleum Refining Infrastructure In Canada
Page 21
Balancing refinery configurations with the availability of crude feedstock to yield the
appropriate amounts RPP demanded requires careful planning. More often the process
yield excess which cannot be fully utilized within a supply region, the most prudent
method to clear the market of a product surplus is to sell and transport it out of the
region.
Over the past ten years, domestic sales of RPP have grown in aggregate 195,949 bpd
from 1,622,227 bpd in 2002 to 1,818,175 bpd in 2011. Although this represents a
12.1% growth (Statistics Canada, 2012, 2003) or 1.15% Compounded Average Annual
Growth Rate (CAGR) over a ten year period (Gitman and Hennessey, 2008, p. 318),
domestic demand exhibits substantial annual variation.
Figure 8 - Canadian Domestic Sales of RPP 2002 - 2011
Although the demand for RPP is obviously being influenced by economic growth, other
issues such as societal initiatives directed towards reducing energy intensity and the
growing awareness of the environmental damage caused by Green House Gases
dampen the growth expectations of the RPP.
The rate of growth in the use of individual products has been uneven. Over the past ten
years, national gasoline sales have increased 11.7% while diesel sales have increased

A Strategic Analysis of Petroleum Refining Infrastructure In Canada
Page 22
33%. The use of heavy fuel oil is down 33%, light fuel oil is down 27% but asphalt is up
26.7%.
Figure 9 - Canadian Product Demand
Summary
The relative volume of different products that the process of refining crude yields is a
function of the crude slate inputted into the refinery and the configuration of the refinery.
Different crude slates used as feedstock will produce different product yields in different
configurations.
Figure 10 - Major Elements of Refining Supply Network
Crude Oil
Slate
Mid-stream
Options
Refinery
Configuration
and Capacity
Product
Slate
Yield
Refined
Product
Demand

A Strategic Analysis of Petroleum Refining Infrastructure In Canada
Page 23
Matching a source of crude to a particular refinery’s product yield to satisfy product
demand is challenging especially given the long lead times involved in adjusting the
physical components of this chain to demand which can respond to environmental
changes much quicker.
3.2.1 Industry Structure in Canada
Refining infrastructure in Canada has undergone constant restructuring over the past 40
years. Since 1970, the number of operating refineries has dropped from 49 to just 18
producing refineries today (CAPP, 2012b). This reduction of the number of refineries in
Canada was not a function of reduced demand for refined products but was undertaken
to take advantage of economies of scale in the production of refined products. In spite
of this 61% drop in the number of refineries, the refining capacity in Canada has
increased 47% during this same time period (BP, 2012a).
Figure 11 - Refinery Capacity Verses Number of Refineries
This reduction in the number of operating refineries has concentrated the ownership
control of these refineries. The remaining 18 operating refineries are owned by 11
companies; two companies control 43% of Canada’s refining capacity while largest five
refinery owners control 80% (CAPP, 2012a).

A Strategic Analysis of Petroleum Refining Infrastructure In Canada
Page 24
Figure 12 - Ownership of Canadian Refinery Capacity
Company Capacity
(bpd) % Total
Capacity
Imperial Oil 516,000 25.67%
Suncor 350,000 17.41%
Irving Oil 300,000 14.93%
Ultramar 265,000 13.18%
Shell Canada 175,000 8.71%
Five Largest Refiners 1,606,000 79.90%
Next six owners 404,000 20.10%
Total Canadian Capacity 2,010,000 100.00%
(CAPP, 2012a, pp. 39-40)
Vertically integrated oil companies own 57% of the refining capacity, 18.7% are State
Owned Enterprises (SOE) while the remaining are independent of upstream production
although some have downstream retail marketing outlets .
Further complicating this oligopoly structure is the regional concentration of these large
refineries:
- 67% of Western Canada’s refinery capacity is owned by three
companies,
- 84% of Ontario’s capacity is owned by three companies,
- 100% of Quebec’s capacity is owned by two companies while,
- 83% of the Maritime Provinces capacity is owned by two companies.
In addition to the concentration of ownership, in certain regions of Canada, individual
large refineries produce a disproportionate share of the regions RPP. The Ultramar
265,000 bpd refinery in Levy, Quebec represents 67% of Quebec’s throughput capacity
and without it operating Quebec would require 225,000 bpd of petroleum products from
outside Quebec and Ontario would require an additional 40,000 bpd that Quebec
refineries currently provide.

A Strategic Analysis of Petroleum Refining Infrastructure In Canada
Page 25
Industry defines throughput capacity as the volume of crude oil and feedstock that can
fed into the distillation unit which is sometimes referred to as the charge capacity of the
refinery (EIA, 2012b). Refineries can operate continuously 24/7 however about 5% of
operating time is consider necessary for annual maintenance. Consequently, refineries
that operate at 95% utilization are considered as being at full capacity. Refined product
outputs can confuse the issue as refining increases the volume of output by as great as
Figure 13 - Throughput Capacity of Canadian Refineries
Capacity Percent of
Western Capacity (bpd) Total
Husky Prince George 12,000 0.59%
Chevron Burnaby 55,000 2.72%
BC Capacity 67,000 3.31%
Imperial Oil Edmonton 187,000 9.23%
Shell Scotford 100,000 4.94%
Suncor Edmonton 135,000 6.66%
Husky Lloydminister 29,000 1.43%
Alberta Capacity 451,000 22.27%
Regina Consumers Co-Op 100,000 4.94%
Moose Jaw Refinery 15,000 0.74%
Saskatchewan Capacity 115,000 5.68%
Western Capacity 633,000 31.25%
Ontario Capacity
Nova Sarnia 78,000 3.85%
Suncor Sarnia 85,000 4.20%
Shell Sarnia 75,000 3.70%
Imperial Oil Sarnia 120,000 5.92%
Imperial Oil Nanicoke 120,000 5.92%
Ontario Capacity 478,000 24.37%
Quebec Capacity Ultramar Levis 265,000 13.08%
Suncor Montreal 130,000 6.42%
Total Quebec Capacity 395,000 19.50%
Maritime Capacity North Atlantic Newfoundland 115,000 5.68%
Imperial Oil Dartmouth 89,000 4.39%
Irving Oil Saint John 300,000 14.81%
Total Maritime Capacity 504,000 24.88%
Total Canadian Capacity 2,010,000 100.00%
(CAPP, 2012a, pp. 39-40)

A Strategic Analysis of Petroleum Refining Infrastructure In Canada
Page 26
7% (volumetric gain) resulting in some refineries operating for short periods of time at
over 100% of capacity if output volumes of refined products are being compared to
capacity. Although refineries are routinely maintained and debottlenecked, no new
refineries have been built in Canada since 1984 (Natural Resources Canada, 2008,
p.25)
In 2011, Canada extracted over 3 million bpd of crude production of which
approximately 1.8 million bpd was used to meet the countries total demand for RPP.
Figure 14 - Summary of Canadian Refined
Products Production in 2011
Canada
Crude Slates
Light/Medium Conventional 689,544
Upgraded Synthetic 705,000
Heavy Oil 1,610,712
Total Orbit Domestic Supply 3,005,256
Crude Imports (Domestic) 326,140
Crude Imports (International) 679,581
Crude Exports - 2,342,427
Inventory Build (draw) 9,617
Other Feedstock 144,251
Refinery Charge Production 1,822,418
Volumetric Gains 87,863
Refinery output Production 1,910,281
Refined Imports 262,237
Refined Exports 387,870
Adjustments/Interprovincial 33,526
Net Refined Products 1,818,174
Demand
Gasoline 762,485
Diesel 517,289
Heavy Fuel 86,730
Other Fuels 451,670
Total Demand 1,818,174
(Statistics Canada, 2012, p. 28-29)

A Strategic Analysis of Petroleum Refining Infrastructure In Canada
Page 27
On the surface the market appears to be a well-balanced market operating at 91% of
capacity (1,822,418/ 2,010,000 bpd) with the excess crude being exported. At a 91%
utilization rate refineries should be able to maintain a regular maintenance schedule and
operate at profitable levels. Over the past ten years the industry has maintained
utilization at 88% to 95% of available capacity.
Figure 15 - Canadian Refinery Utilization
Canada is a large country and the physical movements of large quantities of volatile
fluids create natural constraints which must be considered. It is expensive and
dangerous to move large quantities by rail or truck. Consequently, the lack of natural
deep water seaways or pipelines has created partially isolated regional zones of supply
and demand in Canada. When regional differences between capacities demand for
products are considered, specific regional imbalances begin to emerge.
A Strategic Analysis of Petroleum Refining Infrastructure In Canada
Page 28
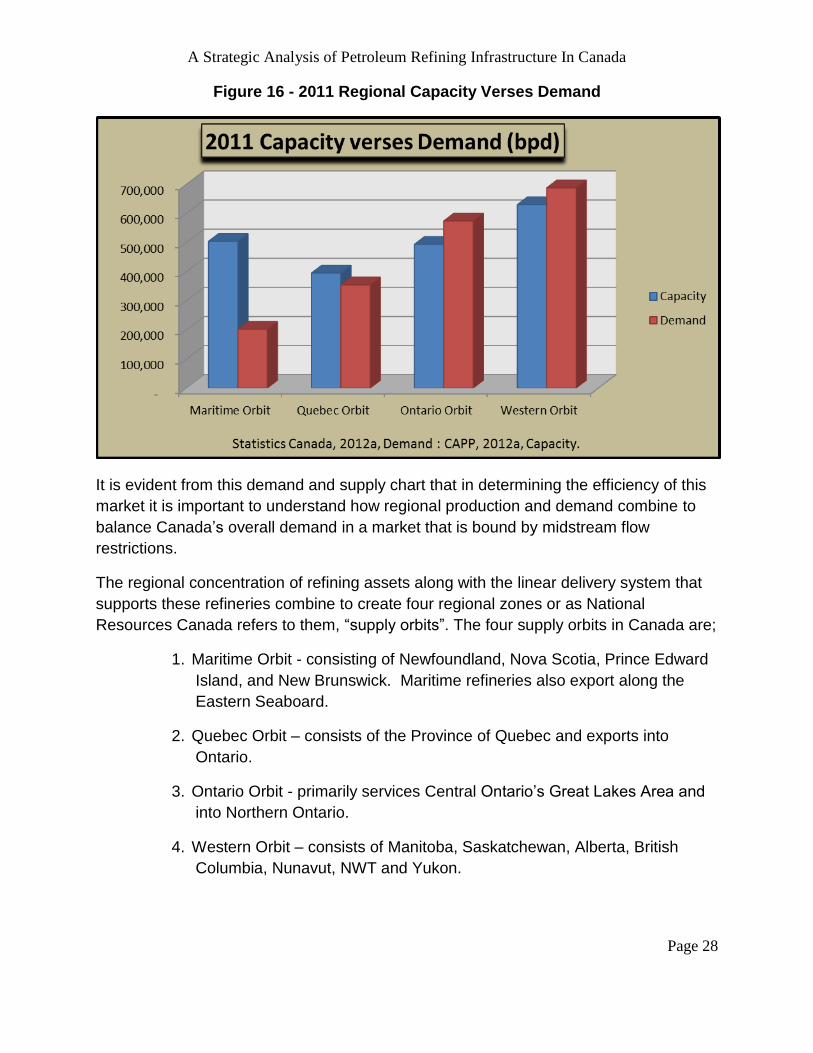
Figure 16 - 2011 Regional Capacity Verses Demand
It is evident from this demand and supply chart that in determining the efficiency of this
market it is important to understand how regional production and demand combine to
balance Canada’s overall demand in a market that is bound by midstream flow
restrictions.
The regional concentration of refining assets along with the linear delivery system that
supports these refineries combine to create four regional zones or as National
Resources Canada refers to them, “supply orbits”. The four supply orbits in Canada are;
1. Maritime Orbit - consisting of Newfoundland, Nova Scotia, Prince Edward
Island, and New Brunswick. Maritime refineries also export along the
Eastern Seaboard.
2. Quebec Orbit – consists of the Province of Quebec and exports into
Ontario.
3. Ontario Orbit - primarily services Central Ontario’s Great Lakes Area and
into Northern Ontario.
4. Western Orbit – consists of Manitoba, Saskatchewan, Alberta, British
Columbia, Nunavut, NWT and Yukon.

A Strategic Analysis of Petroleum Refining Infrastructure In Canada
Page 29
Figure 17 - Canadian Supply Orbits
(Natural Resources Canada, 2012).
Each orbit has different sources of crude feedstock and each have developed unique
resources to refine petroleum products. Although nationally the demand for petroleum
products is balanced relative to production, regionally each orbit has significantly
different characteristics along the supply network. For example:
- The Maritime’s refine much more finished products than they consume
and as their refineries has access to ocean ports, the excess refined
products are exported to the US seaboard and into the Arctic.
- Ontario’s demand is greater than their production while Quebec’s
production is greater than demand. Consequently, Quebec’s
overproduction balances some of Ontario’s shortfall.
- Alberta extracts more crude than all of Canada can use however as
limited pipeline capacity is available flowing east and west, most of the
excess crude is exported to the US. Alberta also refines more RPP
than they consume and although their surplus is transported and
consumed in the supply orbit it is not sufficient to meet the orbits total
demand.
In order to provide a more transparent understanding of interrelationships of these orbits
we will examine the supply network in each orbit.

A Strategic Analysis of Petroleum Refining Infrastructure In Canada
Page 30
Maritime Supply Orbit
The Maritime supply orbit includes the provinces of Newfoundland, Nova Scotia, Prince
Edward Island, and New Brunswick. The three refineries in this orbit provides enough
refined products to meet all of the orbits domestic demand and export the surplus to the
Eastern Seaboard of the United States and into the Arctic.
The defining feature of this market is that their access to deep water ports provides a
flexible cost effective gateway to foreign markets not only for importing crude but also
for exporting finished products. The following production summary chart reflects the
orbits supply, production and demand structure whereas domestic crude which
originates from within the orbit accounts for 20% of the total crude input into refineries.
Figure 18 - Summary of Maritime Refined Products Production in 2011 (bpd)
Maritime Orbit
Crude Slates
Light/Medium Conventional 83,543
Upgraded Synthetic 0
Heavy Oil 2,712
Total Orbit Supply 86,255
Crude Imports (Domestic) -
Crude Imports (International) 325,035
Crude Exports -
Inventory Build (draw) 5,222
Other Feedstock 10,648
Refinery Charge Production 427,160
Volumetric Gains 20,617
Refinery Production 447,777
Refined Imports 39,427
Refined Exports 238,768
Adjustments/Interprovincial - 46,376
Net Refined Products 202,060
Demand
Gasoline 61,956
Diesel 48,542
Heavy Fuel 32,848
Other Fuels 58,714
Total Demand 202,060
(Statistics Canada, 2012a, p. 28-29)

A Strategic Analysis of Petroleum Refining Infrastructure In Canada
Page 31
Exports excluded, domestic crude could provide 45% of domestic consumption, with
volumetric gains taken into consideration. The surplus production from the refineries
allowed for 53% of the refined products to be exported out of the country and a net
16,000 bpd to be transferred to Ontario and Quebec’s orbits.
Crude Slates
The supply of crude in the Atlantic orbit is a mix of domestic production and imported
crude. During 2011, 83,500 bpd of light and medium crude and 2,700 bpd of heavy
crude were provided domestically, primarily from offshore production. Domestic crude
production provided about 45% of the orbits domestic demand. An additional 325,000
bpd was imported to meet the remaining 115,000 bpd domestic demand and provide
the feedstock for the 238,768 bpd of refined products exported out of the orbit. In 2011,
60% of the imported oil came from OPEC nations, primarily Saudi Arabia, Nigeria and
Angola, 15% came from the North Sea and the remaining came from numerous smaller
sources.
Of the 427,000 bpd of crude processed, 99% was a light or medium blend with the
remaining being a conventional heavy oil. The orbits typically maintains a crude
inventory of between 4 to 6 million barrels providing a 10 to 15 day supply of feedstock
or enough to meet domestic demand for 20 to 30 days (Statistics Canada, 2012, p 28).
This orbits access to deep water ports provides the Atlantic refineries with the ability to
purchase crude from multiple global sources. This optionality allows them to tailor the
purchases of their crude slate to an ideal mix that optimizes the yield of their refining
configuration and satisfy this orbits atypical demand for medium weight finished
products. This ability to pick and choose whatever supply source can provide the best
weight of crude for the refinery configuration historically was considered an advantage
as they were able to but product to best utilize their fixed cost design, rather than having
to design more complex refineries to produce the middle and heavier product slate that
the orbit demanded. However over the past number of years, this flexibility in crude
slate comes at a price as it must purchase crude based on Brent Petroleum prices
which has been trading at a 15 to 20 dollar premium to WTI prices.
Midstream delivery and distribution
Imported crude is delivered through sea faring vessels which dock at seaports and then
piped short distances to the orbits three refineries. No crude is transported in or out of
the orbit through pipelines. Waterways provide world access through the Atlantic
Ocean and the St Lawrence Seaway provides waterway access to Quebec and Ontario
supply orbits.

A Strategic Analysis of Petroleum Refining Infrastructure In Canada
Page 32
Refined products are primarily distributed through ships and barges to terminals and
storage facilities, from which products are typically trucked to end users. The inventory
of refined products held in storage terminals, range from 6 to 7 million barrels which is
sufficient to meet domestic and import demand for 15 to 18 days or domestic demand
for 32 to 38 days.
Refineries
The Atlantic supply orbit has three refineries, two larger complexes which provide over
80% of the orbits refined products and a smaller plant which also processes heavy oils
and produces the orbits asphalt supply.
Figure 19- Maritime Refinery Configurations Capacity
Capacity (bpd) % Total Configuration
North Atlantic – Newfoundland 115,000 22.82% CDU+Reformer/Cracker/Hydrotreating
Imperial Oil Dartmouth 89,000 17.66% CDU+Reformer/Cracking/hydrotreating/Asphalt
Irving Oil Saint John 300,000 59.52% CDU+ Reformer/Cracking/Hydrotreating
Maritime Orbit Capacity 504,000 100.00%
(CAPP, 2012a, p. 39- 40)
Utilization in 2011 was 85% of capacity however over the past 10 years has averaged
90% of capacity. Domestic demand was 202,060 bpd in 2011 which represents 40% of
orbits capacity, so even if one refinery went out of production domestic demand could
still be satisfied from the remaining refineries without depleting inventories. The surplus
output is exported primarily to the US however some surplus is transported to the
Quebec and Ontario orbits and supplies the east coast of the Canadian Arctic.
Product Demand
Atlantic Canada has historically had a somewhat atypical demand profile as their large
refining capacity has developed a reliance on heavy fuels for electricity generating
plants and middle distillates for home heating. The orbits reliance on heavier fuel
products can be easily recognized in a comparison with Canada’s aggregate domestic
product consumption mix.

A Strategic Analysis of Petroleum Refining Infrastructure In Canada
Page 33
Figure 20 - Product Demand Mix Canada Verse Maritime
In the past it was cost effective to use heavier oil based sources for electricity and home
heating however recently these uses are being displaced by lower cost natural gas. This
shift to substitute products is reflected the in the negative demand trends in heavy fuel
oil and stove kerosene (included in “Others”) over the past 10 years.
Figure 21 - Maritime Product Demand

A Strategic Analysis of Petroleum Refining Infrastructure In Canada
Page 34
The orbit is self-sufficient in its ability to produce all the different RPP that it uses except
for lubricating oil and greases of which it must import about 1000 bpd. The Maritime’s
orbits excess capacity and ability to sell off unused surplus can efficiently manage any
changes to its domestic demand structure or short term disruption in production.

A Strategic Analysis of Petroleum Refining Infrastructure In Canada
Page 35
Quebec Supply Orbit
The Quebec supply orbit consists of the province of Quebec. There are two refineries in
this orbit which provides sufficient production capacity to satisfy the orbits demand.
Quebec does not produce any crude consequently 92% of its required feedstock is
imported from outside of Canada, 7% is from the Maritime orbit and a small amount has
recently found its way from Western Canada.
Figure 22 - Summary of Quebec Orbits Refined
Products Production in 2011 (bpd)
Quebec
Crude Slates
Light/Medium Conventional 0
Upgraded Synthetic 0
Heavy Oil 0
Total Orbit Supply 0
Crude Imports (Domestic)
26,429
Crude Imports (International) 302,528
Crude Exports 0
Inventory Build (draw) 4,810
Other Feedstock 15,634
Refinery Charge Production 349,401
Volumetric Gains 4,581
Refinery Gross Production 353,982
Refined Imports 85,407
Refined Exports 56,804
Adjustments/Interprovincial - 28,084
Net Refined Products 354,501
Demand
Gasoline 154,728
Diesel 90,799
Heavy Fuel 22,360
Other Fuels 86,614
Total Demand 354,501
(Statistics Canada, 2012a, p. 38-39)
Crude Slates
As previously mentioned, Quebec’s supply of crude is 92% imported crude and 8% from
domestic supply. The domestic supply is primarily from offshore Atlantic production
A Strategic Analysis of Petroleum Refining Infrastructure In Canada
Page 36
however about 3,000 bpd is from the Western Orbit bring brought through Ontario.
Approximately 302,000 bpd was imported from outside of Canada to meet domestic
demand. OPEC nations, primarily Algeria and Angola, accounted for 53% of the
imported supply, the North Sea provided 16%, and the remaining came from numerous
smaller sources.
Of the 349,000 bpd of crude used, 86% was a light sweet blend, 13% was conventional
heavy oil and a small amount of synthetic crude was processed. Crude inventory levels
are maintained between 7 to 9 million barrels which is sufficient to provide 15 to 20
day’s supply of feedstock for the refineries.
Midstream delivery and distribution
Quebec has good waterway access to global markets through the St. Lawrence Seaway
and also has good pipeline access to feedstock from Northeast US and from Montreal
into Ontario. As the size of vessels that can access the Seaway is limited, it is often cost
effective for crude to be transported by pipeline or unit train. The Seaway is impassable
at time during the winter months which necessitates a higher level of inventory during
winter. In 2011 almost half of the crude used in refining was transported to the refineries
by pipeline.
A 240,000 bpd pipeline moves crude from Montreal, Quebec to Sarnia, Ontario
(Enbridge’s Line 9). Originally, the line was designed to transport Western crude to
Montreal however it was reversed in 1999 to help balance feedstock demands in
Ontario. Enbridge has applied to once again reverse this line in 2014 and increase its
flow capacity to 300,000 bpd to accommodate the transportation of Western crude to
Montreal (Enbridge, 2012). Supplying 200,000 plus bpd of WTI priced western crude to
Montreal would be expected to immediately displace the higher Brent Oil priced
imported oil and dramatically reduce this orbits dependence on the 300,000 bpd of
imported oil.
Refined products are distributed through barges, local area pipelines and trucks to
terminals and storage facilities, from which products are typically trucked to end users.
The Trans Northern Pipeline (TNPL) is a 132,600 bpd refined product transmission line
from Montreal to the Toronto area and Ottawa. This line allows RPP from Montreal
refineries and global imports arriving at Montreal via the Seaway access to the southern
Ontario market.
Inventory of refined products held in storage and terminals ranges from 11 to 12.5
million barrels which is sufficient to meet demand for 30 to 36 days.

A Strategic Analysis of Petroleum Refining Infrastructure In Canada
Page 37
Refineries
Quebec only has two refineries and both are required to meet the orbits demand for
RPP. Both refineries have cracking units while the Suncor plant also has an asphalt
plant.
Figure 23 – Quebec Orbits Capacity
Capacity (bpd) % Total Configuration
Ultramar Levis 265,000 67.09% CDU/Cracking/Reformer/Hydrotreating
Suncor Montreal 130,000 32.91% CDU/ Reformer/Cracking/hydrotreating/Asphalt
Quebec Orbit Capacity 395,000 100.00%
( CAPP, 2012a, pp.39-40)
Utilization in 2011 was 89% of capacity however over the past 10 years has averaged
93% of capacity. Domestic demand was 354,501 bpd in 2011 which is more than any
one refinery can provide.
Product Demand
The mix of products demanded in Quebec emulates the aggregated Canadian Product Mix with some minor variations.
Figure 24 - Canada Verses Quebec's Product Demand Mix
A Strategic Analysis of Petroleum Refining Infrastructure In Canada
Page 38
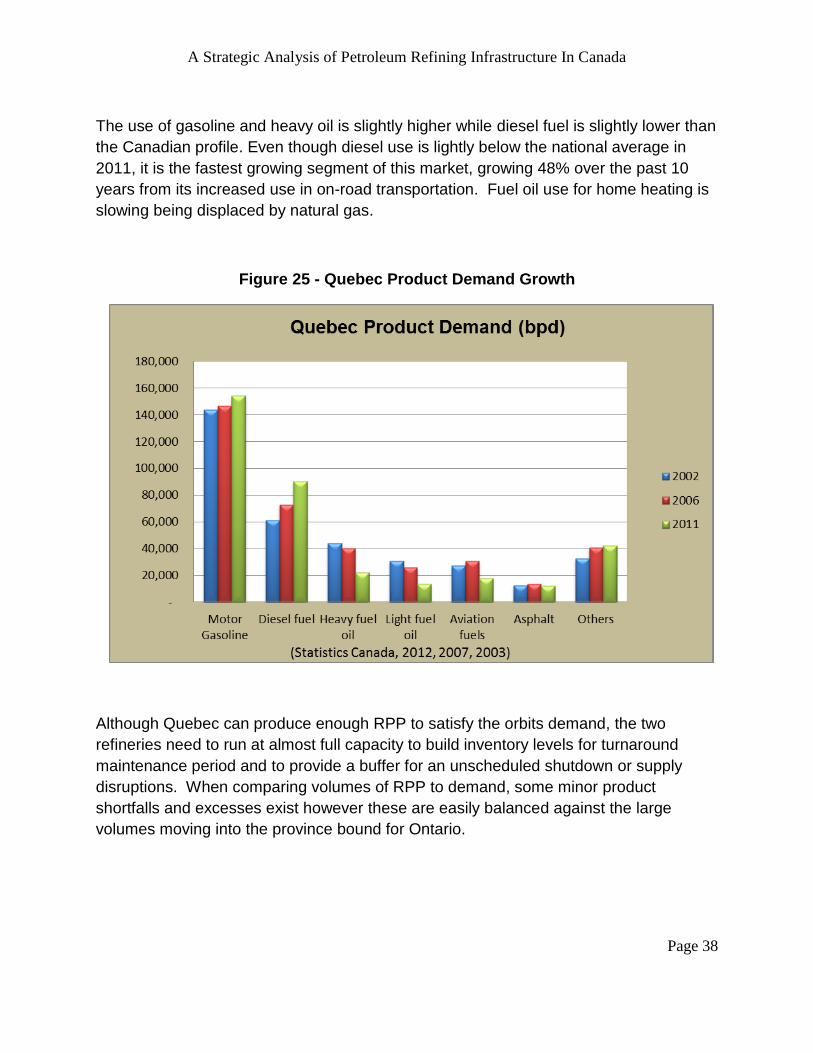
The use of gasoline and heavy oil is slightly higher while diesel fuel is slightly lower than
the Canadian profile. Even though diesel use is lightly below the national average in
2011, it is the fastest growing segment of this market, growing 48% over the past 10
years from its increased use in on-road transportation. Fuel oil use for home heating is
slowing being displaced by natural gas.
Figure 25 - Quebec Product Demand Growth
Although Quebec can produce enough RPP to satisfy the orbits demand, the two
refineries need to run at almost full capacity to build inventory levels for turnaround
maintenance period and to provide a buffer for an unscheduled shutdown or supply
disruptions. When comparing volumes of RPP to demand, some minor product
shortfalls and excesses exist however these are easily balanced against the large
volumes moving into the province bound for Ontario.

A Strategic Analysis of Petroleum Refining Infrastructure In Canada
Page 39
Figure 26 - Quebec's Product Balance
Even though the orbit is close to being self-sufficient in its ability to produce enough
RPP to meet demand, over 142,000 bpd of RPP was brought into the province and over
189,000 bpd was shipped out. This large volume of product movement is required for
various reasons:
- About 150,000 bpd of RPP is received and transferred into the
Ontario’s market to balance Ontario’s demand.
- RPP movement is needed to balance out the daily, weekly and
seasonal timing of the demand for certain types of products and
building inventories to meet these requirements in Quebec and Ontario
orbits.
- As Quebec refineries approach their operating capacity, there is a lack
of flexibility in the product yields. This lack of slack creates some
production excesses and shortfalls of products that need to be traded
off through exports or interprovincial transfers.
Moving products increase the costs of the system and can add $2 to $10 per barrel
depending on how it is transported and where it sold.

A Strategic Analysis of Petroleum Refining Infrastructure In Canada
Page 40
Ontario Supply Orbit
The capacity of the refineries in the Ontario Supply Orbit can only provide 86% of the
orbits demand. This leaves it dependent on RPP transported from outside the supply
orbit. Additionally, Ontario produces almost no crude itself which leaves it dependent on
outside sources for almost all of its feedstock. Ontario requires about 100,000 bpd of
Interprovincial transferred RPP and 52,000 bpd of imports to balance their demand.
Figure 27 – Summary of Ontario's Refined
Product Production in 2011 (bpd)
Ontario
Crude Slates
Light/Medium Conventional 1
Upgraded Synthetic 0
Heavy Oil 0
Total Orbit Domestic Supply 1
Crude Imports (Domestic) 299,711
Crude Imports (International) 52,018
Crude Exports
Inventory Build (draw) 319
Other Feedstock 77,521
Refinery Charge Production 429,570
Volumetric Gains 30,400
Refinery Gross Production 459,970
Refined Imports 56,015
Refined Exports 45,623
Adjustments/Interprovincial 103,566
Net Refined Products 573,928
Demand
Gasoline 288,074
Diesel 123,159
Heavy Fuel 8,861
Other Fuels 153,834
Total Demand 573,928
(Statistics Canada, 2012a, p. 48-49)
Crude slates
Ontario’s supply of crude supply is practically all from outside the orbit, 85% is supplied
from the Western Orbit, less than 1% is from the east coast and 15% is imported from

A Strategic Analysis of Petroleum Refining Infrastructure In Canada
Page 41
outside the country. Approximately 52,000 bpd was imported primarily from the North
Sea (18,000 bpd), US (7,810 bpd), and Mexico (6,155 bpd).
Of the crude charged in production, 61% was light conventional crude, 19% was
synthetic crude, 15% was conventional heavy oil, and 4% was a heavy bitumen blend.
Crude inventory levels are quite limited typically maintained between 2 to 3 million
barrels which is only sufficient to provide 5 to 7 day’s supply of feedstock for the
refineries. The refineries close proximity to US feedstock offsets some of the risks of
this tight inventory hold however for an orbit with no internal supply of crude it is an
economic risk to be committed to such a lean chain.
Midstream delivery and distribution
Most of the Crude and RPP movement in Ontario is through pipelines. Ontario has
access to feedstock from Montreal, Northern US and from Western Canada. In 2011
99% of the crude used in refining was transported to the refineries by pipeline. Western
crude is transported into Ontario via the Enbridge Mainline from Hardisty, Alberta to
Superior then Sarnia which can currently move over 700,000 bpd into Sarnia through
lines 5 and 6b. Imported and Eastern Canadian crude is piped via Enbridge’s Line 9
from Montreal. A proposed reversal of line 9 in 2014 would substantially reduce the
ability to move imported oil to Ontario refineries unless it came through Enbridge’s
mainline.
Trans Canada Pipelines is considering converting an existing natural gas pipeline to a
crude line which could transport an additional 625,000 bpd to Ontario and on to
Montreal from Western Canada. An extension to the existing line could take this line to
Quebec City at which point crude could be shipped to the Atlantic orbit or sold on the
global market.
Refined products are distributed through pipelines, barges, rail and trucks to terminals
and storage facilities, from which products are typically trucked to end users. Most RPP
are piped into the Southern Ontario market via the 132,600 bpd Trans Northern Pipeline
(TNPL) from Montreal. Marine transport by smaller ships and barges into Sault Ste.-
Marie and Thunder Bay from Sarnia moves a small amount of RPP into the northern
markets. The inventory of refined products held in storage and terminals ranges from
16 to 18 million barrels which is sufficient to meet demand for 27 to 30 days.
Refineries
Ontario has four refineries and a petrochemical plant that produces distillates as part of
its petrochemical formation process. Three refineries are configured to refine light
sweet or light sour crude but the 120,000 bpd Imperial Oil Sarnia plant also has a Coker
unit which can process heavy oil from Western Canada.

A Strategic Analysis of Petroleum Refining Infrastructure In Canada
Page 42
Figure 28 - Ontario Orbit's Capacity
Capacity (bpd) % Total Configuration
Nova Sarnia 78,000 15.80% Petrochemical Plant
Suncor Sarnia 85,000 17.22% CDU/ Reformer/Cracking/Hydrotreating
Shell Sarnia 75,000 15.19% CDU/Cracking/Reformer/Hydrotreating
Imperial Oil Sarnia 120,000 24.31% CDU/Cracking/Hydrotreating/Coker
Imperial Oil Nanicoke 120,000 24.31% CDU/ Reformer/Cracking/hydrotreating/Asphalt
Ontario Orbit Capacity 478,000 100.00%
(CAPP, 2012a, pp. 39-40)
Utilization in 2011 was 90% of capacity however these refineries are older and low 90%
utilization is probably their maximum capacity. Domestic demand was 574,000 bpd in
2011 which was 145,000 bpd more than what was produced.
Product Demand
The mix of products demanded in Ontario is substantially different than Canada overall
Product Mix, especially in the gasoline, diesel and heavy fuel product offering.
Figure 29 - Canada verses Ontario's Product Demand Mix
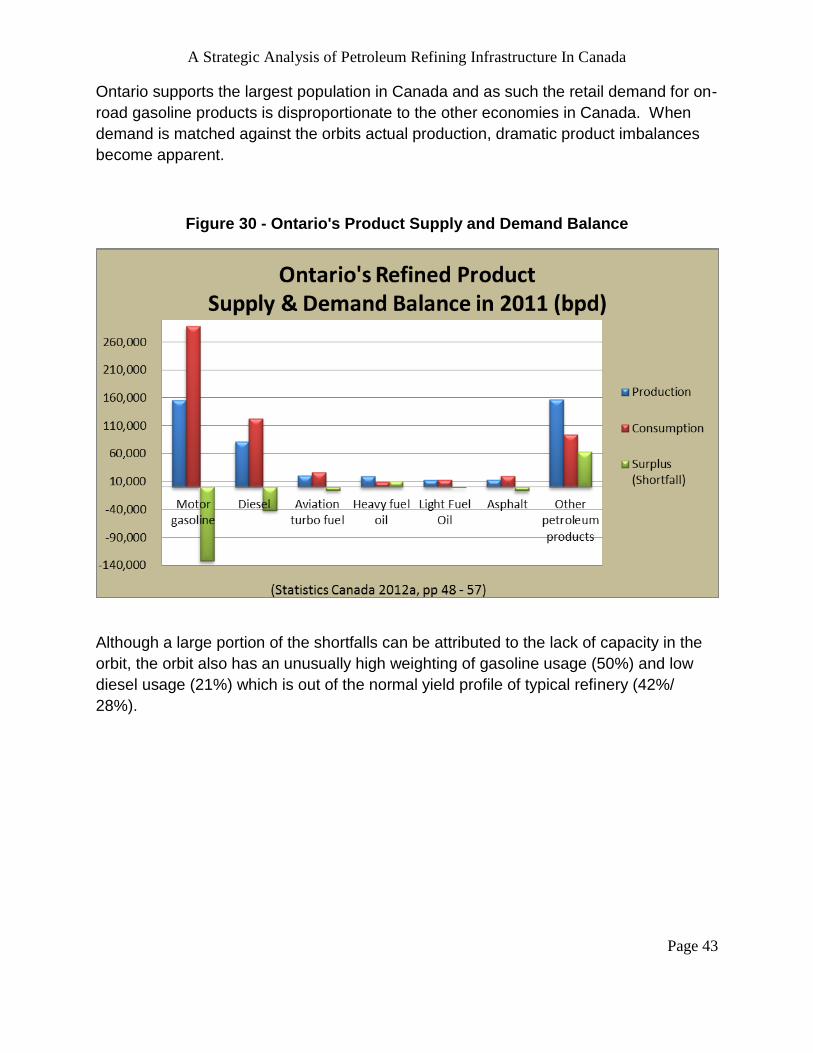
A Strategic Analysis of Petroleum Refining Infrastructure In Canada
Page 43
Ontario supports the largest population in Canada and as such the retail demand for on-
road gasoline products is disproportionate to the other economies in Canada. When
demand is matched against the orbits actual production, dramatic product imbalances
become apparent.
Figure 30 - Ontario's Product Supply and Demand Balance
Although a large portion of the shortfalls can be attributed to the lack of capacity in the
orbit, the orbit also has an unusually high weighting of gasoline usage (50%) and low
diesel usage (21%) which is out of the normal yield profile of typical refinery (42%/
28%).

A Strategic Analysis of Petroleum Refining Infrastructure In Canada
Page 44
Figure 31 - Ontario's Product Demand Growth
Gasoline, diesel and aviation fuel use has grown along with economic and population
growth. Over the past ten years as the volume of gasoline use has grown 10.38%,
diesel has grown 11.6% and aviation fuel has grown 23%.

A Strategic Analysis of Petroleum Refining Infrastructure In Canada
Page 45
Western Supply Orbit
The Western Orbit consists of the provinces of Manitoba, Saskatchewan, Alberta,
British Columbia, and the three northern territories of Nunavut, NWT and Yukon. There
are eight refineries in this orbit however two are asphalt plants. In addition to the eight
refineries there are also six heavy oil upgraders capable of upgrading up to 1,400,000
bpd of heavy oil to lighter synthetic oil.
Figure 32 - Western Orbit's Refined Product
Production in 2011 (bpd)
Western
Crude Slates
Light/Medium Conventional 606,000
Upgraded Synthetic 705,000
Heavy Oil 1,432,000
Total Orbit Domestic Supply 2,743,000
Crude Imports (Domestic) 0
Transfers to Ontario and Quebec Orbits - 300,917
Crude Exports - 1,865,510
Inventory Build (draw) - 734
Other Feedstock 40,448
Refined Charge Production 616,287
Volumetric Gains 32,265
Refinery Production 648,552
Refined Imports 81,388
Refined Exports 46,675
Adjustments/Interprovincial 4,420
Net Refined Products 687,685
Demand
Gasoline 230,350
Diesel 254,439
Heavy Fuel 19,320
Other Fuels 183,576
Total Demand 687,685
(Statistics Canada, 2012a, p. 28-29)

A Strategic Analysis of Petroleum Refining Infrastructure In Canada
Page 46
The supply and demand in Alberta and Saskatchewan are balanced as they have 90%
of the orbits refining capacity. The remaining provinces and territories rely on product
transfers from Alberta or Saskatchewan or imports to balance demand.
Crude slates
Western Canada contributes 91% of all crude oil produced in Canada with production
totaled 2,743,000 barrels of crude oil per day in 2011 consisting of 80% heavy and 20%
light oil. Although, much of Western Canada’s production is heavy oil, approximately
30% of it (705,000 b/d) is upgraded within Western Canada into light synthetic oil which
has refining characteristics similar to light sweet conventional. Excess crude is
produced in Alberta and Saskatchewan of which 300,000 bpd was transferred to
Ontario and Quebec orbits and 1,865,000 was exported to the US in 2011.
Refineries inventories of crude are maintained a very low level due the availability of
supply held in the transmission lines. Reported inventories by refineries were only two
to three million barrels which is only four to five days’ supply.
Midstream delivery and distribution
The producing provinces of Western Canada are landlocked although well-established
gathering and transmission pipeline systems are in place as their fields have been
producing for many years. Consequently all crude movement to refineries is by
pipelines.
Numerous gathering lines run from Fort McMurray, Cold Lake and Northern BC into
Edmonton and onto Hardisty, Alberta. Larger transmission lines move crude through;
- Kinder Morgan’s Trans Mountain Pipeline (300,000 bpd) from
Edmonton to Vancouver and Washington,
- Enbridge Mainline (2,327,000 bpd) from Edmonton and Hardisty East
through Saskatchewan then into Minnesota and the Great Lakes area
eventually connecting into Sarnia from northern US,
- Trans Mountain Keystone (591,000 bpd) from Edmonton and Hardisty
East through Southern Saskatchewan and onto Wood River, Illinois.
- Kinder Morgan Express line (280,000 bpd), south from Hardisty to
Montana and Wood River, Illinois.
In all, there currently exists capacity to transmit 3,498,000 bpd of which 1,566,750 is
designed for light crude and 1,931,250 for heavy crude. Enbridge’s mainline has

A Strategic Analysis of Petroleum Refining Infrastructure In Canada
Page 47
capacity to transmit 491,200 of light crude through line 5 and 231,400 bpd of heavy
crude through line 6b to Sarnia (Capp, 2012a, p.20).
It should be pointed out that the midstream infrastructure is designed to take crude and
RPP out of the Orbit, limited capacity is available to flow back into this orbit except
around the fringes that borders the US. Should an unforeseen event occur that disrupts
a significant portion of production, it would be expensive to import product to balance
demand given the large size of this orbit.
As had previously mentioned in Ontario midstream review, Trans Mountain is
considering converting their underutilized natural gas Canadian Mainline to transport up
to 625,000 bpd of crude into southern Ontario and possibly as far as Quebec City where
it can connect onto the St. Lawrence Seaway.
There are currently three contentious applications for new or expansions of existing
pipelines being considered, Keystone XL, the Northern Gateway, and the Trans
Mountain expansion. These proposals are for the transmission of crude for export and
fall outside the boundaries of our study, other than they add flexibility to the existing
system which could reduce the discount for heavy crude and possibly allow Western
crude to be priced off Brent Oil.
Refineries
The Western Orbits six refineries and two asphalt plants have capacity to produce
633,000 bpd.
Figure 33 - Western Orbit Capacity
Capacity (bpd) % Total Configuration
Husky Prince George 12,000 1.90% CDU/ Reformer/Cracking
Chevron Burnaby 55,000 8.69% CDU/ Reformer/Cracking
BC Capacity 67,000 10.58%
Imperial Oil Edmonton 187,000 29.54% CDU/ Reformer/Cracking/hydrotreating/Asphalt
Shell Scotford 100,000 15.80% CDU/ Reformer/Cracking/Hydro refining
Suncor Edmonton 135,000 21.33% CDU/Cracking/Hydrotreating/Coker
Husky Lloydminister 29,000 4.58% CDU / Asphalt Plant
Alberta Capacity 451,000 71.25%
Regina Consumers Co-Op 100,000 15.80% CDU/Cracking/Hydrotreating/Coker
Moose Jaw Refinery 15,000 2.37% CDU / Asphalt Plant
Saskatchewan Capacity 115,000 18.17%
Western Orbit Capacity 633,000 100.00%
(CAPP, 2012a, pp. 39-40)

A Strategic Analysis of Petroleum Refining Infrastructure In Canada
Page 48
Sixty-five percent of the capacity is concentrated in the Edmonton area which produces
surpluses to balance out most of the orbits demand. British Columbia produces less
than a third of their demand and as such is dependent on Edmonton refineries via the
Trans Mountain Pipeline and imports to balance its demand. Saskatchewan is
balanced with RPP demand of about 105,000 bpd in 2011 verses its capacity of
115,000.
The Shell Scotford, Suncor Edmonton and the Regina Saskatchewan refineries all have
Coker or hydro treating units which are capable of processing heavy crude and bitumen.
Throughput capacity was 97% in 2011and for the past ten years utilization has edging
up from the low 90% utilization to the current rates as economic activity and demand
increases in the orbit.
In addition to these refineries, Alberta has six heavy crude upgraders which are
integrated into Oil Sands mining projects, integrated with in-situ SAGD fields, or are off
site operations independent of refineries. These upgraders are designed to take either
conventional heavy crude or unconventional oil sands crude and upgrade it to light
sweet synthetic crude which can be refined by less complex refineries. The upgrading
capacity of these upgraders is close to 1,400,000 bpd however they do require much
longer turnaround times and suffer from numerous unscheduled shutdowns due to the
nature of the oil sands upgrading process. CAPP indicates that in 2011 only 705,000
bpd were upgraded into synthetic crude (CAPP,2012a, p. 39).
Figure 34 - Crude Upgraders Capacity
Upgrader Capacity
Athabasca Oil Sands Project (AOSP) 255,000
Suncor Base and Millennium 440,000
Syncrude Mildred Lake 407,000
Nexen Long Lake 72,000
Canadian Natural Resources Ltd (CNRL) Horizon 135,000
Husky Lloydminister Upgrader 82,000
Total Upgrading Capacity 1,391,000
(CAPP, 2012a, p. 39)
I
Inventory of RPP is maintained in the 17 to 20 million barrels range which is about 27 to
30 days’ supply. Considering that some of the northern markets need to store month’s

A Strategic Analysis of Petroleum Refining Infrastructure In Canada
Page 49
supplies of RPP due to their distance from the refineries and the poor access into some
communities at times of the year, this level of inventory is actually quite lean.
Product Demand
The mix of products demanded in Western does not mirror Canada’s overall Product
Mix, especially in the gasoline, diesel and heavy and light fuel product offerings.
Figure 35 - Canada verses Western's Product Demand Mix
The large agricultural and industrial economies in Western Canada are the major
users of diesel. Natural gas and coal has always been abundent and cheap in
Western Canada where fuel oil has never been an energy sources for electricity
generation and home heating. In the past ten years, gasoline volume demand has
increased 14% and diesel volume demand has increased 45% resulting in the
volume demanded for both products being almost equal. Asphalt and petrochemical
demand also increase over 40% during this period due to strong economic growth.

A Strategic Analysis of Petroleum Refining Infrastructure In Canada
Page 50
Figure 36 - Western's Product Demand Growth
A supply and demand comparison for 2011 reveals that even though the refineries in
the orbit were at full capacity, production was 41,687 bpd short of gasoline demand and
44,741 bpd short of diesel demand.
Figure 37 - Western's Product Balance

A Strategic Analysis of Petroleum Refining Infrastructure In Canada
Page 51
The need for the orbit to import 80,000 bpd is quite apparent once these shortfalls are
taken into consideration.
Industry Analysis Summary
Although on a national basis the industry does move massive amounts of crude and
RPP while the production of RPP appears to be well balanced with demand in 2011, a
closer look at supply and demand at the regional supply orbit levels reveal specific
imbalances. We have summarized the salient features of each supply orbit in the
following chart.
Figure 38 - Salient Features of Supply Orbits
Maritimes Quebec Ontario Western Crude Slate Domestic crude
can supply 45% of domestic demand. Primarily light/medium crude.
Supply is 92% imported, 8% provided from outside orbit. Supply is 86% light sweet, 13% heavy conventional.
Supply is provided from Western Orbit or imported. Supply is 80% light or synthetic, 20% heavy or bitumen blend.
Domestic supply exceeds demand by over a million bpd. Production is 80% heavy and 20% light oil
Midstream Access to deep water ports connects Orbit to global oils markets.
Access to waterways connects orbit to global markets. Pipelines moves RPP from Quebec into Ontario.
Supply is brought into orbit primarily through one pipeline source. RPP is also shipped from Quebec to Ontario through a single pipeline.
Various pipelines can transport 3.5 million bpd out of orbit. Large area with limited capacity to move RPP into orbit.
Refineries Three refineries have capacity to refine over 300,000 bpd more than demand. Capacity is 504,000 bpd. 2011 utilization was 85%.
Two refineries can meet demand if they operate at 93% capacity. Capacity is 395,000 bpd. 2011 utilization was 89%; average over the last ten years was 93%.
Orbit is dependent on imports as the five refineries capacity only supports 86% of demand. Capacity is 478,000 bpd. 2011 utilization was 90% of capacity.
Eight refineries still required 80,000 bpd of imports to balance 2011 demand. Capacity is 633,000 bpd. 2011 utilization was 97%.
Product Demand
Orbit demand was 202,000 bpd in 2011
Orbit demand was 355,000 bpd in 2011
Orbit demand was 574,000 bpd in 2011
Orbit demand was 688,000 bpd in 2011.

A Strategic Analysis of Petroleum Refining Infrastructure In Canada
Page 52
Capacity exceeds product demand. Exported 238,000 bpd in 2011.
Small gasoline and aviation fuel deficits exist but are easily covered off by product movements into Ontario.
Production shortfalls of 133,000 bpd of gasoline and 42,000 bpd of diesel exist. Demand is balanced through imports.
Production was short 42,000 bpd of gasoline and 45,000 bpd of diesel in 2011. Demand growth is strong especially for diesel.

A Strategic Analysis of Petroleum Refining Infrastructure In Canada
Page 53
3.2 - Competitive Forces Analysis
Porter’s Five Competitive Forces of Strategy is a traditional approach to evaluating
industry strategy that provides a useful framework to evaluate the structure surrounding
the dynamics of the Canadian refining industry. Porter postulates that the Competitive
Forces’ of Internal Industry Rivalry, Threat of New Entrants, Treat of Substitutes,
Bargaining Power of Suppliers and the Bargaining Power of Buyers shape the structure
of industry. The composition of these forces arises from that industry’s distinctive
economic and technical characteristics. The strongest of these forces determine the
profitability of an industry making the appreciation of their interactions critical to strategy
formation (Porter, 2008, pp. – 80-88).
In the analysis of the competitive forces that affect the refining infrastructures supply
network we will review effect of competitive forces on downstream refineries. In applying
this framework at this point in the network we will capture the crude slate producers as
suppliers, the product users as buyers and still maintaining the scope of our focus.
3.2.1 - Threat of New Entrants
Porter argues that every industry has obstacles that create barriers for new entrants to
gain access into that market. These barriers are advantages that incumbents have over
new entrants and it the magnitude of these advantages that shapes the profitability of
the industry. The threat of entry by a new competitor limits the incumbents’ profitability
in that industry as when the barriers to entry are high, new entrants are less likely to be
attracted to enter the market. The strongest incumbent advantages within the refining
industry are supply side economies of scale, restrictive government policy, large capital
requirements, and incumbency advantage of location (Porter, 2008, p. 80-82).
Supply side economies of scale provide a large incumbent advantage when they
possess a supply advantage or when incumbents provide large scale, low cost
operating capacity sufficient to satisfy demand. Although some Canadian refiners have
integrated operations into the upstream market, the open competitive market of the
numerous E &P companies negate any advantaged gained from upstream integrations.
Many independent E&P companies enjoy the low cost crude economies that the
integrated refiners have and are not necessarily contracted to one downstream source.
Although the industry consolidation that occurred over the past thirty years has created
large economies of scale barriers, the capacity shortfalls and product gaps that exist in
the Ontario and Western orbits create opportunities for new entrants to enter or rival
incumbents to fill.

A Strategic Analysis of Petroleum Refining Infrastructure In Canada
Page 54
Economies of scale can provide a powerful advantage however under certain conditions
the scalability of these economics creates inefficiencies under which diseconomies of
scale take over. As volume increases, at some point per unit advantages of scale are
offset by complexity and co-ordination issues such as transportation costs, more
complex production processes or management inefficiency (Thomas and Maurice,
2008, p. 342 – 348). With the trend towards heavier crude slates, the complexity of
refineries must increase in order to efficiently refine this feedstock. In large scale
complex refineries, a problem in one segment of the process, such as fire in a coker,
could shut down the whole process until that segment is repaired. We have seen in the
Northern Canadian and more remote points in the Western markets that the midstream
options increase costs or shifts the efficient cost curve of production such that in small
limited markets with sources of crude production nearby small scale production should
be considered as an option. New technologies or economies of scope can also negate
the cost advantage of scale economics (Thomas and Maurice, 2008, p. 342 – 348).
The time lag and bureaucratic costs of the restrictive governmental policies in
constructing and starting up a refinery is a significant barrier to entry. Government policy
approving a refinery includes federal, provincial and municipal regulations which
typically must be handled separately with numerous stakeholder feedback and consent
being an important part of the approval process. In the case of pipelines, applications
and approvals must be obtained from each province and municipality that the right of
way passes through. In many cases the application is not approved after a lengthy
expensive process.
Refineries require large long run capital commitments and as the existing refining
companies are large enough to attract capital at efficient costs, any new entrant need to
have access to low cost, long term capital in large amounts. Many of the international
oil companies (IOC) and state owned enterprises (SOE) fall into this category. IOC’s
such as Chevron, Shell, Valero (Ultramar) and Exxon (Imperial Oil) are currently
involved in the Canadian refining industry. While South Koreas SOC, Korean National
Oil Corporate (KNOC), purchased Harvest Oil and Newfoundland’s North Atlantic
Refinery in 2009 and the Emirate of Abu Dhabi SOC owns the Nova Chemicals
petrochemical plant in Sarnia. This barrier is not seen as restricting expanding capacity
as there are many companies with the expertise and capital to expand Canadian
capacity providing the return on investment and opportunities are attractive.
Finally, incumbents own many old refinery sites which have been turned into storage
terminals facilities that have excellent pipeline access. These sites provide a location
advantage for new refineries as the regulatory approval process would be much shorter
and the cost of building pipelines supplying the refinery is already a sunk cost.

A Strategic Analysis of Petroleum Refining Infrastructure In Canada
Page 55
Notwithstanding the incumbent advantages in this market, there are many publicly
traded companies with access to low cost capital capable of taking advantage of the
capacity gaps that exist in the Western and Ontario Orbits and as such the threat of a
new entrant is high.
3.2.2- Suppliers Bargaining Power
Suppliers with strong bargaining power will capture more of the industry’s profit for
themselves. Supplier groups are powerful if:
- They are more concentrated than the industry it sells to,
- They serve many industries and do not depend heavily on one industry
for all it revenues,
- Industry faces large switching costs in changing suppliers.
- Suppliers offer products that are differentiated, or no substitutes for the
suppliers’ products,
- They can threaten to integrate forward into the industry (Porter, 2008,
pp. 82-83).
The suppliers of crude are numerous and sell into a market dominated by five large
companies. Suppliers serve only one industry, growth in supply is greater than growth in
demand and industry can quickly switch suppliers. Although crude is differentiated by
API weight and suppliers can threaten to integrate forward, few actually integrate
forward as most of these producers have smaller capital bases to work from relative to
the large capital pools required to build a large scale refinery.
This structure of many suppliers pushing increasing crude production into the supply
network can exceed the infrastructure capacity of the local networks creating localized
areas of oversupply. This localized oversupply cannot be cheaply moved onto world
markets ultimately driving down supply prices within these markets. The supplier group
industry is a price taker that has limited power over the refining industry resulting in
suppliers having weak bargaining power.
3.2.3 - Buyers Bargaining Power
Powerful buyer groups can drive down prices and capture more value from the industry.
Buyer groups are powerful when:

A Strategic Analysis of Petroleum Refining Infrastructure In Canada
Page 56
- There are few buyers purchasing large volumes relative to the size of
the vendor,
- The industry’s products are undifferentiated,
- There are few switching costs.
- They can integrate backwards (Porter, 2008, pp. 83-84).
The largest buyers in this group are the marketing divisions of refiners who have
vertically integrated into the retailing of fuel products and control 33% of the market.
Although the products are undifferentiated with low switching costs, in most of the
markets the buyers are diverse and small relative to the refiners selling fuel and other
RPP. The aviation market has some large buyers, large airlines and the petrochemical
market also has large petrochemical companies as buyers who have some limited
buying power. Notwithstanding these wholesale markets, in the high volume, high value
gas and diesel market buyers have low bargaining power.
3.2.4 - Substitutes
The presence of substitutes limits an industry’s profitability by placing a ceiling on
prices. The threat of substitute is high if:
- The substitute can offer an attractive price-performance trade-off to the
industry’s product,
- Buyers cost of switching is low (Porter, 2008, pp. 84-85).
The threat of substitutes exists in the form of renewable energy sources and other forms
of fossil fuels. These substitutes threaten different markets at varying intensities. The
low price of natural gas and its increased availability has improved its penetration into
the home heating and electrical generation markets, displacing some heavier oil
products. Over the past five years, 2008 to 2012, electricity generated from heavy fuel
oil is down over 50% or 5,702 gigawatt hours (gwh) while electricity generated from
natural gas has increased by 13,900 gwh or 33% (Statistics Canada, 2012c). During
this same period the amount of electricity generated by renewable energy sources
increased by 7,329 gwh which was a fourfold increase (Statistics Canada, 2012d). The
dramatic increase in renewable energy sources has been driven by government subsidy
programs in response to societies growing concern over GHG emissions however its
growth along with natural gas growing market share has resulted in heavy fuel oils and
diesel currently generating less than 1% of the electricity generated in Canada.

A Strategic Analysis of Petroleum Refining Infrastructure In Canada
Page 57
With respect to the use of RPP in transportation, substitute’s lack of distribution
infrastructure and energy density reduce their performance relative to RPP. As a result,
demand is inelastic relative to price indicating that close substitutes are not readily
available to consumers (Grant, 2008, p 73). If low natural gas prices are sustained or if
technology reduces the performance shortfalls of electric cars (EIA, 2012d), substitutes
could displace demand for RPP in this market much like they have in the electrical
market. The threat of substitutes in this market is considered moderate over the long
run.
3.2.5 - Competitive Rivalry
The extent that competitive rivals limit profitability in an industry is determined by the
intensity of their competition and the dimensions on which they compete. Intensity of
internal rivalry increases when:
- Competitors are numerous or are peers in size and power.
- Industry growth is slow.
- Exit barriers are high.
- Rivals are all committed to the business (Porter, 2008, pp. 85-86).
The dimensions that rivals compete can be price, differentiation of product or service, or
focus. Porter warns that competitors that compete on price can be destructive to
industry profitability. Price competition is most likely to occur when;
- Products are undifferentiated with low buyer switching costs,
- Fixed costs are high and marginal costs are low,
- Capacity must be expanded in large increments to be efficient,
- Products are perishable (Porter, 2008, pp. 85-86).
The refining industry fits into each one of these qualifications with the exception of their
products are not perishable. To be more precise:
- Industry leaders are of comparable size and power,
- Industry growth of RPP is slow at 1.15% CAGR per year (Statistics
Canada, 2012b),
- Exit barriers are high,

A Strategic Analysis of Petroleum Refining Infrastructure In Canada
Page 58
- Rivals are committed to the business,
- Fixed costs are high while marginal costs are low,
- Capacity is added in large increments.
Notwithstanding that this industry should be prone to intense competitive pricing
behavior, the oligopoly ownership structure that has survived the consolidation period of
this market and lack of excess capacity has dampened the industry’s capability to gain
more market share. With many of the participants operating at near full capacity, there
is little room to gain more market share unless they expand capacity. The years of
consolidating costs and pursing operational effectiveness techniques has lead the
industry to pursue what Porter would call a conservative homogenous productivity
frontier rather than firms pursuing a truly competitive advantage (Porter, 1996, p.63).
This is a dangerous strategy for these companies as it leaves room in the market for
new entrants to add the capacity that incumbents have not filled. Such new entrants
may not be so reluctant to enter into price competition or add excessive capacity in
specific orbits that could dramatically change the competitive dynamics of the existing
rivalry.
A significant cap on the profitability of Canadian competitors exists in the ability of
competitors from outside of Canada to import RPP into Canada. If Canadian refiners
price their products higher than the global market price plus transport external
competitors will import will undercut their excessive prices. This limits the pricing power
of the group and makes them price takers of the global market price.
3.2.6 - Factors Influencing Competitive Forces
Porter explains that it is the interaction of the five forces that determine industry
structure and its long run potential value however he cautions that it is important not to
mistake industry attributes for competitive forces. He explains that each industry has
specific elements which influence structure but in themselves are not forces. Examples
of such industry elements are technology, complementary products, government and
growth rate (Porter, 2008, p.86).
The factors that influence competitive forces are complementary products, technology,
and social interests represented through governments.
In response to the growing concern over GHG emissions the Federal Renewable Fuel
Regulation required that an average of five percent renewable fuel content in Canadian

A Strategic Analysis of Petroleum Refining Infrastructure In Canada
Page 59
sold gasoline and a two percent renewable fuel content in diesel and heating distillate
fuels (Government of Canada, 2010). These fuel supplements improve the quality of
fuel by reducing the carbon footprint of fuel and should be considered as
complementary products. Such renewables would include biodiesel and ethanol. Should
a technical breakthrough occur that allows large quantities of renewable fuels to be
produced at economical prices these products could be a competitive substitute for
RPP.
Refinery technology exists to efficiently use natural gas as a feedstock for the
production of diesel or to use Oilsands bitumen as a feedstock for the production of
diesel. Refineries that produce diesel using such feedstocks’ would alter the midstream
constraints currently exhibited and change the yield profiles of this industry. Refineries
that capitalize on economies of scope can also alter this industry’s yield profile. Nova’s
petrochemical plant in Sarnia produces 78,000 bpd of diesel fuel but is primarily a
petrochemical plant.
Social interests and smaller groups representing stakeholder interests are often
represented through petitioning governments into strengthening or easing regulatory
constraints on industry. The Canadian Government passed numerous regulatory reform
changes which also streamlined the environmental assessment process for pipeline
applications. These changes sparked the “Idea no more” movement by native
Canadians and numerous environmental stakeholders. The balancing of societal,
industry and stakeholder interests can yield powerful, unpredictable influences on
industry.
Competitive Forces Summary
The intensities of competitive forces combine to create an industry structure that
provides refiners with some pricing power over upstream suppliers of crude which can
be exploited when supply growth outpaces demand, however downstream pricing
power is restricted by global imports. This pricing power is accentuated within the
Alberta and Ontario orbits as midstream constraints increase the refiners pricing power.
Orbits that access waterways are open to global competition and are price takers to
both upstream and downstream global competitive pressures. The salient forces at work
in this industry are summarized in the following chart:

A Strategic Analysis of Petroleum Refining Infrastructure In Canada
Page 60
Figure 39 - Competitive Forces in the Refining Industry
The pricing power that refiners have gained over suppliers is expected to continue as
long as supply increases faster than suppliers can find access to markets that can
obsorb the increase. Refiner profits should increase with this increased power and
motivate new entrants and incumbrants to consider capacity expansion. The threat
from substitutes in the transportation market is a long run deterant to capacity
expansion however technical breakthroughs are required to reduce costs and improve
performance to be competitive with RPP. This threat could motivate company’s to
hedge or reduce their long run risk by reducing the size of the expansion thereby
reducing their exposure to a paradigm shift in demand away from RPP.
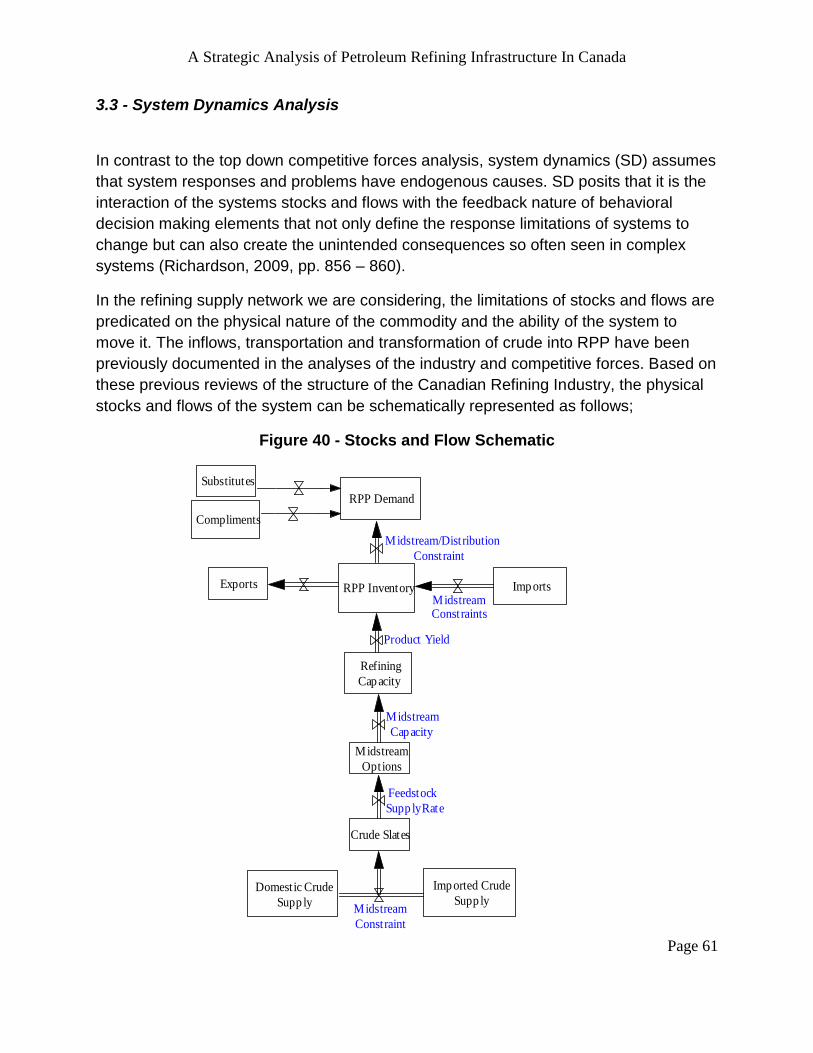
A Strategic Analysis of Petroleum Refining Infrastructure In Canada
Page 61
3.3 - System Dynamics Analysis
In contrast to the top down competitive forces analysis, system dynamics (SD) assumes
that system responses and problems have endogenous causes. SD posits that it is the
interaction of the systems stocks and flows with the feedback nature of behavioral
decision making elements that not only define the response limitations of systems to
change but can also create the unintended consequences so often seen in complex
systems (Richardson, 2009, pp. 856 – 860).
In the refining supply network we are considering, the limitations of stocks and flows are
predicated on the physical nature of the commodity and the ability of the system to
move it. The inflows, transportation and transformation of crude into RPP have been
previously documented in the analyses of the industry and competitive forces. Based on
these previous reviews of the structure of the Canadian Refining Industry, the physical
stocks and flows of the system can be schematically represented as follows;
Figure 40 - Stocks and Flow Schematic
Crude Slates
Midstream
Options
Refining
Cap acity
RPP Inventory
RPP Demand
Domestic Crude
Supp ly
Imp orted Crude
Supp ly
Feedstock
Supp lyRate
Product Yield
Midstream/Distribution
Constraint
Midstream
Cap acity
Midstream
Constraint
Imp orts
Substitutes
MidstreamConstraints
Compliments
Exports
A Strategic Analysis of Petroleum Refining Infrastructure In Canada
Page 62
The squares represent the systems stocks, the values and pipes represent the flows
while the systems flow constraints are in blue. This schematic represents the refining
infrastructure within each orbit as each orbit is characterised by substantially different
elements. For simplicity, the schema included interprovincial transfers as imports or
exports.
SD is particularly useful in identifying how elements within a system will react to a
change or in identifying a problem and isolating the interaction of physical and
behavioral elements causing the problem. We will rely on this schematic to explore who
this system responds to two problematic situations that this industry faces, the effect of
an unanticipated refinery shut down and the effect of adding capacity.
3.3.1 Unanticipated Refinery Shutdown
Refineries handle volatile materials under thermal, pressurized conditions.
Consequently they often have system failures, fires, or explosions which shut down
operations for periods of time. For example, the Federated Co-op refinery in Regina
has experienced three unanticipated shutdowns over the past 18 months (Pacholik,
2013).
We have established that the four supply orbits have differing characteristics which
should make each systems response to a shutdown unique. The Maritimes have a
large surplus capacity, relatively smaller demand and access to deep water ports. Even
if all three were shutdown, the orbits access to deep water ports allows them to arrange
global imports to meet their total domestic demand. Quebec likewise has access to
waterways which can be used and although a refinery shutdown may increase
transportation costs, there are no crude slate or RPP midstream constraints that would
restrict imports from covering the production shortfall from a shutdown. The Ontario and
Western orbits however are more isolated and physically bound by systemic midstream
constraints. Accordingly, we will use the Ontario orbit to probe a shutdown situation.
We will evaluate the Ontario’s Orbit response to a three week shutdown at Shell’s
75,000 bpd Sarnia refinery. This orbits refining capacity is 478,000 bpd however their
demand in 2011 was 573,688 bpd making it depended on imports even when refineries
are operating at full capacity. Imports are primarily transported into Ontario through the
TNPL pipeline which has a capacity of 132,600 bpd. The shutdown would remove
75,000 bpd capacity leaving the remaining capacity at 403,000 bpd.

A Strategic Analysis of Petroleum Refining Infrastructure In Canada
Page 63
Figure 41 - Refinery Shutdown Causal Map
Crude Slates
Midstream
Options
Refining
Capacity
RPP Inventory
RPP Demand
Domestic Crude
Supp ly
Imported Crude
Supp ly
Feedstock
Supp lyRate
Product Yield
Midstream/Distribution
Constraint
Midstream
Capacity
Midstream
Constraint
ImportsMidstreamConstraints
Demand
Expectation
Utilization decision
Import decision
Refine or Import
Decision
Exports
Substitutes
Compliments
Pricing decision
We have added the causal loop map in green to highlight the industry’s response to the
immediate reduction in capacity. We will outline the key decisions and response
industry would make to mitigate the reduction in capacity. We will rely on this schematic
to qualitatively understand the potential feedback responses and anticipate delays to
the system change. We will demonstrate the stocks and flows quantitative response and
limitations as these are easily seen linear constrained conditions.
1. Industry would anticipate that demand would not be immediately dampened by
the shutdown and would seek out alternatives to replace the lost production.
2. The industry options are to increase remaining production or import. Economic
theory suggests that a firm should produce up the point where price equals the
short run marginal cost when price is greater than or equal to the average
variable cost of production (Thomas & Maurice, 2008, p. 404). If we assume that
A Strategic Analysis of Petroleum Refining Infrastructure In Canada
Page 64
each unit produced could be sold at a price greater than the marginal cost and
price is greater than the variable cost of production, we would then expect firms
to independently decide to defer any planned maintenance turnarounds and over
the short term produce at 100% of their capacity.
3. Midstream crude options should be unaffected by the shutdown.
4. Inventory and production will meet current demand however as inventory levels
reduce additional imports will be sought out. As the TNPL is near capacity
alternative midstream options will be explored. The procurement and
transportation of import RPP by rail or truck would cause a response delay.
5. The additional costs of purchasing large amounts of RPP from outside of the
orbit would increase costs which would over the long run adversely affect the
quantity demanded. However, as the time frame is short and as petroleum
products are inelastic to short run changes in price (Grant, 2008, p 73) demand
would not be immediately dampened
6. Inventory holds would be used to offset any deficit in production and imports.
7. Any change in quantity would also impact compliments however the short run
impact on quantity demand would be neutral.
8. The price increase may affect the price performance trade-off between RPP and
substitutes however their lack of infrastructure and short run availability would
delay substitutes gaining market share.
If we modeled these responses assuming that:
- Refineries immediately run at 100% of remaining capacity,
- Refining yields in the orbit are not materially affected by the Shell
shutdown,
- 80% of the RPP imported is gasoline while 20% is diesel and that the
industry was able to import an additional 100,000 barrels at the end of
week two and 200,000 barrels by the end of week three and beyond.
Given these parameters we find the systems flows are predictable and linear as the
feedback mechanisms are delayed from responding. Over the three week period,
inventories readily absorb production and import shortfalls with gasoline inventories
falling 1,593,000 barrels (34%) and diesel inventories falling 973,000 barrels (30%).

A Strategic Analysis of Petroleum Refining Infrastructure In Canada
Page 65
Figure 42 - Ontario's Orbit Shutdown Response
(barrels per week)
Week 1 Week 2 Week 3
Gasoline Inventory 4,625,720 4,298,011 4,070,301
Diesel Inventory 3,266,239 3,034,279 2,802,318
Total Inflows 3,434,200 3,434,200 3,434,200
Total outflows 3,974,814 3,941,122 3,941,122
Net RPP Flows - 540,614 - 506,922 - 506,922
Over the three week shutdown, the system is quite robust and capable of buffering any
supply side issues with current inventory levels. However if the shutdown continued for
four months as the result of a more damaging explosion, and the variables were
maintained at the same amount, inventories would be reduced to a net 900,000 barrels
and by week eighteen they would be totally exhausted.
Figure 43 - Inventory Response to Shutdown
This situation assumed that the orbits other refineries are able to increase capacity
utilization to 100% without straining their refineries. If a shutdown period was extended,

A Strategic Analysis of Petroleum Refining Infrastructure In Canada
Page 66
pushing these refineries at 100% capacity for extended periods would create additional
failures which would exacerbate the production shortfalls.
Responses to an extended shutdown would have to entail structural changes to the
system however many regulatory and safety delays would be incurred. Additional
pipelines could be added from areas with access to waterways such as Montreal which
would increase the flow of imports into the orbit. However, new pipeline projects take
many years to plan and build and regulatory approvals are becoming exceedingly
controversial. Regulatory approvals are drawn out and difficult to obtain as has been
recently experienced with the Keystone XL (The Canadian Press, 2013) and the
Northern Gateway (Fong, 2013) pipeline proposals.
In orbits with midstream constraints, inventory levels are critical to maintaining the
reliability of supply. The USA has long recognized the importance of maintaining crude
oil inventory’s to buffer crude supply disruptions. In response to the 1973 energy crisis,
the US Department of Energy maintains a strategic petroleum reserve (SPR) of crude
oil which can be released during supply interruptions. Over the past ten years SPR
inventory levels have been maintained at between 55 – 82 days which when combined
with industry inventory levels would provide about 120 days’ supply of crude (EIA,
2013). The US supply orbits are referred to Petroleum Administration for Defence
Districts or PADD’s which have more refineries in more locations than in Canada’s
orbits. Consequently, their risk is more in getting crude into their PADD’s than in
providing RPP. The risk in the Ontario and Western orbits continues along the supply
network to the finished product, that is, these orbits having no slack capacity to absorb a
prolonged refinery shutdown. The risk in these orbits would be better contained by a
strategic reserve of RPP than crude.
3.3.2 Capacity Addition Criteria
In deciding whether to add new capacity, John Sterman suggests that individual
producers will expand or contract their production capacity to a desired capacity level
based on their expectation of long run profitability. He argues that individual firms
acting independently cannot solve for equilibrium capacity of productive capital given
the uncertainty surrounding the future values of economic growth, changes in elasticity
of demand, costs and developments of substitutes and changing social norms. As such,
decisions to add capacity are independently made based on long run expectation of the
profitability of the new investment. The degree of confidence in the long run expectation
of profitability of the investment directly impacts the responsiveness of firms to invest in
capacity (Sterman, 2000, pp. 802 – 810).

A Strategic Analysis of Petroleum Refining Infrastructure In Canada
Page 67
The refining industry trends numerous metrics that signal the strength of the market for
RPP, capacity utilization, refining margins, crack spreads and production/ product sales
are but a few. These indicators help refiners respond to short term production
opportunities in the market however as Sterman contents, in making a long run capacity
investments the crucial determinant is the long run expectation of profitability.
In modelling the capacity investment decision, we propose that demand expectations
are signaled to the market through indicators such as growth rates, capacity utilization,
and product shortages signaling to the market that opportunities exist to expand
capacity. Although these metrics are used by industry to identify opportunities in the
market the crucial determinant employed in long run decisions is the expected return on
investment. An additional consideration in the refining industry, planning, regulatory
approval process and construction can delay the capacity addition for five to ten years,
the effects of this delay should be considered. Linking these determinants suggests the
following causal map.
Figure 44 - Capacity Acquisition Causal Map
Crude Slates
Midstream
Options
Refining
Cap acity
RPP Inventory
RPP Demand
Domestic Crude
Supp ly
Imp orted Crude
Supp ly
Feedstock
Supp lyRate
Product Yield
Midstream/Distribution
Constraint
Midstream
Cap acity
Midstream
Constraint
Imp ortsMidstreamConstraints
Long Run Return onCap ital Employ ed
Expectation
Demand
Expectation
Market
Opp ortunity
Cap acity
Addition
Regulatory &
Construction Delay
Exports
Price decision
Substitutes
Compliments

A Strategic Analysis of Petroleum Refining Infrastructure In Canada
Page 68
We know from the industry analysis that in the past ten years RPP demand has
increased on average 1.15% per year and that capacity utilization has been consistently
above 90%. We have also seen that substantial gasoline and diesel production
shortfalls existing in the Ontario and Alberta supply orbits. These indicators signal to
producers and new entrants that market opportunities exist that may be profitable.
In Canada publicly traded companies operate 75% of the refining capacity. Investments
in these companies are made to maximize returns to shareholders (Thomas & Maurice,
2008, pp. 10-15). Consequently, investment decisions are typically made on a portfolio
management basis with most companies operating in the Canadian refining industry
measuring performance on a return on capital employed (ROCE) bases (Imperial Oil,
2012, p. 30). Corporations review numerous investments opportunities and based on
their assessment of expected return on capital, rank and compare expected returns to
corporate ROCE. Based on their ranking, they invest in those projects which are most
accretive to shareholder earnings. Imperial Oil is the largest refiner in Canada with over
500,000 bpd of capacity and provides a good example of the results of this process.
The ROCE is key performance metric for Imperial Oil and a review of their division’s
performance over the past ten years provides some insight into corporations’ internal
competition for capital.
Figure 45 - Imperial Oils Divisional Return on Capital Employed

A Strategic Analysis of Petroleum Refining Infrastructure In Canada
Page 69
This graph illustrates that over the past ten years the ROCE for upstream and the
chemical operations provided a much larger and more variable ROCE than their
downstream operations. We note that the chemical operations are an order of
magnitude smaller than the other two divisions. Prior to 2012, upstream operations
provided a superior yield even given the viability in their results.
The effect that return has on capital allocation decisions is quite apparent; from 2002 to
2011 Imperial Oils’ capital expenditures were 19.98 million dollars of which 83% was
allocated to upstream investments, 16% to downstream operations and 1% to chemical
division investments. As can be seen in the ROCE graph, downstream operations
ROCE improved dramatically in 2012 just as returns from upstream operations turned
down as result of lower crude prices to refiners. This change in ROCE sends a strong
signal to the market that profitability levels are such that capacity could be profitability
added to the industry to at least displace the imports. Capacity addition is a long run
decision and confidence in the long run profitability of the industry is the determining
motive to invest in expansion. As confidence in improved refining returns grows addition
investment in this sector can be expected.
Although the long run expectation for profit is improving, the question arises as to how
much capacity should be added and how would the system respond to the increased
capacity? In his 1999 MIT doctoral thesis, Taylor found that long run capacity cycles in
the pulp and paper industry can be explained by capacity acquisition delays which can
create oscillations in capacity. The pulp and paper industry share many similar
characteristics with the petroleum industry, commodity price variations with growth, long
supply chains and networks with physical constraints, capacity is added in large
quantities at one time and long capacity acquisition delays. Taylor found that a four
year acquisition delay in capacity lead to short run price and utilization oscillations within
a 14 year long capacity cycle (Sterman, 2000, pp. 824 -828).
This effect can be illustrated in the causal map where;
1. Market indicators such as refinery margins, product gaps and inventory shortfall
signal to the market that demand is increasing.
Expected Standard Coefficient
Value (E) Deviation of Variation
Upstream 42.41% 16.66% 39.29%
Downstream 23.76% 12.41% 52.23%
Chemical 45.43% 18.61% 40.97%

A Strategic Analysis of Petroleum Refining Infrastructure In Canada
Page 70
2. Import fill the product gaps in the market however transportation costs increase
the price of RPP being sold thereby increasing refiners ROCE.
3. The long run ROCE expected increases motivating companies to acquire
capacity.
4. Regulatory approvals and construction delays’ could be as long as five years or
more, as such fundamental changes in future demand and competitor responses
need to be considered prior to proceeding with plans to acquire additional
capacity.
5. Adding new capacity increases production of RPP based on the crude slate used
and yield profile of the capacity being added.
6. New production first displaces imports and then builds in inventory until it is
demanded.
7. Demand would draw down inventories and a new equilibrium between prices,
utilization, imports is reached. If demand is not what was originally anticipated
and is not sufficient to draw down inventories and balance the market, as
inventory builds refiners would be motivated to reduce utilization and then
reduce the price to clear excess inventory levels.
8. The reduced price should stimulate demand, decrease inventory and increase
utilization. However if the demand recovery is slow or if the reduced demand is
from lower energy intensity such as better fuel efficient cars or changing
behavioral pattern, the demand recovery could be prolonged or never.
9. In prolonged demand recoveries, demand expectations are negative, profit
expectations are low and the least efficient capacity will eventually be removed
from the system if the recovery is long enough.
It can be seen in this illustration that adding capacity beyond actual domestic demand
can erode profits and result in more consolidation in the market. Companies adding
excess capacity to export RPP into global markets face intense global competition both
in purchasing feedstock and selling RPP. They would also face higher transportation
costs than many other competitors as Canada is not located close to any major markets
other than the US which is already well served within its domestic industry.
Within the context of Canada’s current refining environment, we would expect the
increased profitability of downstream operations and the demand product gaps that
exist in Alberta and Ontario to attract interest from industry participants and new

A Strategic Analysis of Petroleum Refining Infrastructure In Canada
Page 71
entrants. However, as excessive capacity could lead to reduced profitability and further
consolidation the size of the refinery being added needs to be considered.
In Ontario, the production gaps are quite large as the orbit was short 133,000 bpd of
gasoline and 42,000 bpd of diesel in 2011. In Ontario’s situation, acquiring one or two
large cracking refineries would take advantage of the unit cost efficiencies provided by
economies of scale of production however 350,000 bpd of capacity is required to yield
enough gasoline at the 42% yield expected from such a configuration. Although the
existing midstream pipelines can deliver this additional feedstock from Western orbit, an
additional 350,000 bpd would approach the 700,000 bpd capacity limits of the Enbridge
mainline. It would be prudent to consider other sources and delivery systems that could
diversify the supply risk.
The Western Orbit is somewhat of a different story as their production gaps are smaller
and the demand for diesel has been growing at three times the rate of gasoline growth.
This disproportionate growth is expected to continue as long as growth in the industrial
sector continues. Additionally, RPP are transported great distances from Alberta into
Manitoba, Northern Ontario, and North West Territories. In matching the anticipated
demand growth and reduce the amount of RPP transported it would be more efficient
these demand gaps could be filled by a combination of smaller scale refineries located
closer to demand than in building a large centrally located refinery.
Small scale refining options in this market could include;
- Smaller scale bitumen to diesel, or natural gas to diesel refineries in
Northern Alberta or Northern BC which would be closer to demand and
feedstock sources. Petrochemical/diesel refineries could also help fill
the growing demand for diesel.
- Manitoba has a daily demand of about 60,000 barrels consisting
primarily of 28,000 bpd of gasoline and 22,000 of diesel. Feedstock
could be provided via The Spectra Express-Platte pipeline runs from
Hardisty, Alberta into Manitoba as does the existing Keystone pipeline.
- The North West Territories and the Yukon have producing crude fields
which could supply a small scale refinery to meet local demand.
Currently, large inventory holds need to be maintained in Northern
Canadian communities as fuel must be trucked in during winter months
on ice roads. Current demand is only 8,000 bpd but the refinery could
also service Northern BC communities which are only partially served
from Prince George’s 12,000 bpd refinery.

A Strategic Analysis of Petroleum Refining Infrastructure In Canada
Page 72
System Dynamics Summary
The stock and flows of each orbit creates specific dynamics in how the individual orbits
response to change. In orbits without midstream constraints inventories serve as a
reserve for seasonal demand and turnarounds however in orbits that are midstream
constrained inventories provide the buffer that can absorb system disruptions. Current
levels of inventories seem adequate to handle routine short term disruptions in
productions however they would not be able to handle low probability events such an
extended closure of the Enbridge pipeline into Ontario which provides 85% of the orbits
feedstock. Although such events rarely occur they would have a major impact on the
economy of Canada. A strategic reserve of RPP held in the orbits that are subject to
midstream constraints would reduce consequences of these events.
Confidence in the expected long run return on investment is the crucial determinate in
deciding whether to acquire capacity. However, demand and the expectation for
demand can change much more rapidly than the industry’s ability to respond to the
changes. Rapid changes in demand results in the industry often overproviding or
underproviding capacity which coupled with capacity delays can generate into a
negative feedback cycles that reduces or adds capacity at inappropriate times thereby
reducing industry profitability. As capacity demand shortfalls can be covered with
imports, over capacity situations are the more harmful to industry profitability.
4.0 Recommendations and Conclusions
The three analytical approaches utilized in this study each provided valuable insights to
answering the research questions we originally raised. The industry analysis identified
major elements of the petroleum industry’s structure and related these elements to a
review of the industry’s current structure. Information from the industry analysis
identified certain emerging patterns and formed the foundation for the Competitive and
SD Analyses. The competitive analysis provided the framework to view the interaction
of the competitive forces at work in this industry, to determine which forces currently
dominate and which forces could influence the competitive environment in the future.
SD provided an understanding of how the physical limitations of the industry interact
with the industry’s behavioral decision making to respond to changing conditions.
Collectively they provide a more complete framework from which to based strategic
decisions than any one approach independently.
The research question inquired if Canada’s refining infrastructure will meet the future
needs of Canadians. I also posed two sub questions which queried whether its current
structure was secure, reliable, and efficient then if additional capacity is needed would it
A Strategic Analysis of Petroleum Refining Infrastructure In Canada
Page 73
be more efficient to add capacity in large economies of scale refineries or in smaller
scale refineries domiciled closer to the sources of demand.
The industry analysis revealed that refining capacity in the Western and Ontario supply
orbits do not meet current RPP demand much less future demand, Quebec’s orbit can
meet its current domestic demand if it produces at virtually full capacity and the
Maritime Orbit operates at a surplus. The Maritime surplus can be moved into Quebec
or Ontario to offset any future RPP shortfalls. However the Maritime refineries purchase
crude on global markets at a premium Brent Crude price while the Western orbit sells its
crude at a discounted WTI or heavy oil price. This inefficient use of national resources
could cost Canada billions if the price gap between North American crude and Brent
persists. Additionally, Quebec’s production is concentrated in two refineries one of
which provides 67% of the orbits capacity, should it fail 250,000 bpd of imports would be
required to balance demand.
The lack of midstream options available to Ontario and Western limit their ability to bring
RPP and in Ontario’s case crude into the orbit. This raises concern over the reliability of
supply in the case of a prolonged disruption at a major refinery. As both orbits also
under produce their demand requirements, a production disruption could have major
cascading effects on their economies. Inventory levels are sufficient to absorb a short
run unanticipated shutdown however a prolonged shutdown would stress inventory
levels and could create price shocks.
Additional refining capacity should be added in the Ontario and Western orbits to meet
product shortfalls. The Western orbits refineries undersupplied 42,000 bpd of gasoline
and 45,000 bpd of diesel during 2011. Alberta is the center of capacity in the orbit as it
overproduces and transports finished product long distances to Manitoba and Northern
Canada who have no refining capacity. Adding a large cracking refinery would provide
economies of scale and fill the current product gap however with their growing demand
for diesel and the need to transport RPP to far off corners of the orbit; small scale
refineries or more innovative gas to diesel, bitumen to diesel refineries or
petrochemical/diesel refinery may provide a more flexible solution. Regions without
refineries such as NWT, Yukon and Manitoba should be considered as candidates for
smaller scale refineries. NWT has crude production and Manitoba and BC have access
to crude pipelines. Areas of high demand such as Fort McMurray should also be
considered for a smaller scale refinery to fill local market product gaps but not so large
as to create excess capacity.
Ontario’s refineries undersupplied their market by 133,000 bpd of gasoline and 41,000
bpd during 2011. Adding one or two large cracking refineries in this orbit would take
advantage of the unit cost efficiencies provided by scale of production however 350,000
bpd of capacity is required to yield enough gasoline at the 42% yield expected from

A Strategic Analysis of Petroleum Refining Infrastructure In Canada
Page 74
such a configuration. Although Quebec is relatively well balanced, adding specific
product capacity in an orbit that has good access to waterways and an expandable
pipeline system into Ontario would diversify their dependence on two large refineries
and assist in offsetting Ontario’s shortfall and add some slack into their production
capabilities. Small scale refinery options in Quebec would diversify their reliance on
their two major refineries, provide some slack for inventory builds and turnarounds, and
reduce Ontario’s reliance on international imports. Midstream solutions to allow more
efficient movement of RPP between the Maritimes and Ontario should also be
considered, whether that is expanding the pipeline between Quebec and Ontario or
considering a new line from the Maritimes to Quebec or Ontario.
The analysis of competitive forces indicate that even though incumbents enjoy
economies of scale, location advantages and regulatory delay barriers, the threat from
new entrants is high as capacity utilization is high, capital and new candidates for entry
are available, production/demand gaps exist and industry profitability is rising. Although
this threat from new entrants is partially moderated by the threat from potential
substitutes the threat of new entrants is more dominant due to the unfavourable
performance/price trade-off of substitutes in markets lacking stringent carbon
constraints. Both supplier and buyer groups bargaining powers are low relative to
refiners however refiners are limited in pricing power with the buyer groups by imports
that could displace their products if pricing is excessive. The suppliers do not enjoy such
a power limitation as the increased profitability of the refiners is a result of lower input
costs and is a reflection of the refiners pricing power over these suppliers. Competitor
rivalry is currently subdued as little excess capacity exists in three of the four orbits
however all the necessary elements for an intense price war exists. It would be
expected that incumbents faced with the threat of a new entrant that would disrupt their
oligopoly power structure and who still control various terminal locations would reduce
that threat by adding to the current capacity to fill the product gaps that exist in certain
orbits.
The economy of scale advantage that large refinery enjoy could be reaching a point of
diminishing returns due to the complexity requirements of modern refineries and the
transportation costs of moving large quantities to far off points by expensive mode of
transport. In locations where access to crude feedstocks is available it may be more
efficient for local demand to be served by local smaller scale, modern and more efficient
refineries.
The current equilibrium between internal rivals and the other four forces can easily be
subverted if additional capacity is added that exceeds domestic demand. The industry
has gone through a 40 year period of consolidation in the number of refineries and
capacity is not yet back to the capacity levels of 1980. It has only been recently that

A Strategic Analysis of Petroleum Refining Infrastructure In Canada
Page 75
margins have recovered and production/demand gaps are sufficient to add capacity. If a
large economy of scale refinery was added in any one orbit, the excessive capacity
could dramatically shift the balance of power between rivals and trigger a price war as
rivals attempt to drive down their per unit costs by maximizing their production. This
could lead to another extended round of consolidation of the older marginally productive
refineries if capacity increases are excessive.
The extended time delays in gaining regulatory approvals and the possibility of reduced
product demand due to lower energy intensity or changing values creates uncertainty in
projecting demand for the future. The delay in adding capacity coupled with the
uncertainty of what future demand will be when the capacity comes on line could
motivate company’s to hedge or reduce their long run risk by reducing the size of the
expansion thereby reducing their exposure to a shift in demand away from RPP in the
future.
The system dynamics analysis illustrated that the industry uses inventories to manage
the systems inefficiencies and that capacity acquisitions can overshoot demand thereby
creating overcapacity situations that result in reduced profits and the closing of
marginally profitable refineries.
Existing levels of inventories are maintained at levels that can absorb routine system
disruptions. Current inventory levels would not be able to handle low probability, high
impact events such an extended closure of the Enbridge pipeline into Ontario which
provides 85% of the orbits feedstock. Although such events may occur rarely they would
have a major impact on the economy of Canada. A strategic petroleum reserve of RPP
held in the orbits that are subject to these midstream constraints would reduce the
consequences of these events. The holding costs of such a reserve would increase the
cost of RPP in Canada however the impact of disruption could be massive.
Demand and the expectation for demand can change much more rapidly than the
industry’s ability to respond to them. Consequently, the industry often overprovides or
underprovides capacity which coupled with delays in adding capacity can generate into
a negative feedback cycles that reduces or adds capacity at inappropriate times and
reduces industry profitability. As capacity demand shortfalls can be covered with
imports, over capacity situations are the more harmful to industry profitability.
Finally, to response to our research questions, the Canadian Refining Infrastructure
should be able to meet Canada’s future needs however it has developed specific
system rigidities and production shortfalls which need to be addressed. The industry
moves and transforms a remarkable volume of crude into RPP each day however
demand can quickly change while the industry’s ability to respond to these changes is
systemically delayed. The industry should be careful in responding to these changes so

A Strategic Analysis of Petroleum Refining Infrastructure In Canada
Page 76
as not to create capacity issues which reduce profitability. Accordingly, consideration
should be given to the following recommendations:
More flexibility is required in midstream options in the Ontario and Western
orbits. Ontario should add additional pipeline options to transport crude and RPP
into the orbit while the Western Orbit should expand its ability to move RPP into
the orbit and crude out of the orbit.
A Strategic Petroleum Reserve of RPP should be considered in the Ontario and
Western orbits to reduce the potential damage from a low probability, high impact
event.
Capacity should be added in the Western, Ontario and possibly the Quebec
orbits to meet current demand and future growth expectations. Small scale
refinery options located in localized pockets of demand should be considered
such as a bitumen- to-diesel plant in Fort McMurray or a small cracking plant in
the North West Territories rather than a centralized large scale refinery.
The enactment of these recommendations should provide Canadian refining
infrastructure the flexibility and capacity to continue meeting the needs of Canadians.

A Strategic Analysis of Petroleum Refining Infrastructure In Canada
Page 77
References
British Petroleum (2012a). BP Statistical Review of World Energy- June 2012a.
Retrieved August 10, 2012 from;
http://www.bp.com/liveassets/bp_internet/globalbp/globalbp_uk_english/reports_a
nd_publications/statistical_energy_review_2011/STAGING/local_assets/pdf/statist
ical_review_of_world_energy_full_report_2012.pdf
British Petroleum (2012b). BP Energy Outlook 2030, January 2012. Retrieved October
8, 2012 from;
http://www.bp.com/liveassets/bp_internet/globalbp/STAGING/global_assets/downl
oads/O/2012_2030_energy_outlook_booklet.pdf
Briggs, C.A., Tolliver D. and Szmerekovsky, J. (2012). Managing and Mitigating the
Upstream Petroleum Industries Supply Chain Risks: Leveraging Analytic
Hierarchy Process. International Journal of Business and Economics Perspectives
Spring 2012. 7, (1), 1-20
Canadian Association of Petroleum Producers, CAPP (2012a). Crude Oil Forecast,
Markets and Pipelines. Retrieved on October 11, 2012 from;
http://www.capp.ca/forecast/Pages/default.aspx
Canadian Association of Petroleum Producers, CAPP, (2012b). CAPP Statistical
Handbook. Retrieved on October 11, 2012 from;
http://www.capp.ca/library/statistics/handbook/Pages/default.aspx
Canadian Energy Pipeline Association, CEPA, (2012a). About Pipelines. Retrieved
January 15, 2013 from: http://www.cepa.com/about-pipelines/types-of-pipelines
Canadian Energy Pipeline Association, CEPA, (2012b). Liquid Pipelines: Output from a
Barrel of Oil. Retrieved January 15, 2013 from: http://www.cepa.com/about-
pipelines/types-of-pipelines/liquids-pipelines)
Canadian Energy Pipeline Association, CEPA, (2013). Interactive Liquids Pipeline Map.
Retrieved January 15, 2013 from http://www.cepa.com/map/
Canadian Energy Research Institute, CERI, (2012) CERI Crude Oil Report Jul-Aug
2012. Retrieved on October 10, 2012 from;
http://www.ceri.ca/images/stories/CERI_Crude_Oil_Report_-_July-
August_2012.pdf

A Strategic Analysis of Petroleum Refining Infrastructure In Canada
Page 78
CBC News (July 28, 2010). Alberta Gas Shortage Spreads to BC. Retrieved on
January 12, 2013 from; http://www.cbc.ca/news/canada/british-
columbia/story/2010/07/28/shell-gasoline-shortages-western-canada.html
Cibin, R. and Grant, R. M. (1996), Restructuring Among the World's Leading Oil
Companies, 1980–92. British Journal of Management, 7: 283–307. doi:
10.1111/j.1467-8551.1996.tb00120.x
Conference Board of Canada (2011). Canada’s Petroleum Refining Sector. An
Important Contributor Facing Global Challenges. Retrieved on December 12,
2012 from: http://www.conferenceboard.ca/e-library/abstract.aspx?did=4469
DOE, U.S. Department of Energy, (1997) Introduction to System Dynamics. Retrieved
November 21, 2012: http://www.systemdynamics.org/DL-IntroSysDyn/
Enbridge Inc. (2012). Line 9B Reversal and Line 9 Capacity Expansion Project.
Retrieved January 21, 2013:
http://www.enbridge.com/ECRAI/Line9BReversalProject.aspx
Energy Information Agency of the U.S. Department of Energy, EIA, (2009). National
Energy Modeling System. An Overview, 2009. Retrieved on November 20, 2012
from: www.eia.doe.gov/oiaf/aeo/overview/
Energy Information Agency of the U.S. Department of Energy, EIA, (2012a), Short Term
Energy Outlook Supplement: Brent Crude Oil Spot Price Outlook. Retrieved on
January 15, 2013 from:
http://www.eia.gov/forecasts/steo/special/pdf/2012_sp_02.pdf
Energy Information Agency of the U.S. Department of Energy,EIA, (2012b). Definitions;
Charge Capacity. Retrieved on January 15, 2013 from:
http://www.eia.gov/dnav/pet/TblDefs/pet_pnp_cap1_tbldef2.asp
Energy Information Agency of the U.S. Department of Energy, EIA, (2012c). Rail
deliveries of oil and petroleum products up 38% in first half of 2012. Retrieved on
January 15, 2013 from: http://www.eia.gov/todayinenergy/detail.cfm?id=7270
Energy Information Agency of the U.S. Department of Energy, EIA, (2012d). EIA’s
AEO2012 includes analysis of breakthroughs in vehicle battery technology.
Retrieved on March 10, 2013 from:
http://www.eia.gov/todayinenergy/detail.cfm?id=6930

A Strategic Analysis of Petroleum Refining Infrastructure In Canada
Page 79
Energy Information Agency of the U.S. Department of Energy, EIA, (2013). Strategic
Petroleum Reserve 1977 - 2011. Retrieved on February 20, 2013 from:
http://www.eia.gov/totalenergy/data/annual/showtext.cfm?t=ptb0517
Fong, P., (January 18, 2013), Northern Gateway Oil Pipeline: Vancouver Hearings
Overwhelmingly Opposed to Project. Retrieved on February 18, 2013 from;
http://www.thestar.com/news/canada/2013/01/18/northern_gateway_oil_pipeline_
emotions_erupt_at_vancouver_hearings.html
Forrester, J. W. (1958). Industrial Dynamics. Harvard Business Review, Jul/Aug 1958,
Vol. 36 Issue 4, p37- 66.
Forrester, J. W. (1991). System Dynamics and the Lessons of 35 Years. A chapter for
The Systemic Basis of Policy Making in the 1990s edited by Kenyon B. De
Greene. Retrieved on November 22, 2012 from:
ftp://nyesgreenvalleyfarm.com/documents/sdintro/D-4224-4.pdf
Gitman, L. J., & Hennessey, S. M. (2008). Principles of Corporate Finance (2nd
Canadian ed.). Toronto: Pearson Education Canada.
Government of Canada, (2010), Renewable Fuel Regulations. Retrieved on February 2,
2013 from: http://www.gazette.gc.ca/rp-pr/p2/2010/2010-09-01/html/sor-dors189-
eng.html
Grant, Robert M. (2008) Contemporary Strategy Analysis (Sixth Addition). Oxford:
Blackwell Publishing Ltd
Grant, R. M. (2003) Strategic Planning in a Turbulent Environment: Evidence from the
Oil Majors. Strategic Management Journal. 24: 491–517. doi: 10.1002/smj.314
Imperial Oil Limited (2013) 2012 to 2003 Annual Report to Shareholders. Retrieved on
February 2, 2013 from: http://www.imperialoil.ca/Canada-
English/about_investors_reports_aandq.aspx
International Energy Agency, IEA, (2009). Energy Balances in Canada in 2009.
Retrieved on September 6, 2012 from;
http://www.iea.org/stats/balancetable.asp?COUNTRY_CODE=CA
International Energy Agency, IEA, (2012). 2011 Key World Energy Statistics. Retrieved
on September 6, 2012 from;
http://www.iea.org/publications/freepublications/publication/name,26707,en.html

A Strategic Analysis of Petroleum Refining Infrastructure In Canada
Page 80
Leedy, P. D., & Ormrod, J. E. (2005). Practical Research: Planning and Design (8th
ed.). Upper Saddle River, NJ: Pearson.
Mintzberg,H., Ahlstrand, B. and Lampel, J. (1998). Strategy Safari: A Guided Tour
through the Wilds of Strategic Management. The Free Press, New York, Simon
and Schuster Inc.
M.J Ervin & Associates (2011). National Retail Petroleum Site Census: 2010. Retrieved
on February 26, 2013 from:
http://canadianfuels.ca/userfiles/file/2010%20National%20Retail%20Petroleum%2
0Site%20Census%20(revised).pdf
Moore, M.C., Flaim, S. Hackett, D. Grissom, S., Crison, D., Honarvar, A. (2011)
Catching the Brass Ring: Oil market Diversification for Canada. Retrieved on
September 18, 2012 from:
http://policyschool.ucalgary.ca/sites/default/files/research/mmoore-oilmarket.pdf
Morecroft, J.D.W., Heijden, K.A.J.M., (1992). Modelling the oil producers-capturing oil
industry knowledge in a behavioural simulation model. European Journal of
Operational Research 59, 102–122.
National Energy Board (2011) Canada’s Energy Future; Energy Supply and Demand
Projections to 2035. Retrieved on October 8, 2012 from; http://www.neb-
one.gc.ca/clf-nsi/rnrgynfmtn/nrgyrprt/nrgyftr/2011/nrgsppldmndprjctn2035-eng.pdf
Natural Resources Canada (2012) Fuel Focus. Understanding Gasoline Markets in
Canada and Economic Drivers Influencing Prices Volume 7, Issue 16 August 24,
2012. Retrieved on September 10, 2012 from;
http://www.nrcan.gc.ca/energy/sites/www.nrcan.gc.ca.energy/files/files/pdf/issue1
6.pdf
Natural Resources Canada, (2012) Refinery Economics. Retrieved on September 10,
2012 from: http://www.nrcan.gc.ca/energy/sources/petroleum-products-
market/1519
Natural Resources Canada (2009a). Product Supply and Demand. Retrieved on
October 10, 2012 from: http://www.nrcan.gc.ca/energy/sources/petroleum-
products-market/1628

A Strategic Analysis of Petroleum Refining Infrastructure In Canada
Page 81
Natural Resources Canada (2009b). Petroleum Products Distribution Network.
Retrieved on October 10, 2012 from:
http://www.nrcan.gc.ca/energy/sources/infrastructure/1490 )
Natural Resources Canada. (2008). Canadian Refining and Oil Security, November
2008. Retrieved on February 10, 2013 from:
http://www.nrcan.gc.ca/energy/sources/petroleum-products-market/1358
Neiro, S.M.S., Pinto, J.M. (2004). A general modeling framework for the operational
planning of petroleum supply chains. Computers and Chemical Engineering.
Volume 28, pp. 871 – 896. Retrieved on March 2, 2013 from:
http://cepac.cheme.cmu.edu/pasilectures/pinto/revpaper-NP.pdf
Pacholik, B., (February 11, 2013). Regina Co-Op Fire. Retrieved from the Leader Post
website on February 17, 2013 at:
http://www.leaderpost.com/news/Overnight+fire+Regina+refinery/7948133/story.ht
ml
Porter, M. E. (1998). Clusters and the New Economics of Competition. Harvard
Business Review- Nov/Dec 1998, Vol. 76, Issue 6, pp. 77- 90.
Porter, M. E. (2008). The Five Competitive Forces That Shape Strategy. Harvard
Business Review- Jan 2008, Vol. 86, Issue 1, pp. 78- 93.
Porter, M. E. (1996). What is Strategy? Harvard Business Review- Nov-Dec 1996, Vol.
74 Issue 6, pp. 61-78.
Richardson, G.P. (2009) System Dynamics, The Basic Elements of. Rockefeller
College of Public Affairs and Policy, University at Albany, State University of New
York, Albany, USA. Retrieved on November 21, 2012 from;
http://ebooks.narotama.ac.id/files/Complex%20Systems%20in%20Finance%20an
d%20Econometrics/Chapter%2048%20%20System%20Dynamics,%20The%20B
asic%20Elements%20of.pdf
Sharples, Ben. (October 16, 2012). Brent-WTI Spread rises to one-year high. Retrieved
on January 12, 2013 from the Financial Post at:
http://business.financialpost.com/2012/10/16/brent-wti-spread-rises-to-one-year-
high/ .
Slack, N., Chambers, S., & Johnston, R. (2010). Operations Management (6th ed.). Essex, UK: Pearson Education.

A Strategic Analysis of Petroleum Refining Infrastructure In Canada
Page 82
Statistics Canada (2012a). The Supply and Disposition of Petroleum Products in
Canada. June 2012. Retrieved on October 11, 2012 from:
http://www.statcan.gc.ca/pub/45-004-x/45-004-x2012006-eng.pdf
Statistics Canada, (2012b). Energy Statistics Handbook. Retrieved on February 12,
2013 from: http://www.statcan.gc.ca/pub/57-601-x/57-601-x2012001-eng.pdf
Statistics Canada, (2012c). Electricity Generated from Fossil Fuels – Table 128 -0014.
Retrieved on March 2, 2013 from:
http://www5.statcan.gc.ca/cansim/a33?RT=TABLE&themeID=4012&spMode=tabl
es&lang=eng
Statistics Canada, (2012d). Electricity power Generation by class electricity producer –
Table 127-0002. Retrieved on March 2, 2013 from:
http://www5.statcan.gc.ca/cansim/a33?RT=TABLE&themeID=4012&spMode=tabl
es&lang=eng
Statistics Canada (2007). The Supply and Disposition of Petroleum Products in Canada.
June 2007 http://www.statcan.gc.ca/pub/45-004-x/45-004-x2003009-eng.pdf.
Retrieved on October 11, 2012 from: http://www.statcan.gc.ca/pub/45-004-x/45-
004-x2012006-eng.pdf
Statistics Canada (2003). The Supply and Disposition of Petroleum Products in Canada.
September 2003. Retrieved on October 11, 2012 from:
http://www.statcan.gc.ca/pub/45-004-x/45-004-x2003009-eng.pdf
Sterman, J.D. (2000) Business Dynamics, Systems Thinking and Modeling for a
Complex World. McGraw-Hill/Irwin, a division of The McGraw-Hill Companies.
Sterman, J.D.(1988). Modeling the formation of expectations: the history of energy
demand forecasts. International Journal of Forecasting 4(2): 243 -259.
Sterman, J.D., Henderson R., Beinhocker E.D., Newman L.I. (2007). Getting big too
fast: strategic dynamics with increasing returns and bounded rationality.
Management Science 53(4): 683–696.
The Canadian Press.(February 17, 2013), Keystone XL Pipeline Draws Climate Change
Protestors in Washington. Retrieved on February 18, 2013 from:
http://www.huffingtonpost.ca/2013/02/17/keystone-xl-pipeline-protest-
washington_n_2707269.html

A Strategic Analysis of Petroleum Refining Infrastructure In Canada
Page 83
Thomas, C.R. and Maurice, S.C. (2008) Managerial Economics (Ninth Edition). McGraw-Hill/Irwin, a business unit of The McGraw-Hill Companies.
Wolstenholme, E.F., (2003). Towards the definition and use of a core set of archetypal
structures in system dynamics. System Dynamics Review. Spring 2003, Vol. 19,
Issue 1, p. 7 -26.

A Strategic Analysis of Petroleum Refining Infrastructure In Canada
Page 84
Appendix 1 – Acronyms, Units and Conversion Factors
Acronyms and Units
API - American Petroleum Institute’s specific gravity scale measuring the density or
viscosity of petroleum liquids in degrees API
BP – British Petroleum
bpd – barrels per day
CAGR - Compounded Average Annual Growth Rate
CEPA – Canadian Energy Pipeline Association
CERI – Canadian Energy Research Institute
CAPP – Canadian Association of Petroleum Producers
CDU - Crude distillation unit
DOE – US Department of Energy
EIA – Energy Information Administration of the US Department of Energy
FCCU - Fluid catalytic cracking unit
gwh – gigawatt hours of electricity
IEA – International Energy Agency
NEB – National Energy Board of Canada
NRC - Natural Resources Canada
PADD – Petroleum Administration for Defence District
ROCE – Return on Capital Employed
RPP – Refined petroleum Products
SD – Systems Dynamics
TNPL – Trans Northern Pipeline; transports RPP from Montreal Quebec into the Ontario
supply orbit

A Strategic Analysis of Petroleum Refining Infrastructure In Canada
Page 85
WTI – West Texas Intermediate oil blend
Conversion Factors
One cubic meter = 6.2893 barrels of oil
One cubic meter = 1000 litres
One Barrel of oil = 159 litres