Embed Size (px)
Citation preview
GROUND WATER RESOURCE S
of
RENVILLE AND WARD COUNTIES
byWayne A. Pettyjohn and R . D. Hutchinson
Geological Surve yUnited States Department of the Interio r
197 1
BULLETIN 50 - PART II INorth Dakota Geological SurveyEdwin A . Noble, State Geologist
COUNTY GROUND-WATER STUDIES 11 - PART II INorth Dakota State Water CommissionMilo W . Hoisveen, State Engineer
Prepared by the United States Geological Surve yin cooperation with the North Dakota State Water Commission ,
the North Dakota Geological Survey,and Renville and Ward Counties Water Management Districts
This is one of a series of county reports published cooperativelyby the North Dakota Geological Survey and the North Dakota Stat eWater Commission. The reports are in three parts; Part I describes th egeology, Part II presents the ground water basic data, and Part IIIdescribes the ground water resources. Part I will be published later.
CONTENTS
PageABSTRACT 1
INTRODUCTION 1Purpose and scope of the investigation 1Location and extent of the area 2Physiography and drainage 2Previous investigations 4Acknowledgments 5Well-numbering system 5
PRINCIPLES OF GROUND-WATER OCCURRENCE 7
WATER QUALITY AND ITS RELATION TO USE 9Dissolved solids and specific conductance 1 1Irrigation indices 1 2Hardness 1 2
REGIONAL GROUND-WATER HYDROLOGY 1 2Coteau du Missouri recharge area 1 3Des Lacs artesian discharge area 1 3Central recharge area 1 5
GROUND WATER IN THE BEDROCK DEPOSITS 1 5Pre-Cretaceous rocks 1 7Cretaceous rocks 17Tertiary rocks 20
GROUND WATER IN THE QUATERNARY DEPOSITS 25Coteau du Missouri area 26
Douglas aquifer 27Hiddenwood Lake aquifer 31Ryder aquifer 3 1Ryder Ridge aquifer 34Tolgen aquifer 3 5Vang aquifer 37Unnamed aquifers 40
Surficial sand and gravel deposits 40Unnamed aquifer at Carpenter Lake 40Unnamed aquifer west of Berthold 40
Des Lacs artesian discharge area 41
i
Des Lacs River valley 4 1
Kenmare aquifer 42
Souris River valley 49
Burlington aquifer 5 6
Lower Souris aquifer 56
Minot aquifer 6 1
North Hill aquifer 80
Northwest Buried-Channel aquifer 81
South Hill aquifer 82
Sundre Buried-Channel aquifer 83Unnamed aquifers 84
Central recharge area
84
Aquifers in the Souris River valleyupstream from Burlington . . . .
8 6
Aquifers in ice-marginal channel deposits 86
Unnamed aquifers 90
USE OF GROUND WATER 92
Domestic and stock use 92
Public supply 92
Berthold 93
Glenburn 93Kenmare 93
Loraine 9 3Minot 94
Ryder 94
Sherwood 94
SUMMARY AND CONCLUSIONS 9 5
SELECTED REFERENCES 9 7
ii
ILLUSTRATIONS
PagePlate
1 . Map showing ground-wate ravailability (in pocket)
2 . Geologic sections of the Souris andDes Lacs River valleys (in pocket )
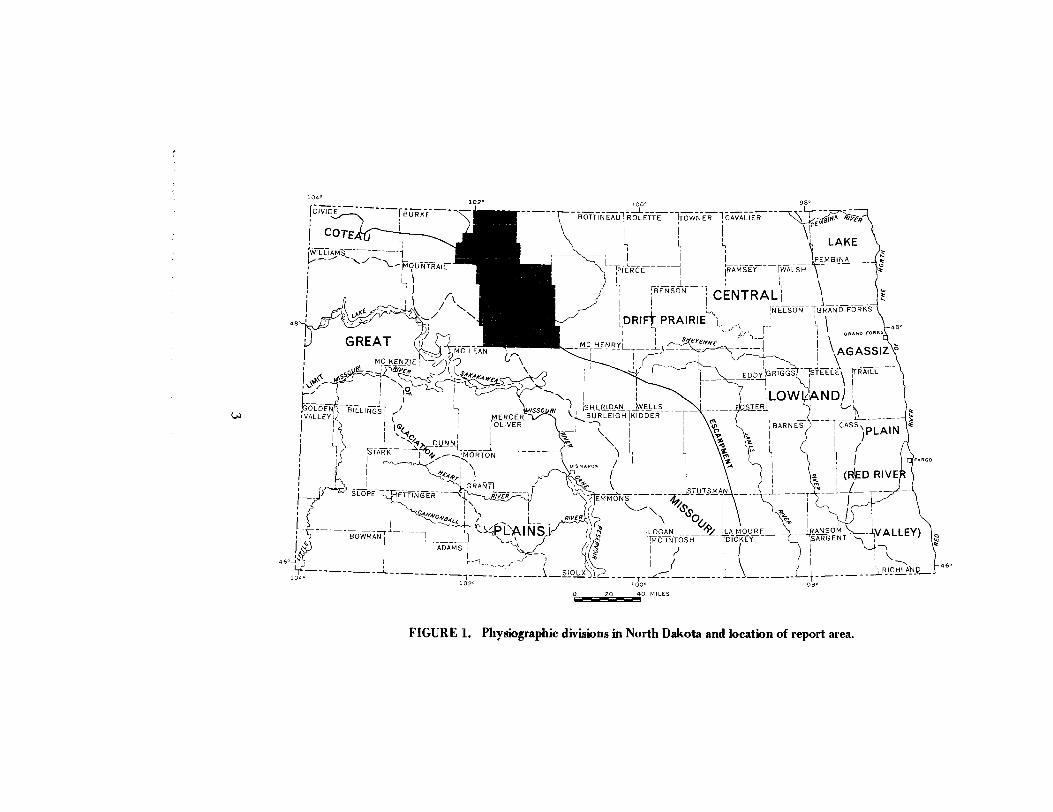
Figure 1 . Map showing physiographic divisions in Nort hDakota and location of report area 3
2. Diagram showing system of numbering wells ,springs, and test holes 6
3. Map showing major ground-water recharge anddischarge areas 14
4. Map showing quality of water from wellspenetrating the Fort Union Group 2 3
5. Map showing location of the Douglas aquifer ,ground-water movement, and specific conductanc eof water from selected wells 28
6. Hydrographs showing water-level fluctuation sin the Douglas aquifer and precipitatio nat Ryder 29
7. Map showing location of the Hiddenwood Lakeaquifer and graph showing water-leve lfluctuations 32
8. Map showing location of the Ryder aquife rand specific conductance of water fromselected wells 33
9. Map showing location of the Tolgen aquiferand specific conductance of water fromselected wells 36
10. Map showing location of the Vang aquifer ,specific conductance of water, andelevation of the water table 38
11. Map showing location of wells for Kenmareaquifer test (160-88-20) 44
12. Graph showing drawdown and recovery curve sfor the Kenmare aquifer test 46
13. Logarithmic graph showing drawdown (s)versus time (t) for observation well2, Kenmare aquifer test 47
14. Graph showing classification of water fromthe Kenmare aquifer for irrigation use 50
15. Hydrographs showing discharge of the Souri sRiver above Minot and near Verendrye, Octobe r1, 1964, to September 30, 1965 5 2
16. Hydrographs showing the combined discharge o fthe Des Lacs and Souris Rivers at the Foxhol mgages and the Souris River at the Minot gage ,June 16, 1964, to September 12, 1964 54
17. Graph showing discharge and dissolved solid sof the Souris River at Verendrye, October1963 through September 1965 55
18. Map showing locations of the Lower Souri sand Sundre Buried-Channel aquifers, andselected hydrologic data 57
19. Hydrographs showing water-level fluctuation sin the Lower Souris and SundreBuried-Channel aquifers . Precipitationat Minot Airport 59
20. Map showing location of wells for the LowerSouris aquifer test (154-82-3) 60
iv
21. Semilogarithmic graph showing Lower Souri saquifer test drawdown-test data forobservation well 1 63
22. Graph showing classification for irrigatio nuse of selected water samples from theLower Souris aquifer and from the SourisRiver between Burlington and Sawyer 64
23. Graph showing precipitation at Minot ,discharge of the Souris River, andwater levels in the central part o fthe Minot aquifer, 1944-66
66
24. Hydrographs showing water-level fluctuation sin the Minot aquifer and precipitation atMinot Airport 68
25. Map showing water-level rise in part of theMinot aquifer from March 1964 toJune 1966
69
26. Graph showing pumpage by Minot, 1944-66 70
27. Semilogarithmic graph showing predicteddrawdowns in the vicinity of Minot wells5 and 7, each discharging 700 gpm fo rselected periods 76
28. Semilogarithmic graph showing predicteddrawdowns in the vicinity of Minotwells 8 and 15, each discharging 70 0gpm for selected periods 77
29. Map showing chemical quality of waterfrom the Minot aquifer 79
30. Map showing location of the North Hillaquifer, and selected hydrologic data 80
31. Semilogarithmic graph showing recovery dat aobtained during aquifer test on th ecity of Sherwood well (164-84-32cdd) 88
v
TABLES
PageTable 1 . Major chemical constituents in water–their
sources, effects upon usability, an drecommended concentration limits 10
2. Bedrock geologic units and theirwater-yielding properties 16
3. Chemical analyses of water fro mbedrock aquifers 18, 19
4. Results of Kenmare aquifer test 48
5. Results of Lower Souris aquifer test 6 2
6. Transmissibility of the Mino taquifer 71, 72
7. Storage coefficient for the Minotaquifer at selected well sites 7 4
8. Specific capacities of selected well sin the vicinity of Minot 7 5
vi
GROUND-WATER RESOURCES OF
RENVILLE AND WARD COUNTIES, NORTH DAKOT A
By
Wayne A. Pettyjohn and R . D. Hutchinson
ABSTRACT
Two major types of aquifers are present in Renville and War dCounties--those in the semiconsolidated and consolidated bedroc kformations and those in unconsolidated glacial deposits .
Layers of sand and lignite in the Fort Union Group are th eprincipal bedrock aquifers. A few bedrock wells flow, but in others th edepth to water may exceed 100 feet. The water is a sodium bicarbonatetype, a sodium chloride type, or a mixture. It is unsuitable for manypurposes.
Aquifers in the Souris (Mouse) and Des Lacs River valleys are th emost productive of the unconsolidated glacial deposits. Individual wellyields of more than 500 gallons per minute are available locally, and th ewater is generally of good quality. Numerous other surficial and buriedglacial aquifers, however, contain water of poor chemical quality .
INTRODUCTIO N
Purpose and Scope of the Investigation
This report is the result of a 4-year investigation by the U .S .Geological Survey in cooperation with the North Dakota State Wate rCommission, the North Dakota Geological Survey, and Renville an dWard Counties. The purpose was to determine the availability, quantity ,and quality of the ground-water resources in the counties . Theavailability of water for municipal use and for irrigation was of primar yinterest.
The investigation began in July 1963 and the fieldwork wascompleted in August 1966. The report on the geology of the countie s
1
will be published as Part I . The basic-data report was published as Par tII (Pettyjohn, 1968a) and includes logs of test holes ; records of wells ,springs, and test holes ; water-level measurements ; and chemical analyse sof ground water . This report (Part III) describes the location, extent ,chemical quality, and quantity of water in storage ; the relationshipbetween surface water and ground water ; water use ; and aquifer yields .It also discusses the suitability of the ground water for irrigation ,municipal supply, industrial use, and domestic and stock use . Basic dataused in this report are from Part II (Pettyjohn, 1968a), unless otherwis ereferenced .
The classification and nomenclature of the rock units in thi sreport conform to the usage of the North Dakota Geological Survey .
Location and Extent of the Area
Renville and Ward Counties cover 2,949 square miles in th enorth-central part of North Dakota (fig. 1) . The area is bounded on thenorth by Canada, on the west by Burke and Mountrail Counties, on th esouth by McLean County, and on the east by Bottineau and McHenr yCounties .
Physiography and Drainage
Renville and Ward Counties can be divided into three distinc tparts: the ground-moraine plain, the valleys of the Souris and Des Lac sRivers, and the Coteau du Missouri . The northeast-slopingground-moraine plain of the Drift Prairie extends from the northeas tedge of the Coteau du Missouri to Canada and includes much of War dCounty and nearly all of Renville County. The plain is traversed by theSouris River upstream from Burlington . The Des Lacs River and theSouris River downstream from Burlington flow near its southwesternborder. The topography is gently rolling, and the local relief is generallylow. A few intermittent streams in ice-marginal channels cross the plai nand potholes are abundant throughout the area . The potholes maycontain water, some throughout the year and others for only a few day sor weeks.
The Souris and Des Lacs River valleys are sufficiently distinct t owarrant a separate discussion in this report . Most of Renville and Ward
2
W
46°
1-/
'0
1SSOOR/
1SHER I DAN ~YJELL S. 11° L (S
—VALLEYI
XEBS.£~
BURLEIG H1KIDDE Ri OLIVER
a
t l
).
DUNN--_~
p
\(STARK +/ „~ORTO N\
9,
ear. Ks
Hf,//8T
q
I
i
~GRANT (R/V£R
102 °
04°102°
4*_ 1STUTSMAN
MMONS
S0LOGA Nr
'rte LA MOURE_\
DC INTOSH ICKEY
98°
\\AGASSI Z
TSTEELE rRAIL L
1AND:
V
—( CASS \PLAI N
1
(
(RIED RIV E
—`SARGENT
I
1
r?ANS_oM
'VALLEY )
(J/
1 146 °
__ RICHLAN_~
98 °
I
f
100 °
20
40 MILE S
100 °BOTTIN EAU ROLETTE 1TOWNER 1 CAVALIE R
II
FEMBIN A_ TIERCE
RAMSEY
rWALS H
1-BENSON
CENTRAL IFN ELSON TGRAND FORK S
I L' iDRIF PRAIRIE 1
jIMC HENRY
S £-4'N£
I
FIGURE 1 . Physiographic divisions in North Dakota and location of report area .
Counties are drained by these rivers, which form part of the drainag esystem of the Red River of the North . The Souris and Des Lacs River sare the only perennial streams in the counties ; although durin gprolonged droughts, flow in both streams may cease in the reache sabove Minot . The river flood plains are wide and nearly flat . There areseveral dams and reservoirs on each river.
The Coteau du Missouri extends across the southern and wester nparts of Ward County . It is characterized by very hilly stagnatio nmoraine, end moraines, and small areas of ground moraine . It is poorlydrained, as shown by the numerous potholes, small lakes, and sloughs .Many of the small bodies of water are saline . There are several extensivedeposits of outwash sand and gravel on the Coteau and many lakechains that represent partly buried valleys . The Missouri Escarpment isthe northeastern margin of the Coteau du Missouri. The "escarpment"is enerally a rather gentle slope (about 50 feet per mile) from thehiger level of the Coteau du Missouri to the lower level of the DriftPrairie. In some localities, however, the slope is much steeper . Itgenerally forms a band several miles wide that is dissected several ten sof feet by tributaries of the Souris and Des Lacs Rivers .
Previous Investigations
Apparently the earliest report concerning the ground-wate rresources in Renville and Ward Counties was by Simpson (1929), whopresented data on water wells in glacial deposits and bedroc kformations . Logs and chemical analyses of selected wells are included i nSimpson's report. Andrews (1939) reported on the lignite deposits i nsouthern Ward County. Robinove, Langford, and Brookhart (1958 )gave a general discussion of the saline water in the counties . A geologicreport (Lemke, 1960) describes the Souris River area, includingRenville County and most of Ward County . A large quantity ofground-water basic data for Renville and Ward Counties, north of theSouris River, is given in a report by LaRocque and others (1963a) . Thebasic data were utilized in a subsequent interpretive report (LaRocqu eand others, 1963b) .
Local ground-water studies have been made in several parts o fRenville and Ward Counties . Akin (1947) studied the ground-wate rconditions in Minot, and Pettyjohn (1967a) added subsequen tinterpretations based on additional data (Pettyjohn and Hills, 1965) .Akin (1951) described the geology and ground-water conditions in theMohall area, which includes parts of Renville and Bottineau Counties .
4
Jensen (1962) discussed the geology and occurrence of ground water i nthe vicinity of Bowbells, which includes parts of Burke and WardCounties. Armstrong (1963) investigated the ground-water resource snear Max in McLean and Ward Counties, and Schmid (1963) studie dthe occurrence of ground water in the Ryder area in southwestern WardCounty. The geology and ground-water resources in the vicinity o fBerthold were described by Randich (1963) . An evaluation of th eground water in the Surrey area in eastern Ward County was made b yFroelich (1964) .
Acknowledgments
The authors are grateful to many of the residents of Renville andWard Counties for contributing helpful information during the study .Mr. Vern Fahy, City Manager of Minot, and Glen Burg, Supervisor o fthe Minot Water-Treatment Plant, deserve special mention for thei rcooperation.
Well-Numbering Syste m
The wells, springs, and test holes in this report are numbere daccording to a system based on the location in the public landclassification of the United States Bureau of Land Management . It i sillustrated in figure 2 . The first numeral denotes the township north o fa base line, the second numeral denotes the range west of the fift hprincipal meridian, and the third numeral denotes the section in whichthe well is located . The letters a, b, c, and d designate, respectively, thenortheast, northwest, southwest, and southeast quarter sections ,quarter-quarter sections, and quarter-quarter-quarter sections (10-acretract) . For example, well 153-87-15ada is in the NEY4SE'/4NE'4 sec . 15 ,T. 153 N., R. 87 W. Consecutive terminal numerals are added if mor ethan one well is recorded within a 10-acre tract.
5
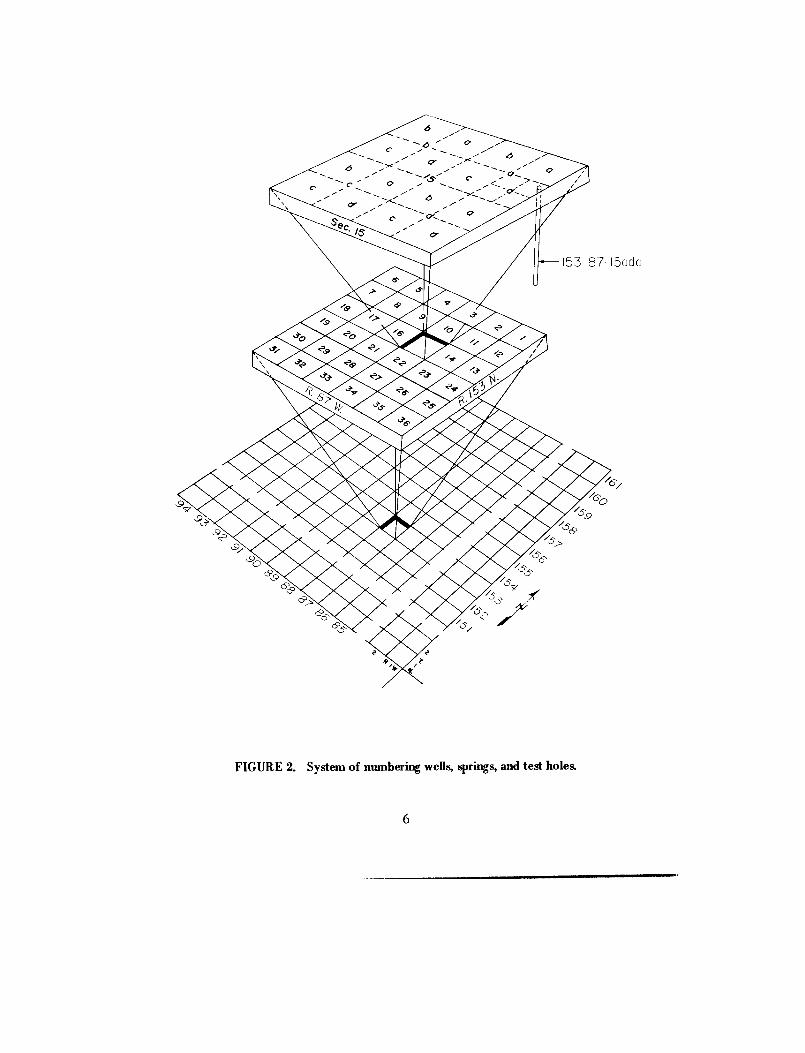
FIGURE 2 . System of numbering wells, springs, and test holes .
6
PRINCIPLES OF GROUND-WATER OCCURRENC E
The ultimate source of ground water is precipitation. After theprecipitation falls on the earth's surface, part is returned to th eatmosphere by evaporation, some runs into the streams, and th eremainder percolates into the ground . Much of the water that sinks intothe ground is held temporarily in the soil and is returned to theatmosphere either by evaporation or by transpiration . The water tha tpercolates downward to the saturated zone (zone of saturation )becomes ground water . The water table is the top of the saturated zon ein an unconfined water body and is free to rise and fall with changes inthe amount of water entering and leaving the saturated zone . The wate rtable is not a flat surface, but generally reflects, in a subdued way, th eirregularities of topography .
A ground-water reservoir that contains sufficient saturate dpermeable material to yield water in sufficient quantity to serve as asource of supply is called an aquifer . When water in an aquifer is no tconfined beneath impermeable material such as clay or shale, it is calle da water-table aquifer . If the pressure in an aquifer due to confinement i ssufficient for water to rise in a well above the top of the aquifer, it i scalled an artesian aquifer .
Ground water is held in temporary storage in an aquifer and move sunder the influence of gravity from areas of recharge to areas of naturaldischarge, such as streams and springs, or artificial discharge, such aswells. Under natural conditions and over a long period of time, the rat eof recharge approximately equals the rate of discharge.
Ground-water movement is generally very slow and may be only afew feet per year. The rate of movement is governed by the ease wit hwhich water can move through a rock and by the differences in wate rleveL
Pumping of water from an aquifer eventually causes one or acombination of the following: (1) A decrease in the rate of naturaldischarge, (2) an increase in the rate of natural recharge, or (3) areduction in the volume of water in storage . The maximum rate o fground-water withdrawal that can be maintained indefinitely is directl yrelated to the rate of recharge.
The water level in a well fluctuates in response to recharge to an ddischarge from the aquifer. Changes in atmospheric pressure andland-surface loadings also cause minor water-level fluctuations inconfined aquifers . The static level is the water level in a well when it isnot being pumped. When water is withdrawn from a well, the wate rlevel is lowered and the water-level surface around the well resembles acone. This surface is referred to as the cone of depression . The amount
7
of water-level drawdown, or the difference between the static an dpumping levels, is controlled by the hydraulic properties of the aquifer ,the physical characteristics of the well, and the rate and duration o fpumping. During constant and uniform discharge from a well, the wate rlevel declines rapidly at first and then continues to decline at adecreasing rate as the cone of depression expands .
Specific capacity, which is a measure of well performance, i sdetermined by dividing the rate of pumping, in gallons per minute, b ythe drawdown in feet . Specific capacity is expressed as gallons pe rminute per foot of drawdown.
The water level in a pumping well must decline in order for wate rto flow from the aquifer to the well . The amount of water-level declinemay become important if (1) it causes water of undesirable quality tomove into the aquifer, (2) the yield of the well decreases because o finterference from other wells or from aquifer boundaries, (3) th epumping lift increases to the point where pumping become suneconomical, or (4) the water level declines below the top of th escreen . When pumping is stopped, the water level rises in the well and inits vicinity at a decreasing rate until the water level again approache sthe static level .
Porosity is the ratio of the volume of the open spaces in a rock t oits total volume and is an index of the storage capacity of the material .
Permeability refers to the ease with which a fluid will pass throug hporous material, and is determined by the size and shape of the por espaces in the rock and their interconnection . Gravel and well-sorte dmedium or coarse sand generally are highly permeable . Well-cementeddeposits and fine-grained materials such as silt, clay, and shale usuall yhave low permeability, and may act as barriers that impede th emovement of water into or out of more permeable rocks .
The coefficient of permeability is the rate of flow in gallons perday through 1 square foot of the aquifer under a unit hydrauli cgradient at a temperature of 60°F (laboratory permeability) . The fieldcoefficient of permeability is determined at the prevailing watertemperature .
The coefficient of transmissibility is a measure of the rate of flowthrough porous material and can be expressed as the number of gallon sof water that will move in 1 day under a unit hydraulic gradient (1 foo tper foot) through a vertical strip of the aquifer 1-foot wide extendin gthe full saturated height of the aquifer . Transmissibility is equal toaquifer thickness multiplied by the field coefficient of permeability .
The storage coefficient refers to the volume of water released fro mor taken into storage per unit of surface area of the aquifer per unitchange in the component of head normal to that surface . Underartesian or confined conditions, the storage coefficient is equal to a
8
very small fraction of the porosity. However, under water-table o runconfined conditions, the storage coefficient is much larger and i spractically equal to the specific yield, which is the ratio of the volum eof water released by gravity drainage to the volume of the materia ldrained. The specific yield may be more than half the total porosity .
WATER QUALITY AND ITS RELATION TO US E
All natural water contains dissolved solids . Rainfall, on contactwith the earth, begins to dissolve mineral matter, and this proces scontinues as the water moves through the earth. The amount and kin dof mineral matter dissolved depends upon the solubility and types o frocks or other mineral matter encountered, the length of time the wate ris in contact with them, and the amount of carbon dioxide and soi lacids in the water. Water that has been underground a long time, or ha straveled a long distance from the recharge area, generally is more highlymineralized than water that has been in transit for only a short timeand is withdrawn near the recharge area . Ground water usually contain smore dissolved minerals than water from streams .
The dissolved mineral constituents in water are reported in partsper million (ppm) in this report . A part per million is a unit weight of aconstituent in a million unit weights of water . Equivalents per million(epm) is the unit chemical combining weight of a constituent in amillion weights of water . This unit is not usually reported, but isnecessary to calculate percent sodium, the sodium-adsorption ratio(SAR), or to check the general accuracy of a chemical analysis .
The suitability of water for various uses is largely determined b ythe kind and amount of dissolved mineral matter . The chemicalproperties and constituents most likely to be of concern to residents o fRenville and Ward Counties are : (1) dissolved solids and the relatedspecific conductance, (2) sodium-adsorption ratio, (3) hardness, (4 )iron, (5) sulfate, (6) nitrate, (7) chloride, and (8) fluoride . The relativeimportance of the above properties and constituents of water depend sprimarily on the use of the water . For example, hardness has very littl eeffect on the suitability of water for drinking, but it can make waterundesirable for laundry use. Additional information may be found i n"Drinking Water Standards" published by the U.S. Public HealthService (1962) .
Table 1, modified from Durfor and Becker (1964, table 2), showsthe major constituents in water, their major sources, and their effect s
9
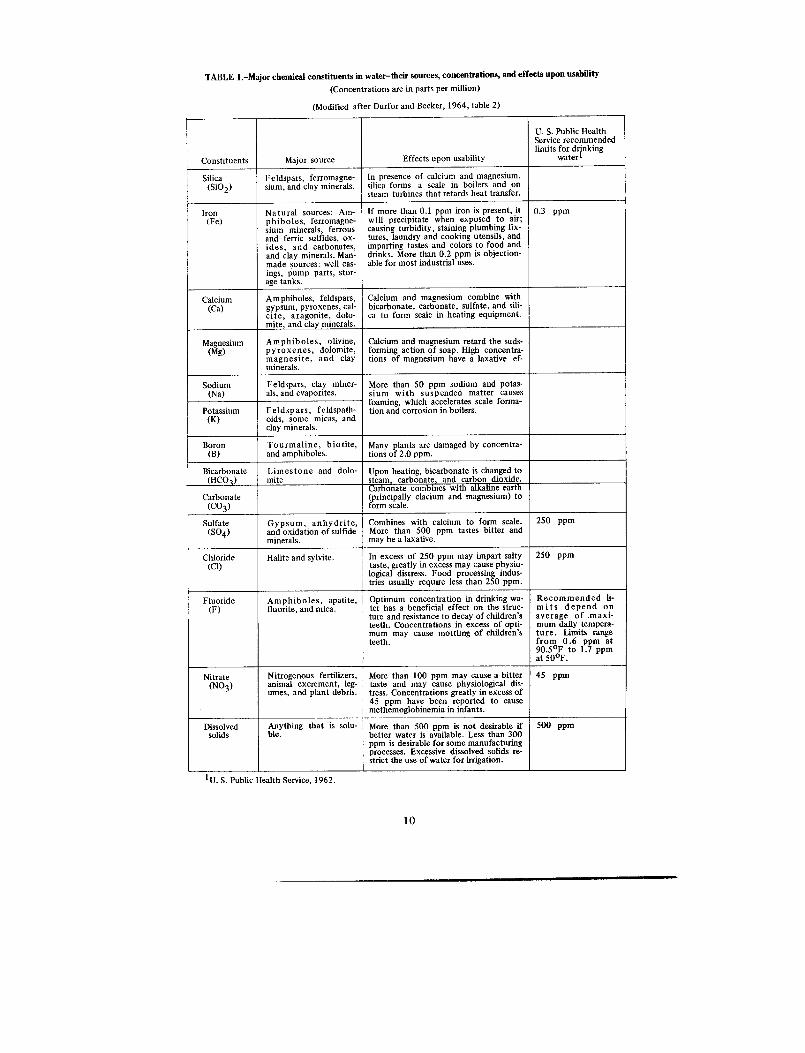
TABLE 1 .—Major chemical constituents in water—their sources, concentrations, and effects upon usabilit y
(Concentrations are in parts per million)
(Modified after Durfor and Becker, 1964, table 2)
Constituents Major source Effects upon usability
U . S. Public HealthService recommendedlimits for drinking
water
Silic a(SiO2 )
Feldspars, ferromagne-sium, and clay minerals .
In presence of calcium and magnesium ,silica forms
a scale in boilers and o nsteam turbines that retards heat transfer .
Iro n(Fe)
Natural sources : Am-phiboles, ferromagne-sium minerals, ferrousand ferric sulfides, ox -ides,
and carbonates ,and clay minerals . Man-made sources : well cas-ings, pump parts, stor-age tanks .
If more than 0 .1 ppm iron is present, itwill precipitate when exposed to air ;causing turbidity, staining plumbing fix -tures, laundry and cooking utensils, andimparting tastes and colors to food anddrinks . More than 0 .2 ppm is objection -able for most industrial uses .
0 .3
pp m
Calciu m(Ca)
Amphiboles, feldspars ,gypsum, pyroxenes, cal-cite,
aragonite, dolo-mite, and clay minerals.
Calcium and magnesium combine withbicarbonate, carbonate, sulfate, and sill-ca to form scale in heating equipment .
Magnesiu m(Mg)
Amphiboles,
olivine,pyroxenes, dolomite,magnesite, and
clayminerals.
Calcium and magnesium retard the suds-forming action of soap . High concentra-tions of magnesium have a laxative ef -
Sodium(Na)
Feldspars, clay miner-als, and evaporites.
More than 50 ppm sodium and potas -sium
with suspended
matter cause sfoaming, which accelerates scale forma-tionandcorrosion inboilers .Potassiu m
(K)Feldspars,
feldspath-oids, some micas, an dclay minerals .
Boro n(B)
Tourmaline, biotite,and amphiboles.
Many plants are damaged by concentra-tions of 2 .0 ppm .
Bicarbonate(HCO3)
Limestone and dolo-mite
Upon heating, bicarbonate is changed t osteam, carbonate, and carbon dioxide .
Carbonat e(CO3)
Carbonate combines with alkaline earth(principally clacium and magnesium) t oform scale .
Sulfate(SO4)
Gypsum, anhydrite ,and oxidation of sulfideminerals .
Combines with calcium to form scale .More than 500 ppm tastes bitter andmay be a laxative .
250 ppm
Chloride(Cl)
Halite and sylvite . In excess of 250 ppm may impart salt ytaste, greatly in excess may cause physio-logical distress . Food processing indus-tries usually require less than 250 ppm .
250 ppm
Fluoride(F)
Amphiboles, apatite,fluorite, and mica .
Optimum concentration in drinking wa-ter has a beneficial effect on the struc -ture and resistance to decay of children'steeth . Concentrations in excess of opti-mum may cause mottling of children'steeth .
Recommended B-m i t s depend o naverage of maxi-mum daily tempera-ture .
Limits rangefrom 0 .6 ppm at90 .5°F to 1 .7 ppmat 50°F.
Nitrate(NO 3)
Nitrogenous fertilizers ,animal excrement, leg-umes, and plant debris .
More than 100 ppm may cause a bittertaste and may cause physiological dis-tress . Concentrations greatly in excess o f45 ppm have been reported to causemethemoglobinemia in infants .
45 ppm
Dissolvedsolids
Anything that is sow-ble .
More than 500 ppm is not desirable ifbetter water is available . Less than 30 0ppm is desirable for some manufacturingprocesses. Excessive dissolved solids re-strict the use of water for irrigation .
500 ppm
1 U. S. Public Health Service, 1962.
1 0
upon usability. Most, if not all, of the minerals shown in the majorsource column are present in the rock formations underlying Renvill eand Ward Counties.
The chemical analyses of water in Renville and Ward Countie swere listed by Pettyjohn (1968a, tables 5 and 6) .
Dissolved Solids and Specific Conductance
The concentration of dissolved solids is a measure of the totalmineralization of water . The dissolved-solids concentration is significan tbecause it may limit the use of water for many purposes . In general, thesuitability of water decreases with an increase in dissolved solids . Thelimits shown in table 1 for drinking water were originally set forcommon carriers in interstate commerce . Residents in areas wheredissolved solids are as high as 2,000 ppm have consumed the water wit hno noticeable effects. Livestock has been known to survive on watercontaining 10,000 ppm. However, growth and reproduction of livestockmay be affected by water containing more than 3,000 ppm of dissolve dsolids .
The dissolved-solids content can be described in terms of salinity .The following terms describing salinity are used by the U.S. GeologicalSurvey (Swenson and Baldwin, 1965, p . 20) .
Dissolved solids ,Description in parts per million
Slightly saline 1,000 - 3,000
Moderately saline 3,000 - 10,000
Very saline 10,000-35,000
Brine More than 35,00 0
The specific conductance of water is a measure of the water' scapacity to conduct an electrical current ; it is a function of the amoun tand kind of dissolved mineral matter . Specific conductance usually isreported in micromhos per centimeter at 25°C, or simply micromhos .An estimate of the total dissolved solids in parts per million can b eobtained by multiplying specific conductance by 0.65 ; however, theconversion factor may range from 0.5 to 1.0, depending upon the typ eand amount of dissolved minerals (Hem, 1959, p. 40) .
11
Irrigation Indice s
Two indices used to show the suitability of water for irrigation ar eSAR and specific conductance . SAR is related to the sodium hazard ;the specific conductance is related to the salinity hazard. The hazardsincrease as the numerical values of these indices increase .
Another index used to evaluate irrigation water is the residua lsodium carbonate (RSC) . This quantity is determined by subtractin gthe equivalents per million of calcium and magnesium from the sum ofequivalents per million of bicarbonate and carbonate . Waters having anRSC between 1 .25 and 2 .5 epm are considered marginal for irrigation .An RSC of more than 2 .5 epm indicates that the water is not suitablefor irrigation purposes. Generally the ground water in Renville andWard Counties has an RSC index of less than 2.5 epm. Goodmanagement practices might make it possible to successfully use som eof the marginal RSC water for irrigation . For further information, th ereader is referred to "Diagnosis and Improvement of Saline and Alkal iSoils" (U.S. Salinity Laboratory Staff, 1954) .
Hardness
The hardness of water determines its usefulness for laundries an dfor some industries . The U.S. Geological Survey rates hardness a sfollows : Water having a hardness of 0 to 60 ppm calcium carbonate i ssoft, between 61 and 120 ppm is moderately hard, between 121 an d180 ppm is hard, and more than 180 ppm is very hard . Hardness doesnot seriously interfere with the use of water for most purposes, but i tdoes increase the consumption of soap . Its removal by a softenin gprocess can be profitable for domestic uses, for laundries, and for som eindustries .
REGIONAL GROUND-WATER HYDROLOGY
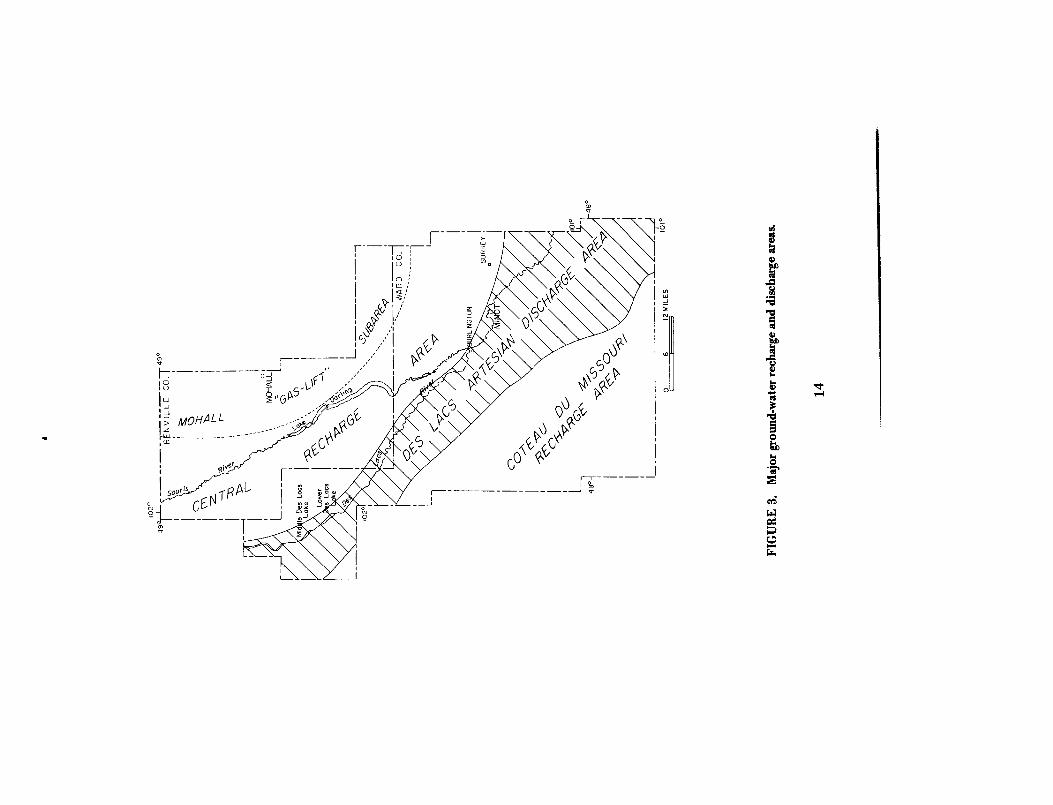
The Renville-Ward County area can be subdivided into three majo rground-water areas : (1) the Coteau du Missouri recharge area ; (2) theDes Lacs artesian discharge area ; and (3) the central recharge area ,including the Mohall "gas-lift" subarea (fig. 3) .
12
Coteau du Missouri Recharge Are a
The Coteau du Missouri covers an area of about 730 square mile sof southwestern Ward County (fig . 3) . The area is marked by thousand sof small undrained depressions in the glacial till that accumulate larg equantities of surface water . Part of the water in these depressions seepsdownward to recharge ground-water reservoirs .
Water that moves downward through the till recharges underlyin ggravel, sand, or lignite aquifers . Upon reaching the aquifers, the watermoves laterally to adjacent areas of discharge where ground-watermovement is upward.
Data are not available to determine the quantity of naturalrecharge that the Coteau du Missouri area provides to the regiona lground-water flow system. Apparently the quantity is not as great asthe ground-water withdrawal in adjacent areas because many of th ewells that formerly flowed must now be pumped and many of th esprings have ceased to flow.
Although the Coteau du Missouri is a regional ground-waterrecharge area, there are many small areas of local discharge .Ground-water discharge in these areas is indicated by seeps and springs ,saline lakes and salt flats, and increased head with depth in wells ,indicating upward movement of ground water, or discharge .
Des Lacs Artesian Discharge Area
The Des Lacs artesian discharge area was first described bySimpson (1929) . It is a belt of about 870 square miles, approximatelyparallel to the northeastern edge of the Coteau du Missouri, in whic hwells flow or once flowed. The area ranges from 6 to 9 miles in widthalong the Des Lacs River and widens to nearly 20 miles in th esoutheastern part of Ward County (fig. 3) .
The gradient of the potentiometric surface in this area ranges fro m40 to 70 feet per mile to the northeast, being steeper in th enorthwestern part. The regional gradient is much steeper than in anyother part of Renville and Ward Counties . The slope of the regionalpotentiometric surface steepens markedly near the Des Lacs and SourisRiver valleys .
Ground water discharges as springs and seeps along the major rive rvalleys. Base flow in the rivers and their tributaries is negligible ,
13
however, except southeast of Minot, because most of the ground wate rthat discharges from this system is lost by evapotranspiration .
Central Recharge Area
The central recharge area (fig. 3) is a nearly flat expanse of groundmoraine that gently slopes to the northeast. It is crossed by severalsmall streams that trend southeastward, generally parallel to the Souri sRiver . This 1,330 square-mile area contains thousands of small, poorl ydrained, shallow prairie potholes .
Throughout most of the central recharge area, wells tapping theglacial drift have higher water levels than nearby wells in the underlyingbedrock. Where two closely adjacent observation wells are constructe din the glacial drift, the shallow observation well has the higher wate rlevel . The water-level difference between wells of different depths inthe drift rarely exceeds 3 feet.
The higher water levels in progressively shallower wells indicat ethat ground-water movement is downward and that ground water isbeing recharged to the deeper aquifers throughout this area .
The Souris River valley, which nearly bisected the area, is a zon eof local ground-water discharge, and small seeps and springs arecommon along the valley walls. The quantity discharged in this manne ris small, however, because of the low permeability of the drift. Baseflow in the reach of the Souris River above Burlington is negligibleduring the summer months .
Many scattered wells in the Mohall "gas-lift" subarea (fig. 3)formerly flowed because of the "gas-lift" effect of gas dissolved in th ewater. The deeper wells may exceed 500 feet in depth and many o fthose deeper than 150 feet produced at least some gas. A morecomplete discussion of the "gas-lift" effect is given on page 84 .
GROUND WATER IN THE BEDROCK DEPOSIT S
Deposits underlying glacial drift and alluvium are referred to asbedrock. Table 2 summarizes the lithology and water-bearingcharacteristics of the bedrock geologic units of Cretaceous and Tertiaryage. Bedrock aquifers yield water to approximately 47 percent of thedomestic and stock wells in Renville and Ward Counties .
-15
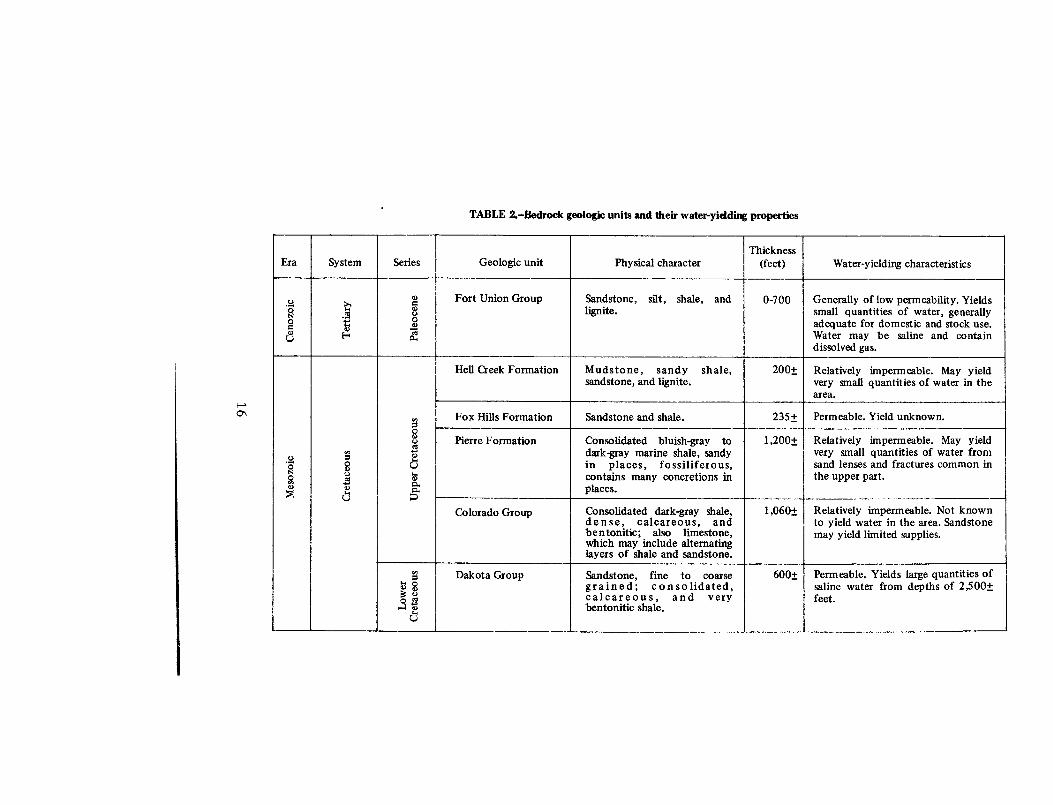
TABLE 2.-Bedrock geologic units and their water-yielding propertie s
Era System Series Geologic unit Physical characterThickness
(feet) Water-yielding characteristic s
a Fort Union Group Sandstone,
silt,
shale,
and 0-700 Generally of low permeability . Yield sN$ lignite . small quantities of water, generall y
o o adequate for domestic and stock use .j E'er' a Water may be saline and contain
dissolved gas .
Hell Creek Formation Mudstone,
sandy
shale, 200± Relatively impermeable. May yieldsandstone, and lignite. very small quantities of water in th e
area .
. Fox Hills Formation Sandstone and shale . 235± Permeable. Yield unknown.
Pierre Formation Consolidated
bluish-gray
to 1,200± Relatively impermeable . May yielddark-gray marine shale, sandy very small quantities of water from
o $ U in
places,
fossiliferous, sand lenses and fractures common incontains many concretions in the upper part .
fa. places .
Colorado Group Consolidated dark-gray shale, 1,060± Relatively impermeable. Not knowndense,
calcareous,
and to yield water in the area . Sandstonebentonitic ;
also
limestone, may yield limited supplies.which may include alternatinglayers of shale and sandstone.
Dakota Group Sandstone,
fine
to
coarse 600± Permeable . Yields large quantities o fa 2 grained ;
consolidated, saline water from depths of 2,500±3 calcareous,
and
very feet .S ° bentonitic shale .
U
Pre-Cretaceous Rocks
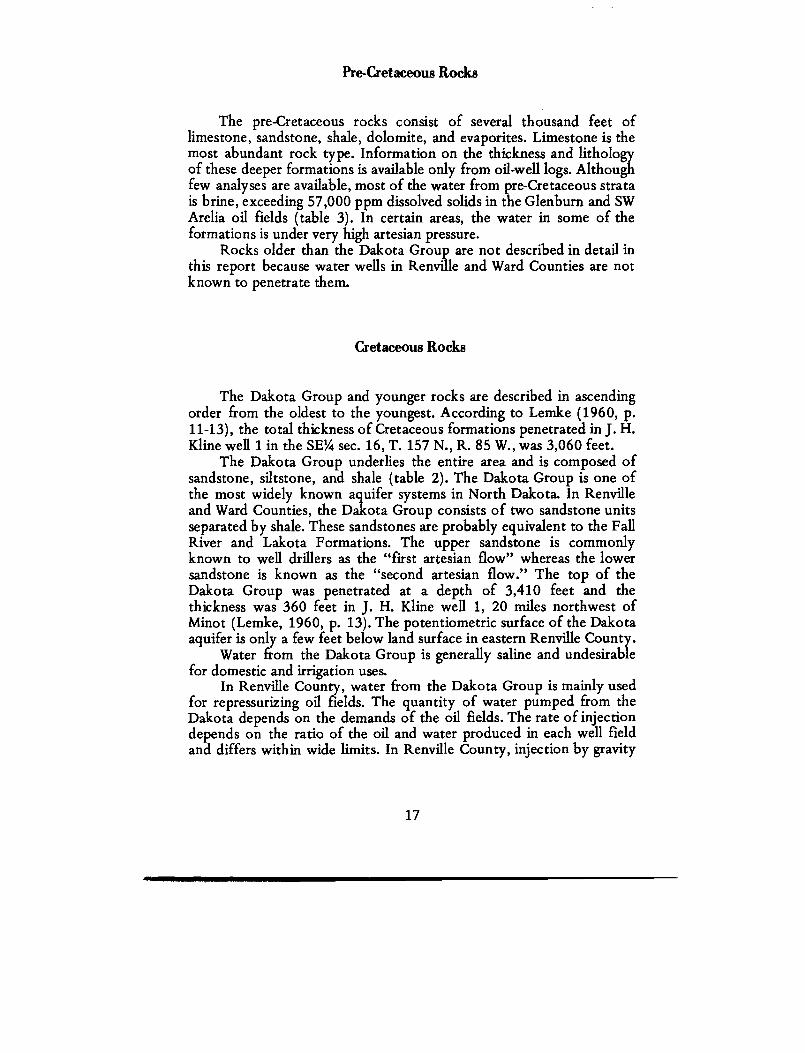
The pre-Cretaceous rocks consist of several thousand feet oflimestone, sandstone, shale, dolomite, and evaporites. Limestone is themost abundant rock type . Information on the thickness and lithologyof these deeper formations is available only from oil-well logs . Althoughfew analyses are available, most of the water from pre-Cretaceous stratais brine, exceeding 57,000 ppm dissolved solids in the Glenburn and S WArelia oil fields (table 3) . In certain areas, the water in some of th eformations is under very high artesian pressure .
Rocks older than the Dakota Group are not described in detail inthis report because water wells in Renville and Ward Counties are no tknown to penetrate them .
Cretaceous Rocks
The Dakota Group and younger rocks are described in ascendingorder from the oldest to the youngest . According to Lemke (1960, p .11-13), the total thickness of Cretaceous formations penetrated in J . H .Kline well 1 in the SE% sec . 16, T. 157 N., R. 85 W., was 3,060 feet .
The Dakota Group underlies the entire area and is composed o fsandstone, siltstone, and shale (table 2) . The Dakota Group is one o fthe most widely known aquifer systems in North Dakota . In Renvilleand Ward Counties, the Dakota Group consists of two sandstone unit sseparated by shale . These sandstones are probably equivalent to the FallRiver and Lakota Formations. The upper sandstone is commonlyknown to well drillers as the "first artesian flow" whereas the lowe rsandstone is known as the "second artesian flow." The top of th eDakota Group was penetrated at a depth of 3,410 feet and thethickness was 360 feet in J . H. Kline well 1, 20 miles northwest ofMinot (Lemke, 1960, p . 13) . The potentiometric surface of the Dakotaaquifer is only a few feet below land surface in eastern Renville County .
Water from the Dakota Group is generally saline and undesirabl efor domestic and irrigation uses.
In Renville County, water from the Dakota Group is mainly use dfor repressurizing oil fields . The quantity of water pumped from th eDakota depends on the demands of the oil fields . The rate of injectio ndepends on the ratio of the oil and water produced in each well fiel dand differs within wide limits . In Renville County, injection by gravity
17
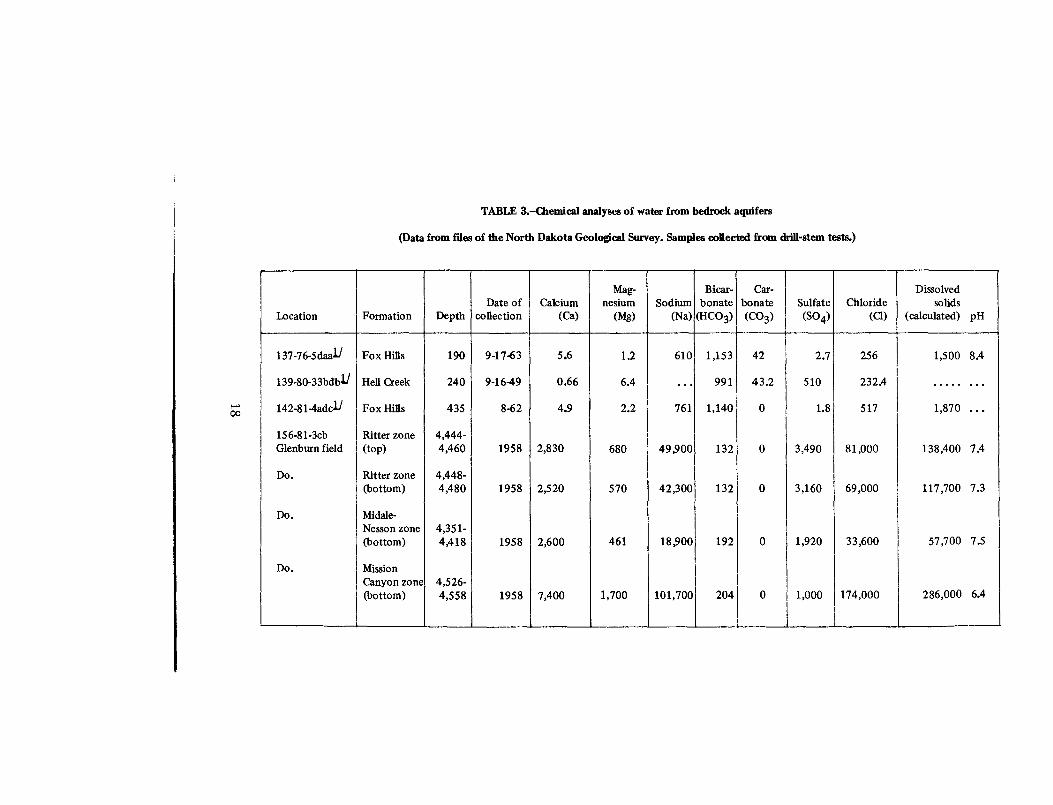
TABLE 3.-Chemical analyses of water from bedrock aquifers
(Data from files of the North Dakota Geological Survey. Samples collected from drill-stem tests .)
Date of CalciumMag-
nesium SodiumBicar-
bonateCar-
bonate Sulfate ChlorideDissolve d
solid sLocation Formation Depth collection (Ca) (Mg) (Na) (HCO3) (CO3) (SO 4) (Q) (calculated)
p H
137-76-5daa1' Fox Hills 190 9-17-63 5 .6 1 .2 610 1,153 42 2 .7 256 1,500
8 .4
139-80-33bdb JJ Hell Creek 240 9-16-49 0 .66 6 .4 . . . 991 43 .2 510 232.4 . . . . .
. . .
142-81-4adcJJ Fox Hills 435 8-62 4 .9 2 .2 761 1,140 0 1 .8 517 1,870
. . .
156-81-3cb Ritter zone 4,444 -Glenburn field (top) 4,460 1958 2,830 680 49,900 132 0 3,490 81,000 138,400
7 .4
Do . Ritter zone 4,448 -
Do .
(bottom)
Midale-
4,480 1958 2,520 570 42,300 132 0 3,160 69,000 117,700
7 .3
Nesson zone 4,351 -
Do .
(bottom )
Mission
4,418 1958 2,600 461 18,900 192 0 1,920 33,600 57,700
7 .5
Canyon zone 4,526 -(bottom) 4,558 1958 7,400 1,700 101,700 204 0 1,000 174,000 286,000
6.4
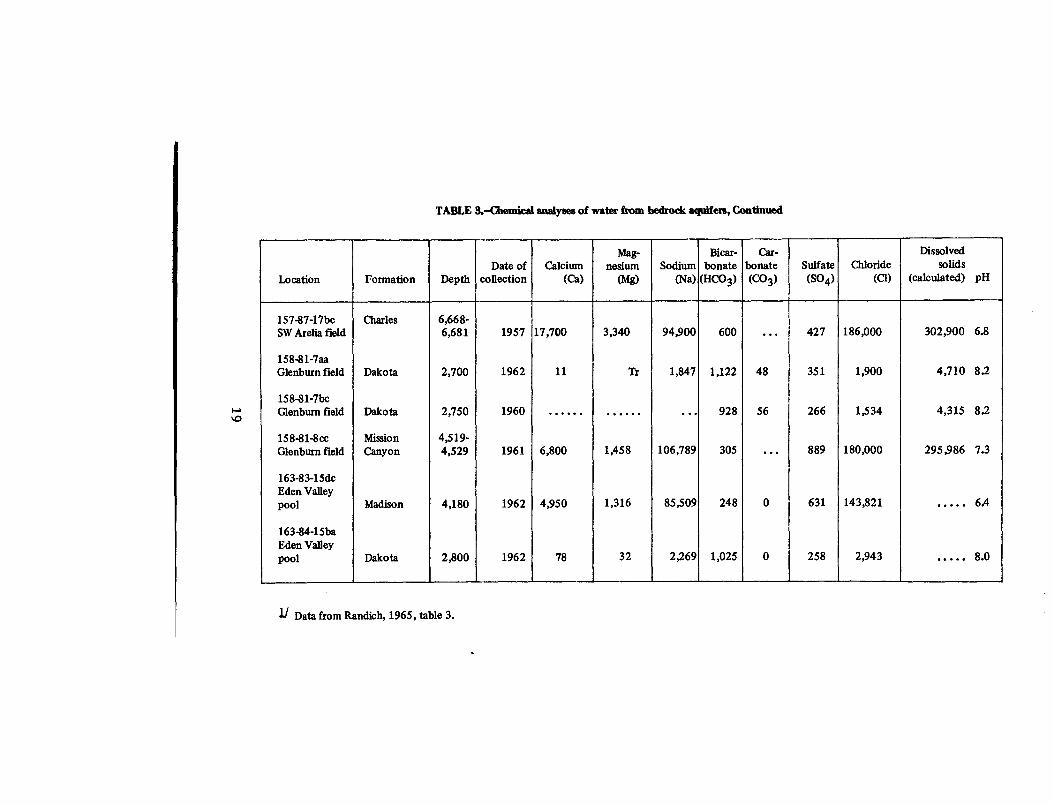
TABLE 3.-Chemical analyses of water from bedrock aquifers, Continue d
Date of CalciumMag-
nesium SodiumBicar -
bonateCar-
bonate Sulfate ChlorideDissolved
solidsLocation Formation Depth collection (Ca) (Mg) (Na) (HCO3 ) (CO 3) (SO4) (Cl) (calculated)
p H
157-87-17bc Charles 6,668 -SW Arelia field 6,681 1957 17,700 3,340 94,900 600 . . . 427 186,000 302,900
6 .8
158-81-7aaGlenburn field Dakota 2,700 1962 11 Tr 1,847 1,122 48 351 1,900 4,710
8 .2
158-81-7b cGlenbum field Dakota 2,750 1960 . . . . . . . . . . . . . . . 928 56 266 1,534 4,315
8 .2
158-81-8cc Mission 4,519 -Glenburn field Canyon 4,529 1961 6,800 1,458 106,789 305 . . . 889 180,000 295,986
7. 3
163-83-15dcEden Valleypool Madison 4,180 1962 4,950 1,316 85,509 248 0 631 143,821 6 .4
163-84-15baEden Valleypool Dakota 2,800 1962 78 32 2,269 1,025 0 258 2,943 8 .0
11 Data from Randich, 1965, table 3 .
flow is at an average rate of about 14 gpm (gallons per minute) . Large rrates are obtainable when the water is injected under high pressure .
In Renville and Ward Counties the Dakota Group is overlain i nascending order by the Belle Fourche, Greenhorn, Carlile, and Niobrar aFormations of the Colorado Group ; the Pierre and Fox Hill sFormations of the Montana Group; and the Hell Creek Formation .Generally only the Fox Hills and Hell Creek are used for water supplie sin the study area. The other formations have limited water-yieldin gcapacities and a detailed description of them is not included in thi sreport .
Lemke (1960, p. 12) reported that the Fox Hills Formation waspenetrated at a depth of 915 feet in J . H. Kline well 1, and is about 235feet thick. It consists of sandstone and shale in about equalproportions. No wells in Renville and Ward Counties are definitelyknown to produce from the Fox Hills Formation, but many well sproduce water from this formation in southwestern North Dakota . Thewater is under artesian pressure, but generally the wells do not flow .The water from the Fox Hills Formation is slightly to very saline .Fluoride concentration may be high, but the water is generally soft an dcould be used for domestic and municipal supplies .
According to Lemke (1960, p . 11-12), the Hell Creek Formationin the Minot area is about 205 feet thick, and consists of fine- tomedium-grained sandstone, siltstone, and shale . The Hell Creek inNorth Dakota is not known to yield large quantities of water . However ,in some areas several water-bearing zones may be screened and a largeyield could be obtained by a single well . The water may be saline andcontains a high percentage of iron, sodium, and sulfate .
Tertiary Rocks
In Renville and Ward Counties, the rocks of Tertiary age belong t othe Paleocene Fort Union Group. The Fort Union is composed of fou rformations, which are, in ascending order : Ludlow, Cannonball, Tongu eRiver, and Sentinel Butte. The Ludlow Formation consists of beds o fsilty sand and clay and contains a few lignite beds. The CannonballFormation is a marine deposit that consists of dark-gray sand, clay, an da few layers of thin, nodular, fossiliferous limestone . The Tongue RiverFormation consists of continental deposits of clay, silt, sandstone, an dnumerous lignite beds . Lemke (1960, p . 11) reported that the For tUnion Group had a total thickness of 615 feet in J . H. Kline well 1 . The
20
Tongue River was penetrated at a depth of 95 feet and had a thicknessof 255 feet; and the Ludlow and Cannonball had a total thickness o f360 feet .
The Cannonball and Ludlow Formations were depositedcontemporaneously–the Cannonball as a marine deposit and theLudlow as adjacent continental strata. Owing to numerous fluctuation sof the sea margin, it is assumed that sediments of the two formation sinterfinger in the subsurface . However, it is difficult to differentiatethese formations accurately by means of drill-hole cuttings . Accordingto Lemke (1960, p. 29), the Ludlow underlies the Cannonball in J . H .Kline well 1 .
The Ludlow Formation is not exposed in Renville and WardCounties, although it probably underlies the entire area . Where expose din other parts of the State, it consists of interbedded layers of fine san dand lignitic shale .
The Cannonball Formation crops out along the walls of the SourisRiver valley in the vicinity of Sawyer, where it consists of sandy shale .Elsewhere it consists of alternating beds of sand and shale . It probablyinterfingers with the overlying Tongue River Formation as well as th eLudlow in this area.
The Tongue River crops out in many places along the Des Lac sRiver valley and the Souris River valley as well as in the valleys of manyof their tributaries. Lignite seams in the Tongue River are extensivelymined on the Missouri Escarpment south of Sawyer . The mined zonemay exceed 15 feet in thickness .
The Sentinel Butte Formation is very similar to the underlyin gTongue River, the major difference being a more somber color in theSentinel Butte. The coloring apparently is a weathering phenomena an dconsequently it cannot be distinguished in the subsurface .
In practice, it is generally difficult or impossible to distinguish th evarious formations in the Fort Union by the examination of water-wel lor test-hole data . In fact, the rocks from the base of the glacial drift t othe top of the Pierre Formation are so similar that even tentativ ecorrelations are difficult, particularly in northern Ward County and i nRenville County . Generally, however, the Cannonball Formatio ncontains water that is high in chloride. High-chloride water may also b epresent in the Fox Hills. In the absence of better information, thecombined thickness of the Fort Union Group, Hell Creek Formation ,and Fox Hills Formation is treated tentatively as a single aquifer syste min this report .
The lignite and fine-grained sandstone layers in the Fort Unio nGroup are a source of water for wells and springs . In many areas, thelignite beds are underlain by clay, which restricts the downwar dmovement of ground water . Consequently, ground water accumulate s
21
in the lignite beds and moves laterally to points of discharge. Manysprings in the Souris River valley flow from the contact of a bed o flignite with the underlying clay .
Although flowing wells are common in the Fort Union Group ,they usually do not yield large amounts of water . Locally, the wellsflow because of entrapped gas, originating in seams of lignite .
Aquifers in the Fort Union Group are recharged by underflo wfrom the southwest, by infiltration of precipitation on the outcrops ,and, in places, by infiltration of water from the overlying glacia ldeposits .
Water is discharged by springs and seeps where the Fort UnionFormation crops out, by evapotranspiration where the overlying drift i sthin or absent, by leakage to adjacent strata, and by pumping fromwells .
Generally the water levels in wells tapping aquifers in the Tertiar yrocks fluctuate only slightly, and most of the fluctuations are probablydue to changes in atmospheric pressure . In some places, the water leve lin wells may be more than 100 feet below land surface . Locally ,however, water in the aquifers is under sufficient artesian or gaspressure to flow at the surface . Most of the flowing wells are south andeast of Burlington, although in the 1920's there were many flowin gwells at the foot of the Missouri Escarpment . Most of the wells in th eMissouri Escarpment area have either been destroyed or ceased to flow .The reduction in water level is probably due to ground-waterwithdrawal.
The wells that formerly flowed in northeastern Renville Count ywere "gas-lift" wells (fig. 3). The gas pressure has been reduced to suc han extent throughout the last 50 years that most wells no longer flow .
The Fort Union Group yields water of three chemical types (fig .4) : (1) sodium bicarbonate, (2) sodium chloride, and (3) a mixture o fsodium bicarbonate and sodium chloride . Wells in most of RenvilleCounty and northeastern Ward County that tap the Cannonbal lFormation or the combined Cannonball and Ludlow Formations yiel dwater that is generally a sodium chloride, sodium bicarbonate chloride ,or sodium chloride bicarbonate type . Bedrock wells between the SourisRiver and the Des Lacs River produce from Tongue River o rCannonball-Ludlow aquifers, and bedrock wells in the Coteau d uMissouri area produce water from aquifers in the Tongue River orSentinel Butte Formations. Water from the latter two formation sgenerally is a sodium bicarbonate type .
The average concentrations of the principal ions, expressed as apercentage of the average dissolved solids, further illustrate thedifferences in the chemical character of water in the Cannonball ,
22
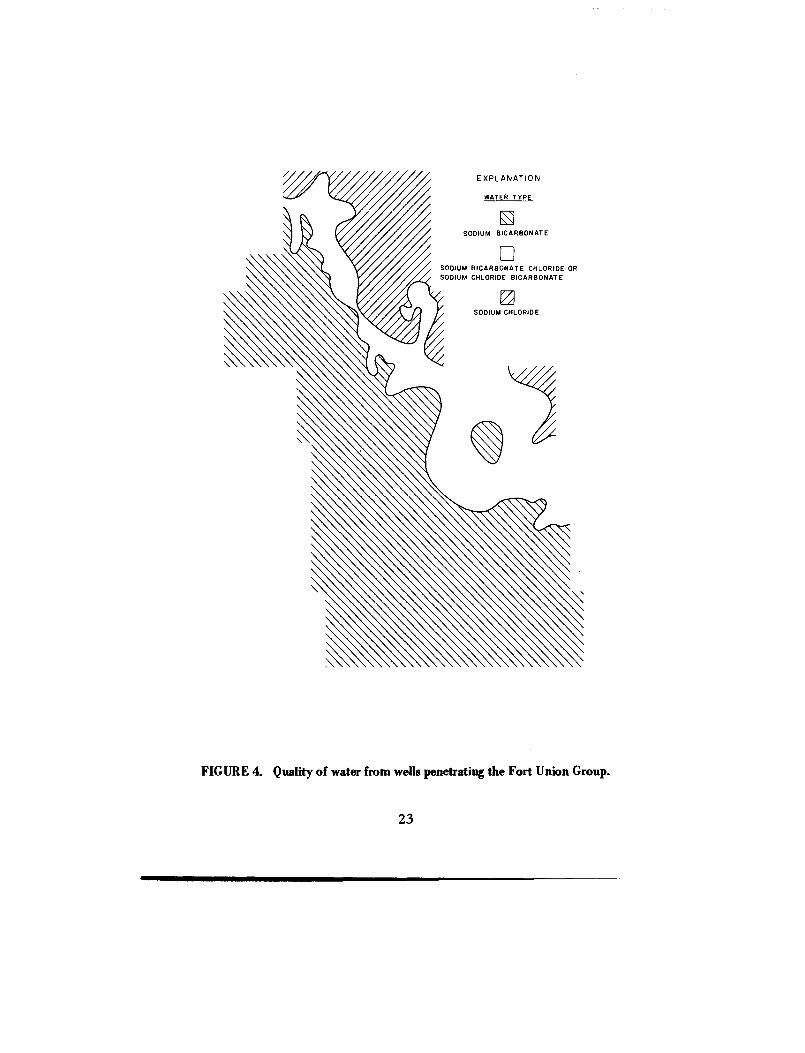
SODIUM BICARBONATE CHLORIDE ORSODIUM CHLORIDE BICARBONAT E
FIGURE 4. Quality of water from wells penetrating the Fort Union Group.
23
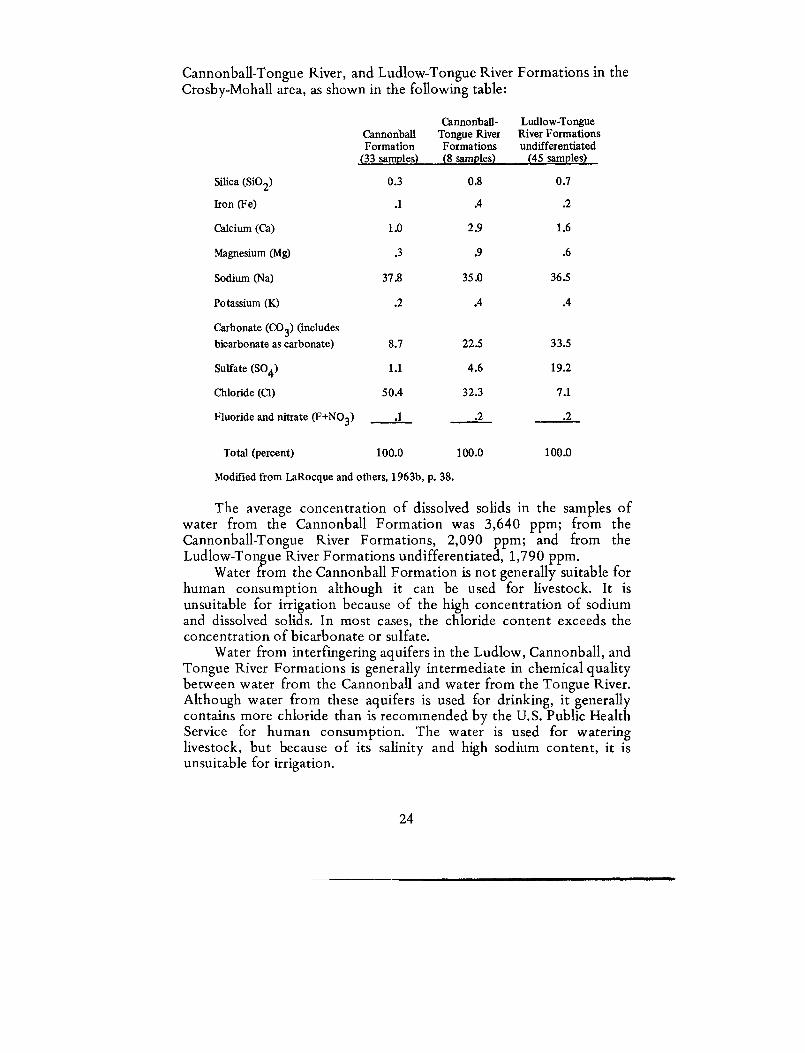
Cannonball-Tongue River, and Ludlow-Tongue River Formations in theCrosby-Mohall area, as shown in the following table :
CannonballFormatio n
(33 samples)
Cannonball -Tongue RiverFormations(8 samples)
Ludlow TongueRiver Formationsundifferentiate d
(45 samples)
Silica (SiO 2 ) 0 .3 0 .8 0 . 7
Iron (Fe) .1 .4 .2
Calcium (Ca) 1 .0 2 .9 1 . 6
Magnesium (Mg) .3 .9 .6
Sodium (Na) 37 .8 35 .0 36 .5
Potassium (K) .2 .4 . 4
Carbonate (CO 3) (include s
bicarbonate as carbonate) 8 .7 22 .5 33 .5
Sulfate (SO4 ) 1 .1 4 .6 19 .2
Chloride (Cl) 50.4 32 .3 7 . 1
Fluoride and nitrate (F+NO 3 ) .1 .2 .2
Total (percent) 100.0 100 .0 100 .0
Modified from LaRocque and others, 1963b, p. 38 .
The average concentration of dissolved solids in the samples o fwater from the Cannonball Formation was 3,640 ppm; from theCannonball Tongue River Formations, 2,090 ppm ; and from theLudlow-Tongue River Formations undifferentiated, 1,790 ppm.
Water from the Cannonball Formation is not generally suitable fo rhuman consumption although it can be used for livestock . It isunsuitable for irrigation because of the high concentration of sodiu mand dissolved solids. In most cases, the chloride content exceeds theconcentration of bicarbonate or sulfate.
Water from interfingering aquifers in the Ludlow, Cannonball, an dTongue River Formations is generally intermediate in chemical qualit ybetween water from the Cannonball and water from the Tongue River .Although water from these aquifers is used for drinking, it generallycontains more chloride than is recommended by the U .S. Public HealthService for human consumption . The water is used for wateringlivestock, but because of its salinity and high sodium content, it i sunsuitable for irrigation .
24
Water from the Tongue River and Sentinel Butte Formation sgenerally is usable for domestic purposes, although it becomes mor emineralized with depth . The water is used for livestock, but is no tconsidered suitable for irrigation because of its generally high dissolve dsolids and high sodium content . In most cases this water contains large rpercentages of sulfate or bicarbonate than chloride .
GROUND WATER IN THE QUATERNARY DEPOSIT S
During the Pleistocene ice age, glaciers moved southward over th earea at least three times, and covered the bedrock surface with driftthat now generally ranges from 0 to 600 feet in thickness .
The glacial deposits consist chiefly of ground moraine, dead-ic emoraine, end moraine, outwash, ice-contact deposits, and glacial lak edeposits .
Ground moraine has a gently rolling topography with only sligh tlocal relief. The prairie potholes on the ground moraine are generall yonly a few feet deep. Ground moraine is the most widespread deposit i nthe report area and consists of till, which is a heterogeneous mixture o fclay, silt, sand, and larger fragments. This material is mainly unsortedand unstratified and has a very low permeability. Scattered throughoutthe ground moraine are buried deposits of sand and gravel, which, i nsome places, become thicker and are important sources of water.
The hummocky areas on the Coteau du Missouri are underlain bydead-ice moraine, which also is largely composed of till . Prairie potholesare abundant in the dead-ice moraine and are generally several fee tdeeper than those on the ground moraine. Locally, there are manysmall buried deposits of sand and gravel in the dead-ice moraine tha thave no surface expression. No large buried sand and gravel deposit swere found, however, in the Coteau du Missouri during thi sinvestigation .
End moraines on the Coteau du Missouri consist of linear ridges o ftill or hummocky till hills that average about a mile in width . The topsof the moraines are 40 to 60 feet above surrounding areas . Importan taquifers in these deposits are scarce. However, the end moraines in th enorthwestern part of Minot and north of the Des Lacs River betwee nDonnybrook and Carpio are low hills and ridges that consist o fice-contact deposits of sand and gravel that will provide small wate rsupplies.
Water from melting glaciers carved a complex network o fchannels, some more than 40 miles long, into the ground moraine an d
25
partly filled the channels with sand and gravel . Outwash sand and grave ldeposits locally cover large areas in the valleys of the Souris and De sLacs Rivers and are overlain by thin deposits of alluvium . Most of theoutwash on the Coteau is collapsed ; that is, the deposits were originall ysupported by glacial ice and became distorted when the support wasremoved by the melting of the ice . In a few places these deposits cove rlarge areas . Most of the outwash deposits are highly permeable, andwhere sufficiently thick, they store large quantities of ground water .
Ice-contact deposits, in the form of kames and eskers, mainl yconsist of sand and gravel . Kames are mounds or hills as much as 40feet high . Eskers are narrow sinuous ridges. The ice-contact deposits ar ehighly permeable, but generally water readily drains from them due t osmall areal extent and steep slopes .
Glacial lake deposits are common on the Coteau du Missouri . Theyconsist chiefly of silt and clay, but may include sand and some gravel ,particularly along their margins . Many of the lakes were formed instagnant glacial ice . The permeability of most lake deposits is very lowand only small ground-water supplies are available to wells .
With the exception of deposits in present and ancient streamvalleys, there are no widespread buried deposits of water-bearing sandand gravel in Renville and Ward Counties . Although Akin (1947, p. 17 )suggested that extensive deposits of sand and gravel were present in th eSouris River valley, test drilling indicated that these deposits are limite dto the area between Minot and Sawyer .
Most wells that tap aquifers in the glacial deposits have bee ndrilled or dug through the glacial till into sand and gravel deposits . Thetill generally yields little or no water to wells .
Water from glacial deposits is variable in chemical quality, but i sgenerally very hard . The dissolved solids generally exceed 750 ppm, butas indicated by the specific conductance, may locally be as low as 13 0ppm (Pettyjohn, 1968a) . Water from surficial sand and gravel i sgenerally less mineralized than water from buried sand and gravel an dwater from glacial till . The sulfate concentration is locally so high thatthe water is unsuitable for many uses .
Coteau du Missouri Area
Several surficial-outwash and buried-valley-fill aquifers in th eCoteau du Missouri store large quantities of ground water . Thesurficial-outwash deposits range from small irregular gravel hills t oextensive outwash plains that cover several tens of square miles . The
26
surficial-outwash aquifers are readily recharged by infiltration ofprecipitation and local runoff, but much of the water drains rapidlythrough springs and seeps . Water from the surficial aquifers is generallyof fair to good chemical quality .
The areal extent and thickness of water-bearing sand and gravel i nthe buried valleys in the Coteau is inferred chiefly from widely space dtest holes and wells . The amount of water stored in the buried-valleyaquifers is evidently large, but data are insufficient for accuratedetermination. Water from buried-valley aquifers is generally moremineralized than that from surficial outwash and it may be saline insome places .
None of the sand and gravel aquifers in the Coteau are usedextensively. There are only a few domestic and stock wells in mostaquifers, and some aquifers are unused . Consequently, almost all th edischarge from these aquifers is by natural processes .
Six major sand and gravel aquifers in the Coteau are shown o n
For1 (in pocket), and at least some ground-water data are availabl e
for each. These aquifers are the Douglas, Hiddenwood Lake, Ryder ,Ryder Ridge, Tolgen, and Vang aquifers. Several other surficial orburied sand and gravel deposits were penetrated by test drilling, but a tpresent there are insufficient data available to accurately describe them.These are referred to herein as unnamed aquifers in the Coteau duMissouri.
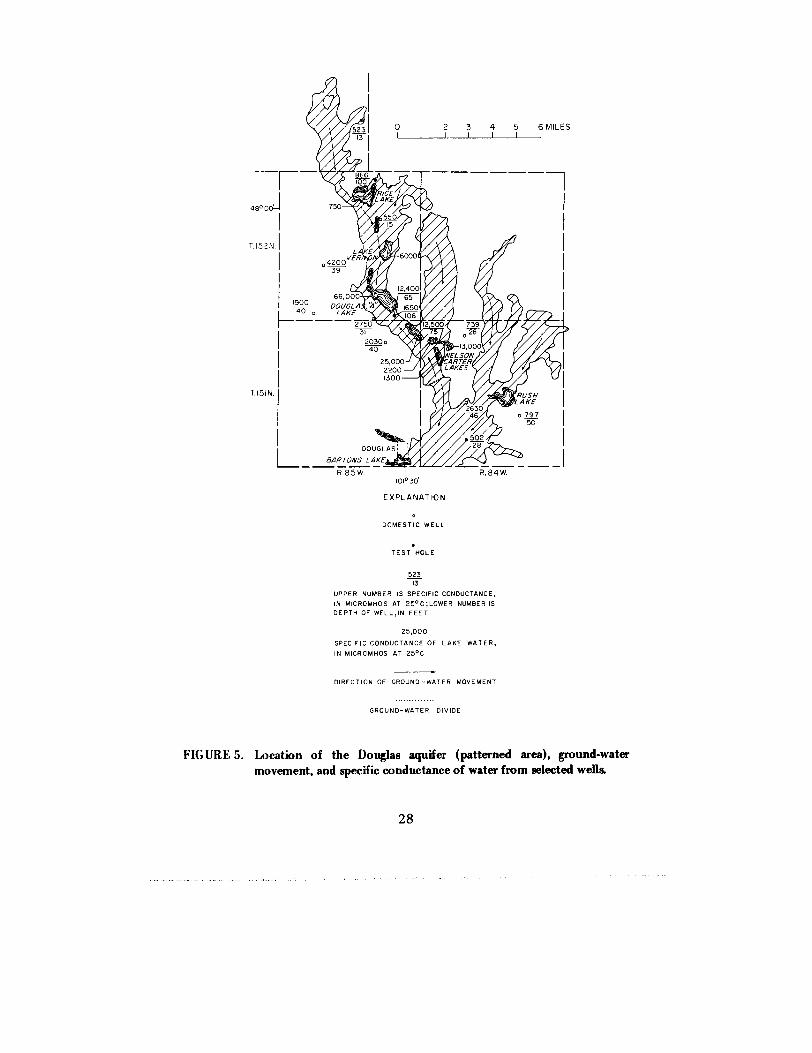
Douglas AquiferThe Douglas aquifer is in south-central Ward County, and extend s
southward from the eastern part of T. 153 N., R . 85 W., through T . 15 2N., R. 85 W., T. 152 N., R. 84 W., T. 151 N., R . 85 W., and T. 151 N.,R. 84 W., and thence into McLean County . The aquifer is about 1 8miles long (fig . 5), and varies from a few feet to more than 3 miles inwidth . It consists of collapsed and buried outwash that partly fills abranching network of valleys.
The outwash material ranges in size from fine sand to coarse grave land boulders, and can be as much as 70 feet in thickness . Gravel andcoarser material are limited to the east flank and north end of theaquifer, whereas fine and medium sand are predominant in the westernpart.
Water in the aquifer is unconfined throughout most of the area ,but is under artesian pressure at the north end of Rice Lake an dperhaps in a few other places .
Ground-water movement in the Douglas aquifer is generally in th edirection of the arrows on figure 5, but there also is local movementinto numerous lakes and undrained depressions in the central part ofthe aquifer.
27
101°30'
EXPLANATIO N
DOMESTIC WEL L
TEST HOL E
52 313
UPPER NUMBER IS SPECIFIC CONDUCTANCE ,IN MICROMHOS AT 25°C ;LOWER NUMBER I SDEPTH OF WELL,IN FEE T
25,00 0
SPECIFIC CONDUCTANCE OF LAKE WATER ,
IN MICRCMHOS AT 25° C
DIRECTION OF GROUND-WATER MOVEMEN T
. . . . . . . . . . . . . .GROUND-WATER DIVID E
FIGURE 5 . Location of the Douglas aquifer (patterned area), ground-water
movement, and specific conductance of water from selected wells .
28
2
3
I
I
I
I
I
I
I
I
I
I
1
I
I
151-84-6ddc
ryOREGORD ___-
NO RECOR Di
I51-84-29ddtl
\~
J
NO REG~aD ~
152-85-35ddcl
_
NORE~O18O
152-85-35ddo2
—
=
n rD `J
I
J J
A
I
S
0
N
I
D
J
I
F
I M
A
I M
I
J
I
J
I
A1965
1966
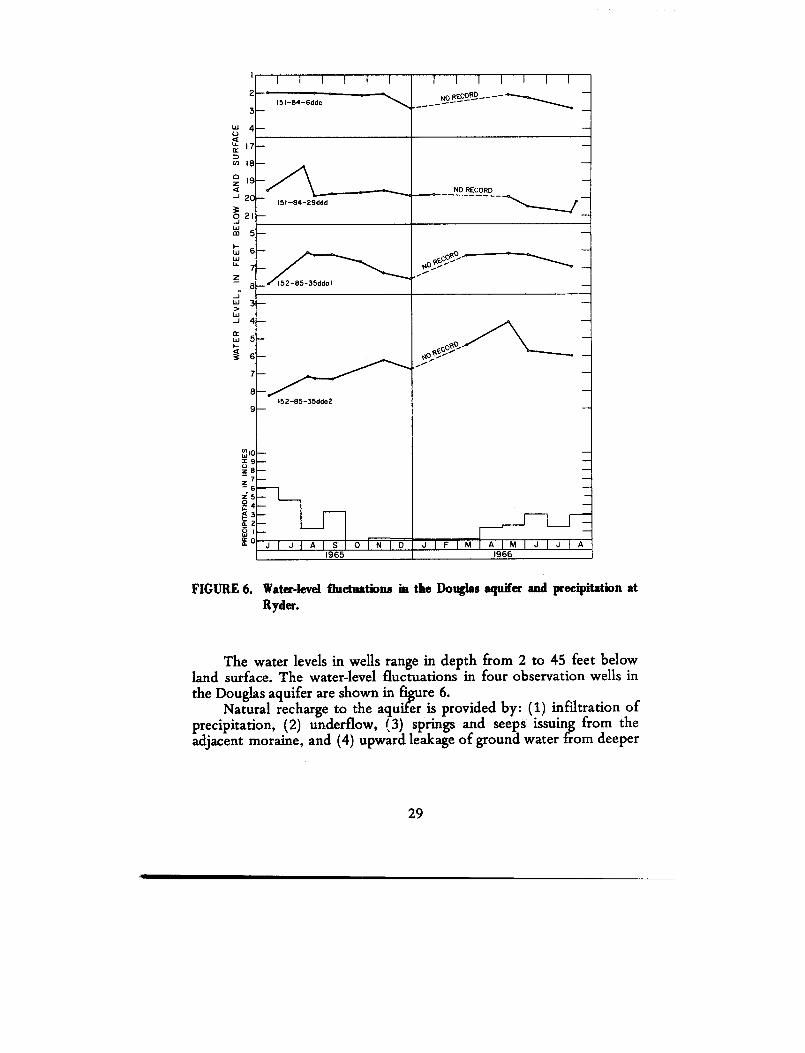
FIGURE 6. Water-level fluctuations in the Douglas aquifer and precipitation atRyder.
The water levels in wells range in depth from 2 to 45 feet belowland surface. The water-level fluctuations in four observation wells inthe Douglas aquifer are shown in
a 6 .Natural recharge to the aqufis provided by : (1) infiltration o f
precipitation, (2) underflow, (3) springs and seeps issuing from theadjacent moraine, and (4) upward leakage of ground water from deepe r
29
4
1 7
1 8
1 9
2
2 1
WI Ox 9z 8z 7
z 5F
aw
sources. Infiltration of precipitation probably accounts for the larges tquantity of natural recharge .
The chemical quality of the water in the Douglas aquifer differswithin wide limits, with the dissolved-solids content generally increasin gtoward areas of discharge . Because the lakes receive ground-waterdischarge from the Douglas aquifer, they can be used to trace thechanges in chemical quality of ground water in the aquifer . The wate rin Rice Lake, for example, had an average specific conductance of 75 0micromhos . Southward and in the direction of ground-watermovement, Douglas "A" Lake had a specific conductance of 66,000micromhos in June 1965. The salinity of surface water and groun dwater also increases from the ground-water divide north of Dougla stoward Douglas "A" Lake . Apparently this lake represents a majordischarge area for the aquifer.
Ground water is generally of good chemical quality near the flanksof the outwash, or in areas where there is a considerable amount o funrestricted flow. The specific conductance of this water ranged from502 micromhos in test hole 151-84-29ddd to 866 micromhos in tes thole 152-85-2bcb . Water from test holes in the central part of theaquifer generally is highly mineralized. The specific conductance ofground water in this area ranged from 1,650 to 12,500 micromhos (fig .5) . The mineral constituents were predominantly sodium, sulfate, an dbicarbonate .
Water in the Douglas aquifer with a specific conductance of lessthan 900 micromhos falls in the C2-S1 and C3-S1 irrigatio nclassifications . The water has a medium to high salinity hazard and alow sodium hazard. This water probably is suitable for irrigatio nbecause of the high permeability of the sandy and gravelly soils in th earea. Water in the vicinity of Douglas "A" and Nelson Carter Lakes,however, is unsuitable for all types of irrigation regardless of the soi ltexture .
The water from test hole 151-84-29ddd met the U .S. PublicHealth Service (1962) standards for drinking water, except for the iro nconcentration which was 0 .96 ppm (Pettyjohn, 1968a) . Water fromwells 152-85-35dda1 and 35dda2 exceeded the recommended limits fo riron, sulfate, and dissolved solids . Water from the shallower well (ddal )was more mineralized (11,000 ppm) .
Water from parts of the Douglas aquifer can be used for domestic ,livestock, irrigation, and industrial purposes . However, it provides waterto only a few domestic and stock wells . Consequently, the quantity o fwater available for use is much greater than is now being withdrawn . Insome places the aquifer is very permeable and could produce as much a s250 gpm.
30
Well yields will be restricted in areas where the water-bearingmaterials are thin or where lenses of less permeable material such as siltor clay are present . In places less than 10 feet of sand and gravel i ssaturated . If the aquifer is developed for irrigation, the quality of thewater should be monitored because pumping could induce highl ymineralized water . Water-level measurements and a soundwater-management program are essential to avoid overdevelopment o fthe aquifer.
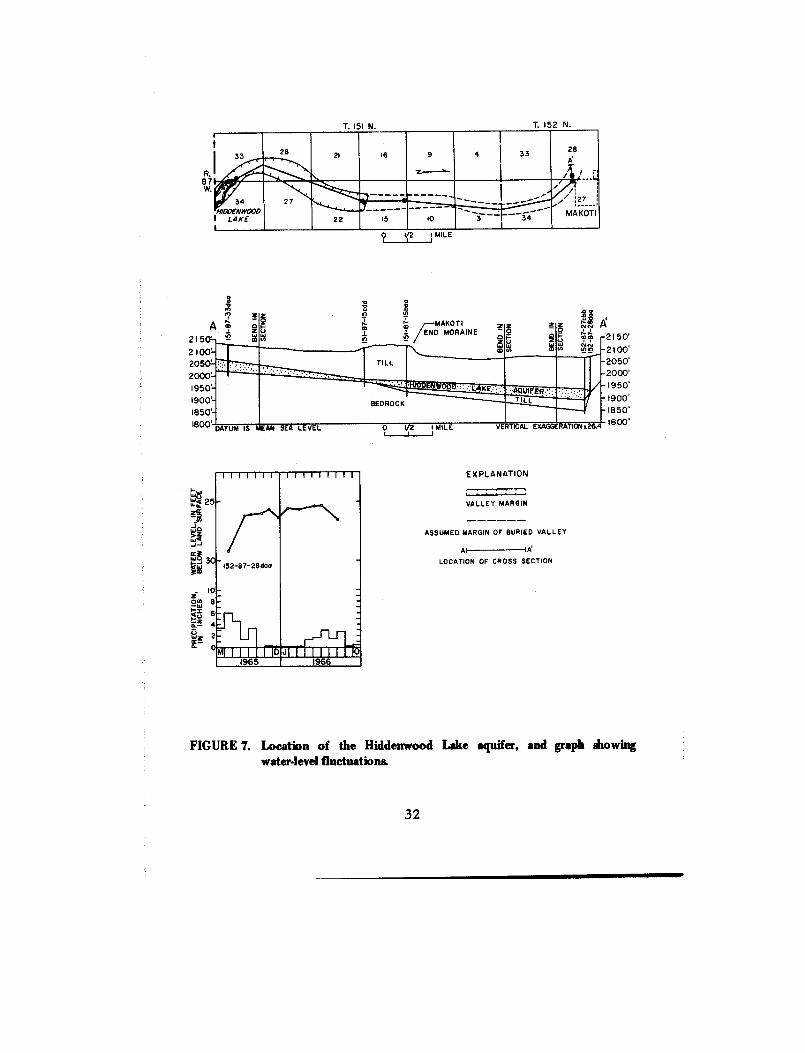
Hiddenwood Lake AquiferThe Hiddenwood Lake aquifer is a valley-fill deposit in
southwestern Ward County (pl . 1) . The valley was cut into the bedrockat least 130 feet below the upland surface and extends from McLeanCounty northward through Hiddenwood Lake to Makoti (fig . 7) . Inplaces, beds of the Fort Union Group crop out in the valley walls .
The aquifer material consists of fine to coarse sand and fine t omedium gravel . It ranges between 9 to 45 feet in thickness, including afew thin layers of clay. It is overlain by at least 66 feet of glacial drift ,predominantly lake deposits, in its southern end (Pettyjohn, 1968a, p .76) and generally by more than 100 feet of till in its northern end . Theaquifer slopes to the north, and has been traced for about 8 miles i nWard County .
The water level in observation well 152-87-28daa averaged abou t26 feet below land surface in 1965 and 1966 A. 7) . This is 116 fee tabove the top of the aquifer, indicating artesian conditions .
Natural recharge to the aquifer is by direct infiltration o fprecipitation . The greatest quantity of recharge probably is provided innorthern McLean County and in the southern 3 miles of its extent i nWard County .
Chemical analyses of water from test hole 152-87-28daa indicate dthat the Hiddenwood Lake aquifer contains water of a hard sodiumsulfate type with objectionable quantities of iron (0 .4 ppm), sulfate(2,650 ppm), and dissolved solids (4,800 ppm) . Each of these exceedsthe limits recommended by the U.S. Public Health Service (1962) fordrinking water. The salinity hazard is too high for the water to be usedfor irrigation .
Even though the Hiddenwood Lake aquifer contains verypermeable materials, it is largely unused. Its poor quality waterprecludes development except under unusual circumstances .
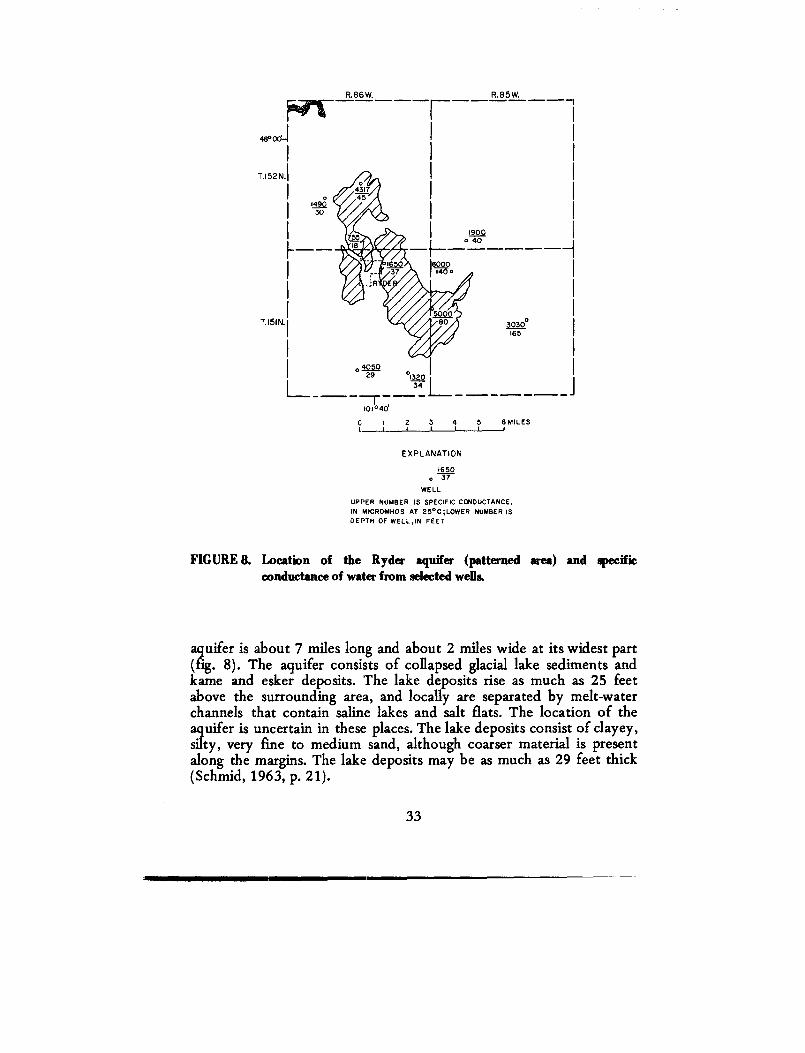
Ryder AquiferThe Ryder aquifer extends southeastward from the central part o f
T. 152 N., R. 86 W., through the northeastern part of T . 151 N ., R. 86W., and thence into the west-central part of T . 151 N., R. 85 W. The
31
Ft8 7W.
TI
N
T. 152 N.
133 2B 21 16 9 4
I33 2 8
A'r
27 ;27_-__--
N/ODENWAOD`
-- -MAKOT I
5 10I
LAKE 22 3
34
0
12
1MILE
- 2150 '
- 2100 '
- 2050'-2000 '
1950'
- 1900 '
- 1850 '
1800 '
EXPLANATIO N
VALLEY MARGI N
ASSUMED MARGIN OF BURIED VALLE Y
AI IA'
LOCATION OF CROSS SECTIO N
FIGURE 7. Location of the Hiddenwood Lake aquifer, and graph showin gwater-level fluctuation&
32
R.86W.
R.85W.
30300
165
T.152 N.I
101°40'
C
I
2
3
4
5
6MILE SI. 1 I
EXPLANATIO N
165 0° 37
WELL
UPPER NUMBER IS SPECIFIC CONDUCTANCE ,IN MICROMHOS AT 25°C ;LOWER NUMBER I SDEPTH OF WELL,IN FEE T
FIGURE 8. Location of the Ryder aquifer (patterned area) and specificconductance of water from selected wells .
uifer is about 7 miles long and about 2 miles wide at its widest par trag. 8) . The aquifer consists of collapsed glacial lake sediments andkame and esker deposits . The lake deposits rise as much as 25 fee tabove the surrounding area, and locally are separated by melt-wate rchannels that contain saline lakes and salt flats . The location of theaquifer is uncertain in these places . The lake deposits consist of clayey ,silty, very fine to medium sand, although coarser material is presen talong the margins . The lake deposits may be as much as 29 feet thick(Schmid, 1963, p . 21) .
33
Recharge to the Ryder aquifer probably is small and is derive dentirely from infiltration of precipitation and local runoff fro madjacent areas . Ground water moves from areas of recharge to areas o fdischarge along the steep margins of saline lakes and salt flats. Water inwells tapping the aquifer is generally 8 to 25 feet below land surface .
The aquifer is used by the village of Ryder and as a source o fdomestic and stock water . The village is reported to pump water at a naverage rate of about 50,000 gpd (gallons per day) .
Quality of the water is marginal for most purposes . The specificconductance ranged from 755 to 5,000 micromhos, but may excee d5,000 micromhos in areas adjacent to the lake deposits. The water is ahard calcium bicarbonate type, except near the lake deposits where i tprobably is a sodium sulfate type . It is high in dissolved solids, iron, an dsulfate .
The small saturated thickness of the aquifer, the dependence o ndirect precipitation and local runoff for natural recharge, th eabundance of clay and silt in the water-bearing material, and th emarginal quality of the water for most uses preclude extensiv edevelopment of the Ryder aquifer . It appears that yields of as much as250 gpm should be possible, however, in parts of the aquifer (pl . 1) .
Ryder Ridge AquiferThe Ryder Ridge aquifer extends from just west of Ryder ,
northwestward across the southern part of T . 152 N., R. 87 W., thenceinto Mountrail County, a distance of about 9 miles (pl. 1). West ofMakoti the aquifer apparently overlies the Hiddenwood Lake aquifer .Although the ridge averages about 700 feet in width, it is difficult totrace except at its eastern extreme where it rises about 40 feet abov ethe surrounding land surface .
The Ryder ridge has a core of water-bearing sand and gravel thatreaches a total thickness of 55 feet in test hole 151-86-5cbb . Theaquifer material ranges in size from fine sand to fine gravel . The top ofthe aquifer ranges in depth from 46 to 104 feet below land surface, andhad a water level between 20 and 28 feet below land surface in 1966 intest hole 151-86-5cbb .
Water from test hole 151-86-5cbb was a moderately hard sodiu msulfate type. The irrigation classification (C3-S2) indicates the water ha sa high salinity and medium sodium hazard . The concentrations offluoride (3 .3 ppm), iron (0.8 ppm), sulfate (672 ppm) and dissolvedsolids (1,250 ppm) exceeded the U.S. Public Health Service (1962 )limits recommended for drinking water. The water is, however, betterthan most water from buried aquifers in the glacial drift in theRyder-Makoti area.
34
No wells are known to produce water from the Ryder Ridgeaquifer. Although it contains permeable water-bearing material, thenarrowness of the deposit and the poor quality of the water severelylimit its use. The fluoride concentration is more than twice theoptimum value recommended by the U.S. Public Health Service (1962 ,p. 8) for the area. The sulfate may have a laxative effect on peopl eunaccustomed to the water and the iron will cause staining of clothe sand fixtures. The water may be suitable for livestock, however .
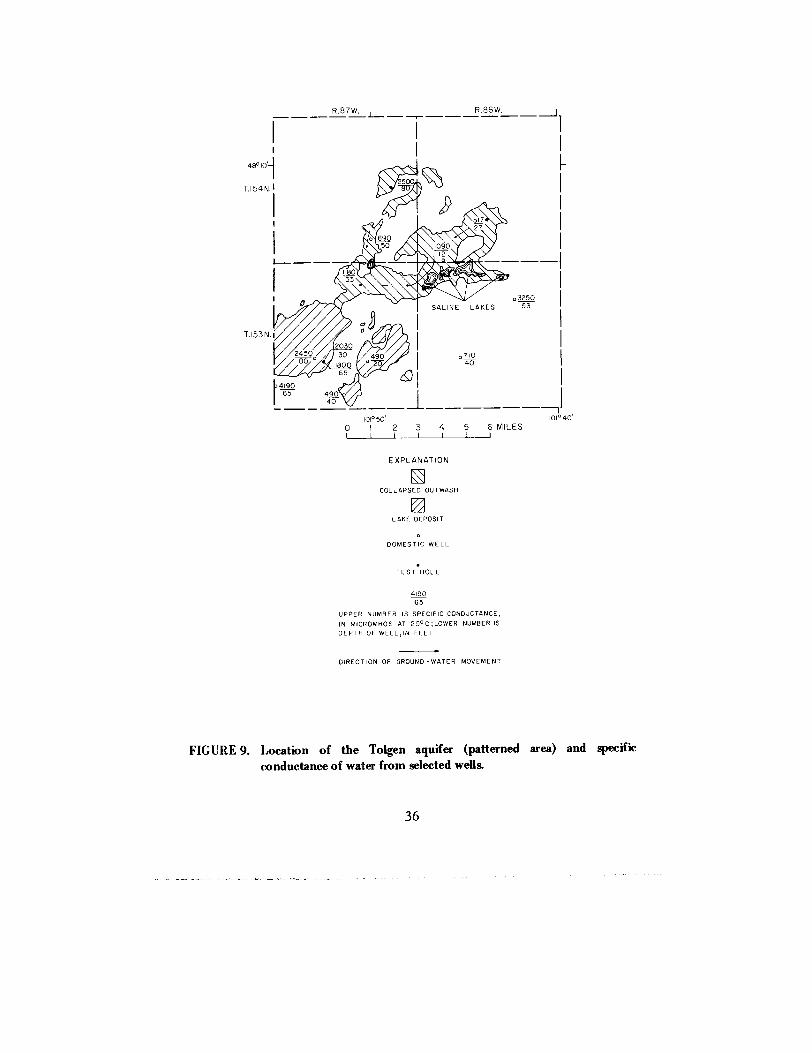
Tolgen AquiferThe Tolgen aquifer is in southwestern Ward County and extend s
from T. 154 N., R. 86 W., and T. 154 N., R. 87 W. southwestwardabout 11 miles through T . 153 N., R. 86 W., and T. 153 N., R. 87 W .(fig. 9) .
The aquifer, a complex arrangement of collapsed-outwash andglacial lake deposits, includes one large unit and 12 smaller isolate dparts . The large unit has a maximum width of slightly more than 2miles, but the smaller isolated segments are generally less than a milewide. Although all parts are not in close hydraulic connection, the ywere formed in the same manner and time and are more convenientl ydescribed as one aquifer .
The aquifer material forming the collapsed-outwash deposit range sin size from fine sand to coarse gravel and from 0 to at least 27 feet i nthickness. Coarse material is more common along the northeastern part sof this deposit, whereas finer material occurs in the more southwesternparts. The lake deposits, in most places, consist of about 5 feet of silt ,underlain by lenticular deposits of till, sand, and gravel . The depositsprobably do not exceed 50 feet in thickness .
Ground water in the collapsed outwash is unconfined, whereaswater in sand and gravel buried within the lake deposits is confined .
Recharge to the Tolgen aquifer is mainly by infiltration o fprecipitation. Additional recharge is by runoff from adjacent areas .Most of the ground-water flows towards the southwest, but locallyflows in other directions . Much of the water in the northeastern part o fthe aquifer discharges at springs and seeps, and by underflow into achain of saline lakes in T . 153 N., R. 86 W. Springs and seeps are alsocommon along the margin of the outwash deposits. The water level i nwells in the largest unit ranges from 2 to about 10 feet below lan dsurface .
Two observation wells, one 30 feet and the other 65 feet in depth ,were constructed in the lake deposits at test hole 153-87-28bbb . The30-foot well produced water that is somewhat more mineralized tha nthe 65-foot well. In addition, the shallower well has the highest wate rlevel. This water-level difference indicates downward movement o f
35
EXPLANATIO N
COLLAPSED OUTWAS H
LAKE DEPOSI T
DOMESTIC WEL L
TEST HOL E
419 06 5
UPPER NUMBER IS SPECIFIC CONDUCTANCE ,
IN MICROMHOS AT 25°C ;LOWER NUMBER ISDEPTH OF WELL, IN FEE T
DIRECTION OF GROUND-WATER MOVEMEN T
FIGURE 9. Location of the Tolgen aquifer (patterned area) and specifi cconductance of waiter from selected wells .
___ R_87W .
R .86W_
419 065
36
ground water, or recharge, which is to be expected on topographi chighs. The difference in chemical composition indicates that eitherwater entering the upper part of the aquifer at this location is mor ehighly mineralized than most water entering the aquifer or, mor eprobably, that at least two flow systems are present .
Owing to the abrupt changes in the aquifer thickness and to theunknown extent of buried, isolated sand and gravel deposits in th eperched lake deposits, it is not possible to determine the quantity o fwater in storage .
Water from the Tolgen aquifer is suitable for most purposes . Thespecific conductance ranged from 490 to 2,500 micromhos. The wateris hard and generally a calcium bicarbonate type in the outwas hsediments and a calcium sulfate type in the lake sediments. Water fromwells less than 40 feet deep along the higher parts of the aquifer o rfrom small isolated parts, generally has a specific conductance less than700 micromhos. Wells that range in depth from 40 to 80 feet generallycontain water that is more highly mineralized and the conductanc eexceeds 1,000 micromhos . The dissolved solids increase toward salinelakes, sloughs, and other low areas .
The Tolgen aquifer is tapped by only a few domestic and stockwells. In several small areas, particularly in the northeastern parts of th eoutwash deposits, properly constructed wells would probably produceas much as 200 gpm for short periods of time, particularly in years o fgreater than normal precipitation. However, the dependence onprecipitation and local runoff for natural recharge and the abruptchanges in saturated thickness of the collapsed sand and gravel limit thepotential of the Tolgen aquifer. The lenticular water-bearing sand andgravel deposits buried within the lake sediments are generally presen tonly in small areas .
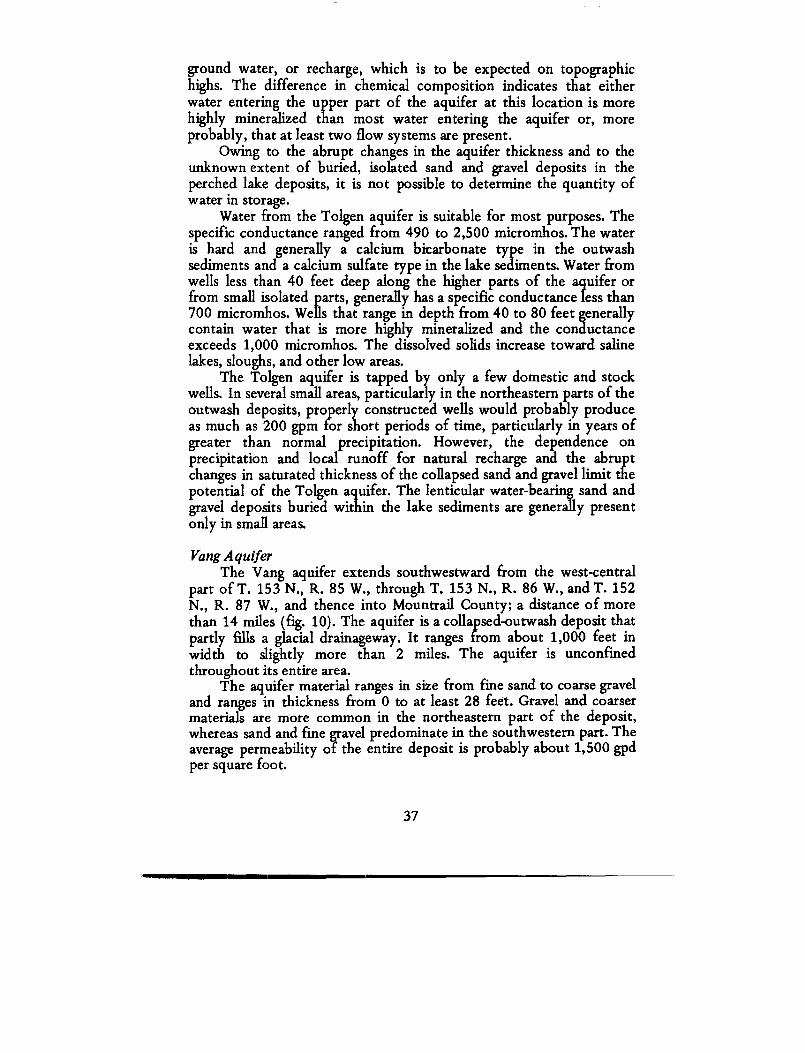
Vang AquiferThe Vang aquifer extends southwestward from the west-central
part of T. 153 N., R. 85 W., through T. 153 N., R. 86 W., and T. 152N., R. 87 W., and thence into Mountrail County ; a distance of morethan 14 miles (fig . 10) . The aquifer is a collapsed-outwash deposit thatpartly fills a glacial drainageway . It ranges from about 1,000 feet inwidth to slightly more than 2 miles . The aquifer is unconfine dthroughout its entire area .
The aquifer material ranges in size from fine sand to coarse grave land ranges in thickness from 0 to at least 28 feet . Gravel and coarsermaterials are more common in the northeastern part of the deposit ,whereas sand and fine gravel predominate in the southwestern part . Theaverage permeability of the entire deposit is probably about 1,500 gpdper square foot .
37
101°40 '
R.86W .
R .85W.—
e
o 261 0
I
i3~ s,n ~
I
T.152N . I710 025
oIMANOT I
---r87 W. ---
-
0
I
2
3
4
5
6MILE SI I I I 1 I I
EXPLANATIO N
DOMESTIC WEL L
TEST HOL E
B9 21 7
UPPER NUMBER IS SPECIFIC CONDUCTANCE ,IN MICROMHCS AT 25°C ;LOWER NUMBER I SDEPTH OF WELL,IN FEE T
---2020---
WATER-TABLE CONTOUR
SHOWS ELEVATION OF WATER TABLE IN 1966 .
CONTOUR INTERVAL 10 FEET . DATUM IS MEA N
SEA LEVE L
FIGURE 10 . Location of the Yang aquifer (patterned area), specific conductanc e
of water, and elevation of the water table.
71 0
T.153 N .I
2290
38
The water table in the Vang aquifer slopes towards the southwestat nearly 8 feet per mile (fig . 10), and generally ranges from 5 to 20feet below land surface .
Natural recharge to the Vang aquifer is derived mainly from direc tinfiltration of precipitation .
Assuming, in the area of test hole 152-87-16aaa, a width of 1,70 0feet, an average permeability of 1,500 gpd per square foot, and anaverage saturated thickness of 8 feet, approximately 31,000 gallons o fwater per day flows through the aquifer .
The chemical quality of the water in the aquifer, in most places, i ssuitable for a variety of purposes . The water is a hard calciumbicarbonate type. The specific conductance of water from well152-87-16aaa was 892 micromhos in 1966 and 808 micromhos fro mwell 152-87-11bdb in 1963.
Two chemical components that locally may appear in larg econcentrations are iron and nitrate . The iron content in water from tes thole 152-87-16aaa was 2 .7 ppm. Iron concentrations of this magnitud ewill cause staining of clothing and plumbing fixtures . Water from wel l152-874 lbdb had an iron content of 0 .2 ppm, however, which is belowthe limit recommended for drinking water by the U .S. Public Healt hService (1962) .
Analyses of water from the Vang aquifer indicate that the nitrat econcentration ranges in value from 12 ppm to more than 85 ppm. It isreported that the nitrate concentration increases considerably followin gperiods of precipitation. This indicates leaching and downwar dmovement of nitrogeneous material into the aquifer . Much of thematerial probably is derived through the leaching of decaying organicmaterial in the small sloughs and potholes that are present throughou tthe outwash-deposit area. Wells along the flanks of the aquifer probabl yhave less opportunity for nitrate contamination from potholes tha nthose drilled in the low areas .
Water from the Vang aquifer is in the C2-S1 and C3-S1 irrigatio nclassifications. The water has a medium to high salinity hazard, a lo wsodium hazard, and is suitable for irrigation on well-drained soils.
The Vang aquifer provides water to only a few domestic and stoc kwells. The quantity of water available is much greater than is now bein gwithdrawn by wells . The water-bearing materials, in places, are verypermeable, indicating a good potential for obtaining small to moderat eyields from properly constructed wells, especially when the water tabl eis high. In several small areas, wells probably could produce at least 15 0gpm for short periods of time .
If the area is developed for any use that requires a largewithdrawal, periodic water-level measurements are essential to insurethat overdevelopment does not take place . If the aquifer is used as a
39
public supply, the nitrate content should be regularly monitored andkept at a low concentration because of the possible toxic effects o ninfants.
Unnamed AquifersSeveral aquifers in the Coteau du Missouri area of Renville and
Ward Counties are described only in general terms owing to a lack o fgeologic and hydrologic information . In a few places, small deposits ofsurface sand and gravel have been mapped (pl . 1) . In other places ,partly collapsed valleys can be located by a study of aerial photographs .Probably all the buried aquifers in the Coteau du Missouri area have no tbeen discovered.
Surficial sand and gravel deposits–Several relatively small and thi ndeposits of sand and gravel were mapped that will provide sufficien twater of good quality for domestic and stock purposes . The aquifers ar ein ice-contact deposits, collapsed outwash, and lake deposits .
Records of wells indicate that the water level is usually 5 to 1 0feet below land surface . Several of the deposits that lie on till in th etopographically highest areas are so thin that they contain only ver ysmall quantities of water and drain rapidly .
Available data indicate that these deposits contain water that i sonly slightly mineralized . Generally the specific conductance rangedbetween 450 and 650 micromhos . Water in surficial sand and graveldeposits near Ryder, however, is generally more mineralized and maycontain large amounts of sulfate .
Unnamed aquifer at Carpenter Lake--A small aquifer trendssouthwestward across the Coteau near Carpenter Lake for a distance o fabout 4 miles . Test hole 155-87-17bab penetrated three deposits o fsand and gravel (20-40, 75-112, and 148-182 feet) in this aquifer at thenortheast end of Carpenter Lake. Observation wells were constructed inthe upper two deposits at depths of 38 and 100 feet . The water level inthe deep well is about 12 feet below land surface, whereas in theshallow well it is about 19 feet . The higher water level in the deeperwell indicates that this is an area of upward ground-water movement .
Records indicate that elsewhere in the Carpenter Lake valley, th edomestic and stock wells produce water from the Fort Union an dsuggest that water-yielding sand and gravel do not extend over th eentire valley.
Unnamed aquifer west of Berthold–Test hole 156-87-15cdd,drilled about 5 miles west of Berthold, penetrated 10 feet of fine t ocoarse gravel from 65 to 75 feet (pl. 1) . The water level was about 5feet below land surface. The water is a sodium bicarbonate type thathad a dissolved-solids concentration of 871 ppm . The areal extent o fthe deposit is unknown .
40
Des Lacs Artesian Discharge Area
The Des Lacs artesian discharge area is a broad belt that extend ssoutheastward across Renville and Ward Counties roughly parallel t othe Des Lacs River and the Souris River below Burlington (fig . 3) . Thesouthern boundary of the area generally follows the northeaster nmargin of the Coteau du Missouri. The northern boundary of the De sLacs artesian area roughly corresponds to the Des Lacs River . From theconfluence of the Souris and Des Lacs Rivers, the boundary extend seastward and includes the flowing wells in the Minot and Surrey areas .
DES LACS RIVER VALLEY
The Des Lacs River begins in Canada about 2 miles north of theinternational boundary and flows southeastward for about 75 miles toits confluence with the Souris River at Burlington . The river has anaverage gradient of about 6 feet per mile through Renville and War dCounties . The channel is entrenched about 15 feet below the valleyfloor and is generally 10 to 40 feet wide . The river has a drainage areaof approximately 1,050 square miles, of which about 400 square milesdo not contribute direct runoff to the river system.
Several sand and gravel deposits were penetrated during tes tdrilling in the Des Lacs River valley downstream from Kenmare (pl . 2 ,cross section A-A', in pocket). Terrace, outwash, and alluvial-fandeposits are also present in several of the tributaries and the mainvalley. Water-bearing deposits may be as much as 45 feet thick, such a sat Foxholm, but they probably have small areal extent .
Well records indicate that many thin deposits of saturated sandand gravel occur at shallow depths in the valley and sufficient groun dwater for domestic and livestock use is generally available . In a fewplaces, ground water may be sufficiently abundant for small municipalsupplies and small-scale irrigation .
The ground-water levels generally range between 3 and 10 fee tbelow land surface, but they fluctuate as much as 3 feet during theyear .
The chemical quality of the water from the glacial deposits in theDes Lacs valley varies from a sodium sulfate type to a calciumbicarbonate type . Wells drilled near the valley walls where bedrock i snear the surface, tend to have larger concentrations of sodium andsulfate. The higher concentrations are probably the result of natura lrecharge from beds of sand and 1' nite in the Fort Union . Water fromwells in the central part of the valley, especially those less than 40 feet
41
deep, tends to contain less dissolved solids ; calcium and bicarbonate arethe major components. Much of this water is derived by infiltratio nfrom the river during spring runoff and from precipitation.
Insufficient data are available to accurately determine theground-water conditions in the Des Lacs River valley north of Kenmare .Cross section G-G' of plate 2 shows about 200 feet of till wit hdiscontinuous sand and gravel bodies in the Des Lacs River valley i nnorthwestern Renville County . Elsewhere, records of wells and tes tholes indicate that in places there are thick accumulations of saturate dsand and gravel. Apparently several buried valleys cross the area, bu tbecause there is no surface expression, their trends and areal extent ar eunknown.
Nearly 80 feet of sand and gravel was penetrated in wel l161-88-31da, but of the few wells along the upper part of the Des Lac svalley, most are less than 20 feet deep . They are limited to the margin sof the valley because Upper Des Lacs Lake, which is only a few fee tdeep, covers most of the valley floor .
Owing to a general lack of ground-water development, it i sassumed that the aquifers in this area are full and that they discharg ewater into the river . The quantity, however, is probably quite small andmuch of the discharge is lost through evapotranspiration .
The Des Lacs River valley is an area of ground-water discharg eduring most of the year . Discharge of ground water into the Des Lac sRiver is indicated by (1) the abrupt steepening of the potentiometricsurface adjacent to the valley, (2) numerous springs and seeps along th evalley walls, (3) the abundance of local marshy areas on the flood plain ,(4) the base flow of the river, and (5) the progressive lowering of th ewater level in shallow wells on the flood plain from spring to latewinter .
Pollution of ground water is a potential problem in the Des Lac sRiver valley. Most of the domestic and stock wells on the flood plai nare less than 30 feet deep and many are less than 10 feet deep. Most o fthese wells are close to septic tanks, outdoor privies, manure piles, o rother sources of pollution . In several places there are refuse dumps i nabandoned meanders or along the river banks. Practices such as thes eprovide ample opportunity for surface-water and ground-waterpollution . Consequently, water from shallow wells, particularly dugwells, should be analyzed periodically for the presence of pollutants ,especially bacteria .
Kenmare aquiferKenmare (population 1,515, 1970 census) obtains its municipal
water supply from a buried sand and gravel aquifer beneath the city (pl .1) . The aquifer is at least 200 feet below the Des Lacs River valley an d
42
is believed to extend in a northeast-southwest direction . The extent ofthe Kenmare aquifer is not known beyond secs. 19 and 20, T . 160 N. ,R. 88 W. (pl. 1 ; pl. 2, cross section F-F') . C. A. Armstrong (oralcommun., 1969) traced a buried channel in southeast Burke County t othe east line of sec . 1, T. 161 N., R. 87 W., and designated the graveldeposit as the Kenmare(?) aquifer . Further test drilling is required t odetermine if this is part of the Kenmare aquifer .
The buried channel is slightly more than a mile wide at Kenmar eand is 355 feet deep at test hole 160-88-20caa1 . On the uplands at thenorth end of Kenmare, the depth to the bottom of the channel wouldprobably exceed 550 feet. There is no surface expression of the buriedaquifer .
The lower part of the aquifer is as much as 60 feet thick, andconsists chiefly of medium to coarse sand, fine to coarse gravel, andboulders. Sand forms the upper part of the deposit . In some places thinlayers of till are interbedded with this material .
Data are insufficient to compute the quantity of water in storageor the direction of water movement in the Kenmare aquifer . As morethan 200 feet of glacial drift overlies the aquifer, recharge fromprecipitation probably is small. Most of the recharge probably is b yunderflow from adjacent areas.
The potentiometric surface of the aquifer is about 250 feet abov ethe top of the aquifer, or about 19 to 48 feet below land surface in th esouthern part of Kenmare . The aquifer, therefore, is confined underartesian pressure .
Three high-capacity wells have been drilled into the aquifer by th ecity of Kenmare. Of the three wells, only one (well 2) was in operatio nin 1967. Although well 2 would probably produce as much as 1,000gpm, water was pumped from the well into a 3-inch pipe to a storag ereservoir and, consequently, the average discharge probably did no tgreatly exceed 500 gpm.
An aquifer test was conducted on the Kenmare aquifer onSeptember 15-18, 1966, by pumping Kenmare municipal well 2(160-88-20cbb2) . This well is 340 feet deep and completely penetratesthe aquifer . It has a 12-inch-diameter steel well casing and 55 feet of8-inch-diameter gravel-packed screen set in the bottom. The well wasequipped with a turbine pump that was powered by a 50-horsepowe relectric motor. During the test, the water was conveyed throug h6-inch-diameter irrigation pipe into a municipal reservoir nearly 200feet west of the pumped well. The discharge, which was measured by aflowmeter coupled to a chart recorder, was maintained at a constan trate of 500 gpm by an inline valve . The well was pumped for 3,000minutes and recovery of water levels was measured for 1,350 minutes .
43
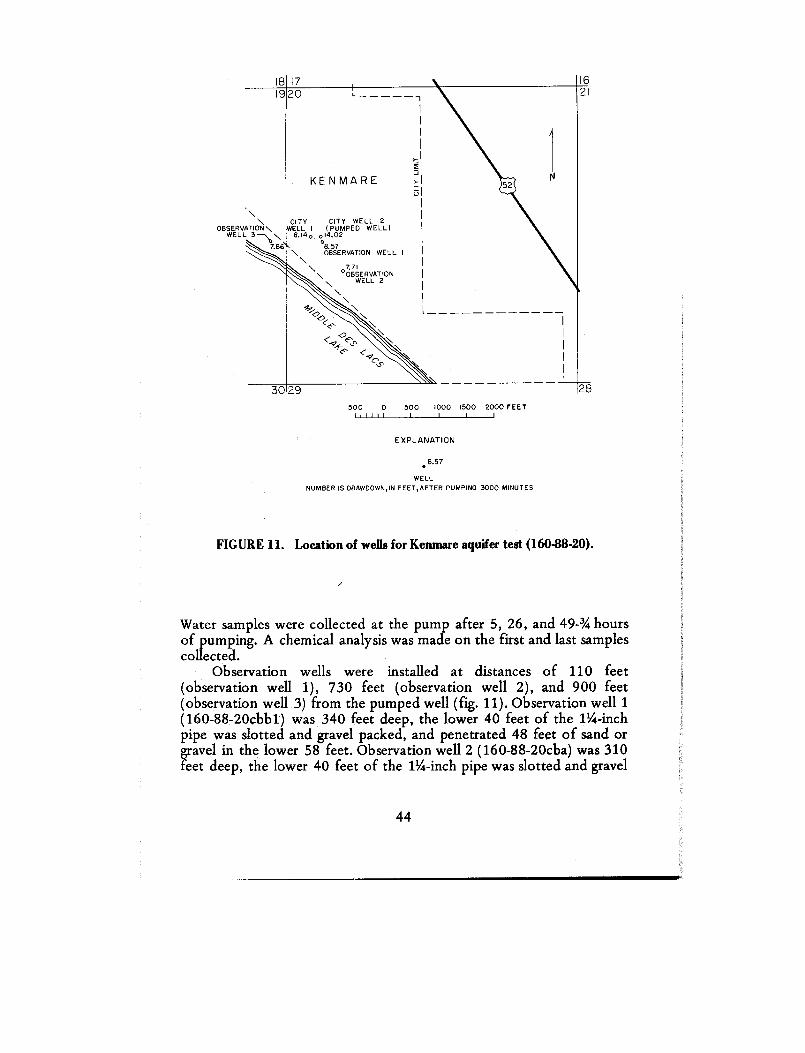
30 29
1 62 1
2 8
18 1 7
\
CITY
CITY WELL 2OBSERVATION\ WELL I (PUMPED WELL )
WELL 3 Tho\ 8 .14 0 0 14 .020
788\\
O8.5 7
BSERVATION WELL I
500
0
500
1000 1500 2000 FEE T111111 1 1 1 1
EXPLANATIO N
8.5 7
WELLNUMBER IS ORAWDOWN,IN FEET,AFTER PUMPING 3000 MINUTE S
FIGURE 11 . Location of wells for Kenmare aquifer test (160-88-20) .
Water samples were collected at the pump after 5, 26, and 49-34 hour sof pumping . A chemical analysis was made on the first and last sample scollected .
Observation wells were installed at distances of 110 feet(observation well 1), 730 feet (observation well 2), and 900 feet(observation well 3) from the pumped well (fig. 11) . Observation well 1(160-88-20cbbl) was 340 feet deep, the lower 40 feet of the 1 1/4-inchpipe was slotted and gravel packed, and penetrated 48 feet of sand o rgravel in the lower 58 feet . Observation well 2 (160-88-20cba) was 31 0feet deep, the lower 40 feet of the 1'4-inch pipe was slotted and gravel
44
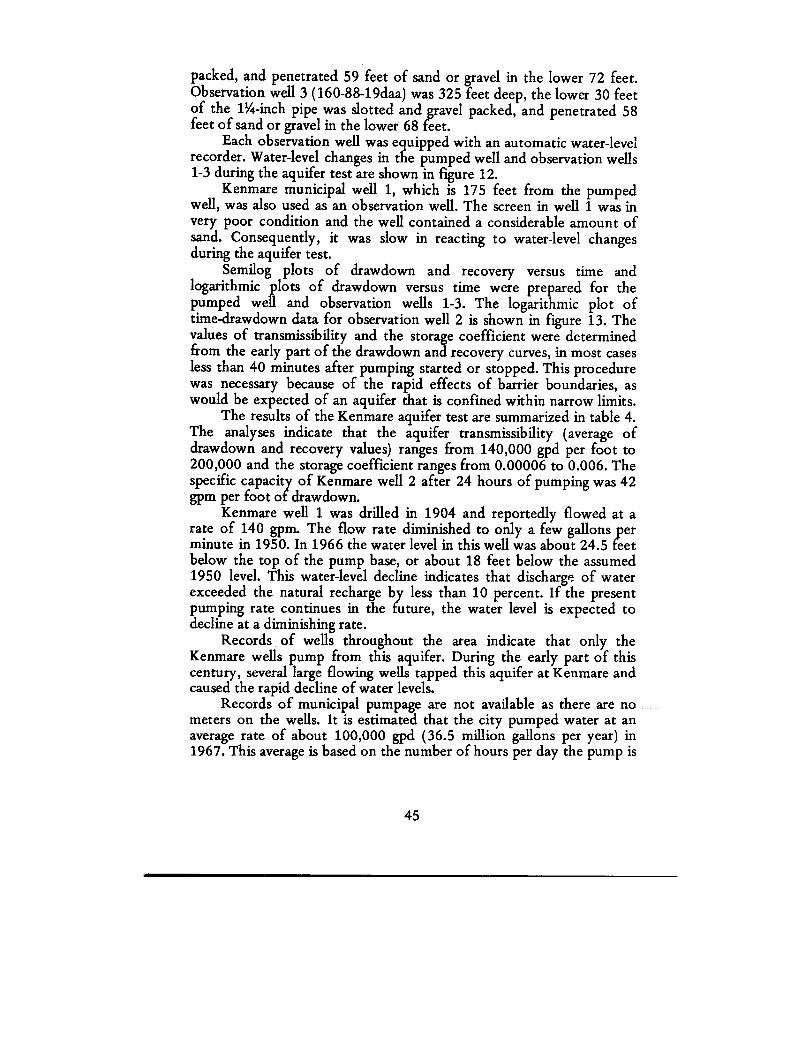
packed, and penetrated 59 feet of sand or gravel in the lower 72 feet .Observation well 3 (160-88-19daa) was 325 feet deep, the lower 30 feetof the 1%-inch pipe was slotted and gravel packed, and penetrated 5 8feet of sand or gravel in the lower 68 feet .
Each observation well was equipped with an automatic water-leve lrecorder . Water-level changes in the pumped well and observation well s1-3 during the aquifer test are shown in figure 12 .
Kenmare municipal well 1, which is 175 feet from the pumpe dwell, was also used as an observation well . The screen in well 1 was invery poor condition and the well contained a considerable amount o fsand. Consequently, it was slow in reacting to water-level change sduring the aquifer test .
Semilog plots of drawdown and recovery versus time an dlogarithmic plots of drawdown versus time were prepared for th epumped well and observation wells 1-3 . The logarithmic plot oftime-drawdown data for observation well 2 is shown in figure 13 . Thevalues of transmissibility and the storage coefficient were determinedfrom the early part of the drawdown and recovery curves, in most case sless than 40 minutes after pumping started or stopped. This procedurewas necessary because of the rapid effects of barrier boundaries, aswould be expected of an aquifer that is confined within narrow limits .
The results of the Kenmare aquifer test are summarized in table 4 .The analyses indicate that the aquifer transmissibility (average ofdrawdown and recovery values) ranges from 140,000 gpd per foot to200,000 and the storage coefficient ranges from 0 .00006 to 0.006. Thespecific capacity of Kenmare well 2 after 24 hours of pumping was 4 2gpm per foot of drawdown.
Kenmare well 1 was drilled in 1904 and reportedly flowed at arate of 140 gpm. The flow rate diminished to only a few gallons pe rminute in 1950 . In 1966 the water level in this well was about 24 .5 feetbelow the top of the pump base, or about 18 feet below the assume d1950 level. This water-level decline indicates that discharge of wate rexceeded the natural recharge by less than 10 percent . If the presentpumping rate continues in the future, the water level is expected t odecline at a diminishing rate .
Records of wells throughout the area indicate that only th eKenmare wells pump from this aquifer . During the early part of thiscentury, several large flowing wells tapped this aquifer at Kenmare an dcaused the rapid decline of water levels .
Records of municipal pumpage are not available as there are n ometers on the wells . It is estimated that the city pumped water at anaverage rate of about 100,000 gpd (36 .5 million gallons per year) in1967. This average is based on the number of hours per day the pump i s
45
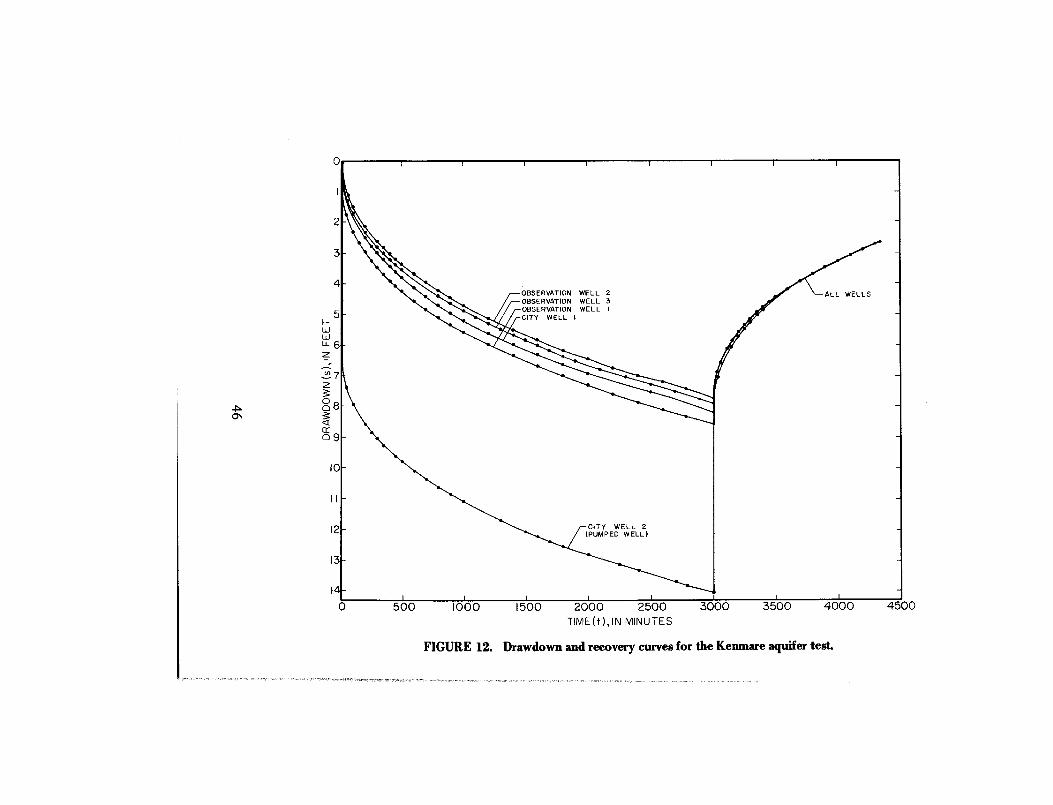
OBSERVATION WELL 2OBSERVATION WELL 3OBSERVATION WELL ICITY WELL I
4
3
t 0
1 2
1 3
14-
CITY WELL 2(PUMPED WELL )
500
1000
1500
2000
2500
3000
3500
4000
4500
TIME(t),IN MINUTE S
FIGURE 12 . Drawdown and recovery curves for the Kenmare aquifer test.
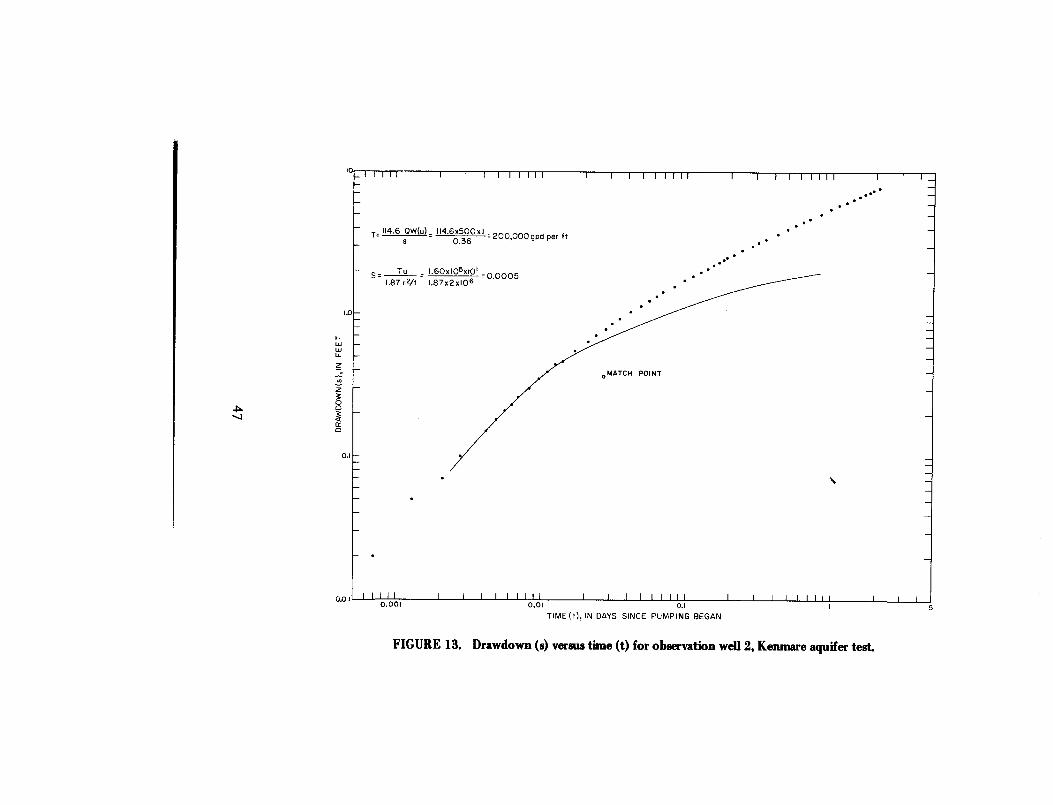
10_ 1
1
1 1 1
I
1
1
1
1
1 1 1
I
I
I
1
1
1
1 1 1
I
I
I
T
I
I
I I r
1
I
I .
I .0
T= 114 .6 QW(u) = 114 .6x500x1200,Q00gpd per f ts
0.36
5=
Tu _ 1 .60xI05x101=0.000 5
1 .87r 2/t
I .87x2x10 6
0.1
0 MATCH POIN T
0.o 15
1 1 I 1 I 1 I 1 1 1 1 1 1 I I I I I I 1 I I I I 1 11 1 I I I0 .01
0 . 1
TIME (t), IN DAYS SINCE PUMPING BEGA N
0 .00 1
FIGURE 13. Drawdown (s) versus time (t) for observation well 2, Kenmare aquifer test .
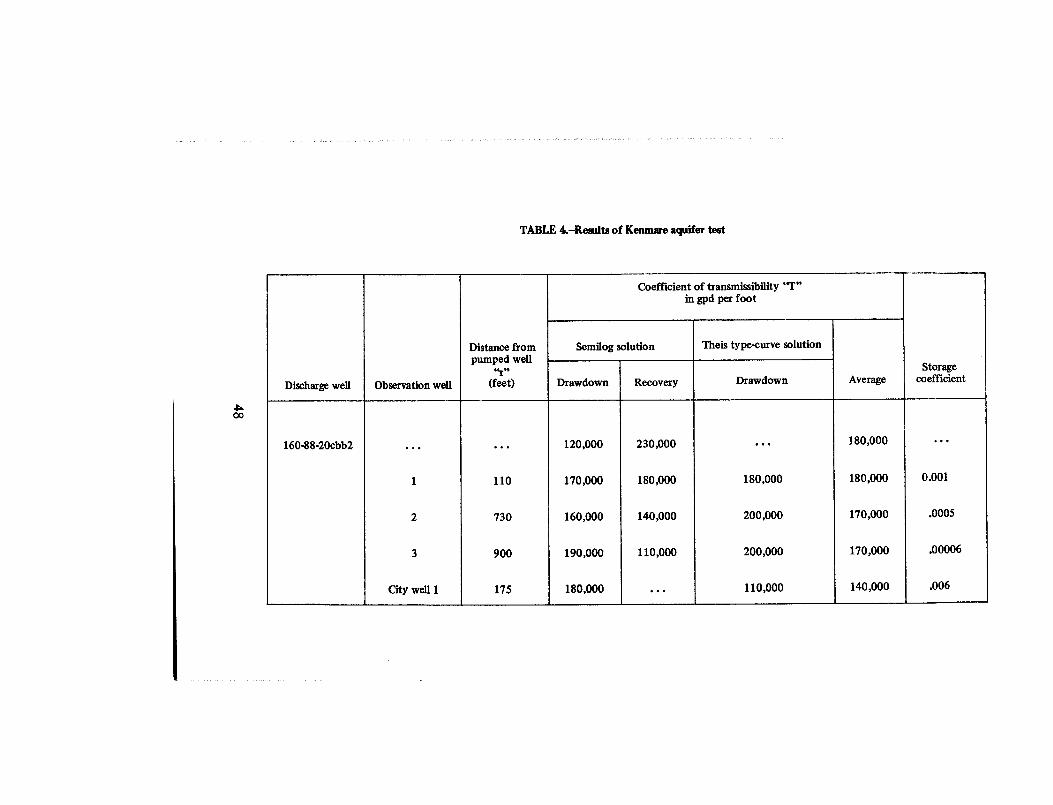
TABLE 4.-Results of Kenmare aquifer tes t
Coefficient of transmissibility `T "in gpd per foot
Discharge well Observation well
Distance fro mpumped well
tft„
(feet)
Semilog solution Theis type-curve solution
AverageStorage
coefficientDrawdown Recovery Drawdown
160-88-20cbb2 . . . . . . 120,000 230,000 . . . 180,000 •• •
1 110 170,000 180,000 180,000 180,000 0 .00 1
2 730 160,000 140,000 200,000 170,000 .000 5
3 900 190,000 110,000 200,000 170,000 .0000 6
City well 1 175 180,000 . . . 110,000 140,000 .006
operated and the discharge rate . The discharge rate was estimated b ydetermining the time required to fill two municipal reservoirs .
The Kenmare aquifer can provide a substantial volume of wate rfor future development . In Kenmare the most desirable area for futurewells is in the vicinity of observation well 3 (160-88-19daa), wherecoarse gravel is present . However, wells should be widely spaced t ominimize interference. In addition to the higher permeability in thi sarea, the aquifer boundaries are at a greater distance than in other areas .
Water from the Kenmare aquifer is a sodium bicarbonate type .The dissolved solids (1,070 to 1,500 ppm) were higher than th emaximum standard recommended by the U.S. Public Health Service .Dissolved iron (0 .22 to 1 .4 ppm) was present in excessiveconcentrations locally, and will stain clothes and plumbing fixtures .Although the water is moderately hard to very hard by nationa lstandards, it is relatively soft in comparison with water from man yother aquifers in Renville and Ward Counties . Water from the Kenmareaquifer is generally unsatisfactory for irrigation because of a high t overy high salinity hazard and hth to very high sodium-hazard (fig. 14) .
Apparently the quality of the water becomes poorer with timeduring pumping, indicating recharge of undesirable water from adjacentsources. The amount of chemical components in the water is nearly 20percent less in the sample collected after 5 hours of pumping ascompared to those taken after 26 and 49- 3/4 hours. The composition ofthe water after 26 and 494 hours of pumping is nearly identical (fig .14) .
SOURIS RIVER VALLEY
The Souris River enters the United States from Canada near thenorthwest corner of Renville County, and flows southeastward acros sRenville and Ward Counties. The river occupies a large flat-flooredvalley, which lies as much as 150 feet below the upland surface . Thevalley is about half a mile wide at the international border but averagesabout three-quarters of a mile in width through the study area . Acomplex meander pattern has been developed by the river . Swampyareas and lakes cover part of the valley floor above Burlington . LakeDarling, an artificial lake in southeast Renville County, is about 2 0miles long and has a maximum depth of about 15 feet . Below th econfluence of the Des Lacs River at Burlington there are only a fewsmall artificial lakes .
Upstream from Burlington, the tributary streams are few an dshort. The main valley is incised to a depth of about 150 feet and hasan average gradient of about 1 foot per mile .
49
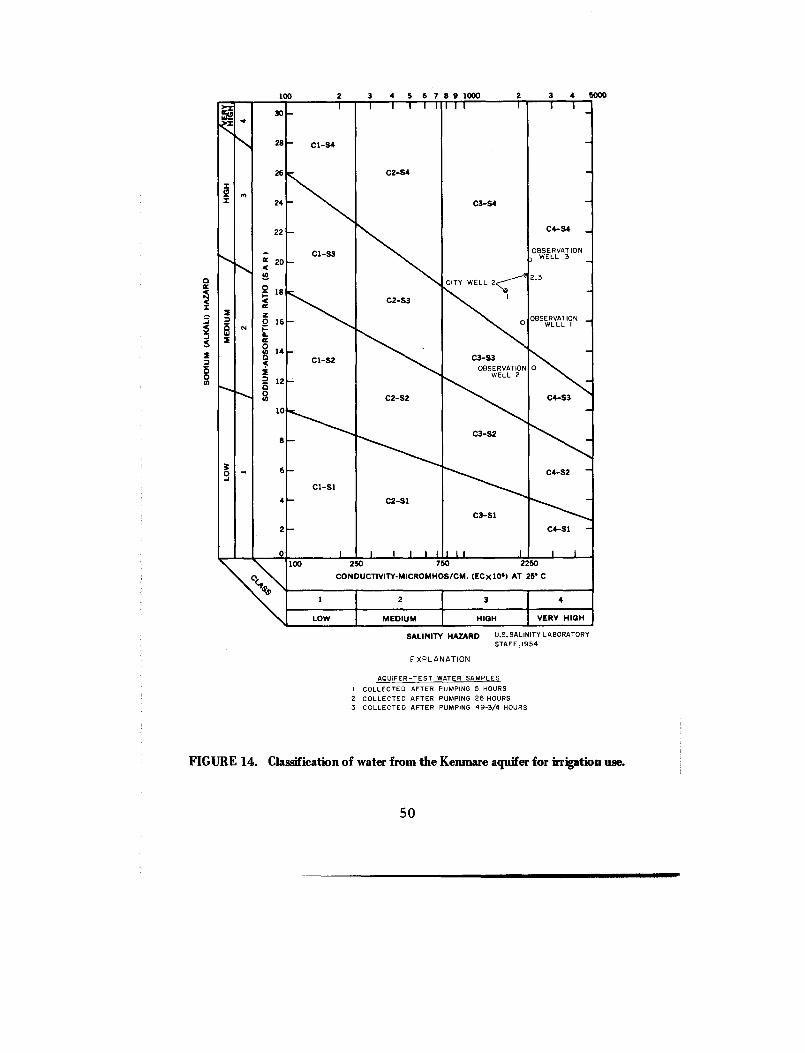
100
2
3
4 5 6 7 8 9 1000
2
3
4 5000
30I I
I
I
I
I I
I
I
I I
I
2C7=
W3<
~
a
28
2 6
24
22
2 0
0 1 8
O 1 6
a.
—
C1-34
-
-
C1-S3-
-
C2-S4
C2-S3
C3-S 4
CITY WELL2
1
0
-
-
-
C4-S4
OBSERVATION -WELL 3
2, 3
OBSERVATION
_WELL I
C0
14 —
<
1 2OvOi
1 0
4
2
0
8
6 ' —
C1-S2
-
Cl-Sl
-
-
I
C2-S2
C2-S 1
I
I
1
1
1
C3-S 3OBSERVATIO N
WELL 2
C3-S 2
C3-S1
1
1
I
I
—
0
C4-S3
—
C4-S2
—
C4-S 1
I
I
~\
p ~»
100
250
750
2250
C4
s,
CONDUCTIVITY-MICROMHOS/CM . (EC xlO‘) AT 25' C
1 2 3 4
LOW MEDIUM HIGH VERY HIGH
SALINITY HAZARD
U .S . SALINITY LABORATOR Y
STAFF, 1954.
EXPLANATIO N
AQUIFER-TEST WATER SAMPLE S
I COLLECTED AFTER PUMPING 5 HOUR S
2 COLLECTED AFTER PUMPING 26 HOURS3 COLLECTED AFTER PUMPING 49-3/4 HOUR S
FIGURE 14. Classification of water from the Kenmare aquifer for irrigation use .
50
The valley of the Souris River downstream from Burlington is cutin bedrock, which, in places, forms the lower one-third to one-half o fthe walls. The valley is deepest near Minot where there is as much a s200 feet of relief from the valley floor to the uplands . Generally, th enorth valley wall is lower than the south wall because of the northeas tslope of the upland. Steep-sided tributaries that may be several miles i nlength are incised into the upland area south of the valley . Tributarieson the north side, however, are few and short because the slope of theupland causes the water to drain away from this side of the valley . Thegradient of the valley floor is about 2 .3 feet per mile .
Two stream-ga5ing stations provide useful data to interpret th esurface-water-grounc.-water relationships in the Souris River valley . Thegaging-station record above Minot (155-83-17dbb) indicates the generalhydrologic conditions of the upper stretches of the Souris and Des Lac sRivers, and a downstream gage near Verendrye (154-78-17cb) i nMcHenry County provides information concerning the interchang ebetween ground and surface water below the Minot gage . Other gage son the Souris River include a station 0 .8 mile downstream from theinternational border near Sherwood and a station 15 .4 milesdownstream from Lake Darling near Foxholm .
The Minot gage record is used to compute the drainage fro mapproximately 10,600 square miles of the Souris River watershed ;however, about 6,700 square miles of this area probably i snoncontributing. Based on 62 years of record, the discharge has rangedfrom no flow in some years to a maximum of 12,000 cfs (cubic feet pe rsecond) during the April 1904 flood. The average discharge at thi sstation was 136 cfs (U .S. Geological Survey, 1965a) .
The daily mean discharge of the Souris River above Minot fro mOctober 1964 through September 1965 is shown in figure 15 . Duringthis period, the minimum flow was 0 .1 cfs (March 25-27), themaximum flow was 1,200 cfs (June 17) . Prior to the construction o fthe Lake Darling dam, the greatest discharge was in April during th espring runoff and thereafter it decreased until late fall, except for shor tperiods after heavy rains fell in the drainage basin . Since theconstruction of the dam, however, flow has been almost completelyregulated .
The weather was unusually dry during the period 1962-64 and fo rweeks at a time no river flow was recorded at the Minot gage . Residentsbetween Burlington and Minot reported that water levels in thei rshallow wells declined substantially at that time and a few well srequired deepening. The lack of recharge and the high rate ofevapotranspiration of water from the nearly dry river channel and theadjacent valley floor were largely responsible for the water-level decline .Consequently, many thousands of acre-feet of ground water were los t
51
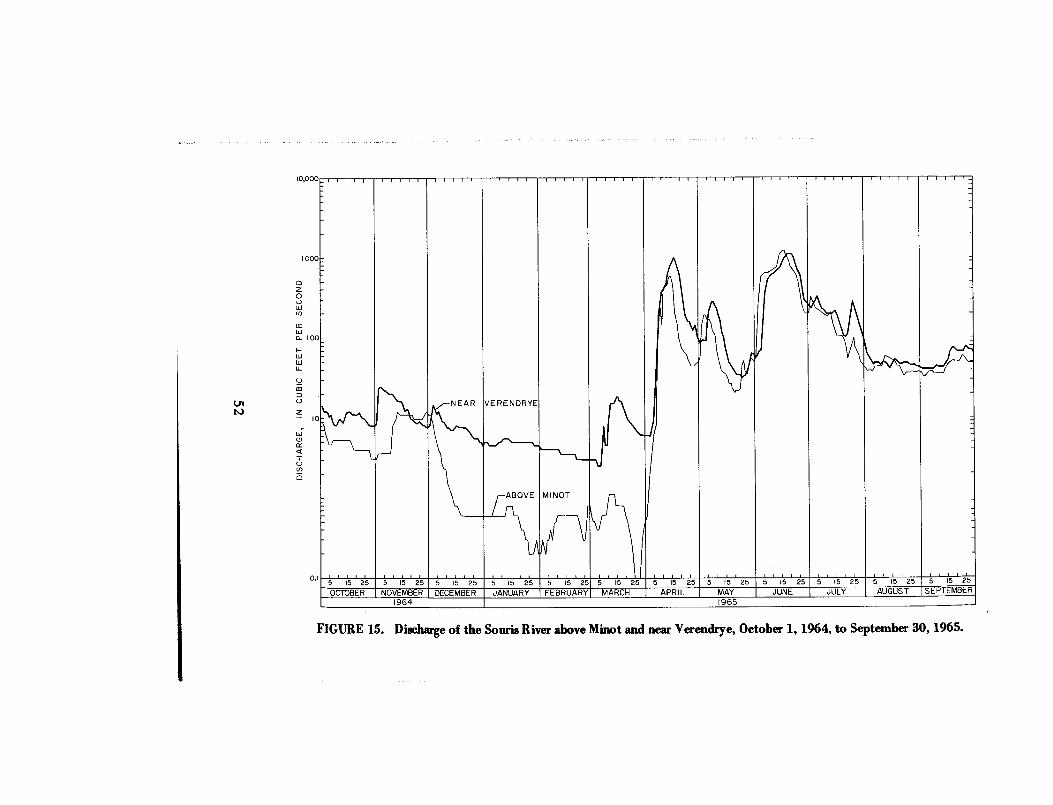
10,00 0
loon
o.1
\11 . _
1NEAR VERENDRYE
ABOVE MINO T
5
5
25 5
15
25 5
15
25 5
15
25 5
15
25 5
15
25 5
15
25 5
15
25 5
15
25 5
15
25 5
15
25 5
15
25
OCTOBER NOVEMBER DECEMBER JANUARY FEBRUARY MARCH APRIL MAY JUNE JULY AUGUST SEPTEMBE R_1964 1965
FIGURE 15 . Discharge of the Souris River above Minot and near Verendrye, October 1, 1964, to September 30, 1965 .
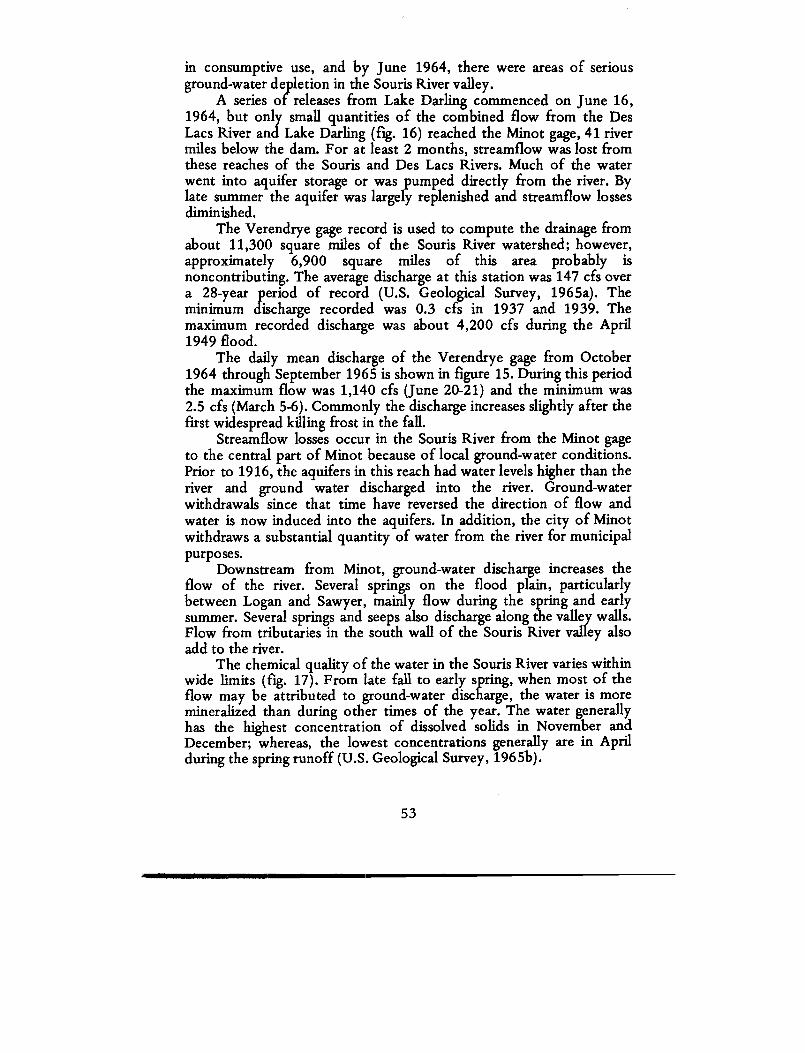
in consumptive use, and by June 1964, there were areas of seriou sground-water depletion in the Souris River valley .
A series of releases from Lake Darling commenced on June 16 ,1964, but only small quantities of the combined flow from the DesLacs River and Lake Darling (fig . 16) reached the Minot gage, 41 rivermiles below the dam. For at least 2 months, streamflow was lost fromthese reaches of the Souris and Des Lacs Rivers . Much of the waterwent into aquifer storage or was pumped directly from the river . Bylate summer the aquifer was largely replenished and streamflow losse sdiminished.
The Verendrye gage record is used to compute the drainage fro mabout 11,300 square miles of the Souris River watershed ; however,approximately 6,900 square miles of this area probably i snoncontributing . The average discharge at this station was 147 cfs ove ra 28-year period of record (U .S. Geological Survey, 1965a) . Theminimum discharge recorded was 0 .3 cfs in 1937 and 1939 . Themaximum recorded discharge was about 4,200 cfs during the Apri l1949 flood .
The daily mean discharge of the Verendrye gage from October1964 through September 1965 is shown in figure 15 . During this periodthe maximum flow was 1,140 cfs (June 20-21) and the minimum wa s2.5 cfs (March 5-6) . Commonly the discharge increases slightly after th efirst widespread killing frost in the fall .
Streamflow losses occur in the Souris River from the Minot gageto the central part of Minot because of local ground-water conditions .Prior to 1916, the aquifers in this reach had water levels higher than th eriver and ground water discharged into the river . Ground-wate rwithdrawals since that time have reversed the direction of flow an dwater is now induced into the aquifers . In addition, the city of Minotwithdraws a substantial quantity of water from the river for municipa lpurposes.
Downstream from Minot, ground-water discharge increases th eflow of the river . Several springs on the flood plain, particularl ybetween Logan and Sawyer, mainly flow during the spring and earlysummer . Several springs and seeps also discharge along the valley walls .Flow from tributaries in the south wall of the Souris River valley alsoadd to the river .
The chemical quality of the water in the Souris River varies withi nwide limits (fig . 17) . From late fall to early spring, when most of th eflow may be attributed to ground-water discharge, the water is moremineralized than during other times of the year. The water generallyhas the highest concentration of dissolved solids in November andDecember; whereas, the lowest concentrations generally are in Apri lduring the spring runoff (U .S . Geological Survey, 1965b) .
53
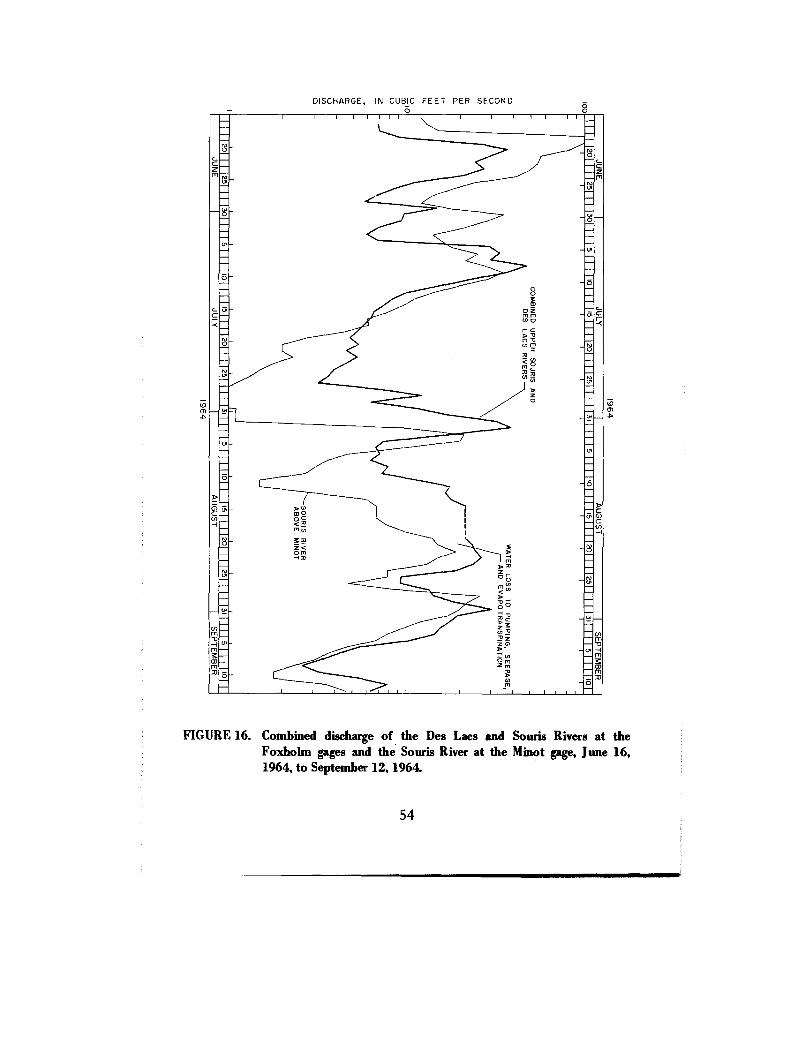
DISCHARGE, IN CUBIC FEET PER SECON D0
cmm
c
CC -
FIGURE 16. Combined discharge of the Des Lacs and Souris Rivers at theFoxholm gages and the Souris River at the Minot gage, June 16 ,1964, to September 12, 1964.
54
z
nz
m-C 0001
0 1
S96I b96I £96 1S d r f W V W f 0 N 0 S d r r W b
W r 0 N 0
- 39lVH0Sl0 113Ntl
J C
FIGURE 17. Discharge and dissolved solids of the Souris River at Verendrye, October 1963 through September 1965 .
00 1
r-0z 000z
000 z
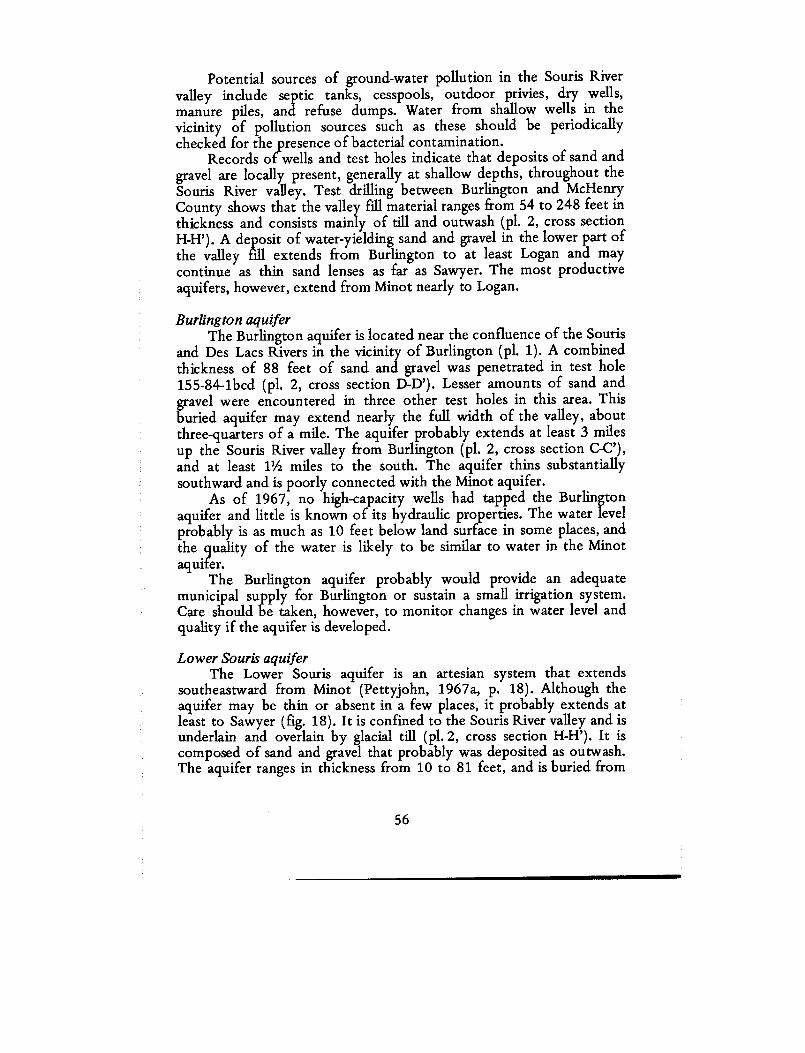
Potential sources of ground-water pollution in the Souris Rive rvalley include septic tanks, cesspools, outdoor privies, dry wells ,manure piles, and refuse dumps. Water from shallow wells in thevicinity of pollution sources such as these should be periodicallychecked for the presence of bacterial contamination .
Records of wells and test holes indicate that deposits of sand an dgravel are locally present, generally at shallow depths, throughout th eSouris River valley. Test drilling between Burlington and McHenryCounty shows that the valley fill material ranges from 54 to 248 feet inthickness and consists mainly of till and outwash (pl . 2, cross sectionH-H') . A deposit of water-yielding sand and gravel in the lower part ofthe valley fill extends from Burlington to at least Logan and ma ycontinue as thin sand lenses as far as Sawyer . The most productiv eaquifers, however, extend from Minot nearly to Logan .
Burlington aquiferThe Burlington aquifer is located near the confluence of the Souri s
and Des Lacs Rivers in the vicinity of Burlington (pl . 1) . A combinedthickness of 88 feet of sand and gravel was penetrated in test hol e155-84-lbcd (pl. 2, cross section D-D') . Lesser amounts of sand andgravel were encountered in three other test holes in this area . Thisburied aquifer may extend nearly the full width of the valley, aboutthree-quarters of a mile. The aquifer probably extends at least 3 milesup the Souris River valley from Burlington (pl . 2, cross section C-C') ,and at least 1% miles to the south . The aquifer thins substantiallysouthward and is poorly connected with the Minot aquifer .
As of 1967, no high-capacity wells had tapped the Burlingto naquifer and little is known of its hydraulic properties . The water levelprobably is as much as 10 feet below land surface in some places, an dthe quality of the water is likely to be similar to water in the Mino taquifer.
The Burlington aquifer probably would provide an adequat emunicipal supply for Burlington or sustain a small irrigation system .Care should be taken, however, to monitor changes in water level an dquality if the aquifer is developed .
Lower Souris aquiferThe Lower Souris aquifer is an artesian system that extend s
southeastward from Minot (Pettyjohn, 1967a, p . 18). Although theaquifer may be thin or absent in a few places, it probably extends a tleast to Sawyer (fig. 18) . It is confined to the Souris River valley and i sunderlain and overlain by glacial till (pl .2, cross section H-H') . It iscomposed of sand and gravel that probably was deposited as outwash .The aquifer ranges in thickness from 10 to 81 feet, and is buried fro m
56
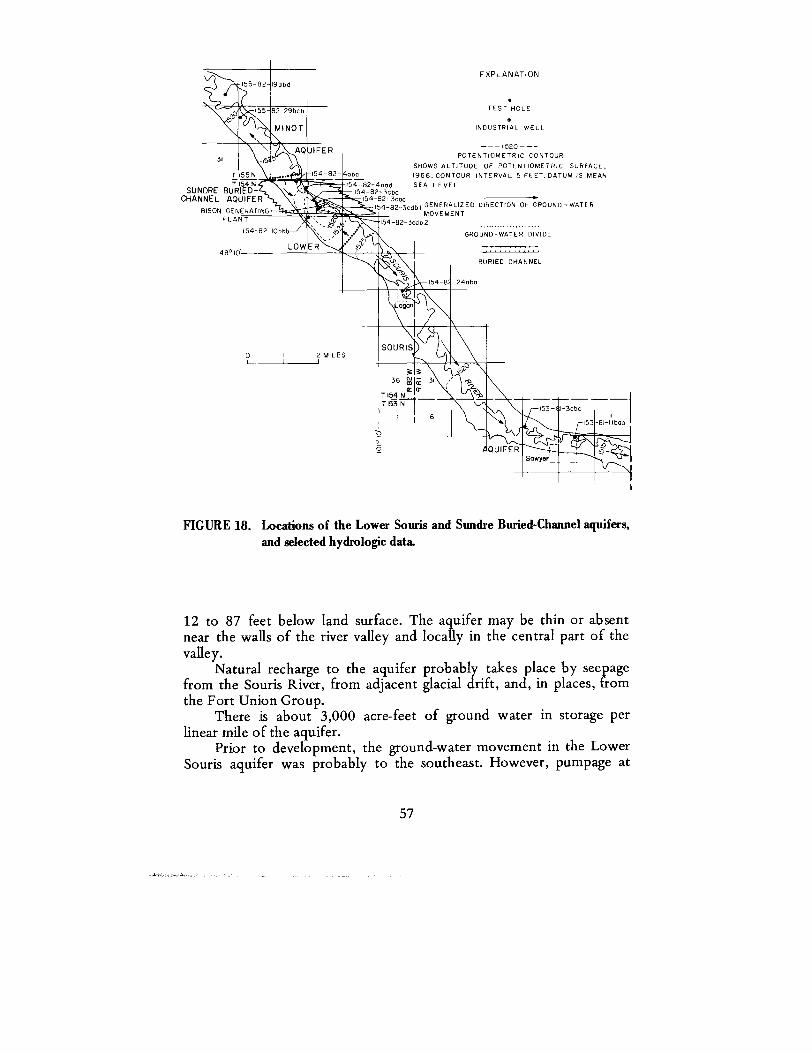
EXPLANATIO N155-82 9dbd
TEST HOL E
INDUSTRIAL WEL L
POTENTIOMETRIC CONTOU RSHOWS ALTITUDE OF POTENTIOMETRIC SURFACE ,1966 . CONTOUR INTERVAL 5 FEET . DATUM IS MEA N
54-82-4oad
SEA LEVE L154-82-3cb o
154-82-3coc154-82--3cdbI GENERALIZED DIRECTION OF GROUND-WATE R
MOVEMEN T154-82-3cdb 2
155-82-29bc b
MINO T
T 155 NT 154 N
SUNDRE BURIED -CHANNEL AQUIFE R
BISON GENERATIN GPLANT
SOURI S0L—
2 MILES
153- : I-3cbc
153-81-Ilboo0
0
154-82
Lopo n
FIGURE 18. Locations of the Lower Souris and Sundre Buried-Channel aquifers ,
and selected hydrologic data.
12 to 87 feet below land surface . The aquifer may be thin or absen tnear the walls of the river valley and locally in the central part of th evalley .
Natural recharge to the aquifer probably takes place by seepagefrom the Souris River, from adjacent glacial drift, and, in places, fro mthe Fort Union Group .
There is about 3,000 acre-feet of ground water in storage perlinear mile of the aquifer .
Prior to development, the ground-water movement in the Lowe rSouris aquifer was probably to the southeast. However, pumpage at
57
Minot and at the Bison Generating Plant, about 3 miles southeast o fMinot, has caused reversals in the direction of ground-water movemen tand ground-water divides have been formed (fig. 18) . The ground-watergradient northwest of the divide in sec . 11, T. 154 N., R. 82 W., istoward the northwest at more than 7 feet per mile . The gradientsoutheast of the divide is toward the southeast at about 1 foot per mile .The quantity of underflow northwestward from the divide in 155-82-33into the adjacent Minot aquifer is probably about 1 mgd (millio ngallons per day) .
The water level in the aquifer ranges from 10 to 40 feet belo wland surface. Hydrographs of water-level fluctuations in the aquifer ar eshown in figure 19 . The greatest fluctuations were in the vicinity o fMinot where the aquifer is heavily pumped. Southeastward from theBison Generating Plant, only minor seasonal changes in ground-waterstorage are indicated by the water-level fluctuations ; water levels arehighest in July or August and lowest in February, March, or April .
An aquifer test was conducted on the Lower Souris aquifer o nOctober 11-16, 1965, using Northern States Power Company's BisonGenerating Plant well (154-82-3cdb3) . The well is 92 feet deep, an dapparently completely penetrates the aquifer. It has a 10-inch-diametersteel well casing and 20 feet of gravel-packed screen at the bottom . Theturbine pump is powered by a 30-horsepower electric motor . Duringthe test, the water was discharged through a 4-inch-diameter pipe int othe Souris River . The discharge, which was measured by a flowmetercoupled to a chart recorder, was maintained at a constant rate of 42 0gpm by using an inline valve . The well was pumped 4,200 minutes an drecovery was measured for 3,000 minutes .
Four observation wells were drilled at distances of 150 fee t(observation well 1), 300 feet (observation well 2), 600 fee t(observation well 3), and 1,200 feet (observation well 4) from th epumped well (fig. 20) . Observation well 1 (154-82-3cdb1) is 80 feetdeep and the lower 10 feet of the 3-inch pipe is slotted and grave lpacked. Thirty feet of gravel was penetrated at this well . An additional25 feet of fine to coarse sand above the main body of the aquifer mayalso be hydraulically connected. Observation well 2 (154-82-3cdb2) is80 feet deep and the 1½-inch pipe is coupled to a 2-foot sand point .The aquifer contains 61 feet of sand in its upper part and at least 2 0feet of coarse gravel in the lower part, but was not completel ypenetrated. Observation well 3 (154-82-3cac) was drilled to a depth o f170 feet, but only 82 feet of 1½-inch pipe and a 2-foot sand point wereinstalled in the hole . The well was gravel packed . Sand and gravelextends from 65 to 88 feet and fine to medium sand with an abundanc eof lignite extends from 88 to at least 170 feet below land surface .Observation well 4 (154-82-3cba) is 96 feet deep, including a sand
58
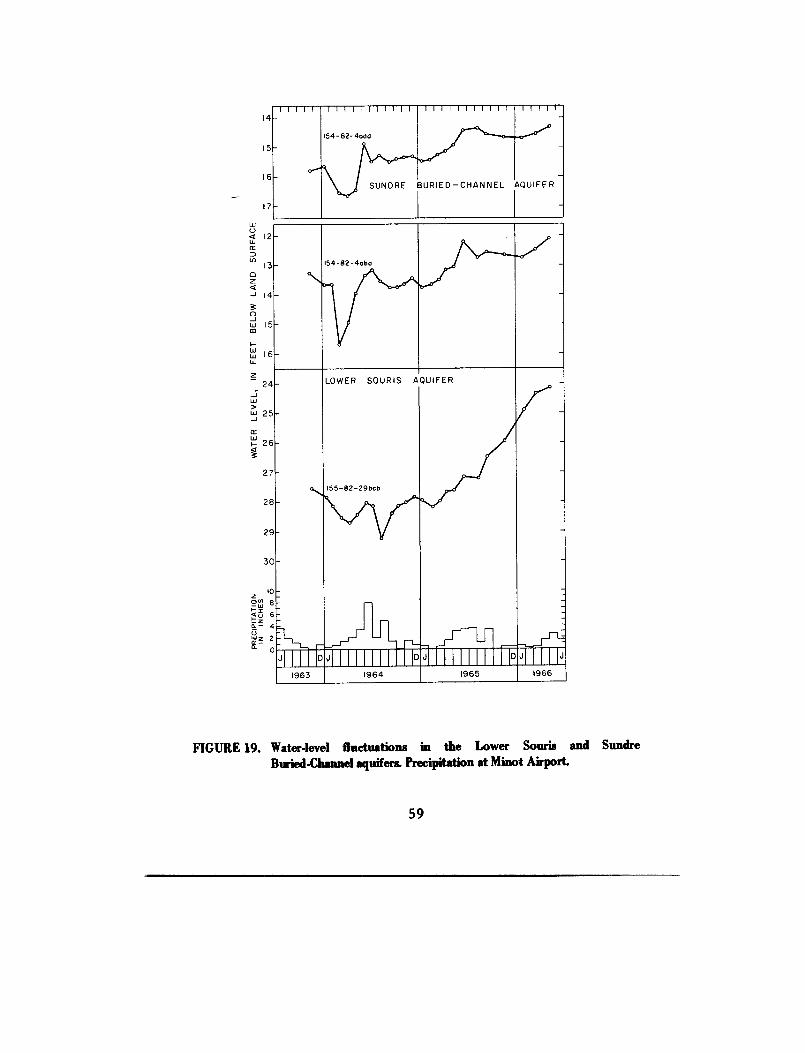
I
I
I
I - r
I
I
I
I
I
I
I
I
I
I
154-82-4aad
I
I
I
I
I
I
I
I
I
1
1 I
I
I
I
I
SUNDRE BURIED-CHANNEL AQUIFE R
_ 154-82-4oba -
•
-
LOWE R
155-82-29bc b
SOURIS AQUIFER -
-
-
,
J
1 DJ DJ DJ J
1963 1964 1965 1966
FIGURE 19. Water-level fluctuations in the Lower Souris and SundreBuried-Channel aquifers . Precipitation at Minot Airport .
59
1 4
1 5
16
7
1 2
2
2
2
2
2
2
3
zo0)F w
a -W
i ?
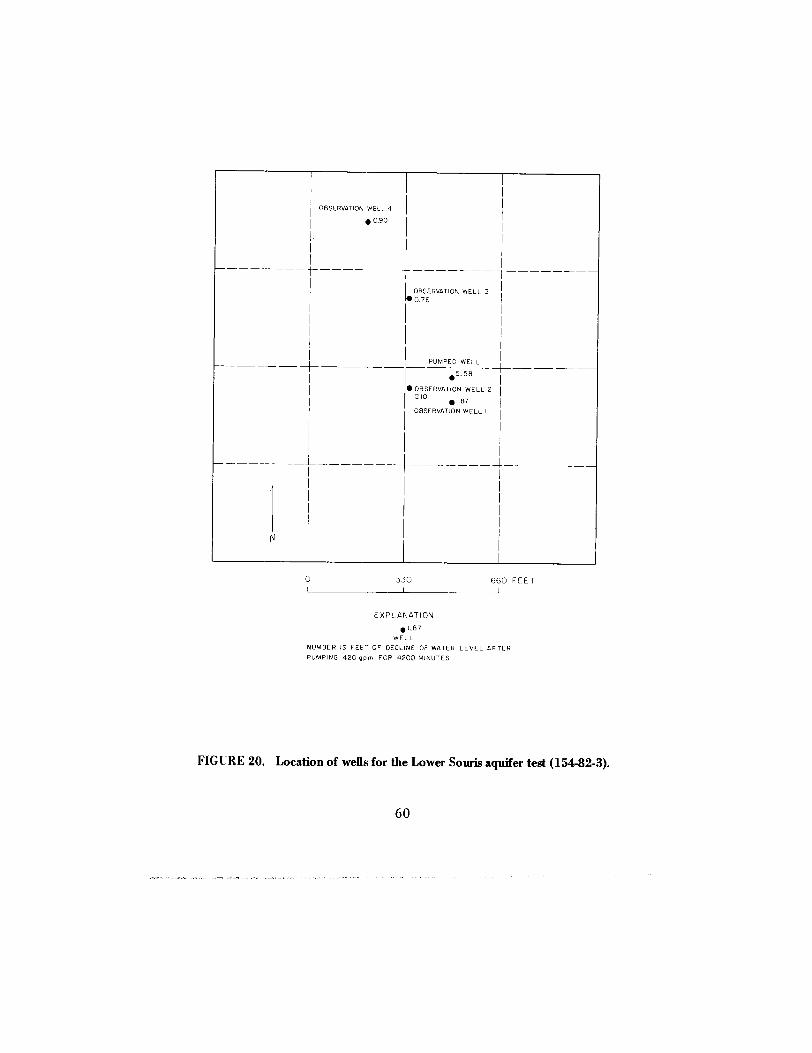
OBSERVATION WELL 30 .76
PUMPED WEL L
0 5 .5 8
1
'OBSERVATION WELL 2210
0 1.87OBSERVATION WELL I
N
0
330
660 FEE TL _ I
EXPLANATIO N
0 1,8 7
WEL LNUMBER IS FEE? OF DECLINE OF WATER LEVEL AFTE RPUMPING 420 gprn FOR 4200 MINUTE S
FIGURE 20 . Location of wells for the Lower Souris aquifer test (154-82-3) .
60
point . This well was also gravel packed . A total of 34 feet of sand,separated by layers of clay, extends from 12 to 61 feet . Fine to coarsesand and gravel was penetrated from 66 to 103 feet .
The drawdown and recovery of the water level in the pumped wellwere measured with a steel tape. The observation wells were equippe dwith automatic water-level recorders with electric water-level sensingdevices that produced a continuous record .
Semilog plots of drawdown and recovery versus time, andlogarithmic plots of drawdown versus r2/t were prepared for thepumped well and observation wells 1-4 . The drawdown curve forobservation well 1 is shown in figure 21 . The values of the coefficient sof transmissibility and storage were determined from the early part o fthe drawdown and recovery curves before the appearance o fboundaries .
The results of the Lower Souris aquifer test are summarized i ntable 5 . The analyses gave values of the coefficient of transmissibilit yfrom 140,000 to 520,000 gpd per foot and the storage coefficien tranges from 0.00009 to 0 .0009 . Variations in the values o ftransmissibility and storage coefficient are due to differences in aquife rhydraulic characteristics, to changes in aquifer thickness, and to wel ldevelopment . The high values of transmissibility in observation well 3reflect the greater thickness of the aquifer in that area . The specificcapacity of the pumped well after 24 hours of pumping was 79 gpm pe rfoot of drawdown.
The test on the Lower Souris aquifer shows that it has a larg epotential for future ground-water development . As of 1967, the onlyhigh-capacity well tapping the aquifer was at the Bison Generatin gPlant, but it was seldom used. Properly constructed and full ypenetrating wells locally could produce as much as 1,000 gpm with adrawdown ranging between 6 and 13 feet. However, lenses of lesspermeable material such as silt and clay, where present, will restrict theyield of a well .
Water from the Lower Souris aquifer is suitable for most domesti cand industrial uses. The water is a hard sodium bicarbonate type . Theiron will stain clothes and fixtures, but the concentrations of otherchemical components are generally much lower than in parts of theMinot aquifer (Pettyjohn and Hills, 1965) . The water is in the C3-S 1and C3-S2 classifications for irrigation and should be suitable forirrigation wherever there is adequate drainage (fig. 22) .
Minot aquiferThe Minot aquifer consists of sand and gravel outwash deposit s
that apparently were emplaced during several minor advances andretreats of glacial ice. The aquifer, although hydraulically connected t o
61
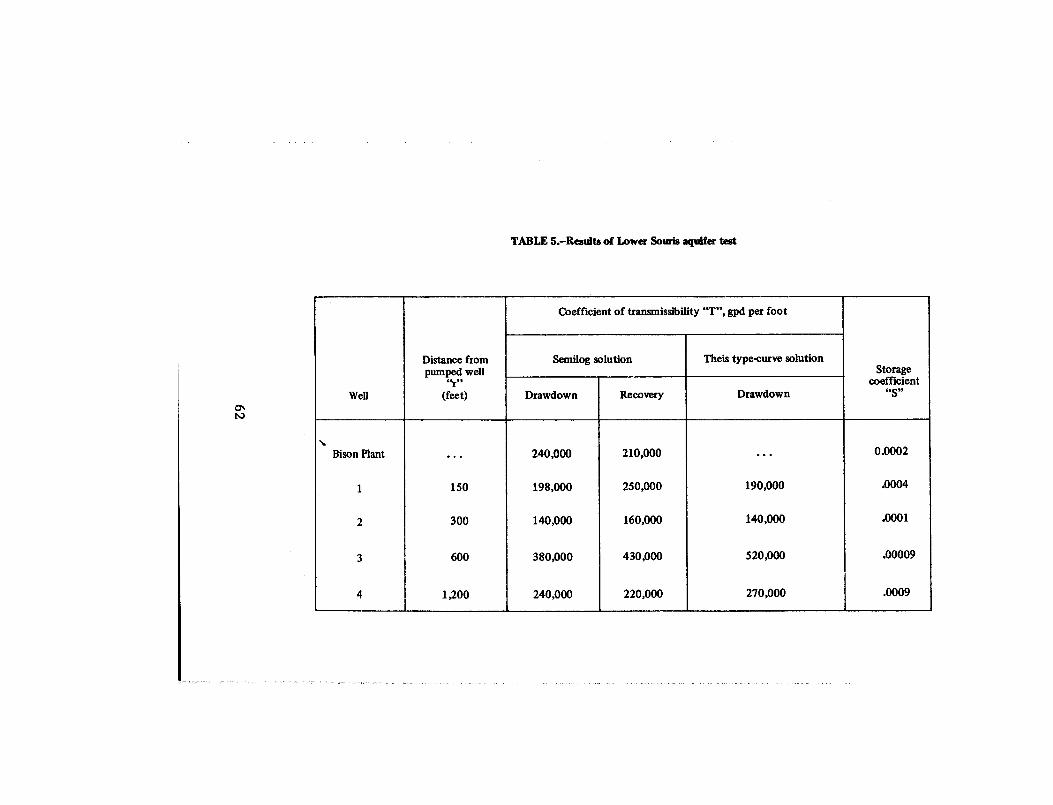
TABLE 5.-Residts of Lower Souris aquifer tes t
Coefficient of transmissibility "T", gpd per foot
Well
Distance frompumped well
•y '(feet)
Semilog solution Theis type-curve solutionStorage
coefficientDrawdown Recovery Drawdow n
Bison Plant . . . 240,000 210,000 . . . 0 .0002
1 150 198,000 250,000 190,000 .0004
2 300 140,000 160,000 140,000 .000 1
3 600 380,000 430,000 520,000 .00009
4 1,200 240,000 220,000 270,000 .0009
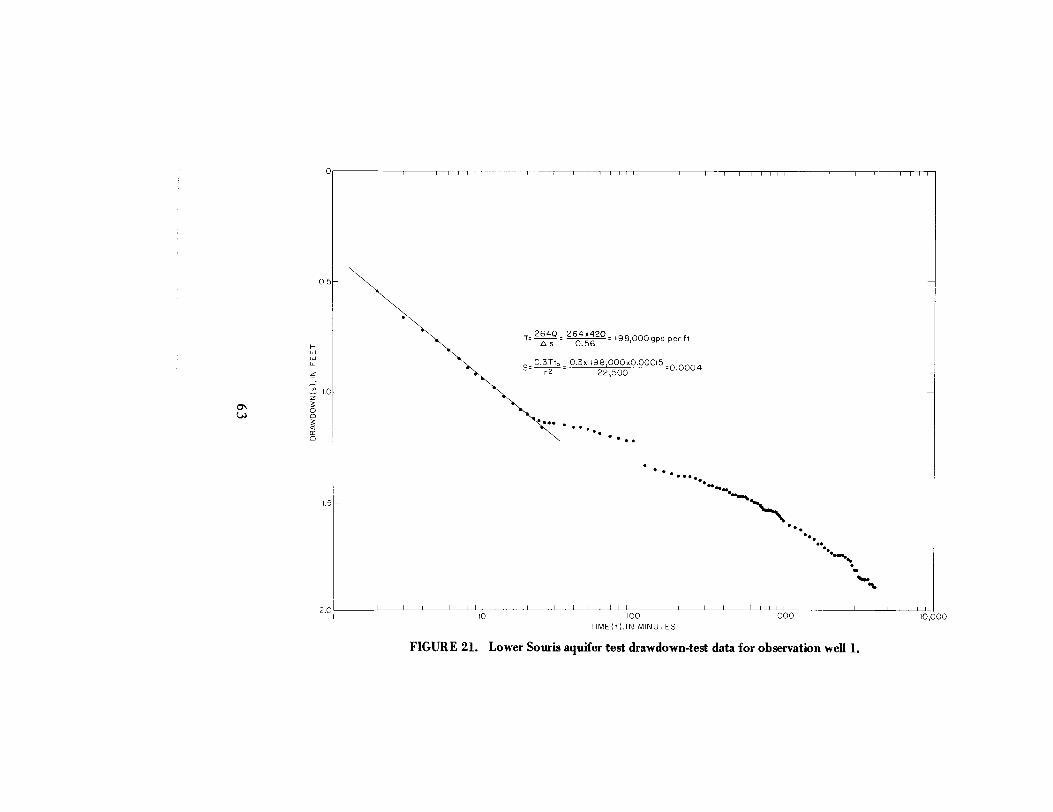
0
0. 5
1 . 5
2 .0 'c oTIME(t),IN MINUTES
I I I I I I I1000
10,00 0
FIGURE 21 . Lower Souris aquifer test drawdown-test data for observation well 1 .
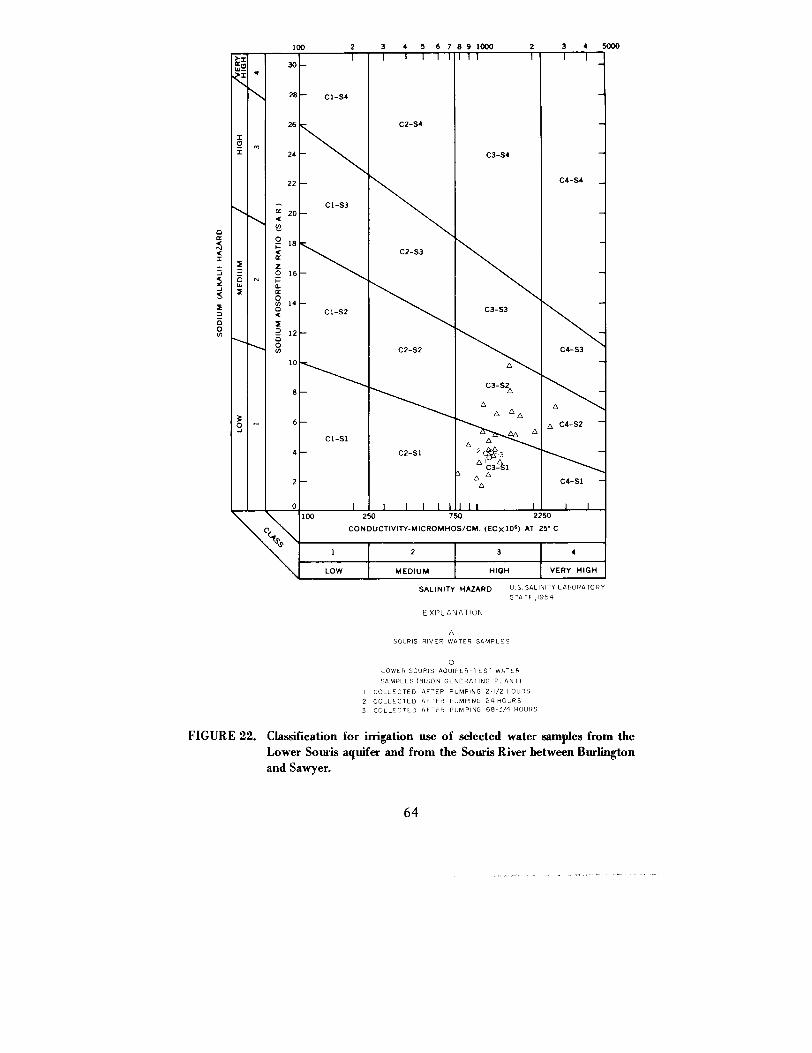
100
2
3
4 5 6 7 8 9 1000
2
3
4
5000
r= I I
I
I
1
1 1
1
1
I I
I
JW\~\\
30
28 C1-S4
26 C2-S4
S
=m
24 C3-S4
22 C4-S4
2 0
~
1 6
ZO
6w
N rycc
1 4O
5
1 20O
10 A
8 •
3O .- 6
4
C1-S1
C2-S1
pp
%; 3
p C3-S 16
p2 Q C4-S 1
0 I 1
I
I
1
I I
I
I
I I
I100
250
750
225 0
De1S
CONDUCTIVITY-MICROMHOS/CM . (ECX10°) AT 25' C
1 2 3 4
LOW MEDIUM HIGH VERY HIGH
SALINITY HAZAR D
EXPLANATIO N
ASOURIS RIVER WATER SAMPLES
U .S . SALINITY LABORATOR YS TA FF,195 4
0LOWER SOURIS AQUIFER-TEST WATE RSAMPLES (BISON GENERATING PLANT )
COLLECTED AFTER PUMPING 2-1/2 HOUR S2 COLLECTED AFTER PUMPING 24 HOUR S3 COLLECTED AFTER PUMPING 68-3/4 HOUR S
FIGURE 22 . Classification for irrigation use of selected water samples from th eLower Souris aquifer and from the Souris River between Burlingto nand Sawyer.
64
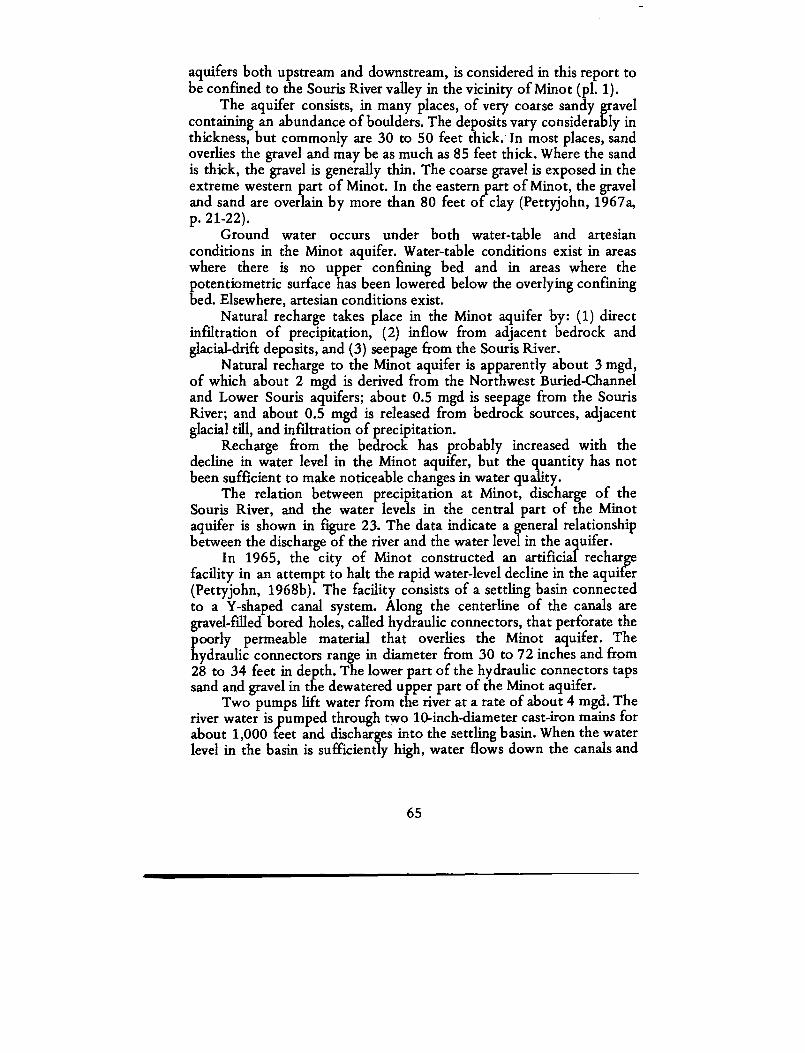
aquifers both upstream and downstream, is considered in this report tobe confined to the Souris River valley in the vicinity of Minot (p1 . 1) .
The aquifer consists, in many places, of very coarse sandy grave lcontaining an abundance of boulders. The deposits vary considerably inthickness, but commonly are 30 to 50 feet thick . In most places, sandoverlies the gravel and may be as much as 85 feet thick . Where the sandis thick, the gravel is generally thin . The coarse gravel is exposed in theextreme western part of Minot . In the eastern part of Minot, the grave land sand are overlain by more than 80 feet of clay (Pettyjohn, 1967a ,p. 21-22) .
Ground water occurs under both water-table and artesianconditions in the Minot aquifer . Water-table conditions exist in areaswhere there is no upper confining bed and in areas where the
Eotentiometric surface has been lowered below the overlying confinin ged. Elsewhere, artesian conditions exist .
Natural recharge takes place in the Minot aquifer by : (1) directinfiltration of precipitation, (2) inflow from adjacent bedrock andglacial drift deposits, and (3) seepage from the Souris River .
Natural recharge to the Minot aquifer is apparently about 3 mgd ,of which about 2 mgd is derived from the Northwest Buried-Channeland Lower Souris aquifers ; about 0.5 mgd is seepage from the SourisRiver ; and about 0 .5 mgd is released from bedrock sources, adjacen tglacial till, and infiltration of precipitation.
Recharge from the bedrock has probably increased with thedecline in water level in the Minot aquifer, but the quantity has no tbeen sufficient to make noticeable changes in water quality .
The relation between precipitation at Minot, discharge of th eSouris River, and the water levels in the central part of the Mino taquifer is shown in figure 23. The data indicate a general relationshipbetween the discharge of the river and the water level in the aquifer .
In 1965, the city of Minot constructed an artificial rechargefacility in an attempt to halt the rapid water-level decline in the aquife r(Pettyjohn, 1968b) . The facility consists of a settling basin connecte dto a Y-shaped canal system. Along the centerline of the canals ar egravel-filled bored holes, called hydraulic connectors, that perforate th epoorly permeable material that overlies the Minot aquifer . Thehydraulic connectors range in diameter from 30 to 72 inches and fro m28 to 34 feet in depth . The lower part of the hydraulic connectors tap ssand and gravel in the dewatered upper part of the Minot aquifer .
Two pumps lift water from the river at a rate of about 4 mgd . Theriver water is pumped through two 10-inch-diameter cast-iron mains fo rabout 1,000 feet and discharges into the settling basin . When the waterlevel in the basin is sufficiently high, water flows down the canals an d
65
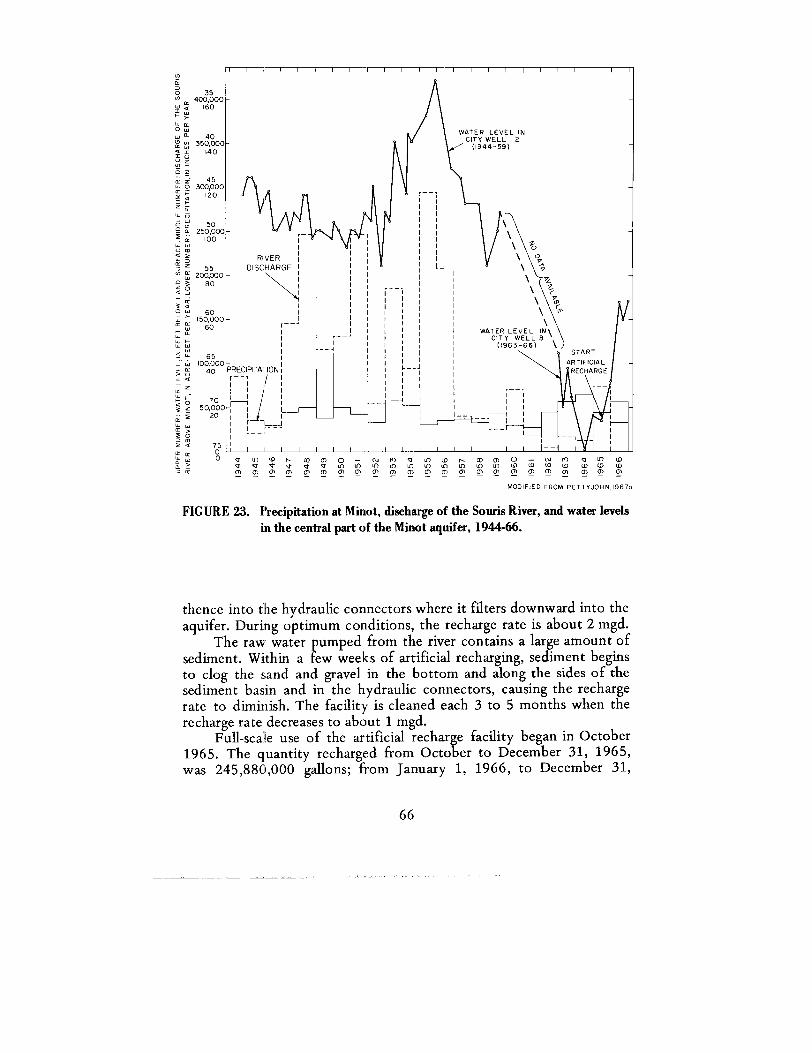
0•
35 I. 400,000.hi w 160r y
mo wwm mo:w
i <1',UV! -q Z
Z 45w o 300,00 0m r
12 0
4 0350,000
14 0
50250,000
10 0
5 5200,000
• 8 0
60150,00 0
6 0
6 5100,00 0
4 0
7 050,000
2 0
7 50
•0
P- RECIPITATIO Nf -
, 'I
1
LJ
--
1
I I IIn (D F- (0 0) O - N rn v U )
v v v a v R (n (n u) 0) u) v)
T 0) rn m m m m m rn m m o)
\ \
1
WATER LEVEL IN \CITY WELL 8
(1963-66)e STAR T
ARTIFICIA LRECHARG E
f--1(0 F- co O O - N n
U) U) U) a) a) a) a)m 0) 0) m 0) o) o) o)
com
a)m
a)m
MODIFIED FROM PETTYJOHN,1967o
FIGURE 23. Precipitation at Minot, discharge of the Souris River, and water levelsin the central part of the Minot aquifer, 1944-66 .
thence into the hydraulic connectors where it filters downward into theaquifer . During optimum conditions, the recharge rate is about 2 mgd.
The raw water pumped from the river contains a large amount o fsediment . Within a few weeks of artificial recharging, sediment begin sto clog the sand and gravel in the bottom and along the sides of th esediment basin and in the hydraulic connectors, causing the recharg erate to diminish. The facility is cleaned each 3 to 5 months when th erecharge rate decreases to about 1 mgd.
Full-scale use of the artificial recharge facility began in October1965 . The quantity recharged from October to December 31, 1965 ,
was 245,880,000 gallons; from January 1, 1966, to December 31 ,
66
1966, was 478,344,250 gallons ; and from January 1, 1967, to April 7 ,1967, was 51,589,000 gallons, for a total of three-quarters of a billio ngallons during the 18-month period of operation .
The water recharged resulted in a substantial water-level ris ethroughout the aquifer, but particularly in the vicinity of the recharg esystem where the rise was more than 15 feet (figs . 24 and 25) .
During 1966, approximately a billion gallons was added to th eMinot aquifer by natural recharge and 500 million gallons by artificia lrecharge. Approximately 850 million gallons was withdrawn from th eaquifer by municipal pumping. Thus, the net increase in ground-waterstorage was nearly 650 million gallons .
Ground water is principally discharged from the Minot aquifer bypumping wells. Water loss by evapotranspiration from the aquifer isnegligible. The aquifer probably does not discharge ground water t ostreams under present conditions.
Pumpage for municipal water supplies at Minot from 1944 t o1966 is shown in figure 26 . The annual pumpage rate has more thanquadrupled since 1944. In general, the greatest pumpage from the wel lfield is during June, July, and August . During this period in 1963, theaverage pumpage from municipal wells was nearly 5 mgd, but itexceeded 7 mgd during short intervals. The least pumpage is duringJanuary, February, and March ; in 1964 it averaged about 3 .3 mgdduring this period (Pettyjohn,1967a, p. 36-38) .
Water levels in the Minot aquifer reportedly declined rapidly at th eclose of 1961 following the construction and subsequent heav ypumping from city wells 11-18 . A general trend toward equilibrium isindicated on hydrographs from the early winter of 1963 through th espring of 1965 (fig . 24). This trend is probably the result of decrease dpumping during fall and winter and of the large municipal withdrawal sdirectly from the Souris River . The rapid rise of the water level startingin May 1965 is the result of artificial recharge .
City wells 5 and 6 are in the deeper eastern part of the aquifer ,and even though they have been heavily pumped for nearly 20 years ,the water level has declined less than in wells in the western part of thecity. This is probably because of their nearness to large sources ofnatural recharge .
The available data indicate that under natural conditions theMinot aquifer can supply about 3 .0 mgd without a substantial declineof water level .
Transmissibilities of the Minot aquifer are shown in table 6 . Thedata from Akin (1947) were the most accurately determined, but theydo not reflect the conditions in 1966 because the water level in th eaquifer has declined nearly 20 feet since the tests were run in 1946 .Transmissibilities determined by development- and production-test dat a
67
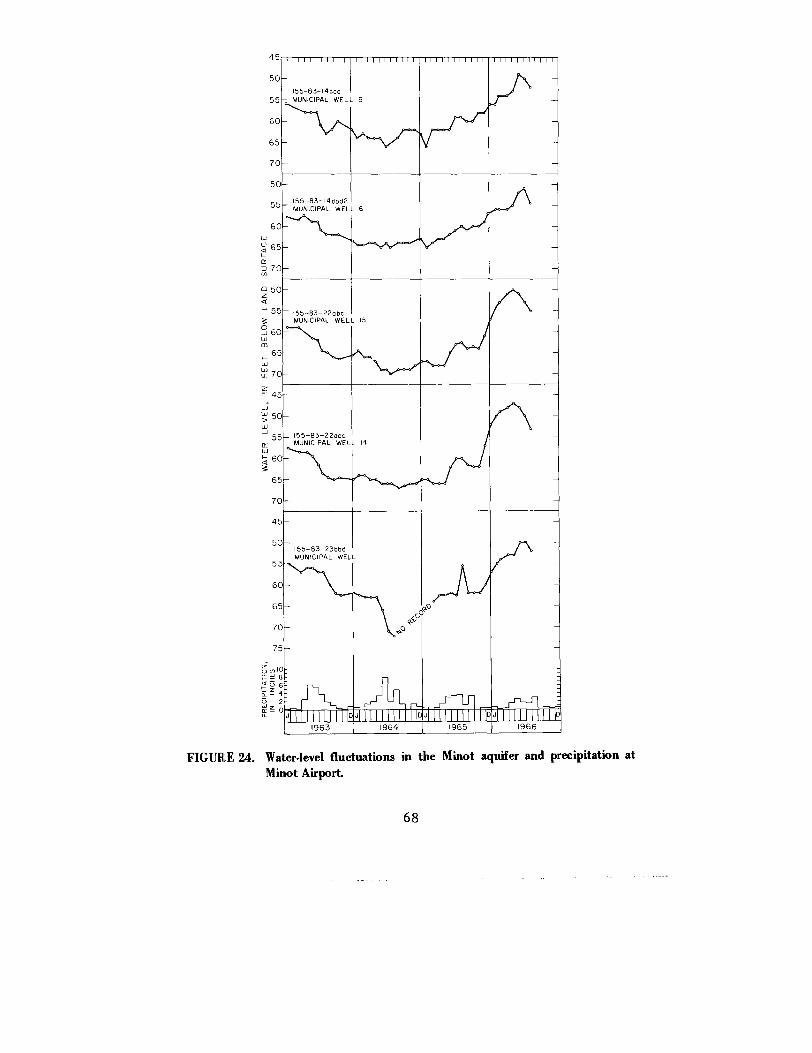
4 5
155-83-14dc o
1111111111
III
IIII
I
I
I
I
11I1111111I
111111111 1
MUNICIPAL WELL 9
MUNICIPAL WELL 6— 155-83-14ddd2
_
— 155-83-22obc
—
5 4
-
0
—
MUNICIPAL WELL 1 5
MUNICIPAL WELL I U
5-
-
0
-
5— 155-83-22occ
—
155-83-23bb dMUNICIPAL WELL
I
LO
i—
—
PO
—
3-
—
rr
Ir^
~n
I
II
1
1
1
1
1
1
0 , I
II
I
I
II
I
IDJ
I
I
I
I
I
I
I
I.,
I
I
I
I
l
l
I
I
I.
1963
1964
1965
1966
FIGURE 24 . Water-level fluctuations in the Minot aquifer and precipitation at
Minot Airport.
5 0
5 5
6 0
6 5
7 0
5 0
5 5
6 0w
6 5
7m
z 5 0a'- ' 5 5
60a)U)1- 6wLL1LL. 7
4
w- 5Si
5
W
6
6
7
4
5
5
6
6
7
7
68
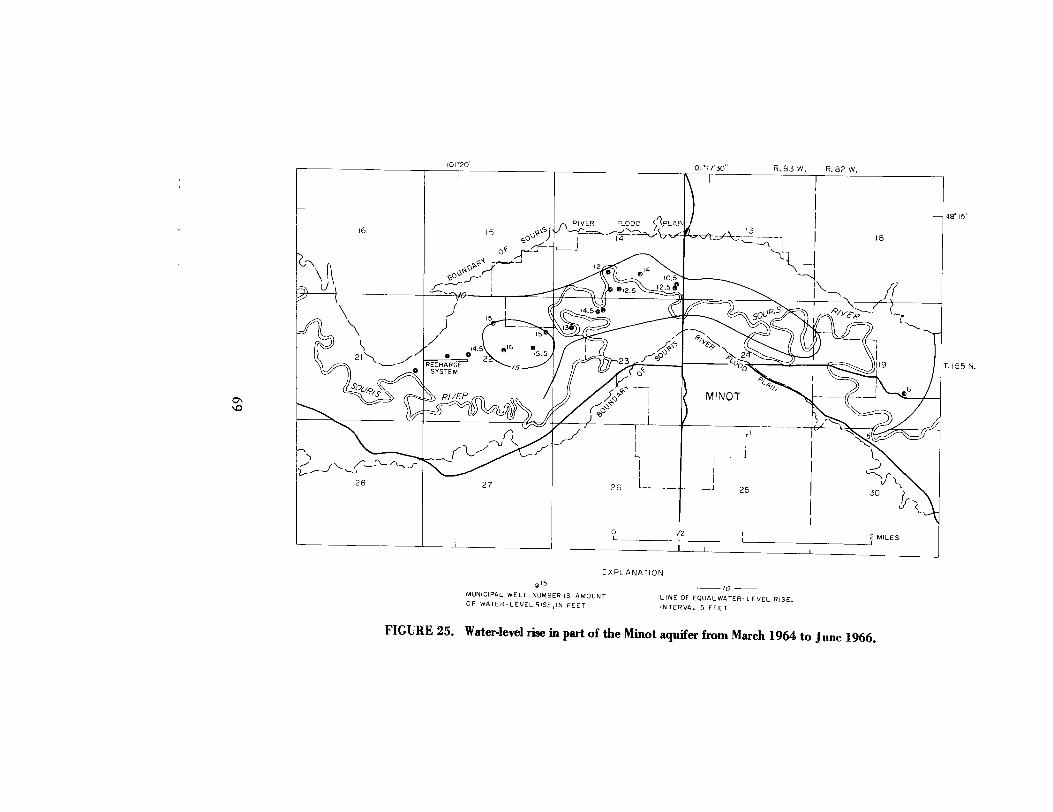
101°20 '
6
i
1
15
JP~SI
nRIVER
FLOOD
< `?LA!N Is.p--'_ 4 ~=-~A,<f
PP rv ,\
I
rd},/
r . CST VV .
18
/l-yj~
9p
ay
0
9
J~pv .
y
~ II
J
12l\/i
0 14
e .4
125 0
\~-XL
2
O
~
15 I _
tC~
J
15'
vW14.5
a ls
® 1
/ P
\
s
yOJ
VFq \ [
wp,̀®\/5~RECHARG ESYSTEM
I TV
O ly
SOUSRIVER fpPP M
p~giN
INO T
/ eo
I
"xi
28 27 26
---- - -~
25 300
O
V,2I
2 MILE S~ I
EXPLANATION
48° 15 '
.155 N .
@ 1 5
MUNICIPAL WELL . NUMBER IS AMOUN TOF WATER-LEVEL RISE,IN FEET
/0LINE OF EQUAL WATER-LEVEL RISE.INTERVAL 5 FEE T
FIGURE 25 . Water-level rise in part of the Minot aquifer from March 1964 to June 1966 .
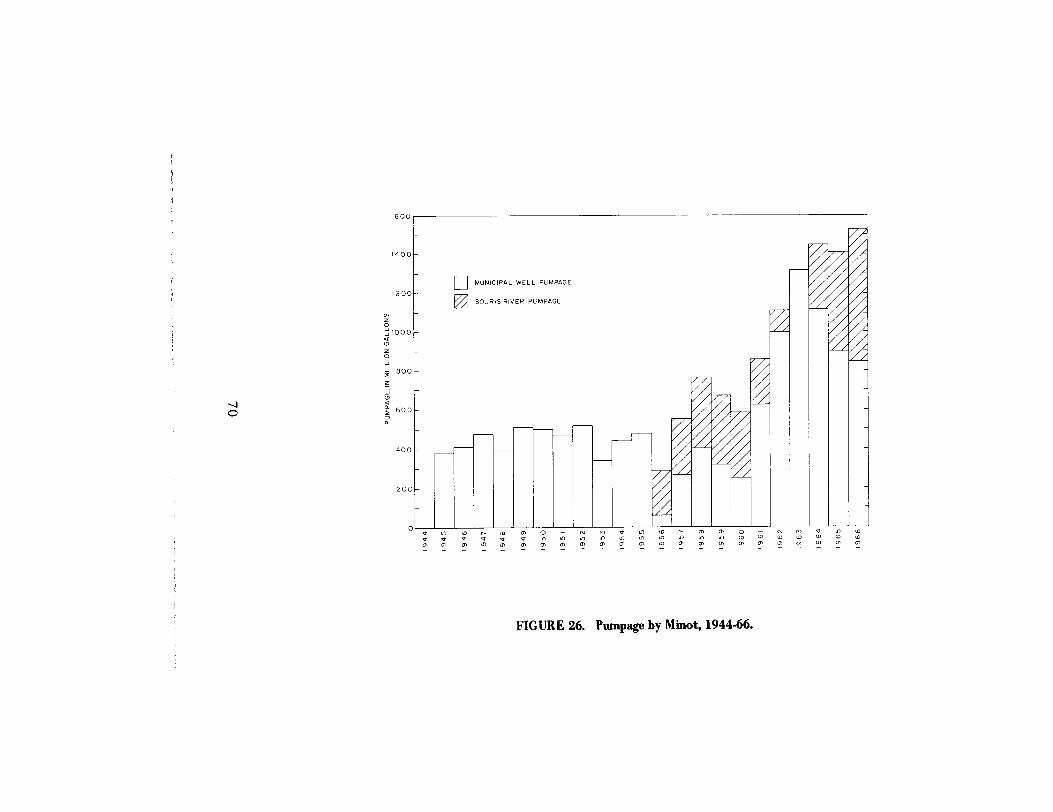
u,z0j 100 0
0z0
80 0
140 0
1200SOURIS RIVER PUMPAG E
MUNICIPAL WELL PUMPAGE
'J0 60 0
40 0
200
a
m
m m 0
0 0 0
m m 0 —
0 N Ca a a a a a
Jl 0
0 m 0 (0 m ~0 m to
m °'
m m m
Q1a+ m m m m o+ m m
o+ m m m o+ m m m m
FIGURE 26. Pumpage by Minot, 1944-66 .
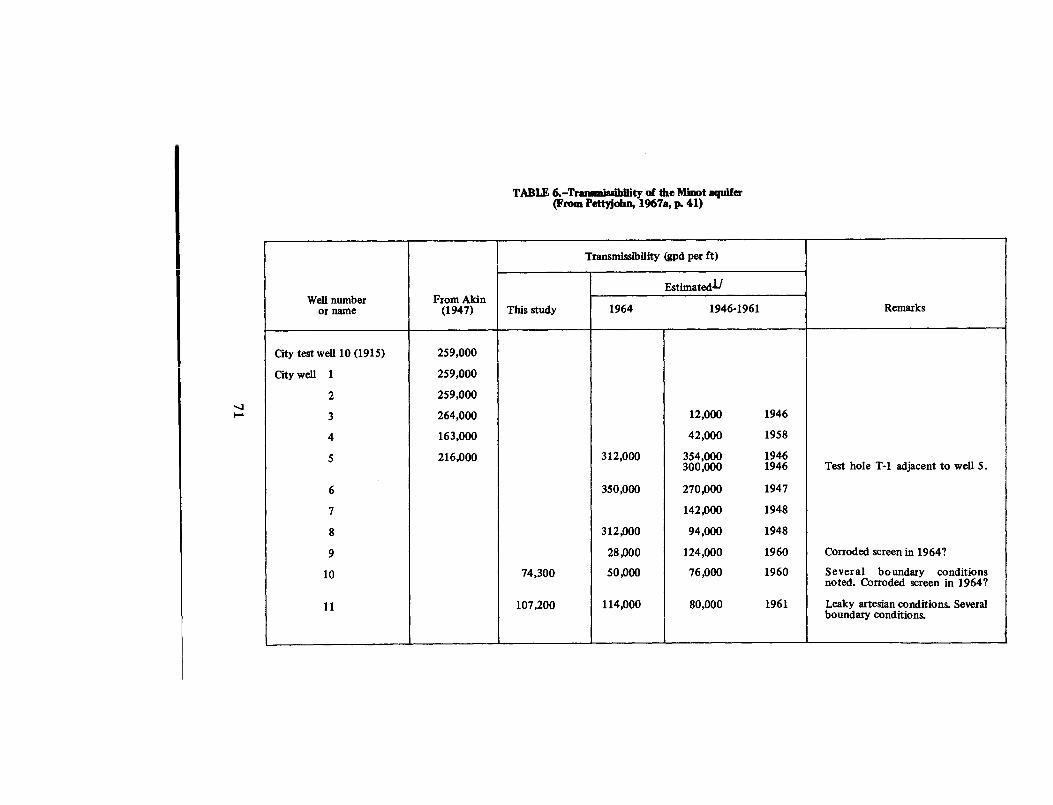
TABLE 6. Transmissbiity of the Minot aquifer(From Pettyjohn, 1967a, p . 41)
I Transmissibility (gpd per ft )
Estimated ./Well number
or nameFrom Akin
(1947) This study 1964
1946-1961 Remarks
City test well 10 (1915) 259,00 0
City well
1 259,000
2 259,000
3 264,000 12,000
194 6
4 163,000 42,000
195 8
5 216,000 312,000 354,000
194 6300,000
1946 Test hole T-1 adjacent to well 5 .
6 350,000 270,000
194 7
7 142,000
194 8
8 312,000 94,000
194 8
9 28,000 124,000
1960 Corroded screen in 1964 ?
10 74,300 50,000 76,000
1960 Several
boundary
conditions
11 107,200 114,000 80,000
1961
noted . Corroded screen in 1964 ?
Leaky artesian conditions . Severa lboundary conditions.
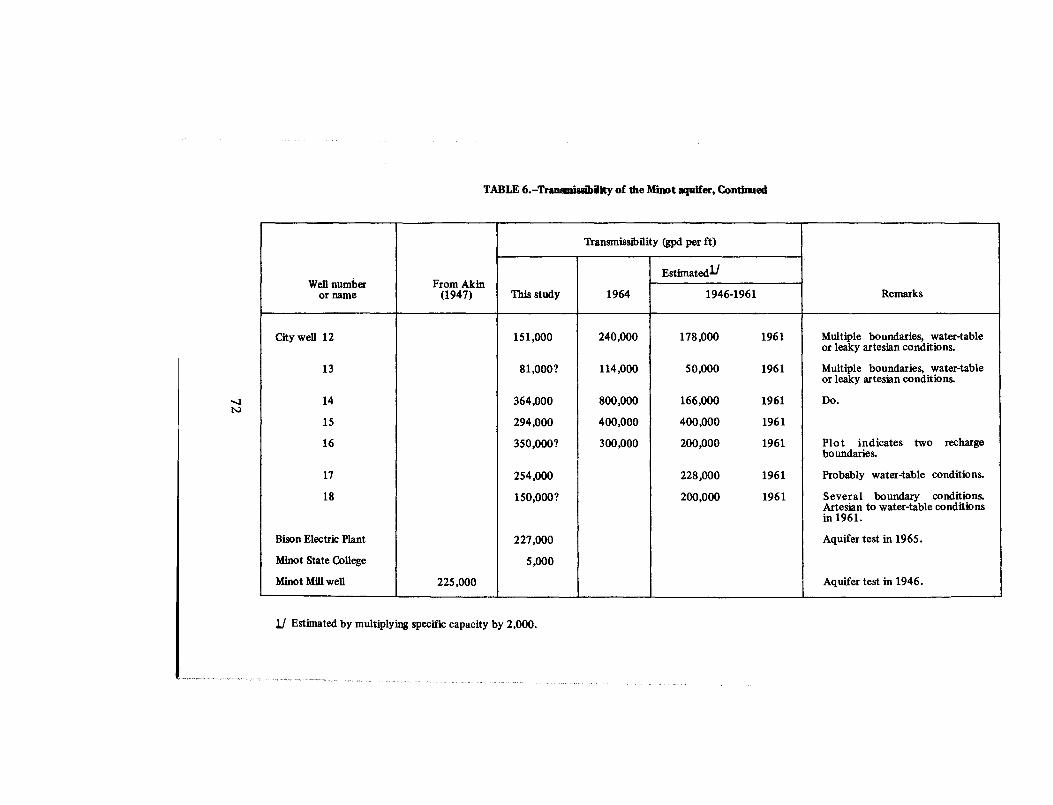
TABLE 6 .-Transmissib ity of the Minot aquifer, Continued
Transmissibility (gpd per ft)
EstimatedLWell number
or nameFrom Akin
(1947) This study 1964 1946-1961 Remarks
City well 12 151,000 240,000 178,000
1961 Multiple boundaries, water-table
13 81,000? 114,000 50,000
1961
or leaky artesian conditions.
Multiple boundaries, water-table
14 364,000 800,000 166,000
1961
or leaky artesian conditions.
Do .
15 294,000 400,000 400,000
196 1
16 350,000? 300,000 200,000
1961 Plot
indicates
two
recharge
17 254,000 228,000
1961
boundaries.
Probably water table conditions.
18 150,000? 200,000
1961 Several
boundary
conditions.Artesian to water table conditionsin 1961 .
Bison Electric Plant 227,000 Aquifer test in 1965 .
Minot State College 5,000
Minot Mill well 225,000 Aquifer test in 1946 .
j/ Estimated by multiplying specific capacity by 2,000 .
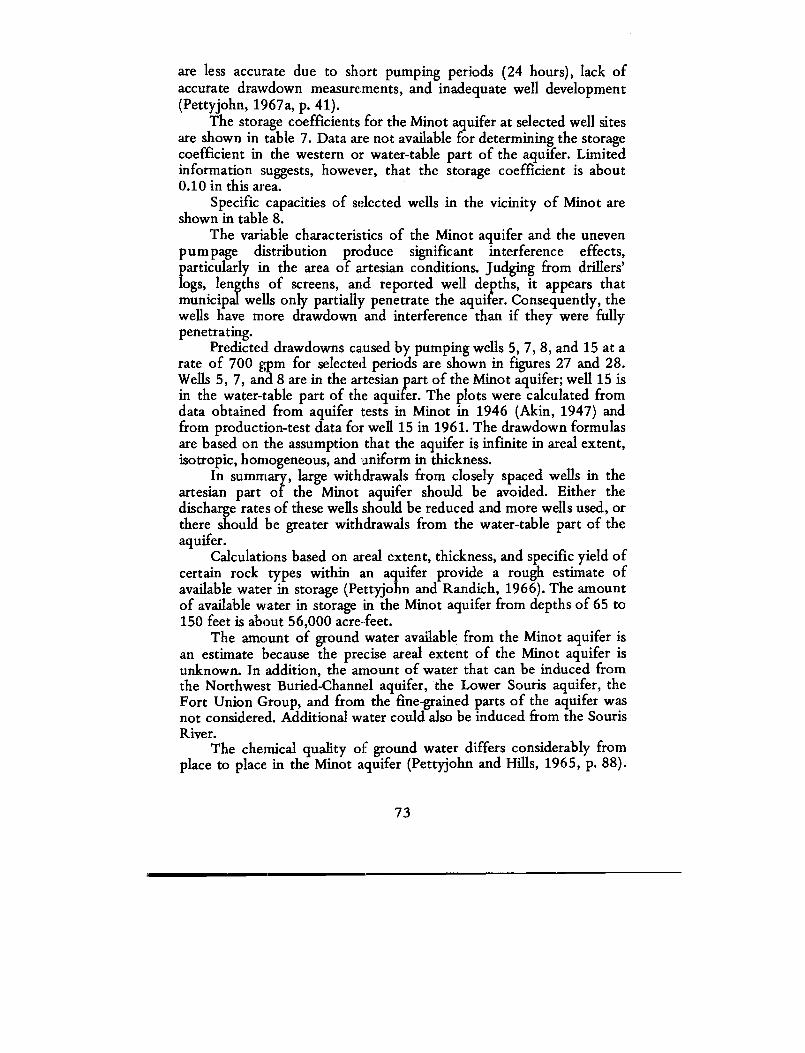
are less accurate due to short pumping periods (24 hours), lack o faccurate drawdown measurements, and inadequate well developmen t(Pettyjohn, 1967a, p. 41) .
The storage coefficients for the Minot aquifer at selected well sitesare shown in table 7 . Data are not available for determining the storag ecoefficient in the western or water-table part of the aquifer . Limitedinformation suKests, however, that the storage coefficient is about0.10 in this area.
Specific capacities of selected wells in the vicinity of Minot areshown in table 8 .
The variable characteristics of the Minot aquifer and the unevenpumpage distribution produce significant interference effects,particularly in the area of artesian conditions . Judging from drillers'logs, lengths of screens, and reported well depths, it appears tha tmunicipal wells only partially penetrate the aquifer. Consequently, th ewells have more drawdown and interference than if they were full ypenetrating.
Predicted drawdowns caused by pumping wells 5, 7, 8, and 15 at arate of 700 gpm for selected periods are shown in figures 27 and 28 .Wells 5, 7, and 8 are in the artesian part of the Minot aquifer; well 15 isin the water-table part of the aquifer . The plots were calculated fro mdata obtained from aquifer tests in Minot in 1946 (Akin, 1947) an dfrom production-test data for well 15 in 1961 . The drawdown formulasare based on the assumption that the aquifer is infinite in areal extent,isotropic, homogeneous, and uniform in thickness .
In summary, large withdrawals from closely spaced wells in th eartesian part of the Minot aquifer should be avoided . Either thedischarge rates of these wells should be reduced and more wells used, o rthere should be greater withdrawals from the water-table part of theaquifer .
Calculations based on areal extent, thickness, and specific yield o fcertain rock types within an aquifer provide a rough estimate o favailable water in storage (Pettyjohn and Randich, 1966). The amoun tof available water in storage in the Minot aquifer from depths of 65 to150 feet is about 56,000 acre-feet .
The amount of ground water available from the Minot aquifer i san estimate because the precise areal extent of the Minot aquifer i sunknown. In addition, the amount of water that can be induced fro mthe Northwest Buried-Channel aquifer, the Lower Souris aquifer, theFort Union Group, and from the fine-grained parts of the aquifer wasnot considered. Additional water could also be induced from the Souri sRiver.
The chemical quality of ground water differs considerably fro mplace to place in the Minot aquifer (Pettyjohn and Hills, 1965, p . 88) .
73
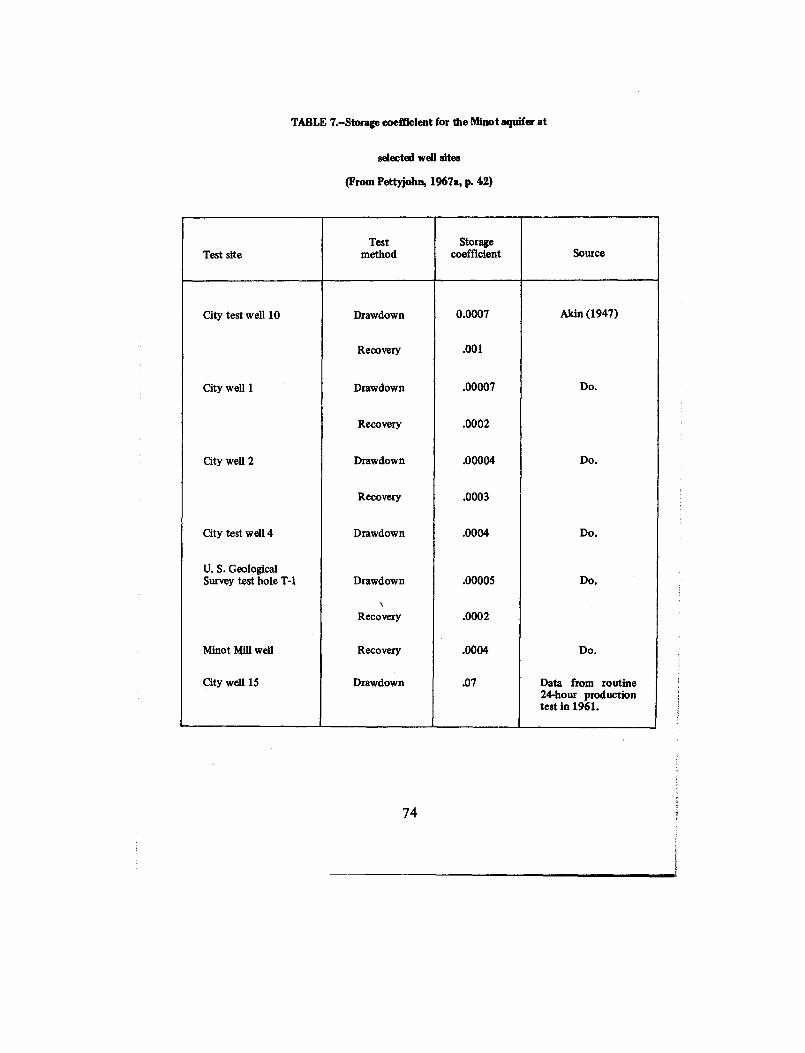
TABLE 7.-Storage coefficient for the Minot aquifer a t
selected well sites
(From Pettyjohn, 1967a, p . 42)
Test siteTest
methodStorage
coefficient Source
City test well 10 Drawdown 0 .0007 Akin (1947)
Recovery .00 1
City well 1 Drawdown .00007 Do .
Recovery .0002
City well 2 Drawdown .00004 Do .
Recovery .0003
City test well 4 Drawdown .0004 Do .
U. S . GeologicalSurvey test hole T-1 Drawdown .00005 Do .
Recovery .0002
Minot Mill well Recovery .0004 Do .
City well 15 Drawdown .07 Data from routine24-hour productio ntest in 1961 .
74
TABLE 8 .-Specific capacities of selected wells in the vicinity of Minot(From Pettyjohn, 1967a, p. 42 )
Specific capacity (gpm per foot drawdown)
Well numberor name
Estimated196411
Productiontests11
Akin(1947)
Minot city well 4 13 2 1
Minot city well 5 156 177 15 0
Minot city well 6 175 135
Minot city well 7 7 1
Minot city well 8 156 4 7
Minot city well 9 14 6 2
Minot city well 10 25 3 8
Minot city well 11 57 4 0
Minot city well 12 120 8 9
Minot city well 13 57 2 5
Minot city well 14 400 53 3
Minot city well 15 200 200
Minot city well 16 150 100
Minot city well 17 11 4
Minot State College well 3 .3
11 Data for Minot city wells estimated from airline gage under static conditions and afte r13 hours pumping . Data for Minot State College from M. Williams .
11 Calculations from routine 24-hour production pumping tests. Data from Minot Cit yEngineer .
75
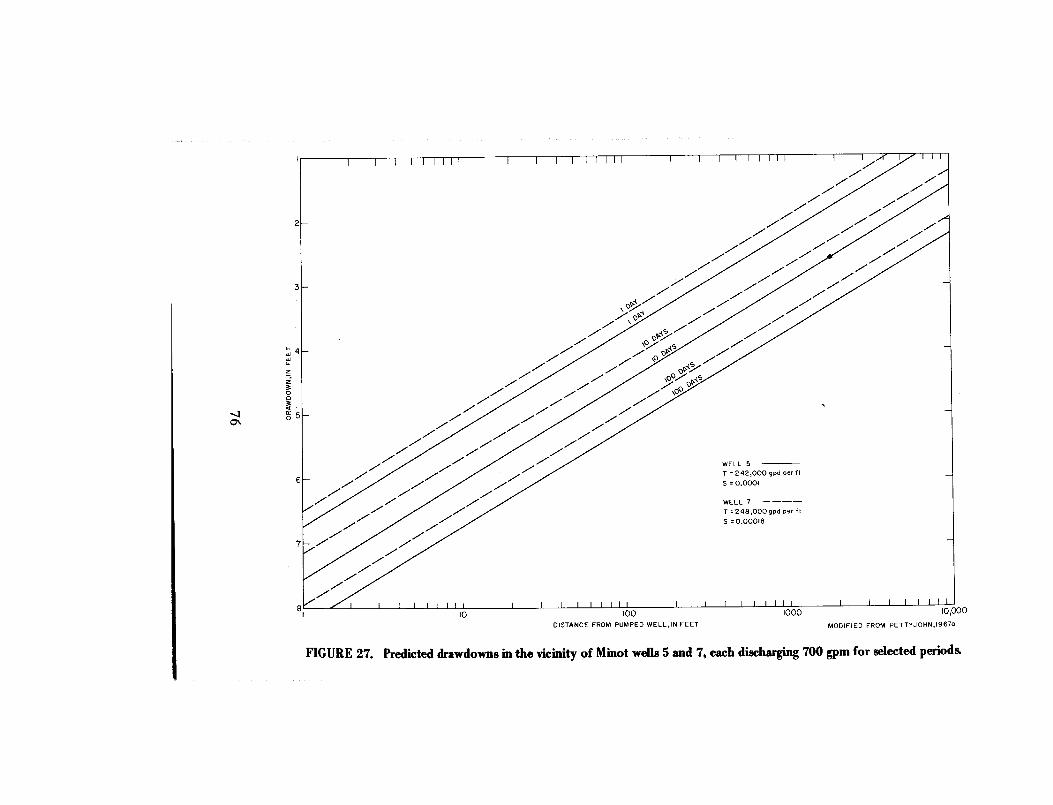
FIGURE 27. Predicted drawdowns in the vicinity of Minot wells 5 and 7, each discharging 700 gpm for selected periods.
10 0DISTANCE FROM PUMPED WELL,IN FEET
10,00 0
MODIFIED FROM PETTYJOHN,19670
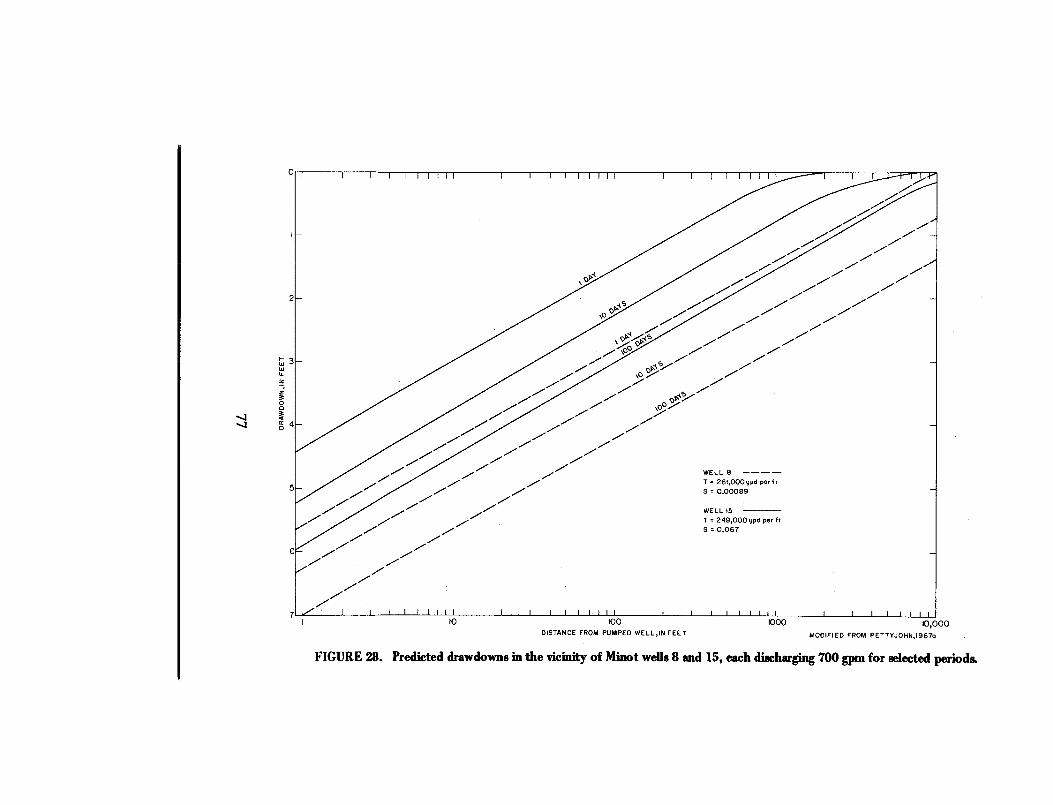
WELL 8 ----T = 261,000 gpd per ftS = 0 .0008 9
WELL 1 5T = 249,000 ypd per f tS = 0 .06 7
10
I 1
10 0DISTANCE FROM PUMPED WELL,IN FEET
I
I
I1000
10,000MODIFIED FROM PETTYJOHN,I967a
FIGURE 28 . Predicted drawdowns in the vicinity of Minot wells 8 and 15, each discharging 700 gpm for selected periods .
The geochemistry is very complex because the aquifer consists ofseveral interconnected beds that vary in composition and grain size . Inaddition, the interpretation of the water quality is made more comple xby the mixing of waters of different chemical characteristics, bas eexchange, ion absorption, and changes in chemical equilibrium becaus eof changes in hydrostatic pressure .
Generally, water from the Minot aquifer is a hard sodiu mbicarbonate type, but calcium or magnesium may be the dominantcation in some areas . Among the municipal wells, the hardness rangedfrom 44 to 590 ppm. The sulfate ranged from 26 to 225 ppm. The ironcontent in water from the Minot aquifer commonly was high, rangingfrom 0.13 to 3.6 ppm. The chloride content in city wells 5, 6, 9, 10,
and the Minot State College well was relatively high ; the concentration sranged from 137 to 338 ppm. The concentration of dissolved solids i nground water in the Minot area ranged from 529 to 1,570 ppm(Pettyjohn and Hills, 1965, table 4) .
The Minot aquifer can be subdivided into at least four parts thatyield water of different chemical composition (fig . 29) .
In area A, water has higher proportions of sodium plus potassiu mand bicarbonate than other municipal wells . In addition, the water isbrown because of leaching of lignite in the aquifer and in the For tUnion Group .
In area B, the water also has a higher sodium plus potassium ,bicarbonate, and chloride concentration than most of the othe rmunicipal wells . The wells are probably recharged predominantly fro mthe south and southwest and from the underlying Fort Union . Lignit efragments in this part of the aquifer give a slight brownish color to th ewater .
Area C is in the western part of Minot where the aquifer i spredominantly sand . The generally low dissolved-solids content of th ewater and other chemical characteristics of ground water from this area ,when compared with surface-water analyses, suggest that recharge i sfrom direct infiltration of precipitation and from the Souris River.
Water from area D contains more dissolved solids, chloride ,magnesium, and sulfate but less sodium plus potassium and bicarbonat ethan the other areas. The chloride concentration is considerably greate rthan in water from the other municipal wells . Water of high chlorideconcentration moves southeastward from the Northwes tBuried-Channel aquifer and recharges the Minot aquifer in the vicinityof wells 5, 6, 9, and 10. The low sodium plus potassium content of th ewater in area D indicates little or no recharge from the Fort Unio nGroup.
78
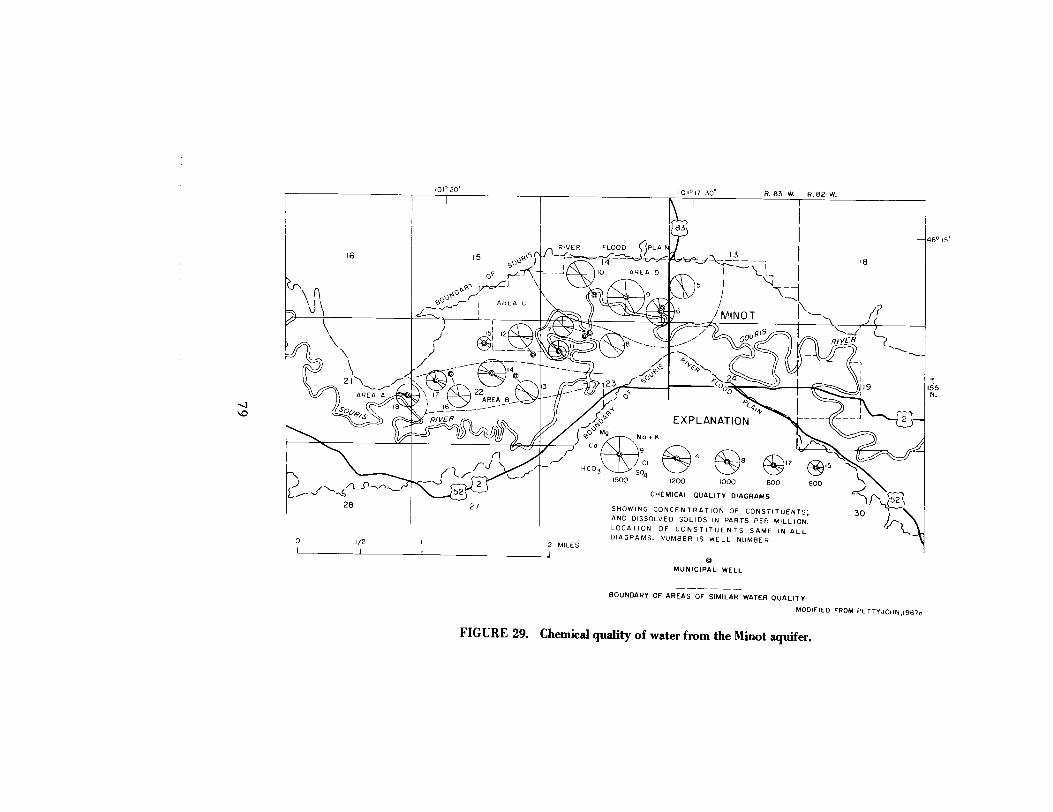
101°2 0 ' 101° 17 ' 30'
R .83 W.
R .82 W .
8348°15 '
16
RIVER
FLOOD
`PLAI N
1 4
10
AREA D1 8
pUFis
Is -l~ l
BOUNDARY OF AREAS OF SIMILAR WATER QUALIT YMODIFIED FROM PETT YJOHN,1967a
FIGURE 29. Chemical quality of water from the Minot aquifer .
28
I
21\—l
AREA A
~~-m
7
- 11_-IB*
16
--R/VER
27
AREA B
2 MILES
fOP
00 Mg
Na ECo %
HCO 3 -10
41500
1200
1000
800
600CHEMICAL QUALITY DIAGRAM S
SHOWING CONCENTRATION OF CONSTITUENTS ;AND DISSOLVED SOLIDS IN PARTS PER MILLION.LOCATION OF CONSTITUENTS SAME IN AL LDIAGRAMS . NUMBER IS WELL NUMBE R
123
OF
rOJT\
5
5
9CI
EXPLANATI< 4j
O N
IDMUNICIPAL WEL L
q..LFH~
„
2 4000
/MINO T
SouRIS
Alllk`O 17 AT. v
-4
T.155N .
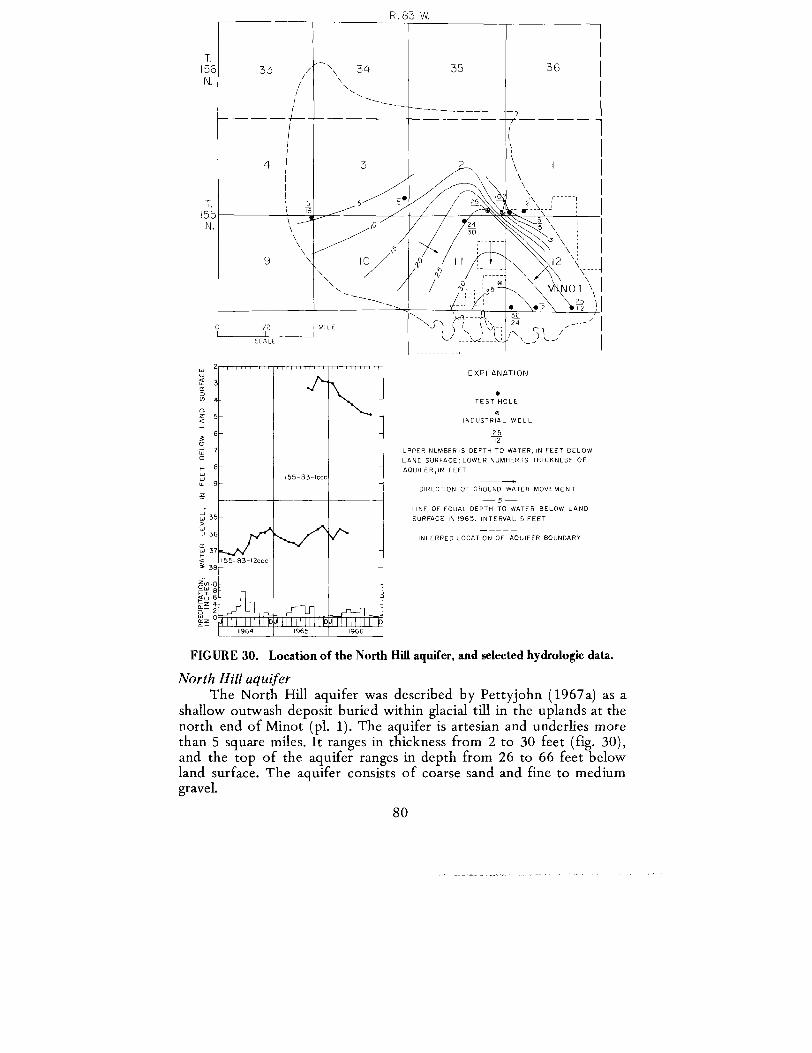
R .83 W.
33
~/ '\
34 35 3 6
---- I --- ---- ----
i
I4 3 \
\\
5 5n
,,I
,,i
\6 X
r
O
\3240
3
\
\
\
9 1 HIti° 12
\ q\ --- -
\ : 3 5~ NOT \ \\
5♦1 26
112
I
MILE f I
1
I\
1\vl\
c8 1rSCALE -\—
-- \__
Li
ii'96
~~~~sDI ~~
ID~~~~IIIIII11lill~~i I% 6
FIGURE 30 . Location of the North Hill aquifer, and selected hydrologic data .
North Hill aquiferThe North Hill aquifer was described by Pettyjohn (1967a) as a
shallow outwash deposit buried within glacial till in the uplands at th enorth end of Minot (pl. 1) . The aquifer is artesian and underlies mor ethan 5 square miles . It ranges in thickness from 2 to 30 feet (fig . 30) ,and the top of the aquifer ranges in depth from 26 to 66 feet belo wland surface . The aquifer consists of coarse sand and fine to mediu mgravel
T.
15 6N .
T.15 5
N .
20LL 3
~n•
q
0z 5a
•6
0Edm
8
u. 9
35
-.1 36ccw 37aW 3 8
r 3 6au 6az 4• 2¢z 0
UPPER NUMBER IS DEPTH TO WATER, IN FEET BELO WLAND SURFACE ;LOWER NUMBER IS THICKNESS O FAQUIFER,IN FEE T
DIRECTION OF GROUND-WATER MOVEMEN T
5LINE OF EQUAL DEPTH TO WATER BELOW LAN DSURFACE IN 1965 . INTERVAL 5 FEE T
INFERRED LOCATION OF AQUIFER BOUNDAR Y
OO
INDUSTRIAL WEL L
EXPLANATIO N
TEST HOL E
2 512
80
The potentiometric surface in the North Hill aquifer slopes towar dthe south and water from- the aquifer is discharged in a zone of spring sand seeps along the north wall of the Souris River valley . The wate rlevel ranges from 2 to 37 feet below land surface, as shown in th ewater-level map and in the hydrographs of test holes 155-83-1ccc and155-83-12cccl (fig . 30) .
The North Hill aquifer provides small quantities of water to sixdomestic and industrial wells . The deepest well (155-83-2ddc2) i sreported to be 60 feet deep, and the shallowest well (155-83-2dad) i sreported to be 32 feet deep (Pettyjohn and Hills, 1965, p . 12-13) . Theaverage depth of the wells is 47 feet .
Water from well 155-83-lccc in the North Hill aquifer was acalcium sulfate type. It was high in dissolved solids (3,430 ppm) ,hardness (1,840 ppm), and sulfate (2,300 ppm) .
Additional information is needed to determine the areal extent ,thickness, and hydraulic characteristics of the North Hill aquifer . Thehigh sulfate concentration in the water, the abrupt changes in thickness,and the small amount of natural recharge suggest that this aquifer doe snot have a large potential for future development .
Northwest Buried-Channel aquiferThe Northwest Buried-Channel aquifer consists of buried outwash
sand and gravel that extends northwestward from the central part o fMinot (pl . 1) . The outline of the aquifer is not well known and mayextend southward toward the South Hill aquifer . The channel mayexceed 1½ miles in width, but is partly filled with clay and till . Theaquifer, which is artesian, is probably less than a mile in width. There isno indication of this aquifer at the land surface .
Six test holes were drilled in the Northwest Buried-Channe laquifer north of Minot . One hundred and five feet of saturated sandand gravel was penetrated in test hole 155-83-12ccc from 220 to 32 5feet (Pettyjohn and Hills, 1965, p. 29) . Test hole 155-83-9aaa2penetrated 27 feet of gravel from 235 to 262 feet . Test hole155-83-4aaa penetrated 37 feet of sand, gravel, and boulders at the bas eof the glacial drift at depths of 393 to 430 feet . Only 10 feet of grave lwas encountered in the lower part of the glacial drift in test hol e156-83-29ddd. Test holes 155-83-14dba and 155-83-14dbb (Pettyjoh nand Hills, 1965, p. 34-35), on the campus of Minot State College ,penetrated the Northwest Buried-Channel aquifer near its connectio nwith the Minot aquifer.
The lithologic logs of the well and test holes on the college campu sshow considerable changes in lithology and thickness within shor tdistances in the Northwest Buried-Channel aquifer . None of these wellswere more than 400 feet apart .
81
Water levels range from 220 feet below land surface in thenorthern part of the aquifer to about 75 feet near the junction of th eNorthwest Buried-Channel aquifer and the Minot aquifer . The waterlevel near the junction is influenced by pumping from the Mino taquifer.
Ground water moves southeastward through the aquifer, toward sthe adjacent Minot aquifer . The gradient between test hole s155-83-4aaa and 155-83-12ccc is approximately 7.3 feet per mile. Thegradient between test holes 155-83-12ccc and 155-83-14dba (Pettyjohnand Hills, 1965, p . 14) is about 23 feet per mile .
Assuming the aquifer has an average width of 3,000 feet and anaverage thickness of 44 feet, approximately 5,300 acre-feet of water i sin storage per linear mile of the channel . Approximately 4,000 acre-fee tof this amount would be available to wells.
Water in the Northwest Buried-Channel aquifer generally is a har dsodium bicarbonate type ; however, chloride and sulfate ions may totalas much as 52 percent of the anions. The water was relatively high inchloride (as much as 381 ppm) and iron (as much as 0.84 ppm) ;according to Glen Berg, Superintendent of the Minot Water-TreatmentPlant, this water is less expensive and easier to treat than water fro mother parts of Minot . The water generally has a high salinity hazard anda medium to high sodium hazard (C3-S2) for irrigation .
Additional information is required to determine the areal extent ,thickness, and hydraulic characteristics of the NorthwestBuried-Channel aquifer . The quality of the water is marginal for man ypurposes. Some wells in the aquifer produce more than 500 gpm an dothers as little as 15 gpm, indicating abrupt changes in thickness an dpermeability .
South Hill aquiferThe South Hill aquifer consists mostly of sand and gravel an d
trends nearly south near the south end of Minot (pl . 1) . The aquifer liesin a buried valley that is about 1 mile wide and about 2 miles long. Thisartesian aquifer is 451 feet deep in test hole 155-83-35aaal (Pettyjoh nand Hills, 1965, p . 75) . The buried valley may represent a forme rpreglacial channel that was blocked by drift during advances of glacia lice . The aquifer may be a continuation of the northwest buried channe land trend southeastward to the Sundre Buried-Channel aquifer .
Data from Pettyjohn and Hills (1965, p. 71-72, 75) show that theaquifer varies widely in thickness . In the lower part of test hol e155-83-25ddd, 67 feet of sand and gravel was penetrated (154-189 an d356-388 feet), whereas test hole 155-83-35aaal penetrated only 9 fee tof sand and gravel (103-109 and 148-151 feet) .
82
Eleven industrial and domestic wells produce small quantities o fwater from the South Hill aquifer . The deepest well is reported to b e338 feet (155-82-31baa) and the shallowest well has a reported dept hof 170 feet (155-82-3ldca) according to Pettyjohn and Hills (1965, p .12) . The average depth of wells is 259 feet and reported water-leve ldepths are generally less than 230 feet below land surface (Pettyjohn ,1967a, p . 16) .
Water from the South Hill aquifer is a sodium bicarbonate typ eand was high in dissolved solids (1,120 to 2,005 ppm), hardness (615 t o775 ppm), iron (0.8 to 5.2 ppm), and sulfate (285 to 620 ppm)(Pettyjohn, 1967a, p. 16) . The water is in the C3-S1 and C3-S 2classifications for irrigation use .
Although additional information is required to determine the area lextent, thickness, and hydraulic characteristics of the South Hil laquifer, the poor quality of the water, the lateral variation in sand'andgravel thickness, and deep water level may exclude the South Hillaquifer from. extensive future development .
Sundre Buried-Channel aquiferThe Sundre Buried-Channel aquifer underlies the northeastern par t
of T. 154 N., R. 82 W., and is exposed in the Souris River valle ybetween Minot and Logan. It consists of fine to coarse sand and fine t omedium gravel with an abundance of lignite chips . Test hole154-82-4aad penetrated 195 feet of saturated sand and grave l(Pettyjohn and Hills, 1965, p . 23) in a terrace along the north edge o fthe Souris River valley about 3% miles southeast of Minot . The sandand gravel apparently was deposited in an ancient river valley, probablythe same valley that contains the South Hill aquifer. The valley isburied by glacial drift in most places and is 233 feet deep at th etest-hole site .
The Souris River flows across the Sundre Buried-Channel aquiferin the vicinity of test hole 154-82-4aad and probably provides rechargeto the aquifer during high river stages . Conversely, the aquifer probablydischarges into the river during low stages . Water-level fluctuations inobservation well 154-82-4aacl are shown in figure 19 .
Apparently no wells are producing water from this aquifer, but i tappears to have considerable potential. More information is neede dconcerning the extent, thickness, permeability, and quality of water inthe aquifer before its full potential can be determined.
Water in the Sundre Buried-Channel aquifer is a sodiumbicarbonate type (Pettyjohn and Hills, 1965, p . 88). The concentration sof individual chemical components, except iron, are within the limit srecommended for drinking water by the U .S . Public Health Service(1962), although the water did contain as much as 800 ppm dissolved
83
solids . Because the water has a high salinity hazard and a low sodiu mhazard (C3-S1), it can be used satisfactorily for irrigation on most soils .
Unnamed aquifersTest hole 153-83-13bbb, about 9 miles south of Minot, penetrate d
a total of 17 feet of sand and gravel from 88 to 96 feet and 100 to 109feet (pl. 1) . The lower 9 feet contained a large percentage of lignit echips . The water level in the aquifer is nearly 60 feet below lan dsurface. The water is a sodium bicarbonate sulfate type and had adissolved solids content of 1,940 ppm. The high sodium content maybe due to recharge from the Fort Union Group . Possibly the upperlayer of sand and gravel has a more desirable quality water .
A total of 80 feet of saturated sand was penetrated in well160-89-9aca. The water level was 8 to 10 feet below land surface. Thequality of the water prohibited its use for irrigation in this area o fheavy poorly drained soil. The specific conductance was 2,05 8micromhos .
Central Recharge Area
The central recharge area includes the northern part of War dCounty and most of Renville County (fig. 3) . Local relief in the area isless than 25 feet, except along the valley of the Souris River and its fewtributaries upstream from Burlington where the relief is greater .Generally the land surface slopes gently to the northeast .
With the exception of the Souris River valley, the entire region is arecharge area, as shown by the higher water level in shallow wells a scompared to deeper wells. The Souris River valley is a long and narro wdischarge area for the regional ground-water system .
A distinct part of the central recharge area is the Mohall gas-lif tsubarea that includes much of eastern Renville County east of theSouris River . Several flowing wells that contain an appreciable quantit yof dissolved gas in the water are scattered throughout this gas-lift area .Most of the flowing wells are in bedrock, but a few tap sand and grave ldeposits near the base of the glacial drift . Although the Fort UnionGroup is the most likely sequence of strata from which the ga soriginates, there is a possibility that the Hell Creek Formation, i fpresent, or the Fox Hills Formation may also contribute gas .
The gas, mainly methane, is believed to accumulate in fracture sand in places of increased porosity in lignite beds. Gas in an aquiferaffects the height to which water will rise in a well and may provide th e
84
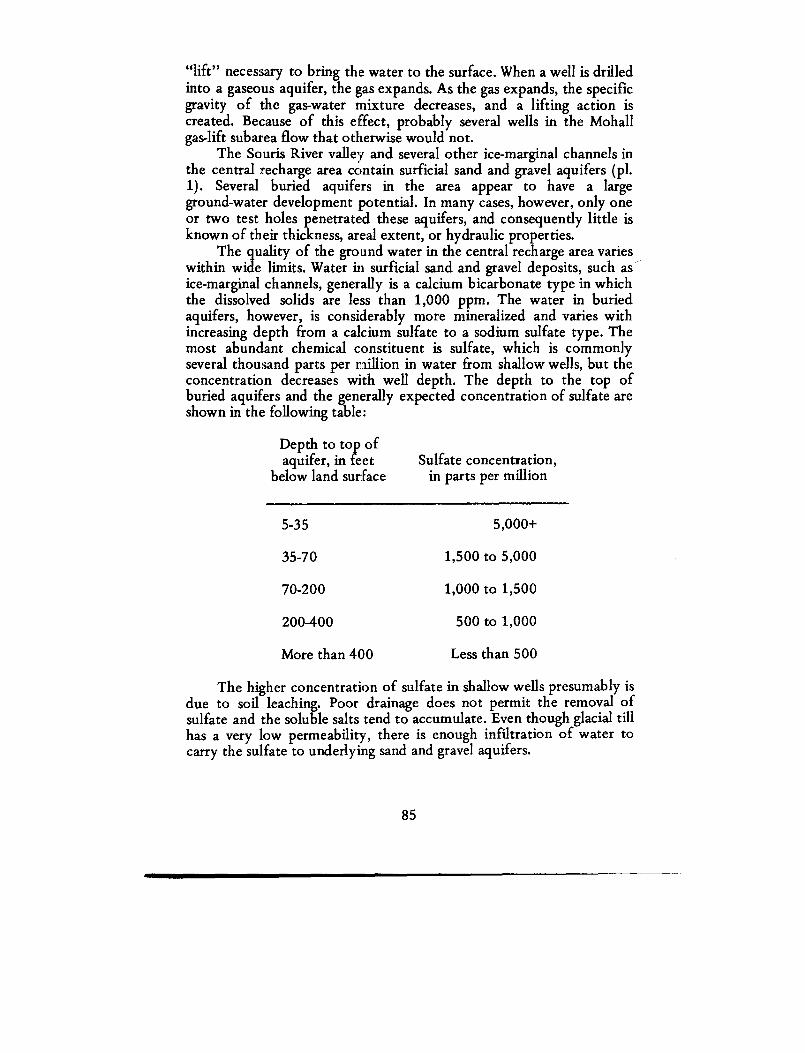
"lift" necessary to bring the water to the surface . When a well is drille dinto a gaseous aquifer, the gas expands. As the gas expands, the specificgravity of the gas-water mixture decreases, and a lifting action i screated. Because of this effect, probably several wells in the Mohal lgas-lift subarea flow that otherwise would not .
The Souris River valley and several other ice-marginal channels inthe central recharge area contain surficial sand and gravel aquifers (pl .1) . Several buried aquifers in the area appear to have a larg eground-water development potential . In many cases, however, only oneor two test holes penetrated these aquifers, and consequently little i sknown of their thickness, areal extent, or hydraulic properties .
The quality of the ground water in the central recharge area varie swithin wide limits. Water in surficial sand and gravel deposits, such a sice-marginal channels, generally is a calcium bicarbonate type in whic hthe dissolved solids are less than 1,000 ppm . The water in buriedaquifers, however, is considerably more mineralized and varies withincreasing depth from a calcium sulfate to a sodium sulfate type . Themost abundant chemical constituent is sulfate, which is commonl yseveral thousand parts per million in water from shallow wells, but th econcentration decreases with well depth. The depth to the top ofburied aquifers and the generally expected concentration of sulfate ar eshown in the following table :
Depth to top ofaquifer, in fee t
below land surfaceSulfate concentration ,
in parts per million
5-35 5,000+
35-70 1,500 to 5,000
70-200 1,000 to 1,500
200-400 500 to 1,000
More than 400 Less than 500
The higher concentration of sulfate in shallow wells presumably i sdue to soil leaching. Poor drainage does not permit the removal ofsulfate and the soluble salts tend to accumulate . Even though glacial til lhas a very low permeability, there is enough infiltration of water tocarry the sulfate to underlying sand and gravel aquifers .
85
Aquifers in the Souris River Valley Upstream from Burlingto nCross sections of the Souris River valley between Burlington and
the international boundary show that the valley fill generally range sfrom 70 to 125 feet in thickness (cross sections B-B', C-C', D-D', andE-E') . The valley fill consists mainly of till, but there are a few smalldeposits of sand and gravel .
Only a few domestic and stock wells tap the aquifer in the SourisRiver valley upstream from Burlington . Many of the wells are less than20 feet deep and tap shallow deposits of sand and gravel . Several well snear the valley walls yield water from the Fort Union Group. Generallythere are at least two wells at each homestead ; a shallow well produce shard water for culinary purposes and a deeper Fort Union wel lproduces soft water for other domestic uses. Both soft and hard waterare used for stock.
Ground water from the Souris River valley aquifers is believed tobe discharging into the stream. The quantity of water discharging fro mthe aquifers is probably quite small, however, and from spring to fal lmost of it is lost to evapotranspiration .
Aquifers in Ice Marginal Channel Deposit sSeveral ice-marginal channels in eastern Renville and northeaster n
Ward Counties contain sufficient thickness of saturated sand and grave lto be productive aquifers (pl . 1) . The channels lie east of and roughlyparallel to the Souris River, and some are more than 40 miles in length .In places, the larger channels spread out to widths of 1-3 miles, but ar emore commonly a quarter of a mile to half a mile in width .
The long, well-defined streams, such as Cut Bank and West Cu tBank Creeks, Spring Coulee, Egg Creek, and Little Deep Creek, havenearly uniform gradients over their total lengths . The average gradientof Little Deep Creek is nearly 5 feet per mile ; the combined West CutBank-Spring Coulee channel, which is 49 miles long, has an averagegradient of about 3.3 feet per mile.
Material in the ice-marginal channel deposits ranges in size fro mclay to boulders, but sand and fine to medium gravel predominate . Thenumerous gravel pits in these deposits provide good exposure of th eaquifer materials. The sand and gravel generally ranges in thicknes sfrom 0 to 20 feet . Deposits in the larger channels are generally thickerand coarser near their mouths.
The present streams have cut narrow steep-walled channels int othese deposits . Stream channels that have gently rounded cross section scommonly contain little sand and gravel, whereas channels that hav erelatively flat floors and gently sloping walls are generally underlain bysand and gravel.
86
Several stock, domestic, and municipal wells obtain water fro mthe ice-marginal channel deposits . Apparently water from these deposit sis preferred over other sources because of easy construction an dshallowness of the wells and the superior quality of the water .
The city of Sherwood owns a well 1 mile north and 1½ miles eastof the city (164-84-32cdd) . The well is 24 feet deep and 22 inches i ndiameter, and produces water from ice-marginal channel deposits in th evalley of Cut Bank Creek. The surficial sand and gravel in the vicinity o fthe well is 18 feet thick and approximately 8 feet is saturated. The wel lwas reported to produce 80 gpm with only 2 feet of drawdown .
An aquifer test was conducted in December 1956 by pumping theSherwood well for a period of 1,170 minutes at an average rate of 23 . 5gpm. The drawdown and recovery was measured in an observation well20.9 feet from the pumped well. A plot of the water-level recover yversus t/t' is shown in figure 31 . Analysis of the aquifer test indicate sthat the transmissibility of the sand and gravel in the vicinity of theobservation well is approximately 44,000 gpd per foot and th epermeability is about 5,400 gpd per square foot.
Assuming an average water-level gradient of 2 feet per mile, a naverage saturated width of 4,200 feet, and an average transmissibility of44,000 gpd per square foot, the underflow through a section across CutBank Creek would be about 68,000 gpd. Assuming a specific yield of0.25 and disregarding natural recharge, the amount of water availablefor use from a 1-mile length of channel would be about 44 millio ngallons.
The village of Loraine obtains its water supply from alarge-diameter dug well in an ice-marginal channel deposit that crosse sthe northeast corner of the village . The well is 20 feet deep and th ewater level is generally about 8 feet below land surface.
Test hole 162-84-8ddc, drilled in the center of West Cut Ban kCreek about a mile west of Loraine, did not encounter surficial san dand gravel, although such deposits are present on the channel flanks .Domestic wells constructed in the West Cut Bank Creek ' valle yreportedly provided water even during the drought of the 1930's whe nwells in adjacent areas went dry .
Glenburn obtains its water supply from a large-diameter well 3 2feet deep dug in a narrow ice-marginal channel at the northern edge o fthe city . The water level in the well averages about 8 feet below lan dsurface . Although the aquifer is only about a quarter of a mile wide i nplaces, it contains as much as 20 feet of saturated sand and gravel . Welland test-hole data indicate that part of the aquifer is buried by as muchas 30 feet of poorly permeable material .
87
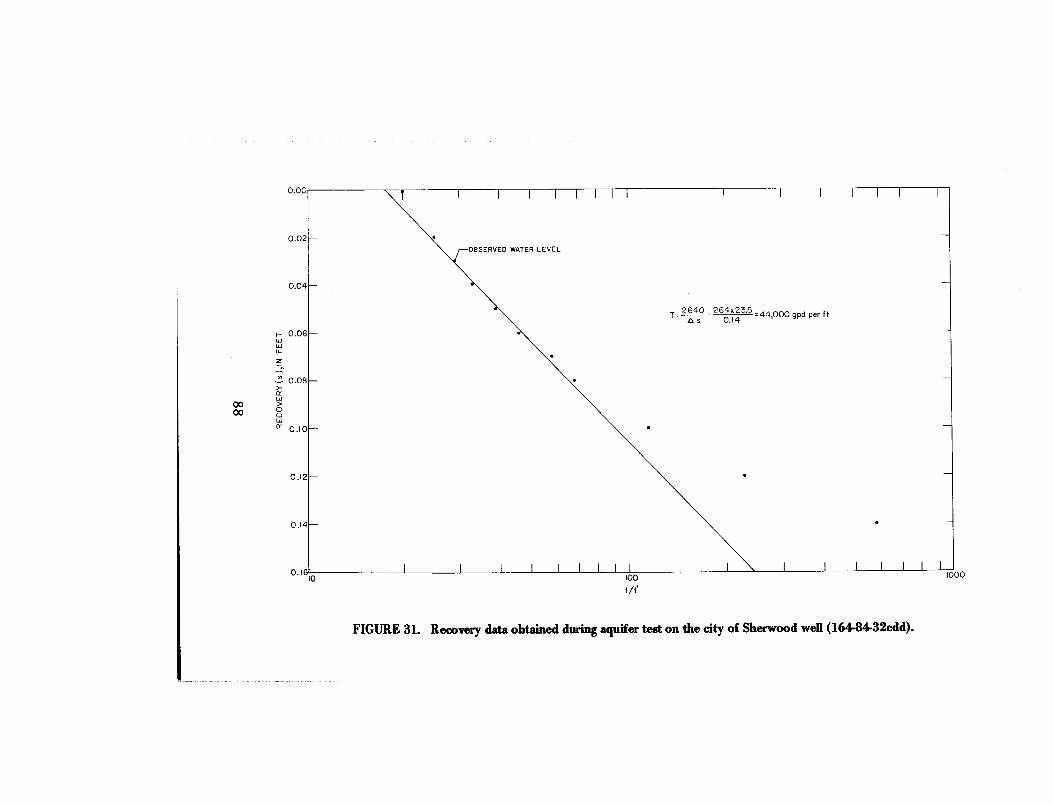
FIGURE 31. Recovery data obtained during aquifer test on the city of Sherwood well (164-84-32cdd) .
Test hole 158-81-36bbb penetrated 13 feet of fine to mediumgravel in a narrow channel south of Spring Coulee . About 6 feet of thedeposit is saturated with water .
The thickest and most extensive ice-marginal channel deposits i nRenville and Ward Counties are probably in Little Deep Creek. Sandand gravel in these deposits probably exceeds 20 feet in thickness, a sshown by the several large gravel pits in the central part of the channel .Small lakes are common in several of the gravel pits during spring an dearly summer, indicating the shallow depth of the water table .
Near the middle of Livingston Creek channel, test hole s156-83-25bbcl and bbc2 penetrated 10 and 13 feet, respectively, o fsurficial gravel . The water level is about 4 feet below land surface .Southeast in the same channel (155-82-8c), several large abandone dgravel pits contain an abundance of coarse gravel and boulders .Operation of these gravel pits was stopped because the water table wasreached .
There are several stock and domestic wells in the divergingbranches of' the ice-marginal channel deposits north and northeast o fSurrey (pl. 1) . Only a few of these deposits, however, contain asufficient thickness of saturated sand and gravel to be considered a naquifer .
Froelich (1964, p. 23) reported that a preliminary aquifer test wasconducted in these deposits using stock well 155-81-7ddd3 . The well is18 inches in diameter and 21 feet deep. The lower 5 feet of the wellcasing consists of perforated steel culvert . The well was pumpedcontinuously for 8 hours at a rate of 60 gpm . After 5 hours ofpumping, there was 0.09 foot of drawdown in an observation wel llocated 142 feet from the pumped well. The transmissibility computedfrom the above data is approximately 18,000 gpd per foot .
The water level in the channel deposits in the Surrey area range sfrom 1 to at least 15 feet below land surface. The wells range in depthfrom 8 to 36 feet .
Recharge to the ice-marginal channel deposits is entirel ydependent upon infiltration of precipitation and seepage from lakes ,reservoirs, and streams. Although the channels are narrow, their lengthand permeability permit the infiltration of large amounts of water.
Discharge from aquifers in the ice-marginal channels takes place b yunderflow, evapotranspiration, seepage to deeper aquifers, and pumpingfrom wells. Pumpage, in most places, is insignificant when compared t othe large quantity of water in storage. Pumping from these aquifer swould lower the water level and salvage part of the water lost t oevapotranspiration and underflow .
The quality of the water in the ice-marginal deposits varies withinwide limits . The water generally is a hard calcium bicarbonate type . The
89
specific conductance of samples tested ranged between 200 and 90 0micromhos. In most cases the concentration of iron was sufficient t ocause staining. The sulfate concentration in many places exceeded 25 0ppm. In addition, the nitrate content, in places, was greater than 4 5ppm. Most of the water has a high to very high salinity hazard but a lo wsodium hazard . It is classified as C3-S1 and C4-S1 for irrigation use .
Unnamed AquifersA total of 117 feet of saturated sand, gravel, and boulders wa s
penetrated in several layers down to a depth of 420 feet in test hol e161-88-11bbb (pl . 1) . An observation well was installed in medium tovery coarse sand and fine to medium gravel from 105 to 156 feet . Thewater level is about 26 feet below land surface . The water was a sodiumsulfate type containing high concentrations of sulfate (1,440 ppm) anddissolved solids (2,530 ppm) . It has a high sodium hazard and a ver yhigh salinity hazard for irrigation . Possibly deeper layers of sand andgravel in this test hole would yield water of a more desirable quality .The extent of this aquifer is unknown.
An observation well was installed in 19 feet of sand and grave lfrom 171 to 190 feet in test hole 160-87-17ddd . The water level isabout 33 feet below land surface . This aquifer contains a sodiumcalcium sulfate type water . The sulfate (1,270 ppm) and dissolvedsolids (2,210 ppm) exceeded U .S. Public Health Service (1962 )standards for drinking water . The water has a medium sodium hazardand a high salinity hazard (C3-S2), but possibly could be used fo rirrigation on well-drained soil with low cation exchange capacity . Theareal extent of this aquifer is unknown.
Test hole 162-87-2ddd penetrated 28 feet of sand and gravel an dencountered bedrock at 111 feet . Other test holes in the same townshippenetrated sand and gravel at about the same depth, but the correlatio nis uncertain .
An aquifer of unknown areal extent was found in test hole162-87-22aaa. The test hole penetrated 49 feet of sand and gravel fro m300 to 349 feet below land surface. The upper 27 feet consisted o fgravelly medium to very coarse sand, while the lower 22 feet consiste dof fine to coarse gravel containing boulders . The water level was abou t36 feet below land surface . The water was a sodium sulfate type tha texceeded U .S. Public Health Service recommended limits with respec tto sulfate (527 ppm) and dissolved solids (1,320 ppm) . It was classifiedC3-S2 for irrigation use. Other test holes drilled in the township did no tpenetrate the aquifer.
Ninety feet of gravelly medium to coarse sand was penetratedfrom 565 to 655 feet in test hole 162-87-27baa2 . Two thinner layers offine sand were encountered from 380 to 390 feet and 505 to 520 feet .
90
Although a water sample from this aquifer was not obtained ,experience in this area suggests that water from so deep an aquiferprobably contains a large concentration of chloride . The aquiferappears to lie in a deeply buried ancient river valley and could be acontinuation of the Kenmare aquifer .
Seven miles north of Carpio, test hole 158-86-laaa penetrated 2 4feet of sand and gravel with a few thin layers of clay between 39 and 6 3feet below land surface . The water level is about 13 feet below landsurface. The water is a sodium sulfate type and contained largeconcentrations of sulfate (4,640 ppm), sodium (1,400 ppm), anddissolved solids (6,640 ppm) . The water is too highly mineralized fo rdomestic and stock use or irrigation.
About a mile northwest of Glenburn, observation wel l158-82-10aad2 was completed near the bottom of a sand and grave ldeposit from 184 to 240 feet below land surface . The water level in thewell is about 15 feet below land surface . The water is a sodiummagnesium sulfate type . It contained excessive quantities of sulfat e(1,240 ppm), dissolved solids (2,460 ppm), and fluoride (1 .8 ppm) foruse as drinking water. The water is within the C4-S2 (very high salinit yand medium sodium hazard) classifications for irrigation use .
Test hole 158-82-34ccd penetrated fine to coarse gravel betwee n154 and 171 feet . The water level is about 32 feet below land surface .The water is a sodium sulfate bicarbonate type and contained excessiv eamounts of sodium (652 ppm), sulfate (820 ppm), and total solid s(2,120 ppm) for use as drinking water . The water has a high salinity andvery high sodium hazard (C3-S4), and is too mineralized to be used fo rirrigation.
On the north margin of Little Deep Creek, test hole 158-82-26cc cpenetrated 32 feet of very fine to coarse sand (11-43 feet below landsurface) . The water level is about 5 feet below land surface . The wateris a sodium magnesium sulfate type and was high in sodium (924 ppm) ,sulfate (5,100 ppm), and dissolved solids (8,160 ppm) . It is too highlymineralized for irrigation or domestic and livestock use withou ttreatment. The same aquifer was penetrated in test hole 158-82-27aaawhere the sand is 30 feet thick . In addition, 24 feet of boulders wasencountered between 165 and 189 feet ; the hole was abandonedbecause of the difficult drilling conditions .
91
USE OF GROUND WATER
The rural population of Renville and Ward Counties depend smainly upon ground water for its domestic and stock requirements. Inmany places, however, the ground-water supply is supplemented by th euse of dugouts or collection galleries. Eight communities obtain theirwater supplies from wells, but only seven of these have waterdistribution systems. Ten villages have no public water-supply systems .At present, ground water is not used for large-scale irrigation and th eheavy, poorly drained soil and the high mineral content of much of th ewater preclude irrigation throughout most of Renville and War dCounties .
Domestic and Stock Use
Most farms and ranches use two or more wells, generally on eshallow and one deep. The shallow wells generally provide hard calciu mwater that is desirable for culinary uses and the deeper wells generall yprovide soft sodium water that is used for laundry purposes as well a sfor livestock. A few wells are large diameter and hand dug ; however ,most are small-diameter drilled wells ranging in depth from 50 to 1,00 0feet . Generally the wells have only short screens or open-ended casing,and consequently yield only a few gallons per minute .
Public Supply
Eight communities in Renville and Ward Counties have municipa lwater supplies : Berthold, Glenburn, Kenmare, Loraine, Minot, Mohall ,Ryder, and Sherwood . Loraine has no water distribution system andMohall obtains its water supply from wells in Bottineau County . All ofthe municipalities have adequate water supplies, but the water is o fpoor quality at Berthold and Ryder. Residents of other communitie sare dependent upon privately owned wells or must haul water from th enearest available source .
92
BertholdThe municipal supply for Berthold is pumped from a well 570 fee t
deep that taps the Fort Union Group . The well pumps water at anaverage rate of about 15,000 gpd, which has been adequate for the 39 8people (1970 census) . The well has a specific capacity of only 0 .3 gpmper foot according to Randich (1963) . The raw water is pumpeddirectly into the distribution lines.
GlenburnThe city of Glenburn owns two wells. A 300-foot well capable o f
yielding 30 gpm from the Fort Union Group supplies water for fireprotection. A 10- by 20-foot dug well, 32 feet deep, is used for most o fthe municipal requirements . The well produces from the sand andgravel outwash that partly fills an ice-marginal channel .
A few yards downstream from the dug well, the gravel wa sremoved across the width of the stream channel and a clay dam wasinstalled. The dam provides a control on the underflow . In addition,during high stages of the creek, particularly during the spring runoffperiod, excess surface water is diverted into an unused gravel pitupstream from the clay dam . The water in the gravel pit movesdownward to replenish the ground-water reservoir . The annual quantit yof water added by artificial recharge per year is unknown, but sinceinstallation of the recharge system, the city has had an adequate wate rsupply. The city requires an average of about 35,000 gpd for the 38 1inhabitants .
KenmareThe water supply for Kenmare is pumped from a well 340 fee t
deep that taps outwash sand and gravel . The average daily pumpage isabout 150,000 gallons, which is considerably less than the Kenmar eaquifer will provide. Although accurate records are not available, thewater level probably has declined less than 40 feet in the last 60 years ,and probably about 10 feet since 1956 . There are no water-treatmentfacilities at Kenmare .
LoraineThe east-central Renville County community of Loraine has a
shallow large-diameter well in an ice-marginal channel occupied by acreek at the east edge of the village. The well, which was dug in 1959, isa 12-foot diameter concrete caisson that is 20 feet deep . The pump ispowered with a 2-horsepower electric motor . No production orwater-level data are available, but the water level will fluctuate with th e
93
stage and quantity of underflow in the creek. In addition, the quality ofthe water probably varies with the seasons . There are nowater-treatment facilities at the well site .
Mino tThe Minot well field consists of 18 wells, of which only 13 are
used. The first municipal well was drilled in 1916 and additional well swere drilled as the need for water increased or wells failed . Originallyground water was used to augment municipal withdrawals from theSouris River, but later, surface water augmented ground-wate rpumping. During the early part of the summer of 1964, the citypumped 60 percent of its water requirements from the Minot aquiferand 40 percent from the Souris River . Since 1965, river water has alsobeen used for artificial recharge of the aquifer . The combined use ofsurface water and ground water is carried on whenever river water i savailable .
Annual pumpage from municipal wells from 1944 to 1966 isshown in figure 26 . Exceptionally heavy withdrawals from the Mino taquifer in 1961, 1962, and 1963 were a result of: (1) drought, (2 )decrease and temporary termination of pumping directly from theSouris River, (3) increased city population, and (4) needs of the MinotAir Force Base .
The city resumed pumping from the Souris River on May 28,1964, and has continued with only short interruptions . Pumping frommunicipal wells is decreased during the periods of river withdrawal . Thecity requires water at an average rate of about 4½ mgd.
RyderWater for municipal purposes is pumped from surficial sand an d
gravel of the Ryder aquifer about half a mile north of Ryder . Thelarge-diameter well is 18 feet deep and the raw water is pumped directlyinto the distribution system. Although records are not available, Ryde rreportedly pumps about 10,000 gpd for the 211 inhabitants. The wateris hard and high in dissolved solids, sulfate, and iron .
SherwoodThe Sherwood water supply is pumped from a well 24 feet deep i n
an ice-marginal channel deposit of sand and gravel in Cut Bank Creek ,nearly 2 miles northeast of the city . Sherwood uses an average o f50,000 gpd. The raw water is pumped directly into the distributio nlines without treatment. The chemical quality of the water is good . Thedissolved solids generally ranged between 500 and 600 ppm . Thequality probably changes, however, from season to season owing to thevariable discharge and underflow in the creek .
94
SUMMARY AND CONCLUSION S
The Souris and Des Lacs Rivers and thousands of potholes containsubstantial quantities of water ; however, the chemical quality varie swithin wide limits. The water in many of the potholes is briny . Thedissolved solids in the streams ranged from about 400 ppm during th espring to as much as 1,300 ppm during the winter .
Locally large sources of ground water are available for use inRenville and Ward Counties .
Two types of aquifers occur in the area--those in th esemiconsolidated and consolidated bedrock formations and those in th eunconsolidated glacial deposits. The Fort Union Group contains themost productive bedrock aquifers in Renville and Ward Counties .
Generally water from the Fort Union is a sodium bicarbonat etype, a sodium chloride type, or a mixture . The water is unsuitable forirrigation and in many places is undesirable for domestic use.
Deposits of Quaternary age comprise the major aquifers inRenville and Ward Counties . In a few places, these aquifers will yieldmore than 500 gpm of good quality water. In other places, the aquifer sare too thin, are of small areal extent, or the rate of natural recharge i stoo slow to provide sustained yields of more than a few gallons perminute .
Several extensive deposits of surficial sand and gravel underlie th eCoteau du Missouri. The Douglas, Tolgen, and Vang aquifers contai nlarge quantities of water of good chemical quality suitable forirrigation. However, the saturated thickness of these aquifers varie swithin wide limits and any particular area should be studied in detailbefore a large-scale ground-water development is undertaken.
Several poorly defined water-bearing zones are buried in the glacialdrift . With the exception of those in river valleys, the buried deposit scommonly contain water of undesirable chemical quality, withobjectionable concentrations of iron, sulfate, and dissolved solids. Mostof the buried water-bearing deposits are not of great extent and wil lsupply only small quantities of ground water to wells .
The most productive aquifers are in the valleys of the Souris an dDes Lacs Rivers . Well yields of more than 500 gpm should be availabl efrom the Kenmare aquifer and locally from aquifers in the Souris Rivervalley between Minot and. Logan. Northwest of Minot and betwee nLogan and Sawyer, yields of 50 to 500 gpm can be expected .
Much of the water in the valley aquifers is suitable for domestic ,municipal, and industrial uses, but it may be of marginal value forirrigation, particularly in the Des Lacs River valley .
95
Substantial quantities of ground water are stored in surficial sandand gravel deposits in ice-marginal channels . In most places, the wate rhad a specific conductance that is less than 1,000 micromhos. In a fewplaces, these deposits could provide enough water for small-scaleirrigation projects, especially during years of above-norma lprecipitation .
Additional test drilling is necessary to define the extent of manyof the aquifers, and to delimit areas of maximum permeability an dsaturated thickness within each aquifer . Accurate long-term data ,especially water-level measurements, pumpage, and water qualit ydeterminations, are essential for proper management of theground-water resources that are now in use as well as for those whic hmay be developed in the future .
96
SELECTED REFERENCE S
Akin, P. D., 1947, Geology and ground-water conditions at Minot ,North Dakota: North Dakota State Water Comm . Ground WaterStudies, no. 6, 99 p .
Akin, P. D., 1951, Ground water in the Mohall area, Bottineau an dRenville Counties, North Dakota: North Dakota State WaterComm. Ground Water Studies, no. 17, 76 p .
Andrews, D. A., 1939, Geology and coal resources of the Minot region,North Dakota: U.S. Geol. Survey Bull. 906-B, 81 p .
Armstrong, C. A., 1963, Ground-water resources near Max, McLean andWard Counties, North Dakota: North Dakota State Water Comm .Ground Water Studies, no . 45, 23 p.
Butler, R. G., Orlob, G. T., and McGauhey, P. H., 1954, Undergroundmovement of bacterial and chemical pollutants : Am. Water WorksAssoc. Jour ., v . 46, no .. 2, p . 97-111 .
Durfor, C. N., and Becker, Edith, 1964, Public water supplies of the100 largest cities in the United States, 1962 : U.S. Geol. SurveyWater-Supply Paper 1812, 364 p .
Ferris, J . G ., Knowles, D. B., Brown, R . H., and Stallman, R . W., 1962 ,Theory of aquifer tests: U.S. Geol. Survey Water-Supply Pape r1536-E, p . 69-174 .
Flynn, J . M., Andreoli, Aldo, and Guerrera, A . A., 1958, Study ofsynthetic detergents in ground water : Am. Water Works Assoc .Jour., v. 28, no . 12, p. 1954-1962.
Froelich, L. L., 1964, Ground-water survey of the Surrey area, War dCounty, North Dakota : North Dakota State Water Comm. Groun dwater Studies, no. 58, 62 p.
Hem, J. D., 1959, Study and interpretation of the chemicalcharacteristics of natural water: U.S. Geol . Survey Water-SupplyPaper 1473, 269 p.
Jensen, H. M., 1962, Geology and occurrence of ground water nearBowbells, Burke and Ward Counties, North Dakota : North DakotaState Water Comm. Ground Water Studies, no. 42, 65 p .
Krieger, R. A., Hatchett, J. L., and Poole, J . L., 1957, Preliminarysurvey of the saline-water resources of the United States : U.S.Geol . Survey Water-Supply Paper 1374, 172 p .
Langbein, W. B., and Iseri, K. T., 1960, General introduction andhydrologic definitions : U.S. Geol. Survey Water-Supply Paper1541-A, 29 p .
97
LaRocque, G. A., Jr., Swenson, H . A., and Greenman, D. W., 1963a ,Tables of hydrologic data, Crosby-Mohall area, North Dakota :U.S. Geol . Survey open-file report, 508 p.
LaRocque, G. A., Jr., Swenson, H . A., and Greenman, D . W., 1963b,Ground water in the Crosby-Mohall area, North Dakota: NorthDakota State Water Comm. Ground Water Studies, no . 54, 57 p .
Lemke, R . W., 1960, Geology of the Souris River area, North Dakota :U.S. Geol . Survey Prof. Paper 325, 138 p .
Meinzer, O . E., 1932, Outline of ground-water hydrology : U.S. Geol .Survey Water-Supply Paper 494, 68 p .
North Dakota State University of Agriculture, Dept . of Economics ,1963, North Dakota livestock statistics, annual summary.
Pettyjohn, W. A., 1967a, Geohydrology of the Souris River valley inthe vicinity of Minot, North Dakota : U.S . Geol. SurveyWater-Supply Paper 1844, 53 p .
Pettyjohn, W. A., 1967b, Multiple drift sheets in southwestern WardCounty, North Dakota, in Glacial geology of the Missouri Coteauand adjacent areas, 1967 : North Dakota Geol . Survey Misc. Ser. ,no. 30, p . 123-129.
Pettyjohn, W. A., 1968a, Geology and ground water resources o fRenville and Ward Counties, North Dakota; Part II, Ground waterbasic data : North Dakota Geol . Survey Bull . 50 and North Dakot aState Water Comm . County Ground Water Studies 11, 302 p .
Pettyjohn, W. A., 1968b, Design and construction of a dual rechargesystem at Minot, North Dakota: National Water Well Assoc . ,Ground Water, v . 6, no. 4, p . 4-8 .
Pettyjohn, W. A., and Hills, D . W., 1965, Geohydrology of the Souri sRiver valley in the vicinity of Minot, North Dakota, Ground-wate rbasic data: North Dakota State Water Comm . Ground WaterStudies, no. 65, 89 p .
Pettyjohn, W. A., and Randich, P . G., 1966, Geohydrologic use oflithofacies maps in glaciated areas : Water Resources Research, v. 2 ,no. 4, p . 679-689 .
Randich, P. G., 1963, Geology and ground-water resources nearBerthold, Ward County, North Dakota : North Dakota State WaterComm. Ground Water Studies, no . 46, 26 p .
Randich, P . G., 1965, Geology and ground water resources of BurleighCounty, North Dakota ; Part II, Ground water basic data : NorthDakota Geol. Survey Bull . 42 and North Dakota State Wate rComm. County Ground Water Studies 3, 273 p .
Robinove, C. J., Langford, R. H., and Brookhart, J . W., 1958,Saline-water resources of North Dakota: U.S. Geol . SurveyWater-Supply Paper 1428, 72 p .
98
Schmid, R . W., 1963, Ground water in the vicinity of Ryder, WardCounty, North Dakota : North Dakota State Water Comm. GroundWater Studies, no . 53, 33 p .
Simpson, H . E., 1929, Geology and ground-water resources of NorthDakota: U.S. Geol. Survey Water-Supply Paper 598, 312 p .
Swenson, H . A., and Baldwin, H. L., 1965, A primer on water quality :U.S. Geol . Survey, 27 p.
Theis, C. V., 1935, Relation between the lowering of the piezometri csurface and the rate and duration of discharge of a well usin gground-water storage : Am. Geophys. Union Trans., 16th Ann.Meeting, pt . 2, p . 519-524.
U.S. Bureau of the Census, 1971, U .S. census of population : 1970,Number of inhabitants, North Dakota : (in press)
U.S. Geological Survey, 1961-64, Surface water records of NorthDakota and South Dakota.
U.S. Geological Survey, 1965a, Water resources data for North Dakotaand South Dakota; Part I, Surface water records .
U.S . Geological Survey, 1965b, Water resources data for North Dakot aand South Dakota; Part 2, Water quality data.
U.S. Geological Survey, 1966a, Water resources data for North Dakota ;Part I, Surface water records .
U.S. Geological Survey, 1966b, Water resources data for North Dakota ;Part 2, Water quality records .
U.S. Public Health Service, 1962, Public health drinking wate rstandards : U.S. Public Health Service Pub . no. 956, 61 p.
U.S. Public Health Service, 1963, Municipal water facilities : U.S. PublicHealth Service Pub . 775 (revised), v. 6, 140 p .
U.S. Salinity Laboratory Staff, 1954, Diagnosis and improvement o fsaline and alkali soils: U.S. Dept. of Agriculture, AgricultureHandb. 60, 160 p .
U.S. Weather Bureau, 1955, Climatic summary of the United States :Suppl, for 1931 through 1952, North Dakota, no. 28.
U.S. Weather Bureau, 1953-66, Climatological data, North Dakota ,Ann. Summary, 1952-65 .
Wenzel, L . K., 1942, Methods for determining permeability ofwater-bearing materials with special reference to discharging-wel lmethods, with a section on direct laboratory methods andbibliography on permeability and liminar flow by V. C. Fishel :U.S. Geol. Survey Water-Supply Paper 887, 192 p.
Wilcox, L. V., 1955, Classification and use of irrigation waters : U.S .Dept . of Agriculture Ciirc ., no. 969, 19 p .
99
Willis, W. O., Carlson, C . W., Alessi, J ., and Haas, H. J ., 1961, Depth offreezing and spring runoff as related to fall soil-moisture level :Canadian Jour . Soil Sci ., v . 41, p. 115-123 .
Willis, W. O., Haas, H. J., and Robins, J . S., 1963, Moistureconservation by surface or subsurface barriers, and soi lconfiguration, under semiarid conditions : Soil Sci. Soc. Amer .Proc., v. 27, p . 577-580 .
Willis, W. O., Parkinson, H . L., Carlson, C . W., and Haas, H . J ., 1964 ,
Water table changes and soil moisture loss under froze nconditions: Soil Sci., v. 98, p. 244-248.
Willis, W. O., and Haas, H. J ., 1965, Dryland soil moisture losses in th eNorthern Great Plains: Great Plains Agri. Council Proc., Laramie,Wyo., p . 49-53.
100