Embed Size (px)
Citation preview
Ground demonstration of planetary gas lidar based on optical parametric amplifier
Kenji Numata',a,b, Haris Ririsb, Steve Lib, Stewart Wub, Stephan R. Kawab, Michael Krainakb, James Abshireb
"Department of Astronomy, University of Maryland, College Park MD, USA 20742 "NASA Goddard Space Flight Center, Greenbelt MD, USA 20771
ABSTRACT
We report on the development effort of a nanosecond-pulsed optical parametric amplifier (OPA) for remote trace gas measurements for Mars and Earth. The OPA output has high spectral purity and is widely tunable both at near-infrared and mid-infrared wavelengths, with an optical-optica1 conversion efficiency of up to -39"10. Using this laser source, we demonstmted open-path measurements ofCH, (3291 nm and 1651 nm), CO, (1573 nm), H,O (1652 nm), and CO (4764 nm) on the ground. The simplicity, tunability. and power scalability of the OPA make it a strong candidate for general planetary lidar instruments, which will offer important information on the origins of the planet's geology, atmosphere, and potential for biology,
Keywords: Optical Parametric Amplifier, Lidar, DIAL, Space Instrumentation
1. INTRODUCTION
Laser remote sensing measurements of trace gases from orbit can provide unprecedented infonnation about important planetary science and answers to critical questions regarding planetary atmospheres. Carbon dioxide (C~), methane (CH4), and carbon monoxide (CO) are three very important greenhouse gases on Earth. Remote sensing of these gases will assist in understanding Earth's climate change and will help to reduce the uncertainty in the carbon budget. NASA's decadal survey [1] called for a mission to measure CO2, C~, and CO. Remote measurements ofC~, water (H20), and other biogenic molecules (such as ethane and fonnaldehyde) on Mars have important connections to questions related to the existence of life on Mars [2]. If localized, areas with higher gas concentrations' will become a primary target of future landing missions. Our aim is to increase the accuracy of mapping these gases globally through Integrated Path Differential Absorption tidar (IPDA) measurements with much higher accuracies by developing a near~infrared (NlR) and mid~infrared (MIR) lidar transmitter. Most trace gases on Mars and Earth have suitable spectral absorption features in the NIR (1.5-1.6 ~) and the MIR (3-5 ~) regions. Our tunable laser transmitter and high sensitivity detectors at NIR and/or MIR when used in a sounding (surface reflection) mode enable IPDA measurements from omit with modest laser power.
At the NASA Goddard Space Flight Center (GSFC), we are developing a laser transmitulr system for both Mars and Earth applications. Our system is based on a nanosecond-pulsed optical parametric amplifier (OPA) pumped at 1064 nm with magnesium oxide-<loped periodically-poled lithium niobate (MgO:PPLN) as the non-linear medium. The OPA is suited for this application since it has a sufficient wavelength tuning moge for gas detections and it generates both NIR and MIR, whereas no traditional laser has the necessary high spectral purity, sufficient pulse energy, and wide tuning capability. The two outputs at NlR and MIR are called "signal" and "idler", respectively. The output wavelengths of signal and idler can be tuned by adju,ting a seed laser in the OP A. While our primary target is CH, on Earth and Mar.o, the OPA approach win allow a new capability for general planetary lidar instruments. In parallel, we continue to examine narrower band sources such as Yb fiber amplifier pumped optical parametric oscillator (OPO) and stand~a1one Er:YAG lasers. These may ultimately achieve higher wall-plug efficiency [3, 4]. However, the OPA clearly provides a convenient light source for the measurement of numerous gases.
I [email protected];phone I 301-286-0799

While many gas sensing lidar systems are based on OPO approaches [5~11], our OPA approach is simpler, especially when narrow-linewidth, high-power pump and seed lasers are available. Due to the optical feedback provided by the resonant cavity, an OPO generally offers higher output beam quality, narrower output linewidth, and higber electrical-tooptical efficiency. However, it is sensitive to alignment, does not allow easy continuous tuning, and requires more optics, electronics, and frequent adjustment. High nonlinearity of a quasi-phase matched device (such as PPLN) allows efficient generation ofNIR and MIR energy even with the single-pass OP A configuration. We think the simplicity and robustness of the OPA's optical arrangement make it a strong candidate for space applications - particularly Earth remote sensing. This type of single-pass device previously required high pump peak: power with picoseconds pulsewidths. However, nanosecond pulsewidths are required for gas sensing applications in order to obtain the narrower transform-limited linewidths needed to resl?lve target gas lines. This type of nanosecond OPA system based on PPLN was previously primarily constructed with Nd: Y AG microchip pump lasers [12- 15].
In this paper, we report on the setup of the developed OPA system and measurements of diurnal variation of Earth's atmospheric C~, CO2, H20, and CO using horizontal absorption paths.
2.EXPERTIMENTALSETUP 2.1 Overview
We have built three OPA systems, designated as OPA system I, OPA system 2, and OPA system 3 in this paper. Figure I sbows the experimental diagram ofOPA system I. In this system, both signal (1573 run) and idler (3291 run) are used for the simultaneous measurements of CH. and CO2 using the near and far targets (as shown in Fig. 2), respectively. A nonlinear crystal is pumped by a pulsed 1064 run Nd:YAG las.er and seeded by a continuous-wave distributed-feedback (OFB) laser diode (LD) through a Erbium doped fiber amplifier (EDF A). OPA system 2 has a similar setup, except that only the signal wavelength near 1651 nm is used for ~ and H20 measurements using the far target. OPA system 3 is implemented upon OPA system 1 by swapping the non-linear crystal and the seed laser. Its idler at 4764.0 om is used for the measurement of CO. No fiber amplifier is employed for the seed in OPA systems 2 and 3, since there was no fiber amplifier that works at their seed wavelengths. Table 1 summarizes the specifications for the three OPA lidar systems.
Data acquisitior. system
M1RUdar ,,"'=--.0-.... ----0_-.,---/7
9!
NlRIWar
'" Far ...... /
i,'g I
Figure 1. Experimental diagram. A MgO:PPLN crystal is pumped and seeded by a Q-switch Nd:YAG NPRO and a DFB laser, respectively. Ir. OPA system 1 (1573 nm seed), both signal and idler are used for lidar measurement as shown in this figure. In OPA system 2 (165 I nm seed), only the signal is used for lidar measurement and there is no EOFA and MIR lidar. In OPA system 3 (1371 run seed), only the idler is used for lidar measurement and there is no EDFA and NIR !idar. EDFA: Erhium-doped fiber amplifier, HWP: halfwave-plalc:, M: mirror, OM: dichroic mirror. L: tens, F: wavelength-selecting filter, COL: fiber collimator, IS: inregratir.g sphere, W: wedge, DET: detector, BE: beam expander, PMF: singie-mode polarization maintaining fiber, MMF: multi-mode fiba, ADC.: anaJog-to-digital converter, DAC: digital-to-analog converter, Trig.: trigger signa! for boxcar averagers, Sig.: Signal input for boxcar averager.

"Window
, Weather station & inlet for insitu monitor
f
Figure 2. Schematic view of two open paths. The MIR lidars (idlers of OPA system 1 and 3) used the near target. The NIR Iidars (signals of OPA system 1 and 2) used the far target.
Target gas (Wavelengtn)
PumpinQ Pump source
Pump pulse wldtn incident pump energy
Repetition rate OPA
Non-linear medium Grating period Temperature Beam radius
Output pulse wkftn Output energy
Output linewidtn Seeding
Seed laser Wavelengtn
Amplifier Seed power
Scan Transmitter
integrated sphere coating Beam expander Wedge material
Recewer Telescope Detector
2.20PA source
OPA system 1 CIi, CO,
(3291.1 nm) (1573.3 nm)
OPA s\'stem 2 CH.
(165O.9 nm) H,O
(1652.0 nm)
LD-pumped, passively Q-switched, Nd:YAG NPRQ -3.3 nsec -60jJ.l "'6 kHz
I I I I
OPA system 3 co
(4764.0 nm)
MgO:PPLN, 50 mm{L) x 8 mm(W) x lmm{H), 5- angle-cut, AR coated
30.5 ~m I 31.0 ~ I 26.4 ~m 111.9 ·C 128.4·C 109.5 ·C
.... 100 ~m for pump, .... 125 ~m for seed -2 nsec
-7,6 jJ.l I -16 jJ.l I "'13~
"'500 MHz
I I I Telecom DFB LD, PM fiber coupled
1573.3 nm 16S0.9nm/1652.0nm (temperature tuned)
PM EDFA Not used "'300mW -lSmW
2 Hz, ramped, current tuning
I Infragold Reflective
CaF2
Spedralon Refractive
BK7
Spectralon Refractive
BK7
I HgCdTe I
200-~m diameter, Cassegrain inGaAs I InGaAs
Table I. Technical data for the three OPA Hdar systems.
I
I
-1.9 jJ.l .... 700 MHz
1370.8 nm
Not used "'15mW
Infragold Reflective
CaF,
HgCdTe
The pump source is a passively Q-switched Nd:YAG non-planar ring oscillator (NPRO) made by Innolight Inc. that emits single-frequency, single longitudinal-mode output at 1064.5 nm. It has -3.3-osec pulse width and -60-111 pulse energy at a --{i-kHz repetition rate. The opticallinewidth of the NPRO is transform limited (-133 MHz).

The seed source is a continuous-wave. PM (polarization-maintaining) fiber-coupled. DFB LD. The instantaneous Iinewidth ofDFB ill is less than 1 MHz. The wavelengths of the DFB LDs are selected to be 1573.3 nm, 1651 nm, aod 1370.8 run for OPA system 1.2, and 3, respectively. The 1651-nm LD for OPA system 2 is step-scanned between 1650.9 run aod 1652.0 nm for CIL aod H20 measurements, respectively, by applying a step temperature change of 7.2 ·C with ao interval of 5 minutes. The DFB LD cao be smoothly tuned through a wide range (>0.25 nm or -30 GHz) without a mode hop, by injection current modula!ion. As a result, the output idler and signal can be tuned without a mode hop across the absorption peaks of the target gases. The seed LOs are tuned by a ramp voltage at 2 Hz .. We observed that use of a higher seed optical power ensures smooth tuning as well as high efficiency. When the seed bas low power and a slight misaligrunent, the signal was obscured by the amplified vacuum fluctuation and/or a parasitic parametric oscillation. Therefore, we used a minimum seed power of - 15 mW (for OPA system 2 and 3). For the OPA system 1 at 1573.3 run, we aroplified the seed to - 300 mW using a PM EDFA.
The seed beam is co-aligned with the pump using a dichroic mirror. The beams are focused down to a crystal by a lens with a focal length of 300 mm. The resultant beam radii inside the crystal are -100 fUll aod -125 I'm for the pump and the seed, respectively. The locations of the beam waists are carefully adjusted to overlap with each other. With this pwnp beam size, the crystal is operated near the threshold of optical parametric generation (OPG).
E .s a c .!! G > ; " G
:2
6000
~ 4500
CO {f1'
4000
3500 • CH4
3000
......... 3O.ei~ waling
..... ~ (OPAsystam 1)
25OO~ __ ~ __ -L __ ~ ____ ~~~ __ -L~~
1350 1400 1460 1500 MSO . 1600 16!!iO 1700
Signal (seed) wavelength [nm]
Figure 3. Tuning curves of the three MgO:PPLN crystals used in the three OPA systems. Wavelengths of the five gas absorption lines used in the lidar measurement are indicated by the arrows.
The nonlinear crystal is a 50-mm long, I-mm thick MgO:PPLN. The end surfaces of the crystal were angled at 5° and anti-reflective (AR) coated at the pump. the signal. and the idler wavelengths in order to minimize optical feedback. A similar angle-cut crystal arrangement can be foun~ for example, in [16]. We observed that the output signal/idler wavelengths do Dot smoothly follow the scanned seed if the end surfaces of the crystal are not angJed. Figure 3 shows the measured tuning curve of the MgO:PPLN crystals. We used a 30.5-~m grating at 1l1.9·C, 31.0-l'm grating at 128.4·C, and 26.4-1lffi grating at 109.5·C for OPA systems I, 2, and 3, respectively. The center wavelength of pararoetric galn at NlR was tuned around 1370 nm, 1575 nm, and 1650 nm, with the three gratings, by tuning the temperature between 70 and 170·C. The oorresponding idler luning occurred around 4770 nm, 3280 nm, and 3000 nm, respectively. The full-width half-maximum of the un,eeded OPG spectra was about 0.3 nm, 1.2 nm, and 2.1 run at 1370 run, 1575 om, and 1650 nm, respectively. As a result, the crystal temperature required no tuning for the two wavelengths (1650.9 nm and 1652.0 run) in OPA system 2. Once seeded within the gain baodwidth, the output spectrum collapsed to the seed wavelength with >20dB suppression.
2.3 Lidar and monitor systems
The output beam is separated into three paths using dichroic mirrors . The signal at NIR and the idler at MlR are used for gas detection through open-paths with cooperative hard targets set at 1493 m and 207 m away, respectively, as shown in Fig. 2. The targets are covered by automotive reflective tape. The signal and the idler are detected by InGaAs and HgCdTe detectors. respectively. The light goes through a beam expander and a wedge, which is set inside the integrating sphere. The scattered light inside the integrating sphere is detected by a detector and used as an energy monitor to nonnalize the return signals. The return beams reflected by the hard targets are received by 2<k:m Cassegraio telescopes 'Nith protective aluminum coatings. The pulsed signals from the detectors are averaged by boxcar averagers triggered by

the residual pump pulse. Optical crosstalk is avoided by inserting optical filters before the transmitter and after the telescope.
The temperature and pressure values of the atmosphere~ which are needed to convert the measured absorption curve into mixing ratios. are monitored by a weather station set at the roof of OUT building. An in situ cavity ring-down spectrometer by Picarro Inc. monitors CH... CO2, and H20 mixing ratios of the outside air on the same roof. The lidar systems and the in situ system are set on the 4th floor of one of the buildings at GSFC, in Greenbelt, Maryland, United States.
3. EXPERIMENTAL RESULTS
3.10PA characterization
f. "
o
r-r-r-r-o
CPA. system 1 • 414mW seed
207mW seed
• 94mW seed 0 BmW seed
• ... ... :~ .. • I tu 'l,V
fO 20 30
• • ..... .. -,
'V. ,
Pump energy [J,IJ]
• • I. . .. V -.. l 'V
'V ---
, 60
Figure 4. Relationship between signal and pump energies at different seed power levels (OPA system 1).
Figure 4 shows the relationship between pump energies, signal ' energies, and seed powers in OPA system 1. With a 60-j.t.T pump and a .... 300-mW seed at 1573.3 nm, we obtained a -16-jJJ signal, excluding the effect of .... 70-% transmittance of wavelength selection filter. The corresponding. idler at 3291.1 om was -7.6 j.l1. Thus, total pump conversion efficiency was (16 f'l+7.6 J.1l)I60 f'l- 39%.
1.2
1.0
-; -; 0.8 .!.
.!. G
J 0.6 ...
,!! 0.4 a.
E 0.2 C , 0.0
-2 0 2 4 6 -1.0
Time [nsec] Frequency [GHzJ
Figure 5. (Left) Typical pul;;e shapes of the output signal and residual pump. (Right) Typical optical spectrum of the output signal with full and reduced pump energies. This is measured by a scanning Fabry~Perot etalon with 2~ GHz free spectral range.
As shown in Fig. 5 (left), the OPA output had a -2-nsec width and a distorted Gaussian pulse shape, which is caused by the back-conversion process between the 1064-nm pump and signaVidler. The M2 of the OPA output signal beam was .... 1.3. The output linewidth of the OPA was estimated both from the scanning Fabry-Perot etalon and the gas ceUs. When the pump energy was low and the crystal was operated ncar the differential frequency generation (DFG) regime, the linewidth of the signal was measured as near transform limited (<200 MHz). When the pump energy was high and at our

nominal OPA operating condition, the signal was broadened to -500 MHz (averaged over the beam) due to the backconversion processes, as shown in Fig. 5 (right). The effect of the broadened linewidth on the measured mixing ratio was small, siDce the typical pressure-broadened full-~dth half maximum ~) Jinewidth of our target line is - 5 GHz.
For the same seed power of .... 15 mW, the total pump conversion efficiency was .... 34%, -33%, and .... 14% for the OPA system 2 (J651-nm seed), I (1573-nm seed), and 3 (1371-nm seed), respectively. The higher efficiency for longer seed wavelengths can be partly attributed to the difference in the parametric gain, which becomes higher at longer seed wavelengths for the same crystal length and for the same optical power densities [17]. The low efficiency of the OPA system 3 (26.4-~ grating) was also thought to be a result of the imperfection of the crystal with a shorter grating period.
3.20pen path scans
The calculation of the mixing ratio was done by fining the scan result with theoretical Voigt profile (examples are shown in Fig. 6). To reduce the statistical error, 5 min of the digitized data were averaged. As a result, 10-min interval data of C~ and H10 were alternatively obtained for OPA system 2. The signal from the receiver telescope was divided by the signal from the integrating sphere. The baseline was detennined by fitting the divided data, excluding the absorption feature with a 5-th order polynomial function, which removed drifting instrwnental fringes. The CH4, CO2, and CO absorptions are affected by the side lobes of nearby H20 absorption lines and may cause error in the mixing ratio estimatioD. Therefore, the result from the 1652.O-nm H20 Jidar, which has less contamination from other gas species, was used to correct the baseline of the other lidar data. The data were nonnalized both by the fitted baseline and by the H20 contribution, and finally fitted to the theoretical Voigt profile [18] using the center wavelength of the scan and a mixing ratio as the fitting parameters. The measured temperature, pressure, and round-trip path lengths were used to calculate the profiIe. Line parameters (center wavelength, line strength, etc.) are taken from the IDTRAN 2008 database [19]. Ten adjacent lines were included into the fitting process.
1.0~~~~ 0.' 0.8
o.
0.' 0.' a4 0.3 - MIIuuroddllllo(opA systam I. iIt • • cH.)
(l'IDI'I1»Iidd WId !IaseIine '" ~o aonIrilutign _ lid) 0.2 • • • Fitted THUll
0.', =;;=Ro::""""~~H,~o::oom='~'"~".;=:;~=:j O.Ot:
32(J(J.4 32!J0.B 3291.2 3291,6
Wavelength [nm]
0
a8
o. 6
• 0
, - -
-
-
MIMt8Ind ditto (OPA. .,-m 2. ,,/iii. CHo) (l'tOIITlartzed and lHoseline '" HJO ~ r.movad)
••• FlUad r.lult - R.mO'l1ld Hp cantribuUon
'650.90 1651.00 1651.10
Wavelength [nm]
Figure 6. Examples of measured scan data and fitting results. CH4 measurement at 3291.1 Drn (left) aDd 1650.9 Dm
(right) are shoWD. The scan data were averaged. divided by the signal from the integrating spbere. and further nonnalized by a polynomial baseline determined from tbe edge of the data, after the removal of the H10 contribution.
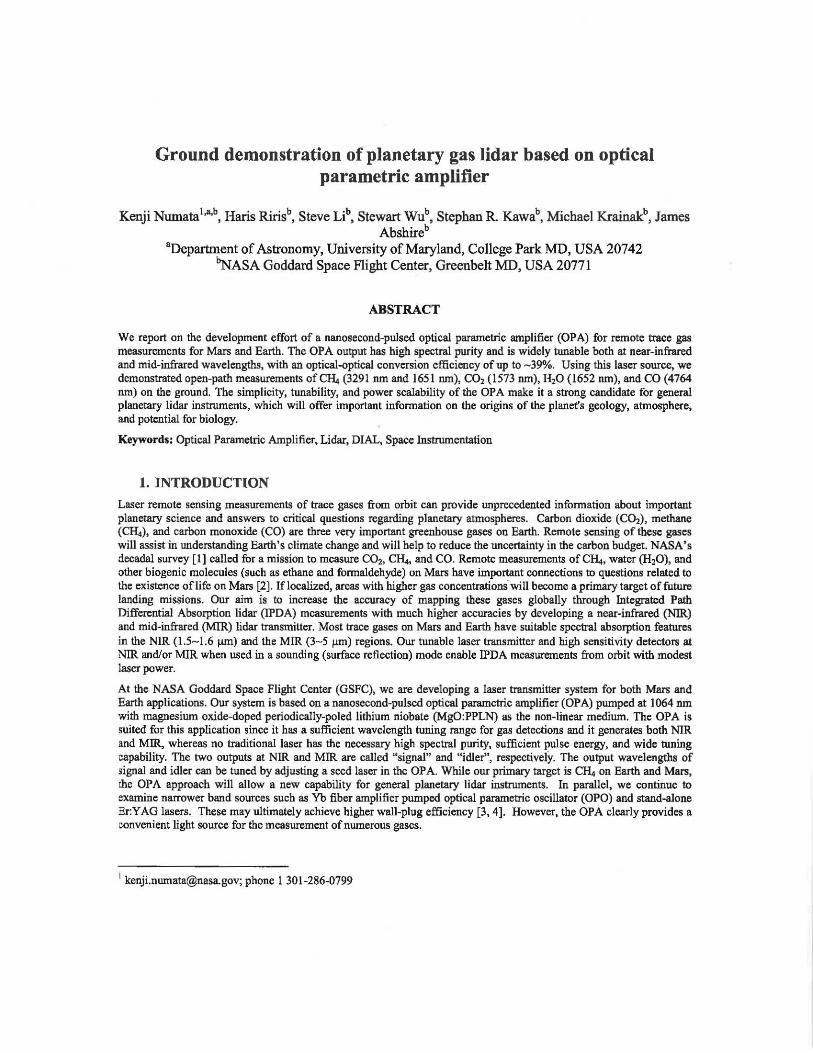
Figure 7 shows the result of simultaneous measurements of CH4, COl, and H20 mixing raijo over 50 hours (OPA system 1 and 2). The lidar measurements showed good agreement with in situ data for all three gases. Figure 8 shows the result of independent CO measurement (OPA system 3).
Local time (EOn 51279 m5J282am m 12 m 5 m 10 m S1293am 8am 1pm 6 m 11 m
i ~ !' D.
~ . _ .... 8 _ 3291nm Jidar (OPA system 1, idler) x· .- ... 1651nm lidar (OPA system 2, signal) o W ~~
tlo-----5L----L1o----~15----~2Q-----2L~!===3Oz:==~35=====4CO====45z===::y50
28
24
o 5 10 15
, ,
Measurement time [hours]
20 25 30
Measurement time [hours]
, , ,
.
35 40 45
, , ,
- - --~- -. . 20 "'_ 1' - ··· 1.6 ..rr-.-......... ~ ...... _-'-"'. ~JII'I!'''''W'.J.i 1.2~
o I I
5 10
I
15 I
20
t 25
1652rvn lidar (CPA system 2, signal) In sit..!
30 35 40 45
Measurement time [hours]
50
-
50
Figure 7. Simultaneous measurements oftbe diurnal variations of atmospheric CH4 (top). CO:! (middle), and H20 (bottom) measured with OPA systems I and 2, and an in situ sensor.
Loea: time (EDT) 101219 10122 28m 78m 12 m 5 m 10 1012338m Sam 6 11
0.50
35 40 45 50 Measurement time [hours]
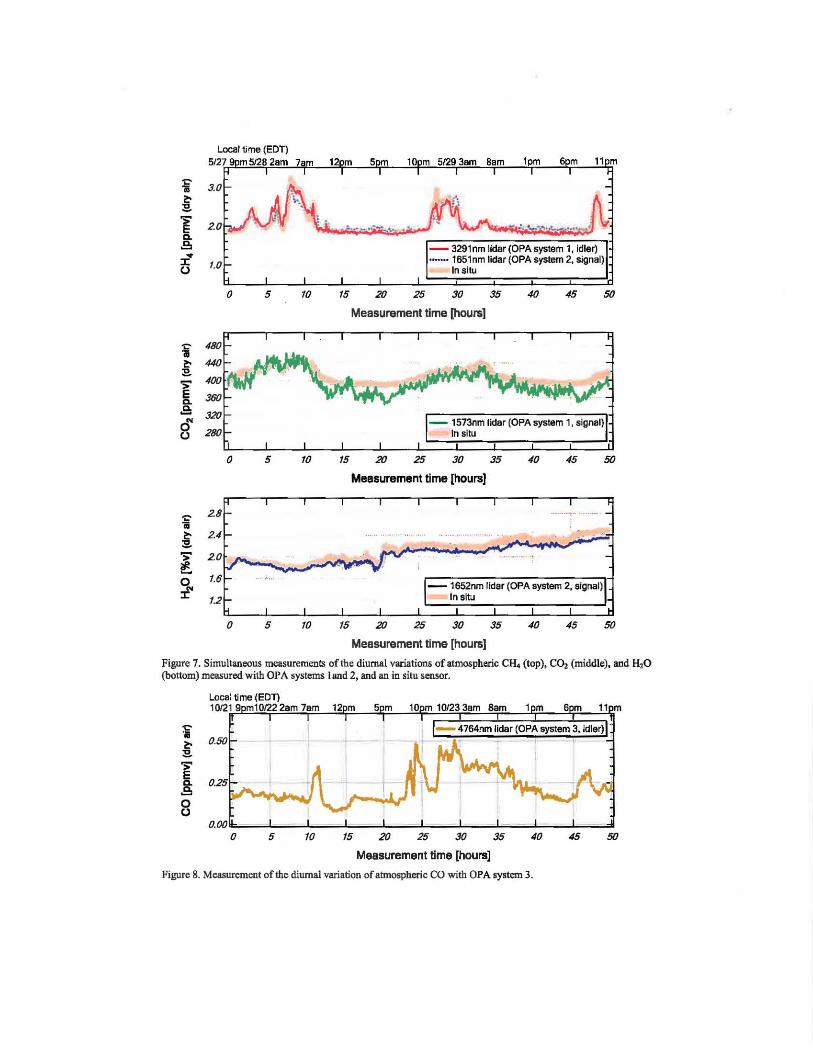
Figure 8. Measurement of the diurnal variation of atmospheric CO with OPA system 3.

4. DISCUSSION
4.1 Interpretation of results
The agreement between the lidar and the in situ sensor shows that the OPA system is capable of measuring variations in the mixing ratios of the atmospheric gases both at NIR and MJR. Their deviation can be largely explained by the difference between the lidar's column measUrement and the in situ device's point measurement. We observed -...±O.5 ppm and -±30 ppm mixing ratio variations in CH. and C(h channels, respectively. The source for the methane increase is thought to be the power plant at NASA GSFC, which uses natural gas from a nearby landfill. This hypothesis is in part supported by the difference observed between the two results from the two CH. channels. The 3291.1-nm channel (OPA system I, near target) has a better agreement with the in situ data, while the ·1650.9-nm channel (OPA system 2, far target) tcnded to show different C~ variations when increases occurred. This difference is possibly caused by the incoming CH4 flow in the pipeline for the power plant. The COl variation is equally likely to arise from respiration of vegetation at night. The larger fast fluctuation observed in the CO2 channel is likely a result of the optical interference effects (etalon fringes) between the two ends of the multi-mode fiber. The H20 channel (OPA system 2, far target) showed good agreement with in situ data. especially when no air-conditioning activity was ongoing in the building.
The CO diurnal variation measured by the 4764-nm channel (OPA system 3, near target) was the largest among the 4 measured species. This variation is most likely a result of car traffic actiVity. While this kind of dynamic CO variation was previously observed in early long-path measurements using a tunable diode laser [20], to the best of our knowledge, our measurement is the first CO open-path measurement based on OPA.
4.2Airborne demonstration
We upgraded OPA system 2 and successfully performed an airborne measurement ofCH. at 1650.9 nm from an ll-km altitude. A NIR photo-mu1tiplier detected a strong rerum signa1 from the earth surface from a few Ian in altitude. The optics components were mounted on stable, spring-free mounts, and the fiber-coupled beam expander was replaced by a free-space transmitter. Instead of the continuous seed wavelength scan descnDed in this paper. we implemented a stepped scan, which samples 20 wavelength points across the 1650.9-nm CH. line, pulse by pulse. These results win be reported in a separate paper. The successful flight demonstration confinned that the OPA approach should enable IPDA measurements from orbit once the laser power is scaled up.
4.3 Power scaling for space implementation
Since our system is less sensitive to alignment, it can be implemented by naturally enhancing existing Nd:YAG space laser instruments. For satellite-based instruments at a1titudes of a few lOOs of km, our -10-"u output energy has to be scaled up by a factor of2()....50. In the experiment presented here, our output energy is limited by the pump energy (-60 J,LJ). Since this OPA approach should be scalable to a higher output power as long as the crystal is not damaged, we are looking into injection seeded NPROs and burst-mode Vb fiber arnplifien as ways to boost the pump energy to the > I mJ level. We have used a 600-I..I-J injection-seeded NPRO and have obtained a -IOO.I..I-J signal output. The use of a fiber laser in burst mode is a new concept for OPA power scaling, and it potentia1ly offers higher wall-plug efficiency for space applications. In these high pump energy situations, back-conversion would lead to spectral broadening and may obscure detailed spectral features of low-pressure atmospheres. For example, the Doppler width of a C~ line at 3270.4 run is - 240 MHz for the Martian atmosphere (- 5 Torr at the surface). Although the impact due to the broadened linewidth can be largely mitigated by data analysis, keeping the laser linewidth as narrow as possible is highly desirable. Therefore, we might need to make our OPA a multiple stage device and arnplii)' a signal andtor an idler separately [211, especially for Mars applications, by using a longer pump pulse (- 10 nsee) and larger beam size inside the crystal.
5. CONCLUSIONS
Lidar will be a key technology for the measurement of atmospheric gases with high sensitivity and resolution on global .scales, and it will enhance our understanding of the cunent state of planetary atmospheres and geology. We have demonstrated the abHity to detect diurnal variations of several atmospheric trace gases both in the NIR and MIR regimes, using OPA and cooperative hard targets. COQ'lparative measurements of the C~, C92, and H20 variations measured by me OPA systems and by an in situ instrument showed good agreement. We measured four important greenhouse gases
using the OPA for Earth applications. Given a sufficient tuning range of the OPA, the measurements can be extended to other molecules. We beHeve that our approach will become a core technology in future planetary lidar instruments.
This work is supported by the ·NASA Astrobiology Program's Astrobiology Science and Technology Instnunent Development (ASTID) Program.
REFERENCES
[I] National Research Council, "Earth Science and Applications from Space: National Imperatives for the Next Decade and Be-yond," Jan. 2007, available from http://www.nap.edu!. [2] G. L. Villanueva, M. J. Mununa, and R. E. Novak, "Strong release of methane on Mars: Evidence of biology or geology?," 19th Annual VM Goldschmidt Conference, Davos, Switzerland, Geachimica et Cosmochimica Acta, 73, A1384 (2009). [3] Y. Chen, F. Kimpel, J.-L. Fouron and S. Gupta, "MW+ peak power sub-nsee lO-kHz repetition rate polarizationmaintaining fiber-amplifiers using tapered Yb-doped fibers," Proc. SPIE 8237, 82371T (2012). [4] D.-W. Chen, P. M. Belden, T. S. Rose, and S. M. Beck, ''Narrowband Er:YAG nonplanar ring oscillator at 1645 nm," Opt. Lell. 36, 1197 (2011). [5] R. A. Baumgartner and R. L. Byer, "Continuously tunable ir lidar with applications to remote measurements of SOl and 04," Appl. Opt. 17,3555 (1978). [6] M. 1. T. Milton, T. D. Gardiner, F. Molero, and 1. Galech, "Tnjection.seeded optical parametric oscillator for range· resolved DIAL measurements of atmospheric methane," Opt. Comm. 142, 153 (1997). [7] M. lmaki and T. Kobayashi, "Infrared frequency upeonverter for high-sensitivity imaging of gas plumes," Opt. Lell. 32, 1923 (2007). [8] A. Amediek, A. Fix, M. Wirth, and G. Ehret, "Development of an OPO system at 1.57 iffi1 for integrated path DIAL measurement of atmospheric carbon dioxide," Appl. Phys. B 92, 295 (2008). [9] D. Sakaizawa, C. Nagasawa, T. Nagai, M. Abo, Y. Shibata, M. Nakazato, and T. Sakai, "Development of a 1.6 iffi1 differential absorption lidar with a quasi·phase.matching optical parametric oscillator and photon-counting detector for the vertical CO, profile," Appl. Opt. 48, 748 (2009). . [10) A. Fix, C. BUdenbender, M. Wirth, M. Quatrevalet, A. Amediek, C. Kiemie, and G. Ehret, "Optical parametric oscillators and amplifiers fOT airborne and spacebome active remote sensing of COl and C~," Proc. SPIE 8182, 818206 (2011). [11) A. W. Yu, K. Numata, H. Riris, J. B. Abshire, G. Allan, X. Sun, and M. A. Krainak, "Mid-Infrared OPO for high resolution measurements of trace gases in the Mars atmosphere," in Laser Applications to Chemical, Security and Environmental Analysis, OSA Technical Digest (CD) (Optical Society of America), paper LMC5 (2008). [l2] J. Zayhowski, "Periodically poled lithium niobate optical parametric amplifiers pumped by high-power passively Qswitched microchip lasers," Opt. Lett. 22, 169 (1997). [13] K. Artiolek, R. Schmitt, T. Kuip, B. Riehman, S. Bisson, and P. Powers, "Microlaser-pumped periodically poled lithium niobate optical parametric generator-<>ptical parametric amplifier," Opt. Lell. 25, 557 (2000). [14] T. J. Kulp, S. E. Bisson, R. P. Barnbha , T. A. Reichardt, U. B. Goers, K. W. Aniolek , D. A. V. Kliner, B. A. Richman, K. M. Armstrong, R. Sommers, R. Schmitt, P. E. Powers, O. Levi, T. J. Pinguet, M. M. Fejer, J. P. Koplow, L. Goldberg, T. G. Mcrae, "The application of quasi·phase·matched parametric light sources to practical infrared chemical sensing systems", Appl. Phys. B 75,317 (2002). [15] T. A. Reichardt, R. P. Bambha, T. J. Kulp, and R. L. Schmitt, "Frequency-locked, injection-seeded, pulsed narrowband optical parametric generator," Appl. Opt. 42, 3564 (2003). [16] U. Bllder, T. Mattern, T. Bauer, J. Bartscbke, M. Rahm, A. Borsutzky, and R. Wallenstein, "Pulsed ·nanosecond optical parametric generator based on periodically poled lithinm niobate," Opt. Comm. Z17, 375 (2003) . . [17] I. T. Sorokina and K. L. Vodopyanov (Eds), "Solid-State Mid-Infrared Laser Sourc""," Springer, (2003), ISBN 3540006214. [18] E. E. Whiting, "An empirical approximation to the Voigt profile," Journal of Quantitative Spectroscopy and Radiative Transfer, 8,1379 (1968). P 9] L. S. Rothman, et. aI., "The HITRAN 2008 molecular spectroscopic database," Journal of Quantitative Spectroscopy and Radiative Transfer, 110, 533 (2009). [20] R T. Ku, E. D. HinkJey, and 1. O. Sample, "Long-path monitoring of atmospheric carbon monoxide with a tunable diode laser system," Appl. Opt. 14,854 (1975).

[21] J. Burris and D. Richter, "Tunable infrared radiation for atmospheric profiling," J. Appl. Remote Sens. 2,023527 (2008).