Embed Size (px)
Citation preview
62 June 2009
Gross Domestic Product by State Advance Statistics for 2008 and Revised Statistics for 2005–2007 By Caitlin E. Coakley, Daniel A. Reed, Shane T. Taylor
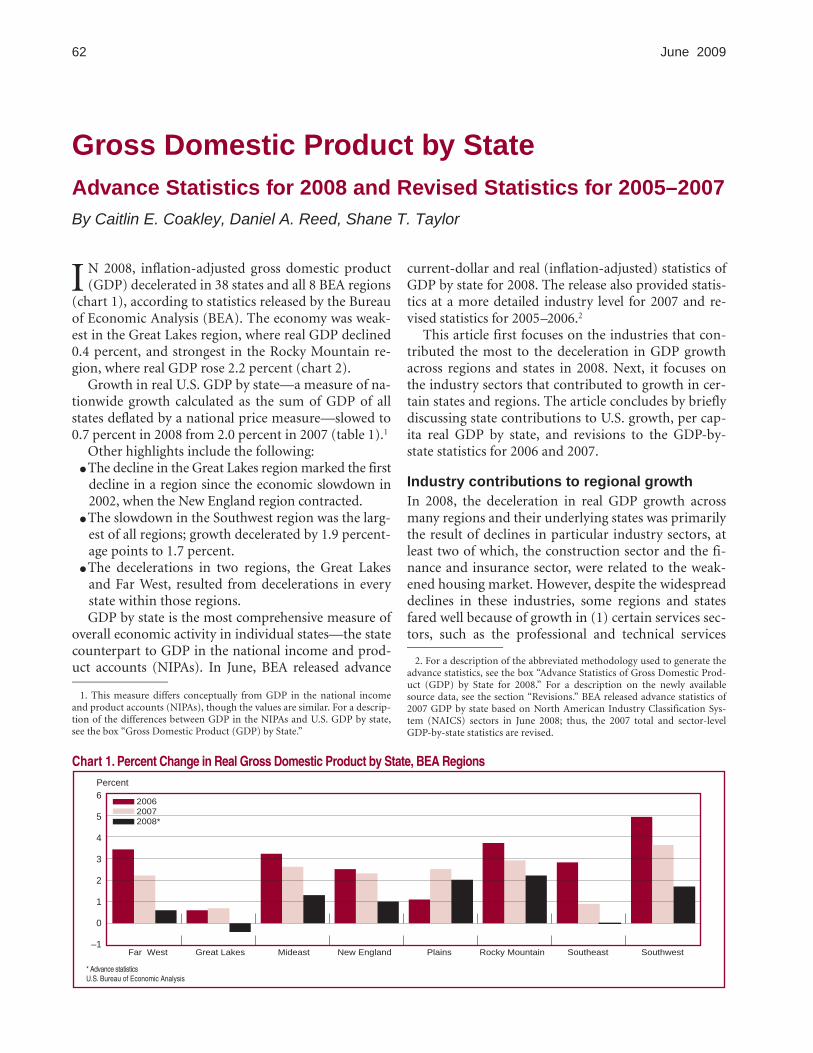
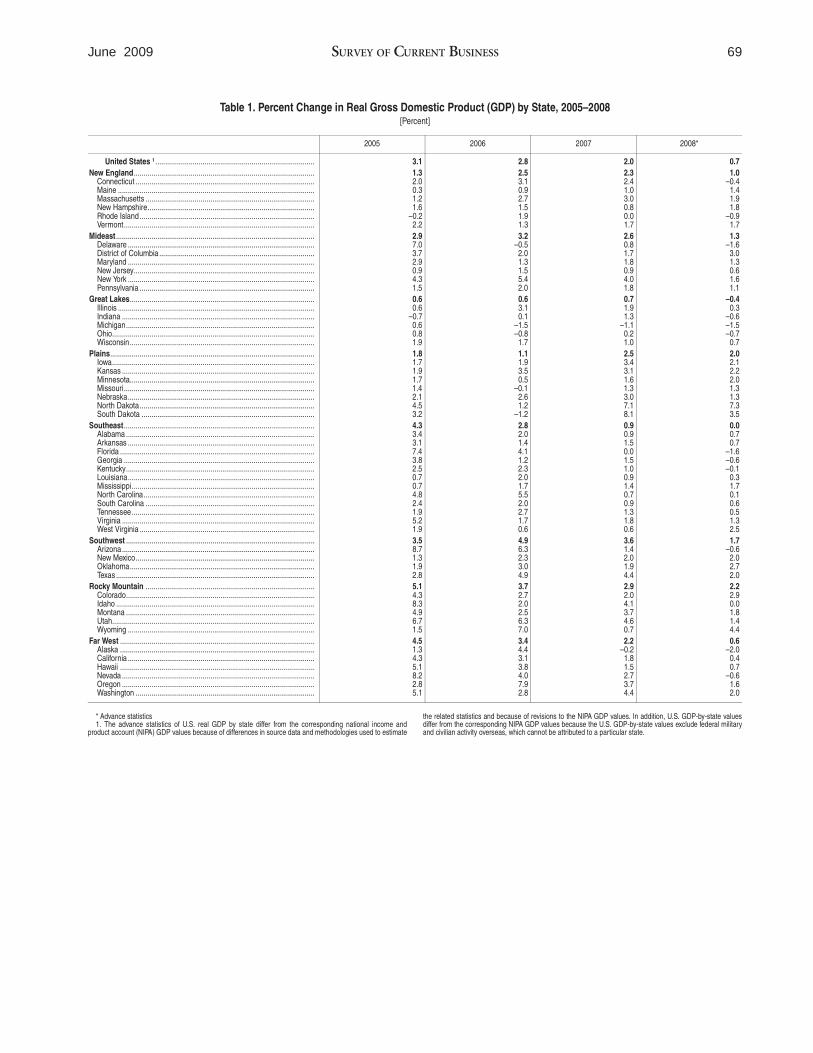
I N 2008, inflation-adjusted gross domestic product (GDP) decelerated in 38 states and all 8 BEA regions
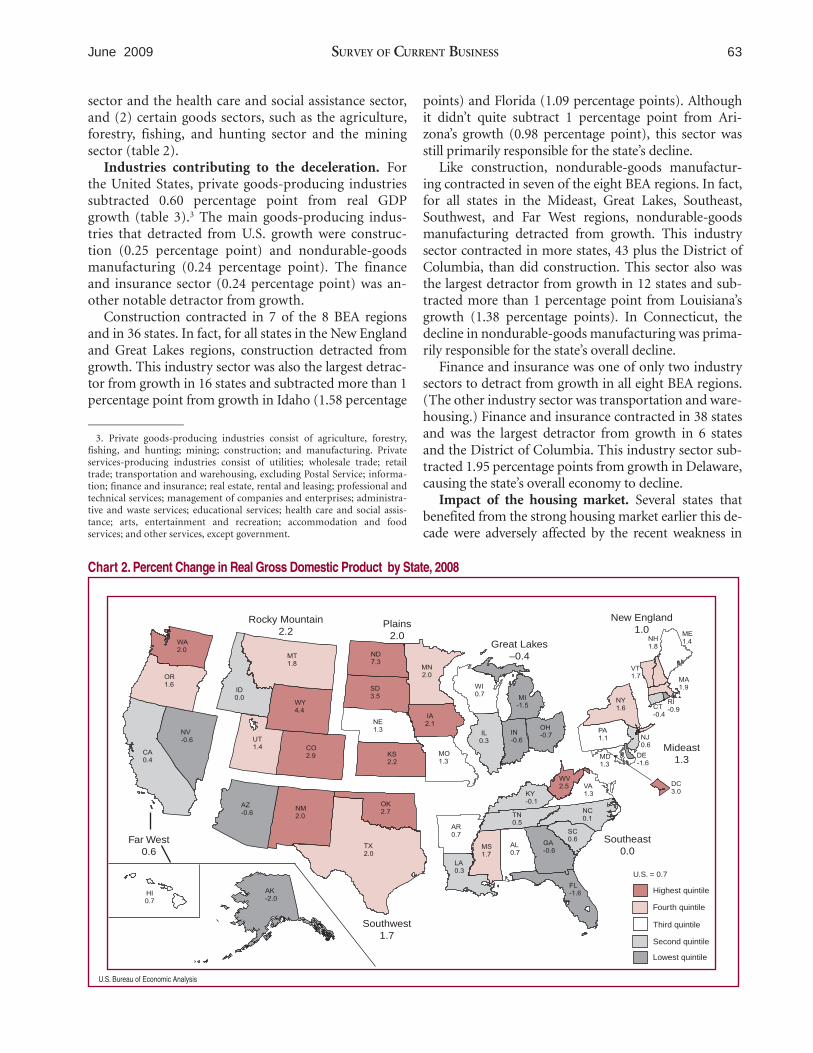
(chart 1), according to statistics released by the Bureau of Economic Analysis (BEA). The economy was weakest in the Great Lakes region, where real GDP declined 0.4 percent, and strongest in the Rocky Mountain region, where real GDP rose 2.2 percent (chart 2).
Growth in real U.S. GDP by state—a measure of nationwide growth calculated as the sum of GDP of all states deflated by a national price measure—slowed to 0.7 percent in 2008 from 2.0 percent in 2007 (table 1).1
Other highlights include the following: ● The decline in the Great Lakes region marked the first
decline in a region since the economic slowdown in 2002, when the New England region contracted.
● The slowdown in the Southwest region was the largest of all regions; growth decelerated by 1.9 percentage points to 1.7 percent.
● The decelerations in two regions, the Great Lakes and Far West, resulted from decelerations in every state within those regions. GDP by state is the most comprehensive measure of
overall economic activity in individual states—the state counterpart to GDP in the national income and product accounts (NIPAs). In June, BEA released advance
1. This measure differs conceptually from GDP in the national income and product accounts (NIPAs), though the values are similar. For a description of the differences between GDP in the NIPAs and U.S. GDP by state, see the box “Gross Domestic Product (GDP) by State.”
current-dollar and real (inflation-adjusted) statistics of GDP by state for 2008. The release also provided statistics at a more detailed industry level for 2007 and revised statistics for 2005–2006.2
This article first focuses on the industries that contributed the most to the deceleration in GDP growth across regions and states in 2008. Next, it focuses on the industry sectors that contributed to growth in certain states and regions. The article concludes by briefly discussing state contributions to U.S. growth, per capita real GDP by state, and revisions to the GDP-bystate statistics for 2006 and 2007.
Industry contributions to regional growth In 2008, the deceleration in real GDP growth across many regions and their underlying states was primarily the result of declines in particular industry sectors, at least two of which, the construction sector and the finance and insurance sector, were related to the weakened housing market. However, despite the widespread declines in these industries, some regions and states fared well because of growth in (1) certain services sectors, such as the professional and technical services
2. For a description of the abbreviated methodology used to generate the advance statistics, see the box “Advance Statistics of Gross Domestic Product (GDP) by State for 2008.” For a description on the newly available source data, see the section “Revisions.” BEA released advance statistics of 2007 GDP by state based on North American Industry Classification System (NAICS) sectors in June 2008; thus, the 2007 total and sector-level GDP-by-state statistics are revised.
Chart 1. Percent Change in Real Gross Domestic Product by State, BEA Regions
* Advance statistics U.S. Bureau of Economic Analysis
Far West Great Lakes Mideast New England Plains Rocky Mountain Southeast Southwest
2006 2007 2008*
Percent 6
5
4
3
2
1
0
–1
63 June 2009 SURVEY OF CURRENT BUSINESS
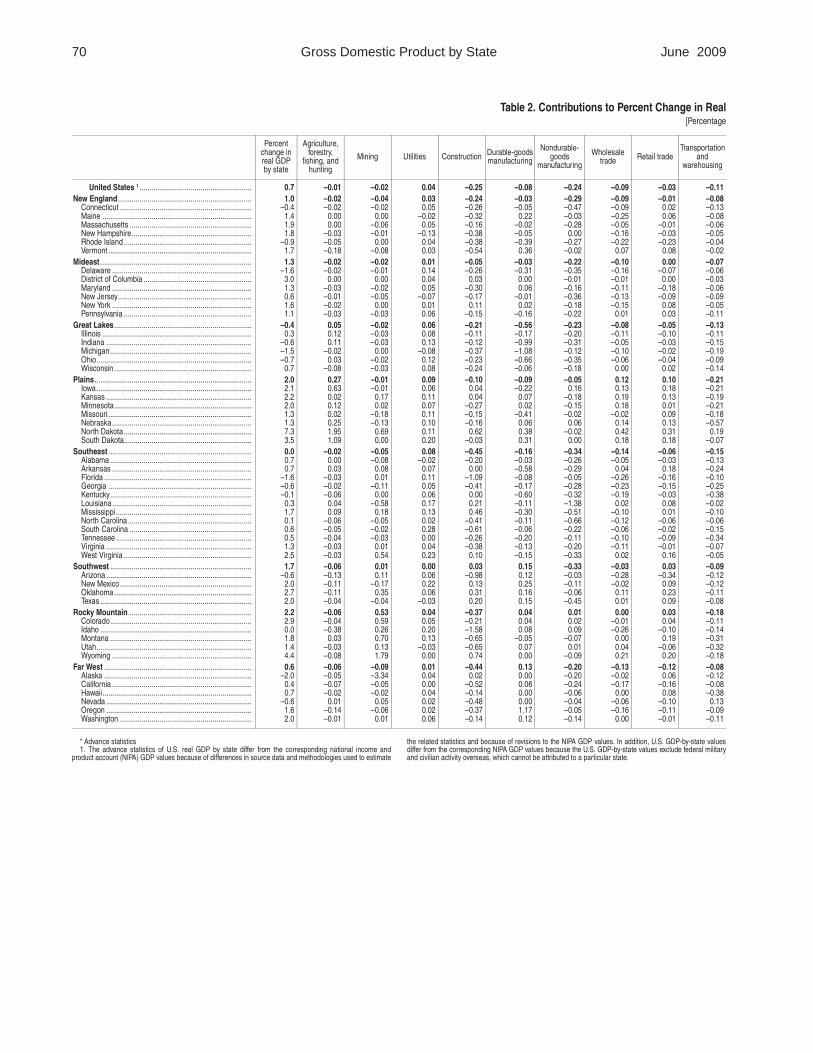
sector and the health care and social assistance sector, and (2) certain goods sectors, such as the agriculture, forestry, fishing, and hunting sector and the mining sector (table 2).
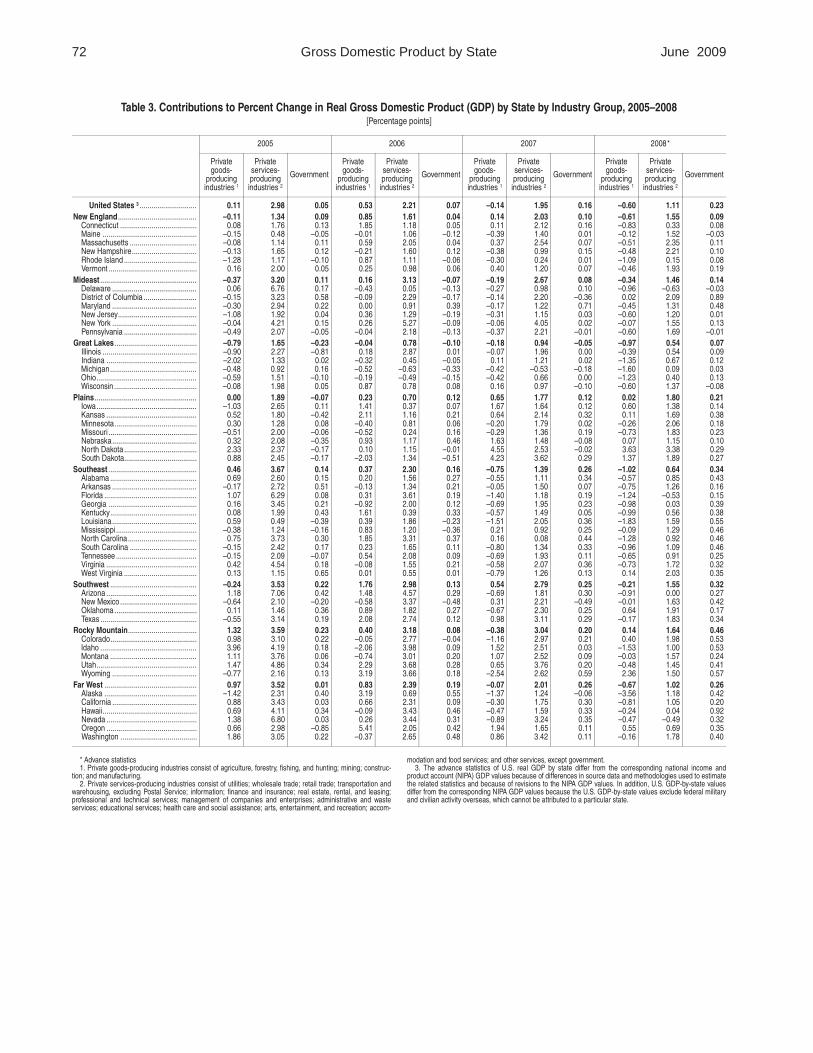
Industries contributing to the deceleration. For the United States, private goods-producing industries subtracted 0.60 percentage point from real GDP growth (table 3).3 The main goods-producing industries that detracted from U.S. growth were construction (0.25 percentage point) and nondurable-goods manufacturing (0.24 percentage point). The finance and insurance sector (0.24 percentage point) was another notable detractor from growth.
Construction contracted in 7 of the 8 BEA regions and in 36 states. In fact, for all states in the New England and Great Lakes regions, construction detracted from growth. This industry sector was also the largest detractor from growth in 16 states and subtracted more than 1 percentage point from growth in Idaho (1.58 percentage
3. Private goods-producing industries consist of agriculture, forestry, fishing, and hunting; mining; construction; and manufacturing. Private services-producing industries consist of utilities; wholesale trade; retail trade; transportation and warehousing, excluding Postal Service; information; finance and insurance; real estate, rental and leasing; professional and technical services; management of companies and enterprises; administrative and waste services; educational services; health care and social assistance; arts, entertainment and recreation; accommodation and food services; and other services, except government.
points) and Florida (1.09 percentage points). Although it didn’t quite subtract 1 percentage point from Arizona’s growth (0.98 percentage point), this sector was still primarily responsible for the state’s decline.
Like construction, nondurable-goods manufacturing contracted in seven of the eight BEA regions. In fact, for all states in the Mideast, Great Lakes, Southeast, Southwest, and Far West regions, nondurable-goods manufacturing detracted from growth. This industry sector contracted in more states, 43 plus the District of Columbia, than did construction. This sector also was the largest detractor from growth in 12 states and subtracted more than 1 percentage point from Louisiana’s growth (1.38 percentage points). In Connecticut, the decline in nondurable-goods manufacturing was primarily responsible for the state’s overall decline.
Finance and insurance was one of only two industry sectors to detract from growth in all eight BEA regions. (The other industry sector was transportation and warehousing.) Finance and insurance contracted in 38 states and was the largest detractor from growth in 6 states and the District of Columbia. This industry sector subtracted 1.95 percentage points from growth in Delaware, causing the state’s overall economy to decline.
Impact of the housing market. Several states that benefited from the strong housing market earlier this decade were adversely affected by the recent weakness in
Chart 2. Percent Change in Real Gross Domestic Product by State, 2008
New England Rocky Mountain Plains
Lowest quintile
Highest quintile
Fourth quintile
Second quintile
Third quintile
U.S. = 0.7
Far West 0.6
Southwest 1.7
2.2 2.0 Great Lakes
–0.4
Southeast 0.0
Mideast 1.3
1.0
DE -1.6
MD 1.3
PA 1.1 NJ
0.6
DC 3.0
NY 1.6 CT
-0.4
RI -0.9
MA 1.9
ME 1.4NH
1.8
VT 1.7
FL -1.6
GA -0.6
SC 0.6
NC 0.1
VA 1.3
WV 2.5
KY -0.1
TN 0.5
AL 0.7
MS 1.7
LA 0.3
AR 0.7
WI 0.7 MI
-1.5
OH -0.7IN
-0.6 IL
0.3
MO 1.3
KS 2.2
NE 1.3
IA 2.1
SD 3.5
MN 2.0
ND 7.3
MT 1.8
WY 4.4
ID 0.0
UT 1.4 CO
2.9
AZ -0.6
NM 2.0
TX 2.0
OK 2.7
WA 2.0
OR 1.6
NV -0.6
CA 0.4
HI 0.7
AK -2.0
U.S. Bureau of Economic Analysis
64 Gross Domestic Product by State June 2009
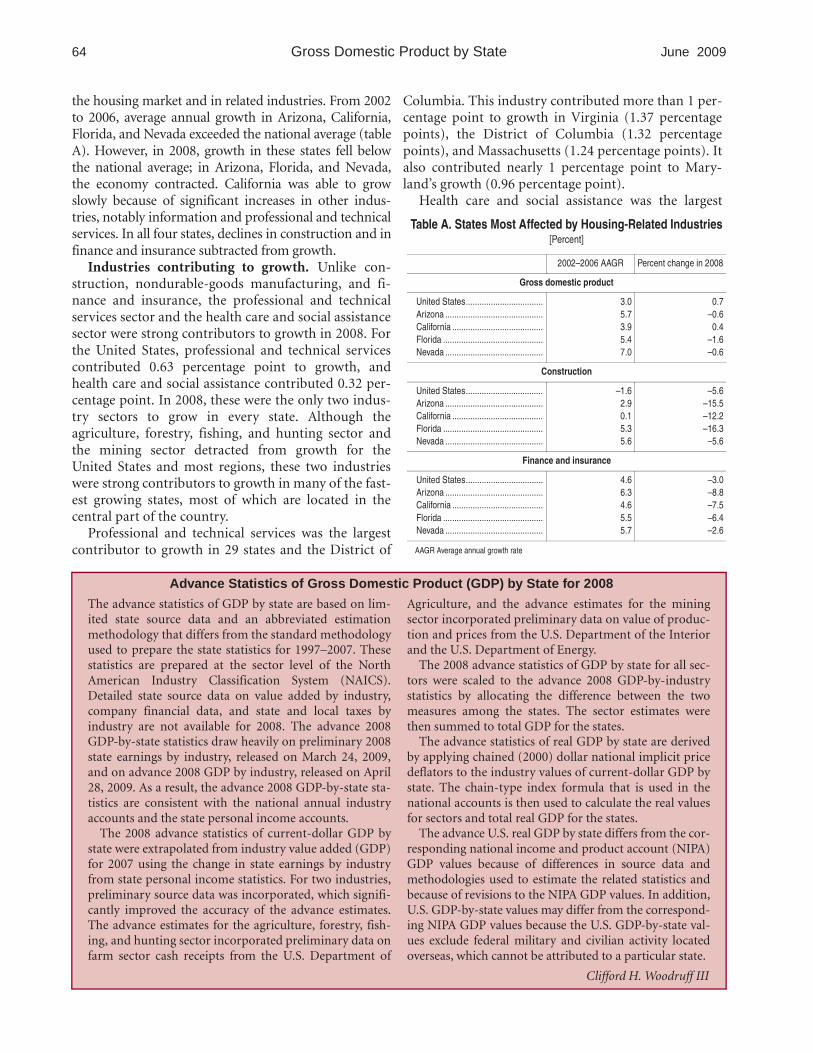
the housing market and in related industries. From 2002 to 2006, average annual growth in Arizona, California, Florida, and Nevada exceeded the national average (table A). However, in 2008, growth in these states fell below the national average; in Arizona, Florida, and Nevada, the economy contracted. California was able to grow slowly because of significant increases in other industries, notably information and professional and technical services. In all four states, declines in construction and in finance and insurance subtracted from growth.
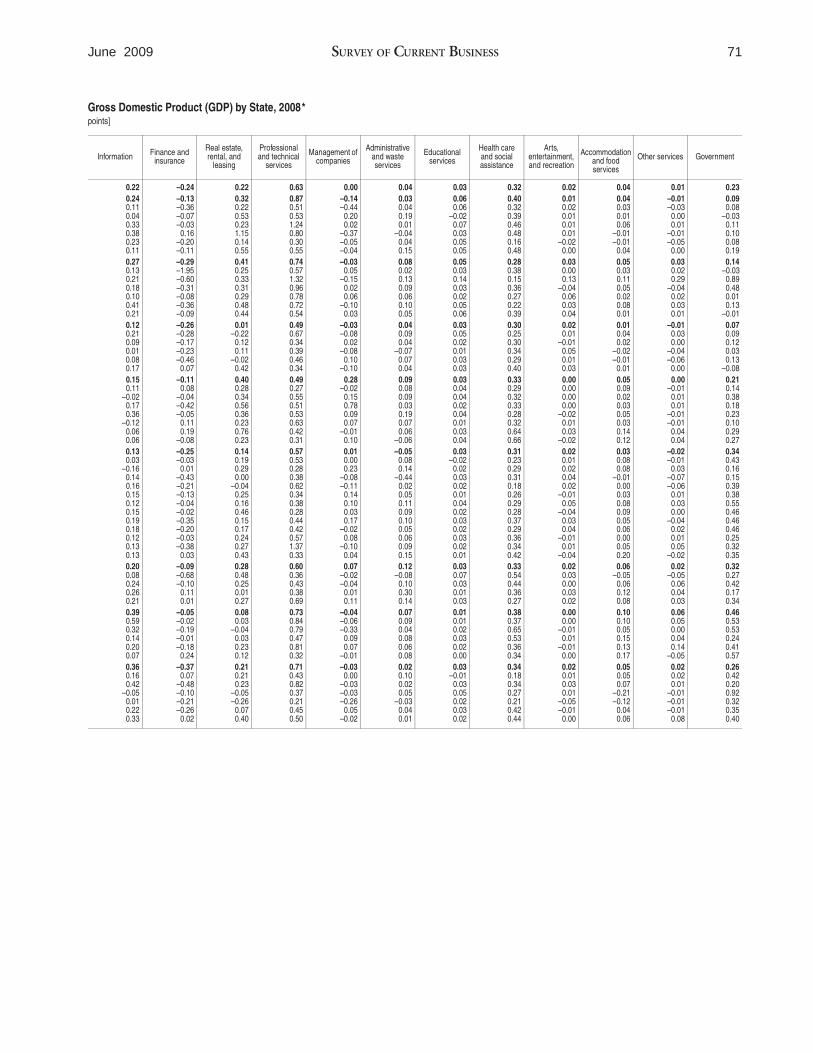
Industries contributing to growth. Unlike construction, nondurable-goods manufacturing, and finance and insurance, the professional and technical services sector and the health care and social assistance sector were strong contributors to growth in 2008. For the United States, professional and technical services contributed 0.63 percentage point to growth, and health care and social assistance contributed 0.32 percentage point. In 2008, these were the only two industry sectors to grow in every state. Although the agriculture, forestry, fishing, and hunting sector and the mining sector detracted from growth for the United States and most regions, these two industries were strong contributors to growth in many of the fastest growing states, most of which are located in the central part of the country.
Professional and technical services was the largest contributor to growth in 29 states and the District of
Columbia. This industry contributed more than 1 percentage point to growth in Virginia (1.37 percentage points), the District of Columbia (1.32 percentage points), and Massachusetts (1.24 percentage points). It also contributed nearly 1 percentage point to Maryland’s growth (0.96 percentage point).
Health care and social assistance was the largest
Table A. States Most Affected by Housing-Related Industries [Percent]
Percent change in 2008 2002–2006 AAGR
Gross domestic product
United States.................................. 3.0 0.7 Arizona ........................................... 5.7 –0.6 California ........................................ 3.9 0.4 Florida ............................................ 5.4 –1.6 Nevada ........................................... 7.0 –0.6
Construction
United States.................................. –1.6 –5.6 Arizona ........................................... 2.9 –15.5 California ........................................ 0.1 –12.2 Florida ............................................ 5.3 –16.3 Nevada ........................................... 5.6 –5.6
Finance and insurance
United States.................................. 4.6 –3.0 Arizona ........................................... 6.3 –8.8 California ........................................ 4.6 –7.5 Florida ............................................ 5.5 –6.4 Nevada ........................................... 5.7 –2.6
AAGR Average annual growth rate
Advance Statistics of Gross Domestic Product (GDP) by State for 2008
The advance statistics of GDP by state are based on lim- Agriculture, and the advance estimates for the mining ited state source data and an abbreviated estimation sector incorporated preliminary data on value of producmethodology that differs from the standard methodology tion and prices from the U.S. Department of the Interior used to prepare the state statistics for 1997–2007. These and the U.S. Department of Energy. statistics are prepared at the sector level of the North The 2008 advance statistics of GDP by state for all sec-American Industry Classification System (NAICS). tors were scaled to the advance 2008 GDP-by-industry Detailed state source data on value added by industry, statistics by allocating the difference between the two company financial data, and state and local taxes by measures among the states. The sector estimates were industry are not available for 2008. The advance 2008 then summed to total GDP for the states. GDP-by-state statistics draw heavily on preliminary 2008 The advance statistics of real GDP by state are derived state earnings by industry, released on March 24, 2009, by applying chained (2000) dollar national implicit price and on advance 2008 GDP by industry, released on April deflators to the industry values of current-dollar GDP by 28, 2009. As a result, the advance 2008 GDP-by-state sta- state. The chain-type index formula that is used in the tistics are consistent with the national annual industry national accounts is then used to calculate the real values accounts and the state personal income accounts. for sectors and total real GDP for the states.
The 2008 advance statistics of current-dollar GDP by The advance U.S. real GDP by state differs from the cor-state were extrapolated from industry value added (GDP) responding national income and product account (NIPA) for 2007 using the change in state earnings by industry GDP values because of differences in source data and from state personal income statistics. For two industries, methodologies used to estimate the related statistics and preliminary source data was incorporated, which signifi- because of revisions to the NIPA GDP values. In addition, cantly improved the accuracy of the advance estimates. U.S. GDP-by-state values may differ from the correspond-The advance estimates for the agriculture, forestry, fish- ing NIPA GDP values because the U.S. GDP-by-state valing, and hunting sector incorporated preliminary data on ues exclude federal military and civilian activity located farm sector cash receipts from the U.S. Department of overseas, which cannot be attributed to a particular state.
Clifford H. Woodruff III
65June 2009 SURVEY OF CURRENT BUSINESS
contributor to growth in three states—Arizona (0.54 percentage point), Arkansas (0.29 percentage point), and New Mexico (0.44 percentage point). This industry sector was a strong contributor to growth in South Dakota (0.66 percentage point), Idaho (0.65 percentage point), North Dakota (0.64 percentage point), and Montana (0.53 percentage point).
The agriculture, forestry, fishing, and hunting sector and the mining sector were significant contributors to growth in many states in the highest growth quintile. In North Dakota—the fastest growing state in 2008— agriculture, forestry, fishing, and hunting contributed 1.95 percentage points to the state’s real GDP growth, and mining contributed 0.69 percentage point. In Wyoming—the second fastest growing state in 2008— mining contributed 1.79 percentage points to growth. In Colorado and Oklahoma, mining was one of the largest contributors to growth, accounting for 20 percent and 13 percent of growth, respectively. In West Virginia, mining was the largest contributor to growth, accounting for more than 20 percent. In South Dakota and Iowa, agriculture, forestry, fishing, and hunting accounted for at least 30 percent of GDP growth.
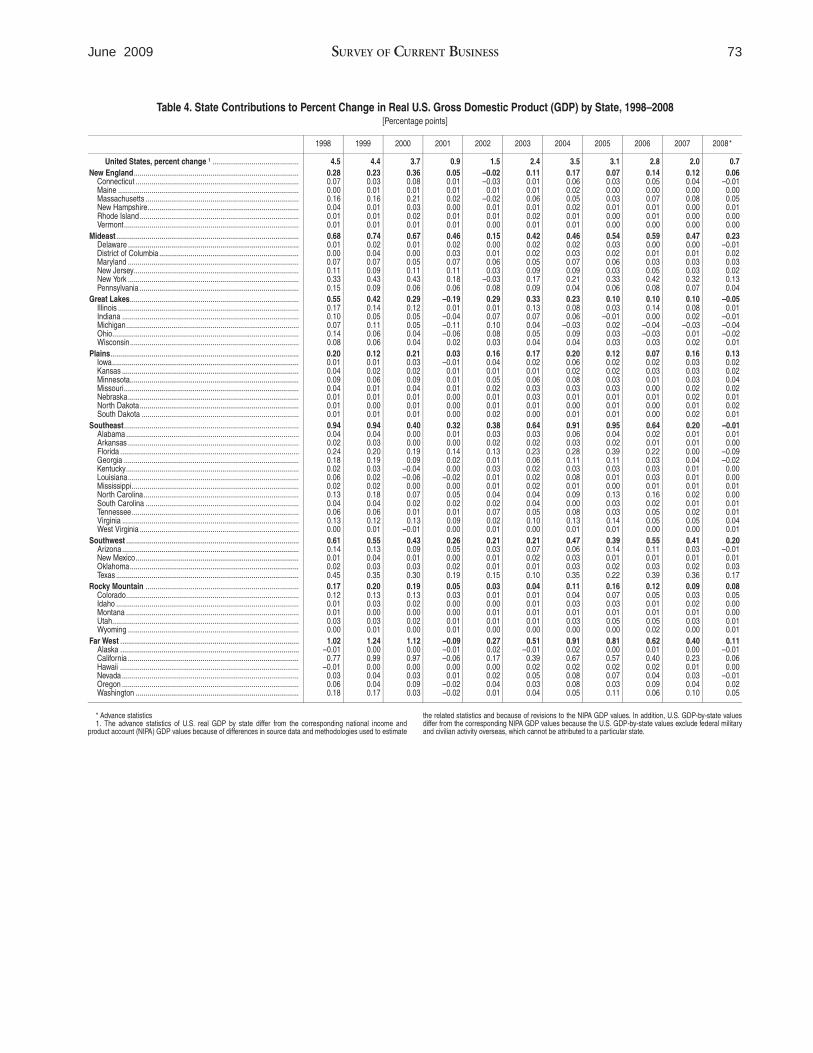
Regional contributions to U.S. growth Contributions to U.S. real GDP growth measure the percentage points that each region or state contributes to real U.S. growth (table 4). The two BEA regions
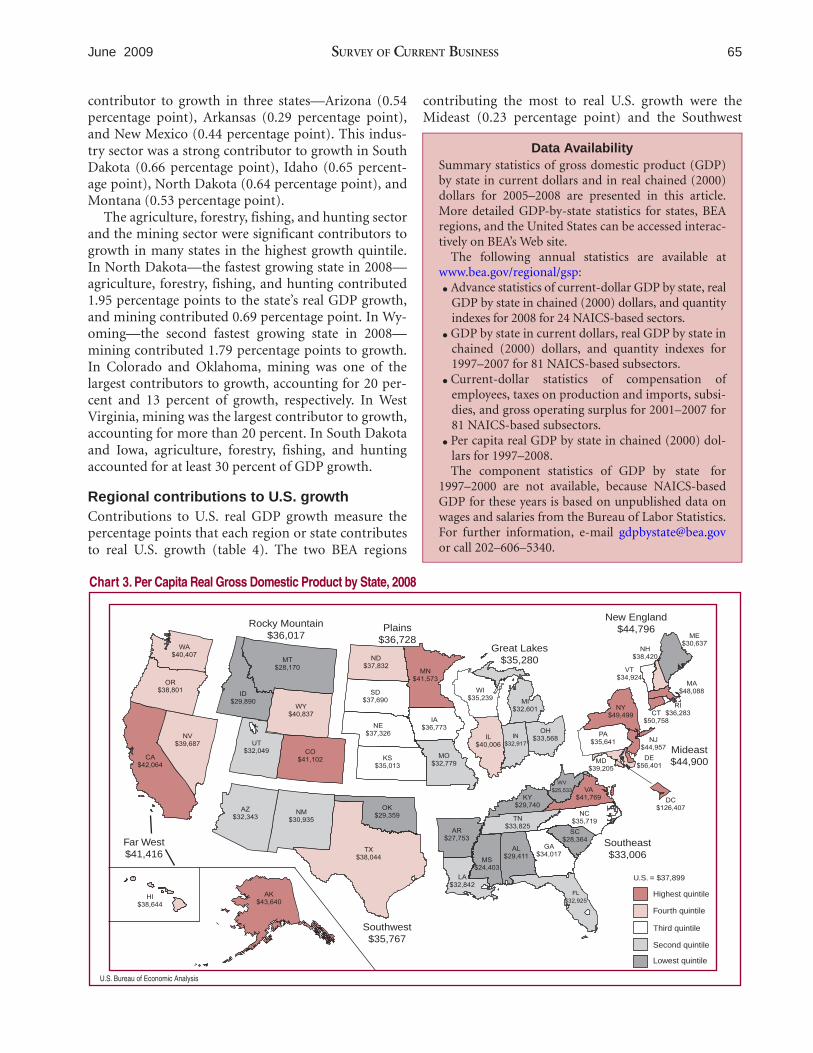
Chart 3. Per Capita Real Gross Domestic Product by State, 2008
contributing the most to real U.S. growth were the Mideast (0.23 percentage point) and the Southwest
Data Availability Summary statistics of gross domestic product (GDP) by state in current dollars and in real chained (2000) dollars for 2005–2008 are presented in this article. More detailed GDP-by-state statistics for states, BEA regions, and the United States can be accessed interactively on BEA’s Web site.
The following annual statistics are available at www.bea.gov/regional/gsp:
● Advance statistics of current-dollar GDP by state, real GDP by state in chained (2000) dollars, and quantity indexes for 2008 for 24 NAICS-based sectors.
● GDP by state in current dollars, real GDP by state in chained (2000) dollars, and quantity indexes for 1997–2007 for 81 NAICS-based subsectors.
● Current-dollar statistics of compensation of employees, taxes on production and imports, subsidies, and gross operating surplus for 2001–2007 for 81 NAICS-based subsectors.
● Per capita real GDP by state in chained (2000) dollars for 1997–2008. The component statistics of GDP by state for
1997–2000 are not available, because NAICS-based GDP for these years is based on unpublished data on wages and salaries from the Bureau of Labor Statistics. For further information, e-mail [email protected] or call 202–606–5340.
U.S. Bureau of Economic Analysis
Lowest quintile
Highest quintile
Fourth quintile
Second quintile
Third quintile
U.S. = $37,899
Far West $41,416
Southwest $35,767
Rocky Mountain $36,017
Plains $36,728
Great Lakes $35,280
Southeast $33,006
Mideast $44,900
New England $44,796
DE $56,401
MD $39,205
PA $35,641 NJ
$44,957
DC $126,407
NY $49,499 CT
$50,758
RI $36,283
MA $48,088
ME $30,637
NH $38,420
VT $34,924
FL $32,925
GA $34,017
SC $28,364
NC $35,719
VA $41,769
WV
$25,533
KY $29,740
TN $33,825
AL $29,411 MS
$24,403
LA $32,842
AR $27,753
WI $35,239 MI
$32,601
OH $33,568IN
$32,917 IL
$40,006
MO $32,779
KS $35,013
NE $37,326
IA $36,773
SD $37,690
MN $41,573
ND $37,832
MT $28,170
WY $40,837
ID $29,890
UT $32,049 CO
$41,102
AZ $32,343
NM $30,935
TX $38,044
OK $29,359
WA $40,407
OR $38,801
NV $39,687
CA $42,064
HI $38,644
AK $43,640
66 Gross Domestic Product by State June 2009
Gross Domestic Product (GDP) by State
Gross domestic product (GDP) by state, is calculated as the sum of incomes earned by labor and capital and the costs incurred in the production of goods and services; it includes the wages and salaries that workers earn, the income earned by sole proprietorships and partnerships and corporations, and business taxes—such as sales, property, and federal excise taxes—that count as a business expense.
In contrast, GDP in the national income and product accounts (NIPAs) is calculated as the sum of spending by consumers, businesses, and government on final goods and services, plus investment and net foreign trade. In theory, income earned should equal spending, but because of different data sources, income earned, usually referred to as “gross domestic income (GDI),” does not always equal what is spent (GDP). The difference is referred to as the “statistical discrepancy.”
Starting with the 2004 comprehensive revision, BEA’s annual industry accounts and its GDP-by-state accounts allocate the statistical discrepancy across all private-sector industries. Therefore, GDP by state is now conceptually more similar to GDP in the national accounts.
U.S. GDP-by-state values differ from the corresponding national income and product account (NIPA) GDP values, and thus the GDP-by-industry values from the annual industry accounts, because the U.S. GDP-by-state values exclude federal military and civilian activity overseas, which cannot be attributed to a particular state. The GDP-by-industry statistics are identical to those from the 2008 annual NIPA revision released in July 2008. However, because of revisions since July 2008, NIPA GDP may differ from U.S. GDP by state.
The GDP-by-state statistics for 1997 forward are prepared for 81 industries defined by the North American Industry Classification System (NAICS), and the estimates for 1963–97 are prepared for 75 industries defined by the Standard Industrial Classification (SIC). For each industry for 1963–97 and 2001–2007, the three components of GDP by state are presented: compensation of employees, taxes on production and imports less subsidies, and gross operating surplus.1 Compensation of employees is the sum of wage and salary accruals, employer contributions for employee pension and insurance funds, and employer contributions for government social insurance. Taxes on production and imports is the sum of federal excise taxes and customs duties, state and local government sales taxes, property taxes (including residential real estate taxes), motor vehicle licenses, severance taxes, other taxes, and special assessments. Gross operating surplus is the sum of corporate profits, proprietors’ income, rental income of persons, net interest, capital consumption allowances, business transfer payments, nontax payments, and the current surplus of government enterprises.
1. For an explanation of why the components of GDP by state for 1997–2000 are not available, see the box “Data Availability.”
Current-dollar statistics of GDP by state and its components are scaled to equal national totals of current-dollar GDP by industry and its components for all industries except federal military and civilian government. If the national total for an industry differs from the initial sum-ofstates for an industry, the difference between the national total and the sum-of-states total is allocated to the states according to the state distribution of the initial estimates.
The statistics of real GDP by state are prepared in chained (2000) dollars. Real GDP by state is an inflation-adjusted measure of each state’s gross domestic product that is based on national prices of the goods and services produced in that state. The statistics of real GDP by state and of quantity indexes with a base year of 2000 were derived by applying national implicit price deflators to the current-dollar GDP-by-state values for the 64 detailed NAICS-based industries for 1997 forward and for the 63 detailed SIC-based industries for 1977–97.
The chain-type index formula that is used in the national accounts is then used to calculate the values of total real GDP by state and of real GDP by state at more aggregated industry levels.2 Real GDP by state may reflect a substantial volume of output that is sold to other states and countries. To the extent that a state’s output is produced and sold in national markets at relatively uniform prices (or sold locally at national prices), real GDP by state captures the differences across states that reflect the relative differences in the mix of goods and services that the states produce. However, real GDP by state does not capture geographic differences in the prices of goods and services that are produced and sold locally.
BEA is working toward a long-term goal of replacing the national implicit price deflators used to deflate state-level current-dollar GDP by industry with state-specific prices. A paper posted on BEA’s Web site “Estimates of State and Metropolitan Price Levels for Consumption Goods and Services in the United States, 2005” by Bettina H. Aten presents estimates of spatial price deflators that may be used for adjusting price level differences across geographic areas (but not across time). The work is based on microlevel price data from the consumer price index of the Bureau of Labor Statistics and the American Community Survey of the Census Bureau. It represents an important first step in deriving producer-type price indexes—which are the basis for the national implicit price deflators used in BEA’s GDP-by-state accounts—at the state level. BEA plans to continue research into developing state-level prices and to explore estimating GDP by state on an expenditures basis.
2. For additional information, see J. Steven Landefeld and Robert P. Parker, “BEA’s Chain Indexes, Time Series, and Measures of Long-Term Economic Growth,” SURVEY 77 (May 1997): 58–68; and Gerard P. Aman, George K. Downey, and Sharon D. Panek, “Comprehensive Revision of Gross State Product: Accelerated Estimates for 2003 and Revised Estimates for 1977–2002,” SURVEY 85 (January 2005): 80–106.
Clifford H. Woodruff III
67 June 2009 SURVEY OF CURRENT BUSINESS
(0.20 percentage point). The growth in the Mideast largely reflected the contribution of New York (0.13 percentage point), while growth in the Southwest primarily reflected the contribution of Texas (0.17 percentage point). Growth in both of these states reflected growth in the professional and technical services sector.
Two BEA regions subtracted from national growth—the Great Lakes (0.05 percentage point) and the Southeast (0.01 percentage point). The contraction of the Great Lakes reflected declines in Michigan, Ohio, and Indiana. The contraction of the Southeast reflected declines in Florida and Georgia. The two states subtracting the most from national growth were Florida (0.09 percentage point) and Michigan (0.04 percentage point).
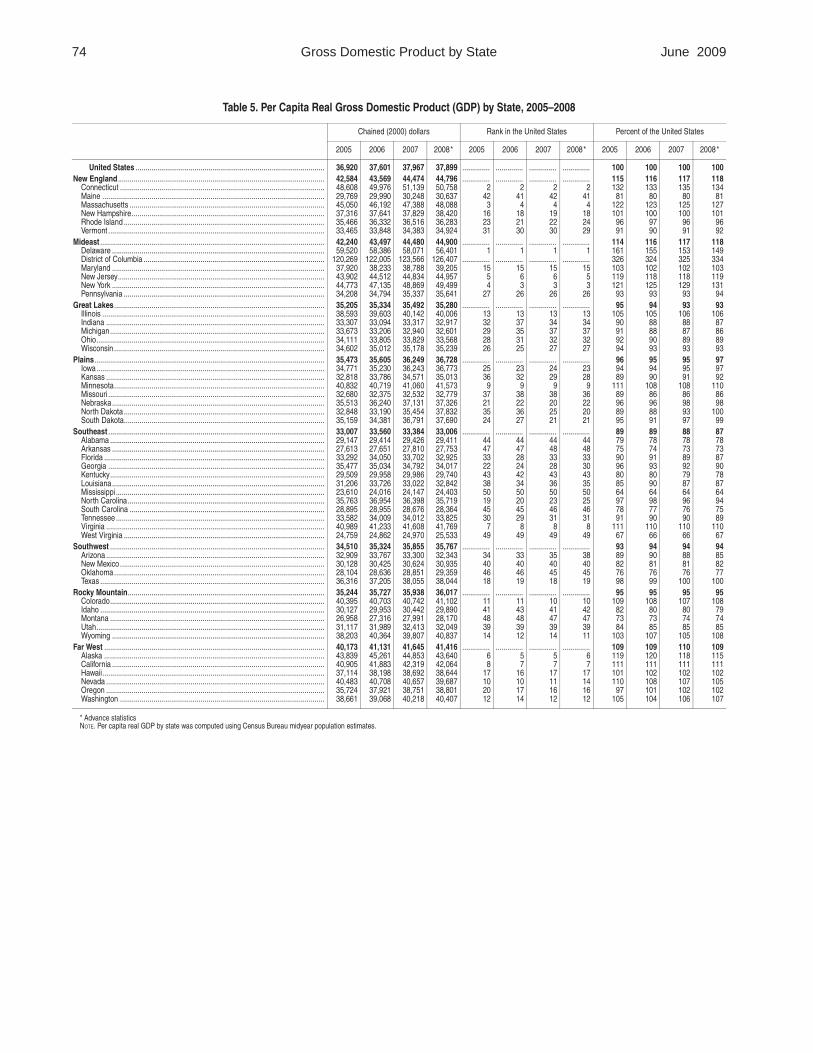
Per capita real GDP by state In 2008, per capita real GDP fell in 24 states and in 4 BEA regions. Both slowing or declining state GDP and growing population caused per capita real GDP in these states to fall. Nationwide, per capita real GDP decreased 0.2 percent in 2008.
In 2008, the states in the highest quintile of per capita real GDP did not change significantly from 2007. Delaware continues to have the highest per capita real GDP at $56,401 (table 5 and chart 3).4 The lowest quintile is almost identical to 2007 as well. Mississippi again had the lowest per capita real GDP in the nation at $24,403.
Typically, the year-to-year rankings of state’s per capita real GDP do not change much. However, North Dakota has made a sizeable leap since 2006, increasing its ranking by 16 places. In 2008, the state ranked 20th with a per capita real GDP of $37,832, which is roughly the national average. In comparison, the next closest absolute changes in rank since 2006 were South Dakota, which climbed six places to 21st, and Georgia,
4. Per capita real GDP by state is computed using Census Bureau midyear population estimates.
Acknowledgements The statistics of gross domestic product (GDP) by state were prepared by staff in the Regional Product Division under the direction of Charles Ian Mead, Chief, and Clifford H. Woodruff III, Chief of the Regional Product Branch. Joel D. Platt, Associate Director for Regional Economics, provided general guidance. Contributing staff members were Jennifer A. Bennett, Chief of the GDP by State Goods Section; Sharon D. Panek, Chief of the GDP by State Services Section; Frank T. Baumgardner; John E. Broda; Caitlin E. Coakley; Patricia J. Gailey; Natalie M. Hayes; William G. Kendall; Yolanda B. Lang-ford; Christian E. Malagon; Matthew J. McCormick; Daniel A. Reed; Ralph M. Rodriguez; and Shane T. Taylor.
which fell six places to 30th.
Revisions The revisions to GDP by state for 2005–2007 primarily reflect the incorporation of new state data from the Census Bureau, specifically the revised Annual Survey of Manufactures (ASM) for 2006, State and Local Government Finances for 2006, and State Government Finances data for 2007. The revised GDP-by-state statistics also incorporated the results of the annual revisions to the annual industry accounts, national income and product accounts, and state personal income statistics.5
As expected, revisions to the advance statistics for 2007, which were released in June 2008, were generally larger than the revisions for 2005–2006.
Current-dollar statistics. Revisions to the current-dollar statistics, measured as a percentage of the previously published data, were fairly small for most states. For 2007, the revisions ranged from –4.0 percent for Louisiana to 3.8 percent for South Dakota (table 6). For Louisiana, the revision was mainly due to a downward revision to nondurable-goods manufacturing, which resulted from the incorporation of revised 2006 ASM data. For South Dakota, the revision was due to an upward revision in agriculture, forestry, fishing, and hunting, based on revised farm data from the U.S. Department of Agriculture.
Inflation-adjusted statistics. The advance GDP growth rates for 2007 correctly identified the direction of change for 45 states and the District of Columbia and also correctly identified whether a state grew at a faster or slower pace than U.S. GDP growth for 39 states.
The revisions to the real growth rates were measured as a percentage point difference from the previously published growth rate. For 2007, only six states had a revision greater than 2 percentage points (in absolute terms); the mean absolute revision was 0.9 percentage point (table 7). The states with the largest absolute revisions were South Dakota (5.8 percentage points), North Dakota (4.1 percentage points), and the District of Columbia (–2.6 percentage points). Revisions to agriculture, forestry, fishing, and hunting led to the upward revisions in North and South Dakota. For the District of Columbia, the revision reflected downward revisions in real estate, rental, and leasing
5. See Soo jeong Kim, Vincent A. Davis, Anna M. Jacobson, and Amanda S. Lyndaker, “Annual Industry Accounts: Revised Statistics for 2005–2008,” SURVEY OF CURRENT BUSINESS 88 (December 2008): 21–31; Eugene P. Seskin and Shelly Smith, “Annual Revision of the National Income and Product Accounts: Annual Estimates for 2005–2007 and Quarterly Estimates 2005:I2008:I,” SURVEY 88 (August 2008): 6–22; David G. Lenze, “State Personal Income: Second Quarter of 2008 and Revised Statistics for 2005–2007,” SURVEY 88 (October 2008): 134–144; and Ann E. Dunbar and David G. Lenze, “Regional Quarterly Report,” SURVEY 89 (April 2009): 55–58.
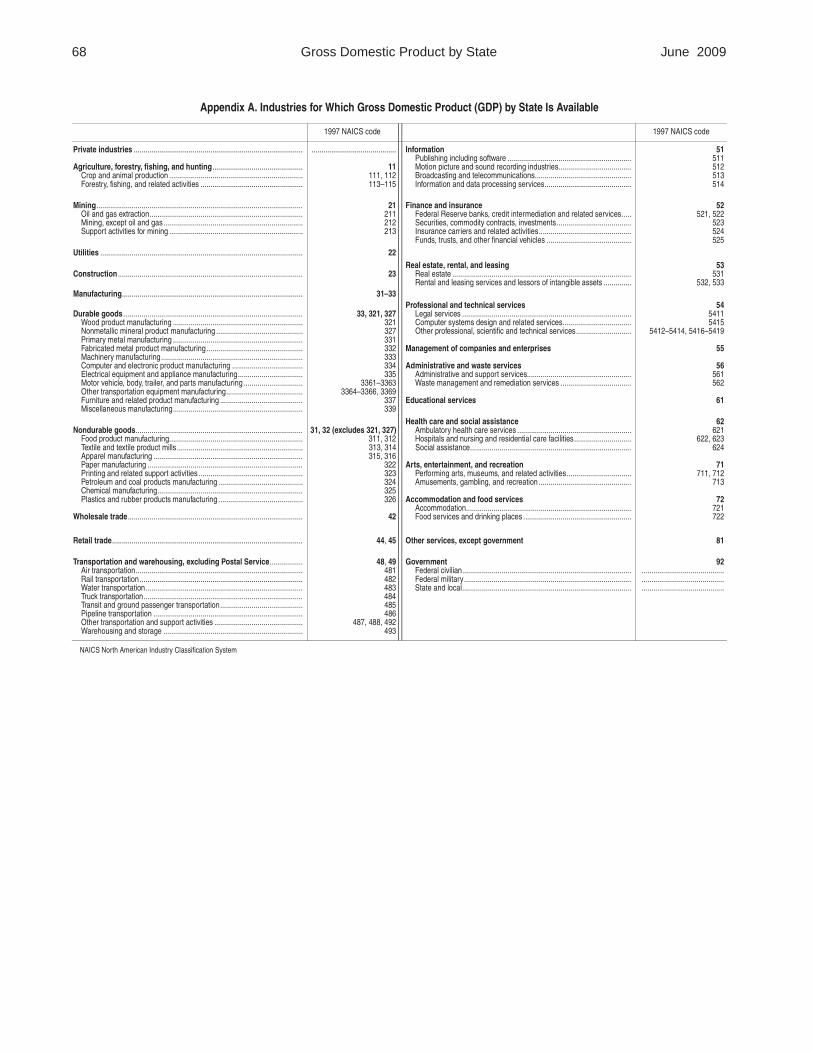
Appendix A and tables 1–10 follow.
68 Gross Domestic Product by State June 2009
Appendix A. Industries for Which Gross Domestic Product (GDP) by State Is Available
1997 NAICS code 1997 NAICS code
Private industries ......................................................................................
Agriculture, forestry, fishing, and hunting.............................................. Crop and animal production .................................................................... Forestry, fishing, and related activities ....................................................
...........................................
11 111, 112 113–115
Information Publishing including software ............................................................... Motion picture and sound recording industries..................................... Broadcasting and telecommunications................................................. Information and data processing services............................................
51 511 512 513 514
Mining......................................................................................................... Oil and gas extraction.............................................................................. Mining, except oil and gas....................................................................... Support activities for mining ....................................................................
Utilities .......................................................................................................
Construction ..............................................................................................
Manufacturing............................................................................................
Durable goods ........................................................................................... Wood product manufacturing .................................................................. Nonmetallic mineral product manufacturing ............................................ Primary metal manufacturing .................................................................. Fabricated metal product manufacturing ................................................. Machinery manufacturing........................................................................ Computer and electronic product manufacturing .................................... Electrical equipment and appliance manufacturing................................. Motor vehicle, body, trailer, and parts manufacturing .............................. Other transportation equipment manufacturing....................................... Furniture and related product manufacturing .......................................... Miscellaneous manufacturing..................................................................
Nondurable goods..................................................................................... Food product manufacturing.................................................................... Textile and textile product mills ................................................................ Apparel manufacturing ............................................................................ Paper manufacturing ............................................................................... Printing and related support activities ..................................................... Petroleum and coal products manufacturing ........................................... Chemical manufacturing.......................................................................... Plastics and rubber products manufacturing ...........................................
Wholesale trade.........................................................................................
21 211 212 213
22
23
31–33
33, 321, 327 321 327 331 332 333 334 335
3361–3363 3364–3366, 3369
337 339
31, 32 (excludes 321, 327) 311, 312 313, 314 315, 316
322 323 324 325 326
42
Finance and insurance Federal Reserve banks, credit intermediation and related services..... Securities, commodity contracts, investments...................................... Insurance carriers and related activities............................................... Funds, trusts, and other financial vehicles ...........................................
Real estate, rental, and leasing Real estate ........................................................................................... Rental and leasing services and lessors of intangible assets ..............
Professional and technical services Legal services ...................................................................................... Computer systems design and related services................................... Other professional, scientific and technical services............................
Management of companies and enterprises
Administrative and waste services Administrative and support services..................................................... Waste management and remediation services ....................................
Educational services
Health care and social assistance Ambulatory health care services .......................................................... Hospitals and nursing and residential care facilities............................. Social assistance..................................................................................
Arts, entertainment, and recreation Performing arts, museums, and related activities................................. Amusements, gambling, and recreation ...............................................
Accommodation and food services Accommodation.................................................................................... Food services and drinking places .......................................................
52 521, 522
523 524 525
53 531
532, 533
54 5411 5415
5412–5414, 5416–5419
55
56 561 562
61
62 621
622, 623 624
71 711, 712
713
72 721 722
Retail trade................................................................................................. 44, 45 Other services, except government 81
Transportation and warehousing, excluding Postal Service................. Air transportation..................................................................................... Rail transportation ................................................................................... Water transportation................................................................................ Truck transportation................................................................................. Transit and ground passenger transportation.......................................... Pipeline transportation ............................................................................ Other transportation and support activities ............................................. Warehousing and storage .......................................................................
48, 49 481 482 483 484 485 486
487, 488, 492 493
Government Federal civilian...................................................................................... Federal military..................................................................................... State and local......................................................................................
92 .......................................... .......................................... ..........................................
NAICS North American Industry Classification System
69 June 2009 SURVEY OF CURRENT BUSINESS
Table 1. Percent Change in Real Gross Domestic Product (GDP) by State, 2005–2008 [Percent]
2005 2006 2007 2008*
United States 1 ................................................................................. 3.1 2.8 2.0 0.7
New England............................................................................................ 1.3 2.5 2.3 1.0 Connecticut ........................................................................................... 2.0 3.1 2.4 –0.4 Maine .................................................................................................... 0.3 0.9 1.0 1.4 Massachusetts ...................................................................................... 1.2 2.7 3.0 1.9 New Hampshire..................................................................................... 1.6 1.5 0.8 1.8 Rhode Island ......................................................................................... –0.2 1.9 0.0 –0.9 Vermont................................................................................................. 2.2 1.3 1.7 1.7
Mideast ..................................................................................................... 2.9 3.2 2.6 1.3 Delaware ............................................................................................... 7.0 –0.5 0.8 –1.6 District of Columbia ............................................................................... 3.7 2.0 1.7 3.0 Maryland ............................................................................................... 2.9 1.3 1.8 1.3 New Jersey............................................................................................ 0.9 1.5 0.9 0.6 New York ............................................................................................... 4.3 5.4 4.0 1.6 Pennsylvania ......................................................................................... 1.5 2.0 1.8 1.1
Great Lakes.............................................................................................. 0.6 0.6 0.7 –0.4 Illinois .................................................................................................... 0.6 3.1 1.9 0.3 Indiana .................................................................................................. –0.7 0.1 1.3 –0.6 Michigan................................................................................................ 0.6 –1.5 –1.1 –1.5 Ohio....................................................................................................... 0.8 –0.8 0.2 –0.7 Wisconsin.............................................................................................. 1.9 1.7 1.0 0.7
Plains........................................................................................................ 1.8 1.1 2.5 2.0 Iowa....................................................................................................... 1.7 1.9 3.4 2.1 Kansas .................................................................................................. 1.9 3.5 3.1 2.2 Minnesota.............................................................................................. 1.7 0.5 1.6 2.0 Missouri................................................................................................. 1.4 –0.1 1.3 1.3 Nebraska............................................................................................... 2.1 2.6 3.0 1.3 North Dakota......................................................................................... 4.5 1.2 7.1 7.3 South Dakota ........................................................................................ 3.2 –1.2 8.1 3.5
Southeast................................................................................................. 4.3 2.8 0.9 0.0 Alabama ................................................................................................ 3.4 2.0 0.9 0.7 Arkansas ............................................................................................... 3.1 1.4 1.5 0.7 Florida ................................................................................................... 7.4 4.1 0.0 –1.6 Georgia ................................................................................................. 3.8 1.2 1.5 –0.6 Kentucky................................................................................................ 2.5 2.3 1.0 –0.1 Louisiana............................................................................................... 0.7 2.0 0.9 0.3 Mississippi............................................................................................. 0.7 1.7 1.4 1.7 North Carolina....................................................................................... 4.8 5.5 0.7 0.1 South Carolina ...................................................................................... 2.4 2.0 0.9 0.6 Tennessee............................................................................................. 1.9 2.7 1.3 0.5 Virginia .................................................................................................. 5.2 1.7 1.8 1.3 West Virginia ......................................................................................... 1.9 0.6 0.6 2.5
Southwest ................................................................................................ 3.5 4.9 3.6 1.7 Arizona .................................................................................................. 8.7 6.3 1.4 –0.6 New Mexico........................................................................................... 1.3 2.3 2.0 2.0 Oklahoma.............................................................................................. 1.9 3.0 1.9 2.7 Texas ..................................................................................................... 2.8 4.9 4.4 2.0
Rocky Mountain ...................................................................................... 5.1 3.7 2.9 2.2 Colorado................................................................................................ 4.3 2.7 2.0 2.9 Idaho ..................................................................................................... 8.3 2.0 4.1 0.0 Montana ................................................................................................ 4.9 2.5 3.7 1.8 Utah....................................................................................................... 6.7 6.3 4.6 1.4 Wyoming ............................................................................................... 1.5 7.0 0.7 4.4
Far West ................................................................................................... 4.5 3.4 2.2 0.6 Alaska ................................................................................................... 1.3 4.4 –0.2 –2.0 California ............................................................................................... 4.3 3.1 1.8 0.4 Hawaii ................................................................................................... 5.1 3.8 1.5 0.7 Nevada .................................................................................................. 8.2 4.0 2.7 –0.6 Oregon .................................................................................................. 2.8 7.9 3.7 1.6 Washington ........................................................................................... 5.1 2.8 4.4 2.0
* Advance statistics the related statistics and because of revisions to the NIPA GDP values. In addition, U.S. GDP-by-state values 1. The advance statistics of U.S. real GDP by state differ from the corresponding national income and differ from the corresponding NIPA GDP values because the U.S. GDP-by-state values exclude federal military
product account (NIPA) GDP values because of differences in source data and methodologies used to estimate and civilian activity overseas, which cannot be attributed to a particular state.
70 Gross Domestic Product by State June 2009
Table 2. Contributions to Percent Change in Real [Percentage
Percent change in real GDP by state
Agriculture, forestry,
fishing, and hunting
Mining Utilities Construction Durable-goods manufacturing
Nondurable- goods
manufacturing
Wholesale trade Retail trade
Transportation and
warehousing
United States 1 ......................................................... 0.7 –0.01 –0.02 0.04 –0.25 –0.08 –0.24 –0.09 –0.03 –0.11
New England .................................................................... 1.0 –0.02 –0.04 0.03 –0.24 –0.03 –0.29 –0.09 –0.01 –0.08 Connecticut ................................................................... –0.4 –0.02 –0.02 0.05 –0.26 –0.05 –0.47 –0.09 0.02 –0.13 Maine ............................................................................ 1.4 0.00 0.00 –0.02 –0.32 0.22 –0.03 –0.25 0.06 –0.08 Massachusetts .............................................................. 1.9 0.00 –0.06 0.05 –0.16 –0.02 –0.28 –0.05 –0.01 –0.06 New Hampshire............................................................. 1.8 –0.03 –0.01 –0.13 –0.38 –0.05 0.00 –0.16 –0.03 –0.05 Rhode Island ................................................................. –0.9 –0.05 0.00 0.04 –0.38 –0.39 –0.27 –0.22 –0.23 –0.04 Vermont ......................................................................... 1.7 –0.18 –0.08 0.03 –0.54 0.36 –0.02 0.07 0.08 –0.02
Mideast ............................................................................. 1.3 –0.02 –0.02 0.01 –0.05 –0.03 –0.22 –0.10 0.00 –0.07 Delaware ....................................................................... –1.6 –0.02 –0.01 0.14 –0.26 –0.31 –0.35 –0.16 –0.07 –0.06 District of Columbia ....................................................... 3.0 0.00 0.00 0.04 0.03 0.00 –0.01 –0.01 0.00 –0.03 Maryland ....................................................................... 1.3 –0.03 –0.02 0.05 –0.30 0.06 –0.16 –0.11 –0.18 –0.06 New Jersey.................................................................... 0.6 –0.01 –0.05 –0.07 –0.17 –0.01 –0.36 –0.13 –0.09 –0.09 New York ....................................................................... 1.6 –0.02 0.00 0.01 0.11 0.02 –0.18 –0.15 0.08 –0.05 Pennsylvania ................................................................. 1.1 –0.03 –0.03 0.06 –0.15 –0.16 –0.22 0.01 0.03 –0.11
Great Lakes...................................................................... –0.4 0.05 –0.02 0.06 –0.21 –0.56 –0.23 –0.08 –0.05 –0.13 Illinois ............................................................................ 0.3 0.12 –0.03 0.08 –0.11 –0.17 –0.20 –0.11 –0.10 –0.11 Indiana .......................................................................... –0.6 0.11 –0.03 0.13 –0.12 –0.99 –0.31 –0.05 –0.03 –0.15 Michigan........................................................................ –1.5 –0.02 0.00 –0.08 –0.37 –1.08 –0.12 –0.10 –0.02 –0.19 Ohio............................................................................... –0.7 0.03 –0.02 0.12 –0.23 –0.66 –0.35 –0.06 –0.04 –0.09 Wisconsin ...................................................................... 0.7 –0.08 –0.03 0.08 –0.24 –0.06 –0.18 0.00 0.02 –0.14
Plains................................................................................ 2.0 0.27 –0.01 0.09 –0.10 –0.09 –0.05 0.12 0.10 –0.21 Iowa............................................................................... 2.1 0.63 –0.01 0.06 0.04 –0.22 0.16 0.13 0.18 –0.21 Kansas .......................................................................... 2.2 0.02 0.17 0.11 0.04 0.07 –0.18 0.19 0.13 –0.19 Minnesota...................................................................... 2.0 0.12 0.02 0.07 –0.27 0.02 –0.15 0.18 0.01 –0.21 Missouri ......................................................................... 1.3 0.02 –0.18 0.11 –0.15 –0.41 –0.02 –0.02 0.09 –0.18 Nebraska....................................................................... 1.3 0.25 –0.13 0.10 –0.16 0.06 0.06 0.14 0.13 –0.57 North Dakota ................................................................. 7.3 1.95 0.69 0.11 0.62 0.38 –0.02 0.42 0.31 0.19 South Dakota................................................................. 3.5 1.09 0.00 0.20 –0.03 0.31 0.00 0.18 0.18 –0.07
Southeast ......................................................................... 0.0 –0.02 –0.05 0.08 –0.45 –0.16 –0.34 –0.14 –0.06 –0.15 Alabama ........................................................................ 0.7 0.00 –0.08 –0.02 –0.20 –0.03 –0.26 –0.05 –0.03 –0.13 Arkansas ....................................................................... 0.7 0.03 0.08 0.07 0.00 –0.58 –0.29 0.04 0.18 –0.24 Florida ........................................................................... –1.6 –0.03 0.01 0.11 –1.09 –0.08 –0.05 –0.26 –0.16 –0.10 Georgia ......................................................................... –0.6 –0.02 –0.11 0.05 –0.41 –0.17 –0.28 –0.23 –0.15 –0.25 Kentucky........................................................................ –0.1 –0.06 0.00 0.06 0.00 –0.60 –0.32 –0.19 –0.03 –0.38 Louisiana....................................................................... 0.3 0.04 –0.58 0.17 0.21 –0.11 –1.38 0.02 0.08 –0.02 Mississippi ..................................................................... 1.7 0.09 0.18 0.13 0.46 –0.30 –0.51 –0.10 0.01 –0.10 North Carolina ............................................................... 0.1 –0.06 –0.05 0.02 –0.41 –0.11 –0.66 –0.12 –0.06 –0.06 South Carolina .............................................................. 0.6 –0.05 –0.02 0.28 –0.61 –0.06 –0.22 –0.06 –0.02 –0.15 Tennessee ..................................................................... 0.5 –0.04 –0.03 0.00 –0.26 –0.20 –0.11 –0.10 –0.09 –0.34 Virginia .......................................................................... 1.3 –0.03 0.01 0.04 –0.38 –0.13 –0.20 –0.11 –0.01 –0.07 West Virginia ................................................................. 2.5 –0.03 0.54 0.23 0.10 –0.15 –0.33 0.02 0.16 –0.05
Southwest ........................................................................ 1.7 –0.06 0.01 0.00 0.03 0.15 –0.33 –0.03 0.03 –0.09 Arizona .......................................................................... –0.6 –0.13 0.11 0.06 –0.98 0.12 –0.03 –0.28 –0.34 –0.12 New Mexico ................................................................... 2.0 –0.11 –0.17 0.22 0.13 0.25 –0.11 –0.02 0.09 –0.12 Oklahoma ...................................................................... 2.7 –0.11 0.35 0.06 0.31 0.16 –0.06 0.11 0.23 –0.11 Texas ............................................................................. 2.0 –0.04 –0.04 –0.03 0.20 0.15 –0.45 0.01 0.09 –0.08
Rocky Mountain............................................................... 2.2 –0.06 0.53 0.04 –0.37 0.04 0.01 0.00 0.03 –0.18 Colorado........................................................................ 2.9 –0.04 0.59 0.05 –0.21 0.04 0.02 –0.01 0.04 –0.11 Idaho ............................................................................. 0.0 –0.38 0.26 0.20 –1.58 0.08 0.09 –0.26 –0.10 –0.14 Montana ........................................................................ 1.8 0.03 0.70 0.13 –0.65 –0.05 –0.07 0.00 0.19 –0.31 Utah............................................................................... 1.4 –0.03 0.13 –0.03 –0.65 0.07 0.01 0.04 –0.06 –0.32 Wyoming ....................................................................... 4.4 –0.08 1.79 0.00 0.74 0.00 –0.09 0.21 0.20 –0.18
Far West ........................................................................... 0.6 –0.06 –0.09 0.01 –0.44 0.13 –0.20 –0.13 –0.12 –0.08 Alaska ........................................................................... –2.0 –0.05 –3.34 0.04 0.02 0.00 –0.20 –0.02 0.06 –0.12 California ....................................................................... 0.4 –0.07 –0.05 0.00 –0.52 0.06 –0.24 –0.17 –0.16 –0.08 Hawaii............................................................................ 0.7 –0.02 –0.02 0.04 –0.14 0.00 –0.06 0.00 0.08 –0.38 Nevada .......................................................................... –0.6 0.01 0.05 0.02 –0.48 0.00 –0.04 –0.06 –0.10 0.13 Oregon .......................................................................... 1.6 –0.14 –0.06 0.02 –0.37 1.17 –0.05 –0.16 –0.11 –0.09 Washington ................................................................... 2.0 –0.01 0.01 0.06 –0.14 0.12 –0.14 0.00 –0.01 –0.11
* Advance statistics the related statistics and because of revisions to the NIPA GDP values. In addition, U.S. GDP-by-state values 1. The advance statistics of U.S. real GDP by state differ from the corresponding national income and differ from the corresponding NIPA GDP values because the U.S. GDP-by-state values exclude federal military
product account (NIPA) GDP values because of differences in source data and methodologies used to estimate and civilian activity overseas, which cannot be attributed to a particular state.
71 June 2009 SURVEY OF CURRENT BUSINESS
Gross Domestic Product (GDP) by State, 2008* points]
Information Finance and insurance
Real estate, rental, and
leasing
Professional and technical
services
Management of companies
Administrative and waste services
Educational services
Health care and social assistance
Arts, entertainment, and recreation
Accommodation and food services
Other services Government
0.22 –0.24 0.22 0.63 0.00 0.04 0.03 0.32 0.02 0.04 0.01 0.23
0.24 –0.13 0.32 0.87 –0.14 0.03 0.06 0.40 0.01 0.04 –0.01 0.09 0.11 –0.36 0.22 0.51 –0.44 0.04 0.06 0.32 0.02 0.03 –0.03 0.08 0.04 –0.07 0.53 0.53 0.20 0.19 –0.02 0.39 0.01 0.01 0.00 –0.03 0.33 –0.03 0.23 1.24 0.02 0.01 0.07 0.46 0.01 0.06 0.01 0.11 0.38 0.16 1.15 0.80 –0.37 –0.04 0.03 0.48 0.01 –0.01 –0.01 0.10 0.23 –0.20 0.14 0.30 –0.05 0.04 0.05 0.16 –0.02 –0.01 –0.05 0.08 0.11 –0.11 0.55 0.55 –0.04 0.15 0.05 0.48 0.00 0.04 0.00 0.19 0.27 –0.29 0.41 0.74 –0.03 0.08 0.05 0.28 0.03 0.05 0.03 0.14 0.13 –1.95 0.25 0.57 0.05 0.02 0.03 0.38 0.00 0.03 0.02 –0.03 0.21 –0.60 0.33 1.32 –0.15 0.13 0.14 0.15 0.13 0.11 0.29 0.89 0.18 –0.31 0.31 0.96 0.02 0.09 0.03 0.36 –0.04 0.05 –0.04 0.48 0.10 –0.08 0.29 0.78 0.06 0.06 0.02 0.27 0.06 0.02 0.02 0.01 0.41 –0.36 0.48 0.72 –0.10 0.10 0.05 0.22 0.03 0.08 0.03 0.13 0.21 –0.09 0.44 0.54 0.03 0.05 0.06 0.39 0.04 0.01 0.01 –0.01 0.12 –0.26 0.01 0.49 –0.03 0.04 0.03 0.30 0.02 0.01 –0.01 0.07 0.21 –0.28 –0.22 0.67 –0.08 0.09 0.05 0.25 0.01 0.04 0.03 0.09 0.09 –0.17 0.12 0.34 0.02 0.04 0.02 0.30 –0.01 0.02 0.00 0.12 0.01 –0.23 0.11 0.39 –0.08 –0.07 0.01 0.34 0.05 –0.02 –0.04 0.03 0.08 –0.46 –0.02 0.46 0.10 0.07 0.03 0.29 0.01 –0.01 –0.06 0.13 0.17 0.07 0.42 0.34 –0.10 0.04 0.03 0.40 0.03 0.01 0.00 –0.08 0.15 –0.11 0.40 0.49 0.28 0.09 0.03 0.33 0.00 0.05 0.00 0.21 0.11 0.08 0.28 0.27 –0.02 0.08 0.04 0.29 0.00 0.09 –0.01 0.14
–0.02 –0.04 0.34 0.55 0.15 0.09 0.04 0.32 0.00 0.02 0.01 0.38 0.17 –0.42 0.56 0.51 0.78 0.03 0.02 0.33 0.00 0.03 0.01 0.18 0.36 –0.05 0.36 0.53 0.09 0.19 0.04 0.28 –0.02 0.05 –0.01 0.23
–0.12 0.11 0.23 0.63 0.07 0.07 0.01 0.32 0.01 0.03 –0.01 0.10 0.06 0.19 0.76 0.42 –0.01 0.06 0.03 0.64 0.03 0.14 0.04 0.29 0.06 –0.08 0.23 0.31 0.10 –0.06 0.04 0.66 –0.02 0.12 0.04 0.27 0.13 –0.25 0.14 0.57 0.01 –0.05 0.03 0.31 0.02 0.03 –0.02 0.34 0.03 –0.03 0.19 0.53 0.00 0.08 –0.02 0.23 0.01 0.08 –0.01 0.43
–0.16 0.01 0.29 0.28 0.23 0.14 0.02 0.29 0.02 0.08 0.03 0.16 0.14 –0.43 0.00 0.38 –0.08 –0.44 0.03 0.31 0.04 –0.01 –0.07 0.15 0.16 –0.21 –0.04 0.62 –0.11 0.02 0.02 0.18 0.02 0.00 –0.06 0.39 0.15 –0.13 0.25 0.34 0.14 0.05 0.01 0.26 –0.01 0.03 0.01 0.38 0.12 –0.04 0.16 0.38 0.10 0.11 0.04 0.29 0.05 0.08 0.03 0.55 0.15 –0.02 0.46 0.28 0.03 0.09 0.02 0.28 –0.04 0.09 0.00 0.46 0.19 –0.35 0.15 0.44 0.17 0.10 0.03 0.37 0.03 0.05 –0.04 0.46 0.18 –0.20 0.17 0.42 –0.02 0.05 0.02 0.29 0.04 0.06 0.02 0.46 0.12 –0.03 0.24 0.57 0.08 0.06 0.03 0.36 –0.01 0.00 0.01 0.25 0.13 –0.38 0.27 1.37 –0.10 0.09 0.02 0.34 0.01 0.05 0.05 0.32 0.13 0.03 0.43 0.33 0.04 0.15 0.01 0.42 –0.04 0.20 –0.02 0.35 0.20 –0.09 0.28 0.60 0.07 0.12 0.03 0.33 0.02 0.06 0.02 0.32 0.08 –0.68 0.48 0.36 –0.02 –0.08 0.07 0.54 0.03 –0.05 –0.05 0.27 0.24 –0.10 0.25 0.43 –0.04 0.10 0.03 0.44 0.00 0.06 0.06 0.42 0.26 0.11 0.01 0.38 0.01 0.30 0.01 0.36 0.03 0.12 0.04 0.17 0.21 0.01 0.27 0.69 0.11 0.14 0.03 0.27 0.02 0.08 0.03 0.34 0.39 –0.05 0.08 0.73 –0.04 0.07 0.01 0.38 0.00 0.10 0.06 0.46 0.59 –0.02 0.03 0.84 –0.06 0.09 0.01 0.37 0.00 0.10 0.05 0.53 0.32 –0.19 –0.04 0.79 –0.33 0.04 0.02 0.65 –0.01 0.05 0.00 0.53 0.14 –0.01 0.03 0.47 0.09 0.08 0.03 0.53 0.01 0.15 0.04 0.24 0.20 –0.18 0.23 0.81 0.07 0.06 0.02 0.36 –0.01 0.13 0.14 0.41 0.07 0.24 0.12 0.32 –0.01 0.08 0.00 0.34 0.00 0.17 –0.05 0.57 0.36 –0.37 0.21 0.71 –0.03 0.02 0.03 0.34 0.02 0.05 0.02 0.26 0.16 0.07 0.21 0.43 0.00 0.10 –0.01 0.18 0.01 0.05 0.02 0.42 0.42 –0.48 0.23 0.82 –0.03 0.02 0.03 0.34 0.03 0.07 0.01 0.20
–0.05 –0.10 –0.05 0.37 –0.03 0.05 0.05 0.27 0.01 –0.21 –0.01 0.92 0.01 –0.21 –0.26 0.21 –0.26 –0.03 0.02 0.21 –0.05 –0.12 –0.01 0.32 0.22 –0.26 0.07 0.45 0.05 0.04 0.03 0.42 –0.01 0.04 –0.01 0.35 0.33 0.02 0.40 0.50 –0.02 0.01 0.02 0.44 0.00 0.06 0.08 0.40
72 Gross Domestic Product by State June 2009
Table 3. Contributions to Percent Change in Real Gross Domestic Product (GDP) by State by Industry Group, 2005–2008 [Percentage points]
2005 2006 2007 2008*
Private Private Private Private Private Private Private Private goods-
producing services-producing Government goods-
producing services-producing Government goods-
producing services-producing Government goods-
producing services-producing Government
industries 1 industries 2 industries 1 industries 2 industries 1 industries 2 industries 1 industries 2
United States 3 ............................. 0.11 2.98 0.05 0.53 2.21 0.07 –0.14 1.95 0.16 –0.60 1.11 0.23
New England ........................................ –0.11 1.34 0.09 0.85 1.61 0.04 0.14 2.03 0.10 –0.61 1.55 0.09 Connecticut ....................................... 0.08 1.76 0.13 1.85 1.18 0.05 0.11 2.12 0.16 –0.83 0.33 0.08 Maine ................................................ –0.15 0.48 –0.05 –0.01 1.06 –0.12 –0.39 1.40 0.01 –0.12 1.52 –0.03 Massachusetts .................................. –0.08 1.14 0.11 0.59 2.05 0.04 0.37 2.54 0.07 –0.51 2.35 0.11 New Hampshire................................. –0.13 1.65 0.12 –0.21 1.60 0.12 –0.38 0.99 0.15 –0.48 2.21 0.10 Rhode Island ..................................... –1.28 1.17 –0.10 0.87 1.11 –0.06 –0.30 0.24 0.01 –1.09 0.15 0.08 Vermont ............................................. 0.16 2.00 0.05 0.25 0.98 0.06 0.40 1.20 0.07 –0.46 1.93 0.19
Mideast ................................................. –0.37 3.20 0.11 0.16 3.13 –0.07 –0.19 2.67 0.08 –0.34 1.46 0.14 Delaware ........................................... 0.06 6.76 0.17 –0.43 0.05 –0.13 –0.27 0.98 0.10 –0.96 –0.63 –0.03 District of Columbia ........................... –0.15 3.23 0.58 –0.09 2.29 –0.17 –0.14 2.20 –0.36 0.02 2.09 0.89 Maryland ........................................... –0.30 2.94 0.22 0.00 0.91 0.39 –0.17 1.22 0.71 –0.45 1.31 0.48 New Jersey........................................ –1.08 1.92 0.04 0.36 1.29 –0.19 –0.31 1.15 0.03 –0.60 1.20 0.01 New York ........................................... –0.04 4.21 0.15 0.26 5.27 –0.09 –0.06 4.05 0.02 –0.07 1.55 0.13 Pennsylvania ..................................... –0.49 2.07 –0.05 –0.04 2.18 –0.13 –0.37 2.21 –0.01 –0.60 1.69 –0.01
Great Lakes.......................................... –0.79 1.65 –0.23 –0.04 0.78 –0.10 –0.18 0.94 –0.05 –0.97 0.54 0.07 Illinois ................................................ –0.90 2.27 –0.81 0.18 2.87 0.01 –0.07 1.96 0.00 –0.39 0.54 0.09 Indiana .............................................. –2.02 1.33 0.02 –0.32 0.45 –0.05 0.11 1.21 0.02 –1.35 0.67 0.12 Michigan............................................ –0.48 0.92 0.16 –0.52 –0.63 –0.33 –0.42 –0.53 –0.18 –1.60 0.09 0.03 Ohio................................................... –0.59 1.51 –0.10 –0.19 –0.49 –0.15 –0.42 0.66 0.00 –1.23 0.40 0.13 Wisconsin .......................................... –0.08 1.98 0.05 0.87 0.78 0.08 0.16 0.97 –0.10 –0.60 1.37 –0.08
Plains.................................................... 0.00 1.89 –0.07 0.23 0.70 0.12 0.65 1.77 0.12 0.02 1.80 0.21 Iowa................................................... –1.03 2.65 0.11 1.41 0.37 0.07 1.67 1.64 0.12 0.60 1.38 0.14 Kansas .............................................. 0.52 1.80 –0.42 2.11 1.16 0.21 0.64 2.14 0.32 0.11 1.69 0.38 Minnesota.......................................... 0.30 1.28 0.08 –0.40 0.81 0.06 –0.20 1.79 0.02 –0.26 2.06 0.18 Missouri ............................................. –0.51 2.00 –0.06 –0.52 0.24 0.16 –0.29 1.36 0.19 –0.73 1.83 0.23 Nebraska........................................... 0.32 2.08 –0.35 0.93 1.17 0.46 1.63 1.48 –0.08 0.07 1.15 0.10 North Dakota ..................................... 2.33 2.37 –0.17 0.10 1.15 –0.01 4.55 2.53 –0.02 3.63 3.38 0.29 South Dakota..................................... 0.88 2.45 –0.17 –2.03 1.34 –0.51 4.23 3.62 0.29 1.37 1.89 0.27
Southeast ............................................. 0.46 3.67 0.14 0.37 2.30 0.16 –0.75 1.39 0.26 –1.02 0.64 0.34 Alabama ............................................ 0.69 2.60 0.15 0.20 1.56 0.27 –0.55 1.11 0.34 –0.57 0.85 0.43 Arkansas ........................................... –0.17 2.72 0.51 –0.13 1.34 0.21 –0.05 1.50 0.07 –0.75 1.26 0.16 Florida ............................................... 1.07 6.29 0.08 0.31 3.61 0.19 –1.40 1.18 0.19 –1.24 –0.53 0.15 Georgia ............................................. 0.16 3.45 0.21 –0.92 2.00 0.12 –0.69 1.95 0.23 –0.98 0.03 0.39 Kentucky............................................ 0.08 1.99 0.43 1.61 0.39 0.33 –0.57 1.49 0.05 –0.99 0.56 0.38 Louisiana........................................... 0.59 0.49 –0.39 0.39 1.86 –0.23 –1.51 2.05 0.36 –1.83 1.59 0.55 Mississippi ......................................... –0.38 1.24 –0.16 0.83 1.20 –0.36 0.21 0.92 0.25 –0.09 1.29 0.46 North Carolina ................................... 0.75 3.73 0.30 1.85 3.31 0.37 0.16 0.08 0.44 –1.28 0.92 0.46 South Carolina .................................. –0.15 2.42 0.17 0.23 1.65 0.11 –0.80 1.34 0.33 –0.96 1.09 0.46 Tennessee ......................................... –0.15 2.09 –0.07 0.54 2.08 0.09 –0.69 1.93 0.11 –0.65 0.91 0.25 Virginia .............................................. 0.42 4.54 0.18 –0.08 1.55 0.21 –0.58 2.07 0.36 –0.73 1.72 0.32 West Virginia ..................................... 0.13 1.15 0.65 0.01 0.55 0.01 –0.79 1.26 0.13 0.14 2.03 0.35
Southwest ............................................ –0.24 3.53 0.22 1.76 2.98 0.13 0.54 2.79 0.25 –0.21 1.55 0.32 Arizona .............................................. 1.18 7.06 0.42 1.48 4.57 0.29 –0.69 1.81 0.30 –0.91 0.00 0.27 New Mexico ....................................... –0.64 2.10 –0.20 –0.58 3.37 –0.48 0.31 2.21 –0.49 –0.01 1.63 0.42 Oklahoma .......................................... 0.11 1.46 0.36 0.89 1.82 0.27 –0.67 2.30 0.25 0.64 1.91 0.17 Texas ................................................. –0.55 3.14 0.19 2.08 2.74 0.12 0.98 3.11 0.29 –0.17 1.83 0.34
Rocky Mountain................................... 1.32 3.59 0.23 0.40 3.18 0.08 –0.38 3.04 0.20 0.14 1.64 0.46 Colorado............................................ 0.98 3.10 0.22 –0.05 2.77 –0.04 –1.16 2.97 0.21 0.40 1.98 0.53 Idaho ................................................. 3.96 4.19 0.18 –2.06 3.98 0.09 1.52 2.51 0.03 –1.53 1.00 0.53 Montana ............................................ 1.11 3.76 0.06 –0.74 3.01 0.20 1.07 2.52 0.09 –0.03 1.57 0.24 Utah................................................... 1.47 4.86 0.34 2.29 3.68 0.28 0.65 3.76 0.20 –0.48 1.45 0.41 Wyoming ........................................... –0.77 2.16 0.13 3.19 3.66 0.18 –2.54 2.62 0.59 2.36 1.50 0.57
Far West ............................................... 0.97 3.52 0.01 0.83 2.39 0.19 –0.07 2.01 0.26 –0.67 1.02 0.26 Alaska ............................................... –1.42 2.31 0.40 3.19 0.69 0.55 –1.37 1.24 –0.06 –3.56 1.18 0.42 California ........................................... 0.88 3.43 0.03 0.66 2.31 0.09 –0.30 1.75 0.30 –0.81 1.05 0.20 Hawaii................................................ 0.69 4.11 0.34 –0.09 3.43 0.46 –0.47 1.59 0.33 –0.24 0.04 0.92 Nevada .............................................. 1.38 6.80 0.03 0.26 3.44 0.31 –0.89 3.24 0.35 –0.47 –0.49 0.32 Oregon .............................................. 0.66 2.98 –0.85 5.41 2.05 0.42 1.94 1.65 0.11 0.55 0.69 0.35 Washington ....................................... 1.86 3.05 0.22 –0.37 2.65 0.48 0.86 3.42 0.11 –0.16 1.78 0.40
* Advance statistics 1. Private goods-producing industries consist of agriculture, forestry, fishing, and hunting; mining; construc
tion; and manufacturing. 2. Private services-producing industries consist of utilities; wholesale trade; retail trade; transportation and
warehousing, excluding Postal Service; information; finance and insurance; real estate, rental, and leasing; professional and technical services; management of companies and enterprises; administrative and waste services; educational services; health care and social assistance; arts, entertainment, and recreation; accom
modation and food services; and other services, except government. 3. The advance statistics of U.S. real GDP by state differ from the corresponding national income and
product account (NIPA) GDP values because of differences in source data and methodologies used to estimate the related statistics and because of revisions to the NIPA GDP values. In addition, U.S. GDP-by-state values differ from the corresponding NIPA GDP values because the U.S. GDP-by-state values exclude federal military and civilian activity overseas, which cannot be attributed to a particular state.
73 June 2009 SURVEY OF CURRENT BUSINESS
Table 4. State Contributions to Percent Change in Real U.S. Gross Domestic Product (GDP) by State, 1998–2008 [Percentage points]
1998 1999 2000 2001 2002 2003 2004 2005 2006 2007 2008*
United States, percent change 1 ............................................ 4.5 4.4 3.7 0.9 1.5 2.4 3.5 3.1 2.8 2.0 0.7
New England.................................................................................... 0.28 0.23 0.36 0.05 –0.02 0.11 0.17 0.07 0.14 0.12 0.06 Connecticut ................................................................................... 0.07 0.03 0.08 0.01 –0.03 0.01 0.06 0.03 0.05 0.04 –0.01 Maine ............................................................................................ 0.00 0.01 0.01 0.01 0.01 0.01 0.02 0.00 0.00 0.00 0.00 Massachusetts .............................................................................. 0.16 0.16 0.21 0.02 –0.02 0.06 0.05 0.03 0.07 0.08 0.05 New Hampshire............................................................................. 0.04 0.01 0.03 0.00 0.01 0.01 0.02 0.01 0.01 0.00 0.01 Rhode Island ................................................................................. 0.01 0.01 0.02 0.01 0.01 0.02 0.01 0.00 0.01 0.00 0.00 Vermont......................................................................................... 0.01 0.01 0.01 0.01 0.00 0.01 0.01 0.00 0.00 0.00 0.00
Mideast ............................................................................................. 0.68 0.74 0.67 0.46 0.15 0.42 0.46 0.54 0.59 0.47 0.23 Delaware ....................................................................................... 0.01 0.02 0.01 0.02 0.00 0.02 0.02 0.03 0.00 0.00 –0.01 District of Columbia ....................................................................... 0.00 0.04 0.00 0.03 0.01 0.02 0.03 0.02 0.01 0.01 0.02 Maryland ....................................................................................... 0.07 0.07 0.05 0.07 0.06 0.05 0.07 0.06 0.03 0.03 0.03 New Jersey.................................................................................... 0.11 0.09 0.11 0.11 0.03 0.09 0.09 0.03 0.05 0.03 0.02 New York ....................................................................................... 0.33 0.43 0.43 0.18 –0.03 0.17 0.21 0.33 0.42 0.32 0.13 Pennsylvania ................................................................................. 0.15 0.09 0.06 0.06 0.08 0.09 0.04 0.06 0.08 0.07 0.04
Great Lakes...................................................................................... 0.55 0.42 0.29 –0.19 0.29 0.33 0.23 0.10 0.10 0.10 –0.05 Illinois ............................................................................................ 0.17 0.14 0.12 0.01 0.01 0.13 0.08 0.03 0.14 0.08 0.01 Indiana .......................................................................................... 0.10 0.05 0.05 –0.04 0.07 0.07 0.06 –0.01 0.00 0.02 –0.01 Michigan........................................................................................ 0.07 0.11 0.05 –0.11 0.10 0.04 –0.03 0.02 –0.04 –0.03 –0.04 Ohio............................................................................................... 0.14 0.06 0.04 –0.06 0.08 0.05 0.09 0.03 –0.03 0.01 –0.02 Wisconsin...................................................................................... 0.08 0.06 0.04 0.02 0.03 0.04 0.04 0.03 0.03 0.02 0.01
Plains................................................................................................ 0.20 0.12 0.21 0.03 0.16 0.17 0.20 0.12 0.07 0.16 0.13 Iowa............................................................................................... 0.01 0.01 0.03 –0.01 0.04 0.02 0.06 0.02 0.02 0.03 0.02 Kansas .......................................................................................... 0.04 0.02 0.02 0.01 0.01 0.01 0.02 0.02 0.03 0.03 0.02 Minnesota...................................................................................... 0.09 0.06 0.09 0.01 0.05 0.06 0.08 0.03 0.01 0.03 0.04 Missouri......................................................................................... 0.04 0.01 0.04 0.01 0.02 0.03 0.03 0.03 0.00 0.02 0.02 Nebraska....................................................................................... 0.01 0.01 0.01 0.00 0.01 0.03 0.01 0.01 0.01 0.02 0.01 North Dakota................................................................................. 0.01 0.00 0.01 0.00 0.01 0.01 0.00 0.01 0.00 0.01 0.02 South Dakota ................................................................................ 0.01 0.01 0.01 0.00 0.02 0.00 0.01 0.01 0.00 0.02 0.01
Southeast......................................................................................... 0.94 0.94 0.40 0.32 0.38 0.64 0.91 0.95 0.64 0.20 –0.01 Alabama ........................................................................................ 0.04 0.04 0.00 0.01 0.03 0.03 0.06 0.04 0.02 0.01 0.01 Arkansas ....................................................................................... 0.02 0.03 0.00 0.00 0.02 0.02 0.03 0.02 0.01 0.01 0.00 Florida ........................................................................................... 0.24 0.20 0.19 0.14 0.13 0.23 0.28 0.39 0.22 0.00 –0.09 Georgia ......................................................................................... 0.18 0.19 0.09 0.02 0.01 0.06 0.11 0.11 0.03 0.04 –0.02 Kentucky........................................................................................ 0.02 0.03 –0.04 0.00 0.03 0.02 0.03 0.03 0.03 0.01 0.00 Louisiana....................................................................................... 0.06 0.02 –0.06 –0.02 0.01 0.02 0.08 0.01 0.03 0.01 0.00 Mississippi..................................................................................... 0.02 0.02 0.00 0.00 0.01 0.02 0.01 0.00 0.01 0.01 0.01 North Carolina............................................................................... 0.13 0.18 0.07 0.05 0.04 0.04 0.09 0.13 0.16 0.02 0.00 South Carolina .............................................................................. 0.04 0.04 0.02 0.02 0.02 0.04 0.00 0.03 0.02 0.01 0.01 Tennessee..................................................................................... 0.06 0.06 0.01 0.01 0.07 0.05 0.08 0.03 0.05 0.02 0.01 Virginia .......................................................................................... 0.13 0.12 0.13 0.09 0.02 0.10 0.13 0.14 0.05 0.05 0.04 West Virginia ................................................................................. 0.00 0.01 –0.01 0.00 0.01 0.00 0.01 0.01 0.00 0.00 0.01
Southwest ........................................................................................ 0.61 0.55 0.43 0.26 0.21 0.21 0.47 0.39 0.55 0.41 0.20 Arizona .......................................................................................... 0.14 0.13 0.09 0.05 0.03 0.07 0.06 0.14 0.11 0.03 –0.01 New Mexico................................................................................... 0.01 0.04 0.01 0.00 0.01 0.02 0.03 0.01 0.01 0.01 0.01 Oklahoma...................................................................................... 0.02 0.03 0.03 0.02 0.01 0.01 0.03 0.02 0.03 0.02 0.03 Texas ............................................................................................. 0.45 0.35 0.30 0.19 0.15 0.10 0.35 0.22 0.39 0.36 0.17
Rocky Mountain .............................................................................. 0.17 0.20 0.19 0.05 0.03 0.04 0.11 0.16 0.12 0.09 0.08 Colorado........................................................................................ 0.12 0.13 0.13 0.03 0.01 0.01 0.04 0.07 0.05 0.03 0.05 Idaho ............................................................................................. 0.01 0.03 0.02 0.00 0.00 0.01 0.03 0.03 0.01 0.02 0.00 Montana ........................................................................................ 0.01 0.00 0.00 0.00 0.01 0.01 0.01 0.01 0.01 0.01 0.00 Utah............................................................................................... 0.03 0.03 0.02 0.01 0.01 0.01 0.03 0.05 0.05 0.03 0.01 Wyoming ....................................................................................... 0.00 0.01 0.00 0.01 0.00 0.00 0.00 0.00 0.02 0.00 0.01
Far West ........................................................................................... 1.02 1.24 1.12 –0.09 0.27 0.51 0.91 0.81 0.62 0.40 0.11 Alaska ........................................................................................... –0.01 0.00 0.00 –0.01 0.02 –0.01 0.02 0.00 0.01 0.00 –0.01 California ....................................................................................... 0.77 0.99 0.97 –0.06 0.17 0.39 0.67 0.57 0.40 0.23 0.06 Hawaii ........................................................................................... –0.01 0.00 0.00 0.00 0.00 0.02 0.02 0.02 0.02 0.01 0.00 Nevada .......................................................................................... 0.03 0.04 0.03 0.01 0.02 0.05 0.08 0.07 0.04 0.03 –0.01 Oregon .......................................................................................... 0.06 0.04 0.09 –0.02 0.04 0.03 0.08 0.03 0.09 0.04 0.02 Washington ................................................................................... 0.18 0.17 0.03 –0.02 0.01 0.04 0.05 0.11 0.06 0.10 0.05
* Advance statistics the related statistics and because of revisions to the NIPA GDP values. In addition, U.S. GDP-by-state values 1. The advance statistics of U.S. real GDP by state differ from the corresponding national income and differ from the corresponding NIPA GDP values because the U.S. GDP-by-state values exclude federal military
product account (NIPA) GDP values because of differences in source data and methodologies used to estimate and civilian activity overseas, which cannot be attributed to a particular state.
74 Gross Domestic Product by State June 2009
Table 5. Per Capita Real Gross Domestic Product (GDP) by State, 2005–2008
Chained (2000) dollars Rank in the United States Percent of the United States
2005 2006 2007 2008* 2005 2006 2007 2008* 2005 2006 2007 2008*
United States ................................................................................................ 36,920 37,601 37,967 37,899 .............. .............. .............. .............. 100 100 100 100
New England ......................................................................................................... 42,584 43,569 44,474 44,796 .............. .............. .............. .............. 115 116 117 118 Connecticut ........................................................................................................ 48,608 49,976 51,139 50,758 2 2 2 2 132 133 135 134 Maine ................................................................................................................. 29,769 29,990 30,248 30,637 42 41 42 41 81 80 80 81 Massachusetts ................................................................................................... 45,050 46,192 47,388 48,088 3 4 4 4 122 123 125 127 New Hampshire.................................................................................................. 37,316 37,641 37,829 38,420 16 18 19 18 101 100 100 101 Rhode Island ...................................................................................................... 35,466 36,332 36,516 36,283 23 21 22 24 96 97 96 96 Vermont .............................................................................................................. 33,465 33,848 34,383 34,924 31 30 30 29 91 90 91 92
Mideast .................................................................................................................. 42,240 43,497 44,480 44,900 .............. .............. .............. .............. 114 116 117 118 Delaware ............................................................................................................ 59,520 58,386 58,071 56,401 1 1 1 1 161 155 153 149 District of Columbia ............................................................................................ 120,269 122,005 123,566 126,407 .............. .............. .............. .............. 326 324 325 334 Maryland ............................................................................................................ 37,920 38,233 38,788 39,205 15 15 15 15 103 102 102 103 New Jersey......................................................................................................... 43,902 44,512 44,834 44,957 5 6 6 5 119 118 118 119 New York ............................................................................................................ 44,773 47,135 48,869 49,499 4 3 3 3 121 125 129 131 Pennsylvania ...................................................................................................... 34,208 34,794 35,337 35,641 27 26 26 26 93 93 93 94
Great Lakes........................................................................................................... 35,205 35,334 35,492 35,280 .............. .............. .............. .............. 95 94 93 93 Illinois ................................................................................................................. 38,593 39,603 40,142 40,006 13 13 13 13 105 105 106 106 Indiana ............................................................................................................... 33,307 33,094 33,317 32,917 32 37 34 34 90 88 88 87 Michigan............................................................................................................. 33,673 33,206 32,940 32,601 29 35 37 37 91 88 87 86 Ohio.................................................................................................................... 34,111 33,805 33,829 33,568 28 31 32 32 92 90 89 89 Wisconsin ........................................................................................................... 34,602 35,012 35,178 35,239 26 25 27 27 94 93 93 93
Plains..................................................................................................................... 35,473 35,605 36,249 36,728 .............. .............. .............. .............. 96 95 95 97 Iowa.................................................................................................................... 34,771 35,230 36,243 36,773 25 23 24 23 94 94 95 97 Kansas ............................................................................................................... 32,818 33,786 34,571 35,013 36 32 29 28 89 90 91 92 Minnesota........................................................................................................... 40,832 40,719 41,060 41,573 9 9 9 9 111 108 108 110 Missouri .............................................................................................................. 32,680 32,375 32,532 32,779 37 38 38 36 89 86 86 86 Nebraska............................................................................................................ 35,513 36,240 37,131 37,326 21 22 20 22 96 96 98 98 North Dakota ...................................................................................................... 32,848 33,190 35,454 37,832 35 36 25 20 89 88 93 100 South Dakota...................................................................................................... 35,159 34,381 36,791 37,690 24 27 21 21 95 91 97 99
Southeast .............................................................................................................. 33,007 33,560 33,384 33,006 .............. .............. .............. .............. 89 89 88 87 Alabama ............................................................................................................. 29,147 29,414 29,426 29,411 44 44 44 44 79 78 78 78 Arkansas ............................................................................................................ 27,613 27,651 27,810 27,753 47 47 48 48 75 74 73 73 Florida ................................................................................................................ 33,292 34,050 33,702 32,925 33 28 33 33 90 91 89 87 Georgia .............................................................................................................. 35,477 35,034 34,792 34,017 22 24 28 30 96 93 92 90 Kentucky............................................................................................................. 29,509 29,958 29,986 29,740 43 42 43 43 80 80 79 78 Louisiana............................................................................................................ 31,206 33,726 33,022 32,842 38 34 36 35 85 90 87 87 Mississippi .......................................................................................................... 23,610 24,016 24,147 24,403 50 50 50 50 64 64 64 64 North Carolina .................................................................................................... 35,763 36,954 36,398 35,719 19 20 23 25 97 98 96 94 South Carolina ................................................................................................... 28,895 28,955 28,676 28,364 45 45 46 46 78 77 76 75 Tennessee .......................................................................................................... 33,582 34,009 34,012 33,825 30 29 31 31 91 90 90 89 Virginia ............................................................................................................... 40,989 41,233 41,608 41,769 7 8 8 8 111 110 110 110 West Virginia ...................................................................................................... 24,759 24,862 24,970 25,533 49 49 49 49 67 66 66 67
Southwest ............................................................................................................. 34,510 35,324 35,855 35,767 .............. .............. .............. .............. 93 94 94 94 Arizona ............................................................................................................... 32,909 33,767 33,300 32,343 34 33 35 38 89 90 88 85 New Mexico ........................................................................................................ 30,128 30,425 30,624 30,935 40 40 40 40 82 81 81 82 Oklahoma ........................................................................................................... 28,104 28,636 28,851 29,359 46 46 45 45 76 76 76 77 Texas .................................................................................................................. 36,316 37,205 38,055 38,044 18 19 18 19 98 99 100 100
Rocky Mountain.................................................................................................... 35,244 35,727 35,938 36,017 .............. .............. .............. .............. 95 95 95 95 Colorado............................................................................................................. 40,395 40,703 40,742 41,102 11 11 10 10 109 108 107 108 Idaho .................................................................................................................. 30,127 29,953 30,442 29,890 41 43 41 42 82 80 80 79 Montana ............................................................................................................. 26,958 27,316 27,991 28,170 48 48 47 47 73 73 74 74 Utah.................................................................................................................... 31,117 31,989 32,413 32,049 39 39 39 39 84 85 85 85 Wyoming ............................................................................................................ 38,203 40,364 39,807 40,837 14 12 14 11 103 107 105 108
Far West ................................................................................................................ 40,173 41,131 41,645 41,416 .............. .............. .............. .............. 109 109 110 109 Alaska ................................................................................................................ 43,839 45,261 44,853 43,640 6 5 5 6 119 120 118 115 California ............................................................................................................ 40,905 41,883 42,319 42,064 8 7 7 7 111 111 111 111 Hawaii................................................................................................................. 37,114 38,198 38,692 38,644 17 16 17 17 101 102 102 102 Nevada ............................................................................................................... 40,483 40,708 40,657 39,687 10 10 11 14 110 108 107 105 Oregon ............................................................................................................... 35,724 37,921 38,751 38,801 20 17 16 16 97 101 102 102 Washington ........................................................................................................ 38,661 39,068 40,218 40,407 12 14 12 12 105 104 106 107
* Advance statistics NOTE. Per capita real GDP by state was computed using Census Bureau midyear population estimates.
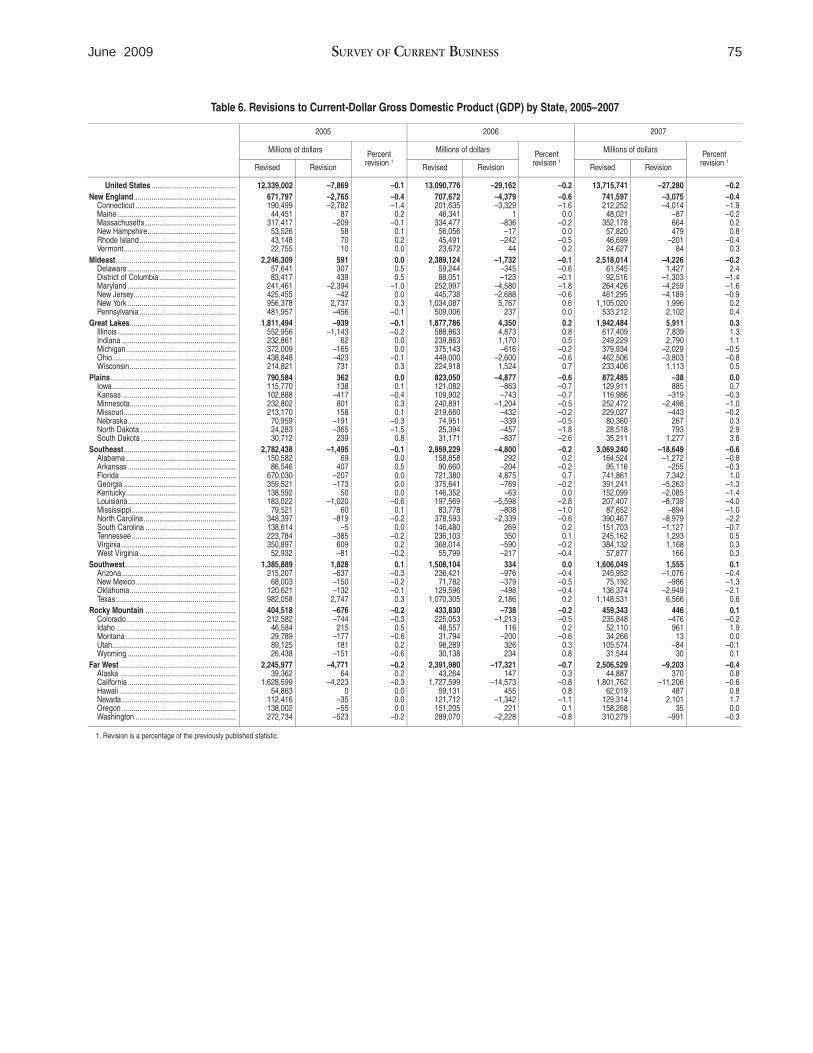
75 June 2009 SURVEY OF CURRENT BUSINESS
Table 6. Revisions to Current-Dollar Gross Domestic Product (GDP) by State, 2005–2007
2005 2006 2007
Millions of dollars Percent revision 1
Millions of dollars Percent revision 1
Millions of dollars Percent revision 1
Revised Revision Revised Revision Revised Revision
United States ........................................... 12,339,002 –7,869 –0.1 13,090,776 –29,162 –0.2 13,715,741 –27,280 –0.2
New England.................................................... 671,797 –2,765 –0.4 707,672 –4,379 –0.6 741,597 –3,075 –0.4 Connecticut ................................................... 190,499 –2,782 –1.4 201,635 –3,329 –1.6 212,252 –4,014 –1.9 Maine ............................................................ 44,451 87 0.2 46,341 1 0.0 48,021 –87 –0.2 Massachusetts .............................................. 317,417 –209 –0.1 334,477 –836 –0.2 352,178 664 0.2 New Hampshire............................................. 53,526 58 0.1 56,056 –17 0.0 57,820 479 0.8 Rhode Island ................................................. 43,148 70 0.2 45,491 –242 –0.5 46,699 –201 –0.4 Vermont......................................................... 22,755 10 0.0 23,672 44 0.2 24,627 84 0.3
Mideast ............................................................. 2,246,309 591 0.0 2,389,124 –1,732 –0.1 2,518,014 –4,226 –0.2 Delaware ....................................................... 57,641 307 0.5 59,244 –345 –0.6 61,545 1,427 2.4 District of Columbia ....................................... 83,417 439 0.5 88,051 –123 –0.1 92,516 –1,303 –1.4 Maryland ....................................................... 241,461 –2,394 –1.0 252,997 –4,580 –1.8 264,426 –4,259 –1.6 New Jersey.................................................... 425,455 –42 0.0 445,738 –2,688 –0.6 461,295 –4,189 –0.9 New York ....................................................... 956,378 2,737 0.3 1,034,087 5,767 0.6 1,105,020 1,996 0.2 Pennsylvania ................................................. 481,957 –456 –0.1 509,006 237 0.0 533,212 2,102 0.4
Great Lakes...................................................... 1,811,494 –939 –0.1 1,877,786 4,350 0.2 1,942,484 5,911 0.3 Illinois ............................................................ 552,956 –1,143 –0.2 588,863 4,873 0.8 617,409 7,839 1.3 Indiana .......................................................... 232,861 62 0.0 239,863 1,170 0.5 249,229 2,790 1.1 Michigan........................................................ 372,009 –165 0.0 375,143 –616 –0.2 379,934 –2,029 –0.5 Ohio............................................................... 438,848 –423 –0.1 449,000 –2,600 –0.6 462,506 –3,803 –0.8 Wisconsin...................................................... 214,821 731 0.3 224,918 1,524 0.7 233,406 1,113 0.5
Plains................................................................ 790,584 362 0.0 823,050 –4,877 –0.6 872,485 –38 0.0 Iowa............................................................... 115,770 138 0.1 121,082 –863 –0.7 129,911 885 0.7 Kansas .......................................................... 102,888 –417 –0.4 109,902 –743 –0.7 116,986 –319 –0.3 Minnesota...................................................... 232,802 801 0.3 240,891 –1,204 –0.5 252,472 –2,498 –1.0 Missouri......................................................... 213,170 158 0.1 219,660 –432 –0.2 229,027 –443 –0.2 Nebraska....................................................... 70,959 –191 –0.3 74,951 –339 –0.5 80,360 267 0.3 North Dakota................................................. 24,283 –365 –1.5 25,394 –457 –1.8 28,518 793 2.9 South Dakota ................................................ 30,712 239 0.8 31,171 –837 –2.6 35,211 1,277 3.8
Southeast......................................................... 2,782,438 –1,495 –0.1 2,959,229 –4,800 –0.2 3,069,240 –18,649 –0.6 Alabama ........................................................ 150,582 69 0.0 158,858 292 0.2 164,524 –1,272 –0.8 Arkansas ....................................................... 86,546 407 0.5 90,660 –204 –0.2 95,116 –255 –0.3 Florida ........................................................... 670,030 –207 0.0 721,380 4,875 0.7 741,861 7,342 1.0 Georgia ......................................................... 359,521 –173 0.0 375,641 –769 –0.2 391,241 –5,263 –1.3 Kentucky........................................................ 138,592 50 0.0 146,352 –63 0.0 152,099 –2,085 –1.4 Louisiana....................................................... 183,022 –1,020 –0.6 197,569 –5,598 –2.8 207,407 –8,739 –4.0 Mississippi..................................................... 79,521 60 0.1 83,778 –808 –1.0 87,652 –894 –1.0 North Carolina............................................... 348,397 –819 –0.2 378,593 –2,339 –0.6 390,467 –8,979 –2.2 South Carolina .............................................. 138,614 –5 0.0 146,480 269 0.2 151,703 –1,127 –0.7 Tennessee..................................................... 223,784 –385 –0.2 236,103 350 0.1 245,162 1,293 0.5 Virginia .......................................................... 350,897 609 0.2 368,014 –590 –0.2 384,132 1,168 0.3 West Virginia ................................................. 52,932 –81 –0.2 55,799 –217 –0.4 57,877 166 0.3
Southwest ........................................................ 1,385,889 1,828 0.1 1,508,104 334 0.0 1,606,049 1,555 0.1 Arizona .......................................................... 215,207 –637 –0.3 236,421 –976 –0.4 245,952 –1,076 –0.4 New Mexico................................................... 68,003 –150 –0.2 71,782 –379 –0.5 75,192 –986 –1.3 Oklahoma...................................................... 120,621 –132 –0.1 129,596 –498 –0.4 136,374 –2,949 –2.1 Texas ............................................................. 982,058 2,747 0.3 1,070,305 2,186 0.2 1,148,531 6,566 0.6
Rocky Mountain .............................................. 404,518 –676 –0.2 433,830 –738 –0.2 459,343 446 0.1 Colorado........................................................ 212,582 –744 –0.3 225,053 –1,213 –0.5 235,848 –476 –0.2 Idaho ............................................................. 46,584 215 0.5 48,557 116 0.2 52,110 961 1.9 Montana ........................................................ 29,789 –177 –0.6 31,794 –200 –0.6 34,266 13 0.0 Utah............................................................... 89,125 181 0.2 98,289 326 0.3 105,574 –84 –0.1 Wyoming ....................................................... 26,438 –151 –0.6 30,138 234 0.8 31,544 30 0.1
Far West ........................................................... 2,245,977 –4,771 –0.2 2,391,980 –17,321 –0.7 2,506,529 –9,203 –0.4 Alaska ........................................................... 39,362 64 0.2 43,264 147 0.3 44,887 370 0.8 California ....................................................... 1,628,599 –4,223 –0.3 1,727,599 –14,573 –0.8 1,801,762 –11,206 –0.6 Hawaii ........................................................... 54,863 0 0.0 59,131 455 0.8 62,019 487 0.8 Nevada .......................................................... 112,416 –35 0.0 121,712 –1,342 –1.1 129,314 2,101 1.7 Oregon .......................................................... 138,002 –55 0.0 151,205 221 0.1 158,268 35 0.0 Washington ................................................... 272,734 –523 –0.2 289,070 –2,228 –0.8 310,279 –991 –0.3
1. Revision is a percentage of the previously published statistic.
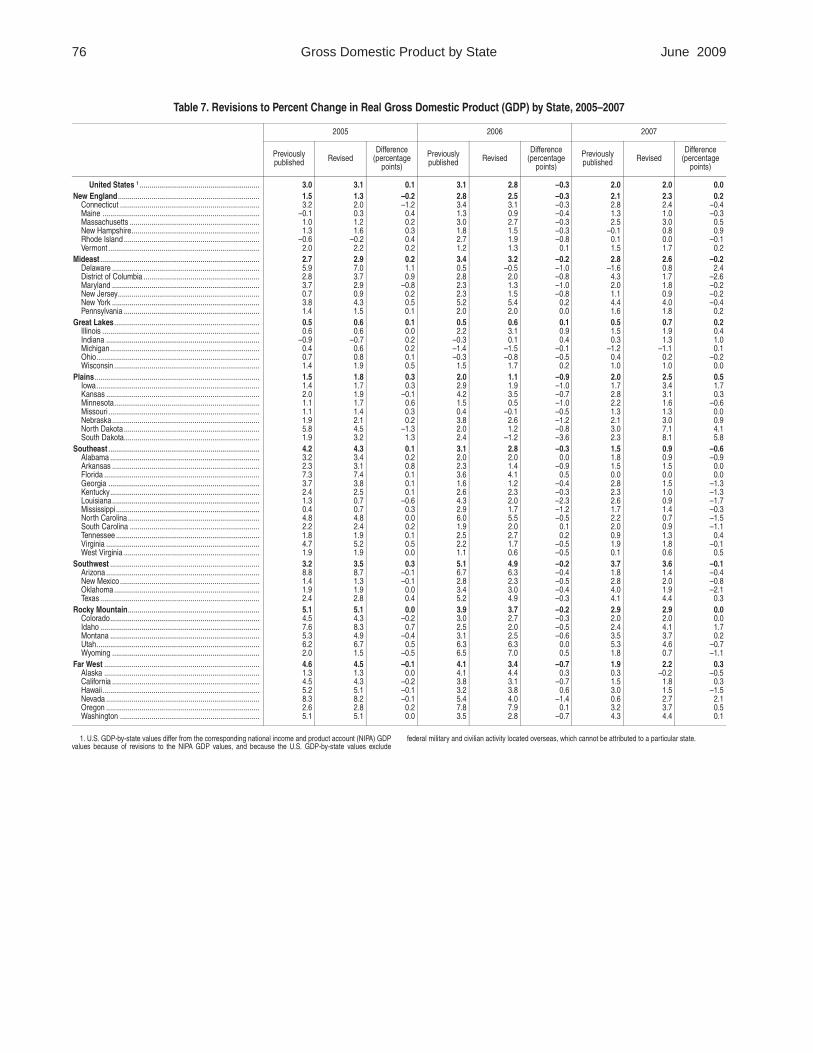
76 Gross Domestic Product by State June 2009
Table 7. Revisions to Percent Change in Real Gross Domestic Product (GDP) by State, 2005–2007
2005 2006 2007
Previously published Revised
Difference (percentage
points)
Previously published Revised
Difference (percentage
points)
Previously published Revised
Difference (percentage
points)
United States 1 ............................................................. 3.0 3.1 0.1 3.1 2.8 –0.3 2.0 2.0 0.0
New England ........................................................................ 1.5 1.3 –0.2 2.8 2.5 –0.3 2.1 2.3 0.2 Connecticut ....................................................................... 3.2 2.0 –1.2 3.4 3.1 –0.3 2.8 2.4 –0.4 Maine ................................................................................ –0.1 0.3 0.4 1.3 0.9 –0.4 1.3 1.0 –0.3 Massachusetts .................................................................. 1.0 1.2 0.2 3.0 2.7 –0.3 2.5 3.0 0.5 New Hampshire................................................................. 1.3 1.6 0.3 1.8 1.5 –0.3 –0.1 0.8 0.9 Rhode Island ..................................................................... –0.6 –0.2 0.4 2.7 1.9 –0.8 0.1 0.0 –0.1 Vermont ............................................................................. 2.0 2.2 0.2 1.2 1.3 0.1 1.5 1.7 0.2
Mideast ................................................................................. 2.7 2.9 0.2 3.4 3.2 –0.2 2.8 2.6 –0.2 Delaware ........................................................................... 5.9 7.0 1.1 0.5 –0.5 –1.0 –1.6 0.8 2.4 District of Columbia ........................................................... 2.8 3.7 0.9 2.8 2.0 –0.8 4.3 1.7 –2.6 Maryland ........................................................................... 3.7 2.9 –0.8 2.3 1.3 –1.0 2.0 1.8 –0.2 New Jersey........................................................................ 0.7 0.9 0.2 2.3 1.5 –0.8 1.1 0.9 –0.2 New York ........................................................................... 3.8 4.3 0.5 5.2 5.4 0.2 4.4 4.0 –0.4 Pennsylvania ..................................................................... 1.4 1.5 0.1 2.0 2.0 0.0 1.6 1.8 0.2
Great Lakes.......................................................................... 0.5 0.6 0.1 0.5 0.6 0.1 0.5 0.7 0.2 Illinois ................................................................................ 0.6 0.6 0.0 2.2 3.1 0.9 1.5 1.9 0.4 Indiana .............................................................................. –0.9 –0.7 0.2 –0.3 0.1 0.4 0.3 1.3 1.0 Michigan............................................................................ 0.4 0.6 0.2 –1.4 –1.5 –0.1 –1.2 –1.1 0.1 Ohio................................................................................... 0.7 0.8 0.1 –0.3 –0.8 –0.5 0.4 0.2 –0.2 Wisconsin .......................................................................... 1.4 1.9 0.5 1.5 1.7 0.2 1.0 1.0 0.0
Plains.................................................................................... 1.5 1.8 0.3 2.0 1.1 –0.9 2.0 2.5 0.5 Iowa................................................................................... 1.4 1.7 0.3 2.9 1.9 –1.0 1.7 3.4 1.7 Kansas .............................................................................. 2.0 1.9 –0.1 4.2 3.5 –0.7 2.8 3.1 0.3 Minnesota.......................................................................... 1.1 1.7 0.6 1.5 0.5 –1.0 2.2 1.6 –0.6 Missouri ............................................................................. 1.1 1.4 0.3 0.4 –0.1 –0.5 1.3 1.3 0.0 Nebraska........................................................................... 1.9 2.1 0.2 3.8 2.6 –1.2 2.1 3.0 0.9 North Dakota ..................................................................... 5.8 4.5 –1.3 2.0 1.2 –0.8 3.0 7.1 4.1 South Dakota..................................................................... 1.9 3.2 1.3 2.4 –1.2 –3.6 2.3 8.1 5.8
Southeast ............................................................................. 4.2 4.3 0.1 3.1 2.8 –0.3 1.5 0.9 –0.6 Alabama ............................................................................ 3.2 3.4 0.2 2.0 2.0 0.0 1.8 0.9 –0.9 Arkansas ........................................................................... 2.3 3.1 0.8 2.3 1.4 –0.9 1.5 1.5 0.0 Florida ............................................................................... 7.3 7.4 0.1 3.6 4.1 0.5 0.0 0.0 0.0 Georgia ............................................................................. 3.7 3.8 0.1 1.6 1.2 –0.4 2.8 1.5 –1.3 Kentucky............................................................................ 2.4 2.5 0.1 2.6 2.3 –0.3 2.3 1.0 –1.3 Louisiana........................................................................... 1.3 0.7 –0.6 4.3 2.0 –2.3 2.6 0.9 –1.7 Mississippi ......................................................................... 0.4 0.7 0.3 2.9 1.7 –1.2 1.7 1.4 –0.3 North Carolina ................................................................... 4.8 4.8 0.0 6.0 5.5 –0.5 2.2 0.7 –1.5 South Carolina .................................................................. 2.2 2.4 0.2 1.9 2.0 0.1 2.0 0.9 –1.1 Tennessee ......................................................................... 1.8 1.9 0.1 2.5 2.7 0.2 0.9 1.3 0.4 Virginia .............................................................................. 4.7 5.2 0.5 2.2 1.7 –0.5 1.9 1.8 –0.1 West Virginia ..................................................................... 1.9 1.9 0.0 1.1 0.6 –0.5 0.1 0.6 0.5
Southwest ............................................................................ 3.2 3.5 0.3 5.1 4.9 –0.2 3.7 3.6 –0.1 Arizona .............................................................................. 8.8 8.7 –0.1 6.7 6.3 –0.4 1.8 1.4 –0.4 New Mexico ....................................................................... 1.4 1.3 –0.1 2.8 2.3 –0.5 2.8 2.0 –0.8 Oklahoma .......................................................................... 1.9 1.9 0.0 3.4 3.0 –0.4 4.0 1.9 –2.1 Texas ................................................................................. 2.4 2.8 0.4 5.2 4.9 –0.3 4.1 4.4 0.3
Rocky Mountain................................................................... 5.1 5.1 0.0 3.9 3.7 –0.2 2.9 2.9 0.0 Colorado............................................................................ 4.5 4.3 –0.2 3.0 2.7 –0.3 2.0 2.0 0.0 Idaho ................................................................................. 7.6 8.3 0.7 2.5 2.0 –0.5 2.4 4.1 1.7 Montana ............................................................................ 5.3 4.9 –0.4 3.1 2.5 –0.6 3.5 3.7 0.2 Utah................................................................................... 6.2 6.7 0.5 6.3 6.3 0.0 5.3 4.6 –0.7 Wyoming ........................................................................... 2.0 1.5 –0.5 6.5 7.0 0.5 1.8 0.7 –1.1
Far West ............................................................................... 4.6 4.5 –0.1 4.1 3.4 –0.7 1.9 2.2 0.3 Alaska ............................................................................... 1.3 1.3 0.0 4.1 4.4 0.3 0.3 –0.2 –0.5 California ........................................................................... 4.5 4.3 –0.2 3.8 3.1 –0.7 1.5 1.8 0.3 Hawaii................................................................................ 5.2 5.1 –0.1 3.2 3.8 0.6 3.0 1.5 –1.5 Nevada .............................................................................. 8.3 8.2 –0.1 5.4 4.0 –1.4 0.6 2.7 2.1 Oregon .............................................................................. 2.6 2.8 0.2 7.8 7.9 0.1 3.2 3.7 0.5 Washington ....................................................................... 5.1 5.1 0.0 3.5 2.8 –0.7 4.3 4.4 0.1
1. U.S. GDP-by-state values differ from the corresponding national income and product account (NIPA) GDP federal military and civilian activity located overseas, which cannot be attributed to a particular state. values because of revisions to the NIPA GDP values, and because the U.S. GDP-by-state values exclude
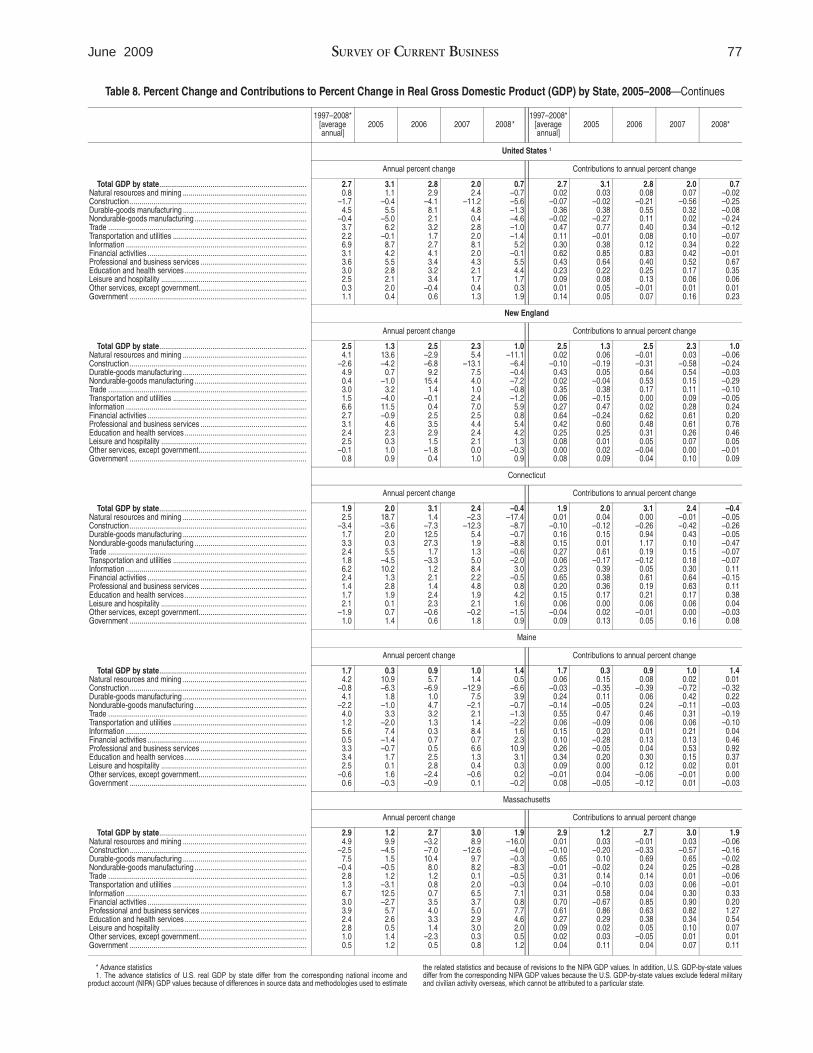
77 June 2009 SURVEY OF CURRENT BUSINESS
Table 8. Percent Change and Contributions to Percent Change in Real Gross Domestic Product (GDP) by State, 2005–2008—Continues
1997–2008* [average annual]
2005 2006 2007 2008* 1997–2008*
[average annual]
2005 2006 2007 2008*
Total GDP by state........................................................................... Natural resources and mining ............................................................... Construction .......................................................................................... Durable-goods manufacturing ............................................................... Nondurable-goods manufacturing ......................................................... Trade ..................................................................................................... Transportation and utilities .................................................................... Information ............................................................................................ Financial activities ................................................................................. Professional and business services ...................................................... Education and health services .............................................................. Leisure and hospitality .......................................................................... Other services, except government....................................................... Government ..........................................................................................
United States 1
Annual percent change Contributions to annual percent change
2.7 0.8
–1.7 4.5
–0.4 3.7 2.2 6.9 3.1 3.6 3.0 2.5 0.3 1.1
3.1 1.1
–0.4 5.5
–5.0 6.2
–0.1 8.7 4.2 5.5 2.8 2.1 2.0 0.4
2.8 2.9
–4.1 8.1 2.1 3.2 1.7 2.7 4.1 3.4 3.2 3.4
–0.4 0.6
2.0 2.4
–11.2 4.8 0.4 2.8 2.0 8.1 2.0 4.3 2.1 1.7 0.4 1.3
0.7 –0.7 –5.6 –1.3 –4.6 –1.0 –1.4
5.2 –0.1
5.5 4.4 1.7 0.3 1.9
2.7 0.02
–0.07 0.36
–0.02 0.47 0.11 0.30 0.62 0.43 0.23 0.09 0.01 0.14
3.1 0.03
–0.02 0.38
–0.27 0.77
–0.01 0.38 0.85 0.64 0.22 0.08 0.05 0.05
2.8 0.08
–0.21 0.55 0.11 0.40 0.08 0.12 0.83 0.40 0.25 0.13
–0.01 0.07
2.0 0.07
–0.56 0.32 0.02 0.34 0.10 0.34 0.42 0.52 0.17 0.06 0.01 0.16
0.7 –0.02 –0.25 –0.08 –0.24 –0.12 –0.07 0.22
–0.01 0.67 0.35 0.06 0.01 0.23
New England
Annual percent change Contributions to annual percent change
Total GDP by state........................................................................... Natural resources and mining ............................................................... Construction .......................................................................................... Durable-goods manufacturing ............................................................... Nondurable-goods manufacturing ......................................................... Trade ..................................................................................................... Transportation and utilities .................................................................... Information ............................................................................................ Financial activities ................................................................................. Professional and business services ...................................................... Education and health services .............................................................. Leisure and hospitality .......................................................................... Other services, except government....................................................... Government ..........................................................................................
2.5 4.1
–2.6 4.9 0.4 3.0 1.5 6.6 2.7 3.1 2.4 2.5
–0.1 0.8
1.3 13.6 –4.2
0.7 –1.0
3.2 –4.0 11.5 –0.9
4.6 2.3 0.3 1.0 0.9
2.5 –2.9 –6.8
9.2 15.4
1.4 –0.1 0.4 2.5 3.5 2.9 1.5
–1.8 0.4
2.3 5.4
–13.1 7.5 4.0 1.0 2.4 7.0 2.5 4.4 2.4 2.1 0.0 1.0
1.0 –11.1
–6.4 –0.4 –7.2 –0.8 –1.2 5.9 0.8 5.4 4.2 1.3
–0.3 0.9
2.5 0.02
–0.10 0.43 0.02 0.35 0.06 0.27 0.64 0.42 0.25 0.08 0.00 0.08
1.3 0.06
–0.19 0.05
–0.04 0.38
–0.15 0.47
–0.24 0.60 0.25 0.01 0.02 0.09
2.5 –0.01 –0.31
0.64 0.53 0.17 0.00 0.02 0.62 0.48 0.31 0.05
–0.04 0.04
2.3 0.03
–0.58 0.54 0.15 0.11 0.09 0.28 0.61 0.61 0.26 0.07 0.00 0.10
1.0 –0.06 –0.24 –0.03 –0.29 –0.10 –0.05 0.24 0.20 0.76 0.46 0.05
–0.01 0.09
Connecticut
Annual percent change Contributions to annual percent change
Total GDP by state........................................................................... Natural resources and mining ............................................................... Construction .......................................................................................... Durable-goods manufacturing ............................................................... Nondurable-goods manufacturing ......................................................... Trade ..................................................................................................... Transportation and utilities .................................................................... Information ............................................................................................ Financial activities ................................................................................. Professional and business services ...................................................... Education and health services .............................................................. Leisure and hospitality .......................................................................... Other services, except government....................................................... Government ..........................................................................................
1.9 2.5
–3.4 1.7 3.3 2.4 1.8 6.2 2.4 1.4 1.7 2.1
–1.9 1.0
2.0 18.7 –3.6
2.0 0.3 5.5
–4.5 10.2
1.3 2.8 1.9 0.1 0.7 1.4
3.1 1.4
–7.3 12.5 27.3
1.7 –3.3 1.2 2.1 1.4 2.4 2.3
–0.6 0.6
2.4 –2.3
–12.3 5.4 1.9 1.3 5.0 8.4 2.2 4.8 1.9 2.1
–0.2 1.8
–0.4 –17.4
–8.7 –0.7 –8.8 –0.6 –2.0 3.0
–0.5 0.8 4.2 1.6
–1.5 0.9
1.9 0.01
–0.10 0.16 0.15 0.27 0.06 0.23 0.65 0.20 0.15 0.06
–0.04 0.09
2.0 0.04
–0.12 0.15 0.01 0.61
–0.17 0.39 0.38 0.36 0.17 0.00 0.02 0.13
3.1 0.00
–0.26 0.94 1.17 0.19
–0.12 0.05 0.61 0.19 0.21 0.06
–0.01 0.05
2.4 –0.01 –0.42 0.43 0.10 0.15 0.18 0.30 0.64 0.63 0.17 0.06 0.00 0.16
–0.4 –0.05 –0.26 –0.05 –0.47 –0.07 –0.07 0.11
–0.15 0.11 0.38 0.04
–0.03 0.08
Maine
Annual percent change Contributions to annual percent change
Total GDP by state........................................................................... Natural resources and mining ............................................................... Construction .......................................................................................... Durable-goods manufacturing ............................................................... Nondurable-goods manufacturing ......................................................... Trade ..................................................................................................... Transportation and utilities .................................................................... Information ............................................................................................ Financial activities ................................................................................. Professional and business services ...................................................... Education and health services .............................................................. Leisure and hospitality .......................................................................... Other services, except government....................................................... Government ..........................................................................................
1.7 4.2
–0.8 4.1
–2.2 4.0 1.2 5.6 0.5 3.3 3.4 2.5
–0.6 0.6
0.3 10.9 –6.3
1.8 –1.0
3.3 –2.0 7.4
–1.4 –0.7
1.7 0.1 1.6
–0.3
0.9 5.7
–6.9 1.0 4.7 3.2 1.3 0.3 0.7 0.5 2.5 2.8
–2.4 –0.9
1.0 1.4
–12.9 7.5
–2.1 2.1 1.4 8.4 0.7 6.6 1.3 0.4
–0.6 0.1
1.4 0.5
–6.6 3.9
–0.7 –1.3 –2.2 1.6 2.3
10.9 3.1 0.3 0.2
–0.2
1.7 0.06
–0.03 0.24
–0.14 0.55 0.06 0.15 0.10 0.26 0.34 0.09
–0.01 0.08
0.3 0.15
–0.35 0.11
–0.05 0.47
–0.09 0.20
–0.28 –0.05
0.20 0.00 0.04
–0.05
0.9 0.08
–0.39 0.06 0.24 0.46 0.06 0.01 0.13 0.04 0.30 0.12
–0.06 –0.12
1.0 0.02
–0.72 0.42
–0.11 0.31 0.06 0.21 0.13 0.53 0.15 0.02
–0.01 0.01
1.4 0.01
–0.32 0.22
–0.03 –0.19 –0.10 0.04 0.46 0.92 0.37 0.01 0.00
–0.03
Massachusetts
Annual percent change Contributions to annual percent change
Total GDP by state........................................................................... Natural resources and mining ............................................................... Construction .......................................................................................... Durable-goods manufacturing ............................................................... Nondurable-goods manufacturing ......................................................... Trade ..................................................................................................... Transportation and utilities .................................................................... Information ............................................................................................ Financial activities ................................................................................. Professional and business services ...................................................... Education and health services .............................................................. Leisure and hospitality .......................................................................... Other services, except government....................................................... Government ..........................................................................................
2.9 4.9
–2.5 7.5
–0.4 2.8 1.3 6.7 3.0 3.9 2.4 2.8 1.0 0.5
1.2 9.9
–4.5 1.5
–0.5 1.2
–3.1 12.5 –2.7
5.7 2.6 0.5 1.4 1.2
2.7 –3.2 –7.0 10.4
8.0 1.2 0.8 0.7 3.5 4.0 3.3 1.4
–2.3 0.5
3.0 8.9
–12.6 9.7 8.2 0.1 2.0 6.5 3.7 5.0 2.9 3.0 0.3 0.8
1.9 –16.0
–4.0 –0.3 –8.3 –0.5 –0.3
7.1 0.8 7.7 4.6 2.0 0.5 1.2
2.9 0.01
–0.10 0.65
–0.01 0.31 0.04 0.31 0.70 0.61 0.27 0.09 0.02 0.04
1.2 0.03
–0.20 0.10
–0.02 0.14
–0.10 0.58
–0.67 0.86 0.29 0.02 0.03 0.11
2.7 –0.01 –0.33
0.69 0.24 0.14 0.03 0.04 0.85 0.63 0.38 0.05
–0.05 0.04
3.0 0.03
–0.57 0.65 0.25 0.01 0.06 0.30 0.90 0.82 0.34 0.10 0.01 0.07
1.9 –0.06 –0.16 –0.02 –0.28 –0.06 –0.01 0.33 0.20 1.27 0.54 0.07 0.01 0.11
* Advance statistics the related statistics and because of revisions to the NIPA GDP values. In addition, U.S. GDP-by-state values 1. The advance statistics of U.S. real GDP by state differ from the corresponding national income and differ from the corresponding NIPA GDP values because the U.S. GDP-by-state values exclude federal military
product account (NIPA) GDP values because of differences in source data and methodologies used to estimate and civilian activity overseas, which cannot be attributed to a particular state.
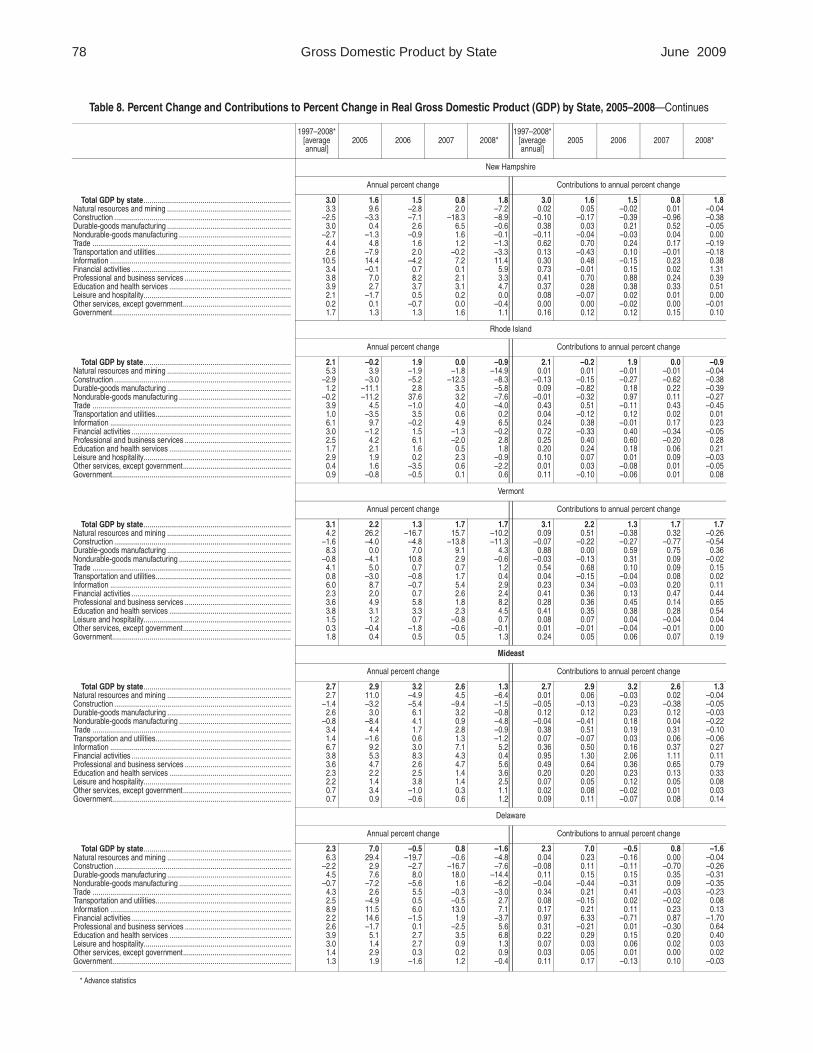
78 Gross Domestic Product by State June 2009
Table 8. Percent Change and Contributions to Percent Change in Real Gross Domestic Product (GDP) by State, 2005–2008—Continues
1997–2008* [average annual]
2005 2006 2007 2008* 1997–2008*
[average annual]
2005 2006 2007 2008*
Total GDP by state........................................................................... Natural resources and mining ............................................................... Construction .......................................................................................... Durable-goods manufacturing ............................................................... Nondurable-goods manufacturing ......................................................... Trade ..................................................................................................... Transportation and utilities..................................................................... Information ............................................................................................ Financial activities ................................................................................. Professional and business services ...................................................... Education and health services .............................................................. Leisure and hospitality........................................................................... Other services, except government....................................................... Government...........................................................................................
New Hampshire
Annual percent change Contributions to annual percent change
3.0 3.3
–2.5 3.0
–2.7 4.4 2.6
10.5 3.4 3.8 3.9 2.1 0.2 1.7
1.6 9.6
–3.3 0.4
–1.3 4.8
–7.9 14.4 –0.1
7.0 2.7
–1.7 0.1 1.3
1.5 –2.8 –7.1
2.6 –0.9
1.6 2.0
–4.2 0.7 8.2 3.7 0.5
–0.7 1.3
0.8 2.0
–18.3 6.5 1.6 1.2
–0.2 7.2 0.1 2.1 3.1 0.2 0.0 1.6
1.8 –7.2 –8.9 –0.6 –0.1 –1.3 –3.3 11.4
5.9 3.3 4.7 0.0
–0.4 1.1
3.0 0.02
–0.10 0.38
–0.11 0.62 0.13 0.30 0.73 0.41 0.37 0.08 0.00 0.16
1.6 0.05
–0.17 0.03
–0.04 0.70
–0.43 0.48
–0.01 0.70 0.28
–0.07 0.00 0.12
1.5 –0.02 –0.39
0.21 –0.03
0.24 0.10
–0.15 0.15 0.88 0.38 0.02
–0.02 0.12
0.8 0.01
–0.96 0.52 0.04 0.17
–0.01 0.23 0.02 0.24 0.33 0.01 0.00 0.15
1.8 –0.04 –0.38 –0.05 0.00
–0.19 –0.18 0.38 1.31 0.39 0.51 0.00
–0.01 0.10
Rhode Island
Annual percent change Contributions to annual percent change
Total GDP by state........................................................................... Natural resources and mining ............................................................... Construction .......................................................................................... Durable-goods manufacturing ............................................................... Nondurable-goods manufacturing ......................................................... Trade ..................................................................................................... Transportation and utilities..................................................................... Information ............................................................................................ Financial activities ................................................................................. Professional and business services ...................................................... Education and health services .............................................................. Leisure and hospitality........................................................................... Other services, except government....................................................... Government...........................................................................................
2.1 5.3
–2.9 1.2
–0.2 3.9 1.0 6.1 3.0 2.5 1.7 2.9 0.4 0.9
–0.2 3.9
–3.0 –11.1 –11.2
4.5 –3.5
9.7 –1.2
4.2 2.1 1.9 1.6
–0.8
1.9 –1.9 –5.2
2.8 37.6 –1.0 3.5
–0.2 1.5 6.1 1.6 0.2
–3.5 –0.5
0.0 –1.8
–12.3 3.5 3.2 4.0 0.6 4.9
–1.3 –2.0
0.5 2.3 0.6 0.1
–0.9 –14.9
–8.3 –5.8 –7.6 –4.0 0.2 6.5
–0.2 2.8 1.8
–0.9 –2.2
0.6
2.1 0.01
–0.13 0.09
–0.01 0.43 0.04 0.24 0.72 0.25 0.20 0.10 0.01 0.11
–0.2 0.01
–0.15 –0.82 –0.32
0.51 –0.12
0.38 –0.33
0.40 0.24 0.07 0.03
–0.10
1.9 –0.01 –0.27
0.18 0.97
–0.11 0.12
–0.01 0.40 0.60 0.18 0.01
–0.08 –0.06
0.0 –0.01 –0.62 0.22 0.11 0.43 0.02 0.17
–0.34 –0.20 0.06 0.09 0.01 0.01
–0.9 –0.04 –0.38 –0.39 –0.27 –0.45 0.01 0.23
–0.05 0.28 0.21
–0.03 –0.05 0.08
Vermont
Annual percent change Contributions to annual percent change
Total GDP by state........................................................................... Natural resources and mining ............................................................... Construction .......................................................................................... Durable-goods manufacturing ............................................................... Nondurable-goods manufacturing ......................................................... Trade ..................................................................................................... Transportation and utilities..................................................................... Information ............................................................................................ Financial activities ................................................................................. Professional and business services ...................................................... Education and health services .............................................................. Leisure and hospitality........................................................................... Other services, except government....................................................... Government...........................................................................................
3.1 4.2
–1.6 8.3
–0.8 4.1 0.8 6.0 2.3 3.6 3.8 1.5 0.3 1.8
2.2 26.2 –4.0
0.0 –4.1
5.0 –3.0
8.7 2.0 4.9 3.1 1.2
–0.4 0.4
1.3 –16.7
–4.8 7.0
10.8 0.7
–0.8 –0.7
0.7 5.8 3.3 0.7
–1.8 0.5
1.7 15.7
–13.8 9.1 2.9 0.7 1.7 5.4 2.6 1.8 2.3
–0.8 –0.6
0.5
1.7 –10.2 –11.3
4.3 –0.6
1.2 0.4 2.9 2.4 8.2 4.5 0.7
–0.1 1.3
3.1 0.09
–0.07 0.88
–0.03 0.54 0.04 0.23 0.41 0.28 0.41 0.08 0.01 0.24
2.2 0.51
–0.22 0.00
–0.13 0.68
–0.15 0.34 0.36 0.36 0.35 0.07
–0.01 0.05
1.3 –0.38 –0.27
0.59 0.31 0.10
–0.04 –0.03
0.13 0.45 0.38 0.04
–0.04 0.06
1.7 0.32
–0.77 0.75 0.09 0.09 0.08 0.20 0.47 0.14 0.28
–0.04 –0.01 0.07
1.7 –0.26 –0.54 0.36
–0.02 0.15 0.02 0.11 0.44 0.65 0.54 0.04 0.00 0.19
Mideast
Annual percent change Contributions to annual percent change
Total GDP by state........................................................................... Natural resources and mining ............................................................... Construction .......................................................................................... Durable-goods manufacturing ............................................................... Nondurable-goods manufacturing ......................................................... Trade ..................................................................................................... Transportation and utilities..................................................................... Information ............................................................................................ Financial activities ................................................................................. Professional and business services ...................................................... Education and health services .............................................................. Leisure and hospitality........................................................................... Other services, except government....................................................... Government...........................................................................................
2.7 2.7
–1.4 2.6
–0.8 3.4 1.4 6.7 3.8 3.6 2.3 2.2 0.7 0.7
2.9 11.0 –3.2
3.0 –8.4
4.4 –1.6
9.2 5.3 4.7 2.2 1.4 3.4 0.9
3.2 –4.9 –5.4
6.1 4.1 1.7 0.6 3.0 8.3 2.6 2.5 3.8
–1.0 –0.6
2.6 4.5
–9.4 3.2 0.9 2.8 1.3 7.1 4.3 4.7 1.4 1.4 0.3 0.6
1.3 –6.4 –1.5 –0.8 –4.8 –0.9 –1.2
5.2 0.4 5.6 3.6 2.5 1.1 1.2
2.7 0.01
–0.05 0.12
–0.04 0.38 0.07 0.36 0.95 0.49 0.20 0.07 0.02 0.09
2.9 0.06
–0.13 0.12
–0.41 0.51
–0.07 0.50 1.30 0.64 0.20 0.05 0.08 0.11
3.2 –0.03 –0.23
0.23 0.18 0.19 0.03 0.16 2.06 0.36 0.23 0.12
–0.02 –0.07
2.6 0.02
–0.38 0.12 0.04 0.31 0.06 0.37 1.11 0.65 0.13 0.05 0.01 0.08
1.3 –0.04 –0.05 –0.03 –0.22 –0.10 –0.06 0.27 0.11 0.79 0.33 0.08 0.03 0.14
Delaware
Annual percent change Contributions to annual percent change
Total GDP by state........................................................................... Natural resources and mining ............................................................... Construction .......................................................................................... Durable-goods manufacturing ............................................................... Nondurable-goods manufacturing ......................................................... Trade ..................................................................................................... Transportation and utilities..................................................................... Information ............................................................................................ Financial activities ................................................................................. Professional and business services ...................................................... Education and health services .............................................................. Leisure and hospitality........................................................................... Other services, except government....................................................... Government...........................................................................................
2.3 6.3
–2.2 4.5
–0.7 4.3 2.5 8.9 2.2 2.6 3.9 3.0 1.4 1.3
7.0 29.4
2.9 7.6
–7.2 2.6
–4.9 11.5 14.6 –1.7
5.1 1.4 2.9 1.9
–0.5 –19.7
–2.7 8.0
–5.6 5.5 0.5 6.0
–1.5 0.1 2.7 2.7 0.3
–1.6
0.8 –0.6
–16.7 18.0
1.6 –0.3 –0.5 13.0
1.9 –2.5
3.5 0.9 0.2 1.2
–1.6 –4.8 –7.6
–14.4 –6.2 –3.0 2.7 7.1
–3.7 5.6 6.8 1.3 0.9
–0.4
2.3 0.04
–0.08 0.11
–0.04 0.34 0.08 0.17 0.97 0.31 0.22 0.07 0.03 0.11
7.0 0.23 0.11 0.15
–0.44 0.21
–0.15 0.21 6.33
–0.21 0.29 0.03 0.05 0.17
–0.5 –0.16 –0.11
0.15 –0.31
0.41 0.02 0.11
–0.71 0.01 0.15 0.06 0.01
–0.13
0.8 0.00
–0.70 0.35 0.09
–0.03 –0.02 0.23 0.87
–0.30 0.20 0.02 0.00 0.10
–1.6 –0.04 –0.26 –0.31 –0.35 –0.23 0.08 0.13
–1.70 0.64 0.40 0.03 0.02
–0.03
* Advance statistics
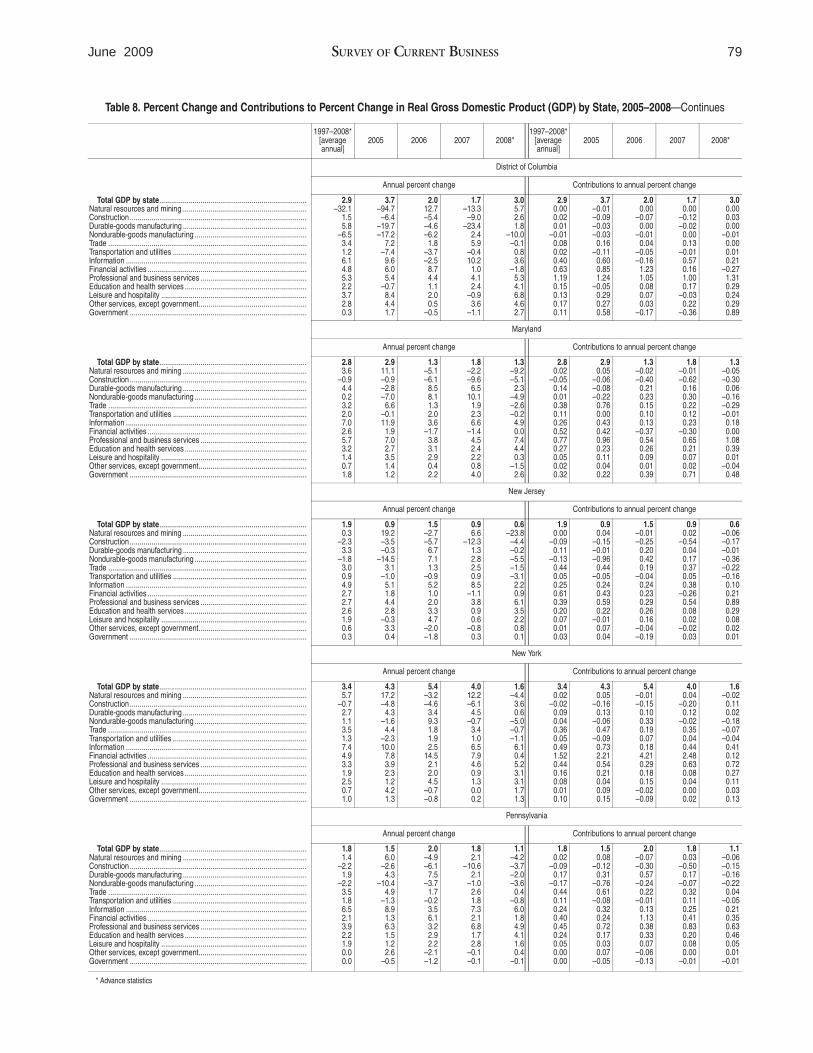
79 June 2009 SURVEY OF CURRENT BUSINESS
Table 8. Percent Change and Contributions to Percent Change in Real Gross Domestic Product (GDP) by State, 2005–2008—Continues
1997–2008* [average annual]
2005 2006 2007 2008* 1997–2008*
[average annual]
2005 2006 2007 2008*
Total GDP by state........................................................................... Natural resources and mining ............................................................... Construction .......................................................................................... Durable-goods manufacturing ............................................................... Nondurable-goods manufacturing ......................................................... Trade ..................................................................................................... Transportation and utilities .................................................................... Information ............................................................................................ Financial activities ................................................................................. Professional and business services ...................................................... Education and health services .............................................................. Leisure and hospitality .......................................................................... Other services, except government....................................................... Government ..........................................................................................
District of Columbia
Annual percent change Contributions to annual percent change
2.9 –32.1
1.5 5.8
–6.5 3.4 1.2 6.1 4.8 5.3 2.2 3.7 2.8 0.3
3.7 –94.7
–6.4 –19.7 –17.2
7.2 –7.4
9.6 6.0 5.4
–0.7 8.4 4.4 1.7
2.0 12.7 –5.4 –4.6 –6.2
1.8 –3.7 –2.5
8.7 4.4 1.1 2.0 0.5
–0.5
1.7 –13.3
–9.0 –23.4
2.4 5.9
–0.4 10.2
1.0 4.1 2.4
–0.9 3.6
–1.1
3.0 5.7 2.6 1.8
–10.0 –0.1
0.8 3.6
–1.8 5.3 4.1 6.8 4.6 2.7
2.9 0.00 0.02 0.01
–0.01 0.08 0.02 0.40 0.63 1.19 0.15 0.13 0.17 0.11
3.7 –0.01 –0.09 –0.03 –0.03
0.16 –0.11
0.60 0.85 1.24
–0.05 0.29 0.27 0.58
2.0 0.00
–0.07 0.00
–0.01 0.04
–0.05 –0.16
1.23 1.05 0.08 0.07 0.03
–0.17
1.7 0.00
–0.12 –0.02 0.00 0.13
–0.01 0.57 0.16 1.00 0.17
–0.03 0.22
–0.36
3.0 0.00 0.03 0.00
–0.01 0.00 0.01 0.21
–0.27 1.31 0.29 0.24 0.29 0.89
Maryland
Annual percent change Contributions to annual percent change
Total GDP by state........................................................................... Natural resources and mining ............................................................... Construction .......................................................................................... Durable-goods manufacturing ............................................................... Nondurable-goods manufacturing ......................................................... Trade ..................................................................................................... Transportation and utilities .................................................................... Information ............................................................................................ Financial activities ................................................................................. Professional and business services ...................................................... Education and health services .............................................................. Leisure and hospitality .......................................................................... Other services, except government....................................................... Government ..........................................................................................
2.8 3.6
–0.9 4.4 0.2 3.2 2.0 7.0 2.6 5.7 3.2 1.4 0.7 1.8
2.9 11.1 –0.9 –2.8 –7.0
6.6 –0.1 11.9
1.9 7.0 2.7 3.5 1.4 1.2
1.3 –5.1 –6.1
8.5 8.1 1.3 2.0 3.6
–1.7 3.8 3.1 2.9 0.4 2.2
1.8 –2.2 –9.6
6.5 10.1
1.9 2.3 6.6
–1.4 4.5 2.4 2.2 0.8 4.0
1.3 –9.2 –5.1
2.3 –4.9 –2.6 –0.2 4.9 0.0 7.4 4.4 0.3
–1.5 2.6
2.8 0.02
–0.05 0.14 0.01 0.38 0.11 0.26 0.52 0.77 0.27 0.05 0.02 0.32
2.9 0.05
–0.06 –0.08 –0.22
0.76 0.00 0.43 0.42 0.96 0.23 0.11 0.04 0.22
1.3 –0.02 –0.40
0.21 0.23 0.15 0.10 0.13
–0.37 0.54 0.26 0.09 0.01 0.39
1.8 –0.01 –0.62 0.16 0.30 0.22 0.12 0.23
–0.30 0.65 0.21 0.07 0.02 0.71
1.3 –0.05 –0.30 0.06
–0.16 –0.29 –0.01 0.18 0.00 1.08 0.39 0.01
–0.04 0.48
New Jersey
Annual percent change Contributions to annual percent change
Total GDP by state........................................................................... Natural resources and mining ............................................................... Construction .......................................................................................... Durable-goods manufacturing ............................................................... Nondurable-goods manufacturing ......................................................... Trade ..................................................................................................... Transportation and utilities .................................................................... Information ............................................................................................ Financial activities ................................................................................. Professional and business services ...................................................... Education and health services .............................................................. Leisure and hospitality .......................................................................... Other services, except government....................................................... Government ..........................................................................................
1.9 0.3
–2.3 3.3
–1.8 3.0 0.9 4.9 2.7 2.7 2.6 1.9 0.6 0.3
0.9 19.2 –3.5 –0.3
–14.5 3.1
–1.0 5.1 1.8 4.4 2.8
–0.3 3.3 0.4
1.5 –2.7 –5.7
6.7 7.1 1.3
–0.9 5.2 1.0 2.0 3.3 4.7
–2.0 –1.8
0.9 6.6
–12.3 1.3 2.8 2.5 0.9 8.5
–1.1 3.8 0.9 0.6
–0.8 0.3
0.6 –23.8
–4.4 –0.2 –5.5 –1.5 –3.1
2.2 0.9 6.1 3.5 2.2 0.8 0.1
1.9 0.00
–0.09 0.11
–0.13 0.44 0.05 0.25 0.61 0.39 0.20 0.07 0.01 0.03
0.9 0.04
–0.15 –0.01 –0.96
0.44 –0.05
0.24 0.43 0.59 0.22
–0.01 0.07 0.04
1.5 –0.01 –0.25
0.20 0.42 0.19
–0.04 0.24 0.23 0.29 0.26 0.16
–0.04 –0.19
0.9 0.02
–0.54 0.04 0.17 0.37 0.05 0.38
–0.26 0.54 0.08 0.02
–0.02 0.03
0.6 –0.06 –0.17 –0.01 –0.36 –0.22 –0.16 0.10 0.21 0.89 0.29 0.08 0.02 0.01
New York
Annual percent change Contributions to annual percent change
Total GDP by state........................................................................... Natural resources and mining ............................................................... Construction .......................................................................................... Durable-goods manufacturing ............................................................... Nondurable-goods manufacturing ......................................................... Trade ..................................................................................................... Transportation and utilities .................................................................... Information ............................................................................................ Financial activities ................................................................................. Professional and business services ...................................................... Education and health services .............................................................. Leisure and hospitality .......................................................................... Other services, except government....................................................... Government ..........................................................................................
3.4 5.7
–0.7 2.7 1.1 3.5 1.3 7.4 4.9 3.3 1.9 2.5 0.7 1.0
4.3 17.2 –4.8
4.3 –1.6
4.4 –2.3 10.0
7.8 3.9 2.3 1.2 4.2 1.3
5.4 –3.2 –4.6
3.4 9.3 1.8 1.9 2.5
14.5 2.1 2.0 4.5
–0.7 –0.8
4.0 12.2 –6.1
4.5 –0.7
3.4 1.0 6.5 7.9 4.6 0.9 1.3 0.0 0.2
1.6 –4.4
3.6 0.6
–5.0 –0.7 –1.1
6.1 0.4 5.2 3.1 3.1 1.7 1.3
3.4 0.02
–0.02 0.09 0.04 0.36 0.05 0.49 1.52 0.44 0.16 0.08 0.01 0.10
4.3 0.05
–0.16 0.13
–0.06 0.47
–0.09 0.73 2.21 0.54 0.21 0.04 0.09 0.15
5.4 –0.01 –0.15
0.10 0.33 0.19 0.07 0.18 4.21 0.29 0.18 0.15
–0.02 –0.09
4.0 0.04
–0.20 0.12
–0.02 0.35 0.04 0.44 2.48 0.63 0.08 0.04 0.00 0.02
1.6 –0.02 0.11 0.02
–0.18 –0.07 –0.04 0.41 0.12 0.72 0.27 0.11 0.03 0.13
Pennsylvania
Annual percent change Contributions to annual percent change
Total GDP by state........................................................................... Natural resources and mining ............................................................... Construction .......................................................................................... Durable-goods manufacturing ............................................................... Nondurable-goods manufacturing ......................................................... Trade ..................................................................................................... Transportation and utilities .................................................................... Information ............................................................................................ Financial activities ................................................................................. Professional and business services ...................................................... Education and health services .............................................................. Leisure and hospitality .......................................................................... Other services, except government....................................................... Government ..........................................................................................
1.8 1.4
–2.2 1.9
–2.2 3.5 1.8 6.5 2.1 3.9 2.2 1.9 0.0 0.0
1.5 6.0
–2.6 4.3
–10.4 4.9
–1.3 8.9 1.3 6.3 1.5 1.2 2.6
–0.5
2.0 –4.9 –6.1
7.5 –3.7
1.7 –0.2
3.5 6.1 3.2 2.9 2.2
–2.1 –1.2
1.8 2.1
–10.6 2.1
–1.0 2.6 1.8 7.3 2.1 6.8 1.7 2.8
–0.1 –0.1
1.1 –4.2 –3.7 –2.0 –3.6
0.4 –0.8
6.0 1.8 4.9 4.1 1.6 0.4
–0.1
1.8 0.02
–0.09 0.17
–0.17 0.44 0.11 0.24 0.40 0.45 0.24 0.05 0.00 0.00
1.5 0.08
–0.12 0.31
–0.76 0.61
–0.08 0.32 0.24 0.72 0.17 0.03 0.07
–0.05
2.0 –0.07 –0.30
0.57 –0.24
0.22 –0.01
0.13 1.13 0.38 0.33 0.07
–0.06 –0.13
1.8 0.03
–0.50 0.17
–0.07 0.32 0.11 0.25 0.41 0.83 0.20 0.08 0.00
–0.01
1.1 –0.06 –0.15 –0.16 –0.22 0.04
–0.05 0.21 0.35 0.63 0.46 0.05 0.01
–0.01
* Advance statistics

80 Gross Domestic Product by State June 2009
Table 8. Percent Change and Contributions to Percent Change in Real Gross Domestic Product (GDP) by State, 2005–2008—Continues
1997–2008* [average annual]
2005 2006 2007 2008* 1997–2008*
[average annual]
2005 2006 2007 2008*
Total GDP by state........................................................................... Natural resources and mining ............................................................... Construction .......................................................................................... Durable-goods manufacturing ............................................................... Nondurable-goods manufacturing ......................................................... Trade ..................................................................................................... Transportation and utilities..................................................................... Information ............................................................................................ Financial activities ................................................................................. Professional and business services ...................................................... Education and health services .............................................................. Leisure and hospitality........................................................................... Other services, except government....................................................... Government...........................................................................................
Great Lakes
Annual percent change Contributions to annual percent change
1.2 2.2
–3.9 1.1
–0.5 2.7 1.5 4.9 1.2 2.0 2.4 1.7
–0.6 0.1
0.6 –10.4
–5.0 1.2
–8.7 4.7
–0.2 8.5 0.6 4.1 2.6 1.1 0.3
–2.2
0.6 9.1
–8.8 2.8
–0.6 0.7 1.6 0.1 2.1 0.2 2.4 1.1
–2.1 –0.9
0.7 8.5
–12.0 2.0 0.6 1.9 1.1 7.4 0.3 2.1 1.0 1.4
–0.1 –0.5
–0.4 1.8
–5.2 –4.9 –3.7 –1.0 –1.2
4.2 –1.3
4.1 3.9 0.9
–0.5 0.7
1.2 0.03
–0.16 0.14
–0.03 0.33 0.08 0.15 0.22 0.24 0.18 0.05
–0.01 0.01
0.6 –0.13 –0.23
0.14 –0.58
0.58 –0.01
0.25 0.11 0.47 0.21 0.03 0.01
–0.23
0.6 0.09
–0.41 0.32
–0.04 0.09 0.09 0.00 0.39 0.02 0.20 0.04
–0.05 –0.10
0.7 0.10
–0.54 0.22 0.04 0.24 0.06 0.21 0.05 0.26 0.08 0.05 0.00
–0.05
–0.4 0.03
–0.21 –0.56 –0.23 –0.12 –0.07 0.12
–0.24 0.50 0.33 0.03
–0.01 0.07
Illinois
Annual percent change Contributions to annual percent change
Total GDP by state........................................................................... Natural resources and mining ............................................................... Construction .......................................................................................... Durable-goods manufacturing ............................................................... Nondurable-goods manufacturing ......................................................... Trade ..................................................................................................... Transportation and utilities..................................................................... Information ............................................................................................ Financial activities ................................................................................. Professional and business services ...................................................... Education and health services .............................................................. Leisure and hospitality........................................................................... Other services, except government....................................................... Government...........................................................................................
1.8 2.5
–2.5 2.0
–1.0 3.1 1.8 5.0 2.0 2.9 2.5 1.7 0.0 0.4
0.6 –31.2
–3.8 1.8
–8.0 5.7
–0.2 9.0 1.2 4.7 2.8 3.1 1.1
–7.7
3.1 23.1 –5.3
7.5 –4.9
2.5 2.3 0.8 8.2 2.5 2.8 2.4
–0.8 0.1
1.9 13.6
–12.7 3.2 3.4 3.2 0.0 9.7 2.7 3.0 1.5 1.8 0.6
–0.1
0.3 7.7
–2.6 –2.3 –3.8 –1.6 –0.5
5.9 –2.2
4.7 3.9 1.6 1.3 1.0
1.8 0.04
–0.11 0.16
–0.06 0.39 0.10 0.19 0.41 0.39 0.17 0.05 0.00 0.04
0.6 –0.37 –0.18
0.13 –0.48
0.71 –0.01
0.32 0.27 0.65 0.21 0.10 0.03
–0.81
3.1 0.18
–0.27 0.54
–0.27 0.33 0.13 0.03 1.75 0.36 0.21 0.08
–0.02 0.01
1.9 0.14
–0.62 0.23 0.17 0.41 0.00 0.33 0.61 0.44 0.11 0.06 0.01 0.00
0.3 0.09
–0.11 –0.17 –0.20 –0.20 –0.03 0.21
–0.50 0.68 0.30 0.05 0.03 0.09
Indiana
Annual percent change Contributions to annual percent change
Total GDP by state........................................................................... Natural resources and mining ............................................................... Construction .......................................................................................... Durable-goods manufacturing ............................................................... Nondurable-goods manufacturing ......................................................... Trade ..................................................................................................... Transportation and utilities..................................................................... Information ............................................................................................ Financial activities ................................................................................. Professional and business services ...................................................... Education and health services .............................................................. Leisure and hospitality........................................................................... Other services, except government....................................................... Government...........................................................................................
1.6 3.0
–4.2 2.0 1.1 3.1 1.7 4.9 1.0 2.5 2.7 2.4
–0.2 0.3
–0.7 –18.1
–4.4 –1.5
–11.6 5.7 1.6 8.3
–0.9 3.3 3.3 0.5 0.9 0.2
0.1 9.8
–9.6 1.2
–1.7 1.2 1.9 0.4
–0.4 0.2 2.5 0.7
–1.2 –0.4
1.3 11.8 –8.3
2.2 –0.6
1.9 1.1 5.3 2.2 3.6 1.6 1.5 0.3 0.2
–0.6 4.1
–2.8 –6.2 –3.2 –0.7 –0.3
4.2 –0.3
5.1 3.8 0.3 0.0 1.2
1.6 0.06
–0.19 0.34 0.11 0.38 0.11 0.11 0.15 0.19 0.21 0.08 0.00 0.03
–0.7 –0.30 –0.20 –0.26 –1.26
0.66 0.09 0.18
–0.14 0.25 0.26 0.02 0.02 0.02
0.1 0.13
–0.48 0.21
–0.18 0.16 0.12 0.01
–0.06 0.01 0.21 0.03
–0.03 –0.05
1.3 0.18
–0.38 0.36
–0.06 0.23 0.07 0.11 0.33 0.28 0.13 0.06 0.01 0.02
–0.6 0.08
–0.12 –0.99 –0.31 –0.09 –0.02 0.09
–0.05 0.40 0.32 0.01 0.00 0.12
Michigan
Annual percent change Contributions to annual percent change
Total GDP by state........................................................................... Natural resources and mining ............................................................... Construction .......................................................................................... Durable-goods manufacturing ............................................................... Nondurable-goods manufacturing ......................................................... Trade ..................................................................................................... Transportation and utilities..................................................................... Information ............................................................................................ Financial activities ................................................................................. Professional and business services ...................................................... Education and health services .............................................................. Leisure and hospitality........................................................................... Other services, except government....................................................... Government...........................................................................................
0.3 2.4
–5.9 0.0
–1.3 1.7 1.2 4.5
–0.4 0.3 2.0 1.9
–1.5 –0.4
0.6 12.3 –6.2
1.5 –12.2
3.5 –1.7
8.2 –0.8
1.6 3.4 0.5
–0.3 1.5
–1.5 14.0
–13.8 –1.4
5.0 –1.5 –1.0 –0.8
0.1 –3.6
2.1 0.4
–3.1 –2.9
–1.1 –5.9
–15.1 2.6
–1.0 0.2 3.3 3.7
–4.7 –0.4
1.2 0.6
–1.2 –1.6
–1.5 –1.6
–10.0 –8.3 –3.0 –0.9 –5.2
0.5 –0.7
1.8 4.0 0.9
–1.6 0.2
0.3 0.02
–0.27 0.00
–0.07 0.25 0.06 0.13
–0.08 0.04 0.18 0.06
–0.04 –0.05
0.6 0.10
–0.28 0.21
–0.51 0.44
–0.08 0.22
–0.15 0.21 0.27 0.02
–0.01 0.16
–1.5 0.12
–0.64 –0.19
0.19 –0.19 –0.05 –0.02
0.01 –0.50
0.18 0.01
–0.07 –0.33
–1.1 –0.07 –0.65 0.33
–0.04 0.03 0.17 0.10
–0.86 –0.06 0.10 0.02
–0.03 –0.18
–1.5 –0.02 –0.37 –1.08 –0.12 –0.12 –0.27 0.01
–0.12 0.24 0.35 0.03
–0.04 0.03
Ohio
Annual percent change Contributions to annual percent change
Total GDP by state........................................................................... Natural resources and mining ............................................................... Construction .......................................................................................... Durable-goods manufacturing ............................................................... Nondurable-goods manufacturing ......................................................... Trade ..................................................................................................... Transportation and utilities..................................................................... Information ............................................................................................ Financial activities ................................................................................. Professional and business services ...................................................... Education and health services .............................................................. Leisure and hospitality........................................................................... Other services, except government....................................................... Government...........................................................................................
0.9 –0.5 –4.6
0.3 –1.5
2.3 1.4 4.1 1.0 2.3 2.0 1.0
–1.0 0.1
0.8 –4.4 –6.4
2.3 –8.5
4.2 0.3 7.1 0.1 5.7 1.9
–0.3 –0.8 –0.9
–0.8 0.9
–8.8 1.8
–0.8 –0.7
3.6 –2.2 –3.3 –0.1
2.4 –0.6 –3.7 –1.3
0.2 2.8
–11.5 0.6
–0.9 2.1 1.3 5.1
–0.8 2.6
–0.1 2.0
–0.4 0.0
–0.7 1.0
–6.2 –5.4 –5.6 –0.8
0.5 3.3
–2.7 5.2 3.4 0.1
–2.7 1.1
0.9 0.00
–0.18 0.05
–0.10 0.30 0.08 0.11 0.17 0.26 0.16 0.03
–0.02 0.01
0.8 –0.05 –0.27
0.29 –0.56
0.54 0.02 0.19 0.02 0.61 0.16
–0.01 –0.02 –0.10
–0.8 0.01
–0.38 0.22
–0.05 –0.08
0.19 –0.06 –0.62 –0.02
0.21 –0.02 –0.09 –0.15
0.2 0.03
–0.48 0.08
–0.05 0.27 0.07 0.13
–0.15 0.30
–0.01 0.06
–0.01 0.00
–0.7 0.01
–0.23 –0.66 –0.35 –0.11 0.03 0.08
–0.48 0.63 0.31 0.00
–0.06 0.13
* Advance statistics
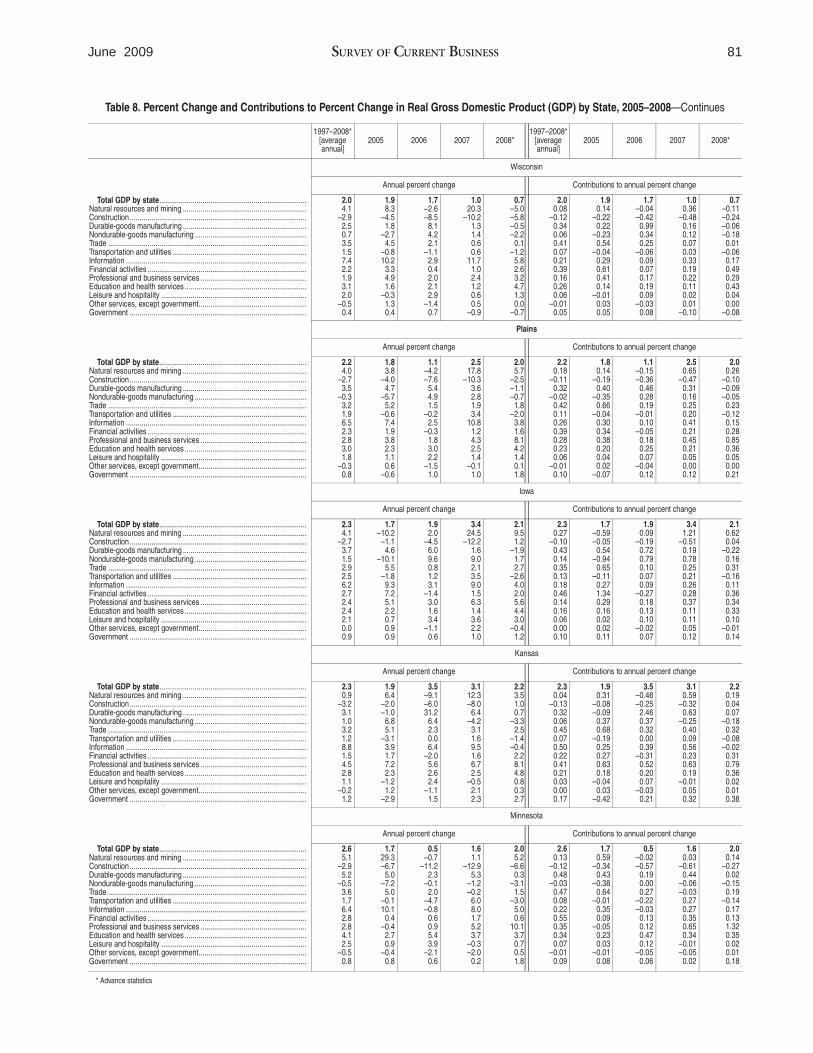
81 June 2009 SURVEY OF CURRENT BUSINESS
Table 8. Percent Change and Contributions to Percent Change in Real Gross Domestic Product (GDP) by State, 2005–2008—Continues
1997–2008* [average annual]
2005 2006 2007 2008* 1997–2008*
[average annual]
2005 2006 2007 2008*
Total GDP by state........................................................................... Natural resources and mining ............................................................... Construction .......................................................................................... Durable-goods manufacturing ............................................................... Nondurable-goods manufacturing ......................................................... Trade ..................................................................................................... Transportation and utilities .................................................................... Information ............................................................................................ Financial activities ................................................................................. Professional and business services ...................................................... Education and health services .............................................................. Leisure and hospitality .......................................................................... Other services, except government....................................................... Government ..........................................................................................
Wisconsin
Annual percent change Contributions to annual percent change
2.0 4.1
–2.9 2.5 0.7 3.5 1.5 7.4 2.2 1.9 3.1 2.0
–0.5 0.4
1.9 8.3
–4.5 1.8
–2.7 4.5
–0.8 10.2
3.3 4.9 1.6
–0.3 1.3 0.4
1.7 –2.6 –8.5
8.1 4.2 2.1
–1.1 2.9 0.4 2.0 2.1 2.9
–1.4 0.7
1.0 20.3
–10.2 1.3 1.4 0.6 0.6
11.7 1.0 2.4 1.2 0.6 0.5
–0.9
0.7 –5.0 –5.8 –0.5 –2.2
0.1 –1.2
5.8 2.6 3.2 4.7 1.3 0.0
–0.7
2.0 0.08
–0.12 0.34 0.06 0.41 0.07 0.21 0.39 0.16 0.26 0.06
–0.01 0.05
1.9 0.14
–0.22 0.22
–0.23 0.54
–0.04 0.29 0.61 0.41 0.14
–0.01 0.03 0.05
1.7 –0.04 –0.42
0.99 0.34 0.25
–0.06 0.09 0.07 0.17 0.19 0.09
–0.03 0.08
1.0 0.36
–0.48 0.16 0.12 0.07 0.03 0.33 0.19 0.22 0.11 0.02 0.01
–0.10
0.7 –0.11 –0.24 –0.06 –0.18 0.01
–0.06 0.17 0.49 0.29 0.43 0.04 0.00
–0.08
Plains
Annual percent change Contributions to annual percent change
Total GDP by state........................................................................... Natural resources and mining ............................................................... Construction .......................................................................................... Durable-goods manufacturing ............................................................... Nondurable-goods manufacturing ......................................................... Trade ..................................................................................................... Transportation and utilities .................................................................... Information ............................................................................................ Financial activities ................................................................................. Professional and business services ...................................................... Education and health services .............................................................. Leisure and hospitality .......................................................................... Other services, except government....................................................... Government ..........................................................................................
2.2 4.0
–2.7 3.5
–0.3 3.2 1.9 6.5 2.3 2.8 3.0 1.8
–0.3 0.8
1.8 3.8
–4.0 4.7
–5.7 5.2
–0.6 7.4 1.9 3.8 2.3 1.1 0.6
–0.6
1.1 –4.2 –7.6
5.4 4.9 1.5
–0.2 2.5
–0.3 1.8 3.0 2.2
–1.5 1.0
2.5 17.8
–10.3 3.6 2.8 1.9 3.4
10.8 1.2 4.3 2.5 1.4
–0.1 1.0
2.0 5.7
–2.5 –1.1 –0.7
1.8 –2.0
3.8 1.6 8.1 4.2 1.4 0.1 1.8
2.2 0.18
–0.11 0.32
–0.02 0.42 0.11 0.26 0.39 0.28 0.23 0.06
–0.01 0.10
1.8 0.14
–0.19 0.40
–0.35 0.66
–0.04 0.30 0.34 0.38 0.20 0.04 0.02
–0.07
1.1 –0.15 –0.36
0.46 0.28 0.19
–0.01 0.10
–0.05 0.18 0.25 0.07
–0.04 0.12
2.5 0.65
–0.47 0.31 0.16 0.25 0.20 0.41 0.21 0.45 0.21 0.05 0.00 0.12
2.0 0.26
–0.10 –0.09 –0.05 0.23
–0.12 0.15 0.28 0.85 0.36 0.05 0.00 0.21
Iowa
Annual percent change Contributions to annual percent change
Total GDP by state........................................................................... Natural resources and mining ............................................................... Construction .......................................................................................... Durable-goods manufacturing ............................................................... Nondurable-goods manufacturing ......................................................... Trade ..................................................................................................... Transportation and utilities .................................................................... Information ............................................................................................ Financial activities ................................................................................. Professional and business services ...................................................... Education and health services .............................................................. Leisure and hospitality .......................................................................... Other services, except government....................................................... Government ..........................................................................................
2.3 4.1
–2.7 3.7 1.5 2.9 2.5 6.2 2.7 2.4 2.4 2.1 0.0 0.9
1.7 –10.2
–1.1 4.6
–10.1 5.5
–1.8 9.3 7.2 5.1 2.2 0.7 0.9 0.9
1.9 2.0
–4.5 6.0 9.6 0.8 1.2 3.1
–1.4 3.0 1.6 3.4
–1.1 0.6
3.4 24.5
–12.2 1.6 9.0 2.1 3.5 9.0 1.5 6.3 1.4 3.6 2.2 1.0
2.1 9.5 1.2
–1.9 1.7 2.7
–2.6 4.0 2.0 5.6 4.4 3.0
–0.4 1.2
2.3 0.27
–0.10 0.43 0.14 0.35 0.13 0.18 0.46 0.14 0.16 0.06 0.00 0.10
1.7 –0.59 –0.05
0.54 –0.94
0.65 –0.11
0.27 1.34 0.29 0.16 0.02 0.02 0.11
1.9 0.09
–0.19 0.72 0.79 0.10 0.07 0.09
–0.27 0.18 0.13 0.10
–0.02 0.07
3.4 1.21
–0.51 0.19 0.78 0.25 0.21 0.26 0.28 0.37 0.11 0.11 0.05 0.12
2.1 0.62 0.04
–0.22 0.16 0.31
–0.16 0.11 0.36 0.34 0.33 0.10
–0.01 0.14
Kansas
Annual percent change Contributions to annual percent change
Total GDP by state........................................................................... Natural resources and mining ............................................................... Construction .......................................................................................... Durable-goods manufacturing ............................................................... Nondurable-goods manufacturing ......................................................... Trade ..................................................................................................... Transportation and utilities .................................................................... Information ............................................................................................ Financial activities ................................................................................. Professional and business services ...................................................... Education and health services .............................................................. Leisure and hospitality .......................................................................... Other services, except government....................................................... Government ..........................................................................................
2.3 0.9
–3.2 3.1 1.0 3.2 1.2 8.8 1.5 4.5 2.8 1.1
–0.2 1.2
1.9 6.4
–2.0 –1.0
6.8 5.1
–3.1 3.9 1.7 7.2 2.3
–1.2 1.2
–2.9
3.5 –9.1 –6.0 31.2
6.4 2.3 0.0 6.4
–2.0 5.6 2.6 2.4
–1.1 1.5
3.1 12.3 –8.0
6.4 –4.2
3.1 1.6 9.5 1.6 6.7 2.5
–0.5 2.1 2.3
2.2 3.5 1.0 0.7
–3.3 2.5
–1.4 –0.4
2.2 8.1 4.8 0.8 0.3 2.7
2.3 0.04
–0.13 0.32 0.06 0.45 0.07 0.50 0.22 0.41 0.21 0.03 0.00 0.17
1.9 0.31
–0.08 –0.09
0.37 0.68
–0.19 0.25 0.27 0.63 0.18
–0.04 0.03
–0.42
3.5 –0.46 –0.25
2.46 0.37 0.32 0.00 0.39
–0.31 0.52 0.20 0.07
–0.03 0.21
3.1 0.59
–0.32 0.63
–0.25 0.40 0.09 0.56 0.23 0.63 0.19
–0.01 0.05 0.32
2.2 0.19 0.04 0.07
–0.18 0.32
–0.08 –0.02 0.31 0.79 0.36 0.02 0.01 0.38
Minnesota
Annual percent change Contributions to annual percent change
Total GDP by state........................................................................... Natural resources and mining ............................................................... Construction .......................................................................................... Durable-goods manufacturing ............................................................... Nondurable-goods manufacturing ......................................................... Trade ..................................................................................................... Transportation and utilities .................................................................... Information ............................................................................................ Financial activities ................................................................................. Professional and business services ...................................................... Education and health services .............................................................. Leisure and hospitality .......................................................................... Other services, except government....................................................... Government ..........................................................................................
2.6 5.1
–2.9 5.2
–0.5 3.6 1.7 6.4 2.8 2.8 4.1 2.5
–0.5 0.8
1.7 29.3 –6.7
5.0 –7.2
5.0 –0.1 10.1
0.4 –0.4
2.7 0.9
–0.4 0.8
0.5 –0.7
–11.2 2.3
–0.1 2.0
–4.7 –0.8
0.6 0.9 5.4 3.9
–2.1 0.6
1.6 1.1
–12.9 5.3
–1.2 –0.2
6.0 8.0 1.7 5.2 3.7
–0.3 –2.0
0.2
2.0 5.2
–6.6 0.3
–3.1 1.5
–3.0 5.0 0.6
10.1 3.7 0.7 0.5 1.8
2.6 0.13
–0.12 0.48
–0.03 0.47 0.08 0.22 0.55 0.35 0.34 0.07
–0.01 0.09
1.7 0.59
–0.34 0.43
–0.38 0.64
–0.01 0.35 0.09
–0.05 0.23 0.03
–0.01 0.08
0.5 –0.02 –0.57
0.19 0.00 0.27
–0.22 –0.03
0.13 0.12 0.47 0.12
–0.05 0.06
1.6 0.03
–0.61 0.44
–0.06 –0.03 0.27 0.27 0.35 0.65 0.34
–0.01 –0.05 0.02
2.0 0.14
–0.27 0.02
–0.15 0.19
–0.14 0.17 0.13 1.32 0.35 0.02 0.01 0.18
* Advance statistics
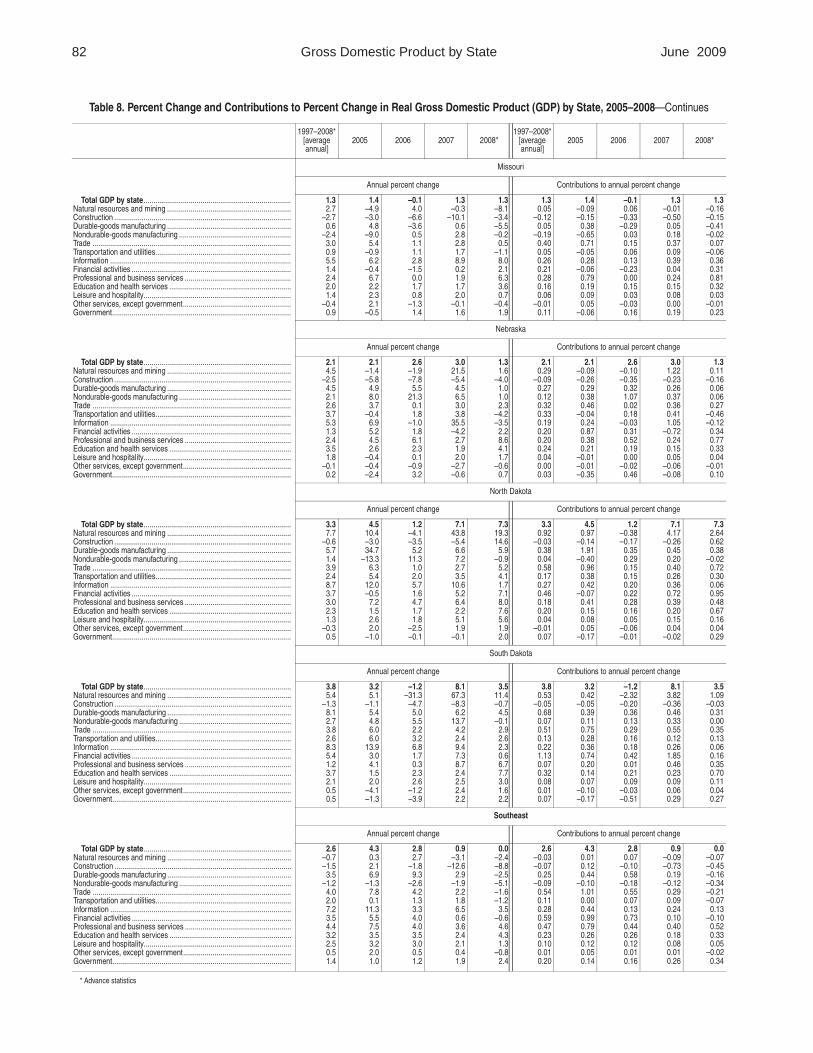
82 Gross Domestic Product by State June 2009
Table 8. Percent Change and Contributions to Percent Change in Real Gross Domestic Product (GDP) by State, 2005–2008—Continues
1997–2008* [average annual]
2005 2006 2007 2008* 1997–2008*
[average annual]
2005 2006 2007 2008*
Total GDP by state........................................................................... Natural resources and mining ............................................................... Construction .......................................................................................... Durable-goods manufacturing ............................................................... Nondurable-goods manufacturing ......................................................... Trade ..................................................................................................... Transportation and utilities..................................................................... Information ............................................................................................ Financial activities ................................................................................. Professional and business services ...................................................... Education and health services .............................................................. Leisure and hospitality........................................................................... Other services, except government....................................................... Government...........................................................................................
Missouri
Annual percent change Contributions to annual percent change
1.3 2.7
–2.7 0.6
–2.4 3.0 0.9 5.5 1.4 2.4 2.0 1.4
–0.4 0.9
1.4 –4.9 –3.0
4.8 –9.0
5.4 –0.9
6.2 –0.4
6.7 2.2 2.3 2.1
–0.5
–0.1 4.0
–6.6 –3.6
0.5 1.1 1.1 2.8
–1.5 0.0 1.7 0.8
–1.3 1.4
1.3 –0.3
–10.1 0.6 2.8 2.8 1.7 8.9 0.2 1.9 1.7 2.0
–0.1 1.6
1.3 –8.1 –3.4 –5.5 –0.2
0.5 –1.1
8.0 2.1 6.3 3.6 0.7
–0.4 1.9
1.3 0.05
–0.12 0.05
–0.19 0.40 0.05 0.26 0.21 0.28 0.16 0.06
–0.01 0.11
1.4 –0.09 –0.15
0.38 –0.65
0.71 –0.05
0.28 –0.06
0.79 0.19 0.09 0.05
–0.06
–0.1 0.06
–0.33 –0.29
0.03 0.15 0.06 0.13
–0.23 0.00 0.15 0.03
–0.03 0.16
1.3 –0.01 –0.50 0.05 0.18 0.37 0.09 0.39 0.04 0.24 0.15 0.08 0.00 0.19
1.3 –0.16 –0.15 –0.41 –0.02 0.07
–0.06 0.36 0.31 0.81 0.32 0.03
–0.01 0.23
Nebraska
Annual percent change Contributions to annual percent change
Total GDP by state........................................................................... Natural resources and mining ............................................................... Construction .......................................................................................... Durable-goods manufacturing ............................................................... Nondurable-goods manufacturing ......................................................... Trade ..................................................................................................... Transportation and utilities..................................................................... Information ............................................................................................ Financial activities ................................................................................. Professional and business services ...................................................... Education and health services .............................................................. Leisure and hospitality........................................................................... Other services, except government....................................................... Government...........................................................................................
2.1 4.5
–2.5 4.5 2.1 2.6 3.7 5.3 1.3 2.4 3.5 1.8
–0.1 0.2
2.1 –1.4 –5.8
4.9 8.0 3.7
–0.4 6.9 5.2 4.5 2.6
–0.4 –0.4 –2.4
2.6 –1.9 –7.8
5.5 21.3
0.1 1.8
–1.0 1.8 6.1 2.3 0.1
–0.9 3.2
3.0 21.5 –5.4
4.5 6.5 3.0 3.8
35.5 –4.2
2.7 1.9 2.0
–2.7 –0.6
1.3 1.6
–4.0 1.0 1.0 2.3
–4.2 –3.5
2.2 8.6 4.1 1.7
–0.6 0.7
2.1 0.29
–0.09 0.27 0.12 0.32 0.33 0.19 0.20 0.20 0.24 0.04 0.00 0.03
2.1 –0.09 –0.26
0.29 0.38 0.46
–0.04 0.24 0.87 0.38 0.21
–0.01 –0.01 –0.35
2.6 –0.10 –0.35
0.32 1.07 0.02 0.18
–0.03 0.31 0.52 0.19 0.00
–0.02 0.46
3.0 1.22
–0.23 0.26 0.37 0.36 0.41 1.05
–0.72 0.24 0.15 0.05
–0.06 –0.08
1.3 0.11
–0.16 0.06 0.06 0.27
–0.46 –0.12 0.34 0.77 0.33 0.04
–0.01 0.10
North Dakota
Annual percent change Contributions to annual percent change
Total GDP by state........................................................................... Natural resources and mining ............................................................... Construction .......................................................................................... Durable-goods manufacturing ............................................................... Nondurable-goods manufacturing ......................................................... Trade ..................................................................................................... Transportation and utilities..................................................................... Information ............................................................................................ Financial activities ................................................................................. Professional and business services ...................................................... Education and health services .............................................................. Leisure and hospitality........................................................................... Other services, except government....................................................... Government...........................................................................................
3.3 7.7
–0.6 5.7 1.4 3.9 2.4 8.7 3.7 3.0 2.3 1.3
–0.3 0.5
4.5 10.4 –3.0 34.7
–13.3 6.3 5.4
12.0 –0.5
7.2 1.5 2.6 2.0
–1.0
1.2 –4.1 –3.5
5.2 11.3
1.0 2.0 5.7 1.6 4.7 1.7 1.8
–2.5 –0.1
7.1 43.8 –5.4
6.6 7.2 2.7 3.5
10.6 5.2 6.4 2.2 5.1 1.9
–0.1
7.3 19.3 14.6
5.9 –0.9
5.2 4.1 1.7 7.1 8.0 7.6 5.6 1.9 2.0
3.3 0.92
–0.03 0.38 0.04 0.58 0.17 0.27 0.46 0.18 0.20 0.04
–0.01 0.07
4.5 0.97
–0.14 1.91
–0.40 0.96 0.38 0.42
–0.07 0.41 0.15 0.08 0.05
–0.17
1.2 –0.38 –0.17
0.35 0.29 0.15 0.15 0.20 0.22 0.28 0.16 0.05
–0.06 –0.01
7.1 4.17
–0.26 0.45 0.20 0.40 0.26 0.36 0.72 0.39 0.20 0.15 0.04
–0.02
7.3 2.64 0.62 0.38
–0.02 0.72 0.30 0.06 0.95 0.48 0.67 0.16 0.04 0.29
South Dakota
Annual percent change Contributions to annual percent change
Total GDP by state........................................................................... Natural resources and mining ............................................................... Construction .......................................................................................... Durable-goods manufacturing ............................................................... Nondurable-goods manufacturing ......................................................... Trade ..................................................................................................... Transportation and utilities..................................................................... Information ............................................................................................ Financial activities ................................................................................. Professional and business services ...................................................... Education and health services .............................................................. Leisure and hospitality........................................................................... Other services, except government....................................................... Government...........................................................................................
3.8 5.4
–1.3 8.1 2.7 3.8 2.6 8.3 5.4 1.2 3.7 2.1 0.5 0.5
3.2 5.1
–1.1 5.4 4.8 6.0 6.0
13.9 3.0 4.1 1.5 2.0
–4.1 –1.3
–1.2 –31.3
–4.7 5.0 5.5 2.2 3.2 6.8 1.7 0.3 2.3 2.6
–1.2 –3.9
8.1 67.3 –8.3
6.2 13.7
4.2 2.4 9.4 7.3 8.7 2.4 2.5 2.4 2.2
3.5 11.4 –0.7
4.5 –0.1
2.9 2.6 2.3 0.6 6.7 7.7 3.0 1.6 2.2
3.8 0.53
–0.05 0.68 0.07 0.51 0.13 0.22 1.13 0.07 0.32 0.08 0.01 0.07
3.2 0.42
–0.05 0.39 0.11 0.75 0.28 0.36 0.74 0.20 0.14 0.07
–0.10 –0.17
–1.2 –2.32 –0.20
0.36 0.13 0.29 0.16 0.18 0.42 0.01 0.21 0.09
–0.03 –0.51
8.1 3.82
–0.36 0.46 0.33 0.55 0.12 0.26 1.85 0.46 0.23 0.09 0.06 0.29
3.5 1.09
–0.03 0.31 0.00 0.35 0.13 0.06 0.16 0.35 0.70 0.11 0.04 0.27
Southeast
Annual percent change Contributions to annual percent change
Total GDP by state........................................................................... Natural resources and mining ............................................................... Construction .......................................................................................... Durable-goods manufacturing ............................................................... Nondurable-goods manufacturing ......................................................... Trade ..................................................................................................... Transportation and utilities..................................................................... Information ............................................................................................ Financial activities ................................................................................. Professional and business services ...................................................... Education and health services .............................................................. Leisure and hospitality........................................................................... Other services, except government....................................................... Government...........................................................................................
2.6 –0.7 –1.5
3.5 –1.2
4.0 2.0 7.2 3.5 4.4 3.2 2.5 0.5 1.4
4.3 0.3 2.1 6.9
–1.3 7.8 0.1
11.3 5.5 7.5 3.5 3.2 2.0 1.0
2.8 2.7
–1.8 9.3
–2.6 4.2 1.3 3.3 4.0 4.0 3.5 3.0 0.5 1.2
0.9 –3.1
–12.6 2.9
–1.9 2.2 1.8 6.5 0.6 3.6 2.4 2.1 0.4 1.9
0.0 –2.4 –8.8 –2.5 –5.1 –1.6 –1.2
3.5 –0.6
4.6 4.3 1.3
–0.8 2.4
2.6 –0.03 –0.07
0.25 –0.09
0.54 0.11 0.28 0.59 0.47 0.23 0.10 0.01 0.20
4.3 0.01 0.12 0.44
–0.10 1.01 0.00 0.44 0.99 0.79 0.26 0.12 0.05 0.14
2.8 0.07
–0.10 0.58
–0.18 0.55 0.07 0.13 0.73 0.44 0.26 0.12 0.01 0.16
0.9 –0.09 –0.73 0.19
–0.12 0.29 0.09 0.24 0.10 0.40 0.18 0.08 0.01 0.26
0.0 –0.07 –0.45 –0.16 –0.34 –0.21 –0.07 0.13
–0.10 0.52 0.33 0.05
–0.02 0.34
* Advance statistics
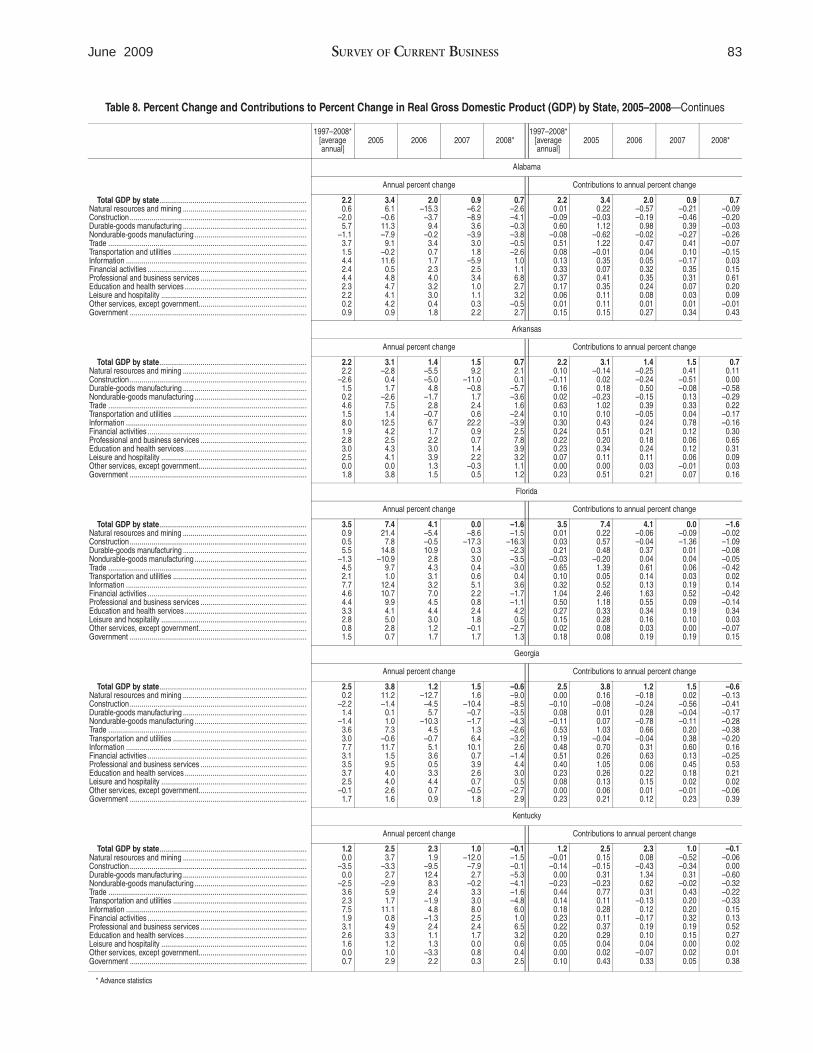
83 June 2009 SURVEY OF CURRENT BUSINESS
Table 8. Percent Change and Contributions to Percent Change in Real Gross Domestic Product (GDP) by State, 2005–2008—Continues
1997–2008* [average annual]
2005 2006 2007 2008* 1997–2008*
[average annual]
2005 2006 2007 2008*
Total GDP by state........................................................................... Natural resources and mining ............................................................... Construction .......................................................................................... Durable-goods manufacturing ............................................................... Nondurable-goods manufacturing ......................................................... Trade ..................................................................................................... Transportation and utilities .................................................................... Information ............................................................................................ Financial activities ................................................................................. Professional and business services ...................................................... Education and health services .............................................................. Leisure and hospitality .......................................................................... Other services, except government....................................................... Government ..........................................................................................
Alabama
Annual percent change Contributions to annual percent change
2.2 0.6
–2.0 5.7
–1.1 3.7 1.5 4.4 2.4 4.4 2.3 2.2 0.2 0.9
3.4 6.1
–0.6 11.3 –7.9
9.1 –0.2 11.6
0.5 4.8 4.7 4.1 4.2 0.9
2.0 –15.3
–3.7 9.4
–0.2 3.4 0.7 1.7 2.3 4.0 3.2 3.0 0.4 1.8
0.9 –6.2 –8.9
3.6 –3.9
3.0 1.8
–5.9 2.5 3.4 1.0 1.1 0.3 2.2
0.7 –2.6 –4.1 –0.3 –3.8 –0.5 –2.6
1.0 1.1 6.8 2.7 3.2
–0.5 2.7
2.2 0.01
–0.09 0.60
–0.08 0.51 0.08 0.13 0.33 0.37 0.17 0.06 0.01 0.15
3.4 0.22
–0.03 1.12
–0.62 1.22
–0.01 0.35 0.07 0.41 0.35 0.11 0.11 0.15
2.0 –0.57 –0.19
0.98 –0.02
0.47 0.04 0.05 0.32 0.35 0.24 0.08 0.01 0.27
0.9 –0.21 –0.46 0.39
–0.27 0.41 0.10
–0.17 0.35 0.31 0.07 0.03 0.01 0.34
0.7 –0.09 –0.20 –0.03 –0.26 –0.07 –0.15 0.03 0.15 0.61 0.20 0.09
–0.01 0.43
Arkansas
Annual percent change Contributions to annual percent change
Total GDP by state........................................................................... Natural resources and mining ............................................................... Construction .......................................................................................... Durable-goods manufacturing ............................................................... Nondurable-goods manufacturing ......................................................... Trade ..................................................................................................... Transportation and utilities .................................................................... Information ............................................................................................ Financial activities ................................................................................. Professional and business services ...................................................... Education and health services .............................................................. Leisure and hospitality .......................................................................... Other services, except government....................................................... Government ..........................................................................................
2.2 2.2
–2.6 1.5 0.2 4.6 1.5 8.0 1.9 2.8 3.0 2.5 0.0 1.8
3.1 –2.8
0.4 1.7
–2.6 7.5 1.4
12.5 4.2 2.5 4.3 4.1 0.0 3.8
1.4 –5.5 –5.0
4.8 –1.7
2.8 –0.7
6.7 1.7 2.2 3.0 3.9 1.3 1.5
1.5 9.2
–11.0 –0.8
1.7 2.4 0.6
22.2 0.9 0.7 1.4 2.2
–0.3 0.5
0.7 2.1 0.1
–5.7 –3.6
1.6 –2.4 –3.9
2.5 7.8 3.9 3.2 1.1 1.2
2.2 0.10
–0.11 0.16 0.02 0.63 0.10 0.30 0.24 0.22 0.23 0.07 0.00 0.23
3.1 –0.14
0.02 0.18
–0.23 1.02 0.10 0.43 0.51 0.20 0.34 0.11 0.00 0.51
1.4 –0.25 –0.24
0.50 –0.15
0.39 –0.05
0.24 0.21 0.18 0.24 0.11 0.03 0.21
1.5 0.41
–0.51 –0.08 0.13 0.33 0.04 0.78 0.12 0.06 0.12 0.06
–0.01 0.07
0.7 0.11 0.00
–0.58 –0.29 0.22
–0.17 –0.16 0.30 0.65 0.31 0.09 0.03 0.16
Florida
Annual percent change Contributions to annual percent change
Total GDP by state........................................................................... Natural resources and mining ............................................................... Construction .......................................................................................... Durable-goods manufacturing ............................................................... Nondurable-goods manufacturing ......................................................... Trade ..................................................................................................... Transportation and utilities .................................................................... Information ............................................................................................ Financial activities ................................................................................. Professional and business services ...................................................... Education and health services .............................................................. Leisure and hospitality .......................................................................... Other services, except government....................................................... Government ..........................................................................................
3.5 0.9 0.5 5.5
–1.3 4.5 2.1 7.7 4.6 4.4 3.3 2.8 0.8 1.5
7.4 21.4
7.8 14.8
–10.9 9.7 1.0
12.4 10.7
9.9 4.1 5.0 2.8 0.7
4.1 –5.4 –0.5 10.9
2.8 4.3 3.1 3.2 7.0 4.5 4.4 3.0 1.2 1.7
0.0 –8.6
–17.3 0.3 3.0 0.4 0.6 5.1 2.2 0.8 2.4 1.8
–0.1 1.7
–1.6 –1.5
–16.3 –2.3 –3.5 –3.0
0.4 3.6
–1.7 –1.1
4.2 0.5
–2.7 1.3
3.5 0.01 0.03 0.21
–0.03 0.65 0.10 0.32 1.04 0.50 0.27 0.15 0.02 0.18
7.4 0.22 0.57 0.48
–0.20 1.39 0.05 0.52 2.46 1.18 0.33 0.28 0.08 0.08
4.1 –0.06 –0.04
0.37 0.04 0.61 0.14 0.13 1.63 0.55 0.34 0.16 0.03 0.19
0.0 –0.09 –1.36 0.01 0.04 0.06 0.03 0.19 0.52 0.09 0.19 0.10 0.00 0.19
–1.6 –0.02 –1.09 –0.08 –0.05 –0.42 0.02 0.14
–0.42 –0.14 0.34 0.03
–0.07 0.15
Georgia
Annual percent change Contributions to annual percent change
Total GDP by state........................................................................... Natural resources and mining ............................................................... Construction .......................................................................................... Durable-goods manufacturing ............................................................... Nondurable-goods manufacturing ......................................................... Trade ..................................................................................................... Transportation and utilities .................................................................... Information ............................................................................................ Financial activities ................................................................................. Professional and business services ...................................................... Education and health services .............................................................. Leisure and hospitality .......................................................................... Other services, except government....................................................... Government ..........................................................................................
2.5 0.2
–2.2 1.4
–1.4 3.6 3.0 7.7 3.1 3.5 3.7 2.5
–0.1 1.7
3.8 11.2 –1.4
0.1 1.0 7.3
–0.6 11.7
1.5 9.5 4.0 4.0 2.6 1.6
1.2 –12.7
–4.5 5.7
–10.3 4.5
–0.7 5.1 3.6 0.5 3.3 4.4 0.7 0.9
1.5 1.6
–10.4 –0.7 –1.7
1.3 6.4
10.1 0.7 3.9 2.6 0.7
–0.5 1.8
–0.6 –9.0 –8.5 –3.5 –4.3 –2.6 –3.2
2.6 –1.4
4.4 3.0 0.5
–2.7 2.9
2.5 0.00
–0.10 0.08
–0.11 0.53 0.19 0.48 0.51 0.40 0.23 0.08 0.00 0.23
3.8 0.16
–0.08 0.01 0.07 1.03
–0.04 0.70 0.26 1.05 0.26 0.13 0.06 0.21
1.2 –0.18 –0.24
0.28 –0.78
0.66 –0.04
0.31 0.63 0.06 0.22 0.15 0.01 0.12
1.5 0.02
–0.56 –0.04 –0.11 0.20 0.38 0.60 0.13 0.45 0.18 0.02
–0.01 0.23
–0.6 –0.13 –0.41 –0.17 –0.28 –0.38 –0.20 0.16
–0.25 0.53 0.21 0.02
–0.06 0.39
Kentucky
Annual percent change Contributions to annual percent change
Total GDP by state........................................................................... Natural resources and mining ............................................................... Construction .......................................................................................... Durable-goods manufacturing ............................................................... Nondurable-goods manufacturing ......................................................... Trade ..................................................................................................... Transportation and utilities .................................................................... Information ............................................................................................ Financial activities ................................................................................. Professional and business services ...................................................... Education and health services .............................................................. Leisure and hospitality .......................................................................... Other services, except government....................................................... Government ..........................................................................................
1.2 0.0
–3.5 0.0
–2.5 3.6 2.3 7.5 1.9 3.1 2.6 1.6 0.0 0.7
2.5 3.7
–3.3 2.7
–2.9 5.9 1.7
11.1 0.8 4.9 3.3 1.2 1.0 2.9
2.3 1.9
–9.5 12.4
8.3 2.4
–1.9 4.8
–1.3 2.4 1.1 1.3
–3.3 2.2
1.0 –12.0
–7.9 2.7
–0.2 3.3 3.0 8.0 2.5 2.4 1.7 0.0 0.8 0.3
–0.1 –1.5 –0.1 –5.3 –4.1 –1.6 –4.8 6.0 1.0 6.5 3.2 0.6 0.4 2.5
1.2 –0.01 –0.14
0.00 –0.23
0.44 0.14 0.18 0.23 0.22 0.20 0.05 0.00 0.10
2.5 0.15
–0.15 0.31
–0.23 0.77 0.11 0.28 0.11 0.37 0.29 0.04 0.02 0.43
2.3 0.08
–0.43 1.34 0.62 0.31
–0.13 0.12
–0.17 0.19 0.10 0.04
–0.07 0.33
1.0 –0.52 –0.34 0.31
–0.02 0.43 0.20 0.20 0.32 0.19 0.15 0.00 0.02 0.05
–0.1 –0.06 0.00
–0.60 –0.32 –0.22 –0.33 0.15 0.13 0.52 0.27 0.02 0.01 0.38
* Advance statistics
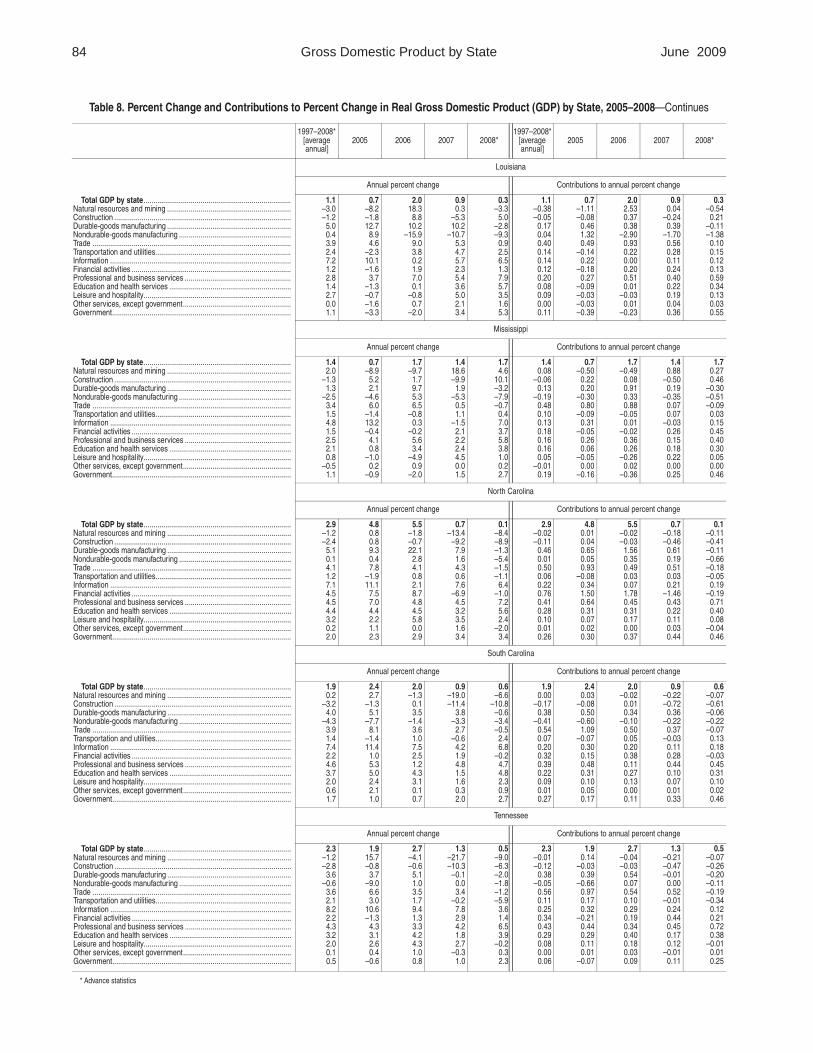
84 Gross Domestic Product by State June 2009
Table 8. Percent Change and Contributions to Percent Change in Real Gross Domestic Product (GDP) by State, 2005–2008—Continues
1997–2008* [average annual]
2005 2006 2007 2008* 1997–2008*
[average annual]
2005 2006 2007 2008*
Total GDP by state........................................................................... Natural resources and mining ............................................................... Construction .......................................................................................... Durable-goods manufacturing ............................................................... Nondurable-goods manufacturing ......................................................... Trade ..................................................................................................... Transportation and utilities..................................................................... Information ............................................................................................ Financial activities ................................................................................. Professional and business services ...................................................... Education and health services .............................................................. Leisure and hospitality........................................................................... Other services, except government....................................................... Government...........................................................................................
Louisiana
Annual percent change Contributions to annual percent change
1.1 –3.0 –1.2
5.0 0.4 3.9 2.4 7.2 1.2 2.8 1.4 2.7 0.0 1.1
0.7 –8.2 –1.8 12.7
8.9 4.6
–2.3 10.1 –1.6
3.7 –1.3 –0.7 –1.6 –3.3
2.0 18.3
8.8 10.2
–15.9 9.0 3.8 0.2 1.9 7.0 0.1
–0.8 0.7
–2.0
0.9 0.3
–5.3 10.2
–10.7 5.3 4.7 5.7 2.3 5.4 3.6 5.0 2.1 3.4
0.3 –3.3
5.0 –2.8 –9.3
0.9 2.5 6.5 1.3 7.9 5.7 3.5 1.6 5.3
1.1 –0.38 –0.05
0.17 0.04 0.40 0.14 0.14 0.12 0.20 0.08 0.09 0.00 0.11
0.7 –1.11 –0.08
0.46 1.32 0.49
–0.14 0.22
–0.18 0.27
–0.09 –0.03 –0.03 –0.39
2.0 2.53 0.37 0.38
–2.90 0.93 0.22 0.00 0.20 0.51 0.01
–0.03 0.01
–0.23
0.9 0.04
–0.24 0.39
–1.70 0.56 0.28 0.11 0.24 0.40 0.22 0.19 0.04 0.36
0.3 –0.54 0.21
–0.11 –1.38 0.10 0.15 0.12 0.13 0.59 0.34 0.13 0.03 0.55
Mississippi
Annual percent change Contributions to annual percent change
Total GDP by state........................................................................... Natural resources and mining ............................................................... Construction .......................................................................................... Durable-goods manufacturing ............................................................... Nondurable-goods manufacturing ......................................................... Trade ..................................................................................................... Transportation and utilities..................................................................... Information ............................................................................................ Financial activities ................................................................................. Professional and business services ...................................................... Education and health services .............................................................. Leisure and hospitality........................................................................... Other services, except government....................................................... Government...........................................................................................
1.4 2.0
–1.3 1.3
–2.5 3.4 1.5 4.8 1.5 2.5 2.1 0.8
–0.5 1.1
0.7 –8.9
5.2 2.1
–4.6 6.0
–1.4 13.2 –0.4
4.1 0.8
–1.0 0.2
–0.9
1.7 –9.7
1.7 9.7 5.3 6.5
–0.8 0.3
–0.2 5.6 3.4
–4.9 0.9
–2.0
1.4 18.6 –9.9
1.9 –5.3
0.5 1.1
–1.5 2.1 2.2 2.4 4.5 0.0 1.5
1.7 4.6
10.1 –3.2 –7.9 –0.7 0.4 7.0 3.7 5.8 3.8 1.0 0.2 2.7
1.4 0.08
–0.06 0.13
–0.19 0.48 0.10 0.13 0.18 0.16 0.16 0.05
–0.01 0.19
0.7 –0.50
0.22 0.20
–0.30 0.80
–0.09 0.31
–0.05 0.26 0.06
–0.05 0.00
–0.16
1.7 –0.49
0.08 0.91 0.33 0.88
–0.05 0.01
–0.02 0.36 0.26
–0.26 0.02
–0.36
1.4 0.88
–0.50 0.19
–0.35 0.07 0.07
–0.03 0.26 0.15 0.18 0.22 0.00 0.25
1.7 0.27 0.46
–0.30 –0.51 –0.09 0.03 0.15 0.45 0.40 0.30 0.05 0.00 0.46
North Carolina
Annual percent change Contributions to annual percent change
Total GDP by state........................................................................... Natural resources and mining ............................................................... Construction .......................................................................................... Durable-goods manufacturing ............................................................... Nondurable-goods manufacturing ......................................................... Trade ..................................................................................................... Transportation and utilities..................................................................... Information ............................................................................................ Financial activities ................................................................................. Professional and business services ...................................................... Education and health services .............................................................. Leisure and hospitality........................................................................... Other services, except government....................................................... Government...........................................................................................
2.9 –1.2 –2.4
5.1 0.1 4.1 1.2 7.1 4.5 4.5 4.4 3.2 0.2 2.0
4.8 0.8 0.8 9.3 0.4 7.8
–1.9 11.1
7.5 7.0 4.4 2.2 1.1 2.3
5.5 –1.8 –0.7 22.1
2.8 4.1 0.8 2.1 8.7 4.8 4.5 5.8 0.0 2.9
0.7 –13.4
–9.2 7.9 1.6 4.3 0.6 7.6
–6.9 4.5 3.2 3.5 1.6 3.4
0.1 –8.4 –8.9 –1.3 –5.4 –1.5 –1.1
6.4 –1.0
7.2 5.6 2.4
–2.0 3.4
2.9 –0.02 –0.11
0.46 0.01 0.50 0.06 0.22 0.76 0.41 0.28 0.10 0.01 0.26
4.8 0.01 0.04 0.65 0.05 0.93
–0.08 0.34 1.50 0.64 0.31 0.07 0.02 0.30
5.5 –0.02 –0.03
1.56 0.35 0.49 0.03 0.07 1.78 0.45 0.31 0.17 0.00 0.37
0.7 –0.18 –0.46 0.61 0.19 0.51 0.03 0.21
–1.46 0.43 0.22 0.11 0.03 0.44
0.1 –0.11 –0.41 –0.11 –0.66 –0.18 –0.05 0.19
–0.19 0.71 0.40 0.08
–0.04 0.46
South Carolina
Annual percent change Contributions to annual percent change
Total GDP by state........................................................................... Natural resources and mining ............................................................... Construction .......................................................................................... Durable-goods manufacturing ............................................................... Nondurable-goods manufacturing ......................................................... Trade ..................................................................................................... Transportation and utilities..................................................................... Information ............................................................................................ Financial activities ................................................................................. Professional and business services ...................................................... Education and health services .............................................................. Leisure and hospitality........................................................................... Other services, except government....................................................... Government...........................................................................................
1.9 0.2
–3.2 4.0
–4.3 3.9 1.4 7.4 2.2 4.6 3.7 2.0 0.6 1.7
2.4 2.7
–1.3 5.1
–7.7 8.1
–1.4 11.4
1.0 5.3 5.0 2.4 2.1 1.0
2.0 –1.3
0.1 3.5
–1.4 3.6 1.0 7.5 2.5 1.2 4.3 3.1 0.1 0.7
0.9 –19.0 –11.4
3.8 –3.3
2.7 –0.6
4.2 1.9 4.8 1.5 1.6 0.3 2.0
0.6 –6.6
–10.8 –0.6 –3.4 –0.5 2.4 6.8
–0.2 4.7 4.8 2.3 0.9 2.7
1.9 0.00
–0.17 0.38
–0.41 0.54 0.07 0.20 0.32 0.39 0.22 0.09 0.01 0.27
2.4 0.03
–0.08 0.50
–0.60 1.09
–0.07 0.30 0.15 0.48 0.31 0.10 0.05 0.17
2.0 –0.02
0.01 0.34
–0.10 0.50 0.05 0.20 0.38 0.11 0.27 0.13 0.00 0.11
0.9 –0.22 –0.72 0.36
–0.22 0.37
–0.03 0.11 0.28 0.44 0.10 0.07 0.01 0.33
0.6 –0.07 –0.61 –0.06 –0.22 –0.07 0.13 0.18
–0.03 0.45 0.31 0.10 0.02 0.46
Tennessee
Annual percent change Contributions to annual percent change
Total GDP by state........................................................................... Natural resources and mining ............................................................... Construction .......................................................................................... Durable-goods manufacturing ............................................................... Nondurable-goods manufacturing ......................................................... Trade ..................................................................................................... Transportation and utilities..................................................................... Information ............................................................................................ Financial activities ................................................................................. Professional and business services ...................................................... Education and health services .............................................................. Leisure and hospitality........................................................................... Other services, except government....................................................... Government...........................................................................................
2.3 –1.2 –2.8
3.6 –0.6
3.6 2.1 8.2 2.2 4.3 3.2 2.0 0.1 0.5
1.9 15.7 –0.8
3.7 –9.0
6.6 3.0
10.6 –1.3
4.3 3.1 2.6 0.4
–0.6
2.7 –4.1 –0.6
5.1 1.0 3.5 1.7 9.4 1.3 3.3 4.2 4.3 1.0 0.8
1.3 –21.7 –10.3
–0.1 0.0 3.4
–0.2 7.8 2.9 4.2 1.8 2.7
–0.3 1.0
0.5 –9.0 –6.3 –2.0 –1.8 –1.2 –5.9
3.6 1.4 6.5 3.9
–0.2 0.3 2.3
2.3 –0.01 –0.12
0.38 –0.05
0.56 0.11 0.25 0.34 0.43 0.29 0.08 0.00 0.06
1.9 0.14
–0.03 0.39
–0.66 0.97 0.17 0.32
–0.21 0.44 0.29 0.11 0.01
–0.07
2.7 –0.04 –0.03
0.54 0.07 0.54 0.10 0.29 0.19 0.34 0.40 0.18 0.03 0.09
1.3 –0.21 –0.47 –0.01 0.00 0.52
–0.01 0.24 0.44 0.45 0.17 0.12
–0.01 0.11
0.5 –0.07 –0.26 –0.20 –0.11 –0.19 –0.34 0.12 0.21 0.72 0.38
–0.01 0.01 0.25
* Advance statistics
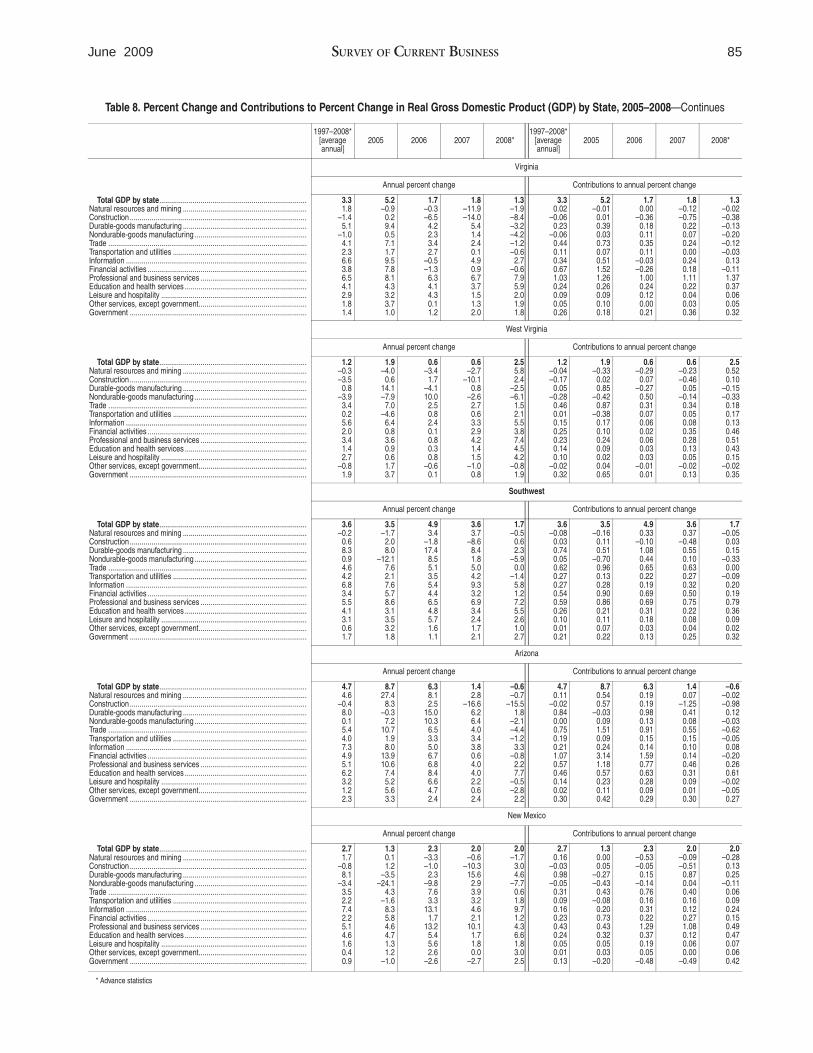
85 June 2009 SURVEY OF CURRENT BUSINESS
Table 8. Percent Change and Contributions to Percent Change in Real Gross Domestic Product (GDP) by State, 2005–2008—Continues
1997–2008* [average annual]
2005 2006 2007 2008* 1997–2008*
[average annual]
2005 2006 2007 2008*
Total GDP by state........................................................................... Natural resources and mining ............................................................... Construction .......................................................................................... Durable-goods manufacturing ............................................................... Nondurable-goods manufacturing ......................................................... Trade ..................................................................................................... Transportation and utilities .................................................................... Information ............................................................................................ Financial activities ................................................................................. Professional and business services ...................................................... Education and health services .............................................................. Leisure and hospitality .......................................................................... Other services, except government....................................................... Government ..........................................................................................
Virginia
Annual percent change Contributions to annual percent change
3.3 1.8
–1.4 5.1
–1.0 4.1 2.3 6.6 3.8 6.5 4.1 2.9 1.8 1.4
5.2 –0.9
0.2 9.4 0.5 7.1 1.7 9.5 7.8 8.1 4.3 3.2 3.7 1.0
1.7 –0.3 –6.5
4.2 2.3 3.4 2.7
–0.5 –1.3
6.3 4.1 4.3 0.1 1.2
1.8 –11.9 –14.0
5.4 1.4 2.4 0.1 4.9 0.9 6.7 3.7 1.5 1.3 2.0
1.3 –1.9 –8.4 –3.2 –4.2 –1.2 –0.6 2.7
–0.6 7.9 5.9 2.0 1.9 1.8
3.3 0.02
–0.06 0.23
–0.06 0.44 0.11 0.34 0.67 1.03 0.24 0.09 0.05 0.26
5.2 –0.01
0.01 0.39 0.03 0.73 0.07 0.51 1.52 1.26 0.26 0.09 0.10 0.18
1.7 0.00
–0.36 0.18 0.11 0.35 0.11
–0.03 –0.26
1.00 0.24 0.12 0.00 0.21
1.8 –0.12 –0.75 0.22 0.07 0.24 0.00 0.24 0.18 1.11 0.22 0.04 0.03 0.36
1.3 –0.02 –0.38 –0.13 –0.20 –0.12 –0.03 0.13
–0.11 1.37 0.37 0.06 0.05 0.32
West Virginia
Annual percent change Contributions to annual percent change
Total GDP by state........................................................................... Natural resources and mining ............................................................... Construction .......................................................................................... Durable-goods manufacturing ............................................................... Nondurable-goods manufacturing ......................................................... Trade ..................................................................................................... Transportation and utilities .................................................................... Information ............................................................................................ Financial activities ................................................................................. Professional and business services ...................................................... Education and health services .............................................................. Leisure and hospitality .......................................................................... Other services, except government....................................................... Government ..........................................................................................
1.2 –0.3 –3.5
0.8 –3.9
3.4 0.2 5.6 2.0 3.4 1.4 2.7
–0.8 1.9
1.9 –4.0
0.6 14.1 –7.9
7.0 –4.6
6.4 0.8 3.6 0.9 0.6 1.7 3.7
0.6 –3.4
1.7 –4.1 10.0
2.5 0.8 2.4 0.1 0.8 0.3 0.8
–0.6 0.1
0.6 –2.7
–10.1 0.8
–2.6 2.7 0.6 3.3 2.9 4.2 1.4 1.5
–1.0 0.8
2.5 5.8 2.4
–2.5 –6.1
1.5 2.1 5.5 3.8 7.4 4.5 4.2
–0.8 1.9
1.2 –0.04 –0.17
0.05 –0.28
0.46 0.01 0.15 0.25 0.23 0.14 0.10
–0.02 0.32
1.9 –0.33
0.02 0.85
–0.42 0.87
–0.38 0.17 0.10 0.24 0.09 0.02 0.04 0.65
0.6 –0.29
0.07 –0.27
0.50 0.31 0.07 0.06 0.02 0.06 0.03 0.03
–0.01 0.01
0.6 –0.23 –0.46 0.05
–0.14 0.34 0.05 0.08 0.35 0.28 0.13 0.05
–0.02 0.13
2.5 0.52 0.10
–0.15 –0.33 0.18 0.17 0.13 0.46 0.51 0.43 0.15
–0.02 0.35
Southwest
Annual percent change Contributions to annual percent change
Total GDP by state........................................................................... Natural resources and mining ............................................................... Construction .......................................................................................... Durable-goods manufacturing ............................................................... Nondurable-goods manufacturing ......................................................... Trade ..................................................................................................... Transportation and utilities .................................................................... Information ............................................................................................ Financial activities ................................................................................. Professional and business services ...................................................... Education and health services .............................................................. Leisure and hospitality .......................................................................... Other services, except government....................................................... Government ..........................................................................................
3.6 –0.2
0.6 8.3 0.9 4.6 4.2 6.8 3.4 5.5 4.1 3.1 0.6 1.7
3.5 –1.7
2.0 8.0
–12.1 7.6 2.1 7.6 5.7 8.6 3.1 3.5 3.2 1.8
4.9 3.4
–1.8 17.4
8.5 5.1 3.5 5.4 4.4 6.5 4.8 5.7 1.6 1.1
3.6 3.7
–8.6 8.4 1.8 5.0 4.2 9.3 3.2 6.9 3.4 2.4 1.7 2.1
1.7 –0.5
0.6 2.3
–5.9 0.0
–1.4 5.8 1.2 7.2 5.5 2.6 1.0 2.7
3.6 –0.08
0.03 0.74 0.05 0.62 0.27 0.27 0.54 0.59 0.26 0.10 0.01 0.21
3.5 –0.16
0.11 0.51
–0.70 0.96 0.13 0.28 0.90 0.86 0.21 0.11 0.07 0.22
4.9 0.33
–0.10 1.08 0.44 0.65 0.22 0.19 0.69 0.69 0.31 0.18 0.03 0.13
3.6 0.37
–0.48 0.55 0.10 0.63 0.27 0.32 0.50 0.75 0.22 0.08 0.04 0.25
1.7 –0.05 0.03 0.15
–0.33 0.00
–0.09 0.20 0.19 0.79 0.36 0.09 0.02 0.32
Arizona
Annual percent change Contributions to annual percent change
Total GDP by state........................................................................... Natural resources and mining ............................................................... Construction .......................................................................................... Durable-goods manufacturing ............................................................... Nondurable-goods manufacturing ......................................................... Trade ..................................................................................................... Transportation and utilities .................................................................... Information ............................................................................................ Financial activities ................................................................................. Professional and business services ...................................................... Education and health services .............................................................. Leisure and hospitality .......................................................................... Other services, except government....................................................... Government ..........................................................................................
4.7 4.6
–0.4 8.0 0.1 5.4 4.0 7.3 4.9 5.1 6.2 3.2 1.2 2.3
8.7 27.4
8.3 –0.3
7.2 10.7 1.9 8.0
13.9 10.6
7.4 5.2 5.6 3.3
6.3 8.1 2.5
15.0 10.3
6.5 3.3 5.0 6.7 6.8 8.4 6.6 4.7 2.4
1.4 2.8
–16.6 6.2 6.4 4.0 3.4 3.8 0.6 4.0 4.0 2.2 0.6 2.4
–0.6 –0.7
–15.5 1.8
–2.1 –4.4 –1.2
3.3 –0.8
2.2 7.7
–0.5 –2.8
2.2
4.7 0.11
–0.02 0.84 0.00 0.75 0.19 0.21 1.07 0.57 0.46 0.14 0.02 0.30
8.7 0.54 0.57
–0.03 0.09 1.51 0.09 0.24 3.14 1.18 0.57 0.23 0.11 0.42
6.3 0.19 0.19 0.98 0.13 0.91 0.15 0.14 1.59 0.77 0.63 0.28 0.09 0.29
1.4 0.07
–1.25 0.41 0.08 0.55 0.15 0.10 0.14 0.46 0.31 0.09 0.01 0.30
–0.6 –0.02 –0.98 0.12
–0.03 –0.62 –0.05 0.08
–0.20 0.26 0.61
–0.02 –0.05 0.27
New Mexico
Annual percent change Contributions to annual percent change
Total GDP by state........................................................................... Natural resources and mining ............................................................... Construction .......................................................................................... Durable-goods manufacturing ............................................................... Nondurable-goods manufacturing ......................................................... Trade ..................................................................................................... Transportation and utilities .................................................................... Information ............................................................................................ Financial activities ................................................................................. Professional and business services ...................................................... Education and health services .............................................................. Leisure and hospitality .......................................................................... Other services, except government....................................................... Government ..........................................................................................
2.7 1.7
–0.8 8.1
–3.4 3.5 2.2 7.4 2.2 5.1 4.6 1.6 0.4 0.9
1.3 0.1 1.2
–3.5 –24.1
4.3 –1.6
8.3 5.8 4.6 4.7 1.3 1.2
–1.0
2.3 –3.3 –1.0
2.3 –9.8
7.6 3.3
13.1 1.7
13.2 5.4 5.6 2.6
–2.6
2.0 –0.6
–10.3 15.6
2.9 3.9 3.2 4.6 2.1
10.1 1.7 1.8 0.0
–2.7
2.0 –1.7
3.0 4.6
–7.7 0.6 1.8 9.7 1.2 4.3 6.6 1.8 3.0 2.5
2.7 0.16
–0.03 0.98
–0.05 0.31 0.09 0.16 0.23 0.43 0.24 0.05 0.01 0.13
1.3 0.00 0.05
–0.27 –0.43
0.43 –0.08
0.20 0.73 0.43 0.32 0.05 0.03
–0.20
2.3 –0.53 –0.05
0.15 –0.14
0.76 0.16 0.31 0.22 1.29 0.37 0.19 0.05
–0.48
2.0 –0.09 –0.51 0.87 0.04 0.40 0.16 0.12 0.27 1.08 0.12 0.06 0.00
–0.49
2.0 –0.28 0.13 0.25
–0.11 0.06 0.09 0.24 0.15 0.49 0.47 0.07 0.06 0.42
* Advance statistics

86 Gross Domestic Product by State June 2009
Table 8. Percent Change and Contributions to Percent Change in Real Gross Domestic Product (GDP) by State, 2005–2008—Continues
1997–2008* [average annual]
2005 2006 2007 2008* 1997–2008*
[average annual]
2005 2006 2007 2008*
Total GDP by state........................................................................... Natural resources and mining ............................................................... Construction .......................................................................................... Durable-goods manufacturing ............................................................... Nondurable-goods manufacturing ......................................................... Trade ..................................................................................................... Transportation and utilities..................................................................... Information ............................................................................................ Financial activities ................................................................................. Professional and business services ...................................................... Education and health services .............................................................. Leisure and hospitality........................................................................... Other services, except government....................................................... Government...........................................................................................
Oklahoma
Annual percent change Contributions to annual percent change
2.3 2.1
–0.5 2.8
–0.4 4.0 3.3 6.3 1.9 3.8 3.1 3.1
–0.4 1.1
1.9 –0.7 –1.1
7.6 –5.7
5.6 0.1 9.7
–0.9 4.0 2.7 2.6
–0.6 2.2
3.0 –1.1 –4.4 11.1 13.3
5.2 2.3
–0.1 1.4 4.5 4.0 8.3 0.0 1.7
1.9 –3.0 –8.2
4.4 –4.3
4.9 7.0 5.7 2.3 4.6 3.5 4.6 3.4 1.6
2.7 1.6 8.8 2.4
–1.4 2.9
–0.8 8.8 0.9 7.9 5.1 5.1 1.6 1.1
2.3 0.15
–0.02 0.23
–0.02 0.51 0.21 0.22 0.25 0.33 0.22 0.09
–0.01 0.19
1.9 –0.10 –0.04
0.49 –0.23
0.67 0.01 0.32
–0.13 0.34 0.19 0.07
–0.01 0.36
3.0 –0.16 –0.18
0.71 0.51 0.62 0.13 0.00 0.18 0.38 0.29 0.23 0.00 0.27
1.9 –0.45 –0.32 0.29
–0.19 0.57 0.41 0.17 0.29 0.40 0.25 0.13 0.07 0.25
2.7 0.23 0.31 0.16
–0.06 0.34
–0.05 0.26 0.11 0.69 0.37 0.15 0.04 0.17
Texas
Annual percent change Contributions to annual percent change
Total GDP by state........................................................................... Natural resources and mining ............................................................... Construction .......................................................................................... Durable-goods manufacturing ............................................................... Nondurable-goods manufacturing ......................................................... Trade ..................................................................................................... Transportation and utilities..................................................................... Information ............................................................................................ Financial activities ................................................................................. Professional and business services ...................................................... Education and health services .............................................................. Leisure and hospitality........................................................................... Other services, except government....................................................... Government...........................................................................................
3.6 –1.0
1.0 9.2 1.1 4.6 4.5 6.8 3.2 5.8 3.7 3.1 0.6 1.7
2.8 –3.4
0.7 11.3
–12.9 7.3 2.5 7.3 3.8 8.8 2.0 3.2 3.4 1.7
4.9 4.7
–2.9 19.8
8.3 4.6 3.7 5.7 4.0 6.2 3.9 5.1 1.1 1.1
4.4 5.3
–6.1 9.0 2.1 5.3 4.0
10.7 4.3 7.7 3.4 2.3 1.9 2.7
2.0 –0.7
4.2 2.3
–6.3 0.7
–1.6 5.7 2.0 8.5 4.8 3.4 1.5 3.2
3.6 –0.18
0.05 0.75 0.08 0.63 0.31 0.30 0.49 0.63 0.23 0.10 0.01 0.20
2.8 –0.33
0.03 0.68
–0.93 0.92 0.17 0.29 0.57 0.89 0.13 0.10 0.07 0.19
4.9 0.48
–0.16 1.22 0.55 0.59 0.25 0.22 0.59 0.66 0.24 0.16 0.02 0.12
4.4 0.56
–0.32 0.59 0.15 0.67 0.28 0.39 0.62 0.83 0.21 0.07 0.04 0.29
2.0 –0.08 0.20 0.15
–0.45 0.09
–0.11 0.21 0.28 0.93 0.30 0.10 0.03 0.34
Rocky Mountain
Annual percent change Contributions to annual percent change
Total GDP by state........................................................................... Natural resources and mining ............................................................... Construction .......................................................................................... Durable-goods manufacturing ............................................................... Nondurable-goods manufacturing ......................................................... Trade ..................................................................................................... Transportation and utilities..................................................................... Information ............................................................................................ Financial activities ................................................................................. Professional and business services ...................................................... Education and health services .............................................................. Leisure and hospitality........................................................................... Other services, except government....................................................... Government...........................................................................................
3.5 4.0
–1.5 7.5
–0.3 4.6 2.3 8.5 3.5 5.0 3.9 2.9 1.2 1.5
5.1 10.0
1.5 12.6 –2.4
7.3 1.4 9.0 4.7 7.5 3.9 2.5 1.3 1.7
3.7 0.0
–0.9 6.4 4.7 5.5 5.0 4.8 4.1 6.0 4.4 6.1 1.4 0.6
2.9 –5.1 –8.0
7.9 3.6 6.4 1.4 5.9 4.6 5.9 2.9 3.3 1.0 1.6
2.2 6.3
–6.6 0.7 0.4 0.2
–2.6 7.0 0.1 6.4 6.0 2.5 2.3 3.6
3.5 0.24
–0.08 0.46
–0.01 0.57 0.12 0.47 0.61 0.57 0.25 0.12 0.03 0.19
5.1 0.65 0.09 0.65
–0.06 0.87 0.07 0.54 0.87 0.85 0.26 0.10 0.03 0.23
3.7 0.00
–0.06 0.33 0.12 0.65 0.25 0.28 0.74 0.70 0.29 0.24 0.04 0.08
2.9 –0.38 –0.49 0.40 0.09 0.76 0.07 0.33 0.83 0.70 0.19 0.13 0.02 0.20
2.2 0.47
–0.37 0.04 0.01 0.03
–0.13 0.39 0.03 0.77 0.40 0.10 0.06 0.46
Colorado
Annual percent change Contributions to annual percent change
Total GDP by state........................................................................... Natural resources and mining ............................................................... Construction .......................................................................................... Durable-goods manufacturing ............................................................... Nondurable-goods manufacturing ......................................................... Trade ..................................................................................................... Transportation and utilities..................................................................... Information ............................................................................................ Financial activities ................................................................................. Professional and business services ...................................................... Education and health services .............................................................. Leisure and hospitality........................................................................... Other services, except government....................................................... Government...........................................................................................
3.6 5.9
–1.3 6.2
–0.4 4.3 2.7 8.7 3.1 5.0 3.9 2.6 1.3 1.3
4.3 13.5 –1.2
6.7 5.9 6.6 0.8 6.9 2.0 7.3 3.4 2.2 1.6 1.8
2.7 –4.8 –6.2 13.6
3.2 3.9 6.9 6.3 2.2 5.4 2.8 4.1 0.2
–0.3
2.0 –13.5 –12.0
4.7 5.1 5.7
–1.7 5.2 3.6 6.5 3.3 3.1 0.6 1.7
2.9 10.6 –3.9
0.9 0.9 0.3
–1.5 7.2 0.0 6.0 5.9 2.2 2.0 4.4
3.6 0.23
–0.07 0.33
–0.01 0.51 0.11 0.70 0.57 0.67 0.24 0.11 0.03 0.16
4.3 0.64
–0.08 0.27 0.14 0.76 0.03 0.60 0.39 0.96 0.22 0.10 0.04 0.22
2.7 –0.28 –0.39
0.53 0.08 0.46 0.26 0.52 0.43 0.74 0.18 0.18 0.01
–0.04
2.0 –0.75 –0.73 0.19 0.13 0.66
–0.07 0.42 0.68 0.91 0.21 0.14 0.01 0.21
2.9 0.55
–0.21 0.04 0.02 0.04
–0.06 0.59 0.01 0.87 0.38 0.10 0.05 0.53
Idaho
Annual percent change Contributions to annual percent change
Total GDP by state........................................................................... Natural resources and mining ............................................................... Construction .......................................................................................... Durable-goods manufacturing ............................................................... Nondurable-goods manufacturing ......................................................... Trade ..................................................................................................... Transportation and utilities..................................................................... Information ............................................................................................ Financial activities ................................................................................. Professional and business services ...................................................... Education and health services .............................................................. Leisure and hospitality........................................................................... Other services, except government....................................................... Government...........................................................................................
4.3 4.6
–3.4 15.6 –0.2
5.0 2.1 9.8 4.3 4.6 4.6 2.8 0.2 1.6
8.3 17.7
4.5 28.5 –0.4
9.9 –0.9 13.4
9.8 5.3 3.6 1.8 3.6 1.2
2.0 –8.4
3.9 –20.5
8.8 6.3 4.1 4.9 6.9 7.7 6.9 6.9 3.4 0.7
4.1 15.0 –6.8 12.0
9.5 5.4 1.5 4.5 5.7 0.9 4.1 6.1
–0.1 0.2
0.0 –1.2
–16.8 0.8 1.9
–1.7 0.8
10.0 –0.9
2.8 5.8 0.7 0.0 2.6
4.3 0.29
–0.21 1.39
–0.01 0.68 0.11 0.20 0.66 0.50 0.32 0.10 0.00 0.22
8.3 1.01 0.27 2.69
–0.01 1.35
–0.04 0.30 1.55 0.63 0.27 0.06 0.07 0.18
2.0 –0.49
0.25 –2.08
0.26 0.87 0.20 0.11 1.12 0.90 0.49 0.23 0.07 0.09
4.1 0.86
–0.47 0.84 0.29 0.76 0.07 0.10 0.95 0.11 0.31 0.21 0.00 0.03
0.0 –0.12 –1.58 0.08 0.09
–0.36 0.06 0.32
–0.23 0.50 0.66 0.04 0.00 0.53
* Advance statistics

87 June 2009 SURVEY OF CURRENT BUSINESS
Table 8. Percent Change and Contributions to Percent Change in Real Gross Domestic Product (GDP) by State, 2005–2008—Continues
1997–2008* [average annual]
2005 2006 2007 2008* 1997–2008*
[average annual]
2005 2006 2007 2008*
Total GDP by state........................................................................... Natural resources and mining ............................................................... Construction .......................................................................................... Durable-goods manufacturing ............................................................... Nondurable-goods manufacturing ......................................................... Trade ..................................................................................................... Transportation and utilities .................................................................... Information ............................................................................................ Financial activities ................................................................................. Professional and business services ...................................................... Education and health services .............................................................. Leisure and hospitality .......................................................................... Other services, except government....................................................... Government ..........................................................................................
Montana
Annual percent change Contributions to annual percent change
2.8 4.4
–0.4 0.5
–3.0 4.1 1.6 7.7 3.5 5.7 3.4 2.8 0.8 1.1
4.9 15.4
4.7 2.5
–25.5 5.3 1.9
10.3 9.8 8.5 3.0 2.2 6.0 0.4
2.5 –6.5 –0.6 –3.6
0.4 4.9 3.7 5.4 4.5 7.3 4.7 6.3
–0.2 1.2
3.7 13.0 –4.5 10.7 –2.8
5.9 0.6 2.3 3.4 9.6 1.5 5.5 1.2 0.6
1.8 6.9
–10.2 –1.9 –3.8
1.5 –2.1
5.5 0.2 8.5 6.2 3.2 1.7 1.5
2.8 0.41
–0.02 0.02
–0.06 0.54 0.15 0.21 0.53 0.40 0.30 0.13 0.02 0.18
4.9 1.32 0.30 0.07
–0.58 0.67 0.16 0.29 1.52 0.57 0.29 0.10 0.15 0.06
2.5 –0.61 –0.04 –0.10
0.01 0.61 0.31 0.15 0.72 0.51 0.43 0.29
–0.01 0.20
3.7 1.18
–0.31 0.26
–0.05 0.74 0.05 0.06 0.55 0.69 0.14 0.26 0.03 0.09
1.8 0.73
–0.65 –0.05 –0.07 0.18
–0.18 0.14 0.03 0.64 0.57 0.15 0.04 0.24
Utah
Annual percent change Contributions to annual percent change
Total GDP by state........................................................................... Natural resources and mining ............................................................... Construction .......................................................................................... Durable-goods manufacturing ............................................................... Nondurable-goods manufacturing ......................................................... Trade ..................................................................................................... Transportation and utilities .................................................................... Information ............................................................................................ Financial activities ................................................................................. Professional and business services ...................................................... Education and health services .............................................................. Leisure and hospitality .......................................................................... Other services, except government....................................................... Government ..........................................................................................
3.5 4.2
–2.3 6.2 1.1 4.9 1.7 7.5 4.1 4.8 3.6 3.7 1.5 1.6
6.7 22.3
5.2 11.6 –8.9
7.5 4.3
19.1 7.9 9.1 5.5 3.5
–2.0 2.3
6.3 9.7 6.7
17.2 7.0 7.8 1.4
–2.9 6.7 5.9 6.4 8.2 1.6 2.0
4.6 2.4
–4.3 9.6 0.3 8.3 6.6
11.1 6.0 5.4 1.6 3.6 0.7 1.4
1.4 2.3
–11.6 0.8 0.4
–0.2 –7.0 5.8 0.3 8.6 5.9 3.3 4.9 3.0
3.5 0.12
–0.13 0.56 0.04 0.63 0.09 0.27 0.77 0.52 0.23 0.12 0.05 0.22
6.7 0.64 0.28 0.87
–0.32 0.94 0.22 0.71 1.58 0.98 0.37 0.12
–0.07 0.34
6.3 0.35 0.39 1.34 0.22 0.97 0.07
–0.11 1.35 0.65 0.42 0.28 0.05 0.28
4.6 0.09
–0.26 0.81 0.01 1.02 0.32 0.37 1.19 0.59 0.11 0.13 0.02 0.20
1.4 0.09
–0.65 0.07 0.01
–0.02 –0.36 0.20 0.05 0.95 0.37 0.11 0.14 0.41
Wyoming
Annual percent change Contributions to annual percent change
Total GDP by state........................................................................... Natural resources and mining ............................................................... Construction .......................................................................................... Durable-goods manufacturing ............................................................... Nondurable-goods manufacturing ......................................................... Trade ..................................................................................................... Transportation and utilities .................................................................... Information ............................................................................................ Financial activities ................................................................................. Professional and business services ...................................................... Education and health services .............................................................. Leisure and hospitality .......................................................................... Other services, except government....................................................... Government ..........................................................................................
2.8 1.8 2.7 1.4
–3.4 5.9 2.5 7.5 3.6 5.5 5.2 3.7 2.0 2.2
1.5 –1.9
3.5 3.5
–14.6 10.1 –0.4
7.8 4.3 6.6 4.2 4.6 5.5 1.0
7.0 7.8 9.9 2.6 2.1 8.9 7.1 6.7 6.0 8.6 4.8
17.0 13.8
1.3
0.7 –8.3
4.2 6.2
–0.4 7.6 3.5 7.9 8.6
10.5 4.7
–3.1 9.1 4.7
4.4 5.2
12.7 –0.1 –4.0
4.6 –1.7
4.7 3.6 8.9 8.2 4.5
–3.0 4.4
2.8 0.47 0.15 0.02
–0.10 0.58 0.27 0.12 0.38 0.24 0.21 0.14 0.03 0.30
1.5 –0.62
0.18 0.04
–0.37 0.92
–0.04 0.12 0.44 0.27 0.19 0.17 0.09 0.13
7.0 2.58 0.54 0.03 0.05 0.81 0.73 0.10 0.60 0.36 0.21 0.63 0.22 0.18
0.7 –2.84 0.24 0.07
–0.01 0.68 0.36 0.11 0.82 0.43 0.19
–0.12 0.15 0.59
4.4 1.71 0.74 0.00
–0.09 0.41
–0.19 0.07 0.36 0.39 0.34 0.17
–0.05 0.57
Far West
Annual percent change Contributions to annual percent change
Total GDP by state........................................................................... Natural resources and mining ............................................................... Construction .......................................................................................... Durable-goods manufacturing ............................................................... Nondurable-goods manufacturing ......................................................... Trade ..................................................................................................... Transportation and utilities .................................................................... Information ............................................................................................ Financial activities ................................................................................. Professional and business services ...................................................... Education and health services .............................................................. Leisure and hospitality .......................................................................... Other services, except government....................................................... Government ..........................................................................................
3.5 0.5
–1.4 9.3 0.9 4.2 2.4 7.6 3.7 3.3 3.8 2.9 0.6 1.7
4.5 5.0 2.1
12.3 –0.2
7.4 0.3 6.4 6.0 4.4 3.1 2.0 2.1 0.1
3.4 6.5
–3.3 11.6
3.6 5.0 2.5 2.3 2.5 4.5 3.5 4.3
–0.1 1.6
2.2 0.7
–12.1 8.9 0.2 3.0 1.0 9.9 1.3 4.6 2.5 1.2 0.1 2.2
0.6 –5.3 –9.6
2.2 –5.2 –2.1 –1.7 6.6
–0.7 5.5 5.4 1.4 0.8 2.1
3.5 –0.01 –0.06
0.73 0.04 0.53 0.11 0.41 0.76 0.42 0.25 0.13 0.02 0.22
4.5 0.13 0.10 0.74
–0.01 0.92 0.01 0.37 1.34 0.52 0.21 0.09 0.05 0.01
3.4 0.17
–0.17 0.70 0.13 0.62 0.11 0.13 0.57 0.55 0.23 0.20 0.00 0.19
2.2 0.02
–0.64 0.54 0.01 0.37 0.04 0.52 0.29 0.56 0.17 0.06 0.00 0.26
0.6 –0.16 –0.44 0.13
–0.20 –0.26 –0.07 0.36
–0.16 0.69 0.37 0.07 0.02 0.26
Alaska
Annual percent change Contributions to annual percent change
Total GDP by state........................................................................... Natural resources and mining ............................................................... Construction .......................................................................................... Durable-goods manufacturing ............................................................... Nondurable-goods manufacturing ......................................................... Trade ..................................................................................................... Transportation and utilities .................................................................... Information ............................................................................................ Financial activities ................................................................................. Professional and business services ...................................................... Education and health services .............................................................. Leisure and hospitality .......................................................................... Other services, except government....................................................... Government ..........................................................................................
0.6 –4.8 –1.9
2.2 –2.4
3.5 4.4 6.2 1.9 3.7 4.9 2.5 0.0 0.6
1.3 –3.6 –0.1
8.6 –20.1
7.3 6.0
11.7 3.2 8.4 2.0 0.8 0.2 2.2
4.4 12.3
–10.0 –3.2
4.6 3.6
–0.6 4.8
–0.6 3.1 3.9 3.0
–0.2 3.0
–0.2 –2.7
–12.2 14.4 –0.3
3.8 3.0 2.6 3.5 6.2
–0.9 0.9
–0.6 –0.4
–2.0 –10.1
0.4 0.7
–10.8 0.7
–0.8 7.8 2.8
10.0 3.4 1.8 1.0 2.4
0.6 –5.37 –0.29
0.03 –0.17
0.90 1.91 0.58 0.71 0.76 0.85 0.28 0.00 0.38
1.3 –1.00 –0.01
0.03 –0.44
0.48 0.64 0.27 0.35 0.43 0.12 0.03 0.00 0.40
4.4 3.62
–0.51 –0.01
0.08 0.24
–0.06 0.11
–0.06 0.17 0.22 0.09 0.00 0.55
–0.2 –0.86 –0.55 0.05
–0.01 0.24 0.31 0.05 0.35 0.32
–0.05 0.03
–0.01 –0.06
–2.0 –3.38 0.02 0.00
–0.20 0.04
–0.08 0.16 0.28 0.52 0.18 0.05 0.02 0.42
* Advance statistics

88 Gross Domestic Product by State June 2009
Table 8. Percent Change and Contributions to Percent Change in Real Gross Domestic Product (GDP) by State, 2005–2008—Table Ends
1997–2008* [average annual]
2005 2006 2007 2008* 1997–2008*
[average annual]
2005 2006 2007 2008*
Total GDP by state........................................................................... Natural resources and mining ............................................................... Construction .......................................................................................... Durable-goods manufacturing ............................................................... Nondurable-goods manufacturing ......................................................... Trade ..................................................................................................... Transportation and utilities..................................................................... Information ............................................................................................ Financial activities ................................................................................. Professional and business services ...................................................... Education and health services .............................................................. Leisure and hospitality........................................................................... Other services, except government....................................................... Government...........................................................................................
California
Annual percent change Contributions to annual percent change
3.6 0.8
–1.0 8.6 1.3 4.2 2.3 7.9 3.8 3.1 3.7 3.1 0.5 1.9
4.3 7.4 1.1
13.2 –1.5
7.3 –0.5
6.1 6.2 3.8 2.9 0.7 1.4 0.2
3.1 4.7
–4.5 10.0
5.3 5.1 2.5 2.2 2.1 4.8 3.1 3.6
–0.7 0.8
1.8 1.8
–14.6 6.8 0.0 2.5 0.5 8.8 0.7 4.2 2.3 1.4
–0.3 2.7
0.4 –4.8
–12.2 1.1
–5.4 –2.6 –2.0
7.3 –1.1
6.0 5.4 2.4 0.5 1.7
3.6 0.00
–0.04 0.67 0.06 0.53 0.10 0.45 0.83 0.44 0.24 0.12 0.01 0.22
4.3 0.16 0.06 0.73
–0.06 0.90
–0.02 0.37 1.44 0.49 0.20 0.03 0.03 0.03
3.1 0.10
–0.23 0.57 0.22 0.63 0.10 0.13 0.49 0.62 0.21 0.14
–0.02 0.09
1.8 0.04
–0.72 0.38 0.00 0.32 0.02 0.49 0.17 0.55 0.16 0.05
–0.01 0.30
0.4 –0.12 –0.52 0.06
–0.24 –0.32 –0.08 0.42
–0.25 0.81 0.37 0.10 0.01 0.20
Hawaii
Annual percent change Contributions to annual percent change
Total GDP by state........................................................................... Natural resources and mining ............................................................... Construction .......................................................................................... Durable-goods manufacturing ............................................................... Nondurable-goods manufacturing ......................................................... Trade ..................................................................................................... Transportation and utilities..................................................................... Information ............................................................................................ Financial activities ................................................................................. Professional and business services ...................................................... Education and health services .............................................................. Leisure and hospitality........................................................................... Other services, except government....................................................... Government...........................................................................................
1.9 –0.1
0.2 4.2
–4.2 3.9 1.9 3.2 2.5 2.8 2.1 1.3
–0.2 1.1
5.1 14.7 11.5 32.7
–16.3 8.5 7.3 6.7 8.5 0.8 4.8 3.2 4.7 1.5
3.8 1.1
–2.0 10.8 –3.2
3.4 8.7 9.5 6.2 3.2 2.9 4.6 3.3 2.0
1.5 –20.7
–5.4 7.2
–0.8 4.3 0.2 0.8 4.1 2.0 0.6 0.3
–0.6 1.5
0.7 –4.9 –2.4 –0.3 –5.7
0.8 –6.1 –2.3 –0.7
4.4 4.3
–2.1 –0.2
4.0
1.9 0.00 0.01 0.03
–0.06 0.43 0.11 0.08 0.53 0.25 0.16 0.13 0.00 0.25
5.1 0.12 0.63 0.16
–0.21 0.91 0.38 0.17 1.78 0.07 0.37 0.32 0.12 0.34
3.8 0.01
–0.12 0.07
–0.04 0.37 0.47 0.22 1.32 0.29 0.22 0.45 0.08 0.46
1.5 –0.17 –0.33 0.05
–0.01 0.44 0.01 0.02 0.89 0.17 0.05 0.03
–0.02 0.33
0.7 –0.03 –0.14 0.00
–0.06 0.08
–0.34 –0.05 –0.15 0.38 0.32
–0.20 –0.01 0.92
Nevada
Annual percent change Contributions to annual percent change
Total GDP by state........................................................................... Natural resources and mining ............................................................... Construction .......................................................................................... Durable-goods manufacturing ............................................................... Nondurable-goods manufacturing ......................................................... Trade ..................................................................................................... Transportation and utilities..................................................................... Information ............................................................................................ Financial activities ................................................................................. Professional and business services ...................................................... Education and health services .............................................................. Leisure and hospitality........................................................................... Other services, except government....................................................... Government...........................................................................................
4.4 2.0
–1.7 9.9 4.2 6.5 3.8 6.8 6.4 5.7 5.8 2.9 2.0 3.2
8.2 7.1 9.0
13.7 –2.1 14.3 –0.3 23.9
9.6 11.4
7.0 5.4 9.7 0.3
4.0 17.9 –1.8 –0.2
7.1 6.1 3.4
–5.9 5.4 2.6 5.2 5.6 2.9 3.2
2.7 –7.7 –9.7
5.5 5.9 4.2 3.9 6.7 7.0 5.0 4.1 1.4
–0.3 3.7
–0.6 2.2
–5.6 0.0
–3.3 –1.4 3.4 0.7
–2.1 –0.7
4.5 –1.0 –0.6
3.3
4.4 0.05
–0.16 0.29 0.05 0.78 0.20 0.14 1.28 0.57 0.29 0.52 0.04 0.33
8.2 0.13 0.82 0.45
–0.03 1.65
–0.01 0.47 2.06 1.17 0.36 0.94 0.17 0.03
4.0 0.36
–0.18 –0.01
0.08 0.72 0.15
–0.12 1.16 0.28 0.26 0.95 0.05 0.31
2.7 –0.19 –0.95 0.17 0.07 0.49 0.17 0.12 1.49 0.52 0.21 0.24
–0.01 0.35
–0.6 0.05
–0.48 0.00
–0.04 –0.16 0.15 0.01
–0.46 –0.08 0.23
–0.17 –0.01 0.32
Oregon
Annual percent change Contributions to annual percent change
Total GDP by state........................................................................... Natural resources and mining ............................................................... Construction .......................................................................................... Durable-goods manufacturing ............................................................... Nondurable-goods manufacturing ......................................................... Trade ..................................................................................................... Transportation and utilities..................................................................... Information ............................................................................................ Financial activities ................................................................................. Professional and business services ...................................................... Education and health services .............................................................. Leisure and hospitality........................................................................... Other services, except government....................................................... Government...........................................................................................
4.0 2.0
–5.0 16.7
0.6 2.8 1.5 7.9 2.4 2.0 4.1 2.4 0.8 1.1
2.8 5.9 1.8 2.4 2.0 5.7
–0.6 8.2 5.1 7.3 3.0 2.9 4.4
–6.3
7.9 0.4 1.1
38.9 2.4 3.9 2.3 5.4 2.0 3.5 4.7 4.0 1.1 3.3
3.7 –1.3 –8.1 14.5
3.3 2.7 0.2
13.5 1.4 3.2 2.6 3.1 0.8 0.9
1.6 –6.9 –8.5
7.5 –1.6 –2.3 –1.6
6.9 –1.0
5.6 5.4 1.0
–0.5 2.8
4.0 0.05
–0.23 2.58 0.02 0.31 0.06 0.21 0.37 0.16 0.27 0.07 0.02 0.12
2.8 0.17 0.08 0.35 0.06 0.70
–0.03 0.26 0.95 0.65 0.25 0.09 0.10
–0.85
7.9 0.01 0.05 5.27 0.07 0.49 0.10 0.17 0.40 0.33 0.39 0.13 0.03 0.42
3.7 –0.04 –0.39 2.27 0.10 0.34 0.01 0.40 0.26 0.30 0.22 0.10 0.02 0.11
1.6 –0.20 –0.37 1.17
–0.05 –0.28 –0.07 0.22
–0.19 0.53 0.45 0.03
–0.01 0.35
Washington
Annual percent change Contributions to annual percent change
Total GDP by state........................................................................... Natural resources and mining ............................................................... Construction .......................................................................................... Durable-goods manufacturing ............................................................... Nondurable-goods manufacturing ......................................................... Trade ..................................................................................................... Transportation and utilities..................................................................... Information ............................................................................................ Financial activities ................................................................................. Professional and business services ...................................................... Education and health services .............................................................. Leisure and hospitality........................................................................... Other services, except government....................................................... Government...........................................................................................
3.1 3.8
–1.0 5.3
–1.6 4.3 1.8 6.5 2.7 4.4 4.3 2.9 1.2 1.3
5.1 5.0 0.8
18.9 15.6
6.9 2.0 5.8 3.4 4.9 2.9 3.6 2.7 1.5
2.8 5.7 1.4
–3.3 –9.6
5.0 2.0 2.3 3.9 4.1 4.1 6.6 0.9 3.4
4.4 7.4
–3.6 12.9 –0.4
5.0 2.7
15.5 1.7 8.6 3.2
–0.5 2.0 0.8
2.0 0.2
–2.9 1.7
–5.1 –0.1 –1.3
4.3 2.2 4.5 6.4 1.8 3.3 2.8
3.1 0.09
–0.05 0.39
–0.05 0.58 0.07 0.52 0.53 0.45 0.29 0.10 0.03 0.19
5.1 0.11 0.04 1.29 0.43 0.92 0.08 0.45 0.68 0.51 0.21 0.13 0.06 0.22
2.8 0.12 0.07
–0.25 –0.31
0.67 0.08 0.17 0.77 0.42 0.29 0.23 0.02 0.48
4.4 0.17
–0.19 0.89
–0.01 0.68 0.11 1.12 0.35 0.91 0.24
–0.02 0.05 0.11
2.0 0.00
–0.14 0.12
–0.14 –0.01 –0.05 0.33 0.42 0.49 0.46 0.06 0.08 0.40
* Advance statistics
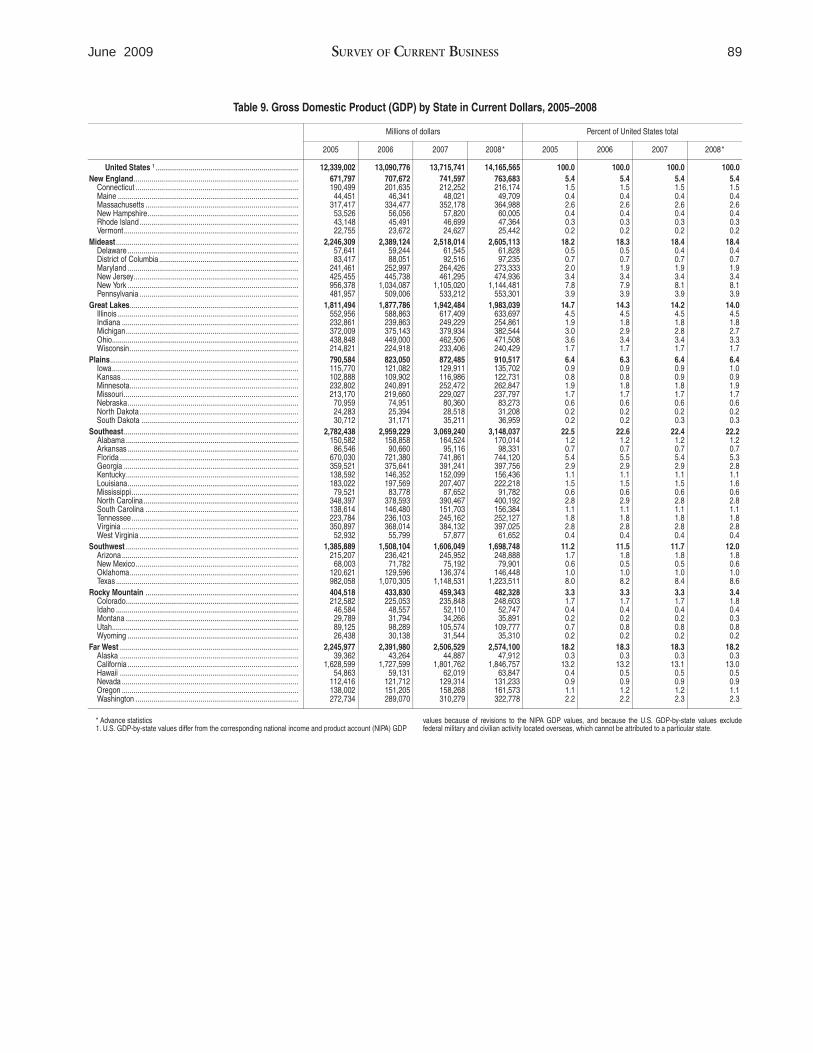
89 June 2009 SURVEY OF CURRENT BUSINESS
Table 9. Gross Domestic Product (GDP) by State in Current Dollars, 2005–2008
Millions of dollars Percent of United States total
2005 2006 2007 2008* 2005 2006 2007 2008*
United States 1 ......................................................................... 12,339,002 13,090,776 13,715,741 14,165,565 100.0 100.0 100.0 100.0
New England.................................................................................... 671,797 707,672 741,597 763,683 5.4 5.4 5.4 5.4 Connecticut ................................................................................... 190,499 201,635 212,252 216,174 1.5 1.5 1.5 1.5 Maine ............................................................................................ 44,451 46,341 48,021 49,709 0.4 0.4 0.4 0.4 Massachusetts .............................................................................. 317,417 334,477 352,178 364,988 2.6 2.6 2.6 2.6 New Hampshire............................................................................. 53,526 56,056 57,820 60,005 0.4 0.4 0.4 0.4 Rhode Island ................................................................................. 43,148 45,491 46,699 47,364 0.3 0.3 0.3 0.3 Vermont......................................................................................... 22,755 23,672 24,627 25,442 0.2 0.2 0.2 0.2
Mideast ............................................................................................. 2,246,309 2,389,124 2,518,014 2,605,113 18.2 18.3 18.4 18.4 Delaware ....................................................................................... 57,641 59,244 61,545 61,828 0.5 0.5 0.4 0.4 District of Columbia ....................................................................... 83,417 88,051 92,516 97,235 0.7 0.7 0.7 0.7 Maryland ....................................................................................... 241,461 252,997 264,426 273,333 2.0 1.9 1.9 1.9 New Jersey.................................................................................... 425,455 445,738 461,295 474,936 3.4 3.4 3.4 3.4 New York ....................................................................................... 956,378 1,034,087 1,105,020 1,144,481 7.8 7.9 8.1 8.1 Pennsylvania ................................................................................. 481,957 509,006 533,212 553,301 3.9 3.9 3.9 3.9
Great Lakes...................................................................................... 1,811,494 1,877,786 1,942,484 1,983,039 14.7 14.3 14.2 14.0 Illinois ............................................................................................ 552,956 588,863 617,409 633,697 4.5 4.5 4.5 4.5 Indiana .......................................................................................... 232,861 239,863 249,229 254,861 1.9 1.8 1.8 1.8 Michigan........................................................................................ 372,009 375,143 379,934 382,544 3.0 2.9 2.8 2.7 Ohio............................................................................................... 438,848 449,000 462,506 471,508 3.6 3.4 3.4 3.3 Wisconsin...................................................................................... 214,821 224,918 233,406 240,429 1.7 1.7 1.7 1.7
Plains................................................................................................ 790,584 823,050 872,485 910,517 6.4 6.3 6.4 6.4 Iowa............................................................................................... 115,770 121,082 129,911 135,702 0.9 0.9 0.9 1.0 Kansas .......................................................................................... 102,888 109,902 116,986 122,731 0.8 0.8 0.9 0.9 Minnesota...................................................................................... 232,802 240,891 252,472 262,847 1.9 1.8 1.8 1.9 Missouri......................................................................................... 213,170 219,660 229,027 237,797 1.7 1.7 1.7 1.7 Nebraska....................................................................................... 70,959 74,951 80,360 83,273 0.6 0.6 0.6 0.6 North Dakota................................................................................. 24,283 25,394 28,518 31,208 0.2 0.2 0.2 0.2 South Dakota ................................................................................ 30,712 31,171 35,211 36,959 0.2 0.2 0.3 0.3
Southeast......................................................................................... 2,782,438 2,959,229 3,069,240 3,148,037 22.5 22.6 22.4 22.2 Alabama ........................................................................................ 150,582 158,858 164,524 170,014 1.2 1.2 1.2 1.2 Arkansas ....................................................................................... 86,546 90,660 95,116 98,331 0.7 0.7 0.7 0.7 Florida ........................................................................................... 670,030 721,380 741,861 744,120 5.4 5.5 5.4 5.3 Georgia ......................................................................................... 359,521 375,641 391,241 397,756 2.9 2.9 2.9 2.8 Kentucky........................................................................................ 138,592 146,352 152,099 156,436 1.1 1.1 1.1 1.1 Louisiana....................................................................................... 183,022 197,569 207,407 222,218 1.5 1.5 1.5 1.6 Mississippi..................................................................................... 79,521 83,778 87,652 91,782 0.6 0.6 0.6 0.6 North Carolina............................................................................... 348,397 378,593 390,467 400,192 2.8 2.9 2.8 2.8 South Carolina .............................................................................. 138,614 146,480 151,703 156,384 1.1 1.1 1.1 1.1 Tennessee..................................................................................... 223,784 236,103 245,162 252,127 1.8 1.8 1.8 1.8 Virginia .......................................................................................... 350,897 368,014 384,132 397,025 2.8 2.8 2.8 2.8 West Virginia ................................................................................. 52,932 55,799 57,877 61,652 0.4 0.4 0.4 0.4
Southwest ........................................................................................ 1,385,889 1,508,104 1,606,049 1,698,748 11.2 11.5 11.7 12.0 Arizona .......................................................................................... 215,207 236,421 245,952 248,888 1.7 1.8 1.8 1.8 New Mexico................................................................................... 68,003 71,782 75,192 79,901 0.6 0.5 0.5 0.6 Oklahoma...................................................................................... 120,621 129,596 136,374 146,448 1.0 1.0 1.0 1.0 Texas ............................................................................................. 982,058 1,070,305 1,148,531 1,223,511 8.0 8.2 8.4 8.6
Rocky Mountain .............................................................................. 404,518 433,830 459,343 482,328 3.3 3.3 3.3 3.4 Colorado........................................................................................ 212,582 225,053 235,848 248,603 1.7 1.7 1.7 1.8 Idaho ............................................................................................. 46,584 48,557 52,110 52,747 0.4 0.4 0.4 0.4 Montana ........................................................................................ 29,789 31,794 34,266 35,891 0.2 0.2 0.2 0.3 Utah............................................................................................... 89,125 98,289 105,574 109,777 0.7 0.8 0.8 0.8 Wyoming ....................................................................................... 26,438 30,138 31,544 35,310 0.2 0.2 0.2 0.2
Far West ........................................................................................... 2,245,977 2,391,980 2,506,529 2,574,100 18.2 18.3 18.3 18.2 Alaska ........................................................................................... 39,362 43,264 44,887 47,912 0.3 0.3 0.3 0.3 California ....................................................................................... 1,628,599 1,727,599 1,801,762 1,846,757 13.2 13.2 13.1 13.0 Hawaii ........................................................................................... 54,863 59,131 62,019 63,847 0.4 0.5 0.5 0.5 Nevada .......................................................................................... 112,416 121,712 129,314 131,233 0.9 0.9 0.9 0.9 Oregon .......................................................................................... 138,002 151,205 158,268 161,573 1.1 1.2 1.2 1.1 Washington ................................................................................... 272,734 289,070 310,279 322,778 2.2 2.2 2.3 2.3
* Advance statistics values because of revisions to the NIPA GDP values, and because the U.S. GDP-by-state values exclude 1. U.S. GDP-by-state values differ from the corresponding national income and product account (NIPA) GDP federal military and civilian activity located overseas, which cannot be attributed to a particular state.
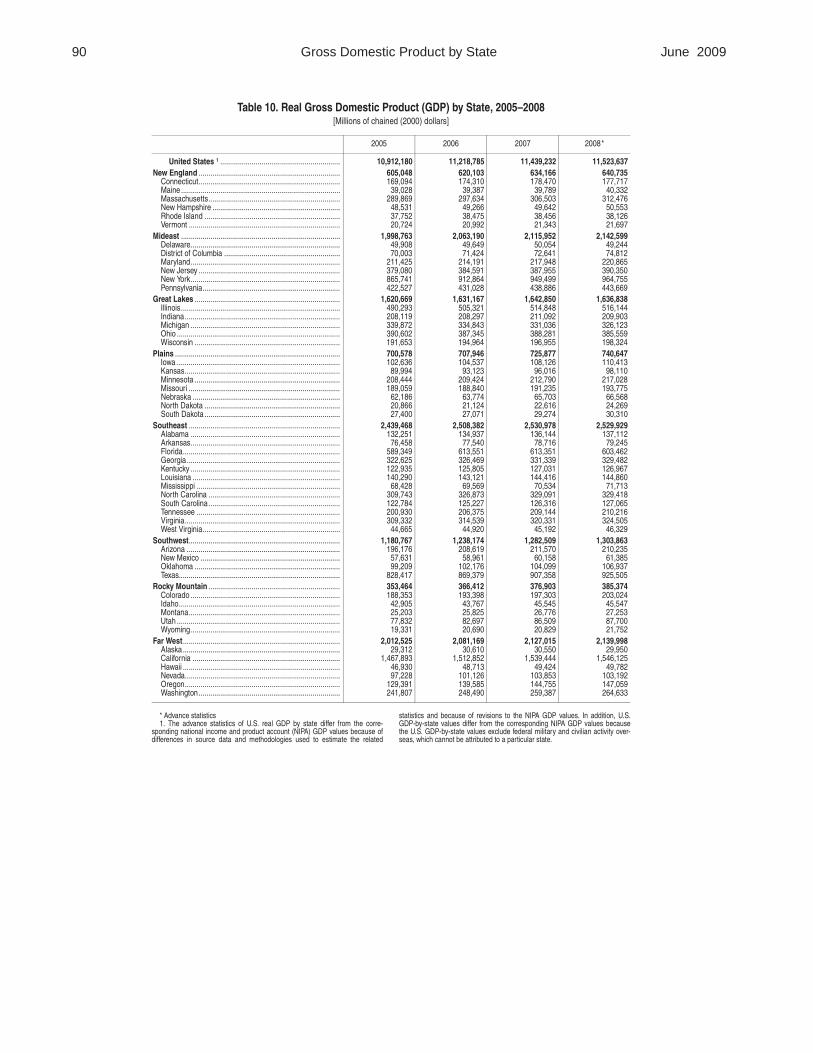
90 Gross Domestic Product by State June 2009
Table 10. Real Gross Domestic Product (GDP) by State, 2005–2008 [Millions of chained (2000) dollars]
2005 2006 2007 2008*
United States 1 ............................................................. 10,912,180 11,218,785 11,439,232 11,523,637
New England ........................................................................ 605,048 620,103 634,166 640,735 Connecticut........................................................................ 169,094 174,310 178,470 177,717 Maine ................................................................................. 39,028 39,387 39,789 40,332 Massachusetts................................................................... 289,869 297,634 306,503 312,476 New Hampshire ................................................................. 48,531 49,266 49,642 50,553 Rhode Island ..................................................................... 37,752 38,475 38,456 38,126 Vermont ............................................................................. 20,724 20,992 21,343 21,697
Mideast ................................................................................. 1,998,763 2,063,190 2,115,952 2,142,599 Delaware............................................................................ 49,908 49,649 50,054 49,244 District of Columbia ........................................................... 70,003 71,424 72,641 74,812 Maryland............................................................................ 211,425 214,191 217,948 220,865 New Jersey ........................................................................ 379,080 384,591 387,955 390,350 New York............................................................................ 865,741 912,864 949,499 964,755 Pennsylvania...................................................................... 422,527 431,028 438,886 443,669
Great Lakes .......................................................................... 1,620,669 1,631,167 1,642,850 1,636,838 Illinois................................................................................. 490,293 505,321 514,848 516,144 Indiana............................................................................... 208,119 208,297 211,092 209,903 Michigan ............................................................................ 339,872 334,843 331,036 326,123 Ohio ................................................................................... 390,602 387,345 388,281 385,559 Wisconsin .......................................................................... 191,653 194,964 196,955 198,324
Plains .................................................................................... 700,578 707,946 725,877 740,647 Iowa ................................................................................... 102,636 104,537 108,126 110,413 Kansas............................................................................... 89,994 93,123 96,016 98,110 Minnesota .......................................................................... 208,444 209,424 212,790 217,028 Missouri ............................................................................. 189,059 188,840 191,235 193,775 Nebraska ........................................................................... 62,186 63,774 65,703 66,568 North Dakota ..................................................................... 20,866 21,124 22,616 24,269 South Dakota ..................................................................... 27,400 27,071 29,274 30,310
Southeast ............................................................................. 2,439,468 2,508,382 2,530,978 2,529,929 Alabama ............................................................................ 132,251 134,937 136,144 137,112 Arkansas............................................................................ 76,458 77,540 78,716 79,245 Florida................................................................................ 589,349 613,551 613,351 603,462 Georgia.............................................................................. 322,625 326,469 331,339 329,482 Kentucky ............................................................................ 122,935 125,805 127,031 126,967 Louisiana ........................................................................... 140,290 143,121 144,416 144,860 Mississippi ......................................................................... 68,428 69,569 70,534 71,713 North Carolina ................................................................... 309,743 326,873 329,091 329,418 South Carolina................................................................... 122,784 125,227 126,316 127,065 Tennessee ......................................................................... 200,930 206,375 209,144 210,216 Virginia............................................................................... 309,332 314,539 320,331 324,505 West Virginia...................................................................... 44,665 44,920 45,192 46,329
Southwest............................................................................. 1,180,767 1,238,174 1,282,509 1,303,863 Arizona .............................................................................. 196,176 208,619 211,570 210,235 New Mexico ....................................................................... 57,631 58,961 60,158 61,385 Oklahoma .......................................................................... 99,209 102,176 104,099 106,937 Texas.................................................................................. 828,417 869,379 907,358 925,505
Rocky Mountain ................................................................... 353,464 366,412 376,903 385,374 Colorado ............................................................................ 188,353 193,398 197,303 203,024 Idaho.................................................................................. 42,905 43,767 45,545 45,547 Montana............................................................................. 25,203 25,825 26,776 27,253 Utah ................................................................................... 77,832 82,697 86,509 87,700 Wyoming............................................................................ 19,331 20,690 20,829 21,752
Far West................................................................................ 2,012,525 2,081,169 2,127,015 2,139,998 Alaska ................................................................................ 29,312 30,610 30,550 29,950 California ........................................................................... 1,467,893 1,512,852 1,539,444 1,546,125 Hawaii ................................................................................ 46,930 48,713 49,424 49,782 Nevada............................................................................... 97,228 101,126 103,853 103,192 Oregon............................................................................... 129,391 139,585 144,755 147,059 Washington........................................................................ 241,807 248,490 259,387 264,633
* Advance statistics statistics and because of revisions to the NIPA GDP values. In addition, U.S. 1. The advance statistics of U.S. real GDP by state differ from the corre- GDP-by-state values differ from the corresponding NIPA GDP values because
sponding national income and product account (NIPA) GDP values because of the U.S. GDP-by-state values exclude federal military and civilian activity over-differences in source data and methodologies used to estimate the related seas, which cannot be attributed to a particular state.