Embed Size (px)
Citation preview
8 CHARTING INTERNATIONAL LABOR COMPARISONS | SEPTEMBER 2012 U.S. BUREAU OF LABOR STATISTICS | www.bls.gov
1
Gross domestic product (GDP) is a
measure of a country’s economic
output. GDP per capita and GDP
per employed person are related
indicators that provide a general picture of
a country’s well-being. GDP per capita is
an indicator of overall wealth in a country,
and GDP per employed person is a general
indicator of productivity.
Gross DomesticProduct
SECTION
U.S. BUREAU OF LABOR STATISTICS | www.bls.gov SEPTEMBER 2012 | CHARTING INTERNATIONAL LABOR COMPARISONS 9
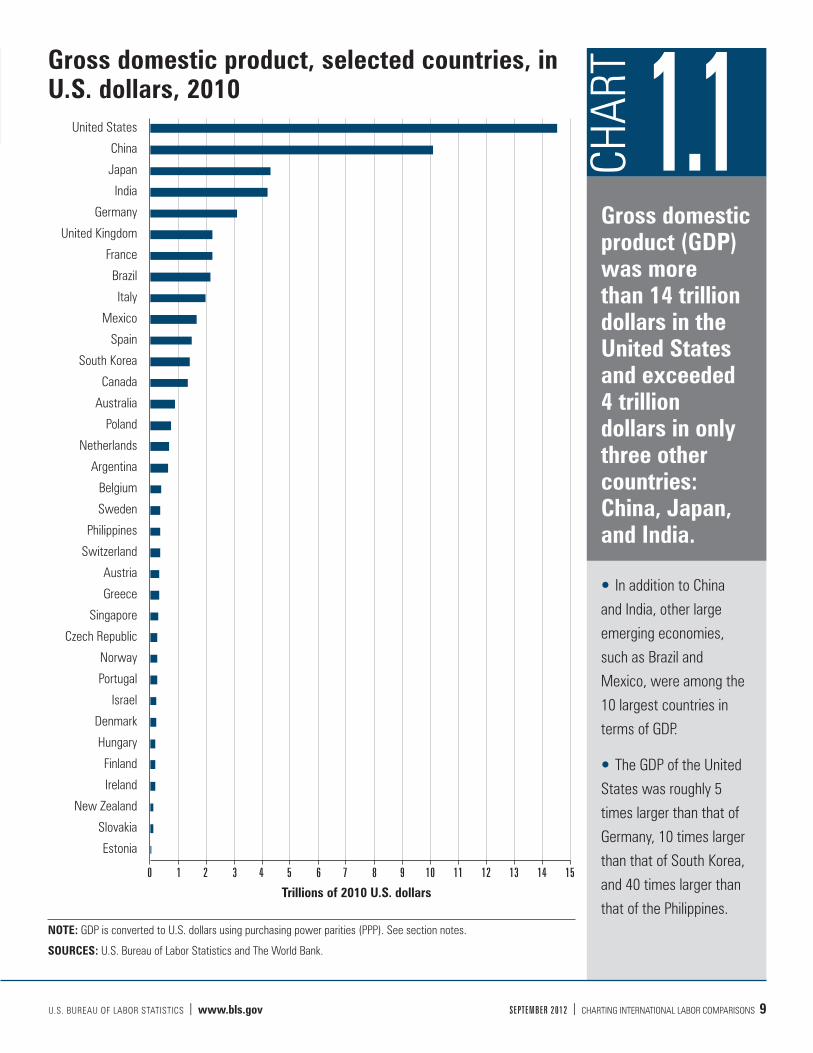
Gross domestic product (GDP) was more than 14 trillion dollars in the United States and exceeded 4 trillion dollars in only three other countries: China, Japan, and India.
In addition to China
and India, other large
emerging economies,
such as Brazil and
Mexico, were among the
10 largest countries in
terms of GDP.
The GDP of the United
States was roughly 5
times larger than that of
Germany, 10 times larger
than that of South Korea,
and 40 times larger than
that of the Philippines.
1.1CHAR
TGross domestic product, selected countries, in U.S. dollars, 2010
United States
China
Japan
India
Germany
United Kingdom
France
Brazil
Italy
Mexico
Spain
South Korea
Canada
Australia
Poland
Netherlands
Argentina
Belgium
Sweden
Philippines
Switzerland
Austria
Greece
Singapore
Czech Republic
Norway
Portugal
Israel
Denmark
Hungary
Finland
Ireland
New Zealand
Slovakia
Estonia
Trillions of 2010 U.S. dollars
0 1 2 3 4 5 6 7 8 9 10 11 12 13 14 15
NOTE: GDP is converted to U.S. dollars using purchasing power parities (PPP). See section notes.
SOURCES: U.S. Bureau of Labor Statistics and The World Bank.
10 CHARTING INTERNATIONAL LABOR COMPARISONS | SEPTEMBER 2012 U.S. BUREAU OF LABOR STATISTICS | www.bls.gov
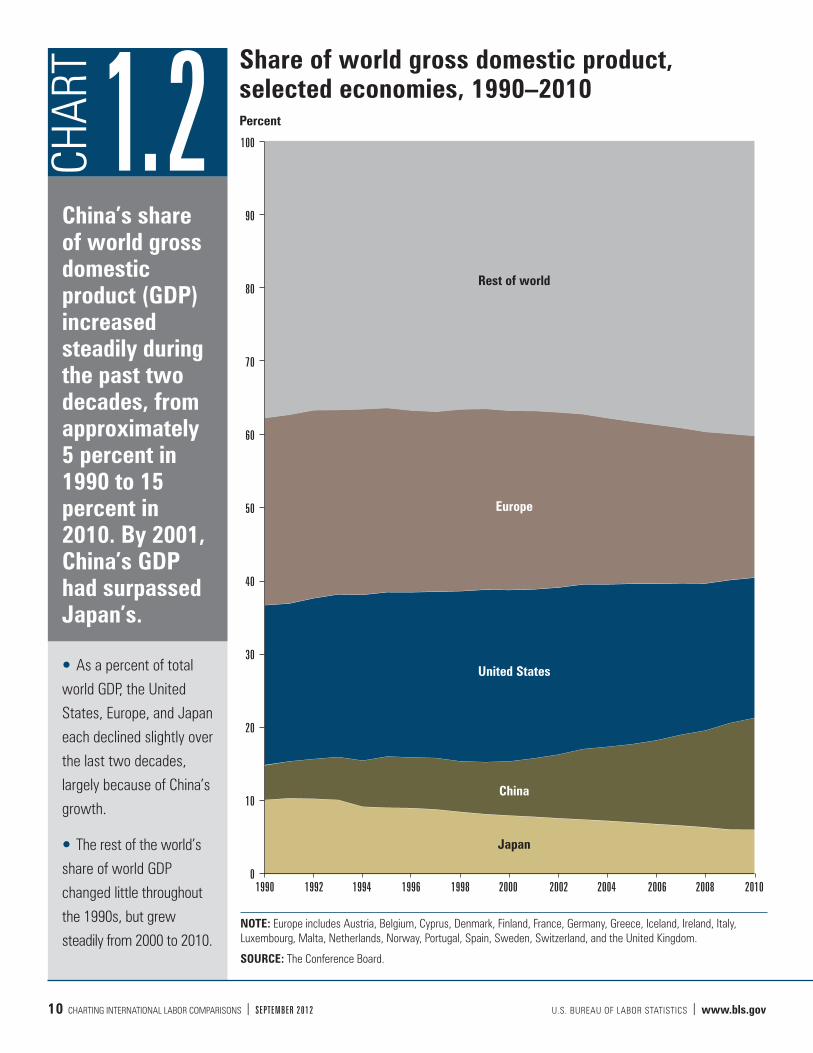
China’s share of world gross domestic product (GDP) increased steadily during the past two decades, from approximately 5 percent in 1990 to 15 percent in 2010. By 2001, China’s GDP had surpassed Japan’s.
As a percent of total
world GDP, the United
States, Europe, and Japan
each declined slightly over
the last two decades,
largely because of China’s
growth.
The rest of the world’s
share of world GDP
changed little throughout
the 1990s, but grew
steadily from 2000 to 2010.
1.2CHAR
T Share of world gross domestic product,selected economies, 1990–2010
100
90
80
70
60
50
40
30
20
10
0
Percent
Rest of world
Europe
United States
China
Japan
1990 1992 1994 1996 1998 2000 2002 2004 2006 2008 2010
NOTE: Europe includes Austria, Belgium, Cyprus, Denmark, Finland, France, Germany, Greece, Iceland, Ireland, Italy, Luxembourg, Malta, Netherlands, Norway, Portugal, Spain, Sweden, Switzerland, and the United Kingdom.
SOURCE: The Conference Board.
U.S. BUREAU OF LABOR STATISTICS | www.bls.gov SEPTEMBER 2012 | CHARTING INTERNATIONAL LABOR COMPARISONS 11
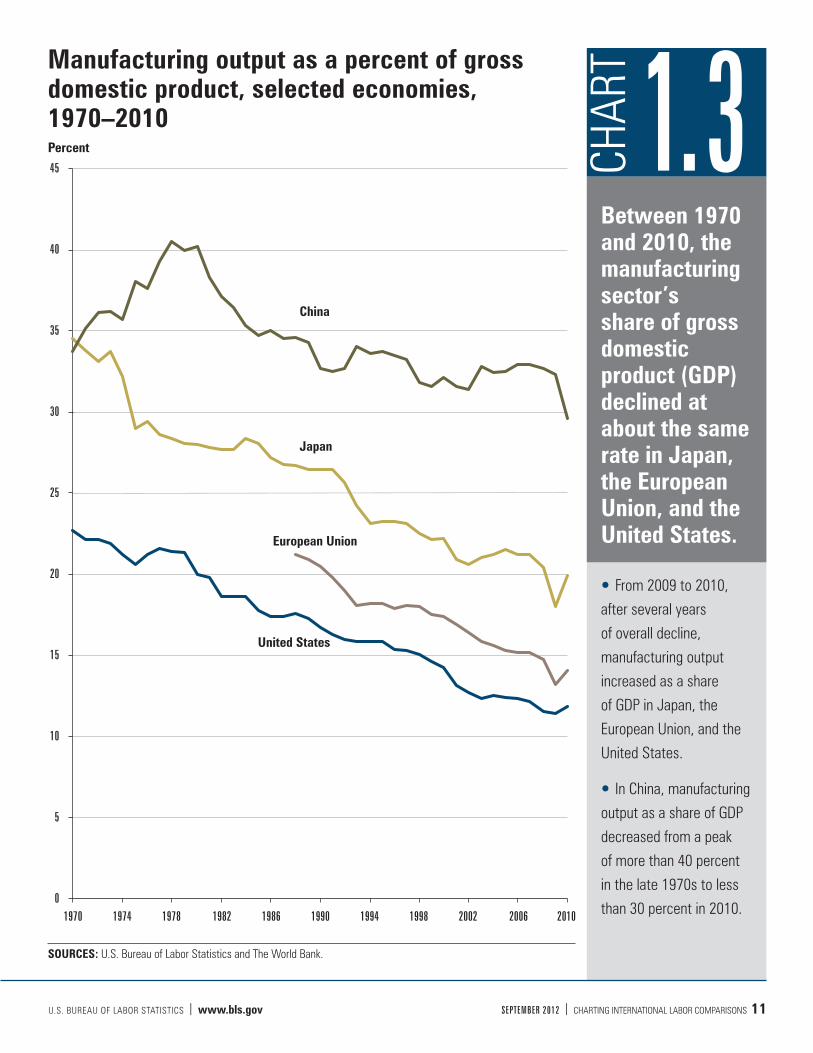
Between 1970 and 2010, the manufacturing sector’s share of gross domestic product (GDP) declined at about the same rate in Japan, the European Union, and the United States.
From 2009 to 2010,
after several years
of overall decline,
manufacturing output
increased as a share
of GDP in Japan, the
European Union, and the
United States.
In China, manufacturing
output as a share of GDP
decreased from a peak
of more than 40 percent
in the late 1970s to less
than 30 percent in 2010.
1.3CHAR
TManufacturing output as a percent of gross domestic product, selected economies, 1970–2010
45
40
35
30
25
20
15
10
5
0
Percent
China
Japan
European Union
United States
1970 1974 1978 1982 1986 1990 1994 1998 2002 2006 2010
SOURCES: U.S. Bureau of Labor Statistics and The World Bank.
12 CHARTING INTERNATIONAL LABOR COMPARISONS | SEPTEMBER 2012 U.S. BUREAU OF LABOR STATISTICS | www.bls.gov
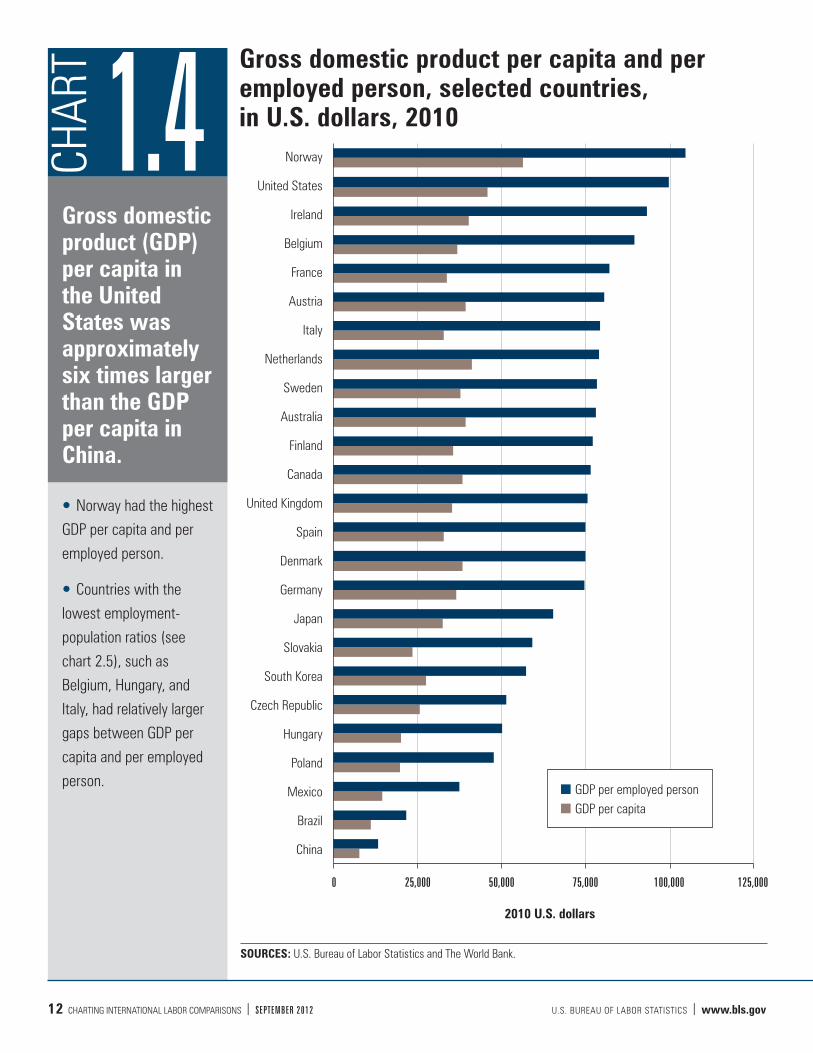
Gross domestic product (GDP) per capita in the United States was approximately six times larger than the GDP per capita in China.
Norway had the highest
GDP per capita and per
employed person.
Countries with the
lowest employment-
population ratios (see
chart 2.5), such as
Belgium, Hungary, and
Italy, had relatively larger
gaps between GDP per
capita and per employed
person.
1.4CHAR
T Gross domestic product per capita and per employed person, selected countries, in U.S. dollars, 2010
Norway
United States
Ireland
Belgium
France
Austria
Italy
Netherlands
Sweden
Australia
Finland
Canada
United Kingdom
Spain
Denmark
Germany
Japan
Slovakia
South Korea
Czech Republic
Hungary
Poland
Mexico
Brazil
China
0 25,000 50,000 75,000 100,000 125,000
SOURCES: U.S. Bureau of Labor Statistics and The World Bank.
2010 U.S. dollars
GDP per employed person GDP per capita
U.S. BUREAU OF LABOR STATISTICS | www.bls.gov SEPTEMBER 2012 | CHARTING INTERNATIONAL LABOR COMPARISONS 13
SourcesGross domestic product (GDP) data for most
countries are based on the BLS report International
Comparisons of GDP per Capita and per Hour,
1960–2010. GDP data for the remaining countries
and all purchasing power parities (PPP) are based on
data in the World Bank database World Development
Indicators. A country or region’s share of world GDP
(chart 1.2) is based on data in The Conference Board
Total Economy Database.
Each country prepares GDP measures in accordance
with national accounts principles. To make
international comparisons of levels of GDP, GDP
per capita, and GDP per employed person, it is
necessary to express GDP in a common currency
unit. BLS converts GDP from national currency units
to U.S. dollars through the use of PPP.
DefinitionsGross domestic product (GDP) is the market value of
all goods and services produced in a country. GDP
per capita is GDP divided by population and is a
rough measure of a country’s overall wealth. GDP
per employed person is GDP divided by the number
of employed persons and is a rough measure of a
country’s productivity. Purchasing power parities (PPP)
are currency conversion rates that allow output
in different currency units to be expressed in a
common unit of value. A PPP is the ratio between
the number of units of a country’s currency and
the number of U.S. dollars required to purchase an
equivalent basket of goods and services within each
respective country.
Section 1 Notes GROSS DOMESTIC PRODUCT