Embed Size (px)
Citation preview
AMP CAPITAL INSIGHT PAPER GREENHOUSE GAS EMISSIONS 1
GREENHOUSE GAS EMISSIONS: RISKS AND CHALLENGES FOR PORTFOLIOS JANUARY 2016
insightpaper
IAN WOODS Head of Environmental, Social and Governance Investment Research
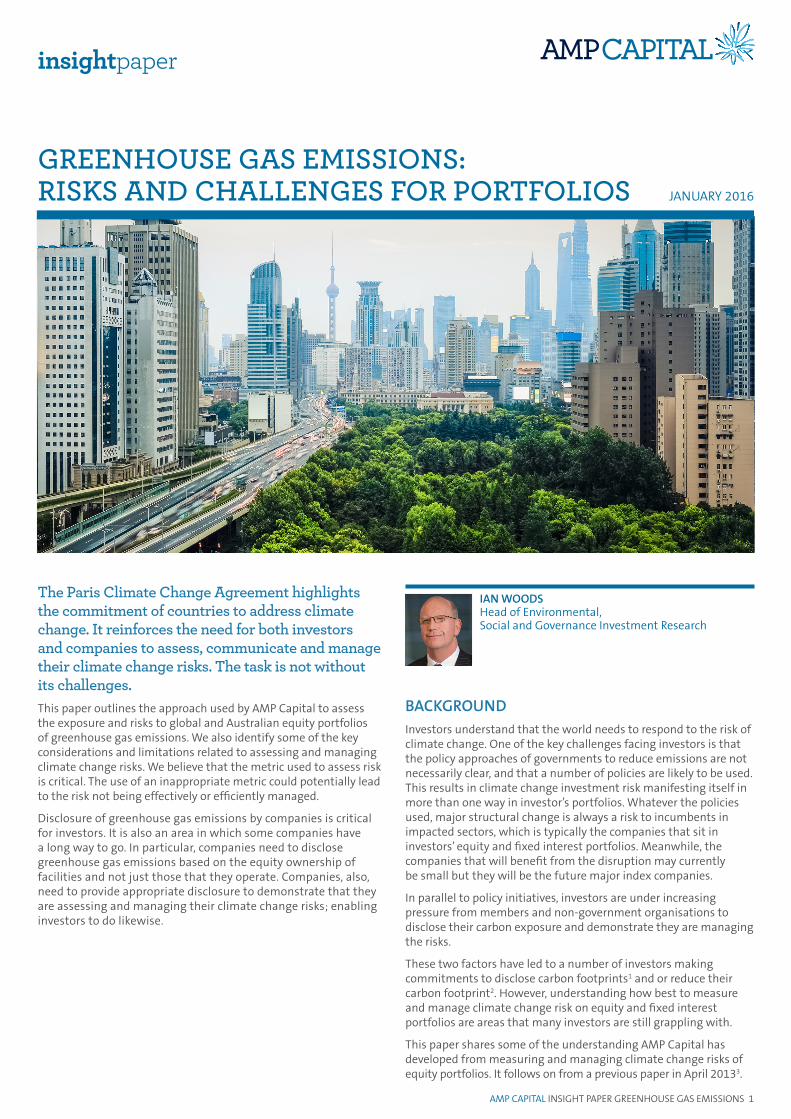
The Paris Climate Change Agreement highlights the commitment of countries to address climate change. It reinforces the need for both investors and companies to assess, communicate and manage their climate change risks. The task is not without its challenges.This paper outlines the approach used by AMP Capital to assess the exposure and risks to global and Australian equity portfolios of greenhouse gas emissions. We also identify some of the key considerations and limitations related to assessing and managing climate change risks. We believe that the metric used to assess risk is critical. The use of an inappropriate metric could potentially lead to the risk not being effectively or efficiently managed.
Disclosure of greenhouse gas emissions by companies is critical for investors. It is also an area in which some companies have a long way to go. In particular, companies need to disclose greenhouse gas emissions based on the equity ownership of facilities and not just those that they operate. Companies, also, need to provide appropriate disclosure to demonstrate that they are assessing and managing their climate change risks; enabling investors to do likewise.
BACKGROUNDInvestors understand that the world needs to respond to the risk of climate change. One of the key challenges facing investors is that the policy approaches of governments to reduce emissions are not necessarily clear, and that a number of policies are likely to be used. This results in climate change investment risk manifesting itself in more than one way in investor’s portfolios. Whatever the policies used, major structural change is always a risk to incumbents in impacted sectors, which is typically the companies that sit in investors’ equity and fixed interest portfolios. Meanwhile, the companies that will benefit from the disruption may currently be small but they will be the future major index companies.
In parallel to policy initiatives, investors are under increasing pressure from members and non-government organisations to disclose their carbon exposure and demonstrate they are managing the risks.
These two factors have led to a number of investors making commitments to disclose carbon footprints1 and or reduce their carbon footprint2. However, understanding how best to measure and manage climate change risk on equity and fixed interest portfolios are areas that many investors are still grappling with.
This paper shares some of the understanding AMP Capital has developed from measuring and managing climate change risks of equity portfolios. It follows on from a previous paper in April 20133.
AMP CAPITAL INSIGHT PAPER GREENHOUSE GAS EMISSIONS 2
THE SIZE OF THE CHALLENGE FACING INVESTORSGovernments around the world have committed to limiting the impact of man-made climate change to less than two degrees celsius4 (2°C). As part of this process and as part of the Paris Climate Change Agreement, governments have made commitments to reduce national greenhouse gas emissions. For example, Australia has committed to reduce emissions by 26-28% from 2005 levels by 2030, while the US has committed to a similar target but by 2025.
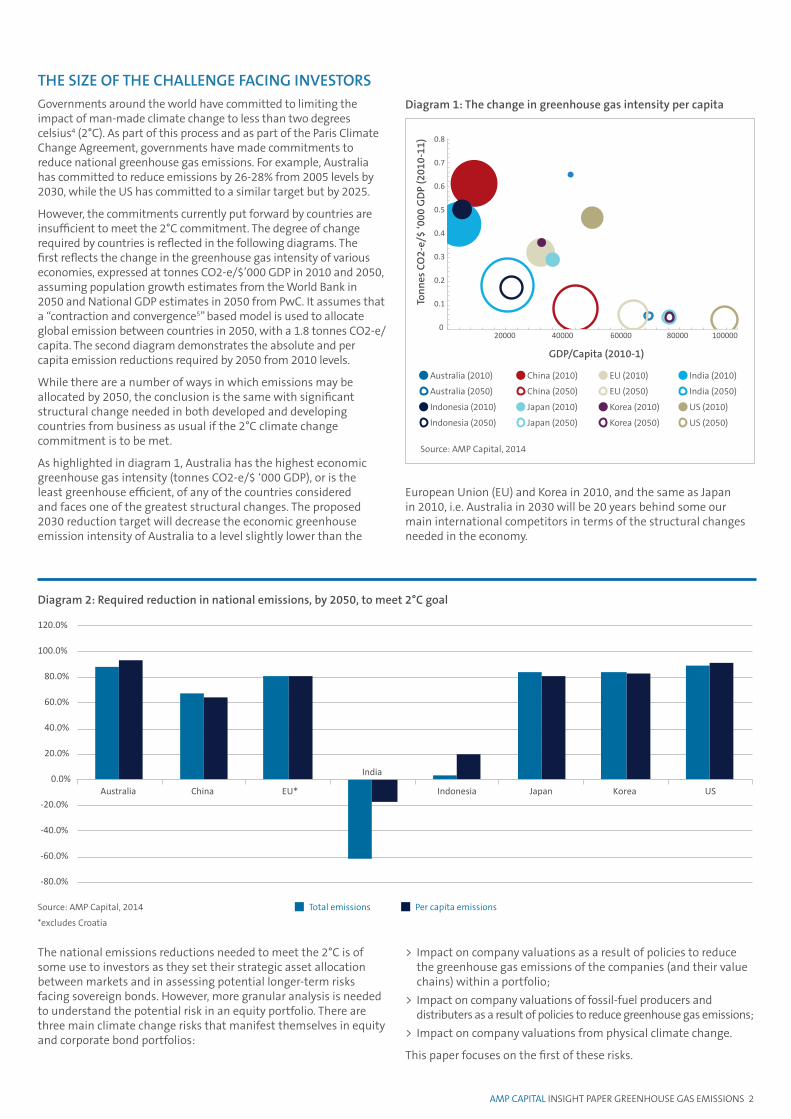
However, the commitments currently put forward by countries are insufficient to meet the 2°C commitment. The degree of change required by countries is reflected in the following diagrams. The first reflects the change in the greenhouse gas intensity of various economies, expressed at tonnes CO2-e/$’000 GDP in 2010 and 2050, assuming population growth estimates from the World Bank in 2050 and National GDP estimates in 2050 from PwC. It assumes that a “contraction and convergence5” based model is used to allocate global emission between countries in 2050, with a 1.8 tonnes CO2-e/capita. The second diagram demonstrates the absolute and per capita emission reductions required by 2050 from 2010 levels.
While there are a number of ways in which emissions may be allocated by 2050, the conclusion is the same with significant structural change needed in both developed and developing countries from business as usual if the 2°C climate change commitment is to be met.
As highlighted in diagram 1, Australia has the highest economic greenhouse gas intensity (tonnes CO2-e/$ ‘000 GDP), or is the least greenhouse efficient, of any of the countries considered and faces one of the greatest structural changes. The proposed 2030 reduction target will decrease the economic greenhouse emission intensity of Australia to a level slightly lower than the
0
0.1
0.2
0.3
0.4
0.5
0.6
0.7
0.8
20000 40000 60000 80000 100000
Ton
nes
CO
2-e/
$ ‘0
00 G
DP
(201
0-11
)
GDP/Capita (2010-1)
Australia (2010) China (2010) EU (2010) India (2010)
Australia (2050) China (2050) EU (2050) India (2050)
Indonesia (2010) Japan (2010) Korea (2010) US (2010)
Indonesia (2050) Japan (2050) Korea (2050) US (2050)
Source: AMP Capital, 2014
-80.0%
-60.0%
-40.0%
-20.0%
0.0%
20.0%
40.0%
60.0%
80.0%
100.0%
120.0%
Australia China EU*
India
Indonesia Japan Korea USUS
Diagram 2: Required reduction in national emissions, by 2050, to meet 2°C goal
Total emissions Per capita emissionsSource: AMP Capital, 2014
*excludes Croatia
The national emissions reductions needed to meet the 2°C is of some use to investors as they set their strategic asset allocation between markets and in assessing potential longer-term risks facing sovereign bonds. However, more granular analysis is needed to understand the potential risk in an equity portfolio. There are three main climate change risks that manifest themselves in equity and corporate bond portfolios:
> Impact on company valuations as a result of policies to reduce the greenhouse gas emissions of the companies (and their value chains) within a portfolio;
> Impact on company valuations of fossil-fuel producers and distributers as a result of policies to reduce greenhouse gas emissions;
> Impact on company valuations from physical climate change.
This paper focuses on the first of these risks.
Diagram 1: The change in greenhouse gas intensity per capita
European Union (EU) and Korea in 2010, and the same as Japan in 2010, i.e. Australia in 2030 will be 20 years behind some our main international competitors in terms of the structural changes needed in the economy.
AMP CAPITAL INSIGHT PAPER GREENHOUSE GAS EMISSIONS 3
Assessing greenhouse gas emission exposure
The first task is assessing greenhouse gas emission risk is to understand the greenhouse gas exposure.
Company greenhouse gas emissions are considered to be:
> Scope 1 emissions – Greenhouse gas emissions emitted by the company’s operations, e.g. from the combustion of fossil fuel;
> Scope 2 emissions – Greenhouse gas emissions associated with the use of electricity generated by the combustion of fossil fuels, e.g. coal-fired power generation;
> Scope 3 emissions – Company share of greenhouse gas emissions from all the suppliers in a company’s value change, e.g. emissions from the transportation of raw materials, products or provision of services.
If companies do disclose their greenhouse gas emissions, they typically disclose their Scope 1 and Scope 2 emissions. Due to the complexity of the analysis, only some companies also disclose Scope 3 emissions.
At a company level, each of these emission scopes provides some helpful insight into the nature of the company-specific risk. However, the challenge at a portfolio level is the risk of double, triple (or even more) counting of the same emission, i.e. tonne of CO2-e. This is illustrated in the simple example below of a portfolio of five stocks reflecting simple supply chain for a factory (Company E), with suppliers overseas and interstate.
An additional issue is that companies typically report the emissions from operations they control, irrespective of the ownership of the operation. In addition, they do not report emissions from operations they do not control even though they may own a significant proportion of these non-controlled operations. Thus, a company’s exposure from an operational perspective can be very different from an ownership or equity perspective. In the same way investors are interested or exposed to the profit from an ownership or equity perspective, investors are only interested in the ownership or equity exposure of greenhouse gas emissions.
This is particularly, but not exclusively, the case for resource companies. For example in Australia, CSR, a building materials company also owns approximately 25%, but does not operate, a large aluminium smelter. As a result CSR’s operational-based emissions are 20% of the equity-based emissions, because the equity based emissions includes the emissions associated with the part ownership of the aluminium smelter.
Finally, an investor is only exposed to the extent they own the company, i.e. proportional to the company they own. It is therefore appropriate that emission intensity of a company is expressed in terms of tonnes CO2-e/yr per $m company market capitalisation. Some have advocated using tonnes CO2-e per $m company revenue. While such a metric may be useful in assessing whether a company may be able to pass through costs, e.g. a cost of $20/tonne-CO2-e represents a small, say 0.1% of total revenue, then the likelihood it may be able to pass some of the costs through would be, depending on the industry, high. However, there is no clear rationale for using such a metric for assessing the greenhouse gas exposure of a portfolio. On the contrary, such a metric could lead to the wrong investment actions if it is subsequently used to manage greenhouse gas emission investment risk.
So, a metric of tonnes CO2-e/yr per $ million of invested funds, based on equity-based emissions of companies, is considered the most appropriate metric to assess the exposure of an equity portfolio and for meaningfully communicating to investors the exposure of the fund.
CompanyScope 1
EmissionsScope 2
Emissions
Scope 3 emissions (including what
would be considered)
A – ✔
B – ✔ ✔ (A)
C – Power station ✔
D – Transmission line ✔ ✔ (C)
E – Factory ✔ ✔ ✔ (A,B)
Source: AMP Capital, 2015
COMPANY A
COMPANY C
COMPANY B
COMPANY D
COMPANY E
It is clear that if scope 1+2+3 emissions for all the companies are used to assess five company portfolio exposures, then some of the emissions from Company A could be counted three times in the analysis, and emissions from Company B and C twice.
To assess the risk of, say, a price on carbon for this portfolio, the cost of the carbon should only be made once and distributed through the value chain depending on the market forces enabling companies to pass through cost to customers.
Therefore, to assess the exposure of a portfolio, only Scope 1 and Scope 2 emissions are considered, but even here there is a potential for double (or triple) counting at least some emissions from Company C.
Diagram 3: Five stock portfolio
AMP CAPITAL INSIGHT PAPER GREENHOUSE GAS EMISSIONS 4
Assessing greenhouse gas emission investment risk
The measurement of the exposure of a fund is an important first step to assessing the greenhouse gas emission investment risk. However, further analysis is needed to assess the risk. The risk from a company having greenhouse gas emissions depends on the policy approach taken but increasingly a carbon price, whether set by the market or as a tax, is considered the most likely approach and therefore a good measure of the risk.
Theoretically the market capitalisation of the company reflects the current value of future earnings, with the price-to-earnings (P/E) ratio encapsulating both the growth and risk aspects of a company’s future earnings. Therefore, for a given carbon price, a measure of the risk to a company of its greenhouse gas emissions, as a percent of its market capitalisation, can be assessed using the above assessment of greenhouse gas exposure, the company’s P/E and the carbon price.
A word of caution
While a good measure of the risk, it is worth noting the limitations of the metric and in particular the impact of various assumptions on the risk measure.
The first assumption is that the companies can’t pass the carbon cost through to customers. At the same time, however, it is assumed that companies are liable for Scope 2 emissions. This inconsistency can be considered by looking at the risk for the portfolio, excluding the utilities sector, i.e., it is assumed that all utility companies can pass through the total carbon costs through to customers.
In countries like Australia, this assumption is considered reasonable as the electricity market should allow the majority of costs to be passed through and the regulatory environment for infrastructure companies, such as electricity and gas transmission and distribution, is such that these costs will be considered by the regulator and be considered in price determinations. This is not to say that high emission power stations or infrastructure companies will not be challenged by policies to address climate change but the assumption to exclude utilities gives a better assessment of the portfolio risk of a price on carbon.
All companies are likely to be able to pass through some of the costs to some extent depending on the market dynamics but to assess this would require assessment at individual company level. The ability to pass through costs would mean that this assumption leads to overestimates of the investment risk of an individual company’s Scope 1 and Scope 2 emissions but the pass through of carbon costs from suppliers, i.e. Scope 3 emissions, may mean that the liability may be underestimated. Assessment at an individual company level would be required to assess the balance of increased costs from suppliers with the ability to pass through costs to customers.
The second assumption is that companies don’t reduce their emissions as a result of being exposed to a carbon price. As this is the whole point of applying a carbon price, this is clearly incorrect but to incorporate this would require understanding the carbon abatement cost curve for each company. Again, while individual company analysis would allow for this more detailed assessment, it is difficult to do at a portfolio or index level. Thus, this assumption is likely to an overstatement of the investment risk.
The third assumption is an assumed global carbon price, and that future increases in the carbon price is reflected in the P/E of each stock. The higher the carbon price the less likely the above two assumptions will be correct. The analysis also assumes that the current value of the stock does not already factor in some level of carbon pricing, which for European companies subject to the EU Emission Trading Scheme would be incorrect. Again, this assumption is likely to mean any estimate of the carbon risk is an overestimate.
Under some carbon price scenarios the carbon liability can be greater than the market capitalisation for some companies. For the purposes of the risk assessment, it is assumed that the maximum liability is set at the market capitalisation. Under this situation, and in fact well before this situation, debt investors are likely to step in and so this analysis can also be used to help identify potential greenhouse gas emission risk for debt investors.
Finally, there is incomplete greenhouse emissions data and/or only operational data for companies in the portfolio or index. The criticality of lacking emission data depends on the sector in which the company is in. For emission intensive companies, trying to estimate data from operational data may enable an acceptable level, say +/- 30% of uncertainty in emission estimate for a particular company. For companies in lower emission sectors, emissions can be estimated by size of the company relative to others in the same sector. This may mean emission estimates for these companies may only be within a factor of two or greater of the actual emissions for the company. The importance, or otherwise, of this level of uncertainty will depend on the importance of the company in the portfolio or index. This is discussed further in later sections.
The lack of disclosure of operational-based emissions can be overcome to some extent by considering individual companies, especially in the resource sector, and estimating the emissions for the component parts of the company. As discussed later, the use of operational-based emissions becomes increasingly important when the number of companies in the portfolio or index become relatively small in number.
Notwithstanding the qualifications on the methodology to assess the investment risk from greenhouse gas emissions of an index or portfolio, the proposed approach is considered the most appropriate. While absolute risk is important, the relative risk of a portfolio verses an appropriate index is also helpful in understanding the portfolio risk of greenhouse gas emissions.
The choice of metric used to assess risk, and an understanding of the limitations of the metric, is critical if investors then incorporate the metric in their investment decisions. Using the wrong metric can mean investors are not managing the real risk, despite their efforts. A better approach may be to understand risk at individual company level rather than relying on broad portfolio level measures based on an inappropriate metric.
AMP CAPITAL INSIGHT PAPER GREENHOUSE GAS EMISSIONS 5
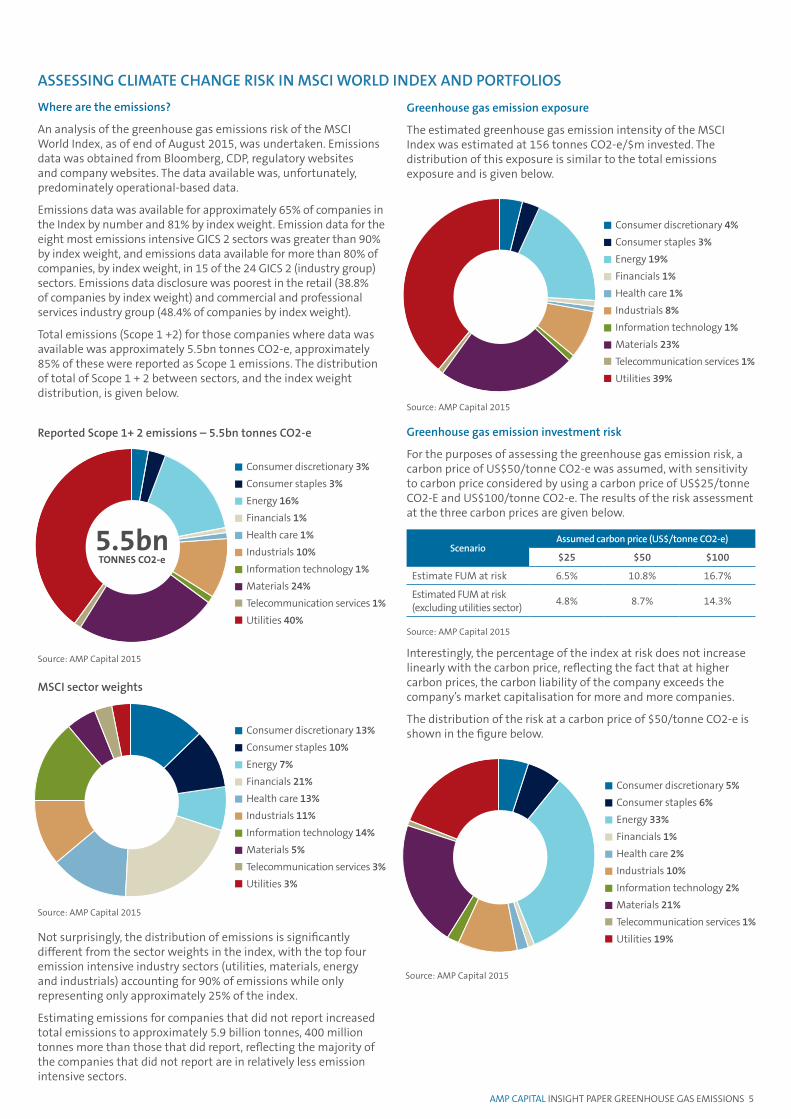
Not surprisingly, the distribution of emissions is significantly different from the sector weights in the index, with the top four emission intensive industry sectors (utilities, materials, energy and industrials) accounting for 90% of emissions while only representing only approximately 25% of the index.
Estimating emissions for companies that did not report increased total emissions to approximately 5.9 billion tonnes, 400 million tonnes more than those that did report, reflecting the majority of the companies that did not report are in relatively less emission intensive sectors.
Greenhouse gas emission exposure
The estimated greenhouse gas emission intensity of the MSCI Index was estimated at 156 tonnes CO2-e/$m invested. The distribution of this exposure is similar to the total emissions exposure and is given below.
Where are the emissions?
An analysis of the greenhouse gas emissions risk of the MSCI World Index, as of end of August 2015, was undertaken. Emissions data was obtained from Bloomberg, CDP, regulatory websites and company websites. The data available was, unfortunately, predominately operational-based data.
Emissions data was available for approximately 65% of companies in the Index by number and 81% by index weight. Emission data for the eight most emissions intensive GICS 2 sectors was greater than 90% by index weight, and emissions data available for more than 80% of companies, by index weight, in 15 of the 24 GICS 2 (industry group) sectors. Emissions data disclosure was poorest in the retail (38.8% of companies by index weight) and commercial and professional services industry group (48.4% of companies by index weight).
Total emissions (Scope 1 +2) for those companies where data was available was approximately 5.5bn tonnes CO2-e, approximately 85% of these were reported as Scope 1 emissions. The distribution of total of Scope 1 + 2 between sectors, and the index weight distribution, is given below.
Consumer discretionary 3%
Consumer staples 3%
Energy 16%
Financials 1%
Health care 1%
Industrials 10%
Information technology 1%
Materials 24%
Telecommunication services 1%
Utilities 40%
Reported Scope 1+ 2 emissions – 5.5bn tonnes CO2-e
5.5bnTONNES CO2-e
Source: AMP Capital 2015
Consumer discretionary 13%
Consumer staples 10%
Energy 7%
Financials 21%
Health care 13%
Industrials 11%
Information technology 14%
Materials 5%
Telecommunication services 3%
Utilities 3%
MSCI sector weights
Source: AMP Capital 2015
Consumer discretionary 4%
Consumer staples 3%
Energy 19%
Financials 1%
Health care 1%
Industrials 8%
Information technology 1%
Materials 23%
Telecommunication services 1%
Utilities 39%
Source: AMP Capital 2015
Consumer discretionary 5%
Consumer staples 6%
Energy 33%
Financials 1%
Health care 2%
Industrials 10%
Information technology 2%
Materials 21%
Telecommunication services 1%
Utilities 19%
Source: AMP Capital 2015
Greenhouse gas emission investment risk
For the purposes of assessing the greenhouse gas emission risk, a carbon price of US$50/tonne CO2-e was assumed, with sensitivity to carbon price considered by using a carbon price of US$25/tonne CO2-E and US$100/tonne CO2-e. The results of the risk assessment at the three carbon prices are given below.
ScenarioAssumed carbon price (US$/tonne CO2-e)
$25 $50 $100
Estimate FUM at risk 6.5% 10.8% 16.7%
Estimated FUM at risk (excluding utilities sector)
4.8% 8.7% 14.3%
Source: AMP Capital 2015
Interestingly, the percentage of the index at risk does not increase linearly with the carbon price, reflecting the fact that at higher carbon prices, the carbon liability of the company exceeds the company’s market capitalisation for more and more companies.
The distribution of the risk at a carbon price of $50/tonne CO2-e is shown in the figure below.
ASSESSING CLIMATE CHANGE RISK IN MSCI WORLD INDEX AND PORTFOLIOS
AMP CAPITAL INSIGHT PAPER GREENHOUSE GAS EMISSIONS 6
An assessment of each sector’s greenhouse investment risk provides a different result to each sector’s the greenhouse exposure. This highlights the importance of choosing the appropriate metric when assessing the risk and also the need to look at company specific issues when implementing an appropriate climate risk management strategy. For example, while utilities represent 38% of the exposure to greenhouse gas emission intensity, the sector represents only 19% of the risk at a carbon price of $50/tonne CO2-e, while energy contributes 23% of the greenhouse emission intensity exposure but 33% of the greenhouse emission investment risk.
The percent of each sector at risk at $50/tonne CO2-e is given below.
Sector % of sector at risk
Consumer discretionary 3.8%
Consumer staples 6.0%
Energy 52.5%
Financials 0.6%
Health care 1.5%
Industrials 10.2%
Information technology 1.5%
Materials 48.6%
Telecommunication services 4.3%
Utilities 65.9%
Total for index 10.8%
Source: AMP Capital 2015
ASSESSING CLIMATE CHANGE RISK IN ASX200 INDEX AND AUSTRALIAN EQUITY PORTFOLIOS
A similar analysis has been undertaken for the ASX200 but this also included an analysis of the equity-based emissions. One of the challenges for assessing the greenhouse gas exposure for some Australian companies is the dynamic nature of their greenhouse gas emissions as a result of mergers, demergers and/or the starting of new energy intensive activities. In this case, historically reported emissions do not reflect the current or near future emissions that are associated with future earnings that are reflected in the company’s market capitalisation.
The table below summarises the total greenhouse exposure and the greenhouse gas emission intensity for the index and greenhouse gas investment risk, from an operational and equity-based perspective.
Operational-based Exposure
Equity-based exposure
Greenhouse gas exposure (million tonnes CO2-e)
234.2 211.8
Greenhouse gas emissions intensity exposure (tonnes CO2-e/$m FUM)
141 128
Greenhouse gas investment risk (%) (@$50/tonne CO2-e)
9.0% 8.5%
Greenhouse gas investment risk, excluding utility sector (@$50/tonne CO2-e)
7.8% 7.5%
Source: AMP Capital 2015
Given the perceived importance of the mining and energy sector to the Australian economy, it is perhaps surprising that the greenhouse gas emission intensity of the ASX200 is less than that of the MSCI World, as is the greenhouse emission investment risk. As with the MSCI, the energy, utility and materials sectors are the largest (85% in total) contributors to ASX200 greenhouse gas emission intensity, with the main difference being that the materials sector, which contributes more for the ASX200 than the utilities. Given the smaller number of stocks in the ASX200, seven companies, which account for 9% of the index, contribute two thirds of the greenhouse gas intensity of the ASX200.
The table above highlights the importance of considering equity-based emissions verses operational-based emissions when considering greenhouse gas investment risk. It is noted that the greenhouse intensity from an equity-based approach is materially 10% less than that from operational-based approach, which is also reflected although to a lesser extent, in the greenhouse gas investment risk.
The issue is more pronounced in the AMP Capital Sustainable Australian Equity Strategy, which the representative account is a 37-stock portfolio. In this case the operational-based greenhouse gas intensity is approximately 76 tonnes CO2-e/$m FUM, which is 35% greater than 56 tonnes CO2-e/$m FUM for the equity-based intensity. Both are significantly less than (more than 50%) of the greenhouse gas intensity of the ASX200.
Greenhouse gas emission investment risk for the Sustainable Strategy is also less for the equity-based approach than the operational-based approach (5.3% versus 5.8%).
AMP CAPITAL INSIGHT PAPER GREENHOUSE GAS EMISSIONS 7
MANAGING CLIMATE CHANGE EXPOSURE OVER TIMEAMP Capital has been assessing the climate change exposure of the ASX200 and its Sustainable Australian Equity Strategy for more than six years. The table below gives the equity-based Scope 1+2 CO2-e emissions, the climate change exposure at a number of points during that time.
Date Feb ‘09 Nov ‘12 Sept ‘15
ASX200 Price Index 3344 4506 5021
ASX200 total emissions (mT CO2-e)
235 207 208
ASX200 exposure (TCO2-e/$m FUM)
231 162 128
Source: Bloomberg, AMP Capital, 2015
The emissions exposure, measured as the emissions intensity, has halved over this time. This reflects both a decrease in the total number of tonnes emitted by companies on the ASX200 and the increase in the value of the companies on the ASX200. It highlights that from an investor’s perspective, both tonnes emitted and the value of companies are important when considering the climate change exposure and risk of a portfolio.
This is not to say that investors can rely on rising markets to manage their climate change risk. There are other longer-term and complex systemic issues that need to be considered. These risks aren’t, and probably can’t be, picked up through this type of analysis. An economy’s reliance on fossil fuels (particularly Australia’s) and hence the value of firms with operations predominately in that economy is more complex than that captured by this analysis of greenhouse gas exposure and risk assessment due to the complex interactions within the economy. The challenges to address climate change facing the broader Australian economy, if the world is to limit global warming to less than 2°C, are better reflected by the national emission reduction
requirements given in figures 1 and 2. It is for this reason that investors need government policies that both reduce emissions and support value creation by companies across the economy.
The greenhouse gas exposure has also been assessed for the AMP Capital Sustainable Australian Equity Strategy during the same time period and its exposure relative to the ASX200 is given in the table below.
AMP Capital Sustainable Australian Equity Strategy
Date Feb ‘09 Nov ‘12 Sept ‘15
ASX200 exposure (TCO2-e/$m FUM)
231 162 128
AMP Capital Sustainable Australian Equity Strategy
149 107 55.6
% Difference 35% 34% 57%
Source: Bloomberg, AMP Capital, 2015
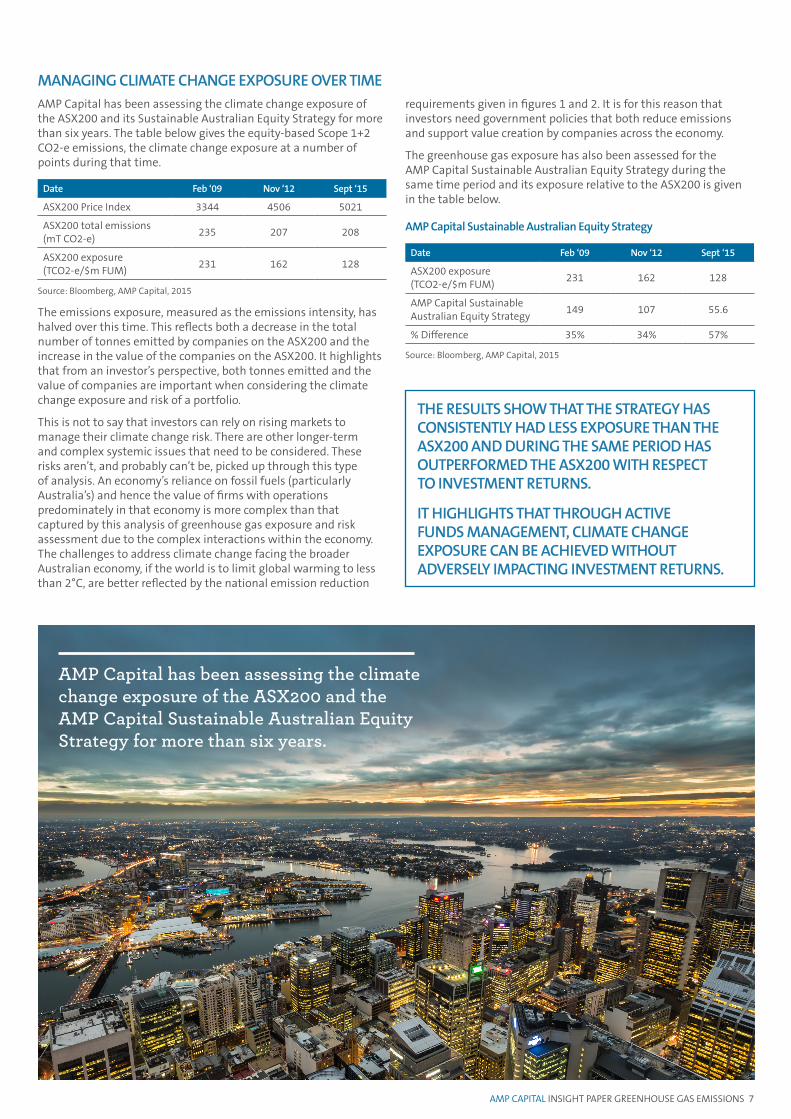
AMP Capital has been assessing the climate change exposure of the ASX200 and the AMP Capital Sustainable Australian Equity Strategy for more than six years.
THE RESULTS SHOW THAT THE STRATEGY HAS CONSISTENTLY HAD LESS EXPOSURE THAN THE ASX200 AND DURING THE SAME PERIOD HAS OUTPERFORMED THE ASX200 WITH RESPECT TO INVESTMENT RETURNS.
IT HIGHLIGHTS THAT THROUGH ACTIVE FUNDS MANAGEMENT, CLIMATE CHANGE EXPOSURE CAN BE ACHIEVED WITHOUT ADVERSELY IMPACTING INVESTMENT RETURNS.

Important note: The information contained in this document has been prepared by AMP Capital Investors Limited (ABN 59 001 777 591, AFSL 232497) (AMP Capital) for providing general information only. It is not intended for distribution or use in any jurisdiction where it would be contrary to applicable laws, regulations or directives and does not constitute a recommendation, offer, solicitation or invitation to invest in any particular investment fund or investment capability. Readers should not treat the Information as advice on legal, tax or investment matters and should make their own inquiries and consult professional advisers as to applicable laws, regulations and requirements in any particular jurisdiction (including, where the Information is received) and the consequences arising from any failure to comply. While every care has been taken in the preparation of this document, neither AMP Capital, nor any member of the AMP Limited Group makes any representation or warranty as to the accuracy or completeness of any statement in it including, without limitation, any forecasts. Certain information in this document identified by footnotes has been obtained from sources that we consider to be reliable and is based on present circumstances, market conditions and beliefs. Other than information sourced from AMP Capital, we have not independently verified this information and cannot assure you that it is accurate or complete. Past performance is not a reliable indicator of future performance. This document has been prepared for the purpose of providing general information, without taking account of any particular investor’s objectives, financial situation or needs. An investor should, before making any investments decisions, consider the appropriateness of the information in this document, and seek professional advice, having regard to the investor’s objectives, financial situation and needs. The Information may not be reproduced or redistributed (in whole or in part) or otherwise made available to any other person in any format without the express written consent of AMP Capital. © Copyright 2016 AMP Capital Investors Limited. All rights reserved.
CONTACT US
If you would like to know more about how AMP Capital can help you, please visit www.ampcapital.com
REFERENCES1. See http://montrealpledge.org/2. See http://unepfi.org/pdc/3. “Assessing climate change risk in the ASX 200 and Equity Portfolios”, AMP Capital Insights, April 20134. See http://cancun.unfccc.int/ and more recently http://www.cop21.gouv.fr/en/5. “Contraction and convergence” allocation refers to allocating global emissions to countries on an equal per capita basis. Hence, per capita emissions in developed countries
reduce to a greater degree than most developing countries, with all country’s per capita emission converging on a common per capita emission.
FINAL THOUGHTSInvestors are facing two pressures. The first is to disclose the climate change exposure of their portfolios. The second is to manage climate change risk. There are significant complexities in trying to assess, communicate and meaningfully manage the climate change risk in a portfolio.
The choice of metrics used to assess exposure and risk are critical and investors need to exercise caution when determining how best to manage risk. Each metric has its limitation and, in some cases, the setting of portfolio objectives to manage climate change risk may not achieve the desired objective if an inappropriate metric is used.
Disclosure by companies is a critical first step to enable investors to assess climate change risk. While disclosure of operational-based emissions by companies in emission intensive sectors is generally positive, many do not disclose equity-based emissions, which is much more relevant to investors. In addition, past historical emission may not adequately reflect the emissions associated with future earnings upon which company value is assessed. Given the issue of climate change and disclosure by companies is something that has been on investors’ agendas for more than ten years, it is time that companies adequately report on their emissions. An inability of companies to do so raises questions about whether they adequately understand and are managing their climate change risks.