Embed Size (px)
Citation preview
Green Train energy consumption
Estimations on high-speed rail operations
by
Piotr Lukaszewicz
Evert Andersson
KTH Railway Group
Stockholm 2009
ISBN 978-91-7415-257-9
Postal Address Royal Institute of Technology Aeronautical and Vehicle Engineering Rail Vehicles SE-100 44 Stockholm
Visiting address Teknikringen 8 Stockholm
Telephone +46 8 790 84 76 Fax +46 8 790 76 29
www.kth.se/fakulteter/centra/jarnvag
i
Abstract In the Swedish research and development program ‘Gröna Tåget’ (the Green Train) environmental performance and energy efficiency is one of the major goals. Another important goal is to reduce travel time and thus increase speed compared with recent trains. The future Green Train will be designed for a top speed of about 250 km/h on existing lines and in the order of 300 km/h if required on planned new high-speed lines. Today’s trains in Sweden have a top speed of 200 km/h.
Low energy consumption at increased speeds requires a new train concept and design, using the most modern technologies and knowledge available. The main alternative for the future Green Train is a wide-body concept, conveying some 25 % more passengers than a train with standard carbody width. Further, the new train will be of motor-coach type, thus a separate locomotive is not needed. This concept makes the train more compact and light for the equivalent number of seats. A high-powered electric regenerative brake is also envisaged, operating on at least 50 % of the axles. These brakes make it possible to brake the train before stops and on downhill gradients while regenerating a considerable amount of energy, still having a high braking rate and thus being able to keep the timetable.
A third measure is to improve the aerodynamic performance, in particular to reduce the aerodynamic resistance of the train. Two levels of aerodynamic performance are investigated; one with modest ambitions for 250 km/h and another one with very high goals also for speeds around 300 km/h.
In order to evaluate proposed measures the energy consumption and running time have been estimated by means of simulation. Time margins are added to simulated time in order to end up with a realistic travel time. This is done for a number of cases regarding operating speed and different driving styles, including ‘eco-driving’ with maximum use of regenerative electrical brakes. Two representative railway lines have been studied; the first one is the existing main line Stockholm-Göteborg (Gothenburg), the other is a planned new high-speed line between the same cities. On the latter a certain amount of tunnels is planned, which to some extent increases aerodynamic resistance and energy consumption. Comparisons are made with a reference train, the current high-speed train X 2000. Despite reduced travel time, higher speeds and other aggravating factors, estimations show possibilities to reduce energy consumption in the order of 30 – 40 % per passenger-km in most cases, compared with the reference train.
Regenerative brakes can be used without loosing more than about 1 % of travel time for a stopping high-speed train. This is estimated to result in more than 20 % energy regeneration on the existing line and in the order of 30 % on the planned high-speed line, the latter with a lot of gradients up and down.
Reduced aerodynamic resistance will be necessary. A high goal on this matter will result in a train with superior energy performance, which would have benefits both in economic terms and for ethical and marketing reasons.

iii
Preface and acknowledgements This study is part of the Swedish ‘Gröna Tåget’ (the Green Train) research and development program. It has been carried out at the Royal Institute of Technology (KTH) in Stockholm, Division of rail Vehicles. In the Green Train program KTH is responsible for general research co-ordination as well as for specialised research and development in a number of areas, including estimations of energy consumption.
Major funding in the Green Train program is provided by the Swedish Rail Administration (Banverket) and Bombardier Transportation, with in-kind contributions also from the Association of Swedish Train Operators (Tågoperatörerna) and the train leasing company Transitio. For this study the financial support is received from Banverket.
In this study Dr Piotr Lukaszewicz has provided most of the data required and has also performed all energy and running time simulations. Prof Evert Andersson has provided some additional data and has written the majority of this report.
Most valuable information on aerodynamic issues was received from Dr. Ben Diedrichs at Bombardier Transportation (partly also a staff member at KTH). The support from him is gratefully acknowledged.
Information on new high-speed lines has been received from Dr Oskar Fröidh at KTH Division of Traffic and Logistics as well as from Mr John Fridlund at Railize and Banverket. General information on new propulsion systems has been received from Prof Stefan Östlund at KTH Div of Electrical Machines and Drives.
Stockholm in February 2009
Piotr Lukaszewicz Evert Andersson Dr Tech Professor

v
Content
Abstract ............................................................................................................................................. i
Preface and acknowledgements ................................................................................................... iii
Content ............................................................................................................................................. v
1 Introduction ..................................................................................................................................... 1
1.1 The Green Train ............................................................................................ 1
1.2 Energy consumption in high-speed operations ..................................................... 2
1.3 Scope of the study ..................................................................................................... 2
2 Method and simulation tool ...................................................................................................... 3
2.1 Methodology .............................................................................................................. 3
2.2 Simulation tool ERTSim - general description ...................................................... 3
2.3 Simulation tool ERTSim - on its accuracy .............................................................. 4
3 Trains, infrastructure, operation etc ......................................................................................... 7
3.1 Two railway lines studied ........................................................................................... 7
3.2 Train scenarios ............................................................................................................ 9
3.3 Operational scenarios .............................................................................................. 16
3.4 What is included in estimated energy? .................................................................. 17
4 Estimated energy consumption and travel time ........................................................ 18 4.1 Results for existing line 'Västra Stambanan' ......................................................... 18
4.2 Results for future line 'Ostlänken-Götalandsbanan' ........................................... 19
4.3 Comparison between ERTSim and a commercial simulation tool ................... 21
5 Summary and conclusions ...................................................................................................... 22
5.1 Main results ............................................................................................................... 22
5.2 Influence of different features and conditions .................................................... 23
5.3 The values of low aerodynamic resistance ........................................................... 25
References 27

1
1 Introduction 1.1 The Green Train The Green Train – in Swedish ‘Gröna Tåget’ – is a research, development and demonstration program intended to strengthen the capabilities for specification, acquisition and development of future high-speed trains for Swedish and Nordic conditions. A new train generation should be developed for high economic efficiency, high environmental performance and for attractiveness to passengers. Low energy consumption is one of the important and basic goals. Another goal is to make it possible to develop a train for reduced travel time, operating both on existing lines at a top speed of about 250 km/h as well as on future new high-speed lines at speeds in the order of 300 km/h if required.
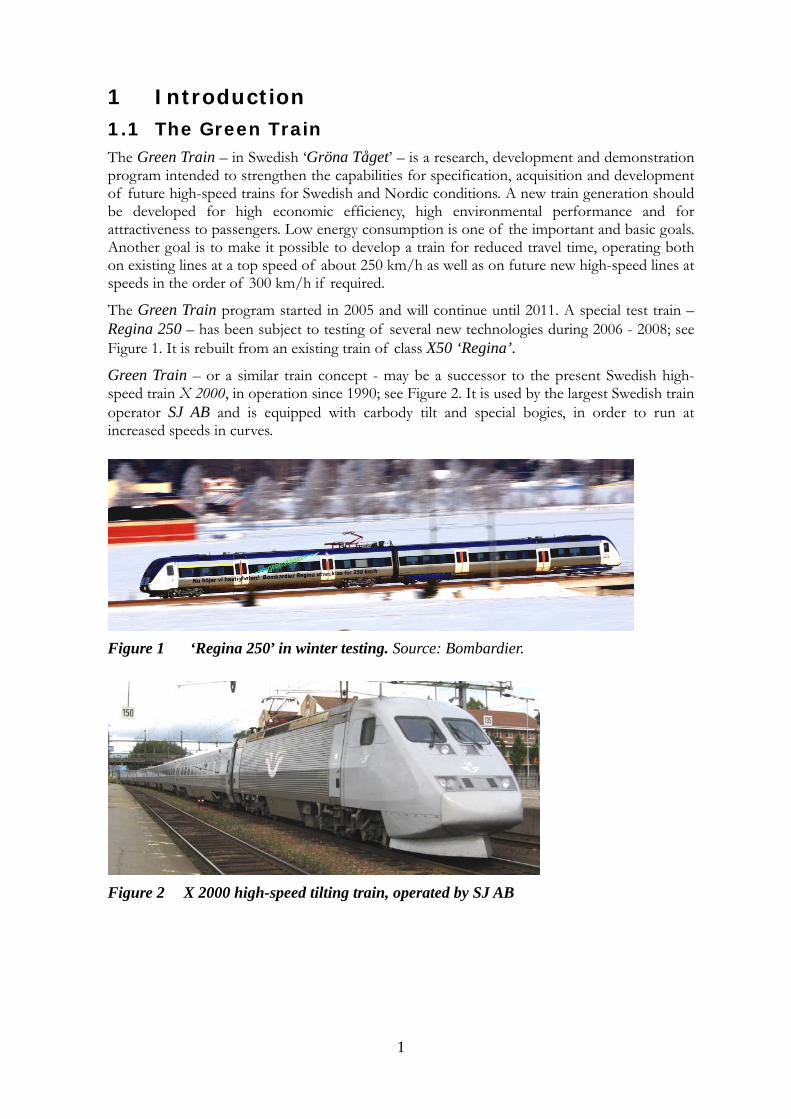
The Green Train program started in 2005 and will continue until 2011. A special test train – Regina 250 – has been subject to testing of several new technologies during 2006 - 2008; see Figure 1. It is rebuilt from an existing train of class X50 ‘Regina’.
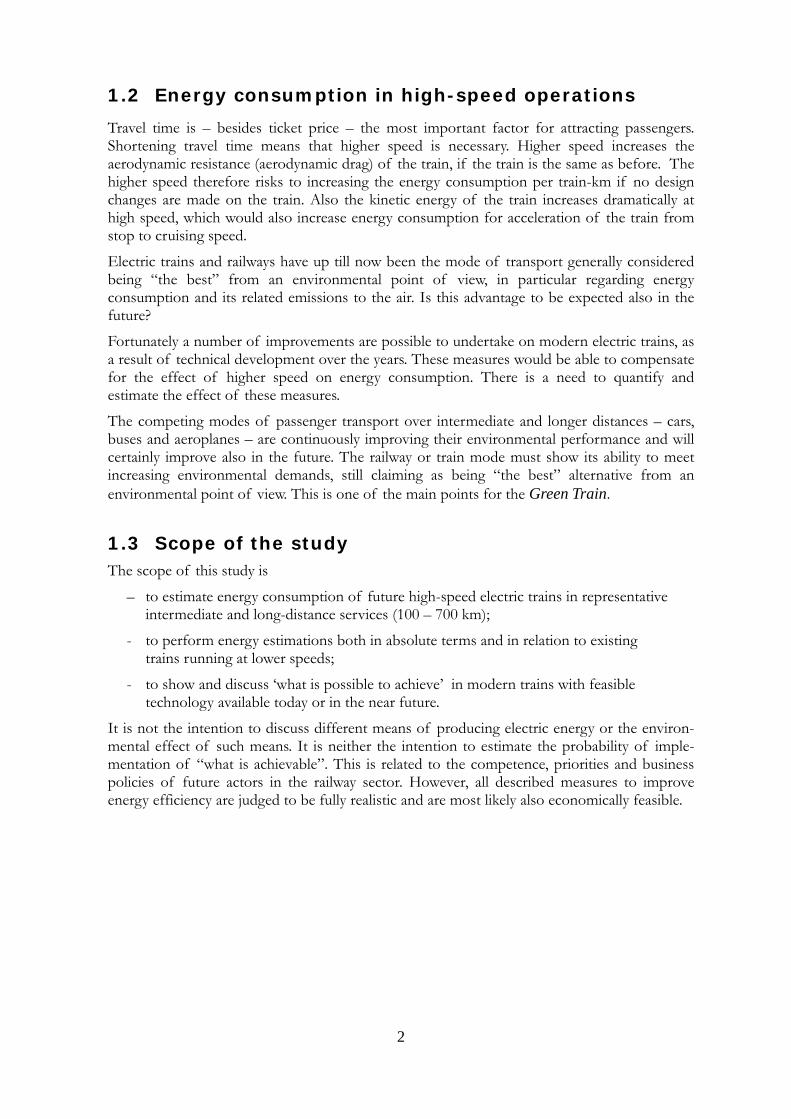
Green Train – or a similar train concept - may be a successor to the present Swedish high-speed train X 2000, in operation since 1990; see Figure 2. It is used by the largest Swedish train operator SJ AB and is equipped with carbody tilt and special bogies, in order to run at increased speeds in curves.
Figure 1 ‘Regina 250’ in winter testing. Source: Bombardier.
Figure 2 X 2000 high-speed tilting train, operated by SJ AB
2
1.2 Energy consumption in high-speed operations
Travel time is – besides ticket price – the most important factor for attracting passengers. Shortening travel time means that higher speed is necessary. Higher speed increases the aerodynamic resistance (aerodynamic drag) of the train, if the train is the same as before. The higher speed therefore risks to increasing the energy consumption per train-km if no design changes are made on the train. Also the kinetic energy of the train increases dramatically at high speed, which would also increase energy consumption for acceleration of the train from stop to cruising speed.
Electric trains and railways have up till now been the mode of transport generally considered being “the best” from an environmental point of view, in particular regarding energy consumption and its related emissions to the air. Is this advantage to be expected also in the future?
Fortunately a number of improvements are possible to undertake on modern electric trains, as a result of technical development over the years. These measures would be able to compensate for the effect of higher speed on energy consumption. There is a need to quantify and estimate the effect of these measures.
The competing modes of passenger transport over intermediate and longer distances – cars, buses and aeroplanes – are continuously improving their environmental performance and will certainly improve also in the future. The railway or train mode must show its ability to meet increasing environmental demands, still claiming as being “the best” alternative from an environmental point of view. This is one of the main points for the Green Train.
1.3 Scope of the study The scope of this study is
– to estimate energy consumption of future high-speed electric trains in representative intermediate and long-distance services (100 – 700 km);
- to perform energy estimations both in absolute terms and in relation to existing trains running at lower speeds;
- to show and discuss ‘what is possible to achieve’ in modern trains with feasible technology available today or in the near future.
It is not the intention to discuss different means of producing electric energy or the environ-mental effect of such means. It is neither the intention to estimate the probability of imple-mentation of “what is achievable”. This is related to the competence, priorities and business policies of future actors in the railway sector. However, all described measures to improve energy efficiency are judged to be fully realistic and are most likely also economically feasible.
3
2 Method and simulation tool
2.1 Methodology In this study computer simulations are used for estimations of possible energy consumption (e.g. energy usage) in future high-speed train operations. These simulations are applied on a preliminary train concept developed within the Green Train R&D program. As a main alternative the train is anticipated to consist of 4-car trainsets, being run alone or multipled two or three together. On the main lines – where the highest speeds are anticipated – one or two trainsets will be used most of the time, occasionally up to there trainsets.
In order to simplify in this study, a 6-car trainset is simulated, being the average between a 4-car and an 8-car train. As each 4-car trainset is anticipated to accommodate around 310 seats, the simulated 6-car trainset will accommodate 465 seats. For train description; see section 3.2.
The procedure is as follows:
Step 1: Energy consumption at the pantograph level of the train is simulated; see simulation tool description in Section 2.2 and 2.3 below.
In order to be able to make straight-forward comparisons with earlier energy studies [2, 3] two additional contributions are made in Step 2 and Step 3.
Step 2: An additional contribution for idling outside scheduled service is added. This is accomplished in a simplified way by adding 2 % to the energy as simulated in Step 1, which is in accordance with an earlier study [3].
Step 3: Average losses in the electric power supply system of the infrastructure (catenary and converter stations) are added as a percentage additional contribution. This contribution is assumed to be 14 % of the ‘pantograph’ power, being an average for Banverket’s supply system in 2003-04 [2]. This assumption may be on the conservative high side for future applications, since the supply system will likely be continuously renewed and improved.
Several operational scenarios are investigated, i.e. various top speeds, various number of station stops and various driving styles. At the last stage the energy consumption of an assumed representative mix of operational scenarios is estimated.
The simulation tool/computer program used for the estimations of energy consumption (and running time) is ERTSim (Energy and Running Time Simulator), developed by the Division of Rail Vehicles at KTH. The quality of results is dependent on the simulation tool used. Therefore, a short relevant description of the tool and its features is given in the sections below.
2.2 Simulation tool ERTSim - general description ERTSim is designed to calculate the energy consumption and running times of trains in parti-cular with respect to train driver behaviour so the impact of different driving strategies or driving styles can be studied. ERTSim is programmed in MATLAB and is therefore flexible and gives the user freedom of choice concerning the usage of various variables and parame-ters, such as running resistance, electrical efficiency, wheel-rail adhesion or driver behaviour. ERTSim can therefore be regarded as a ¨test bench¨ where different types of trains having different properties can be compared with each other and with measured on-track results on authentic trains in regular operation. ERTSim was originally developed for studies of energy consumption and running times for freight trains but has evolved into a tool which can perform simulations of any type of train, such as loco-hauled passenger trains, regional trains and high-speed trains.

4
ERTSim consists mainly of 3 parts or modules which calculate desired variables per time step. Figure 3 shows a schematic view of the system.
Driver. This module calculates the driver actions which are ‘powering’, ‘mechanical braking’ and ’regenerative electrical braking’ or a blend of these braking modes. Coasting is achieved by zero powering and braking. The driver module determines from internal logic and the input data which driver action is to be taken, when this should occur and the duration and level of the action. The output to the train module (see below) is the powering or braking level as well as the mode of braking (mechanical, regenerative electrical or blended).
Infra. This module contains basic track data such as gradients (up and down), position of gradients, position of stations stops and temporary stops and permitted speed, all needed for the driver and train modules.
Train. This module contains equations of motion and energy consumption, further the train model, including masses, running resistance, tractive/braking effort and energy efficiency (or energy losses). The train module calculates (per time step) acceleration or deceleration of the train, speed, position, energy consumption etc.
ERTSim is verified towards full-scale measurements and is proven to have good precision and accuracy in calculated energy consumption and running time; see following section.
2.3 Simulation tool ERTSim – on its accuracy To show that it is possible to achieve good agreement between train model simulations and reality with respect to running time and energy consumption, some representative examples are presented in this section.
Originally the simulation model was developed for freight trains [1], usually requiring a more complex and demanding model than modern passenger trains. To a large extent this is due to the delay in braking action in long freight trains. The accuracy of the freight train model was originally verified against full-scale measurements. The virtual simulated train and the real train are driven by the same driver in exactly the same way. The driver actions were recorded during full-scale measurements and are used as input variables into the virtual train. The model development and verification procedure is more precisely reported in [1].
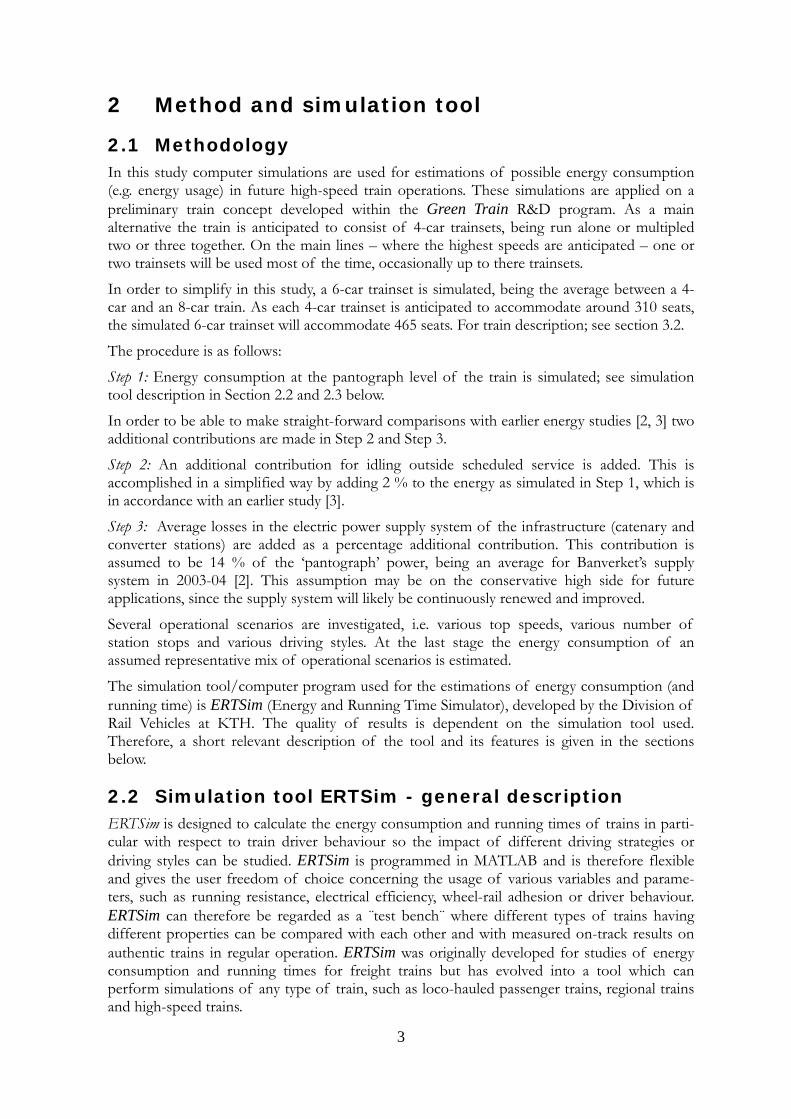
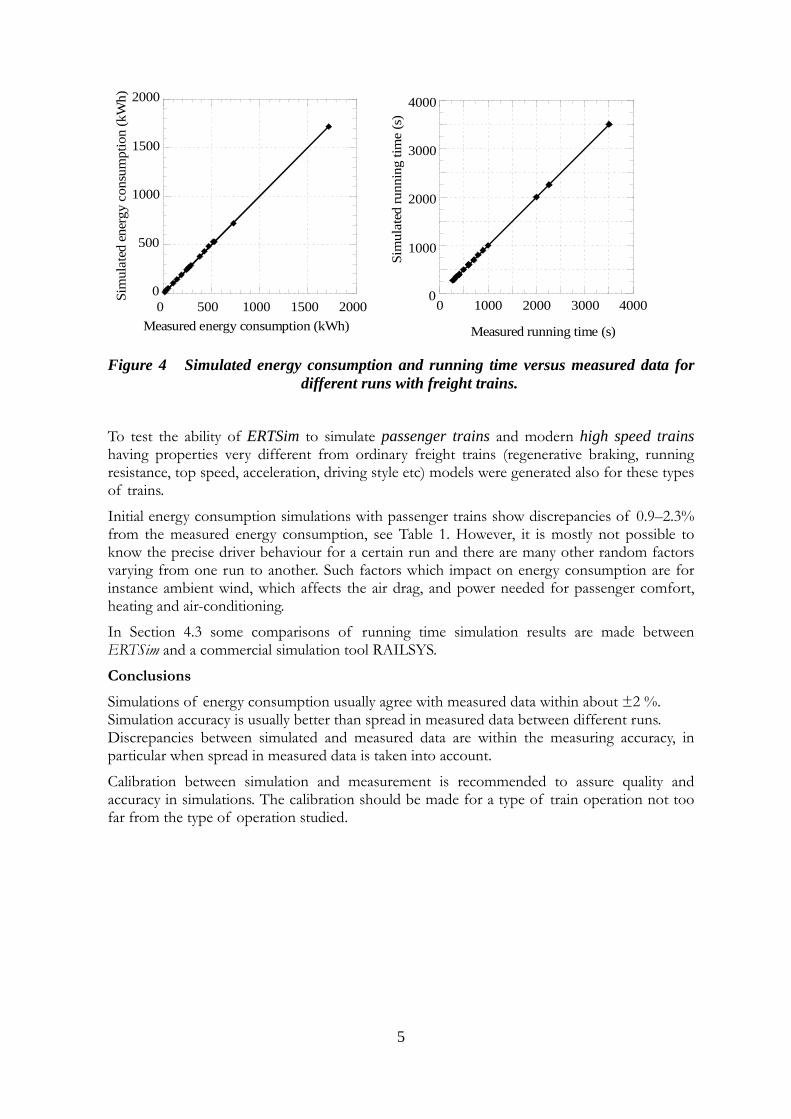
These procedures showed that important factors, beside the train model itself, affecting the results of simulations, are the track- and signalling data, driving style and environmental weather data such as wind and temperature. After the driving style was tuned, the discrepancy in energy consumption, was in the range of 0.5 - 1.0 %; running time showed a still better agreement. See Figure 4.
Driver Train
Infra
Driver actions
Output: - acceleration, speed, distance - consumption - emission of pollutants - etc...
Figure 3 Schematic drawing of the Energy and Running Time Simulator - ERTSim
5
Figure 4 Simulated energy consumption and running time versus measured data for different runs with freight trains.
To test the ability of ERTSim to simulate passenger trains and modern high speed trains having properties very different from ordinary freight trains (regenerative braking, running resistance, top speed, acceleration, driving style etc) models were generated also for these types of trains.
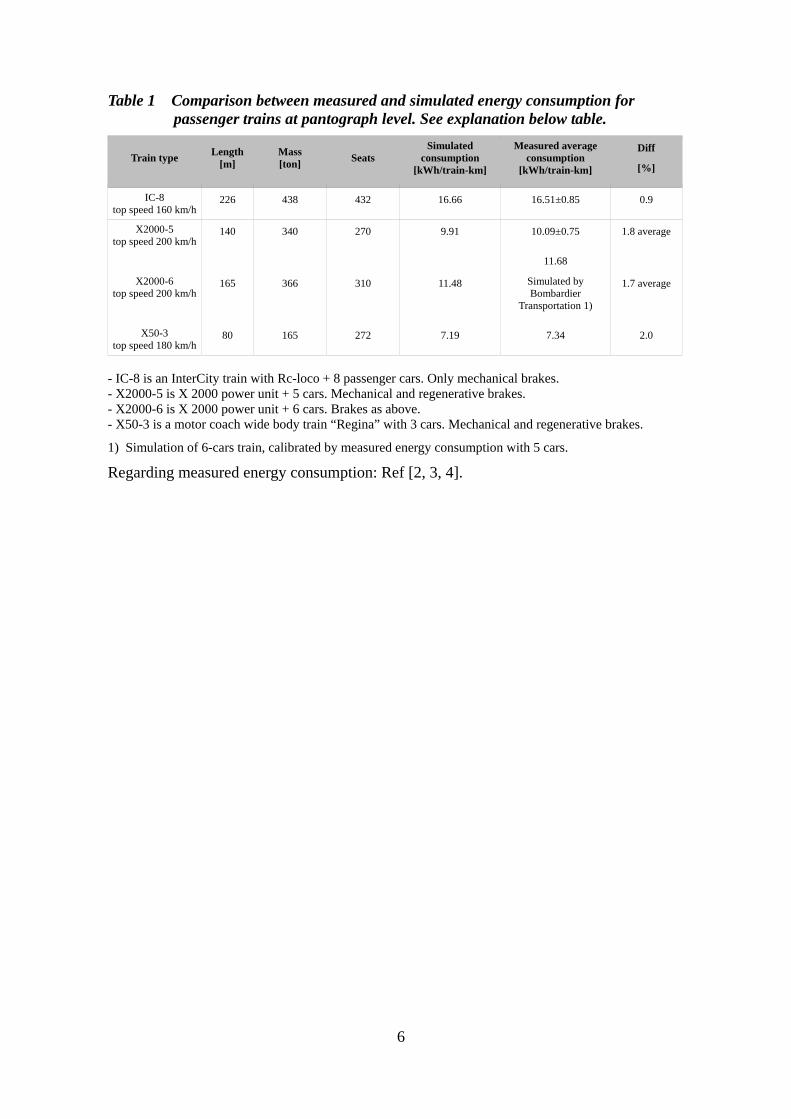
Initial energy consumption simulations with passenger trains show discrepancies of 0.9–2.3% from the measured energy consumption, see Table 1. However, it is mostly not possible to know the precise driver behaviour for a certain run and there are many other random factors varying from one run to another. Such factors which impact on energy consumption are for instance ambient wind, which affects the air drag, and power needed for passenger comfort, heating and air-conditioning.
In Section 4.3 some comparisons of running time simulation results are made between ERTSim and a commercial simulation tool RAILSYS.
Conclusions
Simulations of energy consumption usually agree with measured data within about ±2 %. Simulation accuracy is usually better than spread in measured data between different runs. Discrepancies between simulated and measured data are within the measuring accuracy, in particular when spread in measured data is taken into account.
Calibration between simulation and measurement is recommended to assure quality and accuracy in simulations. The calibration should be made for a type of train operation not too far from the type of operation studied.
0
500
1000
1500
2000
0 500 1000 1500 2000
Sim
ulat
ed e
nerg
y co
nsum
ptio
n (k
Wh)
Measured energy consumption (kWh)
0
1000
2000
3000
4000
0 1000 2000 3000 4000
Sim
ulat
ed ru
nnin
g tim
e (s
)
Measured running time (s)
6
Table 1 Comparison between measured and simulated energy consumption for passenger trains at pantograph level. See explanation below table.
Train type Length[m]
Mass [ton] Seats
Simulated consumption
[kWh/train-km]
Measured average consumption
[kWh/train-km]
Diff
[%]
IC-8 top speed 160 km/h
226 438 432 16.66 16.51±0.85 0.9
X2000-5 top speed 200 km/h
140 340 270 9.91 10.09±0.75 1.8 average
X2000-6 top speed 200 km/h
165 366 310 11.48
11.68
Simulated by Bombardier
Transportation 1)
1.7 average
X50-3 top speed 180 km/h
80 165 272 7.19 7.34 2.0
- IC-8 is an InterCity train with Rc-loco + 8 passenger cars. Only mechanical brakes. - X2000-5 is X 2000 power unit + 5 cars. Mechanical and regenerative brakes. - X2000-6 is X 2000 power unit + 6 cars. Brakes as above. - X50-3 is a motor coach wide body train “Regina” with 3 cars. Mechanical and regenerative brakes.
1) Simulation of 6-cars train, calibrated by measured energy consumption with 5 cars.
Regarding measured energy consumption: Ref [2, 3, 4].
7
3 Trains, infrastructure, operation etc Future energy consumption is estimated for variants of new high speed trains – the Green Train – as well as the reference train X 2000, on two different lines between Stockholm and Gothenburg (Göteborg). The two lines are ‘Västra Stambanan’ and ‘Götalandsbanan’. These lines are judged to be representative for future high-speed operations in Sweden. See Section 3.1 below.
Different scenarios for trains and their assumed operations are considered; see Sections 3.2 and 3.3. Train specifications in Section 3.2 should be considered as ‘what is possible to achieve’ and what judged within the Green Train program to be feasible technically and economically. These specifications are, of course, not necessarily what will eventually be developed by train suppliers or specified and ordered by train owners and operators.
3.1 Two railway lines studied 3.1.1 General
‘Västra Stambanan’ is an existing line having a currently permitted top speed of 180 - 200 km/h (for particular fast trains) on about 90 % of its length. The line is assumed to be upgraded for 195 - 250 km/h in the future. To reduce travel time the cant deficiency (lateral track-plane acceleration) needs to be increased in the numerous curves. For details on trains; see Section 3.2.
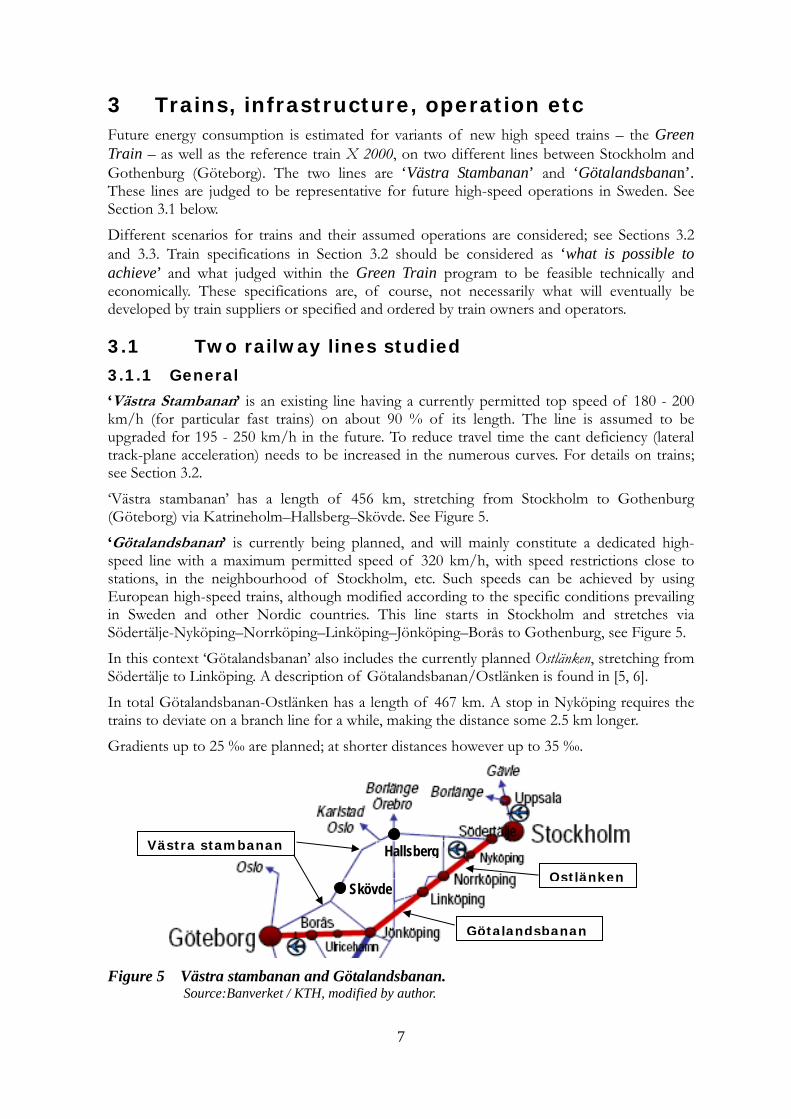
‘Västra stambanan’ has a length of 456 km, stretching from Stockholm to Gothenburg (Göteborg) via Katrineholm–Hallsberg–Skövde. See Figure 5.
‘Götalandsbanan’ is currently being planned, and will mainly constitute a dedicated high-speed line with a maximum permitted speed of 320 km/h, with speed restrictions close to stations, in the neighbourhood of Stockholm, etc. Such speeds can be achieved by using European high-speed trains, although modified according to the specific conditions prevailing in Sweden and other Nordic countries. This line starts in Stockholm and stretches via Södertälje-Nyköping–Norrköping–Linköping–Jönköping–Borås to Gothenburg, see Figure 5.
In this context ‘Götalandsbanan’ also includes the currently planned Ostlänken, stretching from Södertälje to Linköping. A description of Götalandsbanan/Ostlänken is found in [5, 6].
In total Götalandsbanan-Ostlänken has a length of 467 km. A stop in Nyköping requires the trains to deviate on a branch line for a while, making the distance some 2.5 km longer.
Gradients up to 25 ‰ are planned; at shorter distances however up to 35 ‰.
Figure 5 Västra stambanan and Götalandsbanan. Source:Banverket / KTH, modified by author.
Götalandsbanan
Västra stambanan
Skövde
HallsbergOstlänken
8
3.1.2 Power supply efficiency
The supply system for electrical power along the lines comprises
- converter stations (converting from 50 Hz high voltage from the public grid to 15 kV with frequency 16 2/3 Hz)
- the catenary, i.e. the electrical wire above the track.
The exact characteristics of energy losses and energy efficiency in future power supply systems are not known, nor investigated in this study. Considering the scope of the study – to estimate energy consumption of future trains, in particular in relation to existing high-speed trains – we have assumed the same characteristics of the Swedish rail power supply system as of today, or more exactly in the years 2003-2004 as used in an earlier study [3]. The assumed energy efficiencies are
- in converter stations: 91.5 %
- in catenary: 96 % for modern trains with current and voltage approximately in phase
In total the energy efficiency is 0.915 x 0.96 ≈ 0.88 on average.
This is equivalent with an additional contribution of about 14 % to be added to the energy intake to the train’s pantograph (i.e. current collector on the roof).
The above estimation based on the recent system is believed to be representative also in the future, as long as losses and energy efficiency are concerned.
3.1.3 Tunnels
Due to the high speeds all curve radii on newly built high-speed lines will be large. This makes it challenging to adapt the line to the local conditions - hills and valleys, lakes and rivers, villages and other settlement, etc. Part of the line will therefore run through tunnels.
When a train is running in a tunnel the air around it will accelerate significantly, compared to the open air situation. In small enough tunnels this may cause a strong augmentation of the aerodynamic resistance of the train.
On existing lines, usually 1-2 % runs inside tunnels, on basis of a total end-to-end distance of a Swedish main line. On future dedicated high-speed lines the share of tunnels is expected to increase considerably. The most advanced plans are for the part called ‘Ostlänken’, the planned high-speed line stretching from a point 44 km south of Stockholm C to Linköping, a total length of 155 km. On this line 14.4 km will run inside tunnels [7], of which:
- 9.5 km in single-track tunnels; cross section area 68 m2 (total tunnel length 19 km)
- 4.9 km in double-track tunnels, cross section area 123 m2. Approximately 6 % and 3% of the ‘Ostlänken’ line will run in single- and double-track tunnels, respectively. These figures are here assumed to be representative also for the train operations. The topological conditions on ‘Ostlänken’ are partly quite hilly, as a result of crossing the hilly ‘Kolmården’ area. On average, the prospects of tunnels for ‘Götalandsbanan’ as a whole should be somewhat similar. Therefore the same share of tunnels compared to ‘Ostlänken’ is here assumed for the rest of ‘Götalandsbanan´.
Note that the tunnel areas listed above are preliminary and should be seen as an average of several options. However, it should be emphasized that the tunnel area of singe-track tunnels may become critical to the aerodynamic drag and thus to overcoming the total running resistance of high-speed operation. More on this is found in Section 3.2.4.
9
3.2 Train scenarios Different variants of the future Green Train are studied. The existing high-speed train X 2000 is included in the study as being the reference.
3.2.1 Train configurations
The future Green Train should be used in long och medium distance services (100 - 700 km) as well as fast regional service. The length and capacity of the train should be adapted to the actual need depending on time and the cities to be served. As a basic unit a 4-car trainset is assumed; see Figure 6. Longer trains can be derived by running up to three such trainsets in the same train. However, the choice of 4-car trainsets as a basis in the Green Train program should not exclude the possibility of other concepts.
In this study long and medium distance services are studied. On the Swedish main lines we expect a need for future trainsets accommodating about 300 seats in off-peak time and 600 seats in peak time. About 300 seats, or slightly more, can be comfortably accommodated in a 4-car wide-body trainset with efficient space utilization. A mix of 4-car and 8-car trains on the Swedish main lines may therefore be expected in the future.
Most single-deck European high-speed trains have 1.8 – 2.2 seats per meter train, while the Japanese Shinkansen has about 3.3. This difference is not only decisive for energy consumption per seat-km; it is also a key factor for the economic efficiency and a low production cost. The reasons for the much higher efficiency on Shinkansen are mainly (1) a wide carbody allowing one more seat to be placed over the width of the car, (2) trolley catering (i.e. no bistro or restaurant car) and (3) a straight-forward seat layout with long rows of seats with few interruptions. The leg space is, however, very generous.
These reasons are to a large extent behind the fact that the Shinkansen trains are considered to be among the most energy-efficient trains in the world, also being one of the fastest trains. According to author’s information the energy consumption is around 50 Wh per seat-km.
Regarding Green Train the efficient space utilization is mainly due to
(1) motor-coach concept (as opposed to a separate locomotive); (2) wide car bodies, allowing one more seat over the width of the train; (3) somewhat longer cars compared with most previous Swedish and European high-speed trains; (4) more compact and efficient seat arrangement without infringing passenger comfort. This is mainly accomplished by seats having more leg space despite some 5–10 cm tighter seat pitch than most previous long-distance trains. In total these factors have a considerable influence on the space utilization and the train’s economy and energy efficiency. With up to 310 seats in a 4-car train (still with bistro and 25 % 1st class accommodation) the number of seats per meter of train is 2.9, compared with 3.3 for Japanese high-speed trains but only 1.8 – 2.2 for comparable European trains.
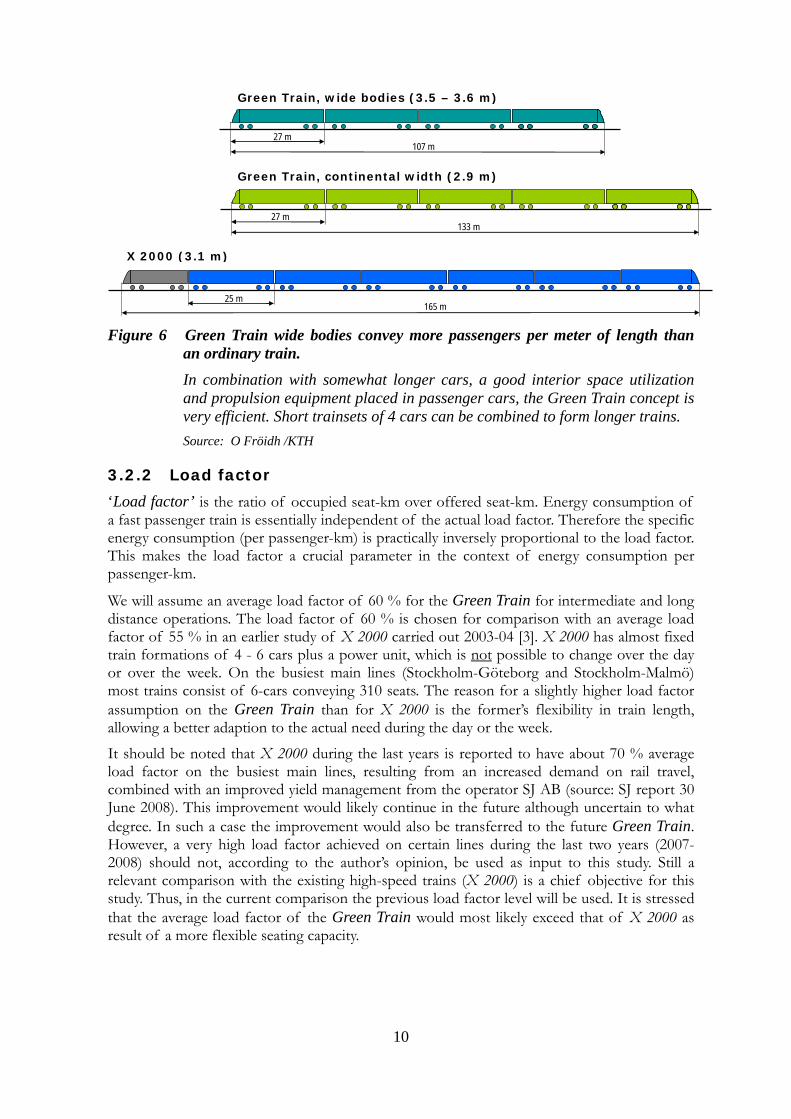
To simplify this study estimates are made on a 6-car train as being an average of all high-speed services on medium and long distances. Such a train is assumed to normally convey 465 seats, in mixed premium and economy class; about 25 % and 75 % respectively. The average train length will then be about 160 m with a mass of about 360 ton (including 60 % passenger load); see further Table 3.
The reference train X 2000 has a length of 165 m and conveys 310 seats; see Figure 6 and Table 3.
10
107 m27 m
133 m27 m
165 m25 m
GTW: Gröna tåget, breda korgar
GTC: Gröna tåget, kontinental bredd
X 2000
Figure 6 Green Train wide bodies convey more passengers per meter of length than
an ordinary train.
In combination with somewhat longer cars, a good interior space utilization and propulsion equipment placed in passenger cars, the Green Train concept is very efficient. Short trainsets of 4 cars can be combined to form longer trains. Source: O Fröidh /KTH
3.2.2 Load factor
‘Load factor’ is the ratio of occupied seat-km over offered seat-km. Energy consumption of a fast passenger train is essentially independent of the actual load factor. Therefore the specific energy consumption (per passenger-km) is practically inversely proportional to the load factor. This makes the load factor a crucial parameter in the context of energy consumption per passenger-km.
We will assume an average load factor of 60 % for the Green Train for intermediate and long distance operations. The load factor of 60 % is chosen for comparison with an average load factor of 55 % in an earlier study of X 2000 carried out 2003-04 [3]. X 2000 has almost fixed train formations of 4 - 6 cars plus a power unit, which is not possible to change over the day or over the week. On the busiest main lines (Stockholm-Göteborg and Stockholm-Malmö) most trains consist of 6-cars conveying 310 seats. The reason for a slightly higher load factor assumption on the Green Train than for X 2000 is the former’s flexibility in train length, allowing a better adaption to the actual need during the day or the week. It should be noted that X 2000 during the last years is reported to have about 70 % average load factor on the busiest main lines, resulting from an increased demand on rail travel, combined with an improved yield management from the operator SJ AB (source: SJ report 30 June 2008). This improvement would likely continue in the future although uncertain to what degree. In such a case the improvement would also be transferred to the future Green Train. However, a very high load factor achieved on certain lines during the last two years (2007-2008) should not, according to the author’s opinion, be used as input to this study. Still a relevant comparison with the existing high-speed trains (X 2000) is a chief objective for this study. Thus, in the current comparison the previous load factor level will be used. It is stressed that the average load factor of the Green Train would most likely exceed that of X 2000 as result of a more flexible seating capacity.
Green Train, continental width (2.9 m)
Green Train, wide bodies (3.5 – 3.6 m)
X 2000 (3.1 m)
11
3.2.3 Speed and carbody tilt Most existing lines in Sweden and other countries, including ‘Västra stambanan’, have a large amount of curves where speed-limits apply. To achieve competitive travel times, high-speed trains should be able to negotiate curves with considerably higher speed and cant deficiency (equivalent with lateral track-plane acceleration) than conventional trains. The current trains X 2000 are therefore equipped with carbody tilt, to reduce lateral acceleration as perceived by passengers when curving. The future Green Train is assumed to have the same features, although with higher performance than X 2000 [11]. Permitted cant deficiency is
- 245 mm (1.60 m/s2) for X 2000 - 305 mm (2.0 m/s2) for Green Train (target, at least for occasional use).
This practically means, for example, that in a curve with a horizontal radius of 1000 m and a track cant of 140 mm (typical for current Swedish main lines) a speed of 180 km/h is allowed for X 2000, while Green Train will be targeted to run at 190 km/h in the same curve. However it is suggested that track cant is raised to a maximum of 160 mm (compatible with recent European standards), which will allow a further increase of the speed to 195 km/h for the curve in question. With equivalent procedures the permitted speed in 1200 m radius curves (also quite typical) will be 215 km/h instead of 200 km/h. On parts of ‘Västra stambanan’ speeds can be raised to 250 km/h instead of 200 km/h why curves will no longer have speed restrictions. The above-mentioned performance is judged to be realistic supposed that train and infrastructure are adapted appropriately; see for example [11].
Carbody tilt is assumed to be applied for Green Train also on ‘Götalandsbanan’, however only on some limited sections where tilt will increase permitted speed. In these ‘tilting’ cases the Green Train maximum permitted speed is set to 250 km/h. This means that the Green Train is able to run at some limited sections, e.g. south of Stockholm, at higher permitted speed than a train without carbody tilt. About two minutes of travel time may be earned in this way.
3.2.4 Propulsion performance and aerodynamic resistance
Green Train simulations are performed with models comprising features such as speed-dependent tractive effort, speed dependent regenerative and mechanical braking, auxiliary and comfort power as well as electrical and mechanical energy efficiency. Two types of Green Train models are considered. They differ from each other mainly with respect to aerodynamic resistance, usually called aerodynamic drag or, simply, air drag.
Generally and somewhat simplified the running resistance FR of a train on level straight track can be written as
FR = A + B v + C v2 ……………….. (1) where v is train speed. The two last terms expresses (mainly) the aerodynamic drag of the train, where a large part of the B-coefficient represents the impulse resistance due to ventilation and cooling purposes. At higher speeds (say over 100 km/h) the last term with the C-coefficient is usually dominating. The speed-independent A-coefficient expresses the mechanical resistance, sometimes called rolling resistance.
Two versions of the future Green Train are studied, referred to as GT-250 and GT-VHST. Main data for these trains are shown in Table 3, which includes the running resistance coefficients A, B and C.
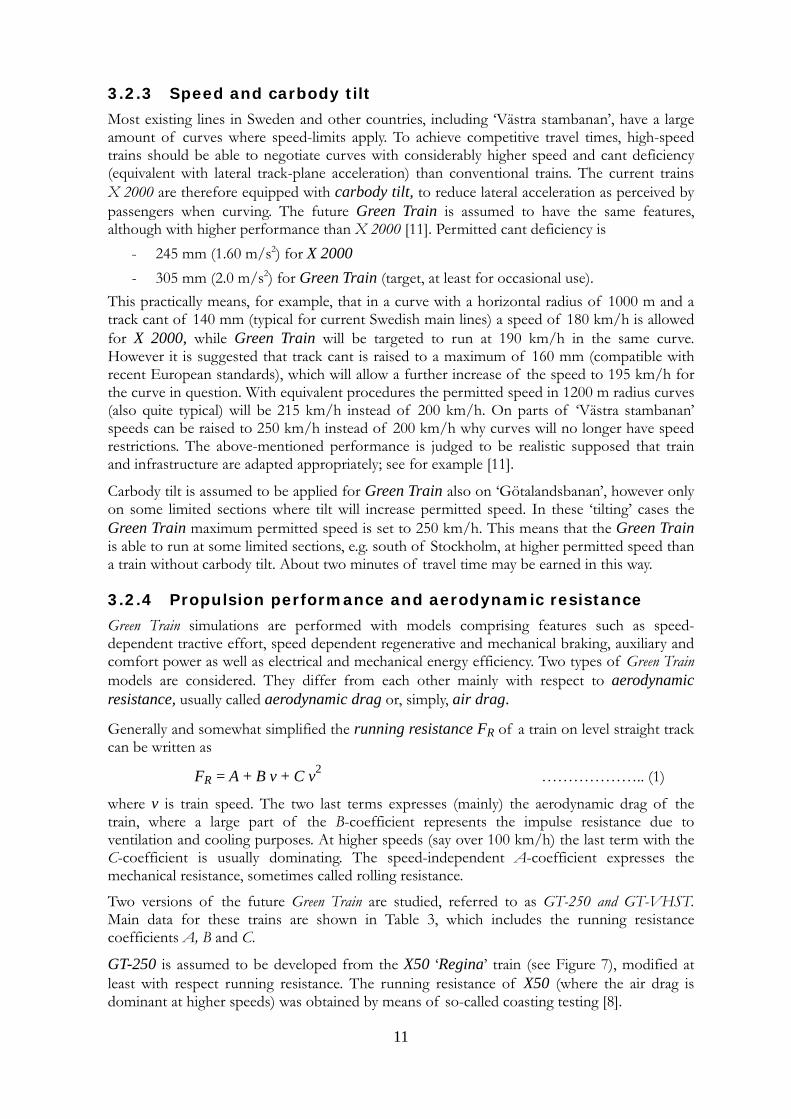
GT-250 is assumed to be developed from the X50 ‘Regina’ train (see Figure 7), modified at least with respect running resistance. The running resistance of X50 (where the air drag is dominant at higher speeds) was obtained by means of so-called coasting testing [8].
12
Figure 7 X50 ‘Regina’ as a test train
In relation to X50 the GT-250 is improved, where in particular the nose and tail are adequately streamlined plus that some of the roof equipment is shielded from the air stream. Also the bogie shielding may be subject to some simpler changes. According to the authors this is a mandatory improvement for a train designed for 250 km/h compared to 180-200 km/h.
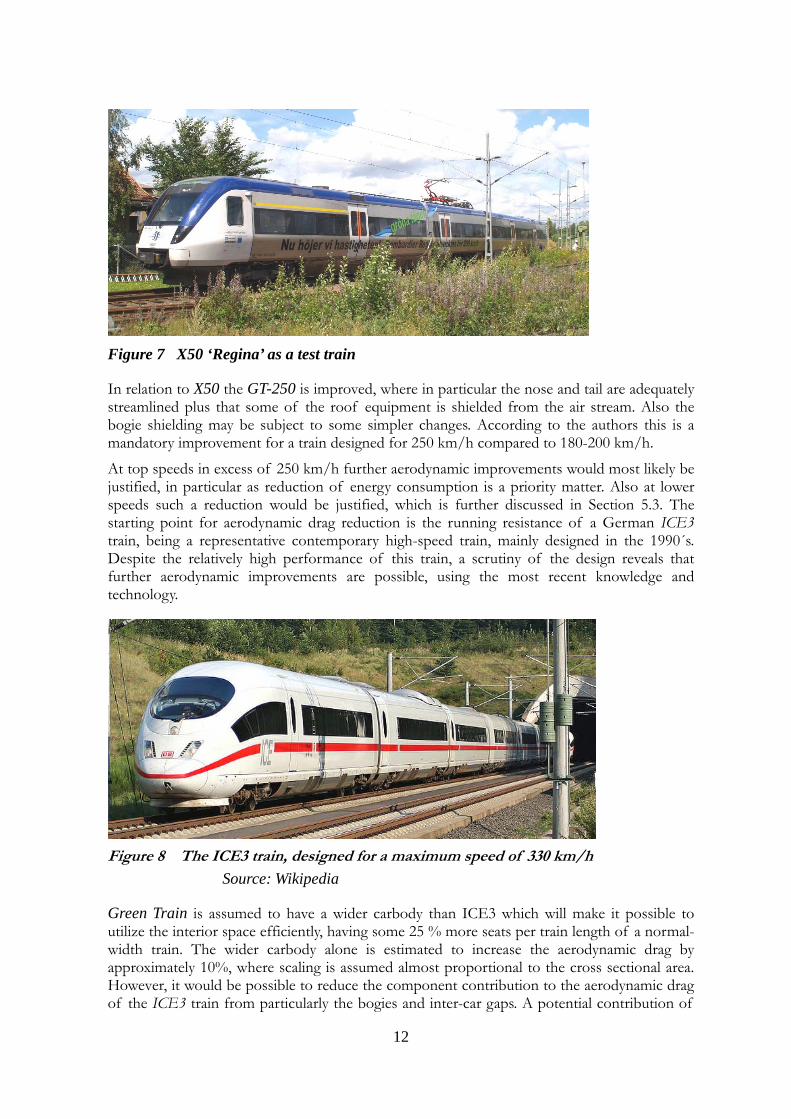
At top speeds in excess of 250 km/h further aerodynamic improvements would most likely be justified, in particular as reduction of energy consumption is a priority matter. Also at lower speeds such a reduction would be justified, which is further discussed in Section 5.3. The starting point for aerodynamic drag reduction is the running resistance of a German ICE3 train, being a representative contemporary high-speed train, mainly designed in the 1990´s. Despite the relatively high performance of this train, a scrutiny of the design reveals that further aerodynamic improvements are possible, using the most recent knowledge and technology.
Figure 8 The ICE3 train, designed for a maximum speed of 330 km/h Source: Wikipedia
Green Train is assumed to have a wider carbody than ICE3 which will make it possible to utilize the interior space efficiently, having some 25 % more seats per train length of a normal-width train. The wider carbody alone is estimated to increase the aerodynamic drag by approximately 10%, where scaling is assumed almost proportional to the cross sectional area. However, it would be possible to reduce the component contribution to the aerodynamic drag of the ICE3 train from particularly the bogies and inter-car gaps. A potential contribution of
13
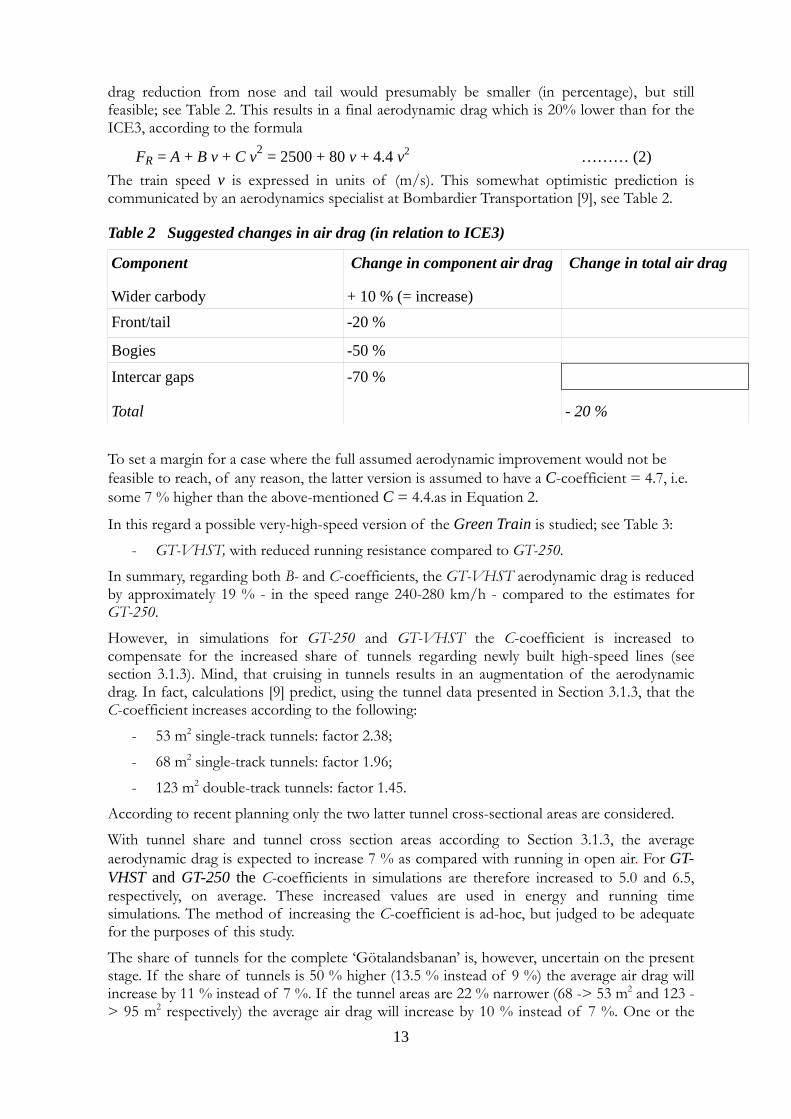
drag reduction from nose and tail would presumably be smaller (in percentage), but still feasible; see Table 2. This results in a final aerodynamic drag which is 20% lower than for the ICE3, according to the formula
FR = A + B v + C v2 = 2500 + 80 v + 4.4 v2 ……… (2) The train speed v is expressed in units of (m/s). This somewhat optimistic prediction is communicated by an aerodynamics specialist at Bombardier Transportation [9], see Table 2.
Table 2 Suggested changes in air drag (in relation to ICE3)
Component Change in component air drag Change in total air drag
Wider carbody + 10 % (= increase) Front/tail -20 %
Bogies -50 %
Intercar gaps -70 %
Total - 20 % To set a margin for a case where the full assumed aerodynamic improvement would not be feasible to reach, of any reason, the latter version is assumed to have a C-coefficient = 4.7, i.e. some 7 % higher than the above-mentioned C = 4.4.as in Equation 2.
In this regard a possible very-high-speed version of the Green Train is studied; see Table 3:
- GT-VHST, with reduced running resistance compared to GT-250. In summary, regarding both B- and C-coefficients, the GT-VHST aerodynamic drag is reduced by approximately 19 % - in the speed range 240-280 km/h - compared to the estimates for GT-250.
However, in simulations for GT-250 and GT-VHST the C-coefficient is increased to compensate for the increased share of tunnels regarding newly built high-speed lines (see section 3.1.3). Mind, that cruising in tunnels results in an augmentation of the aerodynamic drag. In fact, calculations [9] predict, using the tunnel data presented in Section 3.1.3, that the C-coefficient increases according to the following:
- 53 m2 single-track tunnels: factor 2.38;
- 68 m2 single-track tunnels: factor 1.96;
- 123 m2 double-track tunnels: factor 1.45.
According to recent planning only the two latter tunnel cross-sectional areas are considered.
With tunnel share and tunnel cross section areas according to Section 3.1.3, the average aerodynamic drag is expected to increase 7 % as compared with running in open air. For GT-VHST and GT-250 the C-coefficients in simulations are therefore increased to 5.0 and 6.5, respectively, on average. These increased values are used in energy and running time simulations. The method of increasing the C-coefficient is ad-hoc, but judged to be adequate for the purposes of this study.
The share of tunnels for the complete ‘Götalandsbanan’ is, however, uncertain on the present stage. If the share of tunnels is 50 % higher (13.5 % instead of 9 %) the average air drag will increase by 11 % instead of 7 %. If the tunnel areas are 22 % narrower (68 -> 53 m2 and 123 -> 95 m2 respectively) the average air drag will increase by 10 % instead of 7 %. One or the
14
other of these changes would still be well within the total margin with coefficient C finally increased from 4.4 to 5.0 for GT-VHST.
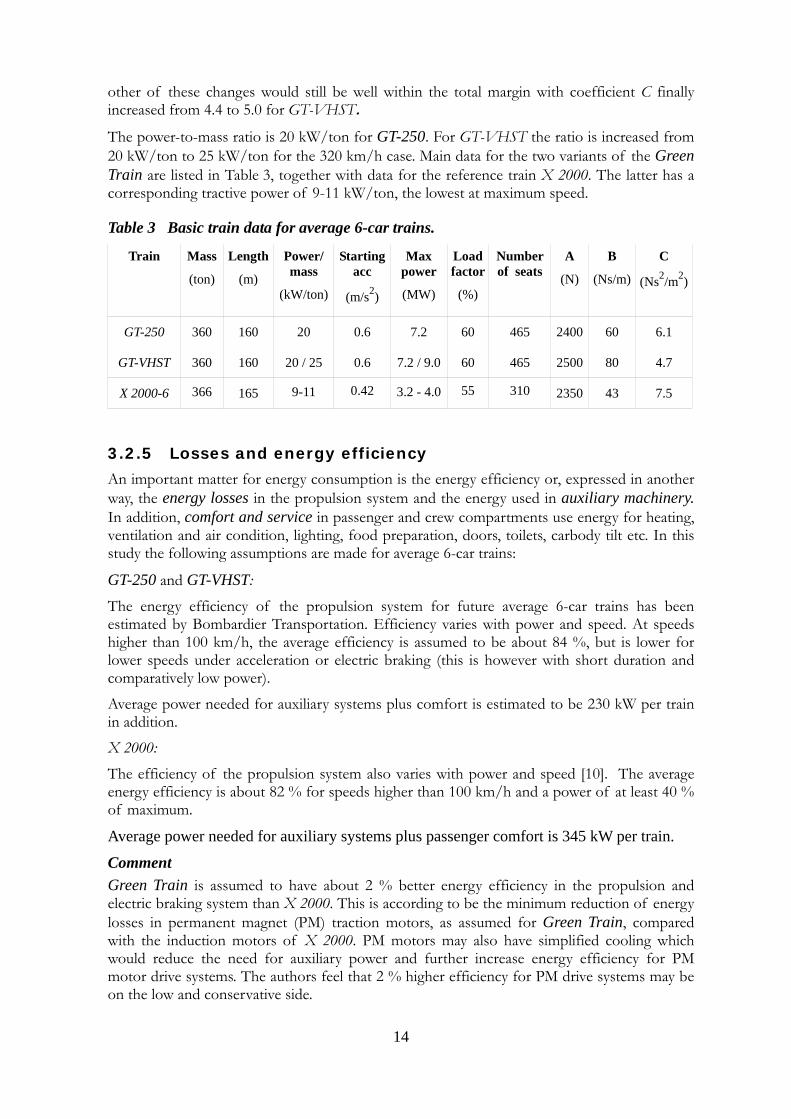
The power-to-mass ratio is 20 kW/ton for GT-250. For GT-VHST the ratio is increased from 20 kW/ton to 25 kW/ton for the 320 km/h case. Main data for the two variants of the Green Train are listed in Table 3, together with data for the reference train X 2000. The latter has a corresponding tractive power of 9-11 kW/ton, the lowest at maximum speed.
Table 3 Basic train data for average 6-car trains.
Train Mass
(ton)
Length
(m)
Power/ mass
(kW/ton)
Starting acc
(m/s2)
Max power
(MW)
Load factor
(%)
Number of seats
A
(N)
B
(Ns/m)
C
(Ns2/m2)
GT-250 360 160 20 0.6 7.2 60 465 2400 60 6.1
GT-VHST 360 160 20 / 25 0.6 7.2 / 9.0 60 465 2500 80 4.7
X 2000-6 366 165 9-11 0.42 3.2 - 4.0 55 310 2350 43 7.5
3.2.5 Losses and energy efficiency
An important matter for energy consumption is the energy efficiency or, expressed in another way, the energy losses in the propulsion system and the energy used in auxiliary machinery. In addition, comfort and service in passenger and crew compartments use energy for heating, ventilation and air condition, lighting, food preparation, doors, toilets, carbody tilt etc. In this study the following assumptions are made for average 6-car trains:
GT-250 and GT-VHST: The energy efficiency of the propulsion system for future average 6-car trains has been estimated by Bombardier Transportation. Efficiency varies with power and speed. At speeds higher than 100 km/h, the average efficiency is assumed to be about 84 %, but is lower for lower speeds under acceleration or electric braking (this is however with short duration and comparatively low power).
Average power needed for auxiliary systems plus comfort is estimated to be 230 kW per train in addition. X 2000: The efficiency of the propulsion system also varies with power and speed [10]. The average energy efficiency is about 82 % for speeds higher than 100 km/h and a power of at least 40 % of maximum.
Average power needed for auxiliary systems plus passenger comfort is 345 kW per train.
Comment Green Train is assumed to have about 2 % better energy efficiency in the propulsion and electric braking system than X 2000. This is according to be the minimum reduction of energy losses in permanent magnet (PM) traction motors, as assumed for Green Train, compared with the induction motors of X 2000. PM motors may also have simplified cooling which would reduce the need for auxiliary power and further increase energy efficiency for PM motor drive systems. The authors feel that 2 % higher efficiency for PM drive systems may be on the low and conservative side.
15
3.2.6 Regenerative braking Both X 2000 and the Green Train are equipped with electrical brakes, feeding back electrical energy to the power supply system (through the catenary) when braking, after subtracting losses in the propulsion system. Regenerated energy is mainly used by other trains on the line or for auxiliary power in the infrastructure, but may occasionally be fed back to the public general electric grid, although the latter case is recently used restrictively. It is assumed that all regenerated energy will be useful for other trains or for auxiliary systems.
Maximum electrical braking force (at wheels) for X 2000 is 140 kN (below 100 km/h). Above a speed of 100 km/h it is further limited by the maximum tractive power. Maximum electrical brake force for Green Train (6 cars) is limited to 228 kN (for lower speeds) or the tractive power (for higher speeds). The maximum electrical braking power is here assumed to be the same as the maximum traction power.
In practice also mechanical brakes will be used to some extent, for instance when the required braking force can not be achieved by the electrical brake alone, or when the supply system is not able to receive all regenerated energy, of any reason. If full service brake is applied at high speed (in this study a retardation of 0.6 m/s2) the required brake force is usually higher than what the electrical system is able to deliver, then a blended brake (mechanical + electrical) will be automatically applied. At emergency braking the mechanical brakes alone are assumed to be applied.
In the reference train X 2000 (in the consist of power unit plus 6 cars) only 4 out of 28 axles are powered and thus the achievable braking force from the electric regenerative brake is quite low in relation to total train mass; cf. Table 3. Further, the adhesion level (wheel-rail) is quite limited in some whether conditions, so the electric braking effort could then also be further reduced. If the train should be able to keep the timetable it is usually necessary to use also the mechanical brakes.
Accordingly, a large share of powered axles and a high tractive power (i.e. high power-to-mass ratio) will help to deliver a high amount of regenerated energy when braking, without loosing too much time. If more energy is fed back than can be used in the power supply system, the voltage in the catenary will rise above the nominal 15 kV. If the voltage tend to rise above a certain level when braking (recently 16.5 - 17 kV), the regenerated current is controlled in such a way that the voltage will not further increase. This action may restrict and limit regeneration in some cases. According to Swedish experience these cases are quite unusual on lines with a considerable amount of operating trains. However, some allowance for such cases is made in Section 3.3.3.
16
3.3 Operational scenarios
3.3.1 Operating speed
On the existing line ‘Västra stambanan’ a top speed of 250 km/h is simulated for Green Train, although a substantial part of the line will be run at lower speeds; see section 3.1.
This is compared with a reference case: X 2000 at top speed 200 km/h on this line.
On the new line ‘Götalandsbanan’ three top speed cases are tested: 250, 280 and 320 km/h.
3.3.2 Stop at stations
Västra stambanan: 2 stops at Katrineholm and Skövde.
Götalandsbanan: Two cases of station stops: - 9 intermediate stops: Flemingsberg, Södertälje syd, Nyköping, Norrköping, Linköping,
Jönköping, Ulricehamn, Borås, Landvetter airport. - Non stop
No additional stops (outside stations) are made in simulations.
3.3.3 Driving style
Two driving styles are simulated
- Minimal running time, meaning maximum acceleration, then following the permitted speed limit and, finally, braking with the prescribed constant deceleration (0.6 m/s2) of full service braking. This type of braking usually requires a considerable share of mechanical braking in addition to the electrical regenerative braking.
- ‘Eco driving’ which is, in this case, performed by minimizing the use of mechanical braking. Almost all braking is performed by using the electric regenerative brakes. This will reduce the braking effort and decelerations at high speed, thus prolonging the total running time to some extent.
There is no other attempt to drive economically, for example by coasting before braking or before downhill gradients. Coasting was excluded since it would have prolonged running time too much and the slack-time margin of 3 % would have been exceeded. However, some coasting would likely occur in practical operations, which would generate slightly lower energy consumption than simulated.
The driver module in ERTsim may make slight modifications to the above-mentioned driving styles, although not of significant importance.
On ‘Västra Stambanan’ (X 2000 and GT-250) full service braking is applied before station stops, while speed variations along the line is managed by using the regenerative electrical brakes. This mode of braking is found to produce energy estimations according to real measured energy consumption on this line.
On ‘Götalandsbanan’ the different cases (speed, station stops, driving style, different trains) are simulated separately and finally weighted according to the following
- 20 % ‘minimal running time’, 80 % ‘eco driving’
- 40 % non-stop trains, 60 % stopping trains
This is believed to deliver representative and realistic estimates of average energy consumption in future high-speed operations with the Green Train on this newly built high-speed line, as far as is possible to do at this stage. In future operations there will certainly also be other stopping
17
patterns than the two above-mentioned (non-stop, 9 stops), however the mentioned “mix” is believed to represent an approximate average.
The Green Train is assumed to have distributed power on at least 50 % of the axles, possibly more. Normal service braking is usually performed by the regenerative electrical brakes, loosing just a small amount of time and without being forced to utilize a high adhesion at high speed. This will be demonstrated and discussed in Chapters 4 and 5. Occasionally however the blended brake (mechanical and regenerative) or pure mechanical will be applied, due to emergency braking, or brakes activated by the ATP (ATC or ETCS) system, or when the train is late and the driver wants to run at minimum time.
3.3.4 Simulated running time versus travel time Simulations are made under ideal assumptions and conditions – trains are starting to move exactly on time, they are accelerating and braking exactly as specified at maximum rate, drivers use the full potential of the train, there are no other trains on the line, delaying the simulated train, there is no fault on track, in signals, etc. This ideal case results in ‘simulated running time’. For practical time tabling appropriate time margins must be added in order to estimate a realistic ‘travel time’.
In this study the following time margins are applied to estimate what is called ‘travel time’:
- simulated running time is prolonged by 3 %;
- another 1 minute per 100 km is added.
Example: on the line Stockholm-Gothenburg (about 460 km), with simulated running times of 110 – 160 minutes, the total time margins will be 8 – 10 minutes.
Such margins are used in practical time-tabling of today, on trains having high priority; however these margins are quite often not sufficient to keep the time table. The estimated travel time, shown in Chapter 4, should be seen as ‘possible to achieve’, at least in some cases. Most likely most trains will have somewhat longer travel time than indicated in this study; say another 5 – 7 minutes on the example line Stockholm – Gothenburg.
3.4 What is included in estimated energy? In the present study energy consumption is estimated as listed below:
- Energy for propulsion, auxiliary machinery and safety systems
- Energy for comfort and service on board the train
- Train idling outside scheduled service (before departure and after final arrival, and at station stops)
- Losses in railway’s electrical supply system, i.e. converter stations and the catenary.
- Net energy, i.e. electrical energy intake to train minus regenerated energy. Regenerated energy from the trains is assumed to be consumed by other trains or for auxiliary purposes, and will thus be efficiently used.
18
4 Estimated energy consumption and travel time
Results of simulations and additional contributions from train idling and losses in the power supply system (see Section 2.1) are presented for ‘Västra Stambanan’ and ‘Götalandsbanan’. Further, in Section 4.3 a comparison is made between running time simulations with ERTSim and the commercial simulation tool RAILSYS.
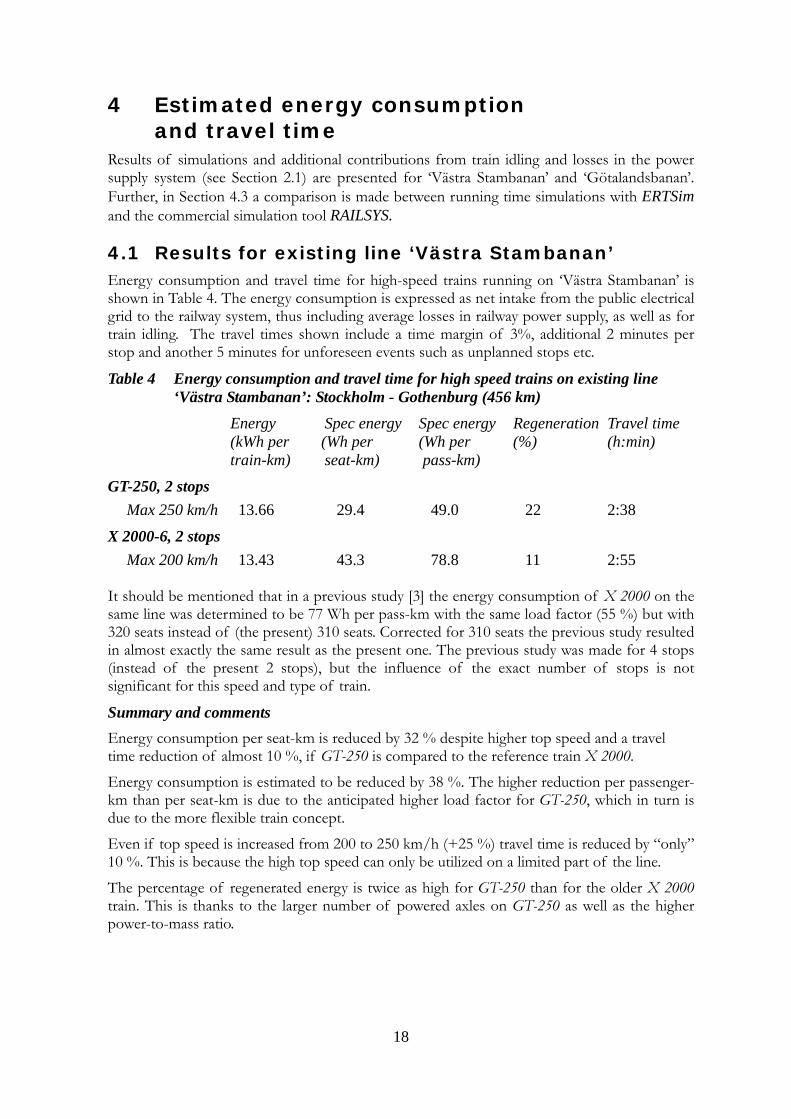
4.1 Results for existing line ‘Västra Stambanan’ Energy consumption and travel time for high-speed trains running on ‘Västra Stambanan’ is shown in Table 4. The energy consumption is expressed as net intake from the public electrical grid to the railway system, thus including average losses in railway power supply, as well as for train idling. The travel times shown include a time margin of 3%, additional 2 minutes per stop and another 5 minutes for unforeseen events such as unplanned stops etc.
Table 4 Energy consumption and travel time for high speed trains on existing line ‘Västra Stambanan’: Stockholm - Gothenburg (456 km)
Energy Spec energy Spec energy Regeneration Travel time (kWh per (Wh per (Wh per (%) (h:min) train-km) seat-km) pass-km)
GT-250, 2 stops Max 250 km/h 13.66 29.4 49.0 22 2:38
X 2000-6, 2 stops Max 200 km/h 13.43 43.3 78.8 11 2:55 It should be mentioned that in a previous study [3] the energy consumption of X 2000 on the same line was determined to be 77 Wh per pass-km with the same load factor (55 %) but with 320 seats instead of (the present) 310 seats. Corrected for 310 seats the previous study resulted in almost exactly the same result as the present one. The previous study was made for 4 stops (instead of the present 2 stops), but the influence of the exact number of stops is not significant for this speed and type of train.
Summary and comments Energy consumption per seat-km is reduced by 32 % despite higher top speed and a travel time reduction of almost 10 %, if GT-250 is compared to the reference train X 2000. Energy consumption is estimated to be reduced by 38 %. The higher reduction per passenger-km than per seat-km is due to the anticipated higher load factor for GT-250, which in turn is due to the more flexible train concept.
Even if top speed is increased from 200 to 250 km/h (+25 %) travel time is reduced by “only” 10 %. This is because the high top speed can only be utilized on a limited part of the line.
The percentage of regenerated energy is twice as high for GT-250 than for the older X 2000 train. This is thanks to the larger number of powered axles on GT-250 as well as the higher power-to-mass ratio.
19
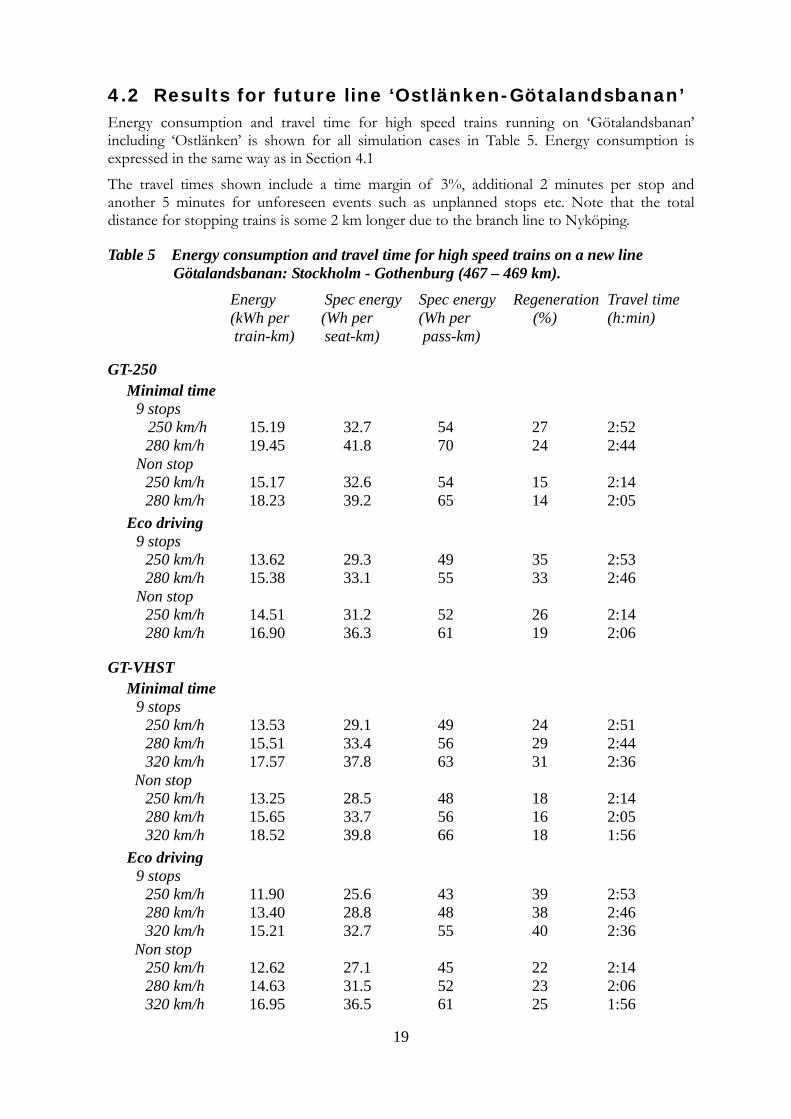
4.2 Results for future line ‘Ostlänken-Götalandsbanan’ Energy consumption and travel time for high speed trains running on ‘Götalandsbanan’ including ‘Ostlänken’ is shown for all simulation cases in Table 5. Energy consumption is expressed in the same way as in Section 4.1
The travel times shown include a time margin of 3%, additional 2 minutes per stop and another 5 minutes for unforeseen events such as unplanned stops etc. Note that the total distance for stopping trains is some 2 km longer due to the branch line to Nyköping.
Table 5 Energy consumption and travel time for high speed trains on a new line Götalandsbanan: Stockholm - Gothenburg (467 – 469 km).
Energy Spec energy Spec energy Regeneration Travel time (kWh per (Wh per (Wh per (%) (h:min) train-km) seat-km) pass-km)
GT-250 Minimal time 9 stops 250 km/h 15.19 32.7 54 27 2:52 280 km/h 19.45 41.8 70 24 2:44 Non stop 250 km/h 15.17 32.6 54 15 2:14 280 km/h 18.23 39.2 65 14 2:05 Eco driving 9 stops 250 km/h 13.62 29.3 49 35 2:53 280 km/h 15.38 33.1 55 33 2:46 Non stop 250 km/h 14.51 31.2 52 26 2:14 280 km/h 16.90 36.3 61 19 2:06
GT-VHST Minimal time 9 stops 250 km/h 13.53 29.1 49 24 2:51 280 km/h 15.51 33.4 56 29 2:44 320 km/h 17.57 37.8 63 31 2:36 Non stop 250 km/h 13.25 28.5 48 18 2:14 280 km/h 15.65 33.7 56 16 2:05 320 km/h 18.52 39.8 66 18 1:56 Eco driving 9 stops 250 km/h 11.90 25.6 43 39 2:53 280 km/h 13.40 28.8 48 38 2:46 320 km/h 15.21 32.7 55 40 2:36 Non stop 250 km/h 12.62 27.1 45 22 2:14 280 km/h 14.63 31.5 52 23 2:06 320 km/h 16.95 36.5 61 25 1:56
20
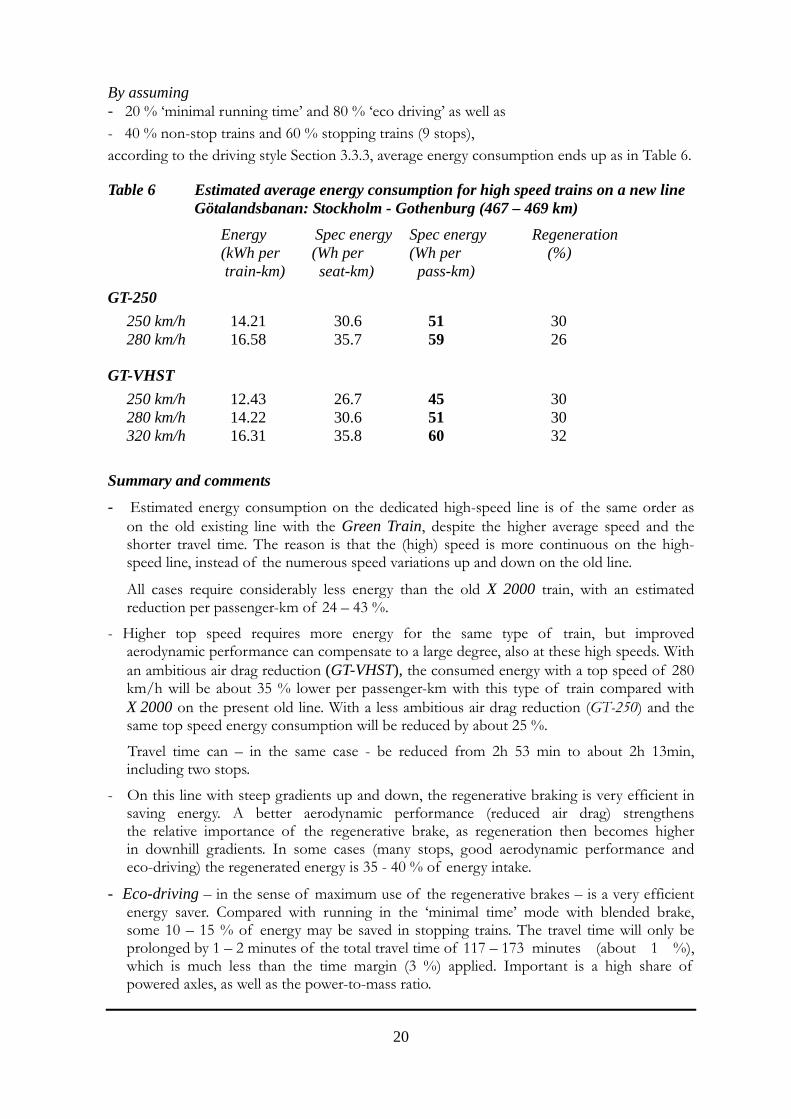
By assuming - 20 % ‘minimal running time’ and 80 % ‘eco driving’ as well as - 40 % non-stop trains and 60 % stopping trains (9 stops), according to the driving style Section 3.3.3, average energy consumption ends up as in Table 6.
Table 6 Estimated average energy consumption for high speed trains on a new line Götalandsbanan: Stockholm - Gothenburg (467 – 469 km)
Energy Spec energy Spec energy Regeneration (kWh per (Wh per (Wh per (%) train-km) seat-km) pass-km)
GT-250 250 km/h 14.21 30.6 51 30 280 km/h 16.58 35.7 59 26
GT-VHST 250 km/h 12.43 26.7 45 30 280 km/h 14.22 30.6 51 30 320 km/h 16.31 35.8 60 32
Summary and comments
- Estimated energy consumption on the dedicated high-speed line is of the same order as on the old existing line with the Green Train, despite the higher average speed and the shorter travel time. The reason is that the (high) speed is more continuous on the high- speed line, instead of the numerous speed variations up and down on the old line.
All cases require considerably less energy than the old X 2000 train, with an estimated reduction per passenger-km of 24 – 43 %. - Higher top speed requires more energy for the same type of train, but improved
aerodynamic performance can compensate to a large degree, also at these high speeds. With an ambitious air drag reduction (GT-VHST), the consumed energy with a top speed of 280 km/h will be about 35 % lower per passenger-km with this type of train compared with X 2000 on the present old line. With a less ambitious air drag reduction (GT-250) and the same top speed energy consumption will be reduced by about 25 %.
Travel time can – in the same case - be reduced from 2h 53 min to about 2h 13min, including two stops.
- On this line with steep gradients up and down, the regenerative braking is very efficient in saving energy. A better aerodynamic performance (reduced air drag) strengthens the relative importance of the regenerative brake, as regeneration then becomes higher in downhill gradients. In some cases (many stops, good aerodynamic performance and eco-driving) the regenerated energy is 35 - 40 % of energy intake.
- Eco-driving – in the sense of maximum use of the regenerative brakes – is a very efficient energy saver. Compared with running in the ‘minimal time’ mode with blended brake, some 10 – 15 % of energy may be saved in stopping trains. The travel time will only be prolonged by 1 – 2 minutes of the total travel time of 117 – 173 minutes (about 1 %), which is much less than the time margin (3 %) applied. Important is a high share of powered axles, as well as the power-to-mass ratio.
21
4.3 Comparison between ERTSim and a commercial simulation tool In the Green Train R&D program the commercial tool RAILSYS is used for timetabling and capacity studies. RAILSYS has in its basic version a very limited ability to calculate energy con-sumption, compared with tools developed mainly for energy consumption studies, as ERTSim.
ERTSim is calculating energy consumption and running time according to how the train is handled by the train driver. If the driver behaviour varies the energy consumption and running time will vary as well. This feature, i.e. driver-dependent energy consumption and running time, is not implemented in most commercial tools for simulating running time or travel time and for construction of timetables. However, there often exists a simple feature such as ‘minimal running time behaviour’ and a ‘relaxed behaviour’, the latter meaning that the allowed top speed is not utilized to 100%. Relaxed behaviour prolongs the running time and saves some energy.
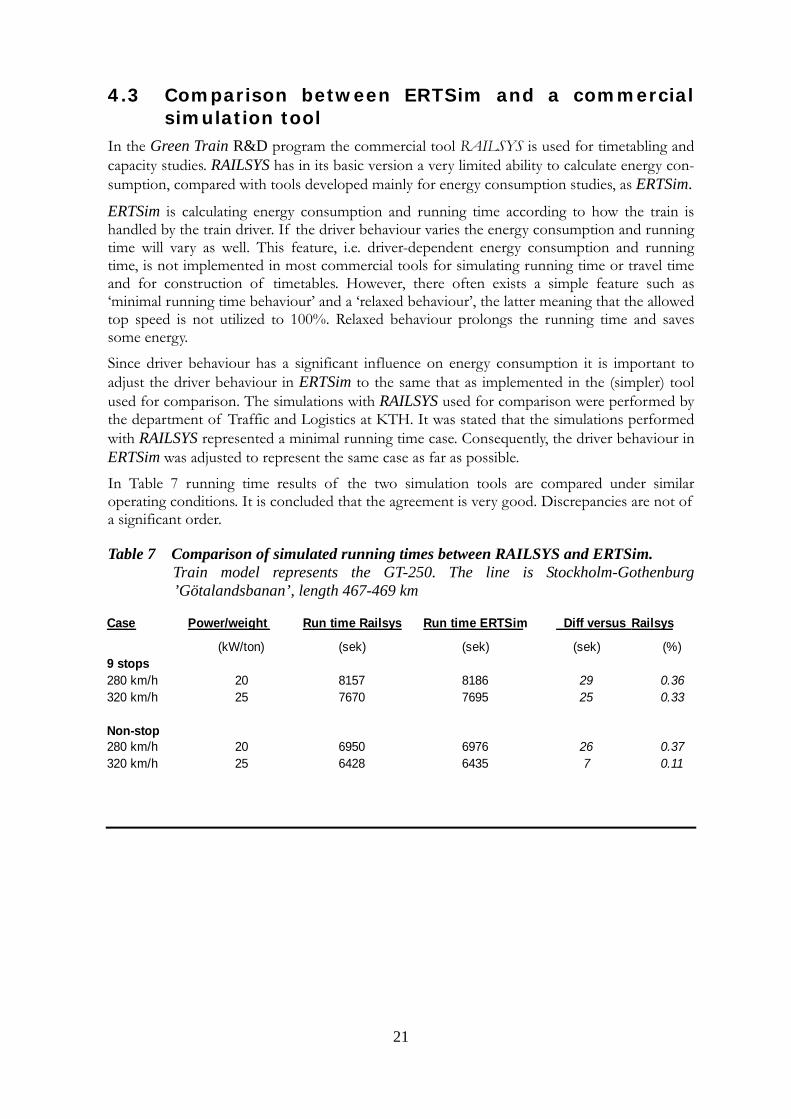
Since driver behaviour has a significant influence on energy consumption it is important to adjust the driver behaviour in ERTSim to the same that as implemented in the (simpler) tool used for comparison. The simulations with RAILSYS used for comparison were performed by the department of Traffic and Logistics at KTH. It was stated that the simulations performed with RAILSYS represented a minimal running time case. Consequently, the driver behaviour in ERTSim was adjusted to represent the same case as far as possible. In Table 7 running time results of the two simulation tools are compared under similar operating conditions. It is concluded that the agreement is very good. Discrepancies are not of a significant order.
Table 7 Comparison of simulated running times between RAILSYS and ERTSim. Train model represents the GT-250. The line is Stockholm-Gothenburg
’Götalandsbanan’, length 467-469 km
Case Power/weight Run time Railsys Run time ERTSim Diff versus Railsys
(kW/ton) (sek) (sek) (sek) (%)9 stops280 km/h 20 8157 8186 29 0.36320 km/h 25 7670 7695 25 0.33
Non-stop280 km/h 20 6950 6976 26 0.37320 km/h 25 6428 6435 7 0.11
22
5 Summary and conclusions Energy consumption and running time is estimated by advanced simulation software. The amount of energy is expressed per seat-km or passenger-km, with the difference depending on the average load factor of the train. Estimated energy is the net energy consumed, i.e. after regeneration of braking energy, with losses in train propulsion, power supply and idling included. Energy estimations also include assumed needs for auxiliary machinery and passenger comfort (heating, air condition, catering, carbody tilt and others). Also included is the increased air resistance in anticipated tunnels along new a high-speed-line.
The driving style is towards using the electrical regenerative brake as the normal braking mode, although mechanical brakes are still used on some occasions. Using the electrical brake will not only save energy but also save wear and maintenance cost of mechanical brakes.
Time margins are added to ‘simulated running time’ in order to estimate a realistic ‘travel time’.
5.1 Main results Energy consumption and travel time is estimated for two representative lines, i.e.
- the existing line ‘Västra Stambanan’ (Stockholm-Gothenburg) where top speed in the future is assumed to be raised from 200 to 250 km/h;
- a new planned very-high-speed line ‘Götalandsbanan’ (also Stockholm-Gothenburg) where top speed for Green Train is varied from 250 km/h up to 320 km/h.
Despite the higher speeds and reduced travel time the Green Train – with features and data assumed in this study – is estimated to reduce energy consumption per passenger-km by 24 – 43 % as compared with the present train X 2000, the latter anyhow considered having a good energy performance. The lowest energy saving (24 %) is for a very-high-speed train with a top speed of 320 km/h, while the most favourable figure (43 % saving) is for a train with superior aerodynamic performance at a top speed of 250 km/h.
Green Train with moderately reduced aerodynamic drag - on the existing line ‘Västra Stambanan’- is estimated to reduce average energy consumption by 32 % per seat-km and by 38 % per passenger-km as compared with X 2000. Travel time is estimated to be reduced by about 10 %.
Green Train on a new very-high-speed line ‘Götalandsbanan’ is estimated to reduce average energy consumption by 29 % per seat-km and by 35 % per passenger-km in relation to present X 2000 on the existing line. This is at a top speed of 250 km/h and a moderately reduced air drag reduction or at a top speed 280 km/h with superior aerodynamic performance. In the latter case travel time is reduced from 2h 55 min with X 2000 (2 stops) to 2h 20 min with Green Train (4 stops), i.e. a travel time reduction of 20 % despite increased number of stops.
The estimates above should be seen as ‘what is possible to achieve’ from a technical-economical view assumed that energy and efficiency issues are given appropriate attention at future train acquisition and development. The estimates are valid for
- an average six-car wide-body train averaging 465 seats; an efficient but still comfortable layout of the train;
- a high-powered train of motor-coach type, with at least 50 % of axles powered and used for a high amount of regenerative braking;
- an appropriate, but by no means extreme, aerodynamic performance for the speeds in question; two variants are analyzed.
23
5.2 Influence of different features and conditions Energy consumption and travel time is sensitive to a number of features and variables, as stated in the previous section. On basis of our simulations and other sources, a number of conclusions can be drawn.
Speed and aerodynamic resistance
The aerodynamic resistance for a train increases almost with the train speed squared, assuming the same train. The kinetic energy needed to accelerate the train is exactly proportional to the train speed squared. This clearly indicates that energy consumption increases substantially with increasing speed. However, there as some components which will not increase with speed. For example, gradients up and down the line have a diminishing importance for energy and travel time with increasing train speed. Further, a shorter travel time will reduce the energy needed for comfort, service and auxiliaries as these components are depending on time rather than speed. For X 2000 about 15 – 20 % of the total energy is needed for comfort and auxiliaries. Both the top speed and the average speed are of importance for energy consumption. Average speed is usually increased by a lower percentage than top speed, as station stops and mandatory speed restrictions takes time.
Our estimations show that energy consumption increases by a power of 1.1–1.3 of the top speed for the trains running on the dedicated very-high-speed line. For example, if the top speed is increased from 250 to 280 km/h (12 %), energy consumption increases by 13 – 16%. Improved aerodynamic performance can to a large degree compensate for increased speed. For instance, the more superior aerodynamic performance of GT-VHST compared with GT-250 will allow the former to run with a top speed of 280 km/h instead of 250 – or 320 km/h instead of 280 – and still maintain the lower energy consumption. In this case the total aerodynamic drag is reduced by 19 % in the actual speed range.
Despite a higher speed for the Green Train compared with X 2000 the energy consumption is considerably lower, as determined per seat-km or per passenger-km. Besides the lower aerodynamic drag this is due to the factors discussed below.
Efficient space utilization
A key factor is space utilization in trains, defined as how many seats are conveyed in a certain number of cars or per meter length of train. As earlier mentioned in Section 3.2.1 European high-speed trains have usually relatively poor space utilization if compared to Japanese trains. The use of wide car bodies in Japan is a significant reason for the difference, but also other factors are important, as already noted in Section 3.2.1.
The efficient Green Train concept has been presented in Section 3.2.1. The efficient space utilization is mainly due to (1) the motor-coach concept (opposed to having a separate locomotive), (2) the wide car bodies, (3) the somewhat longer cars compared with most previous Swedish and European high-speed trains and (4) a more compact and efficient seat arrangement without reducing comfort. This would end up with about 2.9 seats per meter of train. As a result, about the same amount of passengers can be conveyed in four vehicles with a mass of 240 tons (loaded 60 %), instead of seven vehicles as for X 2000 having a mass of 366 tons. This reveals that the mass per seat may be reduced by some 35 %. A similar reduction is true also for the aerodynamic resistance per seat.
If the number of seats in the Green Train is reduced by 20 % (i.e. 245 - 250 instead of 310 in a 4-car trainset), the energy consumption per seat-km will increase by almost 25 % compared with figures otherwise estimated for the Green Train in his study.
24
Load factor
Energy consumption of a high-speed train is practically almost independent on the actual passenger load. This results in a high dependence on the load factor when estimating energy consumption per passenger-km. As said earlier the average load factor in Green Train is assumed to be 5 percentage units higher by comparison to X 2000 (60 % instead of 55 %), due to the more flexible train concept with shorter trains being able to couple in multiples at demand. This reduces energy consumption per passenger-km by about 8 %, but will not change energy as determined per seat-km.
It should also be noted that the average load factor for future high-speed trains may be higher than 60 % which will further reduce energy consumption per passenger-km. Such an improvement has already been substantiated on X 2000 services during the years 2006-2008, as a result from a more active yield management and others.
Regenerative electric brakes
The principle is that traction motors are used as electric generators when braking the train. The kinetic energy of the train is fed back to the catenary after subtraction of energy losses in the propulsion and electric braking system.
The usefulness of regenerative electric brakes is very dependent on the power (in kW) in the propulsion system. A high power will enable a high braking force also at high speed. Therefore a high power makes it possible to brake the train with a reasonably high deceleration, thus braking without too much loss of time compared with the usual mechanical braking.
It is also important to have a high percentage of the total train mass on powered (and electrically braking) axles. Otherwise the braking axles risk to be slipping in cases of low or medium adhesion. In this study we have assumed some 50 % of the total train mass resting on powered axles.
The two factors above are the reasons for the considerably higher amount of regeneration on Green Train as compared with X 2000; i.e. 22 % instead of 11 % of energy intake on the existing line ‘Västra Stambanan’.
On the very-high-speed line with steep gradients up and down, the regenerative brake is very efficient in saving energy. A better aerodynamic performance (reduced air drag) strengthens the importance of the regenerative brake, as regeneration then becomes higher on downhill gradients. In some cases (many stops, good aerodynamic performance and eco-driving) the regenerated energy is 35 - 40 % of energy intake. At more cautious assumptions the average energy savings due to regenerative braking may be about 30 %. This is a high percentage in relation to the present X 2000 with the more modest regeneration of about 11 %. Older Swedish trains from the 1970´s and 1980’s have no regenerative braking at all.
Despite a high power in the system, the regenerative electric brakes usually have lower braking forces than the usual mechanical brakes. However, with the performance of electric brakes assumed in this study, the loss of time is very modest by using the electric brakes. At full use of electric brakes (and no use of mechanical brakes) the loss of time is in the order of just 1 % of total travel time for a stopping high-speed train (one stop each 40 - 50 km), which is well within the time margin of 3 %. This means that this kind of ‘Eco-driving’ – i.e. using regenerative electric brakes as a normal mean of braking - is possible in most cases, without any substantial drawback in travel time. This will save some 10 – 15 % of energy intake, compared with blended mechanical and electric braking.
25
Others
As said earlier, tunnels will increase aerodynamic resistance and thus the energy consumption. In this study about 9 % of the very-high-speed line is assumed to run in tunnels, of which 6 % of the line is in single-track tunnels, being tighter than double-track tunnels. This will increase average aerodynamic drag by about 7 %. Energy consumption will increase by 4 - 5 % due to these tunnels. This is included in our estimations.
Permanent magnet motors are assumed to be used in future high-speed train applications. These motors are assumed to have at least 2 % better energy efficiency than the previously used induction motors, which is considered as a cautious estimation. The resulting energy consumption will be reduced by about the same percentage. Further, the need for forced cooling will most likely be reduced, thus reducing also the auxiliary power consumption. These reductions are not accounted for in this study and will likely be less than 1.5 - 2 %.
5.3 The values of low aerodynamic resistance Low aerodynamic resistance is important for saving energy on high-speed train operations. It is mentioned earlier that a high ambition regarding the aerodynamic performance (e.g. regar-ding air drag) would most likely be justified for speeds above 250 km/h, and in particular if the top speed of train speed is raised to 300 km/h and above. Simulations in this study conclude that a 19 % reduction in air drag can save almost 2.4 kWh of electric energy per train-km at a top speed of 280 km/h on the contemplated high-speed line ‘Götalandsbanan’. This is some 14 % of total energy consumption. The savings grow larger at 300 á 320 km/h.
There are at least two incentives to save energy:
(1) The cost of additional energy consumption during the lifetime of the train
(2) The ethical and economical values of marketing and operating a train with a superior environmental performance.
This study attempts to present values of the first incentive, which is easier to express in objective terms than the second one. Having that said, it is pointed out that the intention is not to depreciate the importance of the more ‘soft’ values of a state-of-the-art environmental performance.
It is not attempted to estimate how much higher the first investment cost of the train is expected to be, as result of the more advanced aerodynamic design. Neither it is possible, in the scope of this study, to estimate the possible changes in maintenance cost (if any) resulting from increased shielding of bogies and other equipment on the train. These costs could be significant, but not necessarily too high if the equipment is designed properly. It is the responsibility of the train supplier to estimate these costs, together with train operators and maintenance suppliers. Clever design features built in from the start of the development may provide affordable solutions.
As said already, the energy saved is in the order of 1.8 kWh per train-km at 250 km/h. With a representative average running distance of 400 000 km per year, some 720 000 kWh per year is estimated to be saved for this train in this type of operation. This regards intake of electric energy to the railway’s converter station, i.e. losses in the railway’s electrical supply system are included in the above-mentioned amount of energy. The economic value depends on recent and future price of electric energy.
During recent years (2006-08) the cost of electric energy for railway use in Sweden has been approximately 0.5 SEK (approx. 0.05 EUR) per kWh, at the intake to converter stations. This
26
includes the favourable Swedish tax-free condition for railway energy. Future energy prices would likely increase; energy and carbon dioxide emission tax may eventually be paid and a gradual transition to energy prices on the European continent is a realistic scenario. Therefore a realistic alternative price scenario is 1.0 SEK per kWh by comparison to the current price of about 0.5 SEK per kWh.
Another factor is the time horizon for which train operators are willing to discount future energy cost savings, and to what discount interest rate. In this study estimations for three time horizons are presented: 5, 10 and 20 years, and for two discount rates: 5 and 10 %. Railway operators, vehicle owners and regional transport authorities would have different policies on these matters.
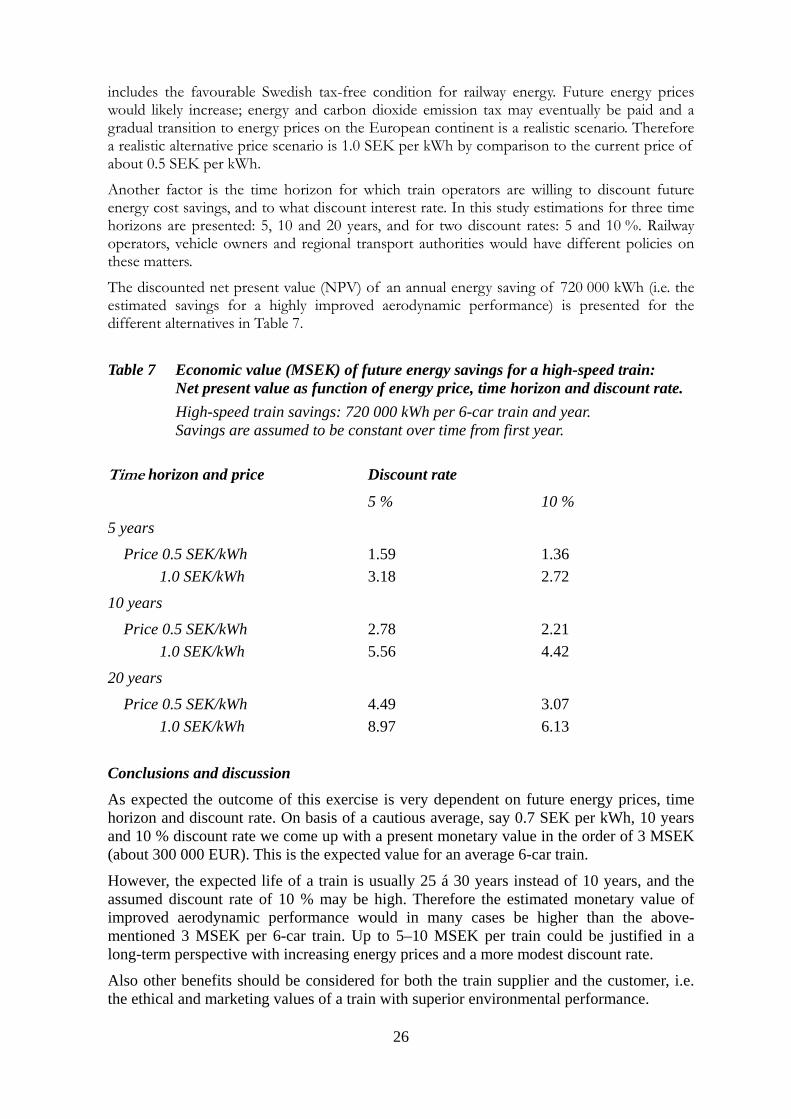
The discounted net present value (NPV) of an annual energy saving of 720 000 kWh (i.e. the estimated savings for a highly improved aerodynamic performance) is presented for the different alternatives in Table 7.
Table 7 Economic value (MSEK) of future energy savings for a high-speed train: Net present value as function of energy price, time horizon and discount rate. High-speed train savings: 720 000 kWh per 6-car train and year. Savings are assumed to be constant over time from first year.
Time horizon and price Discount rate
5 % 10 %
5 years
Price 0.5 SEK/kWh 1.59 1.36 1.0 SEK/kWh 3.18 2.72
10 years
Price 0.5 SEK/kWh 2.78 2.21 1.0 SEK/kWh 5.56 4.42
20 years
Price 0.5 SEK/kWh 4.49 3.07 1.0 SEK/kWh 8.97 6.13
Conclusions and discussion
As expected the outcome of this exercise is very dependent on future energy prices, time horizon and discount rate. On basis of a cautious average, say 0.7 SEK per kWh, 10 years and 10 % discount rate we come up with a present monetary value in the order of 3 MSEK (about 300 000 EUR). This is the expected value for an average 6-car train.
However, the expected life of a train is usually 25 á 30 years instead of 10 years, and the assumed discount rate of 10 % may be high. Therefore the estimated monetary value of improved aerodynamic performance would in many cases be higher than the above-mentioned 3 MSEK per 6-car train. Up to 5–10 MSEK per train could be justified in a long-term perspective with increasing energy prices and a more modest discount rate.
Also other benefits should be considered for both the train supplier and the customer, i.e. the ethical and marketing values of a train with superior environmental performance.
27
References [1] Lukaszewicz P: Energy consumption and running time for trains – Modelling of
running resistance and driver behaviour based on full scale testing. Doctoral thesis, KTH, Stockholm 2001, ISRN KTH/FKT/D--01/25—SE.
[2] Andersson E: Energy consumption and air pollution of electric rail traffic – the Swedish case. KTH Railway Technology, Stockholm 1994,
ISRN KTH/FKT/FR-- 94/46—SE.
[3] Andersson E, Lukaszewicz P: Energy consumption and related air pollution for Scandinavian electric passenger trains. Dept. of Aeronautical and Vehicle Engineering, KTH, Stockholm 2006, ISSN 1650-7660.
[4] Flykt P / Bombardier Transportation: Energy measurements at X50 Regina in SJ operation 2003-04.
[5] PM Infrastrukturmodell av Götalandsbanan i RailSys. Banverket/Railize, Mats Gunnervall 2006-01-03.
[6] Bandata Götalandsbanan 070515. KTH Internal document, Oskar Fröidh.
[7] Personal communication with John Fridlund, Technical co-ordinator, project Ostlänken, Banverket 2008-12-09.
[8] Bombardier Transportation internal report, 2007. [9] Diedrichs B / Bombardier Transportation, personal communication.
[10] Fors Jonas: Energy consumption of passenger train X2 with regenerative braking and induction motors. ISSN 1103-470X. KTH, Stockholm 2001.
[11] Persson R: Tilting trains - Description and analysis of the present situation. KTH Railway Group, Publication 0702, ISBN 978-91-7178-608-1, Stockholm 2007.


![Fiches catalogue Estimations 1 [ALMANACHS]. Almanach ...media.interencheres.com/251/2017/03/22/152316_12f1c3f14de42e66dbb9ab... · Fiches catalogue Estimations 1 [ALMANACHS]. Almanach](https://img.pdfslide.us/doc/110x75/5e3e53c4efb520272121ec1b/fiches-catalogue-estimations-1-almanachs-almanach-media-fiches-catalogue.jpg)