Embed Size (px)
Citation preview
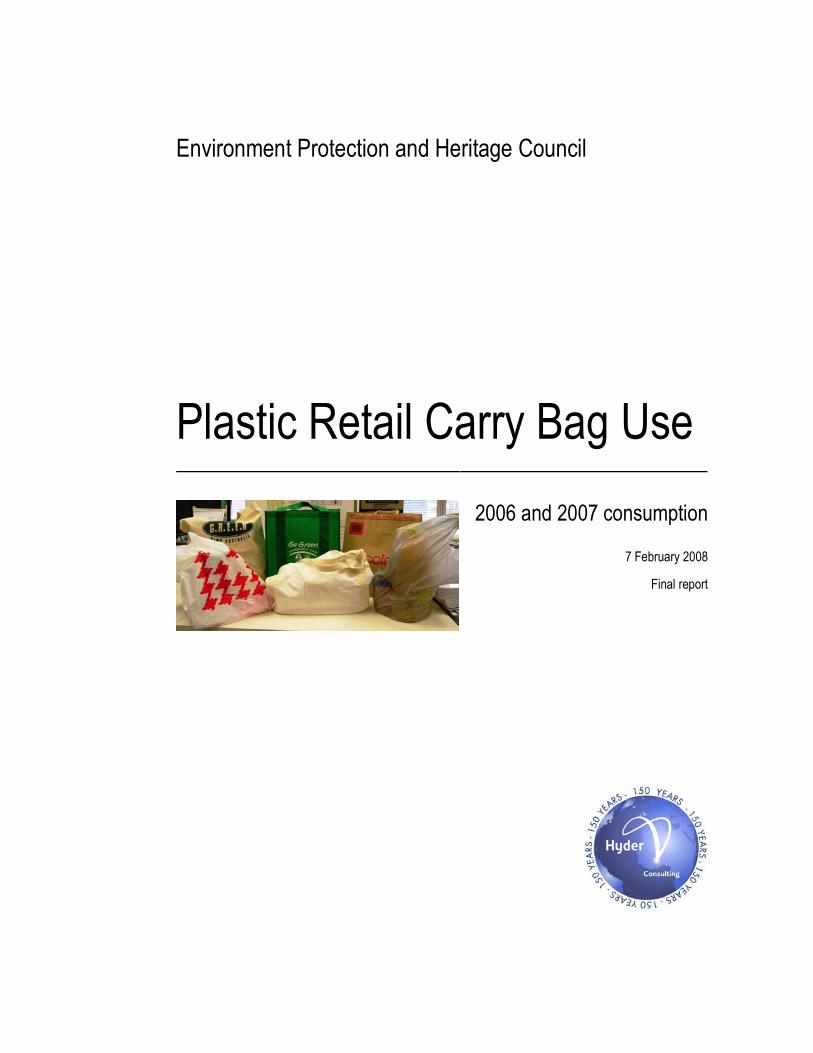
Environment Protection and Heritage Council
Plastic Retail Carry Bag Use
2006 and 2007 consumption
7 February 2008
Final report
Environment Protection and Heritage Council
Plastic Retail Carry Bag Use
2006 and 2007 consumption
Author: Rebecca Cain, Melanie Oke
Checker: Peter Allan, Selina Mok
Approver: Peter Allan
Report no: Final report Date: 7 February 2008
This report has been prepared for Environment Protection and Heritage Council in accordance with the terms and
conditions of appointment for Plastic Bag Data. Hyder Consulting Pty Ltd (ABN 76 104 485 289) cannot accept any
responsibility for any use of or reliance on the contents of this report by any third party.
Hyder Consulting Pty Ltd
ABN 76 104 485 289
Level 16, 31 Queen Street, Melbourne VIC 3000, Australia
Tel: +61 3 8623 4000 Fax: +61 3 8623 4111 www.hyderconsulting.com
Page i
Plastic Retail Carry Bag Use Plastic bag data
Hyder Consulting Pty LtdABN 76 104 485 289
http://oldaus.hybis.info/sites/vc02933/F_Reports/0001_VC02933_VCR_10_Plastic bag consumption data report.doc
7/02/08 5:54 5
Contents 1 Executive summary .................................................................................................. 1
2 Background ............................................................................................................... 4
2.1 Plastic bags use in Australia ........................................................................................ 4
2.2 EPHC objectives .......................................................................................................... 4 2.3 Project scope................................................................................................................ 5
3 Domestic production & importation of carry bags ................................................ 6
3.1 Domestic production..................................................................................................... 6 3.2 Bag imports .................................................................................................................. 6
3.3 Trends in HDPE local bag production & import ............................................................ 9
4 Retail sector use ..................................................................................................... 11
4.1 Retail sector HDPE carry bag consumption ............................................................... 11
4.2 Supermarkets ............................................................................................................. 11 4.3 Other retail sectors ..................................................................................................... 12
5 Degradable retail carry bags.................................................................................. 13
5.1 Definitions................................................................................................................... 13 5.2 Consumption of degradable carry bags ..................................................................... 14
6 Consumption of plastic bag alternatives .............................................................. 16
6.1 Reusable bags ........................................................................................................... 16 6.2 Consumer carry bag behaviours ................................................................................ 17
7 Sales of kitchen tidy bag products........................................................................ 19
8 Plastic bag litter ...................................................................................................... 22
8.1 Estimating plastic bag litter in 2006/07....................................................................... 22 8.2 2002 plastic bag litter estimate ................................................................................... 25
8.3 2006 plastic bag flows ................................................................................................ 26 8.4 Plastic bag litter trends and relationships................................................................... 28
9 Conclusions............................................................................................................. 29
10 References............................................................................................................... 31
Appendix A
Sensitivity analysis on estimations
Appendix B
Summary of shopping observations
Page 1
Plastic Retail Carry Bag Use Plastic bag data
Hyder Consulting Pty LtdABN 76 104 485 289
http://oldaus.hybis.info/sites/vc02933/F_Reports/0001_VC02933_VCR_10_Plastic bag consumption data report.doc
7/02/08 5:54 5
1 Executive summary
Retail plastic carry bag use
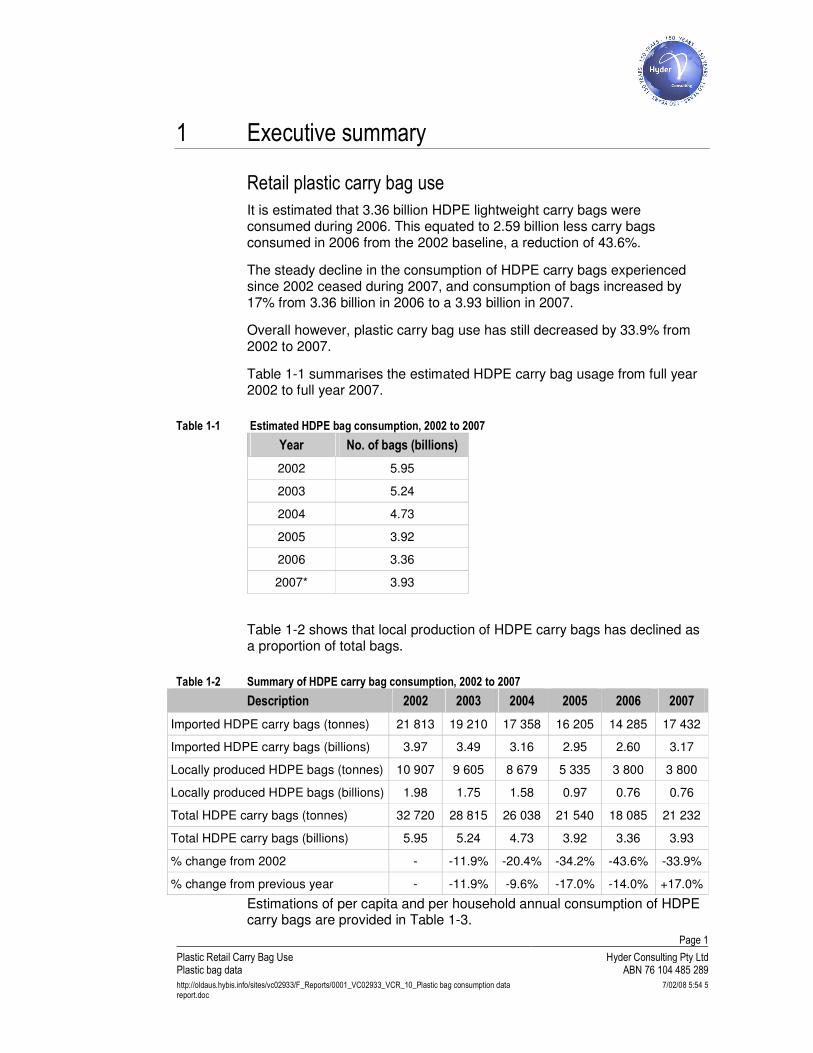
It is estimated that 3.36 billion HDPE lightweight carry bags were consumed during 2006. This equated to 2.59 billion less carry bags consumed in 2006 from the 2002 baseline, a reduction of 43.6%.
The steady decline in the consumption of HDPE carry bags experienced since 2002 ceased during 2007, and consumption of bags increased by 17% from 3.36 billion in 2006 to a 3.93 billion in 2007.
Overall however, plastic carry bag use has still decreased by 33.9% from 2002 to 2007.
Table 1-1 summarises the estimated HDPE carry bag usage from full year 2002 to full year 2007.
Table 1-1 Estimated HDPE bag consumption, 2002 to 2007
Year No. of bags (billions)
2002 5.95
2003 5.24
2004 4.73
2005 3.92
2006 3.36
2007* 3.93
Table 1-2 shows that local production of HDPE carry bags has declined as a proportion of total bags.
Table 1-2 Summary of HDPE carry bag consumption, 2002 to 2007
Description 2002 2003 2004 2005 2006 2007
Imported HDPE carry bags (tonnes) 21 813 19 210 17 358 16 205 14 285 17 432
Imported HDPE carry bags (billions) 3.97 3.49 3.16 2.95 2.60 3.17
Locally produced HDPE bags (tonnes) 10 907 9 605 8 679 5 335 3 800 3 800
Locally produced HDPE bags (billions) 1.98 1.75 1.58 0.97 0.76 0.76
Total HDPE carry bags (tonnes) 32 720 28 815 26 038 21 540 18 085 21 232
Total HDPE carry bags (billions) 5.95 5.24 4.73 3.92 3.36 3.93
% change from 2002 - -11.9% -20.4% -34.2% -43.6% -33.9%
% change from previous year - -11.9% -9.6% -17.0% -14.0% +17.0%
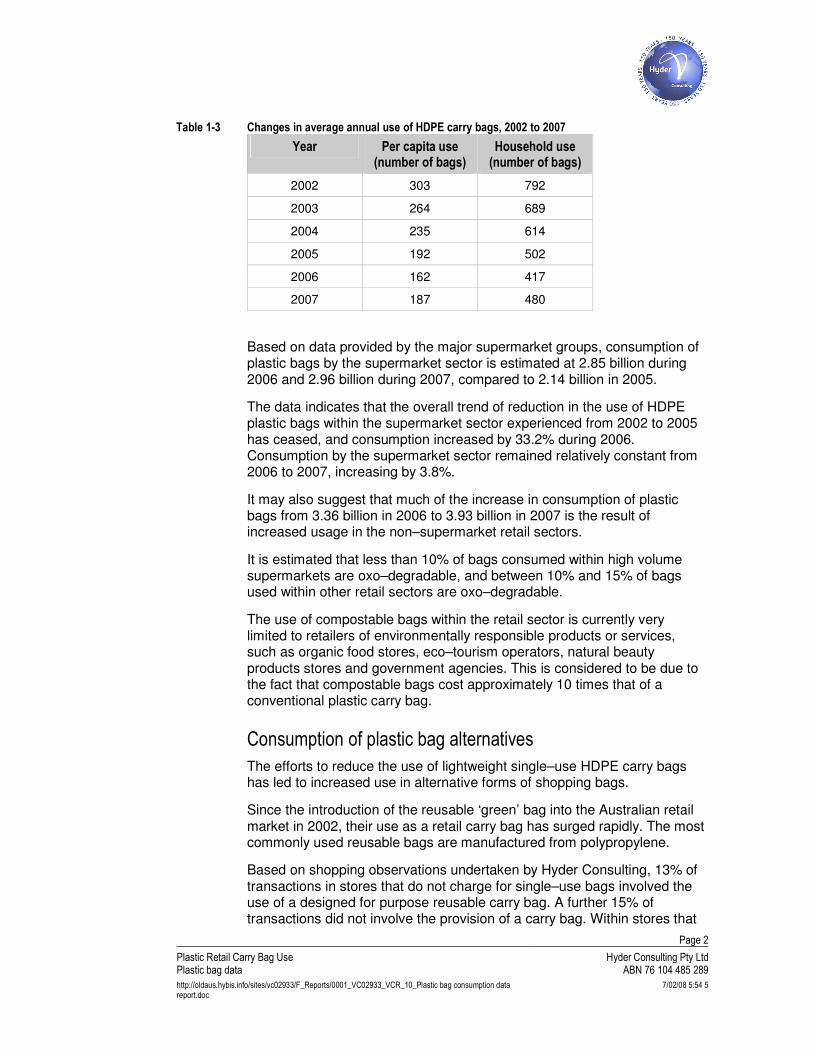
Estimations of per capita and per household annual consumption of HDPE carry bags are provided in Table 1-3.
Page 2
Plastic Retail Carry Bag Use Plastic bag data
Hyder Consulting Pty LtdABN 76 104 485 289
http://oldaus.hybis.info/sites/vc02933/F_Reports/0001_VC02933_VCR_10_Plastic bag consumption data report.doc
7/02/08 5:54 5
Table 1-3 Changes in average annual use of HDPE carry bags, 2002 to 2007
Year Per capita use (number of bags)
Household use (number of bags)
2002 303 792
2003 264 689
2004 235 614
2005 192 502
2006 162 417
2007 187 480
Based on data provided by the major supermarket groups, consumption of plastic bags by the supermarket sector is estimated at 2.85 billion during 2006 and 2.96 billion during 2007, compared to 2.14 billion in 2005.
The data indicates that the overall trend of reduction in the use of HDPE plastic bags within the supermarket sector experienced from 2002 to 2005 has ceased, and consumption increased by 33.2% during 2006. Consumption by the supermarket sector remained relatively constant from 2006 to 2007, increasing by 3.8%.
It may also suggest that much of the increase in consumption of plastic bags from 3.36 billion in 2006 to 3.93 billion in 2007 is the result of increased usage in the non–supermarket retail sectors.
It is estimated that less than 10% of bags consumed within high volume supermarkets are oxo–degradable, and between 10% and 15% of bags used within other retail sectors are oxo–degradable.
The use of compostable bags within the retail sector is currently very limited to retailers of environmentally responsible products or services, such as organic food stores, eco–tourism operators, natural beauty products stores and government agencies. This is considered to be due to the fact that compostable bags cost approximately 10 times that of a conventional plastic carry bag.
Consumption of plastic bag alternatives
The efforts to reduce the use of lightweight single–use HDPE carry bags has led to increased use in alternative forms of shopping bags.
Since the introduction of the reusable ‘green’ bag into the Australian retail market in 2002, their use as a retail carry bag has surged rapidly. The most commonly used reusable bags are manufactured from polypropylene.
Based on shopping observations undertaken by Hyder Consulting, 13% of transactions in stores that do not charge for single–use bags involved the use of a designed for purpose reusable carry bag. A further 15% of transactions did not involve the provision of a carry bag. Within stores that
Page 3
Plastic Retail Carry Bag Use Plastic bag data
Hyder Consulting Pty LtdABN 76 104 485 289
http://oldaus.hybis.info/sites/vc02933/F_Reports/0001_VC02933_VCR_10_Plastic bag consumption data report.doc
7/02/08 5:54 5
charge a fee for single–use bags provided, 33% of transactions involved a reusable carry bag and 40% of transactions did not involve the provision of a carry bag.
This seems to indicate that the introduction of bag charges at a retail level does lead to a major shift from single–use bags to reusable bags or no bag transactions.
Sales of kitchen tidy bag products
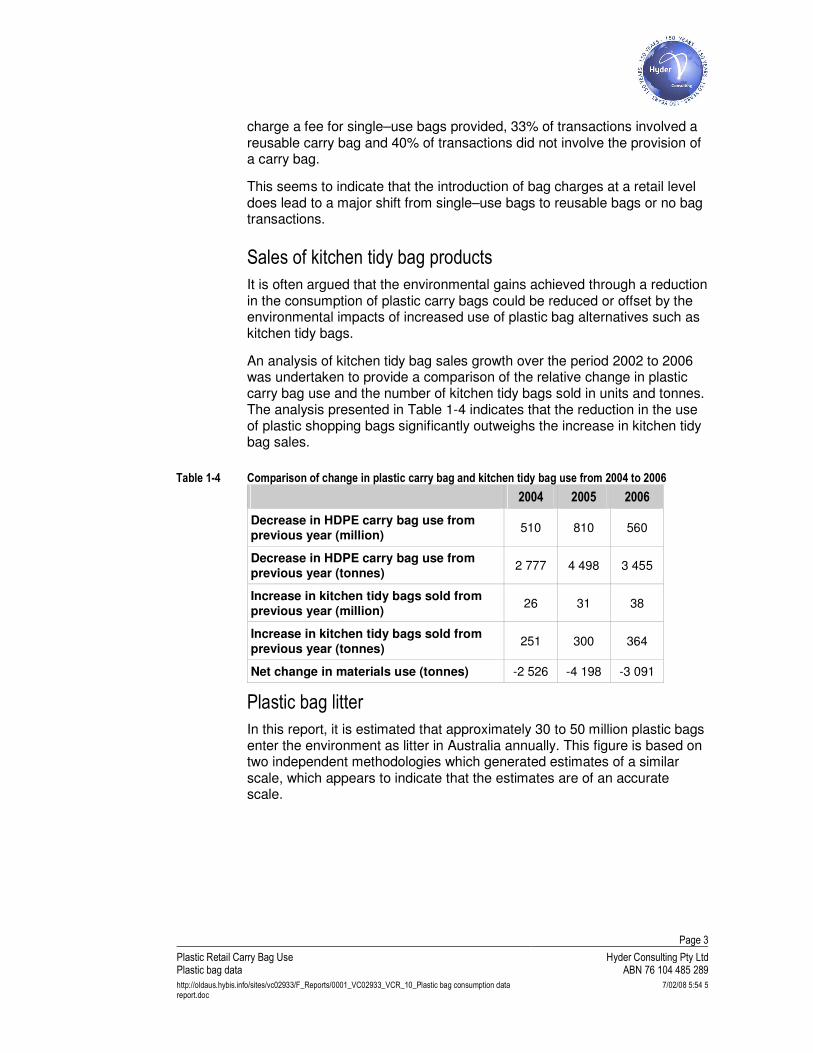
It is often argued that the environmental gains achieved through a reduction in the consumption of plastic carry bags could be reduced or offset by the environmental impacts of increased use of plastic bag alternatives such as kitchen tidy bags.
An analysis of kitchen tidy bag sales growth over the period 2002 to 2006 was undertaken to provide a comparison of the relative change in plastic carry bag use and the number of kitchen tidy bags sold in units and tonnes. The analysis presented in Table 1-4 indicates that the reduction in the use of plastic shopping bags significantly outweighs the increase in kitchen tidy bag sales.
Table 1-4 Comparison of change in plastic carry bag and kitchen tidy bag use from 2004 to 2006
2004 2005 2006
Decrease in HDPE carry bag use from previous year (million)
510 810 560
Decrease in HDPE carry bag use from previous year (tonnes)
2 777 4 498 3 455
Increase in kitchen tidy bags sold from previous year (million)
26 31 38
Increase in kitchen tidy bags sold from previous year (tonnes)
251 300 364
Net change in materials use (tonnes) -2 526 -4 198 -3 091
Plastic bag litter
In this report, it is estimated that approximately 30 to 50 million plastic bags enter the environment as litter in Australia annually. This figure is based on two independent methodologies which generated estimates of a similar scale, which appears to indicate that the estimates are of an accurate scale.
Page 4
Plastic Retail Carry Bag Use Plastic bag data
Hyder Consulting Pty LtdABN 76 104 485 289
http://oldaus.hybis.info/sites/vc02933/F_Reports/0001_VC02933_VCR_10_Plastic bag consumption data report.doc
7/02/08 5:54 5
2 Background
2.1 Plastic bags use in Australia The plastic retail carry bag is a cheap, convenient and versatile option for the transport of shopping to its destination. Plastic bag use is prevalent across all retail sectors, including supermarket, other food and liquor, general merchandise, apparel, fast food, convenience and service stations.
The most commonly used plastic bags are made of high density polyethylene (HDPE) plastic. Other commonly used plastic bags include low density polyethylene (LDPE) plastic and polypropylene (PP) plastic for more reusable bags.
Most retail shopping bags are imported into Australia.
There is no government or industry program to measure or record plastic carry bag use in Australia. The Australian Customs Service collects data on bag imports based on type and weight of materials.
2.2 EPHC objectives In 2003, the Environment Protection and Heritage Council (EPHC) established the objective of phasing out single-use HDPE plastic bags by the end of 2008. The EPHC challenged Australian retailers to establish a National Code of Practice to achieve this objective.
In response to this challenge, the Australian Retailers’ Association (ARA) developed a National Code of Practice for the Management of Plastic Bags (ARA, 2003). This included a commitment by Group One (major supermarket) signatories to the Code to a 25% reduction in HDPE bags issued by the end of 2004 and 50% by the end of 2005, against the 2002 baseline. The ARA Code focused on HDPE carry bags. It was estimated in 2002 that HDPE bags accounted for over 85% of total carry bags by number.
The retail industry submitted regular reports to the EPHC on the progress of activity against the plastic bag reduction targets.
In its 2006 report Plastic Carry Bags: Working Towards Continuous Environmental Improvements, the Australian National Retailers Association reported that supermarkets had achieved a reduction of 45% in single–use HDPE carry bags issued, from 2002 to the end of 2005.
In its Plastic Retail Carry Bag Use 2002–2005 Consumption, 2005 end of year report, Hyder Consulting estimated that the reduction in single–use HDPE carry bag consumption from 2002 to the end of 2005 was 34.2%. It was estimated that the reduction in the supermarket sector was 41.4% and the reduction across other retail sectors was 22.9%.
Page 5
Plastic Retail Carry Bag Use Plastic bag data
Hyder Consulting Pty LtdABN 76 104 485 289
http://oldaus.hybis.info/sites/vc02933/F_Reports/0001_VC02933_VCR_10_Plastic bag consumption data report.doc
7/02/08 5:54 5
Since the conclusion of the targets at the end of 2005, there have been no plastic bag reduction targets in place for retailers and no reporting requirement. Consequently, there has been no industry reporting on plastic bag use and reduction.
2.3 Project scope In September 2007 the EPHC engaged Hyder Consulting to undertake a study to report on plastic bag use over the period January to December 2006. Plastic bag usage over the period January to December 2007 has also been provided.
The aim of this study is to estimate the level of plastic bag usage across retail sectors in 2006 and 2007 and to compare this to data presented in 2002, 2004 and 2005.
The EPHC has also engaged Hyder to report on consumption of degradable plastic bags, plastic bag alternatives such as reusable polypropylene bags and consumption of kitchen tidy bags.
With thousands of retailers and many companies operating at numerous sites across Australia, it is not possible to conduct a comprehensive survey of bag usage at a retail level. The methodology utilised in this study is therefore focussed primarily on data obtained at a bag manufacturer and import level. Supporting data has also been obtained from retailers. The same methodology has been utilised for all reports on plastic bag consumption undertaken by Hyder Consulting since 2002, to ensure consistency and comparability.
Within the scope of this project, Hyder Consulting has also developed an estimate of HDPE plastic bags entering the environment as litter annually.
The estimate of plastic bag litter has been developed utilising litter counts from the Keep Australia Beautiful 2006/07 National Litter Index.
This estimate has been compared to the estimate of between 50 and 80 million HDPE plastic bags entering the litter stream that was developed by Hyder Consulting in 2002.
Page 6
Plastic Retail Carry Bag Use Plastic bag data
Hyder Consulting Pty LtdABN 76 104 485 289
http://oldaus.hybis.info/sites/vc02933/F_Reports/0001_VC02933_VCR_10_Plastic bag consumption data report.doc
7/02/08 5:54 5
3 Domestic production & importation of carry bags
3.1 Domestic production Australian manufacturing of HDPE carry bags is limited to a small number of producers. The largest manufacturers of HDPE bags in Australia are Detmark and Andrew Kohn Pty Ltd. Both companies manufacture a range of HDPE and LDPE bags for all retail sectors.
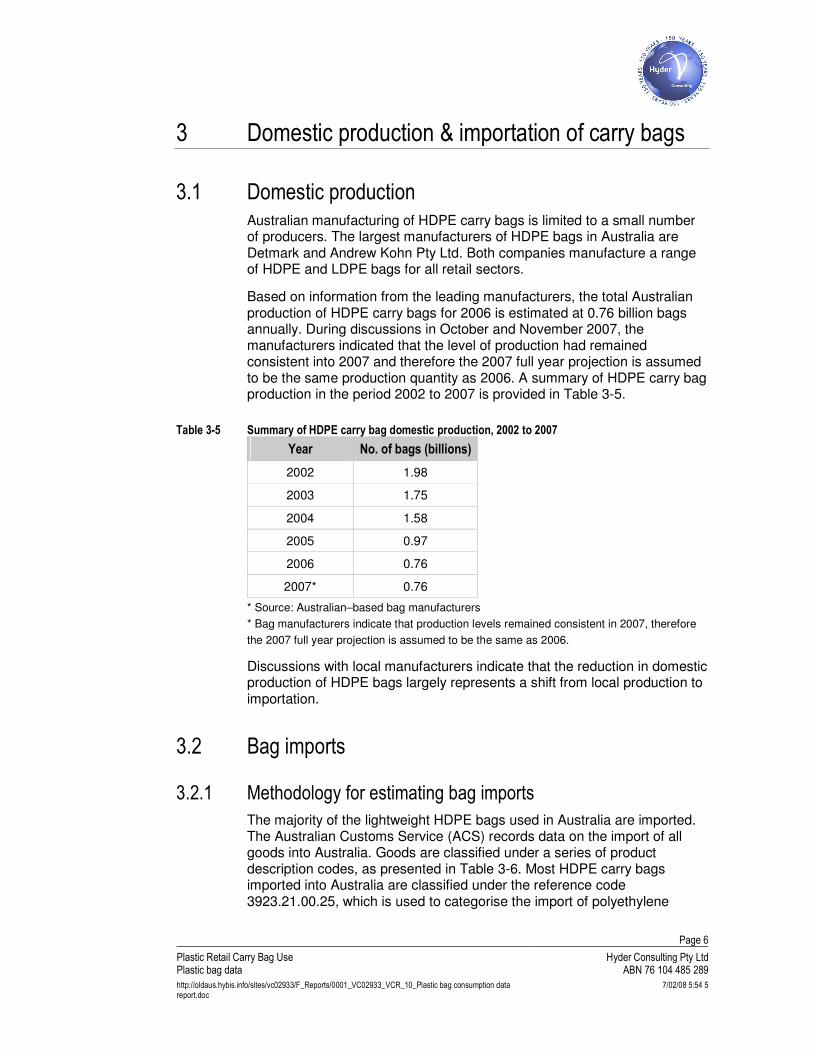
Based on information from the leading manufacturers, the total Australian production of HDPE carry bags for 2006 is estimated at 0.76 billion bags annually. During discussions in October and November 2007, the manufacturers indicated that the level of production had remained consistent into 2007 and therefore the 2007 full year projection is assumed to be the same production quantity as 2006. A summary of HDPE carry bag production in the period 2002 to 2007 is provided in Table 3-5.
Table 3-5 Summary of HDPE carry bag domestic production, 2002 to 2007
Year No. of bags (billions)
2002 1.98
2003 1.75
2004 1.58
2005 0.97
2006 0.76
2007* 0.76
* Source: Australian–based bag manufacturers
* Bag manufacturers indicate that production levels remained consistent in 2007, therefore
the 2007 full year projection is assumed to be the same as 2006.
Discussions with local manufacturers indicate that the reduction in domestic production of HDPE bags largely represents a shift from local production to importation.
3.2 Bag imports
3.2.1 Methodology for estimating bag imports
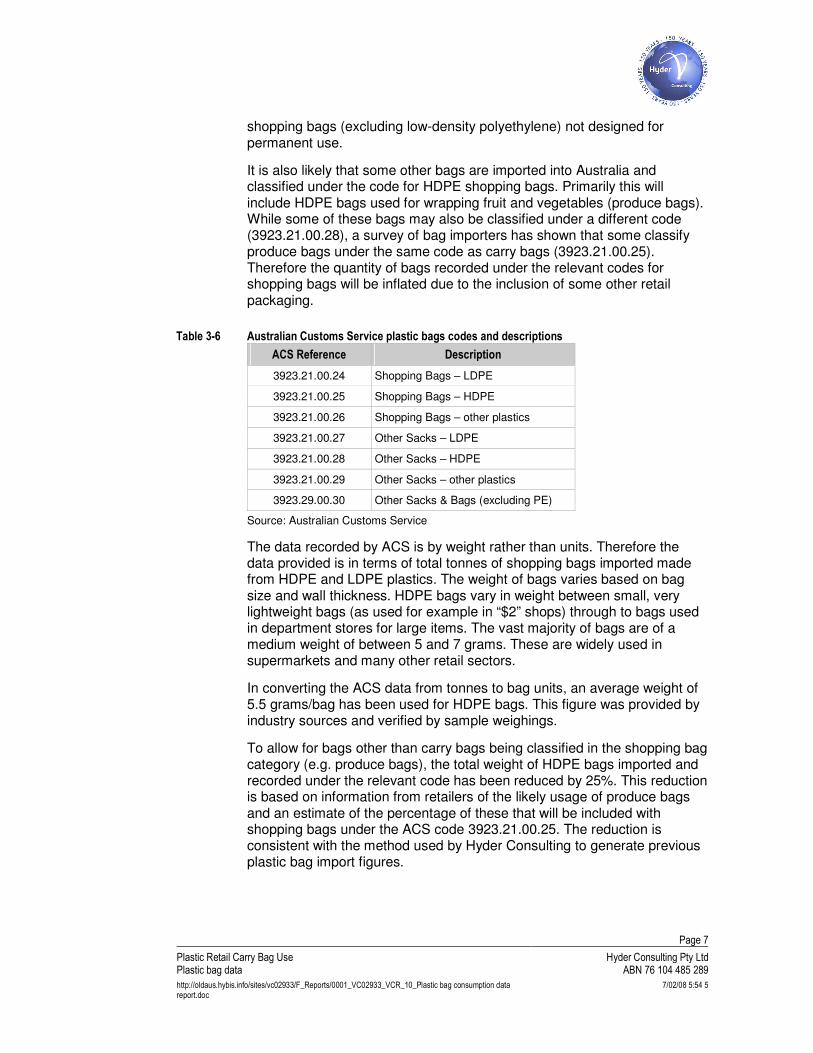
The majority of the lightweight HDPE bags used in Australia are imported. The Australian Customs Service (ACS) records data on the import of all goods into Australia. Goods are classified under a series of product description codes, as presented in Table 3-6. Most HDPE carry bags imported into Australia are classified under the reference code 3923.21.00.25, which is used to categorise the import of polyethylene
Page 7
Plastic Retail Carry Bag Use Plastic bag data
Hyder Consulting Pty LtdABN 76 104 485 289
http://oldaus.hybis.info/sites/vc02933/F_Reports/0001_VC02933_VCR_10_Plastic bag consumption data report.doc
7/02/08 5:54 5
shopping bags (excluding low-density polyethylene) not designed for permanent use.
It is also likely that some other bags are imported into Australia and classified under the code for HDPE shopping bags. Primarily this will include HDPE bags used for wrapping fruit and vegetables (produce bags). While some of these bags may also be classified under a different code (3923.21.00.28), a survey of bag importers has shown that some classify produce bags under the same code as carry bags (3923.21.00.25). Therefore the quantity of bags recorded under the relevant codes for shopping bags will be inflated due to the inclusion of some other retail packaging.
Table 3-6 Australian Customs Service plastic bags codes and descriptions
ACS Reference Description
3923.21.00.24 Shopping Bags – LDPE
3923.21.00.25 Shopping Bags – HDPE
3923.21.00.26 Shopping Bags – other plastics
3923.21.00.27 Other Sacks – LDPE
3923.21.00.28 Other Sacks – HDPE
3923.21.00.29 Other Sacks – other plastics
3923.29.00.30 Other Sacks & Bags (excluding PE)
Source: Australian Customs Service
The data recorded by ACS is by weight rather than units. Therefore the data provided is in terms of total tonnes of shopping bags imported made from HDPE and LDPE plastics. The weight of bags varies based on bag size and wall thickness. HDPE bags vary in weight between small, very lightweight bags (as used for example in “$2” shops) through to bags used in department stores for large items. The vast majority of bags are of a medium weight of between 5 and 7 grams. These are widely used in supermarkets and many other retail sectors.
In converting the ACS data from tonnes to bag units, an average weight of 5.5 grams/bag has been used for HDPE bags. This figure was provided by industry sources and verified by sample weighings.
To allow for bags other than carry bags being classified in the shopping bag category (e.g. produce bags), the total weight of HDPE bags imported and recorded under the relevant code has been reduced by 25%. This reduction is based on information from retailers of the likely usage of produce bags and an estimate of the percentage of these that will be included with shopping bags under the ACS code 3923.21.00.25. The reduction is consistent with the method used by Hyder Consulting to generate previous plastic bag import figures.
Page 8
Plastic Retail Carry Bag Use Plastic bag data
Hyder Consulting Pty LtdABN 76 104 485 289
http://oldaus.hybis.info/sites/vc02933/F_Reports/0001_VC02933_VCR_10_Plastic bag consumption data report.doc
7/02/08 5:54 5
3.2.2 Bag import levels
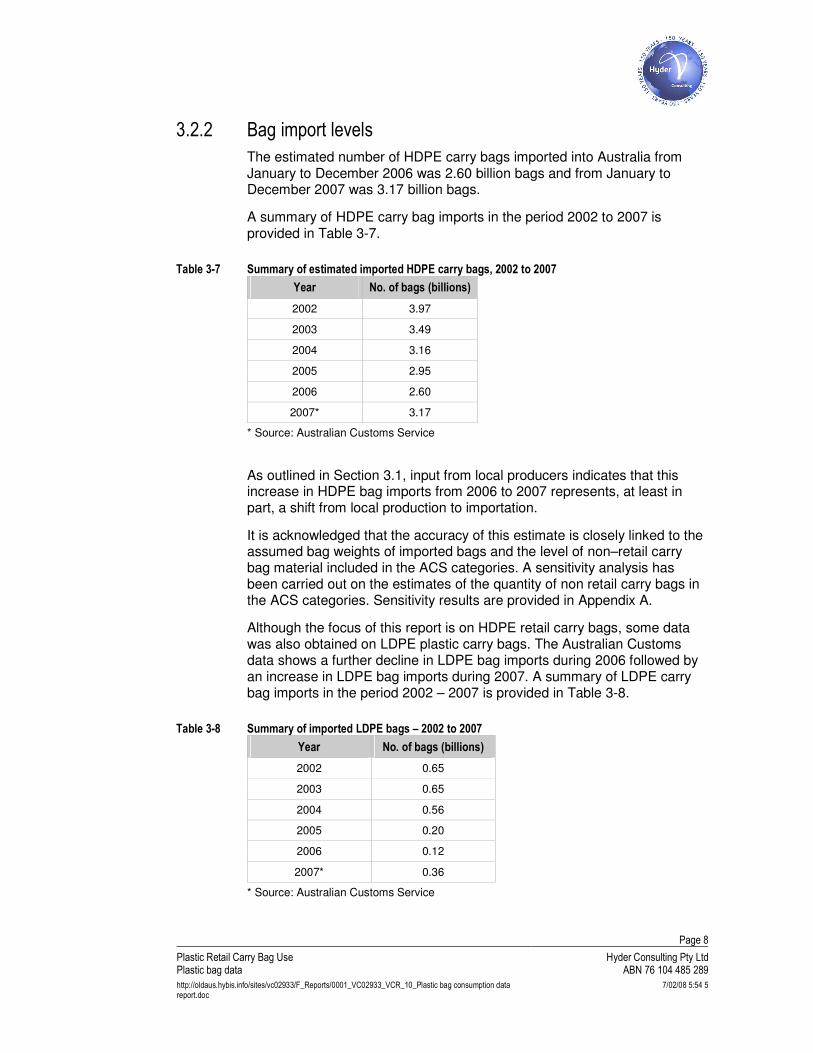
The estimated number of HDPE carry bags imported into Australia from January to December 2006 was 2.60 billion bags and from January to December 2007 was 3.17 billion bags.
A summary of HDPE carry bag imports in the period 2002 to 2007 is provided in Table 3-7.
Table 3-7 Summary of estimated imported HDPE carry bags, 2002 to 2007
Year No. of bags (billions)
2002 3.97
2003 3.49
2004 3.16
2005 2.95
2006 2.60
2007* 3.17
* Source: Australian Customs Service
As outlined in Section 3.1, input from local producers indicates that this increase in HDPE bag imports from 2006 to 2007 represents, at least in part, a shift from local production to importation.
It is acknowledged that the accuracy of this estimate is closely linked to the assumed bag weights of imported bags and the level of non–retail carry bag material included in the ACS categories. A sensitivity analysis has been carried out on the estimates of the quantity of non retail carry bags in the ACS categories. Sensitivity results are provided in Appendix A.
Although the focus of this report is on HDPE retail carry bags, some data was also obtained on LDPE plastic carry bags. The Australian Customs data shows a further decline in LDPE bag imports during 2006 followed by an increase in LDPE bag imports during 2007. A summary of LDPE carry bag imports in the period 2002 – 2007 is provided in Table 3-8.
Table 3-8 Summary of imported LDPE bags – 2002 to 2007
Year No. of bags (billions)
2002 0.65
2003 0.65
2004 0.56
2005 0.20
2006 0.12
2007* 0.36
* Source: Australian Customs Service
Page 9
Plastic Retail Carry Bag Use Plastic bag data
Hyder Consulting Pty LtdABN 76 104 485 289
http://oldaus.hybis.info/sites/vc02933/F_Reports/0001_VC02933_VCR_10_Plastic bag consumption data report.doc
7/02/08 5:54 5
In discussions with local manufacturers of LDPE bags it was apparent that this increase from 2006 to 2007 in LDPE bag imports was at least in part the result of a shift from local production to importation. This increase may also represent a shift from HDPE carry bags to LDPE carry bags.
3.3 Trends in HDPE local bag production & import During 2007, the strong downward trend in the consumption of HDPE carry bags over the period 2002 to 2006 ceased, and overall consumption of HDPE carry bags increased significantly.
The reasons for this are not explored in this study, but could include some or all of the following:
� reduced focus on bag reduction by retailers, due to the conclusion of bag reduction targets
� reduced focus on bag reduction by consumers due to shifts in environmental concerns to climate change and water supply issues
� plateauing of consumer behaviour change to reusable bags
� increased use of degradable bags leading to the perception of single–use bags as acceptable
� broader factors such as population growth or economic growth
The Australian market for lightweight HDPE carry bags is dominated by imported bags.
As outlined in Section 3.2, the estimated number of HDPE retail carry bags imported into Australia during 2006 was 2.60 billion bags and during 2007 was 3.17 billion bags. Input from local producers indicates that this increase in part represents a shift in market share from local production to importation.
This shift from local production to importation is reflected in the domestic production levels, which decreased from 0.97 billion in 2005 to 0.76 billion in both 2006 and 2007.
Over the period 2002 to 2006, total HDPE carry bag consumption steadily declined, with consumption decreasing by 43.6% from 2002 to 2006. However, the consumption of HDPE carry bags increased from 3.36 billion in 2006 to 3.93 billion in 2007, reflecting the increase in the import of HDPE carry bags during 2007.
Despite this increase from 2006 to 2007, HDPE carry bag consumption has decreased by 33.9% over the period from 2002 to 2007.
Page 10
Plastic Retail Carry Bag Use Plastic bag data
Hyder Consulting Pty LtdABN 76 104 485 289
http://oldaus.hybis.info/sites/vc02933/F_Reports/0001_VC02933_VCR_10_Plastic bag consumption data report.doc
7/02/08 5:54 5
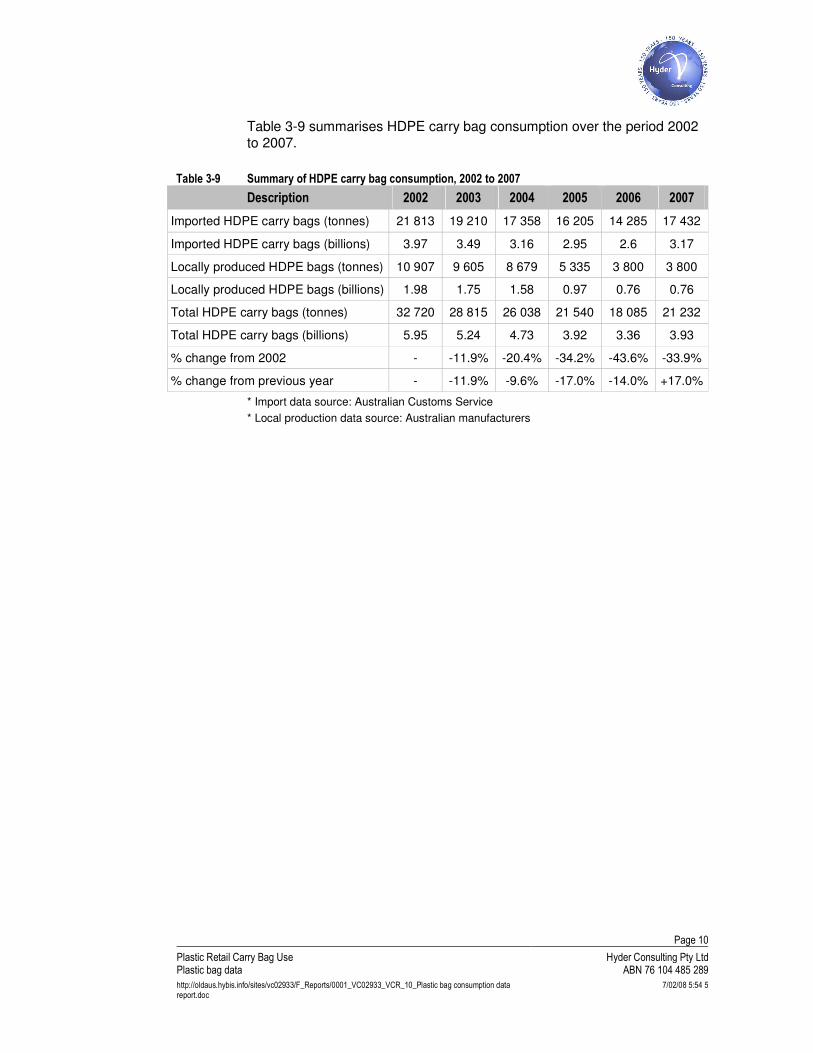
Table 3-9 summarises HDPE carry bag consumption over the period 2002 to 2007.
Table 3-9 Summary of HDPE carry bag consumption, 2002 to 2007
Description 2002 2003 2004 2005 2006 2007
Imported HDPE carry bags (tonnes) 21 813 19 210 17 358 16 205 14 285 17 432
Imported HDPE carry bags (billions) 3.97 3.49 3.16 2.95 2.6 3.17
Locally produced HDPE bags (tonnes) 10 907 9 605 8 679 5 335 3 800 3 800
Locally produced HDPE bags (billions) 1.98 1.75 1.58 0.97 0.76 0.76
Total HDPE carry bags (tonnes) 32 720 28 815 26 038 21 540 18 085 21 232
Total HDPE carry bags (billions) 5.95 5.24 4.73 3.92 3.36 3.93
% change from 2002 - -11.9% -20.4% -34.2% -43.6% -33.9%
% change from previous year - -11.9% -9.6% -17.0% -14.0% +17.0%
* Import data source: Australian Customs Service
* Local production data source: Australian manufacturers
Page 11
Plastic Retail Carry Bag Use Plastic bag data
Hyder Consulting Pty LtdABN 76 104 485 289
http://oldaus.hybis.info/sites/vc02933/F_Reports/0001_VC02933_VCR_10_Plastic bag consumption data report.doc
7/02/08 5:54 5
4 Retail sector use
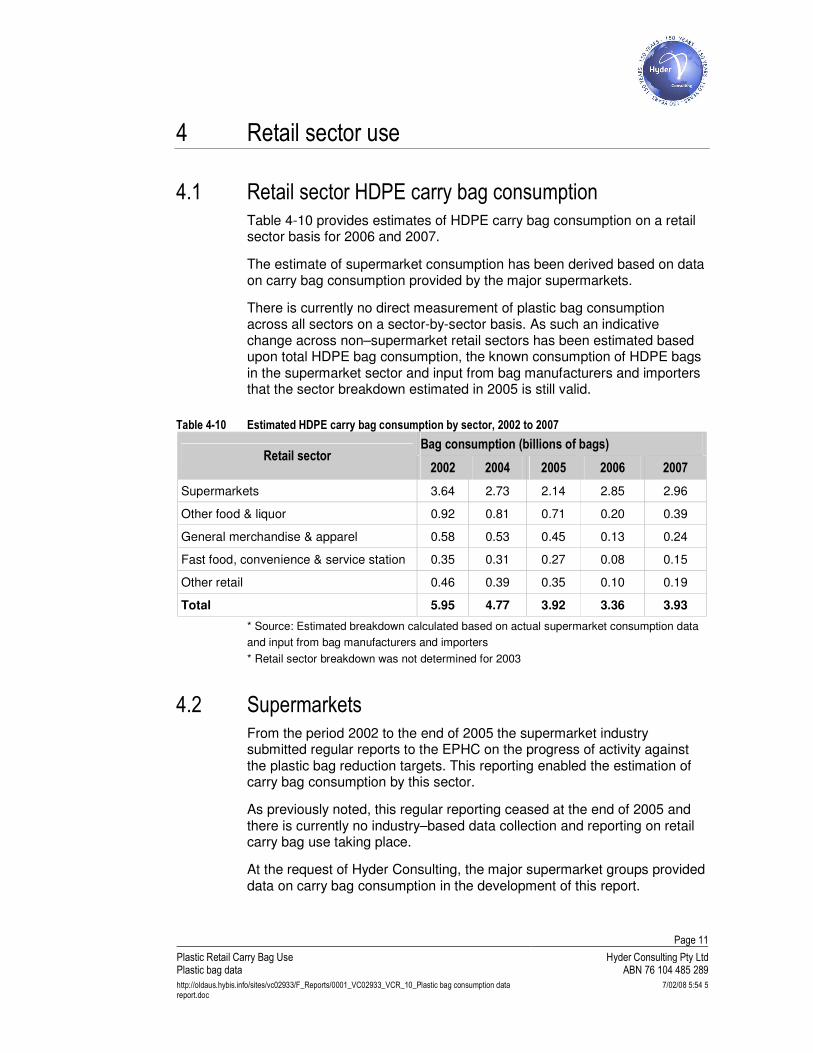
4.1 Retail sector HDPE carry bag consumption Table 4-10 provides estimates of HDPE carry bag consumption on a retail sector basis for 2006 and 2007.
The estimate of supermarket consumption has been derived based on data on carry bag consumption provided by the major supermarkets.
There is currently no direct measurement of plastic bag consumption across all sectors on a sector-by-sector basis. As such an indicative change across non–supermarket retail sectors has been estimated based upon total HDPE bag consumption, the known consumption of HDPE bags in the supermarket sector and input from bag manufacturers and importers that the sector breakdown estimated in 2005 is still valid.
Table 4-10 Estimated HDPE carry bag consumption by sector, 2002 to 2007
Bag consumption (billions of bags) Retail sector
2002 2004 2005 2006 2007
Supermarkets 3.64 2.73 2.14 2.85 2.96
Other food & liquor 0.92 0.81 0.71 0.20 0.39
General merchandise & apparel 0.58 0.53 0.45 0.13 0.24
Fast food, convenience & service station 0.35 0.31 0.27 0.08 0.15
Other retail 0.46 0.39 0.35 0.10 0.19
Total 5.95 4.77 3.92 3.36 3.93
* Source: Estimated breakdown calculated based on actual supermarket consumption data
and input from bag manufacturers and importers
* Retail sector breakdown was not determined for 2003
4.2 Supermarkets From the period 2002 to the end of 2005 the supermarket industry submitted regular reports to the EPHC on the progress of activity against the plastic bag reduction targets. This reporting enabled the estimation of carry bag consumption by this sector.
As previously noted, this regular reporting ceased at the end of 2005 and there is currently no industry–based data collection and reporting on retail carry bag use taking place.
At the request of Hyder Consulting, the major supermarket groups provided data on carry bag consumption in the development of this report.
Page 12
Plastic Retail Carry Bag Use Plastic bag data
Hyder Consulting Pty LtdABN 76 104 485 289
http://oldaus.hybis.info/sites/vc02933/F_Reports/0001_VC02933_VCR_10_Plastic bag consumption data report.doc
7/02/08 5:54 5
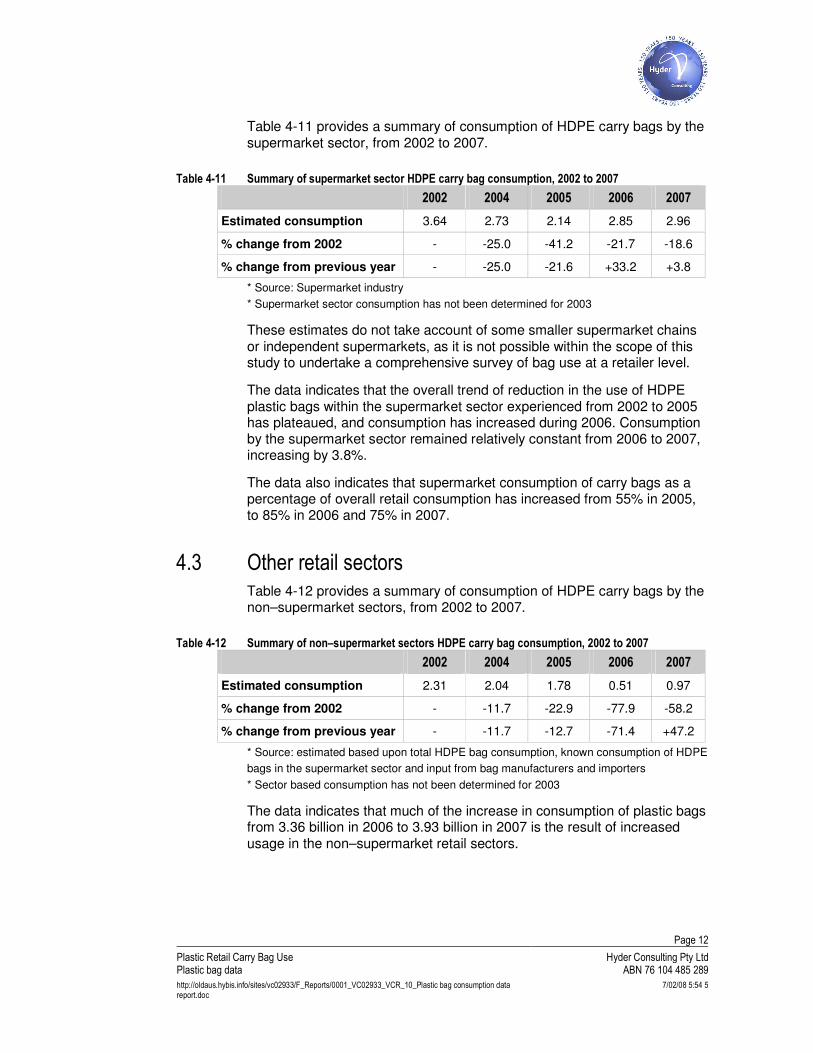
Table 4-11 provides a summary of consumption of HDPE carry bags by the supermarket sector, from 2002 to 2007.
Table 4-11 Summary of supermarket sector HDPE carry bag consumption, 2002 to 2007
2002 2004 2005 2006 2007
Estimated consumption 3.64 2.73 2.14 2.85 2.96
% change from 2002 - -25.0 -41.2 -21.7 -18.6
% change from previous year - -25.0 -21.6 +33.2 +3.8
* Source: Supermarket industry
* Supermarket sector consumption has not been determined for 2003
These estimates do not take account of some smaller supermarket chains or independent supermarkets, as it is not possible within the scope of this study to undertake a comprehensive survey of bag use at a retailer level.
The data indicates that the overall trend of reduction in the use of HDPE plastic bags within the supermarket sector experienced from 2002 to 2005 has plateaued, and consumption has increased during 2006. Consumption by the supermarket sector remained relatively constant from 2006 to 2007, increasing by 3.8%.
The data also indicates that supermarket consumption of carry bags as a percentage of overall retail consumption has increased from 55% in 2005, to 85% in 2006 and 75% in 2007.
4.3 Other retail sectors Table 4-12 provides a summary of consumption of HDPE carry bags by the non–supermarket sectors, from 2002 to 2007.
Table 4-12 Summary of non–supermarket sectors HDPE carry bag consumption, 2002 to 2007
2002 2004 2005 2006 2007
Estimated consumption 2.31 2.04 1.78 0.51 0.97
% change from 2002 - -11.7 -22.9 -77.9 -58.2
% change from previous year - -11.7 -12.7 -71.4 +47.2
* Source: estimated based upon total HDPE bag consumption, known consumption of HDPE
bags in the supermarket sector and input from bag manufacturers and importers
* Sector based consumption has not been determined for 2003
The data indicates that much of the increase in consumption of plastic bags from 3.36 billion in 2006 to 3.93 billion in 2007 is the result of increased usage in the non–supermarket retail sectors.
Page 13
Plastic Retail Carry Bag Use Plastic bag data
Hyder Consulting Pty LtdABN 76 104 485 289
http://oldaus.hybis.info/sites/vc02933/F_Reports/0001_VC02933_VCR_10_Plastic bag consumption data report.doc
7/02/08 5:54 5
5 Degradable retail carry bags
5.1 Definitions Plastic bags that can be broken down by chemical or biological processes are described broadly as degradable. There are many types of degradable plastics which have been introduced into the Australian market in recent years.
In October 2003 the Environment Protection and Heritage Council, comprised of Australian Environment Ministers, initiated the development of Australian Standards for Degradable Plastics by Standards Australia, in response to the following:
� the need to develop consensus on common definitions of degradability for plastics
� the potential impacts of the use of biodegradable plastics on the environment
� the potential effects on established recycling systems and technologies
� to enable verification that polymers comply with claims made about their performance
Standards Australia is developing standards for the range of degradable plastics, and to date has release the AS4376–2006 Biodegradable plastics – Biodegradable plastics suitable for composting and other microbial treatment in November 2006. A standard for oxo–degradable plastics is currently in development.
Oxo–degradable plastics
Oxo–degradable polymers undergo controlled degradation through the incorporation of ‘prodegradant’ additives (additives that can trigger and accelerate the degradation process). These polymers undergo accelerated oxidative defined degradation initiated by natural daylight, heat and/or mechanical stress, and embrittle in the environment and erode under the influence of weathering (Nolan ITU et al, 2003).
Plastic bags manufactured with EPI’s Totally Degradable Plastics Additives (TDPA™) (www.epi-global.com) are the most prevalent oxo–degradable plastic bags used in Australia.
Biodegradable plastics
Biodegradable plastics are defined by the Australian Standard as those which have “the ability to be broken down by micro-organisms in the presence of oxygen (aerobic) to carbon dioxide, water, biomass and mineral salts or any other elements that are present (mineralization). Alternatively, the breakdown of organic substances by micro-organisms
Page 14
Plastic Retail Carry Bag Use Plastic bag data
Hyder Consulting Pty LtdABN 76 104 485 289
http://oldaus.hybis.info/sites/vc02933/F_Reports/0001_VC02933_VCR_10_Plastic bag consumption data report.doc
7/02/08 5:54 5
without the presence of oxygen (anaerobic) to carbon dioxide, methane, water and biomass” (Standards Australia, 2006).
There are a wide range of biodegradable plastics available, the most commonly used being compostable. A polymer is “compostable” when it is biodegradable under composting conditions. The Australian Standard defines composting as “the aerobic and thermophilic degradation of organic matter to make compost” (Standards Australia, 2006).
Bags made of a bio–polymer called Mater-Bi, the main components of which are starch and biodegradable polyester (www.materbi.com), are currently the most commonly used compostable bag in Australia.
5.2 Consumption of degradable carry bags
5.2.1 Oxo–degradable bags
Oxo–degradable plastic bags are relatively cost–competitive with conventional plastic bags and readily available in small or large order quantities.
Input from local bag suppliers and retailers indicates that oxo–degradable plastic bags account for less than 10% of bags consumed within volume supermarkets. In smaller retail sectors, where consumption of plastic bags is lower and sensitivity to price differentials on carry bag options is less significant, consumption of oxo–degradable plastic bags is estimated to be between 10% and 15% of total shopping bag consumption.
Based on the sector–based consumption of total carry bags, it is estimated that:
� during 2006, 361 million or 10.76% of the 3.36 billion HDPE carry bags were oxo–degradable, which consist of 285 million consumed by the supermarket sector and 76 million consumed by the non–supermarket retail sectors
� during 2007, 441 million or 11.23% of the 3.93 billion HDPE carry bags were oxo–degradable, which consist of 296 million consumed by the supermarket sector and 145 million consumed by the non–supermarket retail sectors
Input from bag manufacturers, importers and suppliers, and observations undertaken by Hyder Consulting, indicates that oxo–degradable shopping bags are most commonly used by non–major and independent supermarkets, convenience stores, other food stores such as butchers and green grocers and market vendors.
Based on input from bag manufacturers and importers, it is believed that the vast majority of oxo–degradable shopping bags consumed in Australia
Page 15
Plastic Retail Carry Bag Use Plastic bag data
Hyder Consulting Pty LtdABN 76 104 485 289
http://oldaus.hybis.info/sites/vc02933/F_Reports/0001_VC02933_VCR_10_Plastic bag consumption data report.doc
7/02/08 5:54 5
are imported. A small proportion of oxo–degradable bags consumed are locally produced.
5.2.2 Compostable carry bags
Input from bag manufacturers and importers indicates that the use of compostable bags within the retail sector is currently very limited to retailers of environmentally responsible products or services, such as organic food stores, eco–tourism operators, natural beauty products stores and government agencies.
This is considered to be due to the fact that compostable bags cost approximately 10 times that of a conventional plastic carry bag.
Input from bag manufacturers, importers and suppliers indicates that there is a high level of interest in compostable bags from the retail sector, and that their consumption may increase as they become more cost–competitive.
Based on input from bag manufacturers and importers, it is estimated that approximately 100 000 carry bags which comply with AS4376–2006 Biodegradable plastics – Biodegradable plastics suitable for composting and other microbial treatment are currently sold in Australia annually. The vast majority of those bags consumed in Australia are imported, however there are a small number of domestic producers.
The bag manufacturers and importers contacted indicated that they believe that in the order of ten times as many carry bags which claim to be compostable but do not comply with AS4376 are sold in Australia per annum.
Page 16
Plastic Retail Carry Bag Use Plastic bag data
Hyder Consulting Pty LtdABN 76 104 485 289
http://oldaus.hybis.info/sites/vc02933/F_Reports/0001_VC02933_VCR_10_Plastic bag consumption data report.doc
7/02/08 5:54 5
6 Consumption of plastic bag alternatives
The move away from lightweight single–use HDPE carry bags has led to increased use in alternative forms of shopping bags, both single–use and reusable, manufactured from a wide range of materials.
6.1 Reusable bags The most commonly used reusable bags are manufactured from polypropylene. They are strong and durable, and can hold more than a conventional single use HDPE carry bag.
Since the introduction of the reusable ‘green’ bag into the Australian retail market in 2002, their use as a retail carry bag has surged rapidly.
Other less common reusable bag types include calico, cotton, string and hemp.
Reusable bags are marketed as environmentally preferred, and often as functionally superior, more comfortable and easier to carry than plastic bags.
Consumer market research undertaken by Sustainability Victoria in 2007 found that 94% of households have at least one reusable bag, ranging to as many as 30 reusable bags, with the average number per household being nine. When asked what types of shopping bags they could think of, the most top of mind type of bag was the ‘Coles Green bag’ at 71%, compared to the ‘plastic bag’ at 58%.
Reusable bags have become a very visible and valuable marketing tool, and there are many examples of reusable bags being provided free of charge by fashion stores, shopping centres, banks, real estate agencies and local Members of Parliament. Some government agencies, local governments and community groups distribute free reusable bags as part of programs to encourage shoppers to reduce plastic bag use.
It has not been possible to estimate the number of polypropylene reusable bags sold in Australia per annum due to the following reasons:
� companies importing reusable bags typically use the Australian Customs Service reference code 420.292.90, which includes a broad range of bags, including trunks, vanity cases, brief cases, toilet bags and shopping bags, made with an outer surface of plastic sheeting or of textile material. Due to the large number of products that could be classified under this code, it is not possible to determine what percentage of the products categorised under this code would be reusable shopping bags.
� industry participants were unable to estimate the market size due to the large number and different types of companies that are currently importing reusable bags.
Page 17
Plastic Retail Carry Bag Use Plastic bag data
Hyder Consulting Pty LtdABN 76 104 485 289
http://oldaus.hybis.info/sites/vc02933/F_Reports/0001_VC02933_VCR_10_Plastic bag consumption data report.doc
7/02/08 5:54 5
The percentage of shopping transactions which involve the use of reusable bags is possibly a more useful indicator of the adoption of reusable bags than sales figures.
Shopping observations conducted by Hyder Consulting indicate that 72% of reusable polypropylene carry bags in use are store–purchased, for example the ‘Green bag’, and 28% of reusable polypropylene carry bags in use are those that have been provided to the shopper free of charge.
It is believed that either all or the vast majority of polypropylene retail carry bags used in Australia are imported. The Australian bag manufacturers and suppliers consulted in the development of this report advised that they do not manufacture polypropylene bags in Australia, and they were not aware of any Australian based manufacturers of polypropylene bags. It is also believed that there may be some confusion regarding the origin of reusable bags that are manufactured overseas and screen–printed in Australia.
6.2 Consumer carry bag behaviours From September to November 2007, Hyder Consulting conducted over 800 retail sale exit observations in metropolitan Melbourne and one regional town in Victoria to identify the range of bags used. These observations were conducted at a range of locations – inner city, suburban and regional; shopping centres, retail strips and markets – across all retail sectors: supermarket; other food and liquor; general merchandise and apparel; fast food, convenience and service station; and other retail. Observations were also conducted at retail outlets that charge a fee for single–use bags to enable analysis of the impact of a charge on consumption.
A detailed summary of the shopping observations is provided in Appendix B.
Within stores that do not charge for single–use bags, 72% of transactions involved a single–use bag, made of either HDPE, LDPE or paper, 13% of transactions involved a designed for purpose reusable carry bag and 15% of transactions did not involve the provision or use of a carry bag. In these circumstances, the shopper either placed their shopping in a trolley, backpack or handbag, a shopping bag that they already had or simply carried their purchase.
Within stores that charge a fee for single–use bags provided, 27% of transactions involved a single–use bag, 33% of transactions involved a reusable carry bag and 40% of transactions did not involve the provision of a carry bag.
Carry bag use, as reflected by the exit observations conducted, are summarised in Table 6-13.
Page 18
Plastic Retail Carry Bag Use Plastic bag data
Hyder Consulting Pty LtdABN 76 104 485 289
http://oldaus.hybis.info/sites/vc02933/F_Reports/0001_VC02933_VCR_10_Plastic bag consumption data report.doc
7/02/08 5:54 5
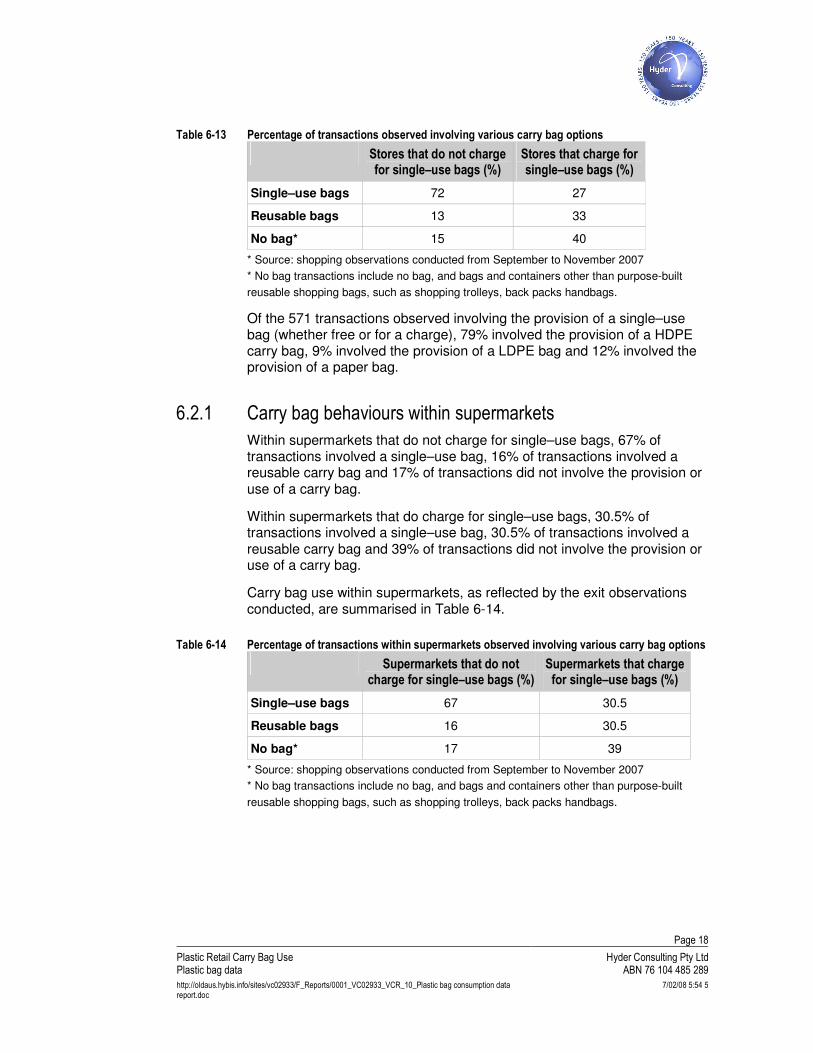
Table 6-13 Percentage of transactions observed involving various carry bag options
Stores that do not charge for single–use bags (%)
Stores that charge for single–use bags (%)
Single–use bags 72 27
Reusable bags 13 33
No bag* 15 40
* Source: shopping observations conducted from September to November 2007
* No bag transactions include no bag, and bags and containers other than purpose-built
reusable shopping bags, such as shopping trolleys, back packs handbags.
Of the 571 transactions observed involving the provision of a single–use bag (whether free or for a charge), 79% involved the provision of a HDPE carry bag, 9% involved the provision of a LDPE bag and 12% involved the provision of a paper bag.
6.2.1 Carry bag behaviours within supermarkets
Within supermarkets that do not charge for single–use bags, 67% of transactions involved a single–use bag, 16% of transactions involved a reusable carry bag and 17% of transactions did not involve the provision or use of a carry bag.
Within supermarkets that do charge for single–use bags, 30.5% of transactions involved a single–use bag, 30.5% of transactions involved a reusable carry bag and 39% of transactions did not involve the provision or use of a carry bag.
Carry bag use within supermarkets, as reflected by the exit observations conducted, are summarised in Table 6-14.
Table 6-14 Percentage of transactions within supermarkets observed involving various carry bag options
Supermarkets that do not charge for single–use bags (%)
Supermarkets that charge for single–use bags (%)
Single–use bags 67 30.5
Reusable bags 16 30.5
No bag* 17 39
* Source: shopping observations conducted from September to November 2007
* No bag transactions include no bag, and bags and containers other than purpose-built
reusable shopping bags, such as shopping trolleys, back packs handbags.
Page 19
Plastic Retail Carry Bag Use Plastic bag data
Hyder Consulting Pty LtdABN 76 104 485 289
http://oldaus.hybis.info/sites/vc02933/F_Reports/0001_VC02933_VCR_10_Plastic bag consumption data report.doc
7/02/08 5:54 5
7 Sales of kitchen tidy bag products
Due to their usefulness and adaptability, plastic carry bags are commonly reused once their primary function has been completed.
Consumer market research undertaken by Sustainability Victoria in 2007 found that 67% of respondents reuse plastic shopping bags as bin liners, with other uses including gym bags, lunch bags and pet waste bags (Ipsos Australia, 2007).
While any subsequent reuse of a product reduces its life cycle impact, a single descending use leading into disposal should not be considered to be comparable to multiple reuses of a product for the purpose for which it was designed, e.g. the reusable bag. Life cycle assessments of shopping bag alternatives have shown considerable environmental savings for bags which are reused multiple times (Hyder Consulting and Centre for Design at RMIT, 2007).
It is often argued that the environmental gains achieved through a reduction in the consumption of plastic carry bags could be reduced or offset by the environmental impacts of increased use of other plastic bag products such as kitchen tidy bags.
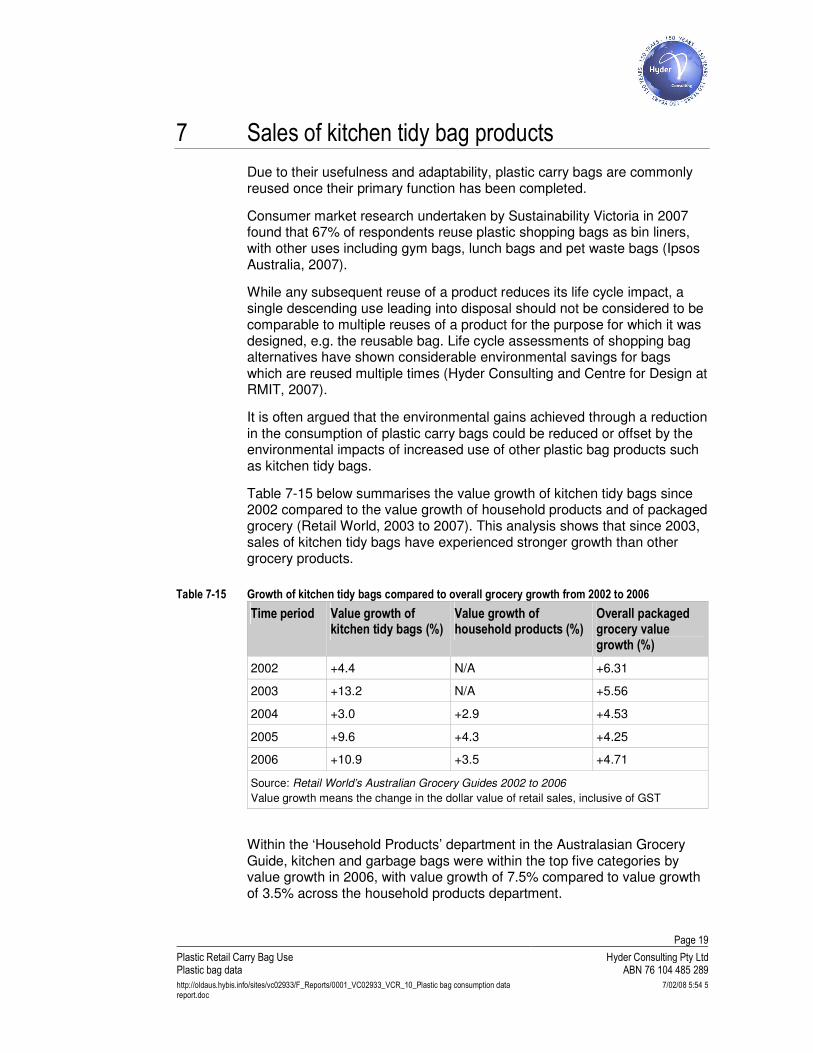
Table 7-15 below summarises the value growth of kitchen tidy bags since 2002 compared to the value growth of household products and of packaged grocery (Retail World, 2003 to 2007). This analysis shows that since 2003, sales of kitchen tidy bags have experienced stronger growth than other grocery products.
Table 7-15 Growth of kitchen tidy bags compared to overall grocery growth from 2002 to 2006
Time period Value growth of kitchen tidy bags (%)
Value growth of household products (%)
Overall packaged grocery value growth (%)
2002 +4.4 N/A +6.31
2003 +13.2 N/A +5.56
2004 +3.0 +2.9 +4.53
2005 +9.6 +4.3 +4.25
2006 +10.9 +3.5 +4.71
Source: Retail World’s Australian Grocery Guides 2002 to 2006
Value growth means the change in the dollar value of retail sales, inclusive of GST
Within the ‘Household Products’ department in the Australasian Grocery Guide, kitchen and garbage bags were within the top five categories by value growth in 2006, with value growth of 7.5% compared to value growth of 3.5% across the household products department.
Page 20
Plastic Retail Carry Bag Use Plastic bag data
Hyder Consulting Pty LtdABN 76 104 485 289
http://oldaus.hybis.info/sites/vc02933/F_Reports/0001_VC02933_VCR_10_Plastic bag consumption data report.doc
7/02/08 5:54 5
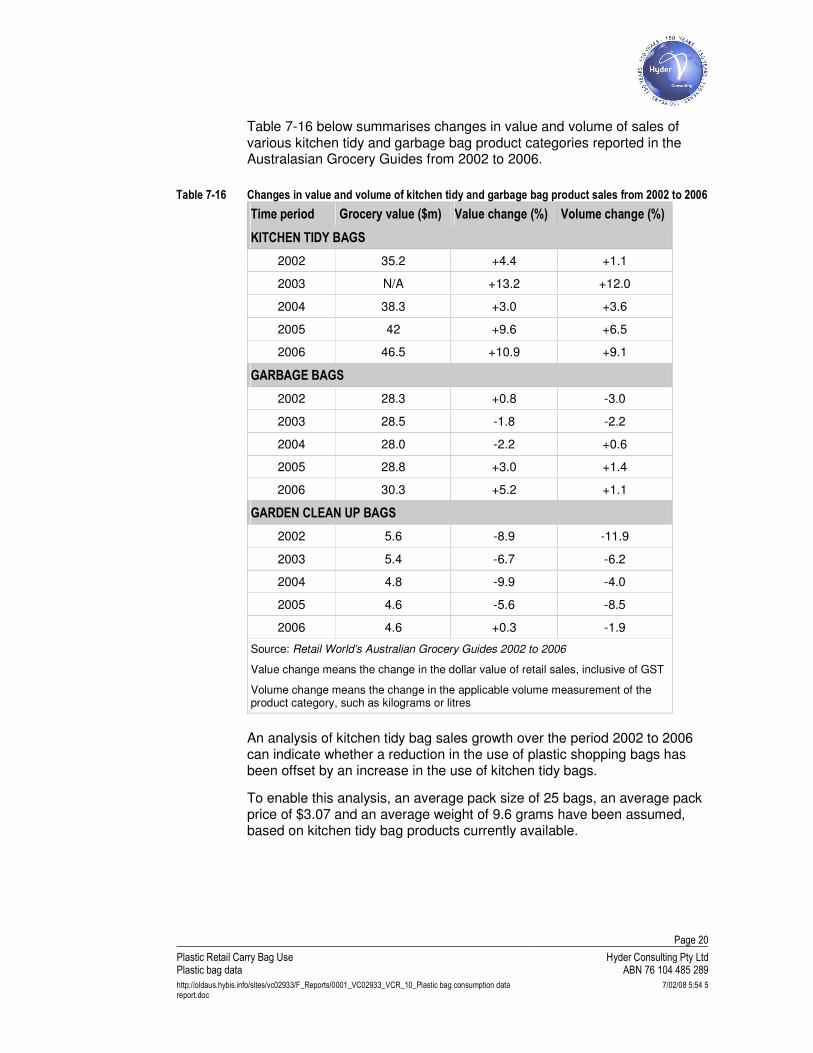
Table 7-16 below summarises changes in value and volume of sales of various kitchen tidy and garbage bag product categories reported in the Australasian Grocery Guides from 2002 to 2006.
Table 7-16 Changes in value and volume of kitchen tidy and garbage bag product sales from 2002 to 2006
Time period Grocery value ($m) Value change (%) Volume change (%)
KITCHEN TIDY BAGS
2002 35.2 +4.4 +1.1
2003 N/A +13.2 +12.0
2004 38.3 +3.0 +3.6
2005 42 +9.6 +6.5
2006 46.5 +10.9 +9.1
GARBAGE BAGS
2002 28.3 +0.8 -3.0
2003 28.5 -1.8 -2.2
2004 28.0 -2.2 +0.6
2005 28.8 +3.0 +1.4
2006 30.3 +5.2 +1.1
GARDEN CLEAN UP BAGS
2002 5.6 -8.9 -11.9
2003 5.4 -6.7 -6.2
2004 4.8 -9.9 -4.0
2005 4.6 -5.6 -8.5
2006 4.6 +0.3 -1.9
Source: Retail World’s Australian Grocery Guides 2002 to 2006
Value change means the change in the dollar value of retail sales, inclusive of GST
Volume change means the change in the applicable volume measurement of the product category, such as kilograms or litres
An analysis of kitchen tidy bag sales growth over the period 2002 to 2006 can indicate whether a reduction in the use of plastic shopping bags has been offset by an increase in the use of kitchen tidy bags.
To enable this analysis, an average pack size of 25 bags, an average pack price of $3.07 and an average weight of 9.6 grams have been assumed, based on kitchen tidy bag products currently available.
Page 21
Plastic Retail Carry Bag Use Plastic bag data
Hyder Consulting Pty LtdABN 76 104 485 289
http://oldaus.hybis.info/sites/vc02933/F_Reports/0001_VC02933_VCR_10_Plastic bag consumption data report.doc
7/02/08 5:54 5
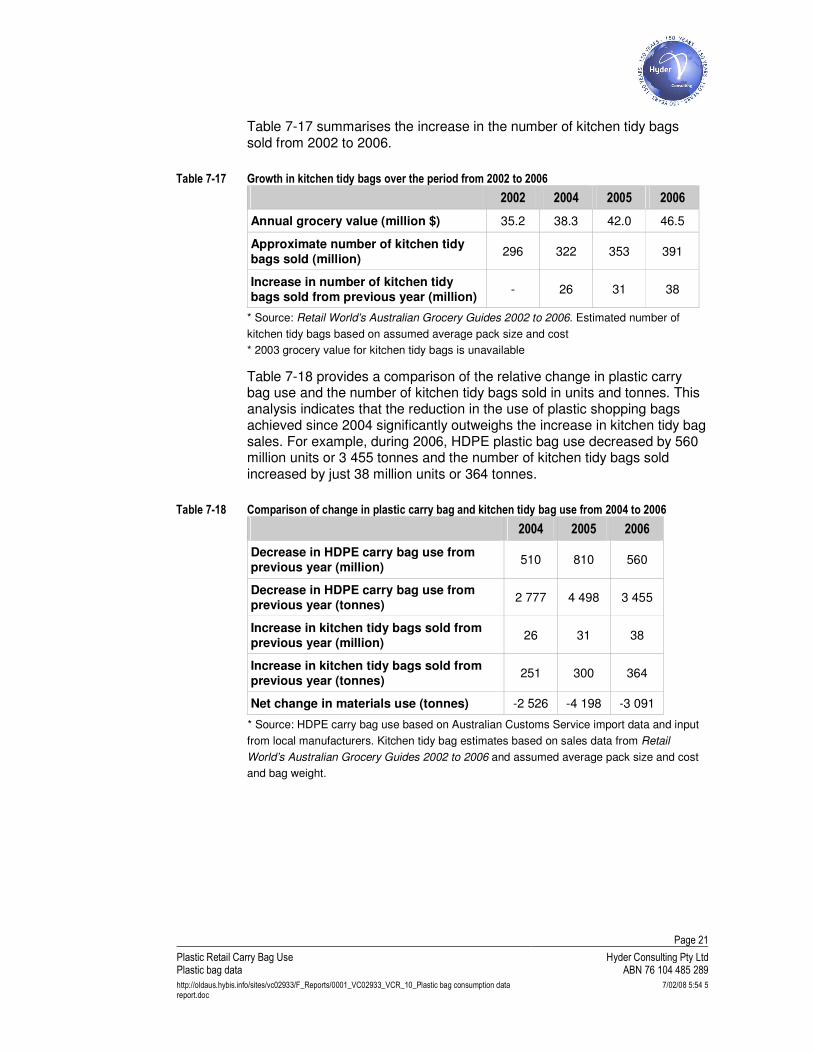
Table 7-17 summarises the increase in the number of kitchen tidy bags sold from 2002 to 2006.
Table 7-17 Growth in kitchen tidy bags over the period from 2002 to 2006
2002 2004 2005 2006
Annual grocery value (million $) 35.2 38.3 42.0 46.5
Approximate number of kitchen tidy bags sold (million)
296 322 353 391
Increase in number of kitchen tidy bags sold from previous year (million)
- 26 31 38
* Source: Retail World’s Australian Grocery Guides 2002 to 2006. Estimated number of
kitchen tidy bags based on assumed average pack size and cost
* 2003 grocery value for kitchen tidy bags is unavailable
Table 7-18 provides a comparison of the relative change in plastic carry bag use and the number of kitchen tidy bags sold in units and tonnes. This analysis indicates that the reduction in the use of plastic shopping bags achieved since 2004 significantly outweighs the increase in kitchen tidy bag sales. For example, during 2006, HDPE plastic bag use decreased by 560 million units or 3 455 tonnes and the number of kitchen tidy bags sold increased by just 38 million units or 364 tonnes.
Table 7-18 Comparison of change in plastic carry bag and kitchen tidy bag use from 2004 to 2006
2004 2005 2006
Decrease in HDPE carry bag use from previous year (million)
510 810 560
Decrease in HDPE carry bag use from previous year (tonnes)
2 777 4 498 3 455
Increase in kitchen tidy bags sold from previous year (million)
26 31 38
Increase in kitchen tidy bags sold from previous year (tonnes)
251 300 364
Net change in materials use (tonnes) -2 526 -4 198 -3 091
* Source: HDPE carry bag use based on Australian Customs Service import data and input
from local manufacturers. Kitchen tidy bag estimates based on sales data from Retail
World’s Australian Grocery Guides 2002 to 2006 and assumed average pack size and cost
and bag weight.
Page 22
Plastic Retail Carry Bag Use Plastic bag data
Hyder Consulting Pty LtdABN 76 104 485 289
http://oldaus.hybis.info/sites/vc02933/F_Reports/0001_VC02933_VCR_10_Plastic bag consumption data report.doc
7/02/08 5:54 5
8 Plastic bag litter
Of the billions of HDPE and LDPE plastic bags distributed annually in Australia, a certain percentage are littered, either directly by consumers or from being blown out of the garbage stream and landfills.
Plastic bags are a highly visible and persistent component of the litter stream, because they are lightweight (and therefore easily become airborne), moisture resistant (float on waterways) and generally only degrade over a long period of time.
Some shopping bags manufactured using degradable or biodegradable plastic may have the advantage of reduced impact in the litter stream due to faster degradation than conventional plastic bags.
8.1 Estimating plastic bag litter in 2006/07 In order to estimate the number of HDPE plastic bags entering the environment as litter annually, an analysis of the Keep Australia Beautiful National Litter Index 2006/07 was undertaken.
With the support of the Australian Federal and State Governments, Keep Australia Beautiful undertakes a bi–annual litter count and develops an annual National Litter Index report.
Litter counts are conducted in November and May each year covering 983 sites. These sites are divided into eight site types: beaches, car parks, highways, industrial, recreational parks, residential, retail and shopping centres.
The annual results for 2006/07 indicate that HDPE plastic bags account for 1.3% of the litter stream by item, excluding cigarette butts which account for approximately 50% of littered items. HDPE plastic bags account for 0.18% of the litter stream by volume, excluding cigarette butts.
Beaches and industrial sites have the greatest number of plastic bags per 1 000 square metres, with 2.9 and 1.7 respectively.
Estimating plastic bag litter across Australia using the National Litter Index results involves extrapolating a very small sample area to a very large land area, i.e. Australia. As such, the estimate developed utilising the National Litter Index results should only be considered to be of the scale of plastic bags entering the environment as litter annually, rather than providing a precise figure.
The National Litter Index counts were undertaken in sites in urban and near–urban areas of the state and territory capital cities. Extrapolating the National Litter Index 2006/07 results, it is estimated that approximately 26 million HDPE plastic bags entered the environment as litter across the capital cities of Australia in 2006/07. Table 8-19 presents the calculation of this estimate.
Page 23
Plastic Retail Carry Bag Use Plastic bag data
Hyder Consulting Pty LtdABN 76 104 485 289
http://oldaus.hybis.info/sites/vc02933/F_Reports/0001_VC02933_VCR_10_Plastic bag consumption data report.doc
7/02/08 5:54 5
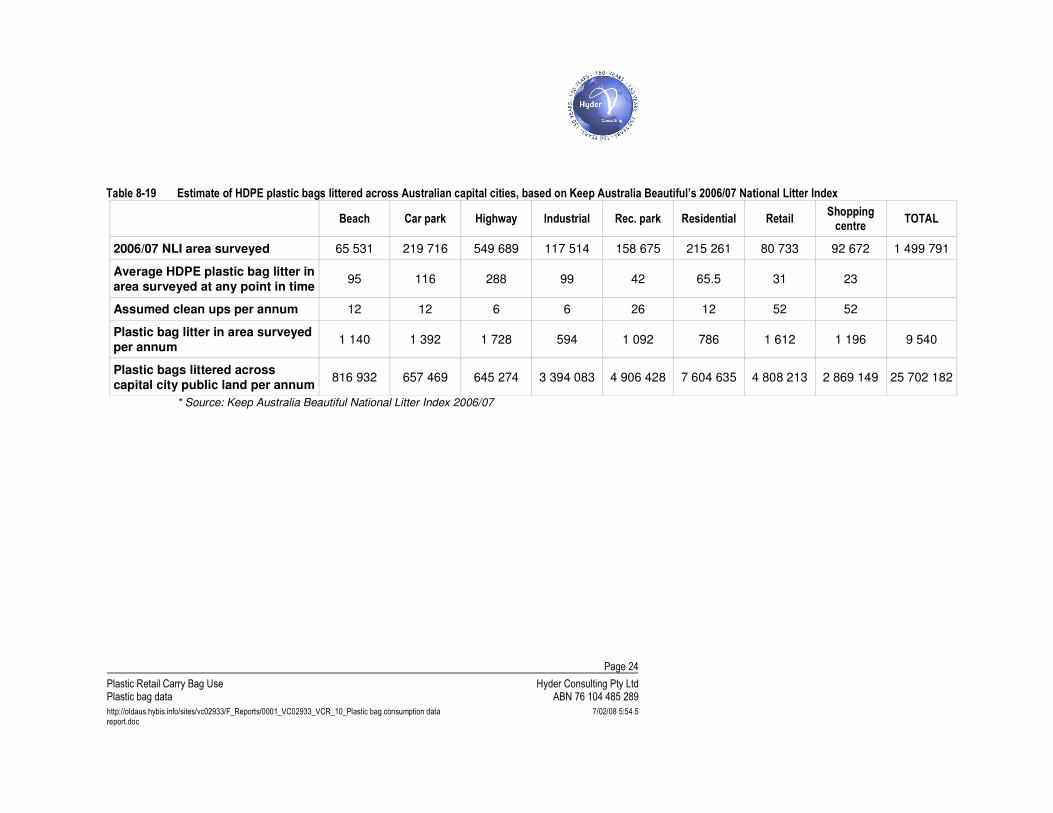
To estimate the amount of plastic bags entering the environment as litter across Australia, this figure is extrapolated based on population. According to the Australian Bureau of Statistics, approximately 64% of Australia’s population resides in capital cities. Therefore, it is estimated that 40 million HDPE plastic bags entered the environment as litter across Australia during 2006/07.
It is considered that the estimate developed utilising the National Litter Index would further under–estimate the amount of HDPE plastic bag litter across Australia because the litter counts did not specifically sample land surrounding landfills and waste management operations, where it is assumed that the amount of plastic bag litter would be above average.
As the National Litter Index counts are only conducted on public land, the results have been extrapolated based on the estimated proportion of the state capitals that are public land. It is assumed that there is very little plastic bag litter on privately–owned land, such as residential backyards and office buildings.
This estimation is sensitive to the assumed number of clean–ups (by local councils, cleaning contractors, environment and community groups, etc) per site annually. A sensitivity analysis has been carried out on the estimates of the number of clean–ups per site per annum. Sensitivity results are provided in Appendix A.
Page 24
Plastic Retail Carry Bag Use Plastic bag data
Hyder Consulting Pty LtdABN 76 104 485 289
http://oldaus.hybis.info/sites/vc02933/F_Reports/0001_VC02933_VCR_10_Plastic bag consumption data report.doc
7/02/08 5:54 5
Table 8-19 Estimate of HDPE plastic bags littered across Australian capital cities, based on Keep Australia Beautiful’s 2006/07 National Litter Index
Beach Car park Highway Industrial Rec. park Residential Retail Shopping centre
TOTAL
2006/07 NLI area surveyed 65 531 219 716 549 689 117 514 158 675 215 261 80 733 92 672 1 499 791
Average HDPE plastic bag litter in area surveyed at any point in time
95 116 288 99 42 65.5 31 23
Assumed clean ups per annum 12 12 6 6 26 12 52 52
Plastic bag litter in area surveyed per annum
1 140 1 392 1 728 594 1 092 786 1 612 1 196 9 540
Plastic bags littered across capital city public land per annum
816 932 657 469 645 274 3 394 083 4 906 428 7 604 635 4 808 213 2 869 149 25 702 182
* Source: Keep Australia Beautiful National Litter Index 2006/07
Page 25
Plastic Retail Carry Bag Use Plastic bag data
Hyder Consulting Pty LtdABN 76 104 485 289
http://oldaus.hybis.info/sites/vc02933/F_Reports/0001_VC02933_VCR_10_Plastic bag consumption data report.doc
7/02/08 5:54 5
8.2 2002 plastic bag litter estimate In the 2002 Plastic shopping bags – Analysis of levies and environment impacts report it was estimated that a total of between 50 and 80 million bags enter the environment as litter across Australia annually. It was assumed that the vast majority of these bags would be HDPE bags.
This equated to approximately 20% or less of the bags utilised in outdoor away-from-home locations being littered, with a further 1/3 of the total litter stream coming from inadvertent litter sources through waste management activities, as data on the litter occurrence around landfills inferred.
8.2.1 Examination of this estimate
The methodology developed in 2002 to estimate plastic bag litter relies on a number of key assumptions in its calculation. These assumptions have been revisited as part of this study in order to examine the precision of this estimate. The assumptions are outlined below:
� Based on input from retailers and industry participants, assumptions regarding the destination of bags (either home or away from home) sourced from each retail sector were made. Input from retailers and other industry participants provided in 2007 indicates that there are no known changes to the assumed breakdown between home and away–from–home destinations of plastic bags for each retail sector.
� Based on consumer market research undertaken by Sustainability Victoria in 2007, the reuse of plastic bags for purposes such as bin lining and storage is currently estimated to be in excess of 67% (Ipsos Australia, 2007). In 2002, it was assumed that 60% of plastic bags were reused. Variation in this figure however does not impact on the calculation of the amount of plastic bag litter.
� In 2002, it was estimated that 20 to 30 million plastic bags are inadvertently littered through waste management activities annually.
Input from the waste management industry confirms that plastics, and plastic bags in particular, are a major litter management issue at landfill and other waste management sites, because it is lightweight and therefore can easily become airborne.
However, with general improvements in landfill and waste management facility operations arising from best practice implementation, the level of inadvertent litter from such sources is estimated to have reduced since 2002. This includes the widespread introduction of litter capture fencing.
Notwithstanding these improvements, it would appear that the estimate developed in 2002 for inadvertent litter from landfill disposal and waste treatment of 20–30 million plastic bags annually would have considerably overstated the level of such inadvertent litter.
Page 26
Plastic Retail Carry Bag Use Plastic bag data
Hyder Consulting Pty LtdABN 76 104 485 289
http://oldaus.hybis.info/sites/vc02933/F_Reports/0001_VC02933_VCR_10_Plastic bag consumption data report.doc
7/02/08 5:54 5
Based on input from landfill operators it is estimated that currently approximately 785 000 plastic bags are inadvertently littered from landfill sites across Australia annually.
This estimate is calculated based on input that approximately 10 plastic bags escape from a landfill on any normal day of operation, and that approximately 100 plastic bags escape from a landfill on any windy day of operation.
In summary, it was estimated in 2002 that between 50 and 80 million bags enter the environment as litter across Australia annually. Based on input obtained from the waste industry in 2007, it is believed that this estimate overstates inadvertent litter from waste management activities, and therefore total plastic bag litter, by approximately 20 to 30 million. Therefore, it is estimated, utilising this methodology, that approximately 30 to 50 million plastic bags enter the environment as litter annually.
By comparison, extrapolating the National Litter Index 2006/07 results, it is estimated that approximately 40 million plastic bags entered the environment as litter across Australia during 2006/07.
These estimates, developed using different methodologies, are of a similar scale, which appears to indicate that the estimates are of an accurate scale.
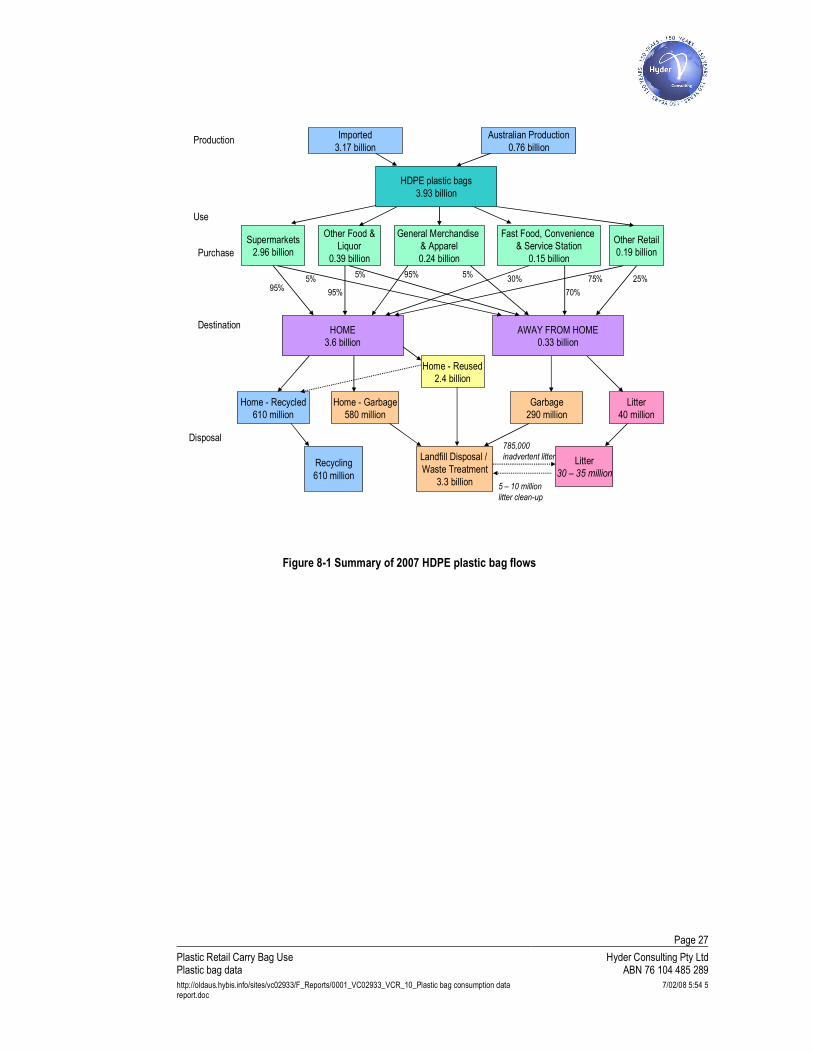
8.3 2007 plastic bag flows A summary of the production, use, destination and disposal of HDPE plastic bags is provided in Figure 8-1, utilising a similar flow structure as adopted in the 2002 Plastic shopping bags – Analysis of levies and environment impacts report.
Page 27
Plastic Retail Carry Bag Use Plastic bag data
Hyder Consulting Pty LtdABN 76 104 485 289
http://oldaus.hybis.info/sites/vc02933/F_Reports/0001_VC02933_VCR_10_Plastic bag consumption data report.doc
7/02/08 5:54 5
Figure 8-1 Summary of 2007 HDPE plastic bag flows
Production
Use
Destination
Disposal
Purchase
Imported
3.17 billion
Australian Production
0.76 billion
Supermarkets
2.96 billion
Fast Food, Convenience
& Service Station
0.15 billion
General Merchandise
& Apparel
0.24 billion
HOME
3.6 billion
AWAY FROM HOME
0.33 billion
Litter
30 – 35 million
Landfill Disposal /
Waste Treatment
3.3 billion
Recycling
610 million
Litter
40 million
Garbage
290 million
Home - Reused
2.4 billion
Home - Recycled
610 million
Home - Garbage
580 million
Other Food &
Liquor
0.39 billion
Other Retail
0.19 billion
70%
75% 25%5%95%
5%95%
5%
95%
30%
785,000
inadvertent litter
5 – 10 million
litter clean-up
HDPE plastic bags
3.93 billion
Page 28
Plastic Retail Carry Bag Use Plastic bag data
Hyder Consulting Pty LtdABN 76 104 485 289
http://oldaus.hybis.info/sites/vc02933/F_Reports/0001_VC02933_VCR_10_Plastic bag consumption data report.doc
7/02/08 5:54 5
8.4 Plastic bag litter trends and relationships The following trends and relationships can be observed:
� The two independent estimates of plastic bag litter developed – utilising the methodology developed in 2002, and the National Litter Index 2006/07 litter counts - are of a similar scale, which appears to indicate that the estimates are of an accurate scale
� It is estimated that approximately 30 to 50 million plastic bags enter the environment as litter annually
� The actual number of plastic bags currently in the environment or littered annually cannot be known without a litter count of a representative sample of land areas across Australia over a period of time
� It is not possible to determine, with the litter data that is currently available, whether there is a link between plastic bag consumption and plastic bag litter. The estimates developed within this report can only provide an indication of the scale of plastic bag litter and are not sensitive enough to indicate whether a change in consumption of plastic bags leads to a change in the amount of plastic bags litter
� Beaches have the greatest number of plastic bags per 1 000 square metres of all the eight site types. This is likely to be the result of bags being washed through waterways from other areas of origin
Page 29
Plastic Retail Carry Bag Use Plastic bag data
Hyder Consulting Pty LtdABN 76 104 485 289
http://oldaus.hybis.info/sites/vc02933/F_Reports/0001_VC02933_VCR_10_Plastic bag consumption data report.doc
7/02/08 5:54 5
9 Conclusions
� After several years of decline, HDPE carry bag use has now increased during 2007.
� The reasons for this are not explored in this study, but could include some or all of the following:
� reduced focus on bag reduction by retailers, due to the conclusion of bag reduction targets
� reduced focus on bag reduction by consumers due to shifts in environmental concerns to climate change and water supply issues
� plateauing of consumer behaviour change to reusable bags
� increased use of degradable bags leading to the perception of single–use bags as acceptable
� broader factors such as population growth or economic growth
� Based on data provided by the major supermarket groups, consumption of plastic bags by the supermarket sector is estimated at 2.85 billion during 2006 and 2.96 billion during 2007, compared to 2.14 billion in 2005. The data indicates that the overall trend of reduction in the use of HDPE plastic bags within the supermarket sector experienced from 2002 to 2005 has ceased, and consumption increased by 33.2% during 2006. Consumption by the supermarket sector remained relatively constant from 2006 to 2007, increasing by 3.8%. It may also suggest that much of the increase in consumption of plastic bags from 3.36 billion in 2006 to 3.93 billion in 2007 is the result of increased usage in the non–supermarket retail sectors.
� The increase in plastic bag use since the conclusion of the plastic bag reduction targets may indicate that the continuation of a bag reduction trend is unlikely without a policy based market intervention by government or industry.
� Based on the shopping observations conducted, the introduction of bag charges at a retailer level does lead to a major shift from single–use bag to reusable bag and no bag transactions.
� Within stores that do not charge for single–use bags, 72% of transactions involved a single–use bag, made of either HDPE, LDPE or paper, 13% of transactions involved a purpose–built reusable carry bag and 15% of transactions did not involve the provision or use of a carry bag.
� Within stores that charge a fee for single–use bags provided, 27% of transactions involved a single–use bag, 33% of transactions involved a reusable carry bag and 40% of transactions did not involve the provision or use of a carry bag.
Page 30
Plastic Retail Carry Bag Use Plastic bag data
Hyder Consulting Pty LtdABN 76 104 485 289
http://oldaus.hybis.info/sites/vc02933/F_Reports/0001_VC02933_VCR_10_Plastic bag consumption data report.doc
7/02/08 5:54 5
� An analysis of kitchen tidy bag sales indicates that the reduction in units and tonnes of plastic shopping bags used since 2004 significantly outweighs the increase in the use of kitchen tidy bags.
� It is estimated that approximately 30 to 50 million plastic bags enter the environment as litter in Australia annually. This figure is based on two independent methodologies which generated estimates of a similar scale, which appears to indicate that the estimates are of an accurate scale.
Page 31
Plastic Retail Carry Bag Use Plastic bag data
Hyder Consulting Pty LtdABN 76 104 485 289
http://oldaus.hybis.info/sites/vc02933/F_Reports/0001_VC02933_VCR_10_Plastic bag consumption data report.doc
7/02/08 5:54 5
10 References
Australian Bureau of Statistics, Regional Population Growth 1996 to 2006, July 2007
Australian National Retailers Association Ltd, Plastic Carry Bags: Working Towards Continuous Environment Improvement, Report to the Chairman Environment Protection and Heritage Council, May 2006
Australian Retailers Association, Code of Practice for the Management of Plastic Bags, October 2003
EPI Environmental Technologies Inc, http://www.epi-global.com/
Hyder Consulting, Plastic Retail Carry Bag Use 2002–2005 Consumption, 2005 end of year report, May 2006
Hyder Consulting and Centre for Design at RMIT, Comparison of existing life cycle analysis of shopping bag alternatives Final Report, April 2007
Ipsos Australia, Plastic Bag Reduction Research, commissioned by Sustainability Victoria, 2007
McGregor Tan Research, Keep Australia Beautiful National Litter Index Annual Report 2006/2007, August 2007
McGregor Tan Research, Keep Australia Beautiful National Litter Index Annual Results 2006/2007 Tabulations, August 2007
Nolan ITU Pty Ltd, Plastic shopping bags – Analysis of levies and environmental impacts, 2002
Nolan ITU, Exelplas Australia and Centre for Design at RMIT, The impacts of degradable plastics in Australia, September 2003
Novamont, http://www.materbi.com/
Retail Media Pty Ltd, Retail World’s Australasian Grocery Guide 2003, 13th edition
Retail Media Pty Ltd, Retail World’s Australasian Grocery Guide 2004, 14th edition
Retail Media Pty Ltd, Retail World’s Australasian Grocery Guide 2006, 16th edition
Retail Media Pty Ltd, Retail World’s Australasian Grocery Guide 2007, 17th edition
Standards Australia, AS4376–2006 Biodegradable plastics – Biodegradable plastics suitable for composting and other microbial treatment, November 2006
Appendix A Sensitivity analysis on estimations
Introduction
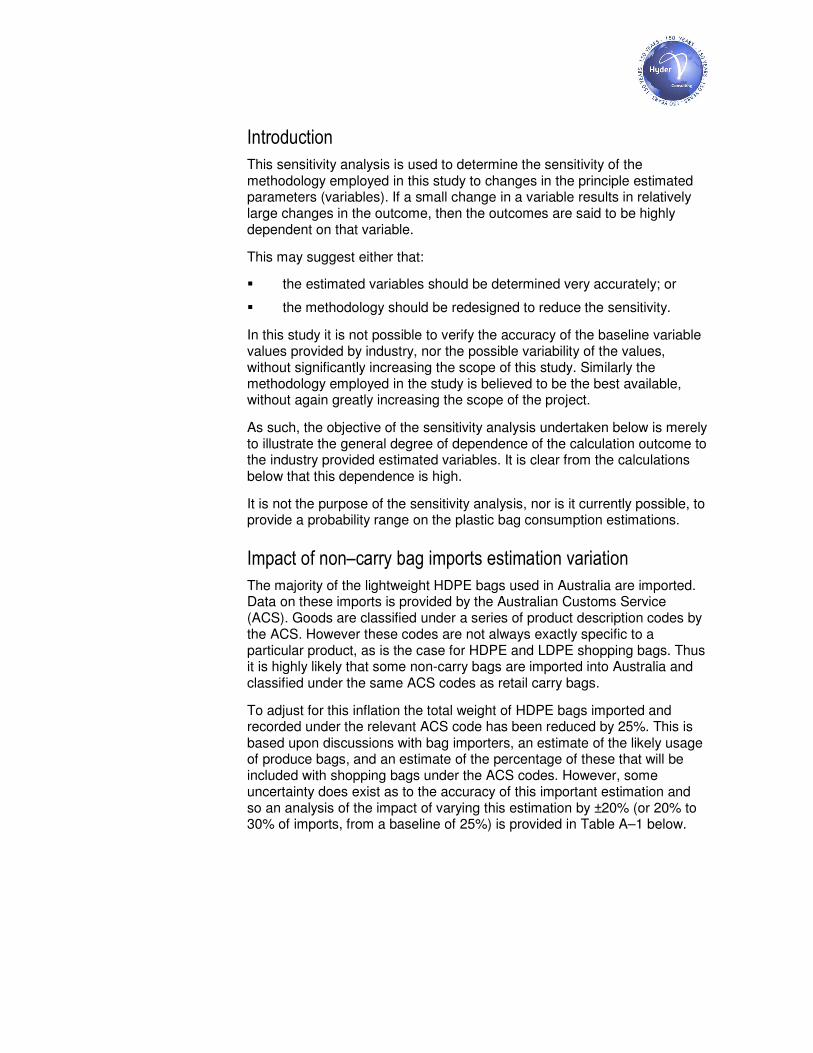
This sensitivity analysis is used to determine the sensitivity of the methodology employed in this study to changes in the principle estimated parameters (variables). If a small change in a variable results in relatively large changes in the outcome, then the outcomes are said to be highly dependent on that variable.
This may suggest either that:
� the estimated variables should be determined very accurately; or
� the methodology should be redesigned to reduce the sensitivity.
In this study it is not possible to verify the accuracy of the baseline variable values provided by industry, nor the possible variability of the values, without significantly increasing the scope of this study. Similarly the methodology employed in the study is believed to be the best available, without again greatly increasing the scope of the project.
As such, the objective of the sensitivity analysis undertaken below is merely to illustrate the general degree of dependence of the calculation outcome to the industry provided estimated variables. It is clear from the calculations below that this dependence is high.
It is not the purpose of the sensitivity analysis, nor is it currently possible, to provide a probability range on the plastic bag consumption estimations.
Impact of non–carry bag imports estimation variation
The majority of the lightweight HDPE bags used in Australia are imported. Data on these imports is provided by the Australian Customs Service (ACS). Goods are classified under a series of product description codes by the ACS. However these codes are not always exactly specific to a particular product, as is the case for HDPE and LDPE shopping bags. Thus it is highly likely that some non-carry bags are imported into Australia and classified under the same ACS codes as retail carry bags.
To adjust for this inflation the total weight of HDPE bags imported and recorded under the relevant ACS code has been reduced by 25%. This is based upon discussions with bag importers, an estimate of the likely usage of produce bags, and an estimate of the percentage of these that will be included with shopping bags under the ACS codes. However, some uncertainty does exist as to the accuracy of this important estimation and so an analysis of the impact of varying this estimation by ±20% (or 20% to 30% of imports, from a baseline of 25%) is provided in Table A–1 below.
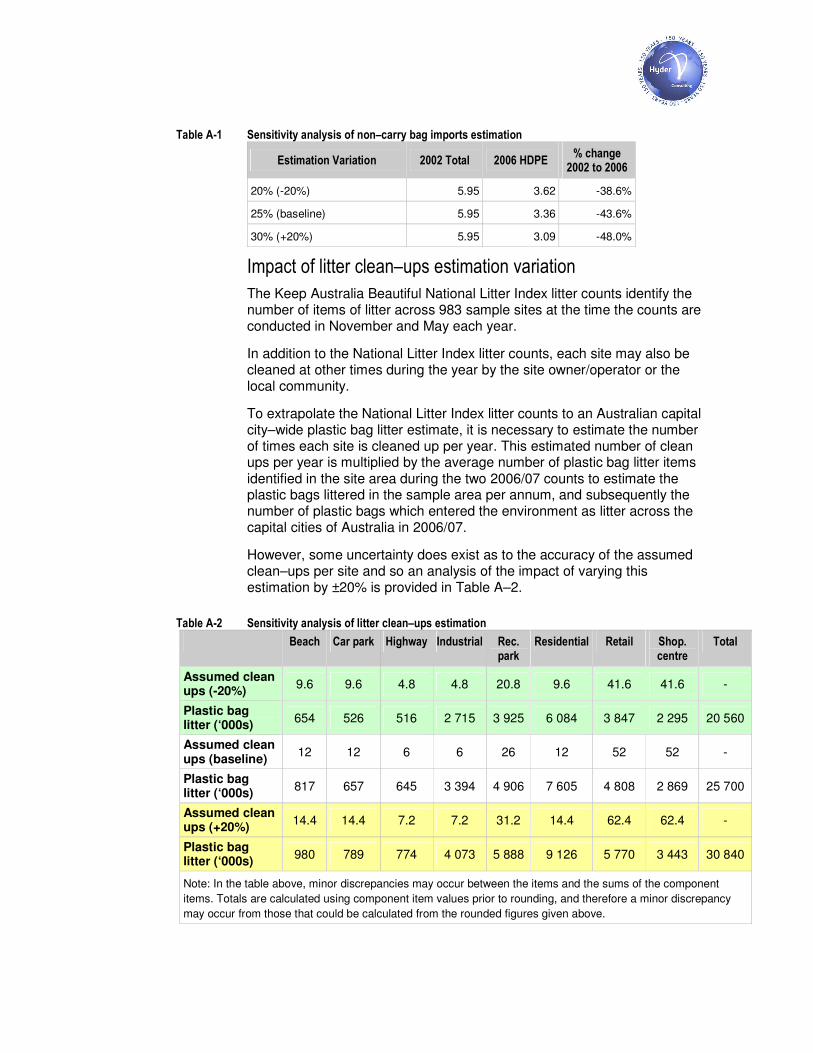
Table A-1 Sensitivity analysis of non–carry bag imports estimation
Estimation Variation 2002 Total 2006 HDPE % change
2002 to 2006
20% (-20%) 5.95 3.62 -38.6%
25% (baseline) 5.95 3.36 -43.6%
30% (+20%) 5.95 3.09 -48.0%
Impact of litter clean–ups estimation variation
The Keep Australia Beautiful National Litter Index litter counts identify the number of items of litter across 983 sample sites at the time the counts are conducted in November and May each year.
In addition to the National Litter Index litter counts, each site may also be cleaned at other times during the year by the site owner/operator or the local community.
To extrapolate the National Litter Index litter counts to an Australian capital city–wide plastic bag litter estimate, it is necessary to estimate the number of times each site is cleaned up per year. This estimated number of clean ups per year is multiplied by the average number of plastic bag litter items identified in the site area during the two 2006/07 counts to estimate the plastic bags littered in the sample area per annum, and subsequently the number of plastic bags which entered the environment as litter across the capital cities of Australia in 2006/07.
However, some uncertainty does exist as to the accuracy of the assumed clean–ups per site and so an analysis of the impact of varying this estimation by ±20% is provided in Table A–2.
Table A-2 Sensitivity analysis of litter clean–ups estimation
Beach Car park Highway Industrial Rec. park
Residential Retail Shop. centre
Total
Assumed clean ups (-20%)
9.6 9.6 4.8 4.8 20.8 9.6 41.6 41.6 -
Plastic bag litter (‘000s)
654 526 516 2 715 3 925 6 084 3 847 2 295 20 560
Assumed clean ups (baseline)
12 12 6 6 26 12 52 52 -
Plastic bag litter (‘000s)
817 657 645 3 394 4 906 7 605 4 808 2 869 25 700
Assumed clean ups (+20%)
14.4 14.4 7.2 7.2 31.2 14.4 62.4 62.4 -
Plastic bag litter (‘000s)
980 789 774 4 073 5 888 9 126 5 770 3 443 30 840
Note: In the table above, minor discrepancies may occur between the items and the sums of the component
items. Totals are calculated using component item values prior to rounding, and therefore a minor discrepancy
may occur from those that could be calculated from the rounded figures given above.
Appendix B Summary of shopping observations
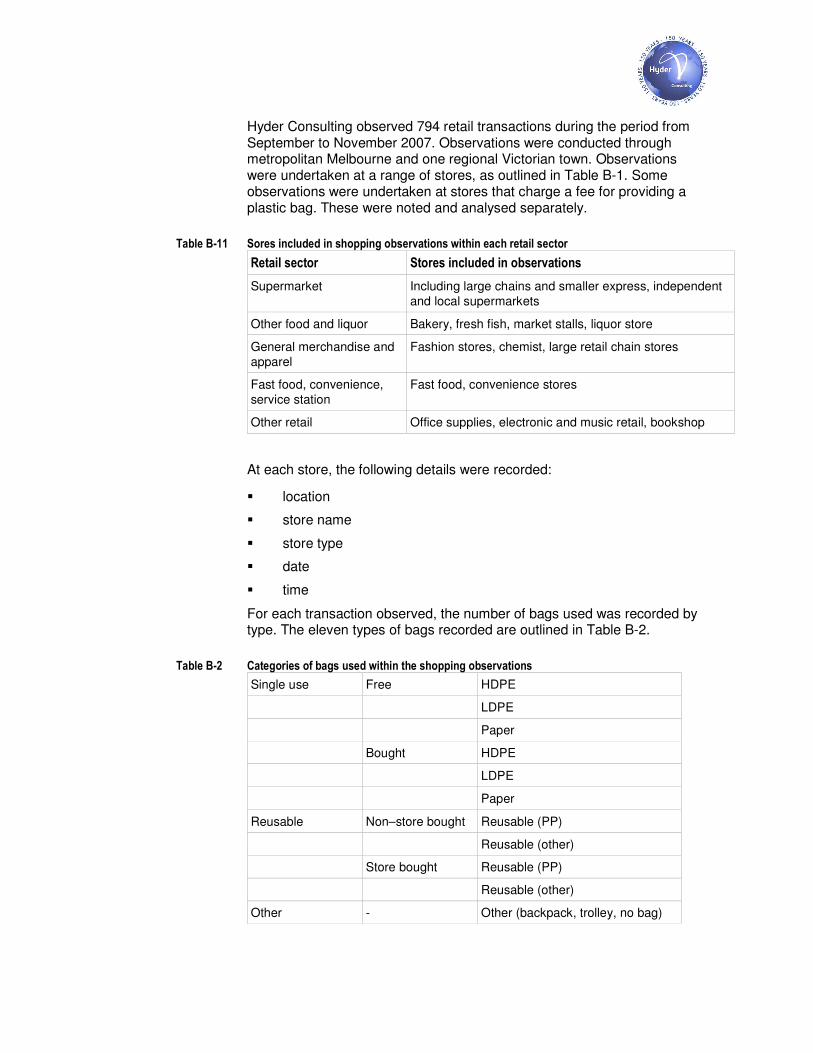
Hyder Consulting observed 794 retail transactions during the period from September to November 2007. Observations were conducted through metropolitan Melbourne and one regional Victorian town. Observations were undertaken at a range of stores, as outlined in Table B-1. Some observations were undertaken at stores that charge a fee for providing a plastic bag. These were noted and analysed separately.
Table B-11 Sores included in shopping observations within each retail sector
Retail sector Stores included in observations
Supermarket Including large chains and smaller express, independent and local supermarkets
Other food and liquor Bakery, fresh fish, market stalls, liquor store
General merchandise and apparel
Fashion stores, chemist, large retail chain stores
Fast food, convenience, service station
Fast food, convenience stores
Other retail Office supplies, electronic and music retail, bookshop
At each store, the following details were recorded:
� location
� store name
� store type
� date
� time
For each transaction observed, the number of bags used was recorded by type. The eleven types of bags recorded are outlined in Table B-2.
Table B-2 Categories of bags used within the shopping observations
Single use Free HDPE
LDPE
Paper
Bought HDPE
LDPE
Paper
Reusable Non–store bought Reusable (PP)
Reusable (other)
Store bought Reusable (PP)
Reusable (other)
Other - Other (backpack, trolley, no bag)
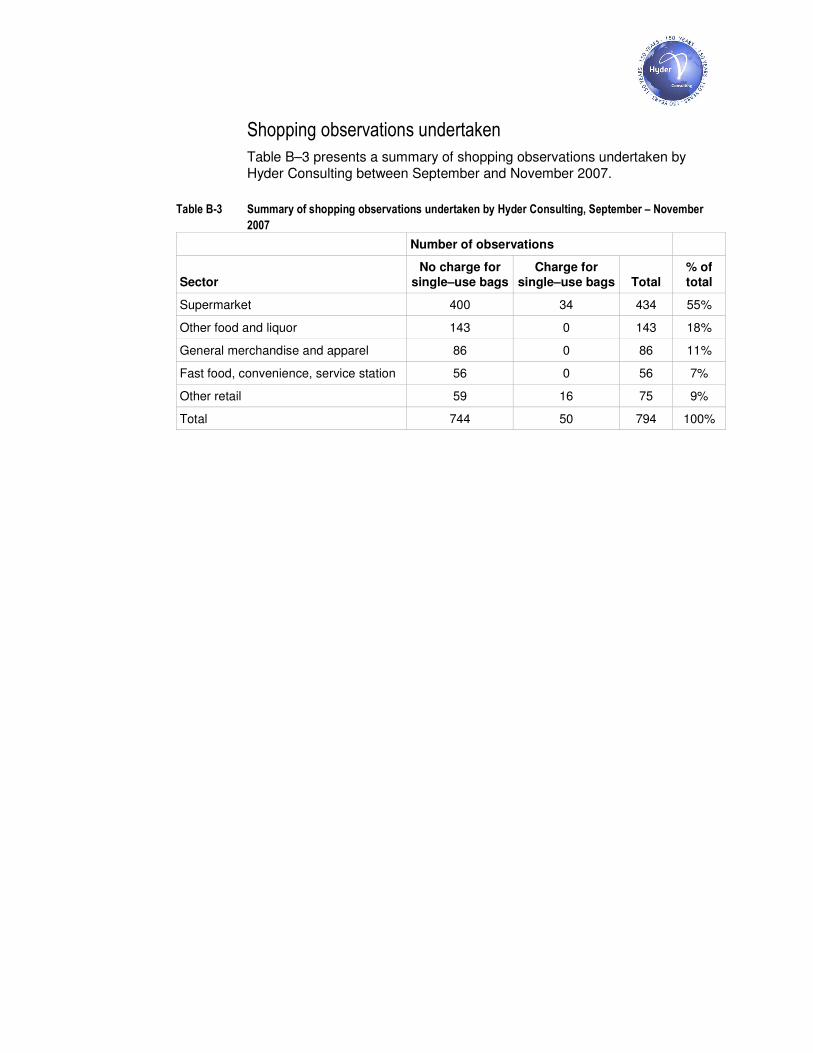
Shopping observations undertaken
Table B–3 presents a summary of shopping observations undertaken by Hyder Consulting between September and November 2007.
Table B-3 Summary of shopping observations undertaken by Hyder Consulting, September – November
2007
Number of observations
Sector No charge for
single–use bags Charge for
single–use bags Total % of total
Supermarket 400 34 434 55%
Other food and liquor 143 0 143 18%
General merchandise and apparel 86 0 86 11%
Fast food, convenience, service station 56 0 56 7%
Other retail 59 16 75 9%
Total 744 50 794 100%