Embed Size (px)
Citation preview
Green Roof Valuation: AProbabilistic Economic Analysis ofEnvironmental BenefitsC O R R I E C L A R K , † P E T E R A D R I A E N S , * , †
A N D F . B R I A N T A L B O T ‡
Department of Civil and Environmental Engineering, Collegeof Engineering, and Department of Operations andManagement Sciences, Ross School of Business, University ofMichigan, Ann Arbor, MI 48109-2125
Received March 16, 2007. Revised manuscript receivedDecember 3, 2007. Accepted December 5, 2007.
Green (vegetated) roofs have gained global acceptance as atechnology that has the potential to help mitigate the multifaceted,complex environmental problems of urban centers. Whilepolicies that encourage green roofs exist at the local and regionallevel, installation costs remain at a premium and deterinvestment in this technology. The objective of this paper is toquantitatively integrate the range of stormwater, energy, andair pollution benefits of green roofs into an economic model thatcaptures the building-specific scale. Currently, green roofsare primarily valued on increased roof longevity, reducedstormwater runoff, and decreased building energy consumption.Proper valuation of these benefits can reduce the presentvalue of a green roof if investors look beyond the upfront capitalcosts. Net present value (NPV) analysis comparing aconventional roof system to an extensive green roof systemdemonstrates that at the end of the green roof lifetime the NPVfor the green roof is between 20.3 and 25.2% less than theNPV for the conventional roof over 40 years. The additionalupfront investment is recovered at the time when a conventionalroof would be replaced. Increasing evidence suggests thatgreen roofs may play a significant role in urban air qualityimprovement. For example, uptake of NOX is estimated to rangefrom $1683 to $6383 per metric ton of NOX reduction. Thesebenefits were included in this study, and results translate to anannual benefit of $895-3392 for a 2000 square meter vegetatedroof. Improved air quality leads to a mean NPV for thegreen roof that is 24.5-40.2% less than the mean conventionalroof NPV. Through innovative policies, the inclusion of airpollution mitigation and the reduction of municipal stormwaterinfrastructure costs in economic valuation of environmentalbenefits of green roofs can reduce the cost gap that currentlyhinders U.S. investment in green roof technology.
IntroductionUrbanization increases stress on private and public utilitiesresulting increases the demand for energy, water and sewerservices, and transportation (1). To meet increased energydemand, more than 150 new coal-fired power plants areproposed in the U.S. alone by 2030 with residential and
commercial buildings currently contributing to 39% of energyconsumption (2, 3). Converting green space into neighbor-hoods, shopping malls, and other developments increasesthe need for infrastructure investment in storm sewer systems(4). New road infrastructure leads to increased vehicleemissions and, along with parking lots and rooftops, roadscontribute to elevated urban surface temperatures by reduc-ing a city’s albedo. Increased urban temperature, commonlyreferred to as the urban heat island effect (UHIE), incombination with emissions from the electric utility industry,impact local and regional air quality (5). As growth isinevitable, a multifaceted and scalable solution is needed totemper the environmental impacts of growing cities. In-creasingly, developers, architects, and city planners recognizethat green (vegetated) roofs may be part of the solution.Composed of a drainage layer, a solid matrix “soil” layer, andvegetation, green roofs reduce the thermal gain directlybeneath the roof (6) and improve the water balance betweenevapotranspiration and runoff (7).
Much of the research on green roofs focuses on theinsulation capability during summer months, which reducesthe flux of solar radiation in a building (8). A study byTakebayashi and Moriyama (2007) on the surface heat budgetof a green roof and a high reflectivity (white) roof revealedthat both systems have a small sensible heat flux comparedto a concrete roof surface (9). The small heat flux on thewhite roof is due to the low net radiation, whereas that ofthe green roof was attributed to the large latent heat flux byevaporation (9).
There are two main parameters that influence the solarradiation reaching the roof deck, leaf foliage and soil media.The more extensive the foliage density of a particular plant,the more the heat flux through the roof decreases (8, 10)and the greater the decrease in surface temperatures (11).Thick soil layers reduced cooling needs during summermonths while thin substrate layers resulted in little to nocooling benefit (10). Additionally, a dry environment andwind speed increase the rate of evapotranspiration, therebyaiding the absorbance of solar radiation by plants (10).Generally, heat transfer is greater on roof surfaces that arenot vegetated (11).
Green roofs retain as much as seventy percent of annualrainfall precipitation depending on regional climate (12).Rainfall retention is also affected by slope and substrate depth:in general, the flatter the roof, the greater the retention andpeak flow reduction (12). While increased thickness providesincreased storage capacity, moisture is also retained for alonger period of time limiting the effectiveness of retentionfor subsequent storm events. Villarreal and Bengtsson (2005)found that the moisture content of the media had a greateraffect on peak flow and total stormwater volume reductionthan slope (13).
Green roofs exhibit the capacity to reduce pollution inurban environments from ground level ozone (14). Vegetationplays a role in lowering surface temperatures through latentheat removal from soils via evaporation and transpiration inthe presence of high moisture levels (15). The absorption ofincoming solar radiation by impervious surfaces creates anurban heat island where temperatures are elevated. Anthro-pogenic heat and pollution can further intensify the UHIEby creating an inversion layer, resulting in increased airconditioning demand (16), and heat-stressed related mortal-ity and illness (17).
With vehicular and power plant emissions, the reactivechemistry in urban areas can be greatly affected by nitrogenoxides. Nitrogen oxides (NOX) alone or in combination with
* Corresponding author phone: 734-763-8032; fax: 734-763-2275;e-mail: [email protected].
† College of Engineering.‡ Ross School of Business.
Environ. Sci. Technol. 2008, 42, 2155–2161
10.1021/es0706652 CCC: $40.75 2008 American Chemical Society VOL. 42, NO. 6, 2008 / ENVIRONMENTAL SCIENCE & TECHNOLOGY 9 2155
Published on Web 02/09/2008
other air pollutants such as ozone, sulfur oxides, andparticulate materials (PM) can cause respiratory diseases andincrease the risk of heart attacks (18). Damage from NOX canextend to plants as well reducing growth, respiration,photosynthesis, stomatal conductance, and enzyme activities(19). While no studies modeling the effects or removal of airpollutants by green roofs have been reported in the peer-reviewed literature, there is extensive work on the uptake ofreactive nitrogen species by vegetation (20).
Although green roofs have been shown to mitigatestormwater runoff volume and to reduce the heating andcooling loads of buildings, the challenges for widespreadintegration of green roofs include the premium cost overconventional roofs, and widely diverging municipal man-agement practices for stormwater and air pollution control.For example, in the USA, the financial burden of managingstormwater is rarely applied to property owners accordingto area and intensity of impervious area. Reducing theuncertainty in the quantification of economic benefits ofgreen roofs is a necessary first step to develop policies aimedat stimulating widespread acceptance of the technology inthe United States.
The objective of this paper is to quantitatively integrateprobabilistic ranges of stormwater, energy, and air pollutionbenefits in an economic model capturing the building-specific scale. A secondary goal is to assess the impact andopportunities of market-based air credit valuation as a policytool for green roof diffusion.
Materials and MethodsThe first step describes a cost-benefit analysis that can beapplied to a range of green roof projects through a proba-bilistic evaluation procedure. This analysis provides infor-mation relevant to building owners, developers, or designersregarding the costs and environmental benefits (stormwaterreduction, energy savings, and air quality) of green rooftechnology. This section summarizes the steps for the cost-benefit analysis at the building scale.
Installation Costs for Conventional and Green Roofs.To determine how the environmental benefits reduce theinstallation cost gap between green and conventional roofs,the magnitude of the gap was first determined. Cost and sizedata were obtained from reroofing cost and time estimatesprovided by plant operations for seventy-five campus roofsfrom the University of Michigan in Ann Arbor, Michigan.Within this sample, the mean cost of a conventional flat roofwas $167 per m2 (standard deviation: $28 per m2). The meancampus roof is 1870 m2 and the mean building floor area is9730 m2.
The distribution of green roof installation costs was basedon available green roof case data (21). As the price of greenroofs can vary according to design and function (e.g., intensivegreen roof can serve as a garden), the cases used in the dataanalysis were limited to extensive roofs with a depth between5 and 15 cm. The collected data represent the additional costof the green roof components. The distributions of theconventional roof and green roof were summed to obtainthe total cost of installation for a new green roof with a newconventional roof. The mean difference between the cost ofthe green roof and the conventional roof is defined as thecost gap. The internal rate of return was then determined foreach environmental benefit.
Stormwater Fees and Reductions. The reduction ofstormwater volume by green roofs benefits municipalities;however, not all local water authorities pass the economicsavings on to the owner of the green roof. Traditionally, thebudget for stormwater management is provided throughproperty taxes or potable water use fees. In recent years,municipalities have been moving toward stormwater fees
based upon total impervious surface on a property, creatingan opportunity to “credit” green roofs for stormwaterreduction. Two methods were used for determining storm-water fees and the reduced fee for a green roof. The firstmethod is limited to the City of Ann Arbor, Michigan and itsnew stormwater ordinance. The commercial stormwater feeis $279.10 per acre per quarter ($0.28 per square meter peryear) (22). The second method takes an average fee based onavailable data from eleven municipalities with establishedstormwater management fees (Supporting Information TableS1). It was assumed that the reduction in stormwater feesdue to a green roof is normally distributed at fifty percentof the stormwater fee for the building footprint according todata on fee reduction policies in Portland, Oregon; Min-neapolis, Minnesota; and Ann Arbor, Michigan (23–25).
Energy Savings Determination and Valuation. Theenergy savings were based on mixed-use administrative/laboratory buildings at the University of Michigan campusin Ann Arbor, Michigan. Total expenditures for energy(natural gas and electricity) consumption (mean $225 00),total energy consumption (mean 4050 MWh), and energyconsumption by fuel source (mean 2370 MWh from electricityand 1670 MWh from natural gas) were obtained for 75university buildings for fiscal year 2003. National commercialbuilding energy consumption statistics provided additionaldata (e.g., average commercial conductance, system loadfactors) (26). To determine the roof’s contribution to theHVAC energy requirement, the heat flux through the roofwas determined according to two methods.
The first method is based on EnergyPlus v2.0.0, a buildingenergy simulation software program supported and madeavailable by the US Department of Energy (27). It can modelbuilding heating, cooling, lighting, ventilating, and otherenergy flows, based on climate and building use, material,and size inputs. Version 2.0.0, released in April 2007, containsthe capability to include a green roof (referred to as ecoroof)on a building. The ecoroof component accounts for heat fluxthrough a 1-dimensional heat transfer model. The modelaccounts for heat transfer processes within the soil and plantcanopy, but it does not account for the soil moisturedependent thermal properties of the green roof (28).
The second method is a simplified 1-dimensional heatflux equation that assumes an R-value of 1.2 ft2 × °F × h/Btu(conductance of 4.7 W/m2/K) per centimeter depth for a10.2 cm soil media of a green roof.
Q·) h × A × ∆T ) A × ∆T
R
where Q is the heat flux through the roof (W), A is the areaof the roof (m2), ∆T is the temperature difference betweenthe building interior and the ambient temperatures (K), andh is the heat transfer coefficient (W/m2/K). This coefficientis a function of the thermal conductivity of a material andthe material thickness. The inverse of h is the R-value, whichrepresents a material’s resistance to heat flow. The larger theR, the less heat flux Q. In the construction industry, R-value(ft2 × °F × h/Btu) is commonly used to compare theeffectiveness of insulation in building materials. For thismethod, an average R-value of 11.34 ft2 × °F × h/Btu(conductance of 0.50 W/m2/K) was assumed for the con-ventional roof according to national commercial buildingdata (26). The total combined R-value for a conventionalroof with a green roof is 23.4 ft2 × °F × h/Btu (totalconductance of 0.24 W/m2/K). The requisite energy con-sumption by the HVAC system to compensate for the lossthrough the roof was then determined. Annual totals for heatloss and cooling loss were multiplied by a system factor assuggested by Huang and Franconi (26).
Energy costs due to the heat flux were determinedassuming natural gas for heating and electricity for cooling.
2156 9 ENVIRONMENTAL SCIENCE & TECHNOLOGY / VOL. 42, NO. 6, 2008
Pricing for energy was based upon available university energyexpenditure information, $0.08/kWh for electricity and $0.02/kWh of natural gas. Heating and cooling degree-days wereused for the R-value analysis, while hourly weather data wassupplied for the EnergyPlus model (29).
Air Quality Improvement and Valuation. Impact on airquality was limited to the mitigation of nitrogen oxide (NOx).Nitrogen oxide emission allowances are currently traded inthe U.S.; market-based economic valuations for 2005–2006ranged from $900 per ton ($992 per Mg) to $4282 per ton($4721 per Mg) (30, 31). To quantify nitrogen oxide uptakeby plants (per unit area), data from Morikawa, et al. (1998)were used (32). That study evaluated the NOX uptake potentialof 217 plant taxa under controlled conditions in a greenhouseenvironment. Although sedums, the traditional vegetated roofplants of choice, were not evaluated, the study included amember of the same family, Crassulaceae. Published resultswere in terms of mg N g-1 dry weight per 8 h of daylightexposure. The following assumptions were made to obtainthe uptake capacity per unit area (kgNO2 m-2 y-1): (i) Ninetypercent of plant mass is water; (ii) Leaf thickness is 2 mm;(iii) Leaf area index (LAI) is 5 (m2 leaf area per m2 surfacearea) according to a global mean (33); (iv) Average hours ofdaylight per day (12) (34). Calculations were performed tocapture the potential impact of all 217-plant taxa on NOX
uptake. The distribution of uptake potentials (SupportingInformation Figure S1) is assumed to be log-normal with amean of 0.27 ( 0.44 kgNO2 m-2 y-1. An implicit assumptionwas that the uptake capacity is constant on a year-to-yearbasis.
Once the annual uptake of NOX was determined, the resultwas translated to health benefits. These calculations werebased upon two estimation methods developed by the U.S.Environmental Protection Agency (EPA) as part of a regulatoryimpact analysis of NOX reductions in 1998 (35). The conclu-sion of the analysis for the Eastern U.S., was that fewerpremature deaths and fewer cases of chronic bronchitistranslated into an economic benefit between $1680 and $6380per Mg adjusted to 2006 dollars (35). The two estimates werebased upon the results of several atmospheric models thatprovided estimates for secondary ozone, nitrogen deposition,and particulate formation (35). The range of economic benefitaccounts for uncertainty in atmospheric acid sulfate con-centration, which affects ammonium nitrate particulateformation (35). For the purposes of this study, the estimatesare referred to as the low estimate ($1680 per Mg) and thehigh estimate ($6380 per Mg). It should be noted that thesevalues are in a similar range of emission allowance values.
Economic Analysis and Sensitivity Analysis. Once thecosts and benefits were determined on a per unit area basis,the results were integrated into an economic model todetermine the length of time required for a return oninvestment in a 2,000 m2 green roof using a net present value(NPV) analysis (Supporting Information Table S2). An interestrate of five percent (based upon the 2006, 20 year U.S.government bond interest rate) and inflation rate of threepercent (based upon the 2005-2006 Consumer’s Price Index)were used (36, 37).
It was assumed that the conventional roof would bereplaced after twenty years (38, 39). Maintenance costs havenot been included in this analysis. A sensitivity analysisevaluated model sensitivity to economic parameters, climatefactors, and variability in air pollution uptake.
Results and DiscussionThe following summarizes the NPV analysis. The implicationsof the benefits on city environmental policy are also discussed.
Stormwater Benefits. For the Ann Arbor assessment, aper square meter area cost was assumed (instead of the fullcost for one acre). The stormwater fee for a conventional
roof of 2000 m2 is then $520 per year (22). As Ann Arborconsiders a green roof to be a pervious surface, then thegreen roof fee would be $0 per year. The mean stormwaterfee was found to be $0.17/m2 (standard deviation: $0.12/m2)(40–49). Potential fee reductions for green roofs resulted ina mean stormwater fee of $0.08/m2 (standard deviation:$0.06/m2). For the 2000 m2 roof, conventional roof fees wouldbe $340, whereas the green roof scenario would have fees of$160 per year. A few municipalities offer fee reductions togreen roof projects (assuming reduced impervious area andadequate storm capture) to pass the value of the public benefitof stormwater reduction to the building owner (e.g., Min-neapolis, Minnesota) (24).
Energy Assessment. The heat flux was based on a 2000m2 roof utilizing hourly climate data from nearby Detroit,Michigan for the EnergyPlus simulation and heating andcooling degree days for Ann Arbor, Michigan for the R-valueanalysis. Roof conductance values and energy savingsbetween conventional and green roof systems were differentaccording to model method, and are summarized in Table1. A study by Saiz et al. (2006) compared several roof systemsfor a roof in Madrid, and the conductance of the roofs areprovided in Table 1 (50). The conductivity estimates for theconventional roof and green roof by Saiz et al. is larger thanthe results from both models presented here. This may bedue to their use of an existing building in Madrid, Spain forthe analysis (age, different insulation requirements) and theassumption of pine bark and compost as the primaryconstituents of the soil media for the green roof, which wouldaffect soil moisture properties. For the EnergyPlus analysis,the difference in consumption for a one floor commercialfacility with a green roof versus a conventional roof is 16.4MWh with 6.6 MWh saved from electricity and 9.8 MWhfrom heating. Based on energy costs for 2003 and adjustedto 2006 dollars (2003 energy expenditure data was availablefrom the university and energy prices for 2004 and 2005 wereunusually high), this translates to a savings of $710 ofthe green roof over the conventional roof. For the R-valueanalysis, there was a 66.1 MWh savings for the green roofwith 59.5 MWh attributable to heating and 6.6 MWh forcooling. This translates to a savings of $1670 of the greenroof over the conventional roof. While the two models agreeon electricity savings, they differ in estimates for heating.The EnergyPlus model accounts for the other envelope heatloss pathways such as walls, windows, and slab, which havehigher conductivities, 0.51, 3.25, and 2.69, respectively. Whenheat flux occurs, the EnergyPlus model suggests that greaterlosses would occur through these pathways than the roof.During periods of heating, the difference between interiorand exterior conditions are greater than during periods ofcooling, so the magnitude of error in heat flux between themodels would be greater under conditions of heating thanunder cooling conditions. Uncertainty for these calculationsis not included in the NPV analysis as the dependency onsoil moisture and green roof soil media conductance has notyet been investigated in the literature.
To verify the appropriateness of the assumptions used inthe analysis, calculated energy costs through the conventionalroof were compared to actual expended total natural gasand electric energy costs for university buildings. Assuming
TABLE 1. Roof Conductance According to Different EnergyModels
roof Conductance (W/m2/K)
roof typeR-value
modelEnergyPlus
modelESP-rmodel
conventional 0.5 0.38 0.59 (45)green 0.24 0.36 0.42 (45)
VOL. 42, NO. 6, 2008 / ENVIRONMENTAL SCIENCE & TECHNOLOGY 9 2157
that 35% of total building energy consumption is due toheating, ventilation, and air conditioning (HVAC) system use(51), 90% of all buildings (75 total) were within the expectedcosts attributed to HVAC use. The eight buildings with higherenergy expenditures had roof area-to-floor-space ratios muchgreater than one (R/F area >> 1). The ratio can be explainedby the inclusion of roof areas outside the interior buildingfloor area (e.g., exterior walkways, loading docks), includingthese areas in the heat flux calculations would overestimatecontribution to the HVAC consumption.
Air Pollution Mitigation. The benefit assessment includedboth direct and indirect methods of uptake. The uptakecapacity per area for the 217 plant taxa evaluated by Morikawaet al. (1998) had a mean of 0.27 kgNO2/m2/y (variance: 0.17kg2
NO2/m4/y2) (32). For a building with a roof area of 2000 m2,this results in an uptake of 530 kgNO2/y (variance: 700 kg2
NO2/y2). The public health benefits for greening a 2000 m2 roofwere determined to be $890 (variance: 2.0E6 $2) for the lowbenefit estimate and $3390 (variance: 2.8E7 $2) for the highbenefit estimate.
There are limitations to this benefit estimate. The datawere obtained from greenhouse estimates, and plants maybehave differently under stress or vary the rate of uptakeaccording to the time of year. Although NO2 utpake is affectedby closure of the stomata under stress or at night, NO uptakeappears to remain constant independent of stomatal opening(52). Contradictory evidence has shown that specific plantspecies such as kenaf exhibit high nocturnal uptake of NO2
(53). Clearly, further research is needed to understand the(1) performance in the field (or on the roof), and (2) specificplant uptake potentials.
For large-scale urban greening projects, it should be notedthat not all roofs may be conducive to green roof imple-mentation due to restrictive architectural features (e.g., roofslope, HVAC system placement, structural limitations ofbuilding). However, if greening occurred on all 35 ha of roofsevaluated in this study at the University of Michigan,potentially 94.31 MgNO2/y could be removed from the airannually with an estimated value to public health between$158 720 and $601 930 per year.
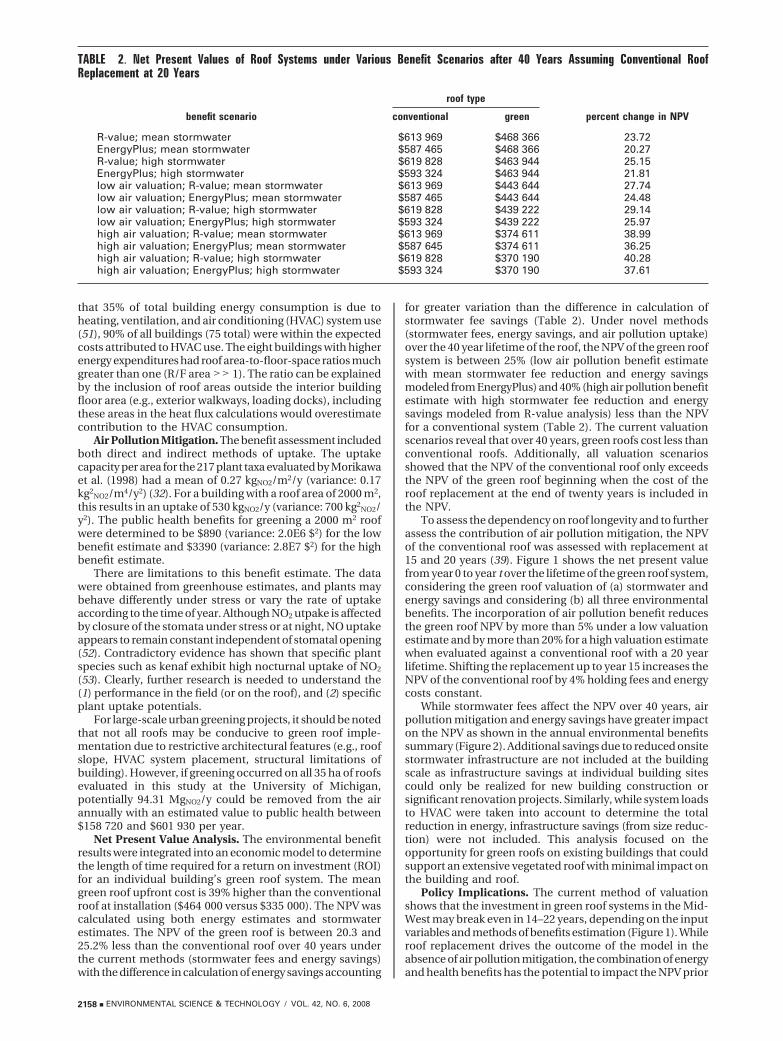
Net Present Value Analysis. The environmental benefitresults were integrated into an economic model to determinethe length of time required for a return on investment (ROI)for an individual building’s green roof system. The meangreen roof upfront cost is 39% higher than the conventionalroof at installation ($464 000 versus $335 000). The NPV wascalculated using both energy estimates and stormwaterestimates. The NPV of the green roof is between 20.3 and25.2% less than the conventional roof over 40 years underthe current methods (stormwater fees and energy savings)with the difference in calculation of energy savings accounting
for greater variation than the difference in calculation ofstormwater fee savings (Table 2). Under novel methods(stormwater fees, energy savings, and air pollution uptake)over the 40 year lifetime of the roof, the NPV of the green roofsystem is between 25% (low air pollution benefit estimatewith mean stormwater fee reduction and energy savingsmodeled from EnergyPlus) and 40% (high air pollution benefitestimate with high stormwater fee reduction and energysavings modeled from R-value analysis) less than the NPVfor a conventional system (Table 2). The current valuationscenarios reveal that over 40 years, green roofs cost less thanconventional roofs. Additionally, all valuation scenariosshowed that the NPV of the conventional roof only exceedsthe NPV of the green roof beginning when the cost of theroof replacement at the end of twenty years is included inthe NPV.
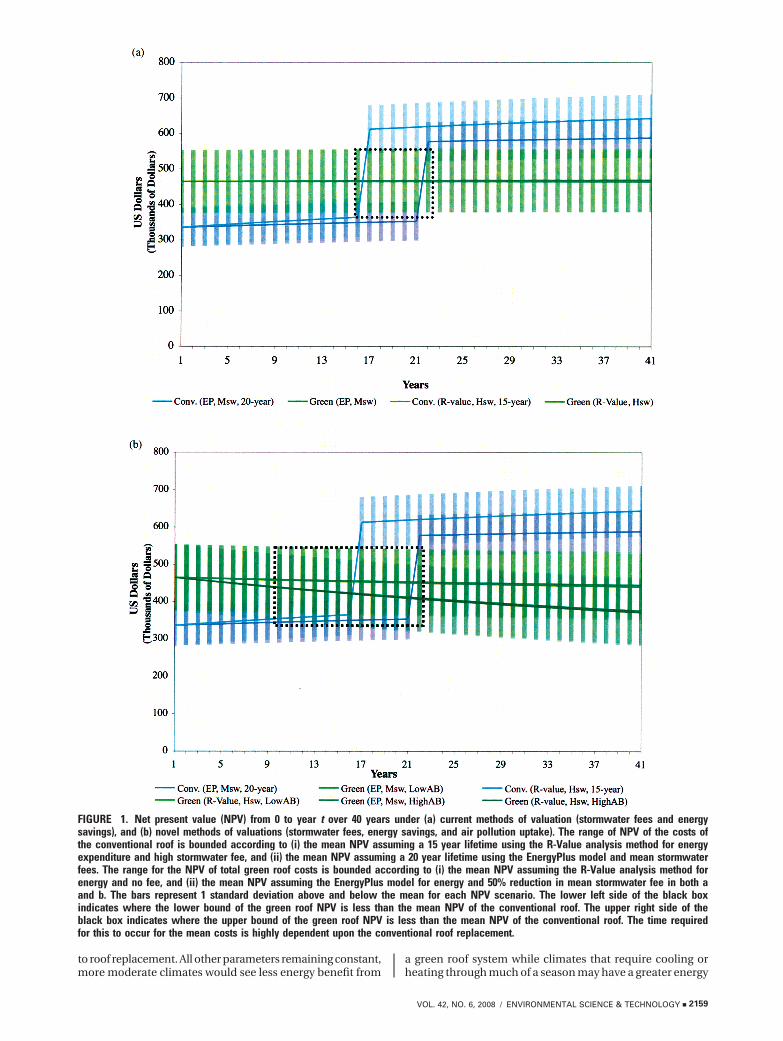
To assess the dependency on roof longevity and to furtherassess the contribution of air pollution mitigation, the NPVof the conventional roof was assessed with replacement at15 and 20 years (39). Figure 1 shows the net present valuefrom year 0 to year t over the lifetime of the green roof system,considering the green roof valuation of (a) stormwater andenergy savings and considering (b) all three environmentalbenefits. The incorporation of air pollution benefit reducesthe green roof NPV by more than 5% under a low valuationestimate and by more than 20% for a high valuation estimatewhen evaluated against a conventional roof with a 20 yearlifetime. Shifting the replacement up to year 15 increases theNPV of the conventional roof by 4% holding fees and energycosts constant.
While stormwater fees affect the NPV over 40 years, airpollution mitigation and energy savings have greater impacton the NPV as shown in the annual environmental benefitssummary (Figure 2). Additional savings due to reduced onsitestormwater infrastructure are not included at the buildingscale as infrastructure savings at individual building sitescould only be realized for new building construction orsignificant renovation projects. Similarly, while system loadsto HVAC were taken into account to determine the totalreduction in energy, infrastructure savings (from size reduc-tion) were not included. This analysis focused on theopportunity for green roofs on existing buildings that couldsupport an extensive vegetated roof with minimal impact onthe building and roof.
Policy Implications. The current method of valuationshows that the investment in green roof systems in the Mid-West may break even in 14–22 years, depending on the inputvariables and methods of benefits estimation (Figure 1). Whileroof replacement drives the outcome of the model in theabsence of air pollution mitigation, the combination of energyand health benefits has the potential to impact the NPV prior
TABLE 2. Net Present Values of Roof Systems under Various Benefit Scenarios after 40 Years Assuming Conventional RoofReplacement at 20 Years
benefit scenario
roof type
percent change in NPVconventional green
R-value; mean stormwater $613 969 $468 366 23.72EnergyPlus; mean stormwater $587 465 $468 366 20.27R-value; high stormwater $619 828 $463 944 25.15EnergyPlus; high stormwater $593 324 $463 944 21.81low air valuation; R-value; mean stormwater $613 969 $443 644 27.74low air valuation; EnergyPlus; mean stormwater $587 465 $443 644 24.48low air valuation; R-value; high stormwater $619 828 $439 222 29.14low air valuation; EnergyPlus; high stormwater $593 324 $439 222 25.97high air valuation; R-value; mean stormwater $613 969 $374 611 38.99high air valuation; EnergyPlus; mean stormwater $587 645 $374 611 36.25high air valuation; R-value; high stormwater $619 828 $370 190 40.28high air valuation; EnergyPlus; high stormwater $593 324 $370 190 37.61
2158 9 ENVIRONMENTAL SCIENCE & TECHNOLOGY / VOL. 42, NO. 6, 2008
to roof replacement. All other parameters remaining constant,more moderate climates would see less energy benefit from
a green roof system while climates that require cooling orheating through much of a season may have a greater energy
FIGURE 1. Net present value (NPV) from 0 to year t over 40 years under (a) current methods of valuation (stormwater fees and energysavings), and (b) novel methods of valuations (stormwater fees, energy savings, and air pollution uptake). The range of NPV of the costs ofthe conventional roof is bounded according to (i) the mean NPV assuming a 15 year lifetime using the R-Value analysis method for energyexpenditure and high stormwater fee, and (ii) the mean NPV assuming a 20 year lifetime using the EnergyPlus model and mean stormwaterfees. The range for the NPV of total green roof costs is bounded according to (i) the mean NPV assuming the R-Value analysis method forenergy and no fee, and (ii) the mean NPV assuming the EnergyPlus model for energy and 50% reduction in mean stormwater fee in both aand b. The bars represent 1 standard deviation above and below the mean for each NPV scenario. The lower left side of the black boxindicates where the lower bound of the green roof NPV is less than the mean NPV of the conventional roof. The upper right side of theblack box indicates where the upper bound of the green roof NPV is less than the mean NPV of the conventional roof. The time requiredfor this to occur for the mean costs is highly dependent upon the conventional roof replacement.
VOL. 42, NO. 6, 2008 / ENVIRONMENTAL SCIENCE & TECHNOLOGY 9 2159
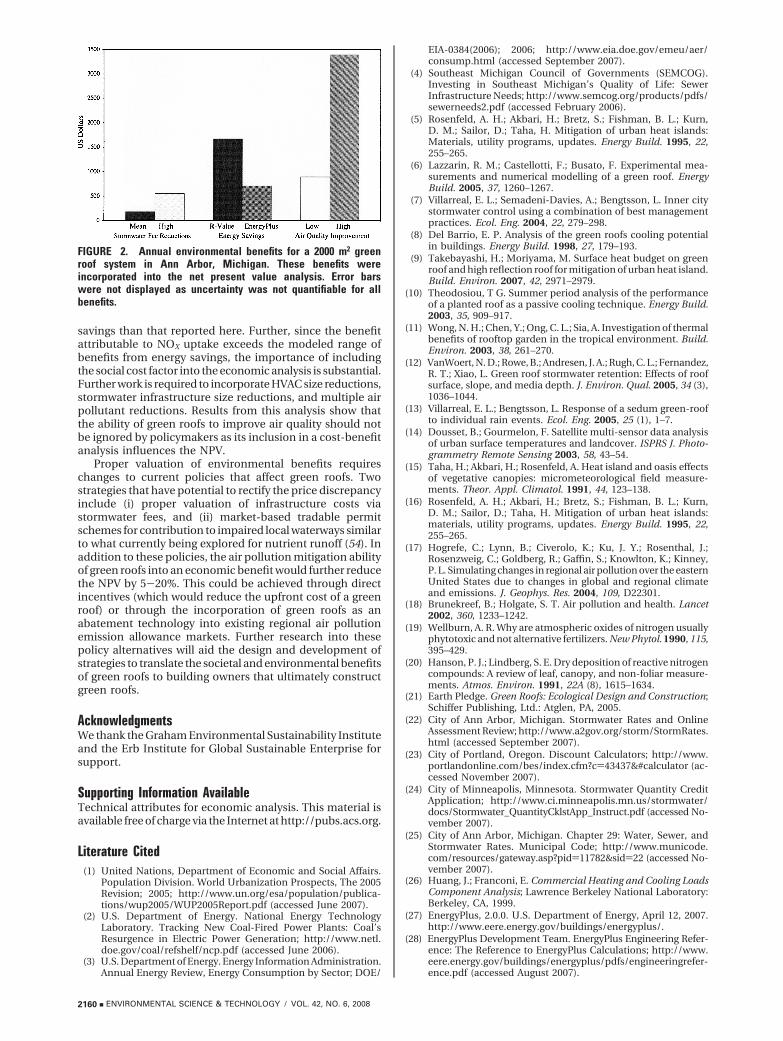
savings than that reported here. Further, since the benefitattributable to NOX uptake exceeds the modeled range ofbenefits from energy savings, the importance of includingthe social cost factor into the economic analysis is substantial.Further work is required to incorporate HVAC size reductions,stormwater infrastructure size reductions, and multiple airpollutant reductions. Results from this analysis show thatthe ability of green roofs to improve air quality should notbe ignored by policymakers as its inclusion in a cost-benefitanalysis influences the NPV.
Proper valuation of environmental benefits requireschanges to current policies that affect green roofs. Twostrategies that have potential to rectify the price discrepancyinclude (i) proper valuation of infrastructure costs viastormwater fees, and (ii) market-based tradable permitschemes for contribution to impaired local waterways similarto what currently being explored for nutrient runoff (54). Inaddition to these policies, the air pollution mitigation abilityof green roofs into an economic benefit would further reducethe NPV by 5-20%. This could be achieved through directincentives (which would reduce the upfront cost of a greenroof) or through the incorporation of green roofs as anabatement technology into existing regional air pollutionemission allowance markets. Further research into thesepolicy alternatives will aid the design and development ofstrategies to translate the societal and environmental benefitsof green roofs to building owners that ultimately constructgreen roofs.
AcknowledgmentsWe thank the Graham Environmental Sustainability Instituteand the Erb Institute for Global Sustainable Enterprise forsupport.
Supporting Information AvailableTechnical attributes for economic analysis. This material isavailable free of charge via the Internet at http://pubs.acs.org.
Literature Cited(1) United Nations, Department of Economic and Social Affairs.
Population Division. World Urbanization Prospects, The 2005Revision; 2005; http://www.un.org/esa/population/publica-tions/wup2005/WUP2005Report.pdf (accessed June 2007).
(2) U.S. Department of Energy. National Energy TechnologyLaboratory. Tracking New Coal-Fired Power Plants: Coal’sResurgence in Electric Power Generation; http://www.netl.doe.gov/coal/refshelf/ncp.pdf (accessed June 2006).
(3) U.S. Department of Energy. Energy Information Administration.Annual Energy Review, Energy Consumption by Sector; DOE/
EIA-0384(2006); 2006; http://www.eia.doe.gov/emeu/aer/consump.html (accessed September 2007).
(4) Southeast Michigan Council of Governments (SEMCOG).Investing in Southeast Michigan’s Quality of Life: SewerInfrastructure Needs; http://www.semcog.org/products/pdfs/sewerneeds2.pdf (accessed February 2006).
(5) Rosenfeld, A. H.; Akbari, H.; Bretz, S.; Fishman, B. L.; Kurn,D. M.; Sailor, D.; Taha, H. Mitigation of urban heat islands:Materials, utility programs, updates. Energy Build. 1995, 22,255–265.
(6) Lazzarin, R. M.; Castellotti, F.; Busato, F. Experimental mea-surements and numerical modelling of a green roof. EnergyBuild. 2005, 37, 1260–1267.
(7) Villarreal, E. L.; Semadeni-Davies, A.; Bengtsson, L. Inner citystormwater control using a combination of best managementpractices. Ecol. Eng. 2004, 22, 279–298.
(8) Del Barrio, E. P. Analysis of the green roofs cooling potentialin buildings. Energy Build. 1998, 27, 179–193.
(9) Takebayashi, H.; Moriyama, M. Surface heat budget on greenroof and high reflection roof for mitigation of urban heat island.Build. Environ. 2007, 42, 2971–2979.
(10) Theodosiou, T G. Summer period analysis of the performanceof a planted roof as a passive cooling technique. Energy Build.2003, 35, 909–917.
(11) Wong, N. H.; Chen, Y.; Ong, C. L.; Sia, A. Investigation of thermalbenefits of rooftop garden in the tropical environment. Build.Environ. 2003, 38, 261–270.
(12) VanWoert, N. D.; Rowe, B.; Andresen, J. A.; Rugh, C. L.; Fernandez,R. T.; Xiao, L. Green roof stormwater retention: Effects of roofsurface, slope, and media depth. J. Environ. Qual. 2005, 34 (3),1036–1044.
(13) Villarreal, E. L.; Bengtsson, L. Response of a sedum green-roofto individual rain events. Ecol. Eng. 2005, 25 (1), 1–7.
(14) Dousset, B.; Gourmelon, F. Satellite multi-sensor data analysisof urban surface temperatures and landcover. ISPRS J. Photo-grammetry Remote Sensing 2003, 58, 43–54.
(15) Taha, H.; Akbari, H.; Rosenfeld, A. Heat island and oasis effectsof vegetative canopies: micrometeorological field measure-ments. Theor. Appl. Climatol. 1991, 44, 123–138.
(16) Rosenfeld, A. H.; Akbari, H.; Bretz, S.; Fishman, B. L.; Kurn,D. M.; Sailor, D.; Taha, H. Mitigation of urban heat islands:materials, utility programs, updates. Energy Build. 1995, 22,255–265.
(17) Hogrefe, C.; Lynn, B.; Civerolo, K.; Ku, J. Y.; Rosenthal, J.;Rosenzweig, C.; Goldberg, R.; Gaffin, S.; Knowlton, K.; Kinney,P. L. Simulating changes in regional air pollution over the easternUnited States due to changes in global and regional climateand emissions. J. Geophys. Res. 2004, 109, D22301.
(18) Brunekreef, B.; Holgate, S. T. Air pollution and health. Lancet2002, 360, 1233–1242.
(19) Wellburn, A. R. Why are atmospheric oxides of nitrogen usuallyphytotoxic and not alternative fertilizers. New Phytol. 1990, 115,395–429.
(20) Hanson, P. J.; Lindberg, S. E. Dry deposition of reactive nitrogencompounds: A review of leaf, canopy, and non-foliar measure-ments. Atmos. Environ. 1991, 22A (8), 1615–1634.
(21) Earth Pledge. Green Roofs: Ecological Design and Construction;Schiffer Publishing, Ltd.: Atglen, PA, 2005.
(22) City of Ann Arbor, Michigan. Stormwater Rates and OnlineAssessment Review; http://www.a2gov.org/storm/StormRates.html (accessed September 2007).
(23) City of Portland, Oregon. Discount Calculators; http://www.portlandonline.com/bes/index.cfm?c)43437&#calculator (ac-cessed November 2007).
(24) City of Minneapolis, Minnesota. Stormwater Quantity CreditApplication; http://www.ci.minneapolis.mn.us/stormwater/docs/Stormwater_QuantityCklstApp_Instruct.pdf (accessed No-vember 2007).
(25) City of Ann Arbor, Michigan. Chapter 29: Water, Sewer, andStormwater Rates. Municipal Code; http://www.municode.com/resources/gateway.asp?pid)11782&sid)22 (accessed No-vember 2007).
(26) Huang, J.; Franconi, E. Commercial Heating and Cooling LoadsComponent Analysis; Lawrence Berkeley National Laboratory:Berkeley, CA, 1999.
(27) EnergyPlus, 2.0.0. U.S. Department of Energy, April 12, 2007.http://www.eere.energy.gov/buildings/energyplus/.
(28) EnergyPlus Development Team. EnergyPlus Engineering Refer-ence: The Reference to EnergyPlus Calculations; http://www.eere.energy.gov/buildings/energyplus/pdfs/engineeringrefer-ence.pdf (accessed August 2007).
FIGURE 2. Annual environmental benefits for a 2000 m2 greenroof system in Ann Arbor, Michigan. These benefits wereincorporated into the net present value analysis. Error barswere not displayed as uncertainty was not quantifiable for allbenefits.
2160 9 ENVIRONMENTAL SCIENCE & TECHNOLOGY / VOL. 42, NO. 6, 2008
(29) EnergyPLus Energy Simulation Software Weather Data; http://www.eere.energy.gov/buildings/energyplus/cfm/weather_data3.cfm/region)4_north_and_central_america_wmo_region_4/country)1_usa/cname)USA#MI (accessed August 2007).
(30) US EPA. NOX Budget Trading Program: 2006 Program Compli-ance and Environmental Results, EPA-430-R-07–009; http://www.epa.gov/airmarkets/progress/docs/2006-NBP-Report.pdf (ac-cessed September 2007).
(31) South Coast Air Quality Management District. Annual RECLAIMAudit Report for the 2005 Compliance Year; http://www.aqmd.gov/hb/2007/March/070334a.html#_ftn1 (accessed Sep-tember 2007).
(32) Morikawa, H; Takahasi, M; Kawamura, Y. More than a 600-foldvariation in nitrogen dioxide assimilation among 217 plant taxa.Plant Cell Environ. 1998, 21, 180–190.
(33) Asner, G. P.; Scurlock, J. M. O.; HickeJ, A. Global synthesis ofleaf area index observations: implications for ecological andremote sensing studies. Global Ecol. Biogeography 2003, 12,191–205.
(34) Severinsen, M.; Jager, T. Modelling the influence of terrestrialvegetation on the environmental fate of xenobiotics. Chemo-sphere 1998, 37, 41–62.
(35) U.S. EPA. Office of Air and Radiation. Regulatory Impact Analysisfor the NOx SIP Call, FIP, and Section 126 Petitions; EPA-452/R-98–003A; U.S. Environmental Protection Agency: Washington,DC, 1998.
(36) U.S. Federal Reserve System Statistical Release. Selected InterestRates; http://www.federalreserve.gov/releases/h15/data.htm(accessed September 2007).
(37) U.S. Department of Labor Bureau of Statistics. Consumer PriceIndexes; http://www.bls.gov/cpi/#overview (accessed Septem-ber 2007).
(38) Köhler; M. Long-term vegetation research on two extensive greenroofs in berlin. Urban Habitats [Online] 2006, 4 (1).
(39) American Society of Civil Engineers. Structural EngineeringInstitute. Minimum Design Loads for Buildings and OtherStructures; ASCE 7–05; ASCE Publications: Reston, VA, 2005.
(40) City of Ann Arbor, Michigan. Water, Sewer, and StormwaterRates; http://www.ci.ann-arbor.mi.us/PublicServices/Water/CS/WaterSewerStormRates.pdf (accessed September 2006).
(41) County of Gwinnett, Georgia. A Resolution of the GwinnettCounty Board of Commissioners to Establish a Rate Structurefor a Stormwater Utility; http://www.co.gwinnett.ga.us/departments/publicutilities/pdf/Stormwater%20Utility%20Rate%20Structure%20Resolution.pdf (accessed September 2006).
(42) City of Bellevue, Washington. 2006 Utility Rates; http://www.ci.bellevue.wa.us/page.asp?view)22319 (accessed Sep-tember 2006).
(43) City of Boulder, Colorado. 2006 Utility Rates; http://www.ci.boulder.co.us/index.php?option)com_content&task)view&id)4884&Itemid)2128 (accessed September 2006).
(44) City of Gainesville, Florida. Stormwater Management Utility;http://www.cityofgainesville.org/pubworks/stormwater/ (ac-cessed September 2006).
(45) City of Minneapolis, Minnesota. Stormwater Rate; http://www.ci.minneapolis.mn.us/stormwater/what-we-do/StormwaterRate.asp#TopOfPage (accessed September 2006).
(46) City of Portland, Oregon. Fiscal Year 2006/2007 Sewer Rates;http:// www.portlandonline.com/bes/ indexcfm?a)117495&c)31019. (accessed September 2006).
(47) City of Seattle, Washington. Drainage Rates; http://www.seattle.gov/uti l/Services/Drainage_&_Sewer/Rates/DRAINAGER_200312020900545.asp (accessed March 2007).
(48) City of Tacoma, Washington. Public Utilities. Rates; http://www.ci.tacoma.wa.us/waterservices/ (accessed September 2006).
(49) District of Columbia. Water and Sewer Authority. Rates; http://www.dcwasa.com/customercare/rates.cfm#currentrates (ac-cessed September 2006).
(50) Saiz, S.; Kennedy, C.; Bass, B.; Pressnail, K. Comparative lifecycle assessment of standard and green roofs. Environ. Sci.Technol. 2006, 40, 4312–4316.
(51) D&R International, Ltd. 2005 Buildings Energy Data Book.Prepared for the Office of Planning Budget Formulation andAnalysis, Energy Efficiency and Renewable Energy, U.S. De-partment of Energy; http://buildingsdatabook.eren.doe.gov/docs/2005bedb-0805.pdf (accessed December 2005).
(52) Saxe, H. Stomatal-dependent and stomatal-independent uptakeof NOx. New Phytol. 1986, 103, 199–205.
(53) Takahashi, M.; Konaka, D.; Sakamoto, A.; Morikawa, H. Noc-turnal uptake and assimilation of nitrogen dioxide by C3 andCAM plants. Z. Naturforsch. 2005, 60c, 279–284.
(54) Chesapeake Bay Program. Nutrient Trading Negotiation Team.Chesapeake Bay Program Nutrient Trading Fundamental Prin-ciples and Guidelines Printed by the U.S. EnvironmentalProtectionAgency,EPA903-B-01–001;http://www.chesapeakebay.net/pubs/subcommittee/nsc/final15guidancedoc.pdf (accessedSeptember 2007).
ES0706652
VOL. 42, NO. 6, 2008 / ENVIRONMENTAL SCIENCE & TECHNOLOGY 9 2161