Embed Size (px)
Citation preview
RESEARCH ARTICLE Open Access
A probabilistic approach for economicevaluation of occupational health andsafety interventions: a case study of silicaexposure reduction interventions in theconstruction sectorAmirabbas Mofidi1,2, Emile Tompa1,3, Seyed Bagher Mortazavi1,2* , Akbar Esfahanipour4 and Paul A. Demers5
Abstract
Background: Construction workers are at a high risk of exposure to various types of hazardous substances such ascrystalline silica. Though multiple studies indicate the evidence regarding the effectiveness of different silicaexposure reduction interventions in the construction sector, the decisions for selecting a specific silica exposurereduction intervention are best informed by an economic evaluation. Economic evaluation of interventions issubjected to uncertainties in practice, mostly due to the lack of precise data on important variables. In this study,we aim to identify the most cost-beneficial silica exposure reduction intervention for the construction sector underuncertain situations.
Methods: We apply a probabilistic modeling approach that covers a large number of variables relevant to the costof lung cancer, as well as the costs of silica exposure reduction interventions. To estimate the societal lifetime costof lung cancer, we use an incidence cost approach. To estimate the net benefit of each intervention, we comparethe expected cost of lung cancer cases averted, with expected cost of implementation of the intervention in onecalendar year. Sensitivity analysis is used to quantify how different variables affect interventions net benefit.
Results: A positive net benefit is expected for all considered interventions. The highest number of lung cancercases are averted by combined use of wet method, local exhaust ventilation and personal protective equipment,about 107 cases, with expected net benefit of $45.9 million. Results also suggest that the level of exposure is animportant determinant for the selection of the most cost-beneficial intervention.
Conclusions: This study provides important insights for decision makers about silica exposure reductioninterventions in the construction sector. It also provides an overview of the potential advantages of usingprobabilistic modeling approach to undertake economic evaluations, particularly when researchers are confrontedwith a large number of uncertain variables.
Keywords: Cost-benefit analysis, Lung cancer, Uncertainty, Probabilistic modeling approach, Net benefit, Bayesiannetworks
© The Author(s). 2020 Open Access This article is distributed under the terms of the Creative Commons Attribution 4.0International License (http://creativecommons.org/licenses/by/4.0/), which permits unrestricted use, distribution, andreproduction in any medium, provided you give appropriate credit to the original author(s) and the source, provide a link tothe Creative Commons license, and indicate if changes were made. The Creative Commons Public Domain Dedication waiver(http://creativecommons.org/publicdomain/zero/1.0/) applies to the data made available in this article, unless otherwise stated.
* Correspondence: [email protected] for Work & Health, 481 University Ave Suite 800, Toronto, ON M5G2E9, Canada2School of Medical Science, Tarbiat Modares University, PO: 14115-111,Tehran, IranFull list of author information is available at the end of the article
Mofidi et al. BMC Public Health (2020) 20:210 https://doi.org/10.1186/s12889-020-8307-7
BackgroundConstruction workers are at a high risk of exposure tovarious types of hazardous substances such as crystallinesilica [1, 2]. Crystalline silica is an abundant materialthat is commonly released in respirable form during dif-ferent construction activities such as concrete work,abrasive blasting, demolition, excavation, earth moving,tunnel construction, and highway building [3]. Reportsindicate that the level of silica exposure for numerousconstruction workers in Ontario, Canada exceed occupa-tional exposure limit (i.e. 0.05 mg/m3) [1]. This is likelythe case in other jurisdictions across Canada and inter-nationally. Meanwhile, occupational silica-related dis-eases such as lung cancer annually impose considerabledirect costs to the healthcare system and indirect coststo industry in the form of lost output and reduced prod-uctivity, as well as high intangible costs in the form ofhealth-related quality of life losses to afflicted workersand their families [4].There are several silica exposure reduction interven-
tions applicable to construction projects [5–10]. Theseinterventions work in different ways, e.g., preventing sil-ica dust from getting into the atmosphere; removingdust in the atmosphere; and preventing workers from in-haling the dust if present in the atmosphere. Wetmethod (WM) refers to the use of water with devices toreduce the release of silica dust. Local exhaust ventila-tion (LEV) refers to the use of local vacuum systems atthe point of operation to reduce the release of free silicadust into the work environment. Personal protectiveequipment (PPE) refers to the use of National Institutefor Occupational Safety and Health approved air-purifying or supplied-air respirators. Enclosed workareas and work hygiene practices are some other com-mon types of intervention options, but are not consid-ered here.Though several studies provide evidence on the effect-
iveness of different silica exposure reduction interven-tions in the construction sector, choosing a specificintervention is best informed by an economic evaluation.Despite the importance of the issue, there are only a feweconomic evaluations of silica exposure reduction inter-ventions. One of these studies by Lahiri et al. [7] evalu-ates the costs and effects of different interventions forthe prevention of occupationally induced silicosis. Theyestimate the cost-effectiveness in terms of the dollarsspent to obtain an additional healthy year. Another eco-nomic evaluation study by the Occupational Safety andHealth Administration (OSHA) in the United States [5]addresses issues related to costs, technological feasibility,and the economic impacts of the proposed respirablecrystalline silica rule, which attempts to reduce the per-missible exposure limits from its current level of 0.1 mg/m3 to 0.05 mg/m3. To do so, the authors forecast the
number of silica-related diseases averted as a result ofthe proposed rule and compare the value of avertedcases with the cost of compliance to the rule in all af-fected industrial sectors.Uncertainty about the magnitude of input variables of
an intervention, which has often been cited as a limita-tion in economic evaluation studies, can affect the preci-sion of results [11, 12]. Input data for these studies canbe provided as probabilistic or deterministic values.Deterministic values should only be applied when spe-cific values are available from a reliable source, while itis best to use probabilistic values when the reliability ofinformation is questionable [13]. In the case at hand, wehave large number of uncertain variables that impact anintervention’s economic evaluation results. For instancethe number of silica-exposed workers and the level ofexposure to silica are uncertain variables. The level ofexposure is influenced by several factors such as thetask, workstation characteristics (e.g. being indoor oroutdoor), materials being used, phase of the constructionproject and other unknown variables. In many circum-stances, it is not possible to collect more data on thelevel of exposure because of the quick pace of change ona construction project site, tasks characteristic, and/orsafety requirements [11]. The risk of getting a silica-related occupational disease for workers of different ageand sex also has a high degree of uncertainty, since la-tent health conditions such as lung cancer are influencedby multiple factors not easily recognized as attributableto occupational silica exposures [14]. The cost of re-spiratory disease treatment is also an uncertain variableas it depends on, amongst other things, the stage of thedisease and the age and sex of the individual [15, 16]. Interms of the effectiveness of a silica exposure reductioninterventions, the maximum is achieved by appropriateand systematic use of an intervention, which is not al-ways the case in practice. For example, some studiessuggest that the malfunction of PPE is influenced by sev-eral environmental factors such as worker’s awareness,the nature of the hazard, climate, and occupationalhealth and safety inspections [17]. The overall effective-ness of WM and LEV interventions also depends on theworkstation characteristics and the number of peopleworking near silica dust sources. Because work arrange-ments vary within occupations and across facilities ofdifferent sizes, there is no definitive data on how manyworkers are likely to be protected by a given intervention[5–10].There are several probabilistic modeling approaches
for solving problems under different levels of uncer-tainty and estimation of expected value, such as deci-sion trees [18], Markov models [18], and Bayesiannetworks (BN) [19]. Decision tree analysis involvesdrawing on a tree-shaped diagram to assist with
Mofidi et al. BMC Public Health (2020) 20:210 Page 2 of 12
statistical probability analysis and identifying a solu-tion to the problem. In decision trees, the probabilityof each possible event is explicitly identified, alongwith the consequences of those events. This method isfrequently used in health economics, specifically forproblems that are more complex in nature [18]. Mar-kov models are being used more often in economicevaluation and are probably the most common type ofmodel used in the economic evaluation of healthcareinterventions [18]. The main advantage of a Markovmodel is the representation of recurring events. Al-though they are similar to decision trees, they do notallow for interaction among variables [18]. BN (alsocalled belief networks) approach, is a graphical struc-ture that allows one to capture the relationships be-tween variables. To illustrate these relationships, adiagram of nodes and arrows is often used. Nodes rep-resent the system variables and the arrows symbolizethe direct dependencies among the variables. BN areused to compute the distribution probabilities in a setof variables according to the observation of some vari-ables and the prior knowledge of the others [19].Recently, the BN approach has gained popularity indifferent areas of health economics [13], project costand risk analysis [20–22], cost-benefit analysis [23],and occupational health and safety decision making[24]. BNs are preferred for several reasons, such as theability to integrate various types of data (i.e., qualita-tive and quantitative), to combine available data withexpert knowledge, to explicitly consider relationshipsbetween variables, to model complex problems withmany variables involving a high level of uncertaintyand to easily provide graphical representations [19–23]. The modeling languages of BNs have straightfor-ward semantics, namely that of cause and effect. Fur-thermore, the needed probability calculation of BNs isoften undertaken with the assistance of software pack-ages such as Netica, GeNIe, BayesiaLab, Analytica,Hugin, Bayes Net Toolbox, and many others (this isnot a comprehensive list, and not meant to promoteany specific software). In this study, our objective is toidentify the most cost-beneficial silica exposure reduc-tion intervention for the construction sector in On-tario, Canada. To estimate the net benefit of eachintervention, we apply a probabilistic modeling ap-proach to compare the expected cost of lung cancercases averted, with expected cost of implementation ofeach intervention in one calendar year. We anticipatethis study provides important insights for occupationalhealth policy makers and workplace parties in the con-struction sector. More broadly, this study provides amethodological framework for a more complete treat-ment of uncertainties in the economic evaluation ofoccupational health and safety interventions via BN.
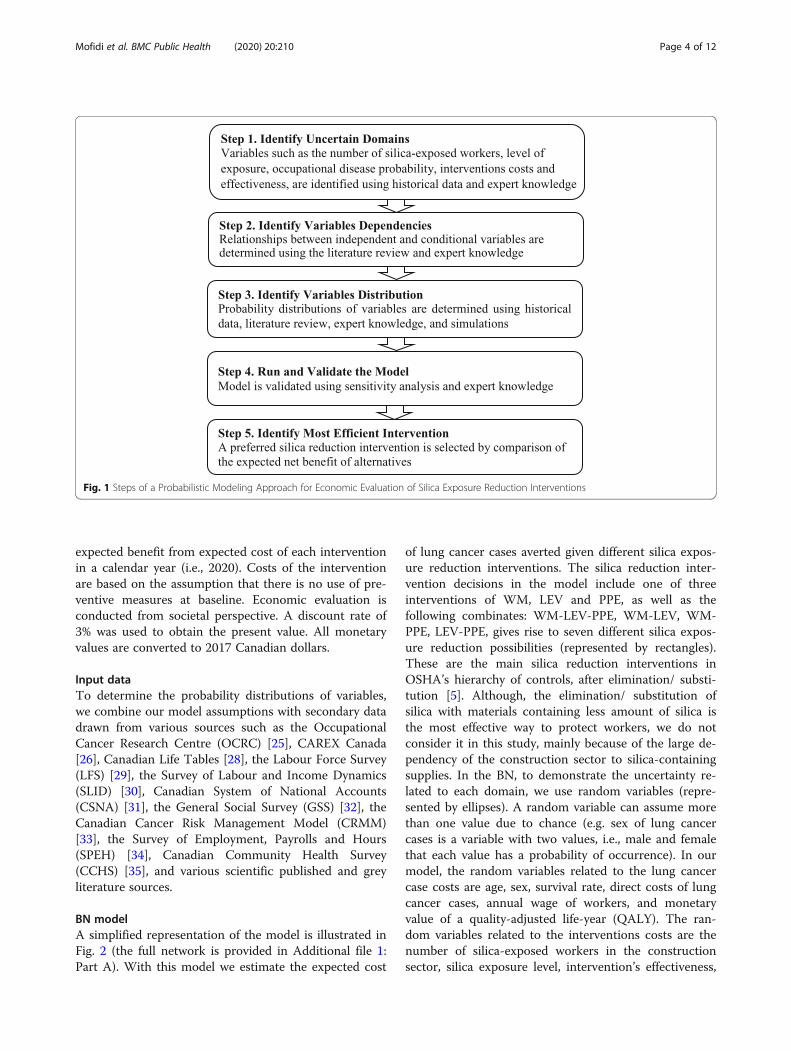
MethodsStudy stepsFigure 1 identifies the main steps of our probabilisticmodeling approach for the economic evaluation of silicaexposure reduction interventions. In the first step, weidentify all variables that impact the net benefit of thesilica reduction interventions, such as the number ofsilica-exposed workers, level of exposure and interven-tion effectiveness. Variables not dependent on any othervariables (called root nodes in BN vocabulary) have asingle probability distribution, whereas variablesdependent on one or more other variables (called childnodes) have a conditional probability table (dependencyof a child variable to its parent’s variables) [19]. In thesecond step, we identify dependencies between variablesvia a literature review and expert knowledge. Six re-searchers with the following backgrounds were involvedin all stages of the project meeting: an expert in silicareduction interventions, two occupational health special-ists, one economist, and two epidemiologists. Brain-storming sessions and interviews with experts wererelatively unstructured. In sessions, participants were allgiven an opportunity to contribute to the discussionuntil consensus was reached. Expert feedback also helpsus to identify variables and interactions that were over-looked when first developing the model. In the thirdstep, we identify the probability distributions of vari-ables, drawing on several scientific literatures inepidemiology [25, 26], occupational cancer economicburden studies [4, 16], and silica exposure reductioninterventions [5–10]. Once the distributions of inde-pendent variables are determined, we compute the prob-ability distributions of conditional variables according tothe knowledge of their parents. The main assumptionsabout the distribution of each variable are explained inthe following paragraphs. To develop the structure ofBN model and to compute the probability distributions,we use GeNIe modeller version 2.2.4 (BayesFusion, Pitts-burgh University decision system laboratory) [27]. Stepfour involves establishing the structural validity of themodel. We validate the model by setting the variables toextreme values and turn to expert judgment to confirmwhether the range of results (e.g. expected lung cancercases, averted costs, and/or interventions costs) appearsreasonable. Sensitivity analysis is also undertaken toquantify how different values of independent variablesaffect the net benefit of interventions. In the fifth andlast step, we select a preferred silica reduction interven-tion by comparing the expected net benefit of alterna-tives. Benefits are the expected cost of lung cancer casesaverted after implementation of different interventions.We use an incidence cost approach and estimate the so-cietal lifetime cost of lung cancer cases. Then we calcu-late expected net benefit as the difference between the
Mofidi et al. BMC Public Health (2020) 20:210 Page 3 of 12
expected benefit from expected cost of each interventionin a calendar year (i.e., 2020). Costs of the interventionare based on the assumption that there is no use of pre-ventive measures at baseline. Economic evaluation isconducted from societal perspective. A discount rate of3% was used to obtain the present value. All monetaryvalues are converted to 2017 Canadian dollars.
Input dataTo determine the probability distributions of variables,we combine our model assumptions with secondary datadrawn from various sources such as the OccupationalCancer Research Centre (OCRC) [25], CAREX Canada[26], Canadian Life Tables [28], the Labour Force Survey(LFS) [29], the Survey of Labour and Income Dynamics(SLID) [30], Canadian System of National Accounts(CSNA) [31], the General Social Survey (GSS) [32], theCanadian Cancer Risk Management Model (CRMM)[33], the Survey of Employment, Payrolls and Hours(SPEH) [34], Canadian Community Health Survey(CCHS) [35], and various scientific published and greyliterature sources.
BN modelA simplified representation of the model is illustrated inFig. 2 (the full network is provided in Additional file 1:Part A). With this model we estimate the expected cost
of lung cancer cases averted given different silica expos-ure reduction interventions. The silica reduction inter-vention decisions in the model include one of threeinterventions of WM, LEV and PPE, as well as thefollowing combinates: WM-LEV-PPE, WM-LEV, WM-PPE, LEV-PPE, gives rise to seven different silica expos-ure reduction possibilities (represented by rectangles).These are the main silica reduction interventions inOSHA’s hierarchy of controls, after elimination/ substi-tution [5]. Although, the elimination/ substitution ofsilica with materials containing less amount of silica isthe most effective way to protect workers, we do notconsider it in this study, mainly because of the large de-pendency of the construction sector to silica-containingsupplies. In the BN, to demonstrate the uncertainty re-lated to each domain, we use random variables (repre-sented by ellipses). A random variable can assume morethan one value due to chance (e.g. sex of lung cancercases is a variable with two values, i.e., male and femalethat each value has a probability of occurrence). In ourmodel, the random variables related to the lung cancercase costs are age, sex, survival rate, direct costs of lungcancer cases, annual wage of workers, and monetaryvalue of a quality-adjusted life-year (QALY). The ran-dom variables related to the interventions costs are thenumber of silica-exposed workers in the constructionsector, silica exposure level, intervention’s effectiveness,
Fig. 1 Steps of a Probabilistic Modeling Approach for Economic Evaluation of Silica Exposure Reduction Interventions
Mofidi et al. BMC Public Health (2020) 20:210 Page 4 of 12
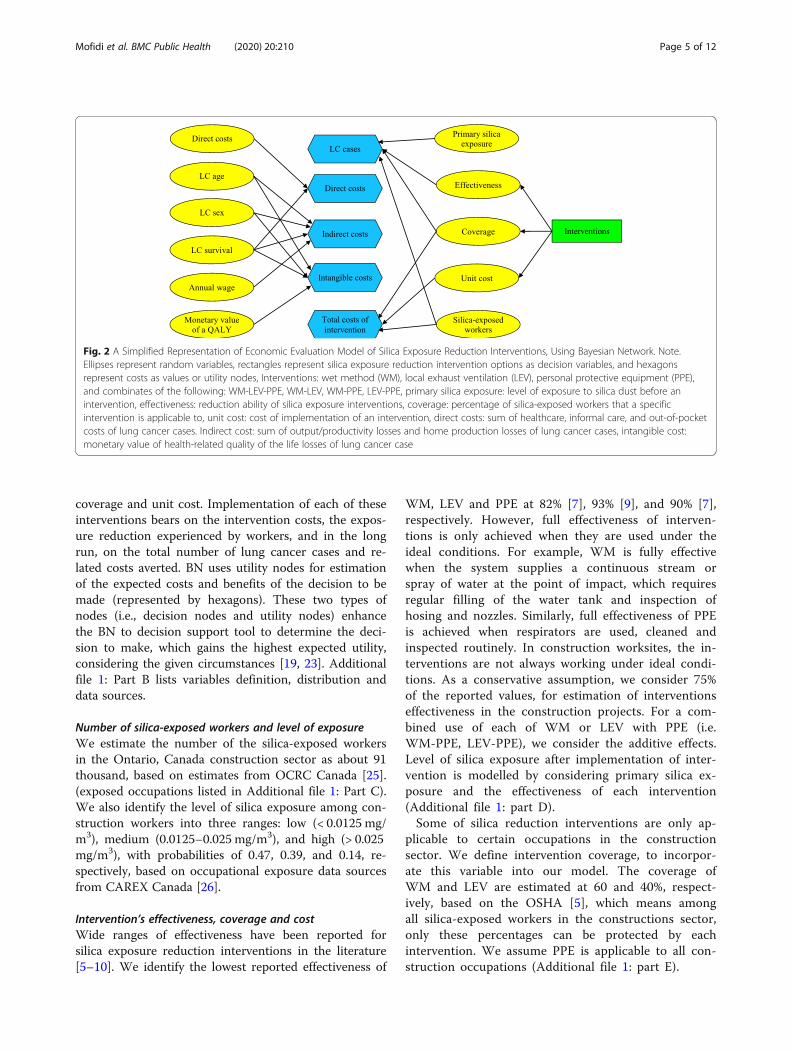
coverage and unit cost. Implementation of each of theseinterventions bears on the intervention costs, the expos-ure reduction experienced by workers, and in the longrun, on the total number of lung cancer cases and re-lated costs averted. BN uses utility nodes for estimationof the expected costs and benefits of the decision to bemade (represented by hexagons). These two types ofnodes (i.e., decision nodes and utility nodes) enhancethe BN to decision support tool to determine the deci-sion to make, which gains the highest expected utility,considering the given circumstances [19, 23]. Additionalfile 1: Part B lists variables definition, distribution anddata sources.
Number of silica-exposed workers and level of exposureWe estimate the number of the silica-exposed workersin the Ontario, Canada construction sector as about 91thousand, based on estimates from OCRC Canada [25].(exposed occupations listed in Additional file 1: Part C).We also identify the level of silica exposure among con-struction workers into three ranges: low (< 0.0125 mg/m3), medium (0.0125–0.025 mg/m3), and high (> 0.025mg/m3), with probabilities of 0.47, 0.39, and 0.14, re-spectively, based on occupational exposure data sourcesfrom CAREX Canada [26].
Intervention’s effectiveness, coverage and costWide ranges of effectiveness have been reported forsilica exposure reduction interventions in the literature[5–10]. We identify the lowest reported effectiveness of
WM, LEV and PPE at 82% [7], 93% [9], and 90% [7],respectively. However, full effectiveness of interven-tions is only achieved when they are used under theideal conditions. For example, WM is fully effectivewhen the system supplies a continuous stream orspray of water at the point of impact, which requiresregular filling of the water tank and inspection ofhosing and nozzles. Similarly, full effectiveness of PPEis achieved when respirators are used, cleaned andinspected routinely. In construction worksites, the in-terventions are not always working under ideal condi-tions. As a conservative assumption, we consider 75%of the reported values, for estimation of interventionseffectiveness in the construction projects. For a com-bined use of each of WM or LEV with PPE (i.e.WM-PPE, LEV-PPE), we consider the additive effects.Level of silica exposure after implementation of inter-vention is modelled by considering primary silica ex-posure and the effectiveness of each intervention(Additional file 1: part D).Some of silica reduction interventions are only ap-
plicable to certain occupations in the constructionsector. We define intervention coverage, to incorpor-ate this variable into our model. The coverage ofWM and LEV are estimated at 60 and 40%, respect-ively, based on the OSHA [5], which means amongall silica-exposed workers in the constructions sector,only these percentages can be protected by eachintervention. We assume PPE is applicable to all con-struction occupations (Additional file 1: part E).
Fig. 2 A Simplified Representation of Economic Evaluation Model of Silica Exposure Reduction Interventions, Using Bayesian Network. Note.Ellipses represent random variables, rectangles represent silica exposure reduction intervention options as decision variables, and hexagonsrepresent costs as values or utility nodes, Interventions: wet method (WM), local exhaust ventilation (LEV), personal protective equipment (PPE),and combinates of the following: WM-LEV-PPE, WM-LEV, WM-PPE, LEV-PPE, primary silica exposure: level of exposure to silica dust before anintervention, effectiveness: reduction ability of silica exposure interventions, coverage: percentage of silica-exposed workers that a specificintervention is applicable to, unit cost: cost of implementation of an intervention, direct costs: sum of healthcare, informal care, and out-of-pocketcosts of lung cancer cases. Indirect cost: sum of output/productivity losses and home production losses of lung cancer cases, intangible cost:monetary value of health-related quality of the life losses of lung cancer case
Mofidi et al. BMC Public Health (2020) 20:210 Page 5 of 12
Intervention costs are estimated by using three vari-ables: 1) number of silica-exposed workers that are pro-tected by intervention, 2) intervention unit cost and 3)intervention protection factor, as indicated in expression1. For estimation of the unit cost of the WM, LEV, andPPE, we use OSHA [5] (Additional file 1: part F). Theprotection factor represents the number of silica-exposed workers that can be protected by each unit ofWM or LEV. Recall, WM and LEV protect a group ofworkers, so for estimation of the total cost of these in-terventions, we need to know how many workers areprotected by each unit of them. For estimation of theprotection factor of both WM and LEV, we drew fromLahiri et al. [7] and estimate their protection factor aver-age at 5 workers, and assume it ranging from 1 to 10workers with Gaussian distribution. Note that PPE totalcost does not depend on the protection factor, as eachunit of PPE only protects one silica-exposed worker.
TotalcostofinterventionðxÞ
¼ interventionunitcostðxÞ � protectedgroupðxÞprotectionfactorðxÞ
ð1Þ
Lung cancer cases age, sex, survivalWe define the age of occupational lung cancer cases in13 intervals, ranging from 25 to more than 85 years ofage [25]. The highest probability of lung cancer is be-tween 70 and 74 years. This older age of onset is due tothe long latency of this disease (Additional file 1: partG). Additionally, men have a higher incidence of occupa-tional lung cancer than women (0.7 versus 0.3) becauseof their higher level of exposure in different male-dominated occupations in the construction sector [25].We identified the survival probability of lung cancercases at 0.09 from CRMM [33].
Annual wage of workersTo estimate average labour-market earnings of workersfor each age and sex group, we used LFS [29], and SLID[30]. Then we add 14% to account for payroll cost paidby employers, based on employer contribution data fromthe CSNA [31]. We define labour-force participation fol-lowing treatment of lung cancer cases at 0.77, similar toEarle et al. [36] It is assumed that once they returned towork, their productivity is the same as the productivityof the general population.
Monetary value of a quality-adjusted life-yearGiven the wide range of monetary values of a QALY inthe health economics literature, we consider a range ofvalue in the form of sensitivity analyses. Our baselinevalue is $150,000 which is reflective of willingness-to-pay values for a QALY identified in recent studies [37].
For sensitivity analyses we use a range from $100,000,which has been used in Canada in the health technologyassessment field, to $200,000 which has been extrapo-lated from increases in health care spending over timeand the health gains that have been associated withthose increases [38].
Lung cancer casesThe number of lung cancer cases expected to arise fromdifferent levels of silica exposure, is estimated by usingtwo variables— the number of the silica-exposedworkers that are protected by each intervention, and theprobability of lung cancer, as described in expression 2.The number of silica-exposed workers that are protectedby each intervention depends on the intervention cover-age described above. We estimate the probability of lungcancer for different level of silica exposure ranges fromlow, medium, and high at 9.1E-4, 1.2E-3, and 1.4E-3, re-spectively, based on OCRC.25 (Additional file 1: part H).After the implementation of each intervention, silica ex-posure is reduced to a lower level, depending on the ef-fectiveness of the intervention (e.g. by using PPE thelevel of silica exposure shifts from medium to low) andconsequently, we expect a lower probability of lung can-cer among the protected group of silica-exposedworkers. In the expression, x is the silica exposure re-duction from the interventions, which is WM, LEV, PPE,or some combination of them.Lung cancer cases(x) = number of the workers protec-
ted(x) × probability of lung cancer(x)(2).
Lung cancer direct, indirect and intangible costsThese are three sub-categories of the economic burdenof lung cancer cases, which are estimated based on ourprevious study [16]. We identify the direct cost of lungcancer in three categories: healthcare [33], out-of-pocketcosts [39], and informal caregiving costs [40], and as-sume it follows a Gaussian distribution [41]. We includeoutput/productivity losses and home production lossesof lung cancer cases under the indirect cost category,and monetary value of health-related quality of life lossesof lung cancer under the intangible cost category. Weconsidered the monetary value of time lost due to poorhealth or premature death using survival probabilitiesfrom the Canadian population [16]. The description ofthe techniques used to estimate these costs, are pre-sented in Additional file 1: part I.
ResultsExpected costs and benefitsTable 1 presents the expected lung cancer cases avertedand net benefit of the seven silica exposure reduction in-terventions. The values are calculated separately for eachof the seven intervention combinations. The percentage
Mofidi et al. BMC Public Health (2020) 20:210 Page 6 of 12
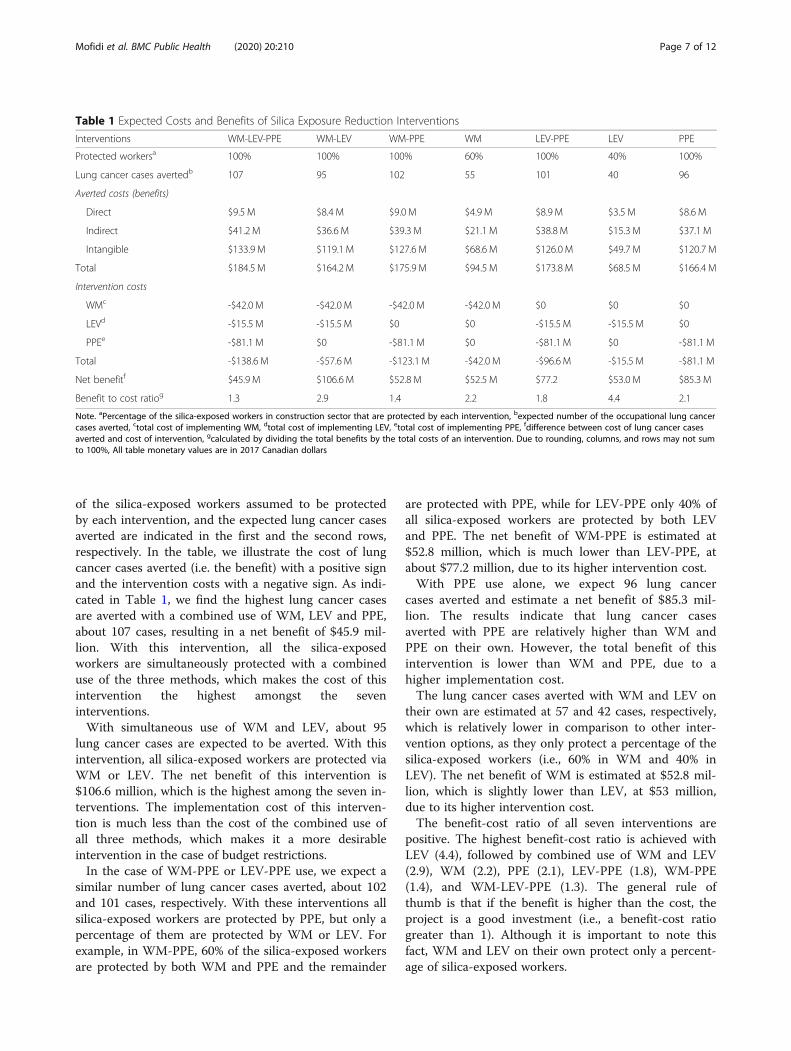
of the silica-exposed workers assumed to be protectedby each intervention, and the expected lung cancer casesaverted are indicated in the first and the second rows,respectively. In the table, we illustrate the cost of lungcancer cases averted (i.e. the benefit) with a positive signand the intervention costs with a negative sign. As indi-cated in Table 1, we find the highest lung cancer casesare averted with a combined use of WM, LEV and PPE,about 107 cases, resulting in a net benefit of $45.9 mil-lion. With this intervention, all the silica-exposedworkers are simultaneously protected with a combineduse of the three methods, which makes the cost of thisintervention the highest amongst the seveninterventions.With simultaneous use of WM and LEV, about 95
lung cancer cases are expected to be averted. With thisintervention, all silica-exposed workers are protected viaWM or LEV. The net benefit of this intervention is$106.6 million, which is the highest among the seven in-terventions. The implementation cost of this interven-tion is much less than the cost of the combined use ofall three methods, which makes it a more desirableintervention in the case of budget restrictions.In the case of WM-PPE or LEV-PPE use, we expect a
similar number of lung cancer cases averted, about 102and 101 cases, respectively. With these interventions allsilica-exposed workers are protected by PPE, but only apercentage of them are protected by WM or LEV. Forexample, in WM-PPE, 60% of the silica-exposed workersare protected by both WM and PPE and the remainder
are protected with PPE, while for LEV-PPE only 40% ofall silica-exposed workers are protected by both LEVand PPE. The net benefit of WM-PPE is estimated at$52.8 million, which is much lower than LEV-PPE, atabout $77.2 million, due to its higher intervention cost.With PPE use alone, we expect 96 lung cancer
cases averted and estimate a net benefit of $85.3 mil-lion. The results indicate that lung cancer casesaverted with PPE are relatively higher than WM andPPE on their own. However, the total benefit of thisintervention is lower than WM and PPE, due to ahigher implementation cost.The lung cancer cases averted with WM and LEV on
their own are estimated at 57 and 42 cases, respectively,which is relatively lower in comparison to other inter-vention options, as they only protect a percentage of thesilica-exposed workers (i.e., 60% in WM and 40% inLEV). The net benefit of WM is estimated at $52.8 mil-lion, which is slightly lower than LEV, at $53 million,due to its higher intervention cost.The benefit-cost ratio of all seven interventions are
positive. The highest benefit-cost ratio is achieved withLEV (4.4), followed by combined use of WM and LEV(2.9), WM (2.2), PPE (2.1), LEV-PPE (1.8), WM-PPE(1.4), and WM-LEV-PPE (1.3). The general rule ofthumb is that if the benefit is higher than the cost, theproject is a good investment (i.e., a benefit-cost ratiogreater than 1). Although it is important to note thisfact, WM and LEV on their own protect only a percent-age of silica-exposed workers.
Table 1 Expected Costs and Benefits of Silica Exposure Reduction Interventions
Interventions WM-LEV-PPE WM-LEV WM-PPE WM LEV-PPE LEV PPE
Protected workersa 100% 100% 100% 60% 100% 40% 100%
Lung cancer cases avertedb 107 95 102 55 101 40 96
Averted costs (benefits)
Direct $9.5 M $8.4 M $9.0 M $4.9 M $8.9 M $3.5 M $8.6 M
Indirect $41.2 M $36.6 M $39.3 M $21.1 M $38.8 M $15.3 M $37.1 M
Intangible $133.9 M $119.1 M $127.6 M $68.6 M $126.0 M $49.7 M $120.7 M
Total $184.5 M $164.2 M $175.9 M $94.5 M $173.8 M $68.5 M $166.4 M
Intervention costs
WMc -$42.0 M -$42.0 M -$42.0 M -$42.0 M $0 $0 $0
LEVd -$15.5 M -$15.5 M $0 $0 -$15.5 M -$15.5 M $0
PPEe -$81.1 M $0 -$81.1 M $0 -$81.1 M $0 -$81.1 M
Total -$138.6 M -$57.6 M -$123.1 M -$42.0 M -$96.6 M -$15.5 M -$81.1 M
Net benefitf $45.9 M $106.6 M $52.8 M $52.5 M $77.2 $53.0 M $85.3 M
Benefit to cost ratiog 1.3 2.9 1.4 2.2 1.8 4.4 2.1
Note. aPercentage of the silica-exposed workers in construction sector that are protected by each intervention, bexpected number of the occupational lung cancercases averted, ctotal cost of implementing WM, dtotal cost of implementing LEV, etotal cost of implementing PPE, fdifference between cost of lung cancer casesaverted and cost of intervention, gcalculated by dividing the total benefits by the total costs of an intervention. Due to rounding, columns, and rows may not sumto 100%, All table monetary values are in 2017 Canadian dollars
Mofidi et al. BMC Public Health (2020) 20:210 Page 7 of 12
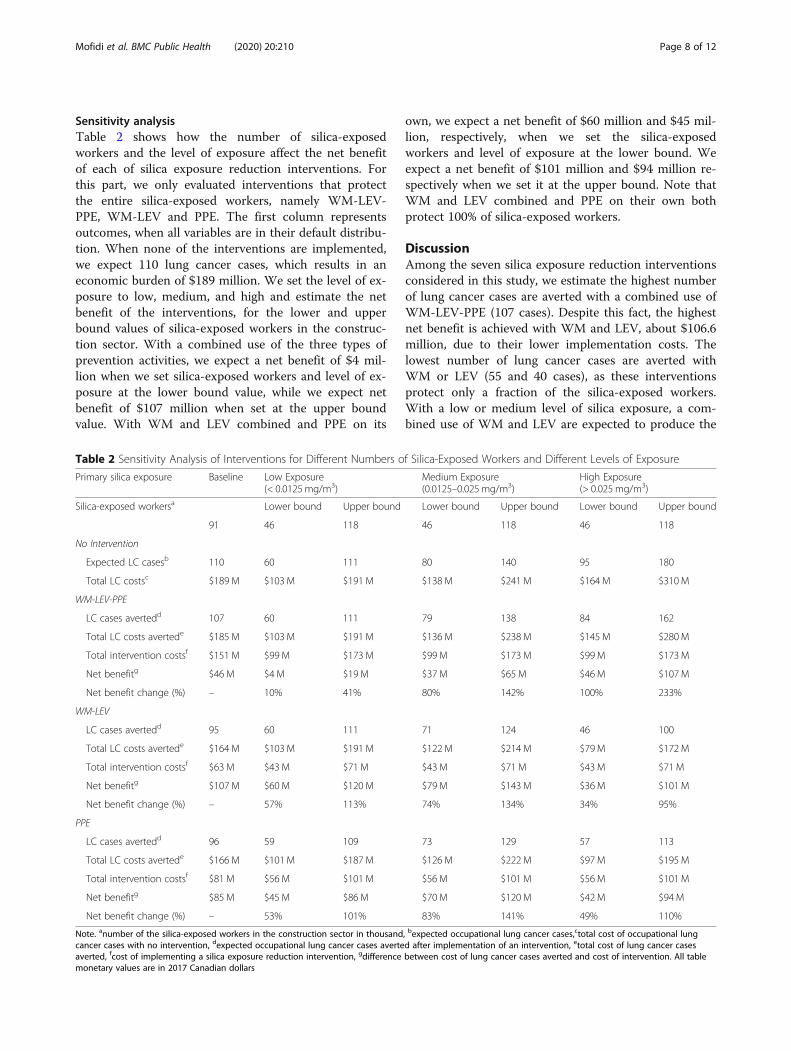
Sensitivity analysisTable 2 shows how the number of silica-exposedworkers and the level of exposure affect the net benefitof each of silica exposure reduction interventions. Forthis part, we only evaluated interventions that protectthe entire silica-exposed workers, namely WM-LEV-PPE, WM-LEV and PPE. The first column representsoutcomes, when all variables are in their default distribu-tion. When none of the interventions are implemented,we expect 110 lung cancer cases, which results in aneconomic burden of $189 million. We set the level of ex-posure to low, medium, and high and estimate the netbenefit of the interventions, for the lower and upperbound values of silica-exposed workers in the construc-tion sector. With a combined use of the three types ofprevention activities, we expect a net benefit of $4 mil-lion when we set silica-exposed workers and level of ex-posure at the lower bound value, while we expect netbenefit of $107 million when set at the upper boundvalue. With WM and LEV combined and PPE on its
own, we expect a net benefit of $60 million and $45 mil-lion, respectively, when we set the silica-exposedworkers and level of exposure at the lower bound. Weexpect a net benefit of $101 million and $94 million re-spectively when we set it at the upper bound. Note thatWM and LEV combined and PPE on their own bothprotect 100% of silica-exposed workers.
DiscussionAmong the seven silica exposure reduction interventionsconsidered in this study, we estimate the highest numberof lung cancer cases are averted with a combined use ofWM-LEV-PPE (107 cases). Despite this fact, the highestnet benefit is achieved with WM and LEV, about $106.6million, due to their lower implementation costs. Thelowest number of lung cancer cases are averted withWM or LEV (55 and 40 cases), as these interventionsprotect only a fraction of the silica-exposed workers.With a low or medium level of silica exposure, a com-bined use of WM and LEV are expected to produce the
Table 2 Sensitivity Analysis of Interventions for Different Numbers of Silica-Exposed Workers and Different Levels of Exposure
Primary silica exposure Baseline Low Exposure(< 0.0125mg/m3)
Medium Exposure(0.0125–0.025 mg/m3)
High Exposure(> 0.025 mg/m3)
Silica-exposed workersa Lower bound Upper bound Lower bound Upper bound Lower bound Upper bound
91 46 118 46 118 46 118
No Intervention
Expected LC casesb 110 60 111 80 140 95 180
Total LC costsc $189 M $103 M $191 M $138 M $241 M $164 M $310M
WM-LEV-PPE
LC cases avertedd 107 60 111 79 138 84 162
Total LC costs avertede $185 M $103 M $191 M $136 M $238 M $145 M $280M
Total intervention costsf $151 M $99 M $173 M $99 M $173 M $99 M $173M
Net benefitg $46 M $4M $19 M $37 M $65 M $46 M $107M
Net benefit change (%) – 10% 41% 80% 142% 100% 233%
WM-LEV
LC cases avertedd 95 60 111 71 124 46 100
Total LC costs avertede $164 M $103 M $191 M $122 M $214 M $79 M $172M
Total intervention costsf $63 M $43 M $71 M $43 M $71 M $43 M $71 M
Net benefitg $107 M $60 M $120 M $79 M $143 M $36 M $101M
Net benefit change (%) – 57% 113% 74% 134% 34% 95%
PPE
LC cases avertedd 96 59 109 73 129 57 113
Total LC costs avertede $166 M $101 M $187 M $126 M $222 M $97 M $195M
Total intervention costsf $81 M $56 M $101 M $56 M $101 M $56 M $101M
Net benefitg $85 M $45 M $86 M $70 M $120 M $42 M $94 M
Net benefit change (%) – 53% 101% 83% 141% 49% 110%
Note. anumber of the silica-exposed workers in the construction sector in thousand, bexpected occupational lung cancer cases,ctotal cost of occupational lungcancer cases with no intervention, dexpected occupational lung cancer cases averted after implementation of an intervention, etotal cost of lung cancer casesaverted, fcost of implementing a silica exposure reduction intervention, gdifference between cost of lung cancer cases averted and cost of intervention. All tablemonetary values are in 2017 Canadian dollars
Mofidi et al. BMC Public Health (2020) 20:210 Page 8 of 12
highest net benefit, while with a high level of exposure,the combined use of WM-LEV-PPE is expected to resultin the highest net benefit.In terms on future uses of BN in the area of Occupa-
tional Health and Safety (OHS) economic evaluation,one potential use is trade-off analysis between expectedcosts and benefits of an intervention when there is abudget constraint, or when one is interested in identify-ing the required budget to avert a specific number oflung cancer cases. For example, as shown in Table 1, wecan consider a situation in which the budget is con-strained to $70 million. In such a situation, using WM-LEV is the only intervention that will protect 100% ofsilica-exposed workers without the total interventioncost exceeding the pre-set amount. Trade-off analysisprovides an opportunity for decision makers to definetheir targets regarding the prevention of a specific num-ber of occupational lung cancer cases in the context of apredetermined budget.To our knowledge, this is the first study to use the
cost of silica-related occupational lung cancer casesaverted for the benefit component in the economicevaluation of an intervention. Therefore, it is difficult tocompare our findings with those of other studies. Forexample, Lahiri et al. [7] consider the averted cost of oc-cupationally induced silicosis as a benefit and the cost ofdifferent interventions. They estimate the cost-effectiveness of interventions with a ratio (i.e., dollarsper healthy years gained), and find they vary between$132.3 ($105.9 in 2005 US dollars) and $136.2 ($109 in2005 US dollars) for different geographic sub-regions.However, they do not include cost items such as health-care, informal caregiving, out-of-pocket, and home pro-duction losses in their analysis. Despite difference ineconomic evaluation methodologies and the inconsisten-cies of considered outcomes, our results are in line withLahiri et al. [7], as we also identify the net benefit ofWM-LEV as the highest among seven interventions.However, as they neither report the average per-casecost for interventions nor the number of silica-exposedworkers affected, so we are unable to estimate a per-casevalue for their study.In another study in the United States, OSHA estimates
the net benefit of compliance with a new silica rule interms of reduction of cost of silica-related diseases (i.e.,fatal cases of lung cancer, non-malignant respiratory dis-eases, renal diseases and nonfatal cases of silicosis) [5].They estimate the net annualized benefit of a reductionin the acceptable limit of exposure to be between $2.4billion and $9.9 billion ($1.8 billion and $7.5 billion in2009 US dollars), with a midpoint value of $6.1 billion($4.6 billion in 2009 US dollars). Annually, the loweringof the exposure limit prevents 688 fatalities (567 fatal-ities in the construction sector) and 1585 moderate-to-
severe silicosis cases (1080 cases in the constructionsector).In both of the studies referred to above, researchers
assume all the variables are deterministic. However, un-certainty of variables is relevant for most of occupationalhealth interventions. In an economic evaluation of anintervention one generally includes many variables withdifferent levels of uncertainty, yet this uncertainty acrossdata inputs has not been substantively addressed in OHSstudies in the past. Ours is one of the first economicevaluation studies in OHS field to use BN. We also pro-vide an overview of some of the potential benefits ofusing this approach and guidance on how to do so. Spe-cifically, we explained the main steps of developing a BNin OHS setting, how to parametrize the variables, definethe variable distribution, and incorporate them into amodel. We capture the uncertainty of each variable andintegrate the dependencies between them using a BN,and then estimate the expected net benefit of variousinterventions.While the BN model developed in this study can sup-
port decision making, in its current form there is roomfor improvement of the approach. Future work in thisarea ought to include further research on the expansionof the model contents, including consideration of abroader set of variables. For example, in our study, thebenefit side of our economic evaluation is limited to oc-cupational lung cancer cases averted, despite the factthere are several other silica-related occupational dis-eases such as silicosis and silicosis-related diseases [4, 5,7]. Additionally, to estimate averted productivity losseswe focus only on absenteeism, not presenteeism, primar-ily because there is a lack of evidence to draw on for themagnitude of productivity losses associated with lungcancer cases upon return to work. Furthermore, ourmodel structure can be improved upon by considering agreater number of relationships between the key vari-ables, since we ignored some interactions because oflimitations in background knowledge. For instance, in-terventions may adversely influence labour and/orequipment productivity [5], and under certain circum-stances, the health-related quality of life of workers maybe affected by the intervention [17]. Another example inthis regard is the dependencies that might exist betweenage and sex in terms of the survival rates of occupationalsilica-related lung cancer cases. A more comprehensiveanalysis would consider other variable interactions thatare caused by implementing an intervention. Moreover,in this study we do not investigate the time needed toimplement silica reduction interventions and the dur-ation of their effectiveness. Undoubtedly, because of therelatively long latency period of lung cancer, ultimate ef-fect of silica reduction interventions will only be realizedafter several years. Further research is also needed on
Mofidi et al. BMC Public Health (2020) 20:210 Page 9 of 12
how to incorporate the uncertainty of the timeline of in-terventions into an economic evaluation, for example toaccount for variability in how many years after the intro-duction of an intervention it takes before the reductionof lung cancer cases reaches a steady state. Lastly, imple-mentation of sensitivity analysis and sorting model vari-ables by level of uncertainty is also one of the abilitieswherein BN can provide invaluable analytic insight forpolicy makers, particularly for the purpose of developingdata gathering strategies. In this regard, we also recom-mend implementation of Value of Information Analysesin future research, as it also enables one to identify partsof a model where additional data (reduction of uncer-tainty) is most useful.
ConclusionsThis study is one of the first to apply BN, as a probabilisticmodeling approach, in the economic evaluation of anOHS intervention. It provides an overview of the potentialadvantages of the probabilistic modeling approach, in par-ticular when decision contexts contain a large number ofuncertain variables. Results indicate that, among seven sil-ica exposure reduction interventions, the highest numberof lung cancer cases are averted with a combined use ofWM-LEV-PPE, but the highest net benefit is achievedwith WM-LEV. Results also suggest that the level of ex-posure is an important determinant for the selection ofthe most cost-beneficial intervention. This study providesevidence that can assist researchers interested in demon-strating the monetary impact of decreasing or eliminatingsilica exposures in workplaces through various interven-tions. The positive return on investment of these interven-tions can help inform policy decision making, particularlyin cases where optimal allocation of scarce resources isparamount. Considering the increasing attention being fo-cused on the prevention of occupational cancer, we antici-pate the case study provides important insights aboutsilica exposure reduction interventions in the constructionsector.
Supplementary informationSupplementary information accompanies this paper at https://doi.org/10.1186/s12889-020-8307-7.
Additional file 1. Part A Bayesian Network Model for EconomicEvaluation of Silica Exposure Reduction Interventions in ConstructionSector. Part B Variables in the Economic Evaluation of Silica ExposureReduction Interventions. Part C Silica-exposed Workers in the Construc-tion Sector (Projection for 2020). Part D Secondary Silica Exposure. Part EInterventions Coverage. Part F Interventions Unit Cost. Part G Age Distri-bution of Lung Cancer Cases. Part H Probability of Lung Cancer in Differ-ent Level of Silica Exposure. Part I Direct, Indirect and Intangible Costs ofLung Cancer
AbbreviationsBN: Bayesian network; CRMM: Canadian Cancer Risk Management Model;CSNA: Canadian System of National Accounts; GSS: General Social Survey;
LEV: Local exhaust ventilation; LFS: Labour Force Survey; OCRC: OccupationalCancer Research Centre; OSHA: Occupational Safety and HealthAdministration; PPE: personal protective equipment; SLID: Survey of Labourand Income Dynamics; SPEH: Survey of Employment, Payrolls and Hours;CCHS: Canadian Community Health Survey; QALY: Quality-Adjusted Life Year;CCO: Cancer Care Ontario; WM: Wet method
AcknowledgementsEpidemiological modeling was developed and implemented by a team ofexperts and research assistants at Occupational Research Center (OCRC) inCancer Care Ontario (CCO) in Toronto, as they were the lead partner on theproject.
Authors’ contributionsAM: Lead author of this study. Led the conceptual and methodologicaldesign of probabilistic analysis and economic component of the study. ET:Study co-investigator. Oversight the conceptual and methodological designof the economic component of the study, assisted in preparing the manu-script write-up, reviewed drafts of the manuscript and provided editorial sug-gestions. SM: Study co-investigator. Contributed to the methodologicaldesign and oversight on technical aspects of occupational hygiene compo-nent. AE: Study co-investigator. Contributed to the conceptual and methodo-logical design of probabilistic modeling component of the study, revieweddrafts of the manuscript and provided editorial suggestions. PD: Project teamlead. Led the conceptual and methodological design of the epidemiologicalcomponent of the study, reviewed drafts of the manuscript and providededitorial suggestions. All authors have participated in the conception andwriting of this manuscript and have read the final version of the manuscript.The manuscript represents honest work. All authors read and approved thefinal manuscript.
FundingThis study was completed as part of a project that was wholly funded by theWorkplace Safety and Insurance Board (WSIB) of Ontario (grant ROP-15-R-026). Some of the preliminary work was completed under a project fundedby the Canadian Cancer Society (CCS) (grant 701285–00).
Availability of data and materialsAll data generated or analysed during this study are included in thispublished article [and its supplementary information files].Cancer Care Ontario, Occupational Cancer Research Centre. Burden ofoccupational cancer in Ontario: Major workplace carcinogens and preventionof exposure. 2017. http://www.occupationalcancer.ca/wp-content/uploads/2017/09/Burden-of-Occupational-Cancer-in-Ontario.pdf. Accessed 26 Feb 2018.CAREX Canada. Silica (crystalline) occupational exposures. 2017. https://www.carexcanada.ca/en/silica_(crystalline)/occupational_estimate/#data_sources_and_methods. Accessed: Accessed 26 Feb 2018.Statistics Canada. Life Tables, Canada, provinces and territories 2010 to 2012.https://www150.statcan.gc.ca/n1/daily-quotidien/160519/dq160519c-eng.htm. Accessed 26 Feb 2018.Statistics Canada. Labour force survey, employment and unemployment,levels and rates, by province. 2017. http://www.statcan.gc.ca/tables-tableaux/sum-som/l01/cst01/labor07b-eng.htm. Accessed 26 Feb 2018.Statistics Canada: survey of labour and income dynamics. 2011. http://www.statcan.gc.ca/pub/75f0011x/75f0011x2013001-eng.htm. Accessed 26 Feb2018.Statistics Canada. Sources of annual average growth in labour productivity inthe total business sector. CANSIM Table 383–0021. 2017. http://www.statcan.gc.ca/pub/15-206-x/2013030/t001-eng.htm. Accessed 26 Feb 2018.Statistics Canada. General social survey cycle 24: time-stress and well-beingpublic. 2017. http://gsg.uottawa.ca/data/teaching/eco/gssc24gid-ver4.pdf.Accessed 26 Feb 2018.Statistics Canada. Guide to the survey of employment, payrolls and hours.2017. http://www.statcan.gc.ca/pub/72-203-g/72-203-g2017001-eng.htm.Accessed 26 Feb 2018.Statistics Canada. Canadian Community Health Survey. 2010. http://www23.statcan.gc.ca/imdb/p2SV.pl?Function=getSurvey&Id=81424. Accessed 26 Feb2018.
Mofidi et al. BMC Public Health (2020) 20:210 Page 10 of 12
Ethics approval and consent to participateAll input data in this study drawn from publicly available data sources. Afterdiscussion with University of Toronto Research Ethics Boards (REB), wedetermined that we don’t need ethics approval for this study, since it’s adata modeling exercise.
Consent for publicationNot applicable.
Competing interestsThe authors declare that they have no competing interests.
Author details1Institute for Work & Health, 481 University Ave Suite 800, Toronto, ON M5G2E9, Canada. 2School of Medical Science, Tarbiat Modares University, PO:14115-111, Tehran, Iran. 3Department of Economics, McMaster University,Hamilton, Ontario, Canada. 4Department of Industrial Engineering andManagement Systems, Amirkabir University of Technology, Tehran, Iran.5Occupational Cancer Research Centre, Toronto, Ontario, Canada.
Received: 22 August 2019 Accepted: 31 January 2020
References1. Verma DK, Kurtz LA, Sahai D, Finkelstein MM. Current chemical exposures
among Ontario construction workers. J Occup Environ Hyg. 2003;18:12.2. Lacourt A, Pintos J, Lavoué J, Richardson L, Siemiatycki J. Lung cancer risk
among workers in the construction industry: results from two case–controlstudies in Montreal. BMC Public Health. 2015;15:1.
3. US Department of Health and Human Services. Report on carcinogensbackground document for silica, Crystalline (Respirable Size).1998. https://ntp.niehs.nih.gov/ntp/newhomeroc/other_background/silica_no_app_508.pdf. Accessed 26 Feb 2018.
4. Demeter SJ, Jacobs P, Chmielowiec C, Logus W, Hailey D, Fassbender K,et al. The cost of lung cancer in Alberta. Can Respir J. 2007;14:2.
5. US Occupational Safety and Health Administration. Final economic analysisand final regulatory flexibility analysis. supporting document for the finalrule for occupational exposure to respirable crystalline silica. 2016. https://www.federalregister.gov/documents/2016/07/26/2016-17270/occupational-exposure-to-respirable-crystalline-silica-approval-of-collections-of-information. Accessed 26 Feb 2018.
6. Meeker JD, Cooper MR, Lefkowitz D, Susi P. Engineering controltechnologies to reduce occupational silica exposures in masonry cuttingand tuckpointing. Public Health Rep. 2009;124:4.
7. Lahiri S, Levenstein C, Nelson DI, Rosenberg B. The cost effectiveness ofoccupational health interventions: prevention of silicosis. Am J Ind Med.2005;48:6.
8. Flynn MR, Susi P. Engineering controls for selected silica and dust exposuresin the construction industry--a review. J Occup Environ Hyg. 2003;18:4.
9. Akbar-Khanzadeh F, Milz SA, Wagner CD, Bisesi MS, Ames AL, Khuder S,et al. Effectiveness of dust control methods for crystalline silica andrespirable suspended particulate matter exposure during manual concretesurface grinding. J Occup Environ Hyg. 2010;7:12.
10. Tjoe Nij E, Hilhorst S, Spee T, Spierings J, Steffens F, Lumens M, et al. Dustcontrol measures in the construction industry. Ann Work Expo Health. 2003;47:3.
11. Cagno E, Micheli GJ, Masi D, Jacinto C. Economic evaluation of OSH and itsway to SMEs: A constructive review. Saf Sci. 2013;53:134-152.
12. Hengel KM, Van Deurssen E, Meijster T, Tielemans E, Heederik D, Pronk A.Relieved Working’study: systematic development and design of anintervention to decrease occupational quartz exposure at constructionworksites. BMC Public Health. 2014;14:1.
13. Baio G. Bayesian methods in health economics. Boca Raton: FL. Chapmanand Hall/CRC Press; 2012. p. 41–48
14. Brown T, Darnton A, Fortunato L, Rushton L. Occupational cancer in Britain.Br J Cancer. 2012;107:S1.
15. McCormack V, Peto J, Byrnes G, Straif K, Boffetta P. Estimating the asbestos-related lung cancer burden from mesothelioma mortality. Br J Cancer. 2012;106:3.
16. Tompa E, Kalcevich C, McLeod C, Lebeau M, Song C, McLeod K. Theeconomic burden of lung cancer and mesothelioma due to occupationaland para-occupational asbestos exposure. J Occup Environ Med. 2017;74:11.
17. Lombardi DA, Verma SK, Brennan MJ, Perry MJ. Factors influencing workeruse of personal protective eyewear. Accid Anal Prev. 2009;41:4.
18. Edlin R, McCabe C, Hulme C, Hall P, Wright J. Cost effectiveness modellingfor health technology assessment: a practical course. Heidelberg: Springer;2015. p. 41–86.
19. Pourret O, Naïm P, Marcot B. Bayesian networks: a practical guide toapplications. New York: Wiley; 2008. p. 15–52
20. Khodakarami V, Abdi A. Project cost risk analysis: A Bayesian networksapproach for modeling dependencies between cost items. Int J Proj Manag.2014;32:7.
21. Yet B, Constantinou A, Fenton N, Neil M, Luedeling E, Shepherd K. ABayesian network framework for project cost, benefit and risk analysis withan agricultural development case study. Expert Syst Appl. 2016;60:141–155.
22. Montewka J, Weckström M, et al. A probabilistic model estimating oil spillclean-up costs–a case study for the Gulf of Finland. Mar Pollut Bull. 2013;76:2.
23. Helle I, Ahtiainen H, Luoma E, Hänninen M, Kuikka S. A probabilisticapproach for a cost-benefit analysis of oil spill management underuncertainty: A Bayesian network model for the gulf of Finland. J EnvironManag. 2015;158:122–32.
24. Lee EG, Kim SW, Feigley CE, Harper M. Exposure models for the priordistribution in bayesian decision analysis for occupational hygiene decisionmaking. J Occup Environ Hyg. 2013;10:2.
25. Cancer Care Ontario, Occupational Cancer Research Centre. Burden ofoccupational cancer in Ontario: Major workplace carcinogens andprevention of exposure. 2017. http://www.occupationalcancer.ca/wp-content/uploads/2017/09/Burden-of-Occupational-Cancer-in-Ontario.pdf.Accessed 26 Feb 2018.
26. CAREX Canada. Silica (crystalline) occupational exposures. 2017. https://www.carexcanada.ca/en/silica_(crystalline)/occupational_estimate/#data_sources_and_methods. Accessed: Accessed 26 Feb 2018.
27. Pittsburgh University decision system laboratory. GeNIe Modeler 2.2.4. 2018.https://dslpitt.org/ Accessed 26 Feb 2018.
28. Statistics Canada. Life Tables, Canada, provinces and territories 2010 to 2012.https://www150.statcan.gc.ca/n1/daily-quotidien/160519/dq160519c-eng.htm. Accessed 26 Feb 2018.
29. Statistics Canada. Labour force survey, employment and unemployment,levels and rates, by province. 2017. http://www.statcan.gc.ca/tables-tableaux/sum-som/l01/cst01/labor07b-eng.htm. Accessed 26 Feb 2018.
30. Statistics Canada: survey of labour and income dynamics. 2011. http://www.statcan.gc.ca/pub/75f0011x/75f0011x2013001-eng.htm. Accessed 26 Feb2018.
31. Statistics Canada. Sources of annual average growth in labour productivityin the total business sector. CANSIM table 383–0021. 2017. http://www.statcan.gc.ca/pub/15-206-x/2013030/t001-eng.htm. Accessed 26 Feb 2018.
32. Statistics Canada. General social survey cycle 24: time-stress and well-beingpublic. 2017. http://gsg.uottawa.ca/data/teaching/eco/gssc24gid-ver4.pdf.Accessed 26 Feb 2018.
33. Evans WK, Wolfson MC, Flanagan WM, Shin J, Goffin J, Miller AB, et al.Canadian cancer risk management model: evaluation of cancer control. Int JTechnol Assess Health Care. 2013;29:2.
34. Statistics Canada. Guide to the survey of employment, payrolls and hours.2017. http://www.statcan.gc.ca/pub/72-203-g/72-203-g2017001-eng.htm.Accessed 26 Feb 2018.
35. Statistics Canada. Canadian Community Health Survey. 2010. http://www23.statcan.gc.ca/imdb/p2SV.pl?Function=getSurvey&Id=81424. Accessed 26 Feb2018.
36. Earle CC, Chretien Y, Morris C, Ayanian JZ, Keating NL, et al. Employmentamong survivors of lung cancer and colorectal cancer. J Clin Oncol. 2010;28:10.
37. Hirth RA, Chernew ME, Miller E, Fendrick AM, Weissert WG. Willingness topay for a quality-adjusted life year: in search of a standard. Med Decis Mak.2000;20:3.
38. Neumann PJ, Cohen JT, Weinstein MC. Updating cost-effectiveness—thecurious resilience of the $50,000-per-QALY threshold. N Engl J MedOverseas Ed. 2014;371:9.
39. Longo CJ, Fitch M, Deber RB, Williams AP. Financial and family burdenassociated with cancer treatment in Ontario. Canada Support Care Cancer.2006;14:11.
Mofidi et al. BMC Public Health (2020) 20:210 Page 11 of 12

40. Van Houtven CH, Ramsey SD, Hornbrook MC, Atienza AA, van Ryn M.Economic burden for informal caregivers of lung and colorectal cancerpatients. Oncologist. 2010;15:8.
41. Briggs A, Sculpher M, Claxton K. Decision modelling for health economicevaluation. New York: Oxford University Press; 2006. p. 77–120.
Publisher’s NoteSpringer Nature remains neutral with regard to jurisdictional claims inpublished maps and institutional affiliations.
Mofidi et al. BMC Public Health (2020) 20:210 Page 12 of 12