Embed Size (px)
Citation preview

+Address for correspondence: Paul Green, Ph.D., 201 17107 107 Ave., Edmonton, Alberta, Canada, T5S 1G3; Email: [email protected]; Website: www.wordmemorytest.com
International Journal of Forensic Psychology Copyright 2006
Volume 1, No. 3 SEPTEMBER 2006 pp. 1-21
The Pervasive Influence of Effort on Neuropsychological Tests
Paul Green+
Neurobehavioural Associates, Edmonton, Canada
Abstract
Although it is intuitively obvious that people exerting a full effort on a test will score higher than people making less effort, it is not obvious to what degree poor effort will affect neuropsychological test scores. Nor is it self-evident how well scores on an effort test based on memory will predict scores on non-memory tests. In this study, effort was measured in 1,307 consecutive outpatients using the Word Memory Test (WMT, Green & Astner, 1995, Green, Allen & Astner, 1996, Green, 2003). The mean WMT effort scores were divided into six ranges, from satisfactory (91% to 100% correct) to very low (50% correct or less). The tables show the mean scores on many commonly used neuropsychological tests for each range of effort on the WMT. As effort decreases, scores on most neuropsychological tests decrease significantly and systematically. In this sample, the variable of effort has more impact on test scores than severe traumatic brain injury.
Keywords: Brain injury; effort; symptom validity; symptom exaggeration; neuropsychological
INTRODUCTION Reitan (1974) has described a neuropsychological test as one whose scores are differentially affected by brain disease, rather than environmental factors. In a study of people with brain injuries, it was found that the greater the severity of traumatic brain injury, based on time to follow commands, the lower were the Halstead-Reitan battery test scores (Dikmen, Machamer, Winn & Temkin, 1995). These findings were replicated by Rohling, Meyers & Millis (2003), using a different test battery, confirming the differential sensitivity of neuropsychological tests to various levels of brain injury severity. However, neuropsychological test scores are also affected by environmental variables, one of which is the presence of incentives to
perform well or poorly on testing. A person capable of recalling ten words from a list could, in principle, decide to recall only four words, thereby introducing major error into test results. It is an empirical question whether brain injuries influence neuropsychological test scores more than motivational factors or vice versa. Another question is whether only some neuropsychological tests are affected by effort, as suggested by Nies and Sweet (1994) or whether varying effort is a general phenomenon affecting most or all such tests. To answer these questions, the effects of effort and brain injury on neuropsychological test scores must be quantified and compared with each other, using data from actual patients.

Green, P.
International Journal of Forensic Psychology © 2006 ijfp.uow.edu.au 2
It has been reported that the suppression of test scores by poor effort can be greater than the effects of a severe traumatic brain injury in people claiming compensation. Green, Rohling, Lees-Haley & Allen (2001) converted 43 neuropsychological test scores to Z-scores relative to external norms in 904 outpatients. It was found that effort explained approximately 50% of the variance in the neuropsychological test scores, which was far more than that explained by brain injury severity, education or age. The mean composite neuropsychological test score was 0.5 standard deviations below the normal mean in patients with the most severe brain injuries, who passed the WMT effort subtests. Yet, in the patients with the most minor head injuries, who failed the WMT, the mean composite neuropsychological test score was 1.5 standard deviations below the normal mean. The same degree of suppression of test scores was observed in patients of all diagnostic groups, who failed the WMT effort measures. Thus, the effects of effort on neuropsychological tests can overshadow the effects of severe traumatic brain injury, producing the misleading appearance of cognitive deficits in cases with poor effort and potentially obscuring real group differences.
The acceptance of spurious deficits in neuropsychological test results as representing valid impairment can have serious implications. Theories of brain disease may be altered, depending on whether or not effort is measured. For many years, for example, it was thought that neuropsychological deficits were greater in some cases of psychogenic-nonepileptic-seizures (PNES) than in actual epileptic patients. The deficits in PNES were thought to be indicative of presumed but undemonstrated brain disease. However, Williamson, Drane, Stroup, Miller, & Holmes (2004) recently discovered that more than half of PNES patients failed effort testing with the WMT. In comparison, the WMT failure rate was very low in the patients with intractable seizures, who were due for brain surgery. 50% of the variance in neuropsychological test scores was explainable by fluctuating effort. The results suggested that, as a group, the PNES patients’ neuropsychological test data were invalid due to inadequate effort, such that they could not be used to infer the presence or severity of underlying brain disease. These results throw doubt upon the validity of test data from past studies of PNES patients, which did not measure effort.
In a recent study of cases of mild head injury with compensation claims, it was found that 47% of the variance in a summary score for the Halstead-Reitan battery (the GNDS) was explained by effort
measured by the Test of Memory Malingering (Constantinou, Bauer, Ashendorf, Fisher & McCaffrey, 2005). Thus, three separate studies have shown that effort explains approximately 50% of the variance in neuropsychological test batteries. In two of these samples, there were financial incentives for symptom exaggeration because they were involved in making compensation claims. In the PNES study, however, the assessments were conducted to determine if brain surgery was needed for epilepsy, although external incentives to appear impaired could not be ruled out.
Important decisions rest on neuropsychological test data and, therefore, it is of fundamental importance to understand further the extent to which test scores are affected by diminishing effort. The tables in this paper provide information on neuropsychological test results from 1,307 outpatients, who were clinically assessed in the private practice of the writer. In most cases, there were financial incentives for disability, whether from medical disability insurance, Workers’ Compensation or personal injury litigation. Scores from twenty-three neuropsychological tests are tabulated according to ranges of effort measured by the computerized WMT. The tables show how scores on tests of memory, problem solving, fluency, manual skills, attention, and many other abilities decrease systematically as effort declines, and to what degree. METHOD Participants
The sample of 1,307 cases, all of whom were tested by the current author, included the 904 patients from the previous study of Green et al (2001), as well as 403 additional consecutive cases. There were 668 patients with head injuries, some with less than one day of post-traumatic amnesia (n=520) and others with one day or more of post-traumatic amnesia (n=148). All were tested at least one month after the injury. 86% of cases were tested at least four months post injury, the median being 15 months. There were 130 neurological patients, suffering from a variety of brain disorders, including strokes, aneurysms, multiple sclerosis, tumor, epilepsy, herpes simplex encephalitis, Von Hippel-Lindau disease, hypoxic event, abscess, venous thrombosis and dorsal midbrain hemorrhage. There were 126 patients with major depression, 23 with anxiety-based disorders, 13 with bipolar disorder and 10 with other psychotic illnesses. Finally, testing included 86 patients with

Effort Effects
International Journal of Forensic Psychology © 2006
ijfp.uow.edu.au 3
orthopedic injuries, 34 with chronic fatigue syndrome, 78 with pain disorder or fibromyalgia and 139 with various other conditions, such as alcoholism or dementia. Excluded from the study were an additional 50 cases, given only the oral Word Memory Test (WMT, Green & Astner, 1995) for various reasons, such as blindness.
Referrals for assessment were made by the Workers’ Compensation Board in 41% of cases, by insurance companies handling medical disability claims in 33% of cases and by lawyers representing the plaintiff or the defense in personal injury claims in 18% of cases. In a further 8% of cases, there was no direct involvement with a financial claim, although, in principle, some might later be able to make claims. For example, a large employer referred 40 people (3% of all cases) with questions about cognitive impairment and emotional status impacting work performance. In the latter group, the very few classified as disabled would go on to receive a medical disability pension but most were highly motivated to carry on working. Some cases were privately referred for various reasons, such as evaluation of suspected dementia. Neuropsychological Tests 1,307 consecutive cases were given tests of a comprehensive range of abilities and the numbers of cases taking each test are noted in the tables. Most of the tests used will be very familiar to neuropsychologists, such as the California Verbal Learning Test (Delis, Kramer, Kaplan, & Ober, 1987) and tests referenced in the norms manual of Heaton, Grant, & Matthews (1991), including the Wisconsin Card Sorting Test, Category Test, Trail Making Test A & B, Thurstone Word Fluency Test, Grooved Pegboard, Hand Dynamometer, Finger Tapping Test and Finger Tip Number Writing test (Reitan, 1969). Other tests included Warrington’s Recognition Memory Tests for Words and Faces (Warrington, 1984), the Ruff Figural Fluency Test (Ruff, 1988), Gorham’s Proverbs Test (Gorham, 1956), Digit Span & Visual Memory Span subtests of the Wechsler Memory Scale-Revised (1987), the Continuous Visual Memory Test (Trahan & Larrabee, 1988), Rey Complex Figure Test (Meyers & Meyers, 1995), Benton’s Judgment of Line Orientation Test and Benton’s Visual Form Discrimination Test (Benton, Hamsher, Varney & Spreen, 1983). Intelligence was measured with the Wechsler Adult Intelligence Scale-Revised (Wechsler, 1981) or its close equivalent, the computerized Multidimensional Aptitude Battery (Jackson, 1998). Some tests will be less familiar, such as the Story Recall Test (Green & Kramar,
1983), the Emotional Perception Test (EPT; Green & Seversen, 1986) and the Alberta Smell Test (AST; Green & Iverson, 2001; Green, Iverson, Rohling & Gervais, 2003). The Story Recall Test involves immediate recall of five short stories ranging from 10 to 25 items in length and recall of the stories after a half hour delay. The Emotional Perception Test requires the person to judge the emotions in the tone of voice of 45 sentences, each said in one of 5 emotions. The Alberta Smell Test involves sniffing a scented felt marker while one nostril is closed and then selecting the name of the odor from one of eight written on a sheet (e.g. orange, lemon, mint). The score is the number correct out of ten and each nostril is tested separately. The latter test was found to be more sensitive to the effects of a severe traumatic brain injury than any of the conventional neuropsychological tests studied (Green, Rohling, Iverson & Gervais, 2003). Effort Testing To measure both effort and verbal memory, all cases were given the computerized Word Memory Test (WMT) as part of 1.5 days of clinical neuropsychological testing, conducted between 1996 and 2004. Cooperative clients often completed testing in only one day but many were slow to perform. The first two out of six subtests of the WMT are the immediate recognition (IR) and delayed recognition (DR) subtests, in which words from a previously presented list must be identified, when presented individually with a non-list foil word. They are the primary effort subtests. A third measure is derived from the consistency of performance from the first to the second subtest.
The mean of the three WMT effort measures (IR, DR and Consistency) was calculated for each person. The scores were broken down into six ranges, where 91% to 100% defines the top range. It may be noted that the mean score from healthy adults tested with the WMT in a study by Suhr & Gunstadt (2005) was 99.5% correct (SD=1.6). In the study by Gorissen, Sanz and Schmand (2005), the healthy adult mean was 96% (SD=3), which similar to the healthy adult mean of 97.8% (SD=3) listed in the WMT Windows program (Green, 2003). Hence, nearly all healthy adults would be expected to score in the range 91% to 100% correct on the WMT effort subtests. The mean for neurological patients in the Gorissen et al (2005) study was 93% (SD=10). Scores of 81% to 90% make up the second range, scores in which may be described as “marginal or failing”, although 42% of these scores were above the conservative cut-offs

Green, P.
International Journal of Forensic Psychology © 2006 ijfp.uow.edu.au 4
recommended in the WMT test manual (Green, 2003). Successively lower ranges of WMT effort scores were 71% to 80%, 61% to 70%, 51% to 60% and 50% or below.
In the tables, scores on other tests are presented for people scoring in each of six ranges on their mean WMT effort scores. Other effort tests employed included the Amsterdam Short Term Memory Test (Schmand, Lindeboom, Schagen, Heijt, Koene,& Hamburger, 1998) and Computerized Assessment of Response Bias (CARB, Conder, Allen & Cox, 1992). RESULTS Every attempt was made to obtain optimal performance from patients and they were all warned in advance that full effort was necessary to produce valid results. Nevertheless, in this sample of 1,307 outpatients, 403 cases (31%) failed the WMT using the clinically recommended cut-offs (82.5% or lower on IR, DR or consistency). In those who failed the WMT, the mean WMT effort scores ranged from 88.3% to 36.6%, with a mean WMT effort score of 71% (SD 13). In the 904 patients who passed the WMT, the mean effort score was 96.2% (SD=3.5), which is almost identical to the value of 96% (SD=3) found in healthy adults in the study of Gorissen, Sanz and Schmand (2005), using the Spanish and French translations of the WMT. Simulator Profile found in those Failing the WMT
It is not plausible that the profiles produced by the WMT failures were valid (i.e. that they were reliable test scores, reflecting good effort) because there were important internal inconsistencies between scores on the WMT subtests, similar to those found in known simulators. The mean WMT scores of 25 patients with early dementia tested by Brockhaus and Merten (2004) are contained within the WMT Windows program and are shown in Figure 1. On the very easy WMT subtests (IR and DR), the 403 WMT failures in the current study scored 74% (SD=16) and 71% (SD=16), whereas the latter dementia patients scored higher than that (respectively, 85%, SD=11, and 82%, SD=15, see Figure 1). If valid, this would mean that those who failed the WMT in the current study were more impaired than the dementia patients, which is not plausible, considering the diagnoses and ages of these patients. For example, 176 of the WMT failures were cases of mild head injury, with a mean GCS of 14.7 and a mean age of only 41 years.
Also, if they were making a valid effort but scoring lower than people with dementia on the easy subtests, we would expect the WMT failures to show more impairment than the dementia patients on the more difficult WMT subtests but just the opposite was found. Whereas they scored lower than dementia patients on the very easy WMT subtests, the WMT failures systematically scored higher than dementia patients on the most difficult WMT subtests (Figure 1). On the MC subtest (Multiple Choice), the WMT failures scored a mean of 51% (SD=18), compared with 43% (SD=20) in the dementia patients. On PA (Paired Associate recall) the failures scored a mean of 47% (SD=17), compared with 34% (SD=15) in the dementia patients. On FR (Free Recall of the word list), the failures scored a mean of 29% (SD=13), compared with 21% (SD=16) in the dementia patients.
Such a pattern of (a) lower scores than dementia patients on easy WMT subtests but (b) higher scores than dementia patients on harder WMT subtests is precisely the pattern observed in studies of simulators (i.e. volunteers who were asked to fake memory impairment). For example, highly educated volunteers who were asked to simulate memory impairment scored means of only 71% and 67% correct on the WMT IR and DR subtests and, therefore, lower than dementia patients on the easy subtests (Green, Lees-Haley & Allen, 2002). Yet their mean scores on the harder subtests (MC=47%, PA=48% & FR=35%) were all higher than those of the dementia patients discussed above (Figure 1). The marked similarity between the WMT profiles in those failing WMT effort tests clinically and those of known simulators suggests that those failing the WMT clinically were making a poor effort, if not actually trying to simulate memory impairment. Neuropsychological Test Scores in WMT Failures Cases passing the WMT effort subtests were compared with cases failing the WMT in terms of their mean scores on each of the neuropsychological tests shown in tables 1 to 21. The differences were all strongly in the direction of poorer performances in those failing WMT. The differences were significant at .0001 in all comparisons using one-way ANOVA, with the exception of Grooved Pegboard left hand (p<.014), Finger Tip Number Writing left hand (p<.006) and right hand (p<.001) and one non-significant result on Ruff Figural Fluency perseverative responses (p<.4). The pervasive influence of effort on almost all neuropsychological tests may be readily seen in

Effort Effects
International Journal of Forensic Psychology © 2006
ijfp.uow.edu.au 5
the tables. The CVLT will be used below to illustrate how effort affects test scores.
Figure 1. Scores from 403 cases failing WMT when tested clinically resemble those from a group of volunteer simulators: They score lower than dementia patients on easy subtests and higher on harder subtests. Table 1 Mean California Verbal Learning Test Recall Scores at Each Level of Effort
Mean WMT effort
N
CVLT Short Delay Free Recall Mean
CVLT SD Free SD
CVLT Long Delay Free
Recall Mean
CVLT LD Free
SD 91-100% 745 10.7 3.2 11.2 3.2 81-90% 206 8.3 3.2 8.9 3.2 71-80% 105 7.8 3.5 8.2 3.4 61-70% 61 7.4 3.0 7.3 3.3 51-60% 50 5.8 2.9 5.5 3.1 <=50% 34 4.4 2.5 3.3 3.0
The effects of effort on CVLT memory test scores
The data in table 1 show a very strong correlation between scores on the effort subtests of the WMT and CVLT recall scores. This relationship was duplicated in a very large sample studied independently by Dr. Roger Gervais (table 5). The data suggest that effort measured by the WMT
recognition memory subtests (IR and DR) is an underlying variable which strongly influences CVLT recall scores. The alternative explanation, which is that the WMT effort scores correlate so strongly with CVLT scores in such large samples because they tap memory ability, can be dismissed as implausible and contrary to large amounts of data. Firstly, a strong relationship between WMT

Green, P.
International Journal of Forensic Psychology © 2006 ijfp.uow.edu.au 6
effort subtests and other test scores may be seen in all of the tables in this paper but most of the tests are not memory tests. Secondly, the quintessential measure of ability is intelligence but children of higher intelligence scored no higher on WMT recognition subtests than children of lower intelligence (Green & Flaro, 2003). Age invariably has an effect on ability tests in children. However, in the latter study, children tested clinically and aged between 7 and 10 years did not score significantly lower on the WMT effort subtests than children aged 11 to 18 years. The children scored the same as adults seeking custody of their children, consistent with the likelihood that WMT recognition subtests (IR & DR) primarily measure effort, rather than ability.
The latter argument is further supported by greater scores on WMT effort subtests in a group of people with severe brain injuries than in a group with very mild head injuries, an effect which is best explained by poor effort in the mild group (Green, Iverson & Allen, 1999). Similar effects were found in compensation seeking cases using another very easy effort test, called the Computerized Assessment of Response Bias (CARB). Those with the most severe brain injuries scored higher on the CARB than those with the most minor head injuries (Green & Iverson, 2001).
The WMT recognition memory subtests are extremely easy. In the original group of 40 normal adult controls (Iverson, Green & Gervais, 1999), the median score was 100% on both IR and DR. Healthy adult volunteers in the study of Tan, Slick, Strauss and Hultsch (2004) scored a mean of 99.5% correct on WMT IR (SD=2.3) and 99.5% correct on WMT DR (SD=0.7). Mentally retarded adults in an institution in Germany scored a mean of 96% (SD=5) on WMT DR (Brockhaus & Merten, 2004). Hence, someone who fails WMT by scoring 82.5% or lower is scoring considerably lower than mentally retarded adults. Similarly, almost perfect scores on WMT effort subtests are obtained from adults or children with neurological diseases or severe traumatic brain injury, if they make an effort (Green, Lees-Haley & Allen, 2002, Green, 2003). Neurological patients with impaired verbal memory on the CVLT scored approximately 96% correct on WMT recognition subtests, which was no lower than those with normal verbal memory (Green, Lees-Haley & Allen, 2002). A group of neurological patients tested by Gorissen et al (2005) scored a mean of 95% correct (SD 9.4) on the WMT Delayed Recognition subtest. Children with various clinical conditions, such as fetal alcohol syndrome, obtained mean scores well above 90% correct on WMT recognition subtests and the
children tested clinically performed just as well as adults seeking custody of their children (Green & Flaro, 2003). These studies show that the WMT recognition subtests are very insensitive to differences in levels of ability.
On the other hand, the WMT effort subtests are very sensitive to poor effort. Highly educated volunteer simulators, mainly psychologists and physicians, were asked to fake memory impairment but to avoid being detected. They scored only 71% on WMT IR and 67% correct on the WMT DR subtest (Green, Lees-Haley & Allen, 2002). In an independent study by Tan, Slick, Strauss & Hultsch (2004), volunteers who were asked to simulate brain injury obtained mean scores of 65% correct on WMT IR (SD=18) and 64% correct (SD=18) on WMT DR. Using a score of 82.5% or lower on WMT IR, DR or consistency to define poor effort, the WMT was found to be 100% accurate in classifying good versus poor effort in the latter study. Similar reports of 99% to 100% accuracy in classification of simulators versus good effort cases come from three other studies using the WMT in German (Brockhaus & Merten, 2004), Turkish (Brockhaus, Peker, & Fritze, 2004) and Russian (Tydecks & Merten, personal communication).
The results of the latter studies support the notion that WMT recognition subtests are very sensitive to poor effort but virtually insensitive to differences in ability. WMT recognition scores are usually suggestive of poor effort if they are substantially lower than those obtained by mentally retarded adults (96%, SD 5), by neurologically impaired patients, who are known to have impaired verbal memory (95%, SD 5) or by children with fetal alcohol syndrome (96%, SD 6). Scores on WMT effort subtests, which are substantially lower than the mean scores from the latter groups suggest low effort, especially where the clinical history would not suggest impairment as great as that of the latter groups (e.g. cases of mild head injury in otherwise healthy adults). Exceptions would include some people with dementia and children with less than a grade three reading level. In the current study, 6 cases of dementia, all in need of full time supervision and guardianship, were given the computerized WMT and their mean scores on WMT were IR, 85.4% (SD 14), DR 82% (SD 21) and consistency 82% (SD 17). While this is a very small sample of dementia patients, the latter scores are similar to the WMT data from adults with early dementia tested by Brockhaus & Merten (2004) using the German WMT (Green, 2003). It is clear that some patients with dementia are unable to pass the WMT IR and DR subtests even if they try their best to do so. To assist in the

Effort Effects
International Journal of Forensic Psychology © 2006
ijfp.uow.edu.au 7
interpretation of WMT scores in people who might genuinely be unable to pass the WMT recognition subtests, the WMT Windows program contains mean scores and standard deviations from all WMT
subtests in groups of early and late dementia, as well as data from 59 other comparison groups, with a total of more than 3,000 cases.
Table 2 CVLT Cued Recall Scores by Level of WMT Effort
Mean WMT effort
N
CVLT SD Cued Recall Mean
CVLT SD Cued Recall
SD
CVLT LD Cued Recall Mean
CVLT LD Cued Recall
SD 91-100% 745 11.8 2.8 11.9 2.9 81-90% 206 9.7 3.0 9.8 3.0 71-80% 105 9.5 3.4 9.2 3.2 61-70% 61 8.9 3.0 8.5 3.2 51-60% 50 7.0 3.0 6.5 3.2 <=50% 34 5.4 3.1 4.5 3.1
SD=short delay, LD=long delay Table 3 CVLT Learning Trial Scores and Recognition Hits by Level of WMT Effort
Mean WMT effort
N
CVLT Trial 1 Mean
CVLT Trial 1
SD
CVLT Trial 5 Mean
CVLT Trial 5
SD
CVLT Rec.Hits
Mean
CVLT Rec.Hits
SD 91-100% 745 7.4 2.3 12.4 2.5 14.6 1.6 81-90% 206 6.4 2.1 10.6 2.7 13.5 2.2 71-80% 105 6.0 2.2 10.2 3.1 12.8 2.9 61-70% 61 6.0 2.3 9.7 2.6 11.9 2.8 51-60% 50 4.9 1.6 8.7 2.8 10.7 3.2 <=50% 34 4.5 2.1 7.0 2.9 7.6 3.7
CVLT = California Verbal Learning Test, version 1; Rec.Hits = Recognition Hits score Effort Explains More Test Variance than Brain Injury Severity
In 421 cases of traumatic brain injury, for whom Glasgow Coma Scale (GCS) scores were available, the correlation was only 0.17 between GCS and the mean of 7 CVLT scores (trials 1 & 5, short and long delayed free and cued recall and recognition hits). Yet, in the same cases, the mean WMT effort scores correlated with mean CVLT scores at 0.58. Hence, GCS explained 3% of the variance in CVLT scores, whereas effort explained more than ten times the variance (34%). In non-brain injured cases, the correlation between WMT effort and CVLT scores was 0.65.
Members of the head injury sample in table 4 all passed the WMT effort subtests. Please note that the mean CVLT SD Free Recall score in the group with a GCS of 3 was 9.1, compared with a mean of 10.2 in the group with a GCS of 15. In contrast, the 745 cases scoring in the top range of WMT effort in table 1 obtained mean scores of 10.7 on CVLT short delayed free recall, while those in the lowest effort range scored 4.4. Based on these data, although brain injury has some impact, CVLT scores are influenced far more by the effort being made by the person taking the test than they are by severity of brain injury.

Green, P.
International Journal of Forensic Psychology © 2006 ijfp.uow.edu.au 8
Table 4 CVLT by Glasgow Coma Scale scores in 258 Cases of Head Injury, who Passed WMT Effort Subtests (i.e. data presumed valid)
GCS
N CVLT SD Free Recall
Mean
CVLT SD Free Recall
SD
CVLT LD Free Recall
Mean
CVLT LD Free Recall
SD 3 11 9.1 3.1 10.3 3.2 5 7 8.0 2.4 7.6 3.1 6 8 7.9 3.3 8.3 2.1 7 9 8.5 4.1 9.6 5.5 8 6 8.5 3.1 9.3 2.8 9 5 10.7 3.9 11.0 2.9 10 6 11.4 3.1 11.6 3.2 11 8 10.6 3.5 11.6 3.4 12 7 10.1 2.7 10.7 2.2 13 9 11.2 3.2 11.6 3.4 14 39 10.6 3.2 11.3 2.9 15 152 10.2 3.2 10.7 3.2
SD=short delay, LD=long delay
Abnormal Brain Scan versus Effort
The correlation between CVLT mean scores and the presence or absence of abnormal CT or MRI brain scans in 456 cases of head injury was effectively zero (r=.01). In 321 traumatically brain injured or neurological patients with normal CT or MRI brain scan results, the mean of the CVLT short and long delayed free recall scores was 9.3 (SD 3.7). This was not significantly different from the mean score of 8.9 (SD 3.7) in 314 cases with abnormal brain scans. However, poor effort obscured a true group difference. After removing cases who failed the WMT, the mean CVLT free recall score in those with a normal brain scan was 11.1 (SD 3.1, n=174) compared with 9.9 (SD 3.2, n=220) in those with an abnormal scan (F 12.9, 1,392, p<.001). The mean difference of 1.2 points is significant but it is minor in comparison with the effects of effort. In the whole sample, the mean CVLT free recall score for those who passed the WMT (n=831) was 10.8 (SD 3.1), compared with 7.3 (SD 3.4) in those who failed the WMT effort subtests (n=370; F 303.5, 1,1199, p<.0001). The mean relative decrement of 3.5 CVLT free recall points associated with failing the WMT is almost three times larger than the effect of a CT or MRI brain abnormality. Mild versus Severe Brain Injury
Paradoxically, the mean WMT effort score of 87% (SD=14) in the mild head injury cases (median GCS=15, median PTA=0, n=469) was significantly lower than the mean score of 92% (SD=9.6) from cases with the most severe brain injuries (median GCS=7, median PTA=336 hours, n=148; F=15, 1, 615, p<.0001). Using the usual cut-offs, 37.5% of the mild group failed the WMT but the failure rate in the cases with more severe brain injuries was only 21.6%. In fact, the highest failure rate of 47% was in 223 people with mild head injuries, who were given a CT scan, which showed no brain abnormality. These results are understandable in terms of poorer effort in the mild group. They would not be explainable as an effect of actual impairment due to brain tissue injury because those with the most severe head injuries had the highest scores on the WMT effort subtests.
Given that effort is lower in mild versus severe brain injury groups, on average, it is necessary to control for effort when comparing these groups on other tests. In order to study group differences due to brain injury severity, we need to select groups of people who are all making a full effort on tests. In fact, there was no significant difference between mild and severe brain injury patients in their mean CVLT scores before WMT failures were dropped. Including only those with presumed valid test results (i.e. passing the WMT), there were 293

Effort Effects
International Journal of Forensic Psychology © 2006
ijfp.uow.edu.au 9
cases of mild head injury, compared with 103 cases of moderate to severe brain injury. The mild group had a median GCS of 15 and a median PTA of zero, whereas the more severe brain injury group had a median GCS of 9 and a median PTA of 204 hours.
The mean CVLT free recall score was 10.8 (sd 3.0) in the mild group compared with 9.9 (sd 3.1) in the more severe injury group, a mean difference of 0.9 points, which is statistically significant (p<.02). On the other hand, it is quite small in comparison with the difference of 6.3 points in short-delayed free recall scores between those in the top range of effort on WMT in table 1 (mean 10.7, SD 3.2) and those in the lowest range (mean 4.4, SD 2.6). It is important to note that, in the mild head injury group who failed the WMT effort subtests, the mean CVLT short delay free recall score was 7.4 (SD=3). Therefore, the lowest CVLT recall scores were found not in the most severe brain injury group but, on the contrary, in the group with the least severe brain injuries, who showed poor effort.
Trail Making Test and Category Test in Cases of Mild versus Severe Brain Injury
Similar findings were obtained when comparing the above mild and severe brain injury groups on other tests, such as the Trail Making Test and the Category Test. There was only a 20-second difference on Trail Making B between the groups with mild versus severe brain injuries noted above, who passed WMT. Their mean scores were 69 and 89 seconds, respectively (SD=28 & 61). Yet, 314 cases who failed the WMT took 132 seconds (SD 106) on Trail Making B, which was 43 seconds longer than the severe brain injuries and 54 seconds longer than the mean for all 733 patients who
passed the WMT (77.7 seconds, SD=48). Those in the top effort range in table 9 took 76 seconds on Trail Making B, whereas those in the bottom effort range took 160 seconds (i.e. 84 seconds longer). The mild head injury patients who failed the WMT took a mean of 128 seconds to complete Trail Making B, which is considerably worse than the severe brain injury patients passing WMT.
On the Category Test, the mild head injury group passing WMT made 51 errors (SD 27), compared with the more severe brain injuries, with 59 errors (SD 31). This is a significant difference in the expected direction but 8 points is a small difference compared with the 33 point spread of Category Test errors as a function of effort shown in table 16 (55 to 88). Also, it is small compared with the average effect of failing the WMT. In 743 cases, who passed the WMT, the mean Category Test error score was 56 (SD 29) but in the 264 cases who failed the WMT, the mean error score was 74 (SD 30). The latter mean difference due to effort (18 errors) is more than twice as large as the difference between mild and severe brain injuries (8 errors). The mean Category Test error score in mild head injuries who failed the WMT was 72 errors (SD=28), which is greater than that of the above severe brain injury patients who passed the WMT (59 errors, SD=31).
The degree to which effort affected neuropsychological test scores in the current study was so much greater than the degree to which brain injury affected these scores that it would be prudent to measure effort in anyone given the CVLT, the Category Test, the Trail Making Test or other neuropsychological tests. If we observe an impaired score on any of these tests, one hypothesis to rule out is that poor effort explains the low score.
Table 5
Independent Replication of the Effect of Effort on CVLT Scores in 678 Cases Tested by Dr. Roger Gervais: Scores on CVLT Short and Long Delayed Free Recall and Recognition Hits and on TOMM trial two.
Mean WMT Effort
N of cases
CVLT SD
FREE Mean
CVLT SD
FREE SD
CVLT LD
FREE Mean
CVLT LD
FREE SD
CVLT Rec. Hits
Mean
CVLT Rec. Hits SD
TOMM Trial
2 Mean
TOMM Trial
2 SD
91-100% 365 11.0 3.0 11.4 3.1 14.8 1.6 49.8 .9 81-90% 128 8.8 3.4 9.2 3.2 14.0 2.0 49.0 2.5 71-80% 58 8.9 3.4 8.7 3.7 13.5 2.3 46.5 4.9 61-70% 46 6.6 2.8 6.6 2.8 11.5 3.7 43.7 8.0 51-60% 23 6.6 2.4 6.3 2.9 11.6 3.0 38.8 9.4 <=50% 13 3.8 2.5 3.5 2.7 9.2 4.4 28.9 10.9 SD=short delay, LD=long delay; Rec.Hits = Recognition Hits score

Green, P.
International Journal of Forensic Psychology © 2006 ijfp.uow.edu.au 10
Independent Replication In table 5, the results are shown from an independent sample of 678 outpatients, who were given the CVLT as part of psychological assessments by Dr. Roger Gervais in Edmonton, Canada. They were predominantly sent for vocational assessment or general psychological assessment after a work-related injury, with
diagnoses including major depression, orthopedic injury, PTSD, and various other conditions. The Gervais sample contained very few cases with a primary diagnosis of head injury or neurological disease. It may be seen that the Gervais sample also shows steady decreases in CVLT recall scores as effort on the WMT decreases, strongly replicating the findings with the current independent sample of 1,307 cases.
Table 6 Warrington’s Recognition Memory Test (RMT) for Words and Faces by Level of WMT Effort
Mean WMT effort
N
WRMT Faces Mean
WRMT Faces SD
N
WRMT Words Mean
WRMT Words
SD 91-100% 645 41.8 5.1 301 46.0 4.3 81-90% 176 39.8 5.8 76 41.7 5.7 71-80% 85 37.1 6.6 35 39.8 6.7 61-70% 51 36.2 6.5 25 36.1 7.3 51-60% 37 32.3 8.1 13 29.1 6.9 <=50% 31 26.1 8.8 15 23.0 5.4
The Effects of Effort on other Neuropsychological Test Scores
In table 6, scores on Warrington’s Recognition Memory Tests for words and faces are strongly related to WMT measured effort [(IR+DR+Consistency)/3]. The mean WMT effort
score correlated at r=0.73 with Warrington’s RMT for Words (n=465) and at r=0.52 with Warrington’s RMT for Faces (n=1,025). Also affected by effort are immediate and delayed story recall scores (table 7), memory on Rey’s Complex Figure Test (table 8) and memory on the Continuous Visual Memory Test (table 21).
Table 7 Immediate and 30-minute Delayed Story Recall by Level of WMT Effort
Mean WMT effort
N
Immediate Story Recall
Mean
Immediate Story Recall
SD
N
Delayed Recall Mean
Delayed Recall
SD 91-100% 773 47.1 9.5 766 36.3 12.2 81-90% 207 42.3 9.4 203 27.0 11.7 71-80% 105 40.9 10.3 104 26.9 12.3 61-70% 58 38.6 8.9 57 23.5 9.9 51-60% 45 34.8 11.6 45 17.8 10.7 <=50% 31 28.5 10.6 31 13.8 8.8
Note. Scores are out of a maximum of 80 for the five-story set on immediate and delayed recall, where 50 (SD 7) is the normal mean for immediate recall in adults of average IQ.
Effort Effects
International Journal of Forensic Psychology © 2006
ijfp.uow.edu.au 11
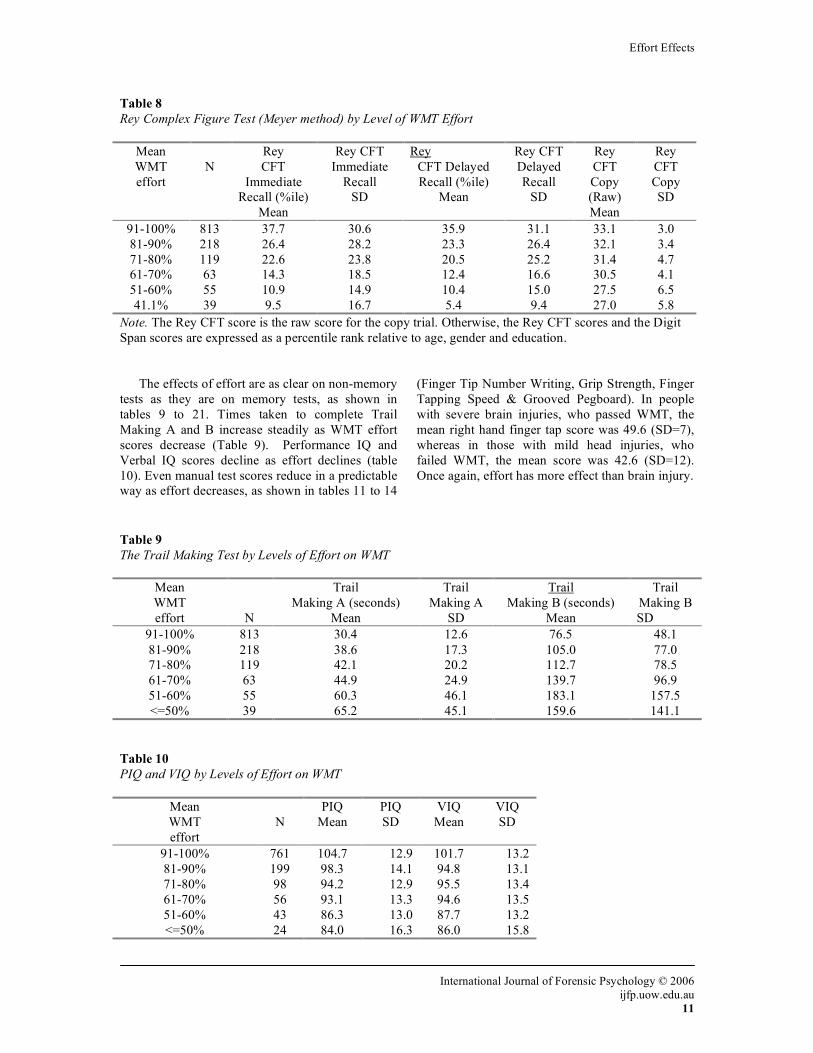
Table 8 Rey Complex Figure Test (Meyer method) by Level of WMT Effort
Mean WMT effort
N
Rey CFT
Immediate Recall (%ile)
Mean
Rey CFT Immediate
Recall SD
Rey CFT Delayed Recall (%ile)
Mean
Rey CFT Delayed Recall
SD
Rey CFT Copy (Raw) Mean
Rey CFT Copy SD
91-100% 813 37.7 30.6 35.9 31.1 33.1 3.0 81-90% 218 26.4 28.2 23.3 26.4 32.1 3.4 71-80% 119 22.6 23.8 20.5 25.2 31.4 4.7 61-70% 63 14.3 18.5 12.4 16.6 30.5 4.1 51-60% 55 10.9 14.9 10.4 15.0 27.5 6.5 41.1% 39 9.5 16.7 5.4 9.4 27.0 5.8
Note. The Rey CFT score is the raw score for the copy trial. Otherwise, the Rey CFT scores and the Digit Span scores are expressed as a percentile rank relative to age, gender and education.
The effects of effort are as clear on non-memory tests as they are on memory tests, as shown in tables 9 to 21. Times taken to complete Trail Making A and B increase steadily as WMT effort scores decrease (Table 9). Performance IQ and Verbal IQ scores decline as effort declines (table 10). Even manual test scores reduce in a predictable way as effort decreases, as shown in tables 11 to 14
(Finger Tip Number Writing, Grip Strength, Finger Tapping Speed & Grooved Pegboard). In people with severe brain injuries, who passed WMT, the mean right hand finger tap score was 49.6 (SD=7), whereas in those with mild head injuries, who failed WMT, the mean score was 42.6 (SD=12). Once again, effort has more effect than brain injury.
Table 9 The Trail Making Test by Levels of Effort on WMT
Mean WMT effort
N
Trail Making A (seconds)
Mean
Trail Making A
SD
Trail Making B (seconds)
Mean
Trail Making B SD
91-100% 813 30.4 12.6 76.5 48.1 81-90% 218 38.6 17.3 105.0 77.0 71-80% 119 42.1 20.2 112.7 78.5 61-70% 63 44.9 24.9 139.7 96.9 51-60% 55 60.3 46.1 183.1 157.5 <=50% 39 65.2 45.1 159.6 141.1
Table 10 PIQ and VIQ by Levels of Effort on WMT
Mean WMT effort
N
PIQ Mean
PIQ SD
VIQ Mean
VIQ SD
91-100% 761 104.7 12.9 101.7 13.2 81-90% 199 98.3 14.1 94.8 13.1 71-80% 98 94.2 12.9 95.5 13.4 61-70% 56 93.1 13.3 94.6 13.5 51-60% 43 86.3 13.0 87.7 13.2 <=50% 24 84.0 16.3 86.0 15.8

Green, P.
International Journal of Forensic Psychology © 2006 ijfp.uow.edu.au 12
Table 11 Finger Tip Number Writing by Levels of Effort on WMT
Mean WMT effort
N
FTNW Errors Left
Mean
FTNW Errors Left SD
FTNW Errors Right Mean
FTNW Errors Right SD
91-100% 272 1.5 2.3 1.8 2.3 81-90% 65 1.7 2.3 2.1 2.2 71-80% 24 2.4 2.8 3.1 2.8 61-70% 16 2.4 2.5 2.1 2.1 51-60% 11 3.3 3.1 4.1 3.5 <=50% 4 7.2 7.9 8.5 8.3
Table 12 Grip Strength by Level of WMT Effort
Mean WMT effort
N
Grip strength Right (Kgs)
Mean
Grip strength Right SD
Grip strength Left (Kgs)
Mean
Grip strength Left SD
91-100% 813 41.4 14.2 38.1 13.6 81-90% 218 39.4 13.6 38.0 13.3 71-80% 119 36.9 16.4 35.3 14.8 61-70% 63 38.0 16.6 36.7 16.0 51-60% 55 33.6 14.6 32.5 14.2 <=50% 39 31.7 14.2 31.6 12.5
Table 13 Finger Tapping Speed by Level of WMT Effort
Mean WMT effort
N
Finger tapping speed Right Mean
FT Right SD
Finger tapping speed Left
Mean
FT Left SD
91-100% 529 48.8 8.9 45.3 8.6 81-90% 134 45.3 11.2 42.7 9.3 71-80% 63 43.3 11.1 40.7 9.2 61-70% 32 44.9 10.6 42.8 10.0 51-60% 26 38.0 11.9 37.4 12.0 <=50% 15 34.7 15.4 36.0 13.8
Table 14 Grooved Pegboard by Level of WMT Effort
Mean WMT Effort
N
Grooved Pegboard Right (secs)
Mean
Grooved Pegboard
Right SD
Grooved Pegboard Left (secs)
Mean
Grooved Pegboard
Left SD
91-100% 813 72.2 24.4 81.3 32.9 81-90% 218 80.3 22.2 86.2 24.3 71-80% 119 92.6 51.2 90.5 29.6 61-70% 63 82.8 18.9 90.5 18.5

Effort Effects
International Journal of Forensic Psychology © 2006
ijfp.uow.edu.au 13
51-60% 55 109.6 55.4 116.2 61.4 <=50% 39 108.4 55.1 123.6 96.3
Table 15 Wisconsin Card Sorting Test and Scores by Levels of Effort on WMT
Mean WMT effort
N
WCST Perseverative Errors Mean (% ile rank)
WCST
Categories Mean
WCST
Categories SD
91-100% 813 51.3 5.2 1.5 81-90% 218 42.1 4.5 1.9 71-80% 119 38.7 4.4 1.9 61-70% 63 33.4 4.2 2.0 51-60% 55 26.9 3.3 2.3 <=50% 39 11.2 2.1 2.3
Note. The WCST perseverative error score is expressed as a percentile rank relative to age, gender and education, using Heaton’s norm tables. Table 16 Category Test Errors by Levels of Effort on WMT
Mean WMT effort
N
Category Test Errors
Mean
Cat Test
Errors SD 91-100% 674 55.1 29.5 81-90% 164 66.2 28.9 71-80% 77 73.3 28.2 61-70% 44 70.7 28.2 51-60% 30 91.1 28.4 <=50% 18 88.4 33.8
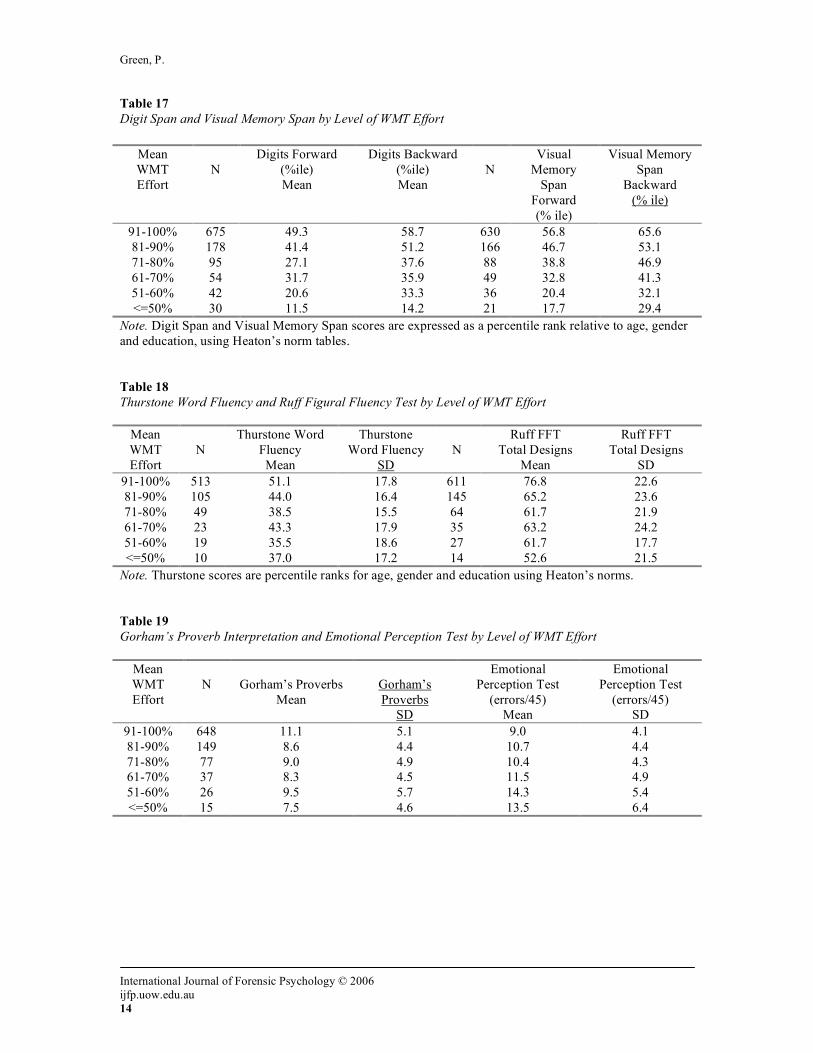
Abstraction and problem solving tests are no exception to the general rule. The Wisconsin Card Sorting Test and Category Test are very susceptible to the influences of effort (tables 15 & 16). Digit Span, Visual Memory Span, Thurstone’s Word Fluency and Ruff Figural Fluency are also strongly affected by effort, as measured by the WMT (tables 17 & 18). Scores on tests as diverse as proverb
interpretation, judgment of emotion in tone of voice, judgment of the angles of lines, visual memory and the ability to identify odors are significantly affected by effort, as measured by the WMT (tables 19, 20 & 21). Although not shown in the tables, scores on WRAT reading, spelling and arithmetic and on the PASAT were all significantly correlated with WMT effort scores.
Green, P.
International Journal of Forensic Psychology © 2006 ijfp.uow.edu.au 14
Table 17 Digit Span and Visual Memory Span by Level of WMT Effort
Mean WMT Effort
N
Digits Forward (%ile) Mean
Digits Backward (%ile) Mean
N
Visual Memory
Span Forward (% ile)
Visual Memory Span
Backward (% ile)
91-100% 675 49.3 58.7 630 56.8 65.6 81-90% 178 41.4 51.2 166 46.7 53.1 71-80% 95 27.1 37.6 88 38.8 46.9 61-70% 54 31.7 35.9 49 32.8 41.3 51-60% 42 20.6 33.3 36 20.4 32.1 <=50% 30 11.5 14.2 21 17.7 29.4
Note. Digit Span and Visual Memory Span scores are expressed as a percentile rank relative to age, gender and education, using Heaton’s norm tables. Table 18 Thurstone Word Fluency and Ruff Figural Fluency Test by Level of WMT Effort
Mean WMT Effort
N
Thurstone Word Fluency Mean
Thurstone Word Fluency
SD
N
Ruff FFT Total Designs
Mean
Ruff FFT Total Designs
SD 91-100% 513 51.1 17.8 611 76.8 22.6 81-90% 105 44.0 16.4 145 65.2 23.6 71-80% 49 38.5 15.5 64 61.7 21.9 61-70% 23 43.3 17.9 35 63.2 24.2 51-60% 19 35.5 18.6 27 61.7 17.7 <=50% 10 37.0 17.2 14 52.6 21.5
Note. Thurstone scores are percentile ranks for age, gender and education using Heaton’s norms. Table 19 Gorham’s Proverb Interpretation and Emotional Perception Test by Level of WMT Effort
Mean WMT Effort
N
Gorham’s Proverbs
Mean
Gorham’s Proverbs
SD
Emotional Perception Test
(errors/45) Mean
Emotional Perception Test
(errors/45) SD
91-100% 648 11.1 5.1 9.0 4.1 81-90% 149 8.6 4.4 10.7 4.4 71-80% 77 9.0 4.9 10.4 4.3 61-70% 37 8.3 4.5 11.5 4.9 51-60% 26 9.5 5.7 14.3 5.4 <=50% 15 7.5 4.6 13.5 6.4

Effort Effects
International Journal of Forensic Psychology © 2006
ijfp.uow.edu.au 15
Table 20 Alberta Smell Test Scores by Level of WMT Effort
Mean WMT effort
N
Smell test (Right) Mean
Smell test (Right)
SD
Smell test (Left) Mean
Smell test (Left)
SD 91-100% 813 5.2 2.6 5.6 2.7 81-90% 218 4.5 2.5 4.6 2.6 71-80% 119 4.4 2.9 5.0 2.9 61-70% 63 3.6 2.8 4.1 2.6 51-60% 55 3.6 2.6 3.7 2.7 <=50% 39 3.5 2.4 3.5 3.2
Note: Scores are number correct out of 10 per nostril Table 21 Benton Judgment of Line Orientation (BJLO) and Continuous Visual Memory Test (CVMT) by Level of WMT Effort
Mean WMT effort
N
BJLO Mean
BJLO SD
CVMT Delay Mean
CVMT Delay Mean
91-100% 653 24.7 4.2 4.2 1.5 81-90% 169 23.8 4.4 3.6 1.6 71-80% 87 22.7 4.4 4.2 1.5 61-70% 49 21.7 5.8 2.8 1.5 51-60% 43 18.5 5.1 2.0 2.0 <=50% 32 15.3 6.7 1.5 1.3
Table 22 shows that effort, as measured by the WMT, is strongly linked with effort measured by other symptom validity tests. The mean WMT effort score correlated at 0.61 with CARB, 0.6 with the Amsterdam and 0.6 with the 21-Item Test. In the Gervais sample shown in table 5, the correlation between the mean WMT effort score and the Test of Memory Malingering (TOMM trial two) was 0.68. WMT effort scores were also significantly negatively correlated with all symptom self-rating scales, including the SCL90-R positive symptom total (-0.26), Beck Depression Inventory (-0.24), the MMPI-2 F scale (-0.22), the MMPI-2 D scale (-0.24) and the Memory Complaints Inventory (-0.4).
WMT Memory Subtest Scores by Range of Effort The mean WMT DR score of those in the second effort range from the top was 88% and, of those in this range, 58% of cases failed the WMT using the standard clinical criteria. In table 23, we can see that the group scoring in the second range on WMT effort subtests obtained a mean score of 66.9% on
WMT MC (Multiple Choice). When an MC score that low occurs, the WMT Windows program (Green, 2003) issues a “caution” because, in most patients, such a score would be too low to be valid. A score of 66.9% on MC would be 4.25 standard deviations below the mean of 95.4% correct (SD 6.7) from normal adult controls listed in the WMT Windows test manual and program (Green, 2003). Neurological patients, selected because they had impaired memory on the CVLT, scored 81% (SD=11) on MC and a group with severe brain injuries and an average GCS of 5 scored 88.2% correct (SD=18.4) on MC. Similarly, those who scored in the range 81% to 90% on the WMT effort measures also scored 61% on the Paired Associates subtest, which is 3.3 standard deviations below the mean from normal adult controls (table 24). An MC score of 66.9% or a PA score of 61% could be valid in a case of dementia or in someone with a left medial temporal lobe brain tumor or lobectomy. However, the vast majority of cases in the current study with WMT effort scores in the second range from the top did not have dementia and did not

Green, P.
International Journal of Forensic Psychology © 2006 ijfp.uow.edu.au 16
need 24 hours a day care. Hence, their mean scores of 66.9% on MC and 61% on PA would not be considered valid.
When those in the top WMT effort range were compared with those in the second range on all neuropsychological tests shown in the tables, the mean differences were significant at 0.005 or lower in all cases, except for grip strength, grooved pegboard and finger tip number writing. For example, the mean Trail Making B score was 76 seconds in the top effort range but 105 seconds in the second range (table 9). To put that number in perspective, people with head injuries and up to six days of coma took an average of only 89 seconds on Trail Making B in the study of Dikmen et al (1995). Those scoring in the second effort range from the top in table 1 scored a mean of 8.3 on CVLT short delayed free recall, whereas the more severe brain injury group discussed earlier scored 9.9 (sd 3.1). This adds further support to the conclusion that mean WMT scores in the second range imply poor effort, sufficient to affect most other test scores.
It is not surprising that mean scores of 81% to 90% on WMT effort subtests are linked with declines in other test scores, when the scores of the following groups are considered:- 1) Children with fetal alcohol syndrome (FAS) scored a mean of 95.5% (SD 5.8) on the Delayed Recognition (DR) subtest of the WMT (Green, & Flaro, 2003); 2) Adults with neurological diseases, selected for having impaired verbal memory, scored a mean of 95% (SD 5.5) on WMT DR (Green, 2003); 3) Mentally retarded adults scored a mean of 95% (SD 5) on the oral form of the WMT (Brockhaus & Merten, 2004); 4) Adults with severe brain injuries and a mean GCS of 5 obtained a mean score of 96.6% (SD 4) on WMT Delayed Recognition (Green, 2003).
Decline in Test Scores Expressed in Standard Deviations In table 24, it is evident that, on the eight neuropsychological tests shown, there was an average drop in scores of half a standard deviation, in patients with WMT scores in the second range from the top. Those scoring in the fourth effort range (mean WMT=67%) showed a mean drop in neuropsychological test scores of 0.85 standard deviations compared with the top effort group. Those scoring in the bottom effort range showed an average drop of approximately two standard deviations.
For comparison with the effects of brain injuries on similar test scores, it may be noted that, in cases
with 7 to 13 days loss of consciousness studied by Dikmen et al (1995), the mean deficit in Halstead-Reitan test scores compared with the normal adult mean was 0.68 standard deviations (Rohling, Meyers & Millis, 2003). In those with more than 28 days loss of consciousness (or time to follow commands), the mean overall deficit in neuropsychological test scores was 2.3 standard deviations. Thus, the effects of effort on test scores in the current study are roughly comparable to the reported effects of severe brain injuries.
It may be noted also that the deficits reported by Dikmen et al (1995) were not corrected for effort. No effort tests were employed. The possibility must be considered that some of their cases of brain injury probably scored lower than they were actually capable of achieving, magnifying the apparent effects of a severe brain injury on neuropsychological test scores. Ideally, in similar studies in future, effort would be measured objectively, allowing the effects of brain injury on neuropsychological test scores to be separated from the effects of poor effort. Rohling et al (2003) did exclude some suspected cases of poor effort, although not necessarily all of them. Perhaps this partly explains why the mean deficit on many tests in their group with more than 28 days of coma was 1.8 standard deviations, compared with 2.3 in the Dikmen et al study.
Sample of Mild Head Injuries with Very Low Effort Scores There were 48 cases in the current study with a mild head injury, no brain scan abnormality and a median GCS of 15, who scored below 70% on WMT effort subtests. Their mean WMT IR and DR scores were 58% and 56%. Yet, in the most severe brain injury group, with PTA of one day or more and with an abnormal brain scan, there were only five cases scoring lower than 70%. A WMT effort score of 56% is approximately 40 percentage points lower than the mean from adults with severe brain injuries, mentally retarded adults or children with FAS. People who were specifically asked to fake memory impairment on the WMT for experimental purposes and institutionalized patients suffering from advanced dementia scored higher than the latter mild head injury patients (Iverson, Green & Gervais, 1999, Brockhaus & Merten, 2004, Green, 2003). The mean CVLT short delayed free recall score in the latter cases of mild head injury was 6 out of 16 (see table 1). Their mean CVLT recognition hits score was 10 (table 5). Their mean Trail Making B score was 146 seconds (table 9) and they scored only 19 out of 30 on Benton’s Judgment of Line Orientation test (table 21). These

Effort Effects
International Journal of Forensic Psychology © 2006
ijfp.uow.edu.au 17
scores are lower than in the more severe brain injury group making an effort and almost certainly
do not provide a valid reflection of the true capabilities of these 48 cases of mild head injury.
Table 22 Amsterdam Short Term Memory Test (ASTM), 21-item Test and Computerized Assessment of Response Bias (CARB) by Level of WMT Effort
Mean WMT effort
N
ASTM Mean
SD
N
21 Item Recognition
Mean
21Item Rec. SD
N
CARB Mean
SD
91-100% 163 87.2 2.9 89 17.5 2.2 788 98.0 5.2 81-90% 48 84.7 4.3 16 16.6 2.3 210 95.5 7.2 71-80% 21 82.5 6.1 10 14.9 2.6 115 91.1 10.8 61-70% 8 80.0 5.9 9 15.9 3.0 60 85.6 14.2 51-60% 7 79.4 6.6 4 10.2 3.7 54 76.1 22.0 <=50% 7 69.6 16.5 3 8.3 .58 38 64.1 25.3
Note. ASTM scores are out of 90. 21-item test scores are out of 21. CARB scores are % correct. Table 23 WMT Memory Subtests by Level of WMT Effort
Mean WMT effort
WMT DR
Mean
N
WMT MC
Mean
WMT MC SD
WMT PA
Mean
WMT PA SD
WMT FR
Mean
WMT FR SD
91-100% 97.5% 813 90.4 10.8 85.8 14.4 52.9 52.9 81-90% 88.1% 218 66.9 14.1 61.4 16.0 35.6 35.6 71-80% 77.0% 119 54.5 12.6 50.2 14.9 31.5 31.5 61-70% 67.1% 63 47.8 11.3 44.9 14.7 27.8 27.8 51-60% 54.5% 55 36.0 13.0 34.5 13.2 23.7 23.7 <=50% 41.1% 39 26.8 15.6 27.4 14.1 19.9 19.9
DR=Delayed Recognition, MC=Multiple Choice, PA=Paired Associates Table 24 Average Drop in Performance on Eight Tests for Each Level of Effort on WMT: Scores Expressed in Terms of Standard Deviations Below the Mean for Those in the Top Range of Effort
Mean WMT effort
CVLT SD
FREE
WRMT Faces
WCST Categ-ories.
Trail Making
A
Ruff FFT
Designs
Finger Tap
Right
PIQ
Immed. Story Recall
Mean of 8
Tests
91-100%
0 0 0 0 0 0 0 0 0
81-90% -0.8 -0.4 -0.5 -0.7 -0.5 -0.4 -0.5 -0.5 -0.54 71-80% -0.9 -0.9 -0.5 -0.9 -0.7 -0.6 -0.8 -0.7 -0.75 61-70% -1.0 -1.1 -0.7 -1.2 -0.6 -0.4 -0.9 -0.9 -0.85 51-60% -1.5 -1.9 -1.3 -2.4 -0.7 -1.2 -1.4 -1.3 -1.46 <=50% -2.0 -3.1 -2.1 -2.8 -1.1 -1.6 -1.6 -1.2 -1.94
Note. For Trail Making A, the signs have been reversed to make the table consistent, because longer times imply poorer performance

Green, P.
International Journal of Forensic Psychology © 2006 ijfp.uow.edu.au 18
DISCUSSION Using the clinically recommended cut-offs, 30.8% of 1,307 cases in this study failed the WMT effort subtests. There was a substantially higher failure rate on WMT in the cases with mild head injury than in those with severe brain injuries. Also, the mean WMT effort score was significantly lower in the mild than in the severe brain injury group in this study. In those who failed WMT, the mean effort score was lower than that from patients institutionalized with dementia. It was far lower than testable mentally retarded adults performed on the WMT (Brockhaus & Merten, 2004, Green, 2003). These findings are most consistent with the fact that the WMT effort subtests primarily measure effort.
The tables show clearly that most neuropsychological test scores were progressively reduced, to a degree corresponding with the level of effort indicated by the WMT. When brain injury effects were weighed directly against effort effects in the current study, the scales invariably tipped in the direction of effort having the greater influence on test scores. It has been shown above that, within a large sample of patients, scores on the CVLT, Trail Making Test and Category Test were suppressed more by effort than by severe brain injury. On each of the latter tests, the patients with the most mild head injuries, who failed the WMT effort subtests, scored much lower than those with severe brain injuries who passed the WMT. The same conclusion holds true for most of the other tests shown in the tables. In a single case, it might be argued that, despite having suffered only a mild head injury, a certain unfortunate patient was the rare exception and had suffered more brain impairment than most cases of severe brain injury. However, it would be illogical to apply such an argument to the latter group data.
The average suppression of neuropsychological test scores by poor effort, as shown in table 24, was of the same order of magnitude as reported in groups with various degrees of brain injury severity, up to and including people who had not responded to commands for more than 28 days. Rohling et al. (2003) reported that average neuropsychological test scores were suppressed by about two standard deviations in the group with the most severe brain injuries. The current tables show that poor effort can suppress test scores to the same degree (table 24). The neuropsychological test scores of people with mild head injuries, making a poor effort, were typically lower in the current study than those of people with at least moderate to
severe traumatic brain injuries, making a full effort. This is the opposite of what would be expected if the test scores were primarily affected by brain injury. The sensitivity of neuropsychological tests to brain injury can thus be nullified by poor effort.
To the extent that these findings generalize to other samples, the results indicate that objective effort testing is necessary to rule out deficits in test scores arising from poor effort, as opposed to brain dysfunction. The data support the position of the National Academy of Neuropsychology (Bush, Ruff, Troster, Barth, Koffler, Pliskin, Reynolds and Silver, 2005) that effort needs to be measured in cases involved in any form of compensation claim, including people who are already receiving compensation payments. The results also suggest that, even if poor effort is not suspected, effort is such a powerful variable that the objective measurement of effort is advisable. Assuming that we know when effort is good without measuring it is a risky proposition. For many years, neuropsychological studies of patients with PNES were performed without any attention to effort measurement. However, when the assumption of good effort was put to the test objectively, more than half of all such patients failed the WMT effort subtests, while most of the actual seizure patients passed the WMT (Williamson et al., 2003). In the latter study, if the WMT was failed, the odds were 20 to 1 that the patient was a case of PNES and not a case of seizure disorder. Parents seeking custody of their children would be expected to be motivated to perform well. Nevertheless, two out of 29 cases failed the WMT (Green & Flaro, 2003) and, on questioning, they both admitted that they had changed their minds and did not want the responsibility of having their children back in their care. We might ask how many volunteers for normative studies make a full effort on testing? Perhaps most of them do so but the honest answer is that we do not know because effort was never measured objectively in past normative studies.
By omitting effort testing in clinical cases or group studies, we are assuming that effort is uniformly good in all participants. That assumption may now be questioned because poor effort in this study had a greater effect on test scores than severe brain injury. Even when WMT effort scores were in the second range from the top (81% to 90%), the tables showed a uniform reduction in all neuropsychological test scores compared with those in the top effort range. Except in dementia, we have good reason to doubt the validity of neuropsychological data when a person scores below the cut-offs on the WMT effort subtests. As

Effort Effects
International Journal of Forensic Psychology © 2006
ijfp.uow.edu.au 19
in the case of the mild head injury subgroup, whose mean WMT effort scores were below 70%, the logic is simple. If a person who is not demented scores much worse on extremely easy tests than people with dementia, severe brain injuries or mental retardation, then that person’s effort is insufficient to produce valid data.
Rarely, if ever, have psychologists argued that subjective judgment, based on no objective criterion, is superior to the use of methods based on objective measurement. However, some neuropsychologists argue that they are able to detect incomplete effort by casual observation alone and that clinical judgment is sufficient to identify poor effort. If that were true, we would have known for many years that effort is a continuous variable, as shown in the tables, but we did not know. If clinical intuition alone were sufficient, we would have known for a long time that effort can affect neuropsychological test scores more powerfully than severe brain injury but this has not been part of our collective knowledge until very recently. If clinical judgment and effort testing with the WMT were equivalent, we would probably all agree that there is insufficient effort to produce valid test results in a substantial proportion of all compensation and disability cases. However, those who rely on clinical judgment invariably argue that poor effort is so rare that there is no need for objective tests of effort. Yet the same clinicians will often pay attention to variables with far less substantial effects on test scores than effort, such as education, age, mood or diagnosis. The National Academy of Neuropsychology Policy and Planning Committee has now stepped into the debate and has published a position paper, in which it is made clear that it is necessary to use objective methods for determining the amount of effort applied to neuropsychological tests (Bush et al., 2005).
The relationships between effort and neuropsychological test scores, shown in tables 1 to 24, are clear but they were neither obvious nor self-evident until the data were gathered over an eight-year period. Although unexpected, the key finding is that neuropsychological test scores in outpatients similar to those of the current study are affected at least as much by effort as by brain injury. To most neuropsychologists, this is initially a troubling conclusion because it gives us reason to pause and reconsider the results of many past studies and clinical assessments, which did not involve effort testing. As the PNES study by Williamson et al. (2003) illustrates, we need to revisit past studies, in which it was assumed that effort was satisfactory in all patients.
In future, it is reasonable to expect that neuropsychologists, who do not measure effort objectively risk failing to recognize the presence of poor effort and, hence, will underestimate its impact on test scores. Low scores could easily be misinterpreted as a sign of biologically based brain impairment, when the real cause is poor effort. Genuine impairment in many brain-injured people could be overlooked because their neuropsychological deficits seem minor compared with the very low test scores of those with deficient effort. On the other hand, it is now possible to measure effort objectively. We are therefore able to measure and control a major nuisance variable that affects our data more than brain injury, impeding our understanding of the true effects of brain disease. By removing data contaminated by poor effort, we are now able to see more clearly than ever before the ways in which neuropsychological test scores actually reflect underlying brain dysfunction. REFERENCES Benton, A.L., Hamsher, K.de S., Varney, N.R. &
Spreen, O. (1983). Contributions to neuropsychological assessment. NY: Oxford University Press.
Brockhaus, R. & Merten, T. (2004), "Neuropsychologische Diagnostik suboptimalen Leistungsverhaltens mit dem Word Memory Test", Nervenarzt, 75 (9), 882-887.
Brockhaus, R., Peker, Ö, Fritze, E. (2003). Testing effort in Turkish-speaking subjects: Validation of a translation of the Word Memory Test (WMT). Poster at annual convention of Gesellschaft der Neuropsychologie in Berlin.
Bush, S., Ruff, R., Troster, A., Barth, J., Koffler, S., Pliskin, N., Reynolds, C. & Silver, C. (2005). Symptom Validity Assessment: Practice issues and medical necessity (NAN Policy and Planning Committee). Archives of Clinical Neuropsychology, 20, 419-426.
Constantinou, M., Bauer, L., Ashendorf, L., Fisher, J. & McCaffrey, R.J. (2005). Is poor performance on recognition memory effort measures indicative of generalized poor performance on neuropsychological tasks? Archives of Clinical Neuropsychology, 20(2), 191-198.
Delis, D.C., Kramer, J.H., Kaplan, E., & Ober, B. (1987). The California Verbal Learning Test: Research edition. NY: The Psychological Corporation.

Green, P.
International Journal of Forensic Psychology © 2006 ijfp.uow.edu.au 20
Dikmen, S.S., Machamer, J.E., Winn, H.R., & Temkin, N.R. (1995). Neuropsychological outcome at one year post head injury. Neuropsychology, 9, 80-90.
Gervais, R.O., Russell, A.S., Green, P., Allen, M., Ferrari, R. & Pieschl, S D. (2001). Effort testing in patients with fibromyalgia and disability incentives. Journal of Rheumatology, 28, 1892-1899.
Gorham, D.R., (1956). Proverb Interpretation Test, Psychological Test Specialists (out of print).
Gorissen, M., Sanz, J.C., & Schmand, B. (2005). Effort and cognition in schizophrenia patients. Schizophrenia Research, 78, 199-208.
Green, P. & Astner, K., (1995). Manual for the Oral Word Memory Test. NC: Cognisyst.
Green, P., Allen, L. & Astner, K., (1996). Manual for the Computerized Word Memory Test (DOS version). NC: Cognisyst.
Green, P., (2003). Green’s Word Memory Test for Windows: User’s manual. Edmonton, Canada: Green’s Publishing.
Green, P. & Flaro, L. (2003). Word Memory Test Performance in Children. Child Neuropsychology 19(3), 189-207.
Green, P. Manual for the Emotional Perception Test (1986, revised 1997). Edmonton: Green’s Publishing.
Green, P. Manual for the Story Recall Test (ACT). (1983, revised 1996). Edmonton: Green’s Publishing.
Green, P., Iverson, G. & Allen, L. (1999). Detecting malingering in head injury litigation with the Word Memory Test. Brain Injury,13(10), 813-819.
Green, P. & Iverson, G.L. (2001). Effects of injury severity and cognitive exaggeration on olfactory deficits in head injury compensation claims. Neurorehabilitation, 16, 237-243.
Green, P. and Iverson, G. (2001) Validation of the Computerized Assessment of Response Bias in litigating patients with head injuries. The Clinical Neuropsychologist, 15 (4), 492-497.
Green, P., Rohling, M.L, Iverson, G. & Gervais, R. (2003) Relationships between olfactory discrimination and head injury severity. Brain Injury, 17, 6, 479-496.
Green, P., Rohling, M, Lees-Haley, P. & Allen, M. (2001) Effort has a greater effect on test scores than severe brain injury in compensation claimants, Brain Injury, 15, 12, 1045-1060.
Green, P., Lees-Haley, P.R. & Allen, M. (2002) The Word Memory Test and the validity of neuropsychological test scores. Journal of Forensic Neuropsychology, 2(3), 97-124.
Iverson, G., Green, P. & Gervais, R. (1999) Using the Word Memory Test to detect biased responding in head injury litigation. The Journal of Cognitive Rehabilitation, 17, 2, 4-8.
Jackson, D.N. (1998), Multidimensional Aptitude Battery-II. Sigma Assessment Systems, Port Huron, Michigan.
Meyers, J., & Meyers, K. (1995). The Meyers Scoring System for the Rey Complex Figure and the Recognition Trial: Professional Manual. Psychological Assessment Resources, Odessa, FL.
Nies, K.J., & Sweet, J.J. (1994). Neuropsychological assessment and malingering: A critical review of past and present strategies. Archives of Clinical Neuropsychology, 9(6), 501-522.
Reitan, R. M. (1974) Methodological problems in clinical neuropsychology. In R. M. Reitan & L. A. Davison (Eds) Clinical Neuropsychology: Current Status and Applications. (pp. 19-46) V. H. Winston & Sons: Washington, DC.
Reitan, R. M. (1969). Manual for Administration of Neuropsychological Test Battery: Theory and Interpretation. Indianapolis, IN: Neuropsychological Press.
Rohling, M.L., Meyers, J.M., & Millis, S.R. (2003) Neuropsychological Impairment Following Traumatic Brain Injury: A Dose-Response Analysis. The Clinical Neuropsychologist, 17, 3, 289-302.
Rohling, M.L., Green, P., Allen, L.M. & Iverson, G.L. (2002) Depressive symptoms and neurocognitive test scores in patients passing symptom validity tests. Archives of Clinical Neuropsychology, 17(3), 205-222.
Ruff, R. (1988) Ruff Figure Fluency Test. Neuropsychological Resources, San Diego, CA.
Schmand B, Lindeboom J, Schagen S, Heijt R, Koene T, Hamburger HL. (1998) Cognitive complaints in patients after whiplash injury: the impact of malingering. Journal of Neurology, Neurosurgery & Psychiatry, 64, 339-43.
Suhr, J. & Gunstadt, J. (2005) Further exploration of the effect of “diagnosis threat” on cognitive performance in individuals with mild head injury. Journal of the International Neuropsychological Society, 11, 23-29.
Tombaugh, T. N., Test of Memory Malingering (1996). Multi-Health Systems, Toronto.
Trahan, D.E., & Larrabee, G.J. (1988). Continuous Visual Memory Test. Manual. Psychological Assessment Resources, Odessa, FL.

Effort Effects
International Journal of Forensic Psychology © 2006
ijfp.uow.edu.au 21
Tydecks, S. & Merten, T., (2005, personal communication). The Word Memory Test and the One-In-Five-Test in an Analogue Study with Russian Participants.
Warrington, E. K. (1984). Recognition Memory Test Manual. Windsor, NFER-Nelson.
Wechsler, D. (1981). Wechsler Adult Intelligence Scale-Revised. Psychological Corporation, New York.
Wechsler, D. (1987) Wechsler Memory Scale - Revised. Psychological Corporation, New York.
Williamson, D. J., Drane, D. L., Stroup, E. S., Miller, J. W., Holmes, M. D., & Wilensky, A. J. (2004). Detecting cognitive differences between patients with epilepsy and patients with psychogenic nonepileptic seizures: Effort matters. Epilepsia, 45 (Suppl. 7), 179.