Embed Size (px)
Citation preview
Copyright © 1986-2013 Eric N. Miller, Ph.D. All Rights Reserved.1775 E. Palm Canyon Dr, Suite 110-201 C Palm Springs, California 92264 C http://www.calcaprt.com
CALCAP®
California ComputerizedAssessment Package™ Manual
Second Edition
Licensing Agreement
The CALCAP® software and manual are protected by both United States copyright law and internationaltreaty provisions. You are permitted to make copies of the software for archival purposes only. Themanual may not be reproduced in whole or in part in any form except as provided by the U.S. CopyrightLaw.
The CALCAP® software may be used by any number of people and may be freely moved from onecomputer location to another, so long as there is no possibility of it being used in two different places atthe same time.
Limited WarrantyThe CALCAP® software diskettes and documentation are warranted to be free of defects in materials andworkmanship for a period of 60 days from the date of purchase. If these materials are found to bedefective during the warranty period, the author will replace the defective disk or documentation.
All other express and implied warranties, including but not limited to implied warranties ofmerchantability and fitness for a particular purpose are hereby disclaimed. In no event shall the author beliable for any loss of profit or any other commercial damage, including but not limited to special,incidental, consequential or other damages.
Cover Design by E. Gordon Bing
CALCAP Manual Revision 5.0 © 1986-2013 Eric N. Miller, Ph.D. All rights reserved. Printed in the United States of America.
California Computerized Assessment Package and CALCAP are registered trademarks of Eric N. Miller,Ph.D. and Norland Software.
12 June 2013
i
Table of ContentsIntroduction
How It Works . . . . . . . . . . . . . . . . . . . . . . . . . . . . . . . . . . . . . . . . . . . . . . . . . . . . . . . . 1-1Background . . . . . . . . . . . . . . . . . . . . . . . . . . . . . . . . . . . . . . . . . . . . . . . . . . . . . . . . . . 1-2Research . . . . . . . . . . . . . . . . . . . . . . . . . . . . . . . . . . . . . . . . . . . . . . . . . . . . . . . . . . . . 1-2
InstallationWhat You Need . . . . . . . . . . . . . . . . . . . . . . . . . . . . . . . . . . . . . . . . . . . . . . . . . . . . . . . 2-1Potential Conflicts with Other Software . . . . . . . . . . . . . . . . . . . . . . . . . . . . . . . . . . . . 2-1Updating an Existing Installation . . . . . . . . . . . . . . . . . . . . . . . . . . . . . . . . . . . . . . . . . 2-1Installing the CALCAP on Your Hard Disk . . . . . . . . . . . . . . . . . . . . . . . . . . . . . . . . . . 2-1Windows Installation Procedures . . . . . . . . . . . . . . . . . . . . . . . . . . . . . . . . . . . . . . . . . 2-1DOS Installation Procedures . . . . . . . . . . . . . . . . . . . . . . . . . . . . . . . . . . . . . . . . . . . . 2-2Installing an Updated Version of the CALCAP Program . . . . . . . . . . . . . . . . . . . . . . . 2-2Installing Multiple Program Drivers for the CALCAP Program . . . . . . . . . . . . . . . . . 2-3Installing Foreign Language Versions of the CALCAP Program . . . . . . . . . . . . . . . . . 2-3Code Page Adjustments for Norwegian and Danish Versions . . . . . . . . . . . . . . . . . . . 2-3Site Identification Codes . . . . . . . . . . . . . . . . . . . . . . . . . . . . . . . . . . . . . . . . . . . . . . . 2-4Removing Old Versions of the CALCAP Program . . . . . . . . . . . . . . . . . . . . . . . . . . . . 2-4
CALCAP Test MaterialsStandard Edition . . . . . . . . . . . . . . . . . . . . . . . . . . . . . . . . . . . . . . . . . . . . . . . . . . . . . . 3-1Abbreviated Version . . . . . . . . . . . . . . . . . . . . . . . . . . . . . . . . . . . . . . . . . . . . . . . . . . . 3-2Mini Version . . . . . . . . . . . . . . . . . . . . . . . . . . . . . . . . . . . . . . . . . . . . . . . . . . . . . . . . . 3-2Customized Versions . . . . . . . . . . . . . . . . . . . . . . . . . . . . . . . . . . . . . . . . . . . . . . . . . . . 3-2
Task AdministrationSetting Up the Room . . . . . . . . . . . . . . . . . . . . . . . . . . . . . . . . . . . . . . . . . . . . . . . . . . . 4-1Starting the CALCAP Program . . . . . . . . . . . . . . . . . . . . . . . . . . . . . . . . . . . . . . . . . . . 4-1
Entering Identification Numbers and Demographic Information . . . . . . . . . . 4-1Instructions to the Subject . . . . . . . . . . . . . . . . . . . . . . . . . . . . . . . . . . . . . . . . 4-2
While the CALCAP Program is RunningInstructions for Subjects Who are Unable to Complete the Practice Trials . . . . . . . . . . . . . . . . . . . . . . . . . . . . . . . . . 4-2Feedback During the CALCAP Task . . . . . . . . . . . . . . . . . . . . . . . . . . . . . . . . 4-3Controlling the Music . . . . . . . . . . . . . . . . . . . . . . . . . . . . . . . . . . . . . . . . . . . 4-3Skipping Specific Tasks . . . . . . . . . . . . . . . . . . . . . . . . . . . . . . . . . . . . . . . . . . 4-3Aborting the CALCAP Program . . . . . . . . . . . . . . . . . . . . . . . . . . . . . . . . . . . . 4-3
End of the CALCAP Program . . . . . . . . . . . . . . . . . . . . . . . . . . . . . . . . . . . . . . . . . . . . 4-3Viewing Exam Results . . . . . . . . . . . . . . . . . . . . . . . . . . . . . . . . . . . . . . . . . . . 4-3Printing the Results . . . . . . . . . . . . . . . . . . . . . . . . . . . . . . . . . . . . . . . . . . . . . 4-4Re-Starting the CALCAP Program . . . . . . . . . . . . . . . . . . . . . . . . . . . . . . . . . . 4-4Exiting the Program . . . . . . . . . . . . . . . . . . . . . . . . . . . . . . . . . . . . . . . . . . . . 4-4
Reviewing Results at a Later Time . . . . . . . . . . . . . . . . . . . . . . . . . . . . . . . . . . . . . . . . 4-4
ii
Printing Results Using the Classic (1986-1998) CalCAP Print Format . . . . . 4-4Troubleshooting Your Printer . . . . . . . . . . . . . . . . . . . . . . . . . . . . . . . . . . . . . . . . . . . . 4-5
Interpretation of Reaction Time Results . . . . . . . . . . . . . . . . . . . . . . . . . . . . . . . . . . . . . . . . . . 5-1Overview . . . . . . . . . . . . . . . . . . . . . . . . . . . . . . . . . . . . . . . . . . . . . . . . . . . . . . . . . . . 5-1How the CalCAP Selects Normative Comparison Samples . . . . . . . . . . . . . . . . . . . . 5-1Sociodemographic Factors that May Influence Reaction Time . . . . . . . . . . . . . . . . . . 5-1
Understanding the Results: A Page by Page Interpretation Guide . . . . . . . . . . . . . . . 5-1Page 1 - Summary of Results . . . . . . . . . . . . . . . . . . . . . . . . . . . . . . . . . . . . . 5-2Page 2 - Graphical Printout . . . . . . . . . . . . . . . . . . . . . . . . . . . . . . . . . . . . . . . 5-3Page 3 - Reaction Times . . . . . . . . . . . . . . . . . . . . . . . . . . . . . . . . . . . . . . . . . 5-4Page 4 - Difference Scores . . . . . . . . . . . . . . . . . . . . . . . . . . . . . . . . . . . . . . . 5-5Page 5 - Accuracy Indices . . . . . . . . . . . . . . . . . . . . . . . . . . . . . . . . . . . . . . . . 5-6Page 6 - Signal Detection Parameters . . . . . . . . . . . . . . . . . . . . . . . . . . . . . . . 5-7
General Tips for Interpretation . . . . . . . . . . . . . . . . . . . . . . . . . . . . . . . . . . . . . . . . . . . 5-8
Supplementary ProgramsRe-Viewing Results from the CALCAP Program (REVIEW) . . . . . . . . . . . . . . . . . . . . 6-1Preparing Data Sets for Additional Data Analyses (SHORTEN) . . . . . . . . . . . . . . . . . 6-1Identifying Multiple Program Drivers for the CALCAP Program (CALCAP) . . . . . . . 6-2
Special Configurations for the CALCAP ProgramCustomizing the CALCAP Program . . . . . . . . . . . . . . . . . . . . . . . . . . . . . . . . . . . . . . . 7-1Command Line Switches . . . . . . . . . . . . . . . . . . . . . . . . . . . . . . . . . . . . . . . . . . . . . . . 7-1
Feedback . . . . . . . . . . . . . . . . . . . . . . . . . . . . . . . . . . . . . . . . . . . . . . . . . . . . . 7-1Music . . . . . . . . . . . . . . . . . . . . . . . . . . . . . . . . . . . . . . . . . . . . . . . . . . . . . . . . 7-1Printer . . . . . . . . . . . . . . . . . . . . . . . . . . . . . . . . . . . . . . . . . . . . . . . . . . . . . . . . 7-1Text Resolution . . . . . . . . . . . . . . . . . . . . . . . . . . . . . . . . . . . . . . . . . . . . . . . . 7-1Site Identification . . . . . . . . . . . . . . . . . . . . . . . . . . . . . . . . . . . . . . . . . . . . . . . 7-2Program Drivers . . . . . . . . . . . . . . . . . . . . . . . . . . . . . . . . . . . . . . . . . . . . . . . . 7-2
Changing CALCAP Program Options . . . . . . . . . . . . . . . . . . . . . . . . . . . . . . . . . . . . . . 7-2
Technical SpecificationsHardware Specifications . . . . . . . . . . . . . . . . . . . . . . . . . . . . . . . . . . . . . . . . . . . . . . . . 8-1Software Timing . . . . . . . . . . . . . . . . . . . . . . . . . . . . . . . . . . . . . . . . . . . . . . . . . . . . . . 8-1Program Driver History . . . . . . . . . . . . . . . . . . . . . . . . . . . . . . . . . . . . . . . . . . . . . . . . 8-1
References . . . . . . . . . . . . . . . . . . . . . . . . . . . . . . . . . . . . . . . . . . . . . . . . . . . . . . . . . . . . . 9-1
Appendices
Appendix A. Task Development and Normative Data . . . . . . . . . . . . . . . . . . . . . . . . . A-1CALCAP Test Batteries . . . . . . . . . . . . . . . . . . . . . . . . . . . . . . . . . . . . . . . . . . A-2CALCAP Task Descriptions . . . . . . . . . . . . . . . . . . . . . . . . . . . . . . . . . . . . . . . A-2
iii
Summary of Normative Data Used by CALCAP . . . . . . . . . . . . . . . . . . . . . . . A-4Normative Data (All Subjects) . . . . . . . . . . . . . . . . . . . . . . . . . . . . . . . . . . . . A-5 ... by Age Strata . . . . . . . . . . . . . . . . . . . . . . . . . . . . . . . . . . . . . . . . . . . . . A-6 ... by Education Strata . . . . . . . . . . . . . . . . . . . . . . . . . . . . . . . . . . . . . . . . A-7 ... Ages 21-34 by Education Strata . . . . . . . . . . . . . . . . . . . . . . . . . . . . . . . A-8 ... Ages 35-44 by Education Strata . . . . . . . . . . . . . . . . . . . . . . . . . . . . . . . A-9 ... Ages 45+ by Education Strata . . . . . . . . . . . . . . . . . . . . . . . . . . . . . . . . A-10 ... Third Grade Children . . . . . . . . . . . . . . . . . . . . . . . . . . . . . . . . . . . . . . A-11 ... Fifth Grade Children . . . . . . . . . . . . . . . . . . . . . . . . . . . . . . . . . . . . . . . A-12 ... Sixth Grade Children . . . . . . . . . . . . . . . . . . . . . . . . . . . . . . . . . . . . . . A-13 ... Comparison of Men and Women . . . . . . . . . . . . . . . . . . . . . . . . . . . . . A-14 ... Repeated Testings . . . . . . . . . . . . . . . . . . . . . . . . . . . . . . . . . . . . . . . . . A-15Psychometric Properties of Reaction Time Measures . . . . . . . . . . . . . . . . . . A-17Intercorrelations of Reaction Time and Conventional Neuropsychological Measures . . . . . . . . . . . . . . . . . . . . . . . . . . . . . . . . . A-19Factor Analysis of Computerized and Conventional Measures . . . . . . . . . . . A-20
Appendix B. Sample ReportPage 1 - Summary of Abnormal Exam Results . . . . . . . . . . . . . . . . . . . . . . . B-2Page 2 - Graph of Reaction Times and True Positive Responses . . . . . . . . . . B-3Page 3 - Reaction Times . . . . . . . . . . . . . . . . . . . . . . . . . . . . . . . . . . . . . . . . . B-4Page 4 - Difference Scores . . . . . . . . . . . . . . . . . . . . . . . . . . . . . . . . . . . . . . . B-5Page 5 - True Positive and False Positive Responses . . . . . . . . . . . . . . . . . . . B-6Page 6 - Signal Detection Parameters . . . . . . . . . . . . . . . . . . . . . . . . . . . . . . . B-7
Appendix C. Classic Report Format (used from 1986-1998) . . . . . . . . . . . . . . . . . . . C-1Interpretation of Reaction Time Results . . . . . . . . . . . . . . . . . . . . . . . . . . . . . C-2Outcome Codes, z-Scores and Percentile Ranks . . . . . . . . . . . . . . . . . . . . . . . C-2Understanding the Column Headings . . . . . . . . . . . . . . . . . . . . . . . . . . . . . . . C-3Interpretation of Outcome Codes . . . . . . . . . . . . . . . . . . . . . . . . . . . . . . . . . . . C-4Summary Evaluation (Recommend Follow-Up; Within Normal Limits) . . . . C-4Understanding the Graphical Printout . . . . . . . . . . . . . . . . . . . . . . . . . . . . . . . C-5General Tips for Interpretation . . . . . . . . . . . . . . . . . . . . . . . . . . . . . . . . . . . . . C-6Sample Output - Standard Stimulus Materials - Standard Printout . . . . . . . . . C-7Sample Output - Abbreviated Stimulus Materials - Standard Printout . . . . . C-10
Appendix D. Structure of Raw Data Files . . . . . . . . . . . . . . . . . . . . . . . . . . . . . . . . . . D-1
Appendix E. SHORTENed Data FilesHow to SHORTEN CALCAP Data Files . . . . . . . . . . . . . . . . . . . . . . . . . . . . . E-1Edit Checks for SHORTENed Data Files . . . . . . . . . . . . . . . . . . . . . . . . . . . . E-1Structure of SHORTENed Data Files . . . . . . . . . . . . . . . . . . . . . . . . . . . . . . . E-2
Appendix F. Bibliography and Selected Abstracts from Articles and PresentationsSuggested Readings about Reaction Time and CalCAP . . . . . . . . . . . . . . . . . F-2Computerized and conventional neuropsychological assessment of HIV-1-infected homosexual men (Miller et al., 1991) . . . . . . . . . . . . . . . . F-5Computer-based neuropsychological screening for AIDS Dementia Complex (Worth et al., 1993) . . . . . . . . . . . . . . . . . . . . . . . . . . . . . . . . . . . F-6
iv
Computerized screening for HIV-related cognitive decline in gay men: Cross-sectional analyses and one-year follow-up (Miller et al., 1989) . . . F-7Use of computerized reaction time in the assessment of dementia (Miller, 1992) . . . . . . . . . . . . . . . . . . . . . . . . . . . . . . . . . . . . . . . . . . . . . . . F-9The effects of sociodemographic factors on reaction time and speed of information processing (Miller et al., 1993) . . . . . . . . . . . . . . . . . . . . . . F-10Cognitive testing using reaction time and traditional neuropsychological procedures (Miller, 1995) . . . . . . . . . . . . . . . . . . . . . . . . . . . . . . . . . . . . F-12The use of computer-based measures of complex reaction time in depressed HIV-1 infected patients (Halman et al., 1995) . . . . . . . . . . . . . F-13Cognitive Performance During Long-Term Respirator Wear While at Rest (Caretti, 1997) . . . . . . . . . . . . . . . . . . . . . . . . . . . . . . . . . . . . . . . F-14Neuropsychological Function in Patients with Increased Serum Levels of Protein S-100 After Minor Head Injury (Waterloo et al., 1997) . . . . . F-15Neuropsychological Performance and HIV-1 in Ethnic Minority Samples of Women and Men (Durvasula et al., 1998) . . . . . . . . . . . . . . . . . . . . . . F-16
1-1
INTRODUCTION
The California Computerized Assessment Package(CA LCAP®) allows you to perform standardizedassessments of reaction time and speed of informationprocessing.
Computerized assessment techniques facilitate theapplication of technology and methods developed inexperimental cognitive laboratories to the problems ofapplied clinical assessment. There are severaladvantages to this approach.
C The test can be administered by technical levelpersonnel.
C The computer controls the presentation ofcomplex stimuli to the subject, thus reducingvariability in test administration.
C The computer automatically records subjectperformance and produces a report in seconds.
C Subjects find the computerized tasks stimulating,non-threatening, and often report that they enjoythe experience.
How It Works
The standard CALCAP task consists of a series of tenSimple and Choice reaction time measuresadministered by computer. The tasks are designed tobe self-explanatory and need only minimal supervisionby the examiner. The complete procedure takesapproximately 20-25 minutes for administration andscoring. An abbreviated version lasting 8-10 minutesis also included. Stimulus materials are available inEnglish, Spanish or Norwegian.
The individual reaction time measures are designed toassess a number of cognitive domains, including speedof processing (reaction time), language skills, rapid
visual scanning, form discrimination, recognitionmemory, and divided attention.
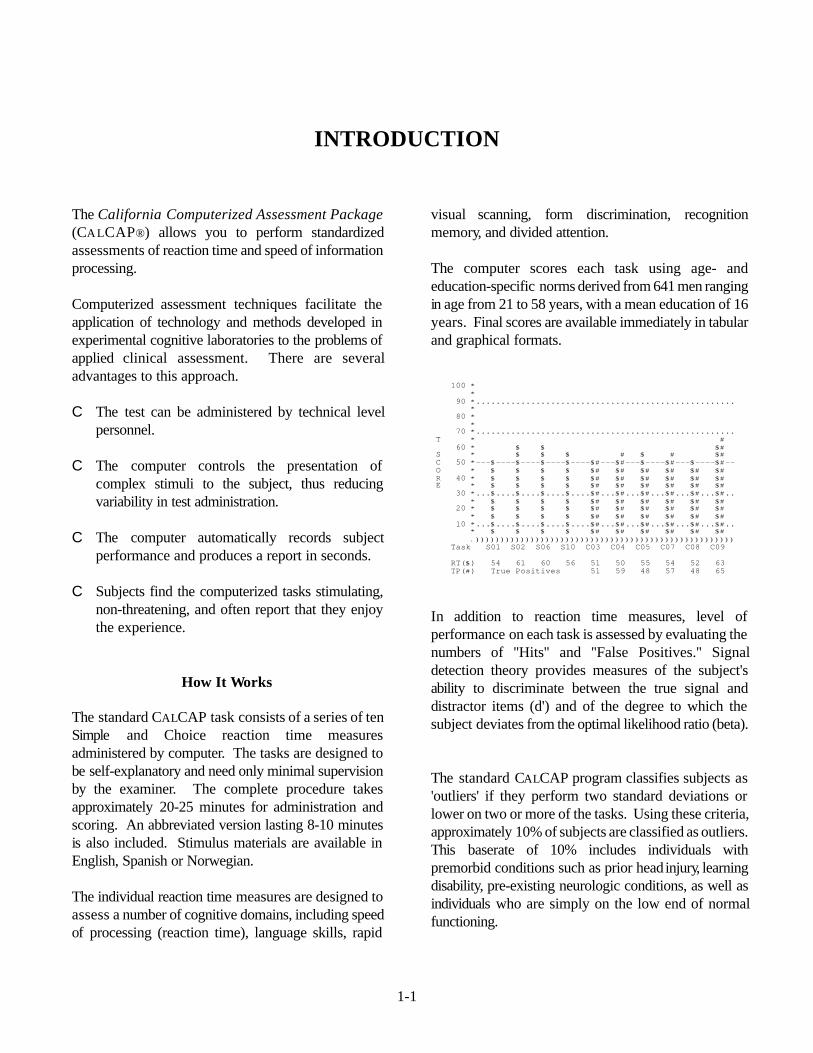
The computer scores each task using age- andeducation-specific norms derived from 641 men rangingin age from 21 to 58 years, with a mean education of 16years. Final scores are available immediately in tabularand graphical formats.
100 * * 90 *.................................................... * 80 * * 70 *.................................................... T * # 60 * $ $ $# S * $ $ $ # $ # $# C 50 *---$----$----$----$----$#---$#---$----$#---$----$#-- O * $ $ $ $ $# $# $# $# $# $# R 40 * $ $ $ $ $# $# $# $# $# $# E * $ $ $ $ $# $# $# $# $# $# 30 *...$....$....$....$....$#...$#...$#...$#...$#...$#.. * $ $ $ $ $# $# $# $# $# $# 20 * $ $ $ $ $# $# $# $# $# $# * $ $ $ $ $# $# $# $# $# $# 10 *...$....$....$....$....$#...$#...$#...$#...$#...$#.. * $ $ $ $ $# $# $# $# $# $# .)))))))))))))))))))))))))))))))))))))))))))))))))))) Task S01 S02 S06 S10 C03 C04 C05 C07 C08 C09 RT($) 54 61 60 56 51 50 55 54 52 63 TP(#) True Positives 51 59 48 57 48 65
In addition to reaction time measures, level ofperformance on each task is assessed by evaluating thenumbers of ''Hits'' and ''False Positives.'' Signaldetection theory provides measures of the subject'sability to discriminate between the true signal anddistractor items (d') and of the degree to which thesubject deviates from the optimal likelihood ratio (beta).
The standard CALCAP program classifies subjects as'outliers' if they perform two standard deviations orlower on two or more of the tasks. Using these criteria,approximately 10% of subjects are classified as outliers.This baserate of 10% includes individuals withpremorbid conditions such as prior head injury, learningdisability, pre-existing neurologic conditions, as well asindividuals who are simply on the low end of normalfunctioning.
1-2
Background
The California Computerized Assessment Packageis modeled after the Continuous Performance Task, ameasure of sustained attention and reaction time.Subjects are asked to focus on a display field andrespond only to specific visual stimuli. The CALCAP program presents a broad range ofstimulus materials on a computer display, withexposure times precisely controlled by the computerprogram. Responses to the stimulus also are preciselymeasured and recorded and include:
C mean and median reaction times
C total numbers of true and false positive responses
C estimates of the signal detection parameters d' andbeta.
These measures can be used to assess slowedcognition, focused and divided attention, sustainedattention, and rapid visual scanning. It is ideal forlongitudinal assessment of cognitive changes due todisease, medications, and cognitive rehabilitation.
Research
The CALCAP test battery is currently being used tostudy changes in reaction time and speed ofinformation processing in multiple sclerosis, hyperbaricnitrogen narcosis, HIV infection, dementia, drug abuseand traumatic brain injury.
Findings to date suggest that the CALCAP is apractical and inexpensive screening tool for detectingearly cognitive decline. Preliminary data suggest thatthe CALCAP may eventually prove more sensitivethan conventional neuropsychological procedures fordetecting cognitive changes over time.
The CALCAP has been used extensively with asample of 509 HIV negative and 451 HIV positivemen who are participating in a longitudinal study of thenatural history of AIDS (Miller et al., 1988, 1989a,1989b, 1991, 1992a, 1992b, 1993).
These subjects were tested using both the CALCAPand a brief conventional neuropsychological screening
procedure consisting of measures of motor speed andattention (Trail-Making, Grooved Pegboard), verbalmemory (Rey Auditory Verbal Learning Task),memory span (WAIS-R Digit Span), and verbalfluency.
Subjects were designated as 'outliers' on theconventional neuropsychological screen if they scoredtwo or more standard deviations below the mean ontwo or more independent measures of cognitivefunctioning, or if they scored three standard deviationsor lower on any one measure.
Using these criteria, the computer program and theconventional neuropsychological screen agreed onoutlier status 85% of the time. Further, 60% ofindividuals identified as outliers by CALCAP at baselinewere identified as having equivocal or abnormal clinicalneuropsychological or neurological exams on follow-up.
Preliminary longitudinal data suggest even greaterspecificity and sensitivity for the computerizedmeasures for detecting change over time. In a sampleof 101 HIV seronegative and 88 HIV seropositive men,poorer performance on the computerized measuresfollowing a 6-month interval was noted in approximatelytwice as many seropositive (27 men, 30.7%) asseronegative subjects (15 men, 14.9%). By contrast,the conventional neuropsychological measures detectedpoorer performance by only 21 seropositive (23.9%)and 18 seronegative men (17.8%) after six months.
In a study of 42 patients with mild to moderate AIDSdementia, Worth et al (1993) found that patients withAIDS dementia performed significantly worse than acontrol group of 33 healthy subjects an all four of thereaction time measures in the Abbreviated CALCAPbattery. The two measures of sequential reaction timewere found to be the best tasks for discriminatingbetween patients and controls and for discriminatingamong different levels of severity of dementia.
2-1
INSTALLATION
What You Need
The California Computerized Assessment Packagerequires an PC-compatible computer running MS-DOS® (any version) or Windows®. The programworks correctly with Intel 80286 microprocessors orfaster (80386, 80486, etc.), but cannot time thestimulus materials correctly on slower computers(8086, 8088). In addition, the program requires:
C 1 MB minimum memoryC Hard Disk Drive with 2 MB of free spaceC 80-column color display (CGA, EGA, VGA or
better) or Active Matrix (TFT) color laptopC DOS 3.1 or greaterC Any printer (optional)
*Note: VGA adaptor cards and monitors provideimproved picture quality relative to CGA and EGAmonitors. The CALCAP stimulus materials weredeveloped so that they appear almost identical acrossthese different monitors. The visual clarity andreadability of the task instructions, however, issignificantly better on VGA monitors. Normativedata for this program were collected using 14-inchEGA and VGA monitors. There were no differencesin reaction times or signal detection parameters as afunction of the type of monitor used.
Potential Conflicts with Other Software
The California Computerized Assessment Packagerequires full access to the microprocessor in yourcomputer for accurate timing. The CALCAPprogram works correctly with most implementationsof Microsoft Windows®, but only when runninginside of a DOS virtual machine. The current versionof the CalCAP sets up the necessary software to runwithin a virtual machine, so long as you always startit from the Windows "Start" menu. Note that whilethe CALCAP program is running, all other Windowsfunctions (such as switching from one task toanother or viewing programs within windows) willbe disabled.You cannot print directly from theCalCAP program when it is running underWindows. Once you return to the Windows
environment you will be able to print out theCalCAP results.
Installing the California ComputerizedAssessment Package (CALCAP)
on Your Hard Disk
Before you use the CALCAP program you need toinstall it. The program and data files for theCALCAP program are in a compressed format andmust be installed using one of the two proceduresdetailed below.
The CALCAP program requires a hard disk forproper execution. Your hard disk should have atleast 2 MB of free disk space.
Windows Installation Procedures
1. Download the current Windows version of theCalCAP program from the internet.
2. Run the downloaded program file by clicking onit.
3. The installation program will transfer all of thefiles for the CalCAP program into a subdirectory(\CALCAP7) on Drive C. You can install aforeign language version of the CalCAP usingprocedures described later in this chapter.
4. To start the CalCAP program, locate theCalCAP program in the Windows Start Menuand then click on the CalCAP icon. You will seea list of all of the installed versions of theCalCAP program, and a DOS prompt (C:\>).Type the name of the program you wish to run atthe DOS prompt, then press the Enter key. Formore information about the different CalCAProutines, see Chapter 4: Task Administration.
5. When the CalCAP program is finished, you will
be returned to the DOS prompt (C:\>). Type'EXIT' to return to Microsoft Windows.
2-2
DOS Installation Procedures
To install the CALCAP Program:
1. Start your computer and stay in the rootdirectory of your hard disk. The DOS prompt willprobably be C:> but may differ depending on yourparticular computer.
2. Download the DOS version of the CalCAPsoftware from the internet and save it on your harddrive or a floppy disk.
3. To start the installation process from a floppydisk, type:
A:INSTALL
and then press the [Enter] key (or, use B:INSTALLif installing from Drive B).
The installation screen will suggest C:\CALCAP asthe default drive and subdirectory. If you would liketo install the program to a different hard disk or to asubdirectory other than CalCAP, edit the destinationshown on the installation screen.
You cannot use nested subdirectories such asMYDIR\CALCAP during the initial installation,though you can copy the CALCAP files to anydirectory after they have been transferred to yourhard disk.
4. Unless you specify otherwise, the installationprogram will transfer all of the files for theCALCAP program into a subdirectory (\CALCAP)on Drive C.
5. At the end of the installation procedure, theinstallation routine will look to see if you have anolder version of the CalCAP already installed in thissubdirectory. If so, it will ask some additionalquestions about updating your CalCAP files (see"Installing an Updated Version of the CalCAPProgram" below).
6. If the installation routine does not detect anolder version of the CalCAP program, it will list allcurrently available CalCAP routines and exit to theDOS prompt. You can then type in the name of theCalCAP routine that you would like to run (seeChapter 4: Task Administration).
Installing an Updated Version of theCalCAP Program
The CALCAP installation program automaticallydetects and updates earlier versions of the CALCAPsoftware.
If the installation routine detects an old version ofthe CALCAP program, you will see some additionalmessages at the end of the installation procedure (forthe DOS installation disk), or the first time that youclick on the CalCAP icon (for the Win 95/98installation). These additional messages aredescribed below:
C An older version of CALCAP has been detected. Shall I delete the old program files? Yes (No) [Default is Yes]
There is no reason to keep the old program filessince they cannot be used with the updatedversion of the CALCAP program and will notfunction correctly after the new CALCAPprocedures have been installed.
C Would you like to keep yourcustomized Site Identificationcodes? Yes (No) [Default is Yes]
This question is asked only if you havecustomized the Site Identification codes byusing the RTCONFIG program (describedbelow). Answer 'Y' if you would like to retainany unique Site Identification codes that youmay have assigned previously.
C There are one or more batchfiles that need to be updated. Would you like to have thesefiles updated so that they canbe used with the new version ofthe CALCAP program? Yes (No)[Default is Yes]
This question is asked only if the installationprocedure finds batch files that use the oldversion of the CALCAP program. Answering 'Y'will save you considerable time by editing yourcustomized batch files and substituting the newname for the latest version of the CALCAPprogram.
2-3
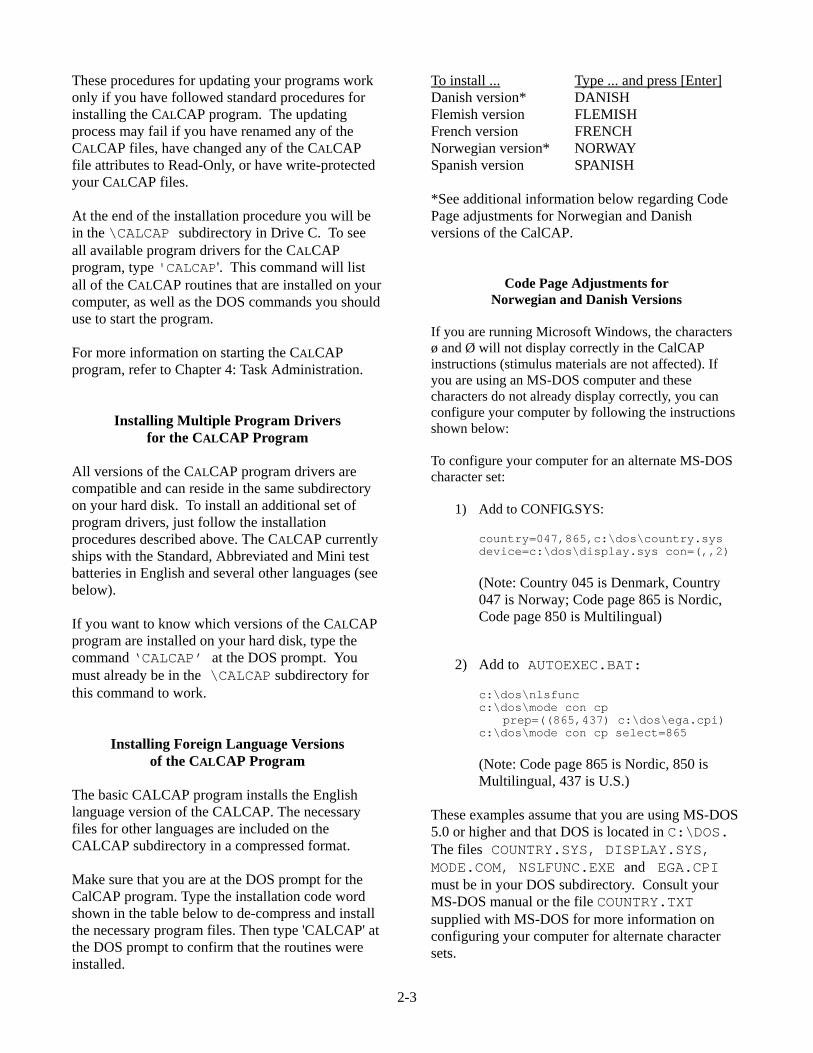
These procedures for updating your programs workonly if you have followed standard procedures forinstalling the CALCAP program. The updatingprocess may fail if you have renamed any of theCALCAP files, have changed any of the CALCAPfile attributes to Read-Only, or have write-protectedyour CALCAP files.
At the end of the installation procedure you will bein the \CALCAP subdirectory in Drive C. To seeall available program drivers for the CALCAPprogram, type 'CALCAP'. This command will listall of the CALCAP routines that are installed on yourcomputer, as well as the DOS commands you shoulduse to start the program.
For more information on starting the CALCAPprogram, refer to Chapter 4: Task Administration.
Installing Multiple Program Driversfor the CALCAP Program
All versions of the CALCAP program drivers arecompatible and can reside in the same subdirectoryon your hard disk. To install an additional set ofprogram drivers, just follow the installationprocedures described above. The CALCAP currentlyships with the Standard, Abbreviated and Mini testbatteries in English and several other languages (seebelow).
If you want to know which versions of the CALCAPprogram are installed on your hard disk, type thecommand ‘CALCAP’ at the DOS prompt. Youmust already be in the \CALCAP subdirectory forthis command to work.
Installing Foreign Language Versionsof the CALCAP Program
The basic CALCAP program installs the Englishlanguage version of the CALCAP. The necessaryfiles for other languages are included on theCALCAP subdirectory in a compressed format.
Make sure that you are at the DOS prompt for theCalCAP program. Type the installation code wordshown in the table below to de-compress and installthe necessary program files. Then type 'CALCAP' atthe DOS prompt to confirm that the routines wereinstalled.
To install ... Type ... and press [Enter]Danish version* DANISHFlemish version FLEMISHFrench version FRENCHNorwegian version* NORWAYSpanish version SPANISH
*See additional information below regarding CodePage adjustments for Norwegian and Danishversions of the CalCAP.
Code Page Adjustments forNorwegian and Danish Versions
If you are running Microsoft Windows, the charactersø and Ø will not display correctly in the CalCAPinstructions (stimulus materials are not affected). Ifyou are using an MS-DOS computer and thesecharacters do not already display correctly, you canconfigure your computer by following the instructionsshown below:
To configure your computer for an alternate MS-DOScharacter set:
1) Add to CONFIG.SYS:
country=047,865,c:\dos\country.sysdevice=c:\dos\display.sys con=(,,2)
(Note: Country 045 is Denmark, Country047 is Norway; Code page 865 is Nordic,Code page 850 is Multilingual)
2) Add to AUTOEXEC.BAT:
c:\dos\nlsfuncc:\dos\mode con cp
prep=((865,437) c:\dos\ega.cpi)c:\dos\mode con cp select=865
(Note: Code page 865 is Nordic, 850 isMultilingual, 437 is U.S.)
These examples assume that you are using MS-DOS5.0 or higher and that DOS is located in C:\DOS. The files COUNTRY.SYS, DISPLAY.SYS,MODE.COM, NSLFUNC.EXE and EGA.CPImust be in your DOS subdirectory. Consult yourMS-DOS manual or the file COUNTRY.TXTsupplied with MS-DOS for more information onconfiguring your computer for alternate charactersets.
2-4
Site Identification Codes
If you are using the CALCAP program at more thanone location you may want to assign unique siteidentification codes for each location. TheRTCONFIG program allows you to enter a 28-character site identification descriptor and a 2-digitsite number (01-99). To change the current defaults,type 'RTCONFIG' while in the \CALCAPsubdirectory.
Note: The RTCONFIG program also lists theversion numbers of the CALCAP programs andreaction time routines. These values are providedfor informational purposes only. You cannot useRTCONFIG to change any of the version numbers.
Removing Old Versions of theCALCAP Program
If you are upgrading to a newer version of theCALCAP program the installation routine willautomatically remove any old program files. Tostart the installation process, follow the instructionsdetailed under Installing the CaliforniaComputerized Assessment Package (CALCAP) onYour Hard Disk.
If you are not installing a new version of theCALCAP program you can still remove the oldprogram files without damaging the data files.
If you installed the program using Windowsprocedures, just choose Uninstall from the CalCAPmenu found by clicking “Start” -> “Programs”.
If you installed the program using the DOSinstallation procedures, you can remove old programfiles by using the 'REMOVE' program included onyour DOS distribution diskette.
For example, if your new CALCAP diskette is inDrive A and your \CALCAP subdirectory is onDrive C, you would type:
A:REMOVE C:\CALCAP
[If you need to use a different floppy disk drive or a different harddisk you would change the drive letters A and/or C shown above.]
This procedure will remove all old versions of theCALCAP program but will not remove any subjectdata.
Technical Notes: The 'REMOVE' program deletesmost executable and batch files from the \CALCAPsubdirectory. If you have installed programs otherthan the CALCAP routines in the \CALCAPsubdirectory these programs should be moved toanother subdirectory before using the 'REMOVE'program.
If you want to erase the old CALCAP programmanually, you should be careful to save any subjectdata. DO NOT erase all of the files in your\CALCAP subdirectory since all of the files with a'.DAT' suffix contain subject data.
3-1
CALCAP TEST MATERIALS
The CALCAP battery is available in Standard (20-25mins) and Abbreviated (8-10 mins) versions, or can becustomized to meet specific clinical or research needs.Final scoring and intermediate feedback are availableusing age- and education-specific norms based on 641men, ages 21 to 58.
Standard EditionTest Duration: 20-25 minutes
The Standard program drivers for the CA LCAPprogram were developed by Eric N. Miller, Ph.D. andPaul Satz, Ph.D. The stimulus materials assess a broadrange of cognitive functions, including brief, sustainedand divided attention, rapid visual scanning, formdiscrimination and language skills:
C Simple Reaction Time. Subjects are asked topress a key as soon as they see anything at all onthe screen. This procedure provides a basalmeasure of reaction time. This task is given at thebeginning, middle and end of the computerizedprocedures to allow the examiner to assess fatigueeffects.
C Choice Reaction Time for Single Digits.Subjects are asked to press a key as soon as theysee a specific number such as '7', otherwise theyare to do nothing. This procedure adds a simpleelement of memory to the task.
C Serial Pattern Matching (Sequential ReactionTime). Subjects are asked to press a key onlywhen they see two of the same number insequence, for example, if they see the number '3'followed by a second occurrence of the number'3'. This procedure adds a more complex elementof memory since the subject must keep in mind thelast number that was seen.
C Lexical Discrimination. Subjects are asked topress a key when they see a word which fits into
a specific category such as animal names (suchas, 'COW' or 'HORSE'), but not when they see aword which fits into a category of non-animals(such as 'DESK' or 'FOOD'). This procedureintroduces an additional level of language skills byrequiring meaningful differentiation betweensemantic categories. The task requires rapidlanguage processing and should be sensitive to anydisruption in language skills.
C Visual Selective Attention. Subjects are asked topress a key as soon as they see a specific wordsuch as 'SEVEN' in the center of the screen. Anadditional set of the words are displayed aroundthe periphery of the target stimulus located in thecenter of the screen. These distractors requirethat the subject focus his or her attention muchmore narrowly.
C Response Reversal and Rapid Visual Scanning.This task is identical to task 5 described above, butthe subject must ignore the stimuli presented in themiddle of the screen while responding to targetstimuli displayed around the periphery of thecomputer screen. This task taps into the subject'sability to change cognitive set from the previoustask, and requires more rapid visual scanningacross the entire display screen.
C Form Discrimination. Subjects are shown threegeometric figures simultaneously and asked topress a key only when two of the figures areidentical. This task requires rapid comparison ofnon-nameable forms, and, because of the briefexposure time, may measure the subject's ability toretain an iconic memory of the figures.
3-2
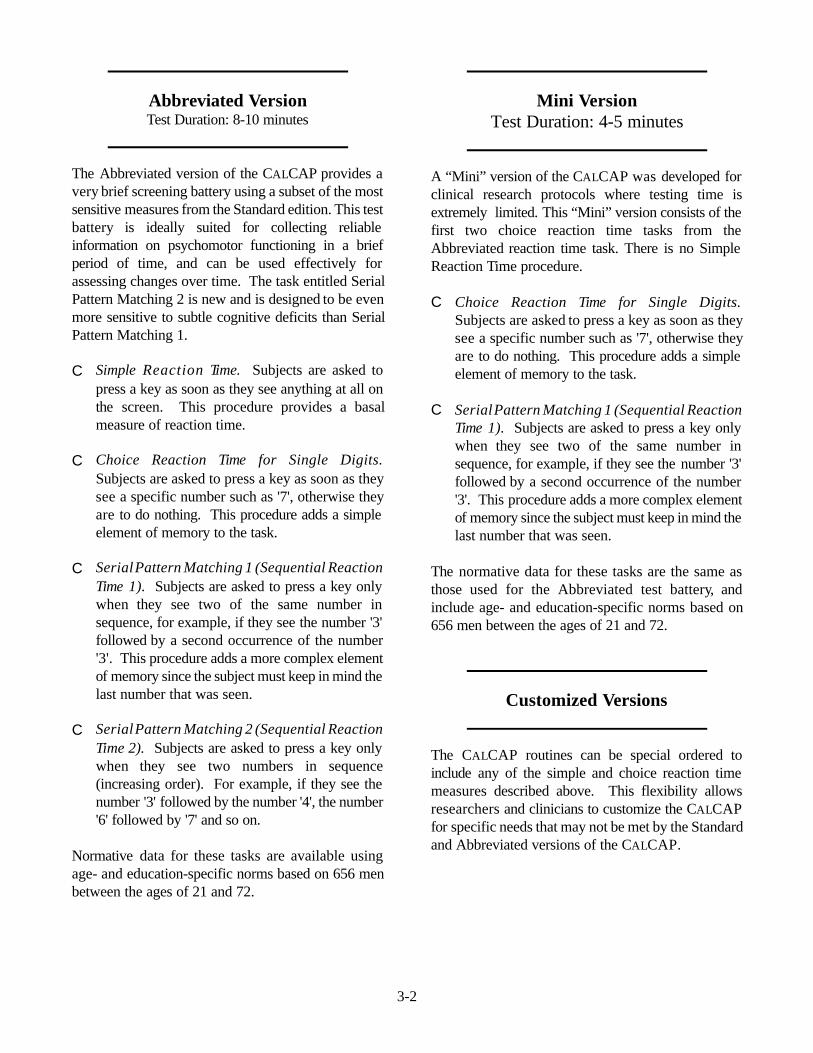
Abbreviated VersionTest Duration: 8-10 minutes
The Abbreviated version of the CALCAP provides avery brief screening battery using a subset of the mostsensitive measures from the Standard edition. This testbattery is ideally suited for collecting reliableinformation on psychomotor functioning in a briefperiod of time, and can be used effectively forassessing changes over time. The task entitled SerialPattern Matching 2 is new and is designed to be evenmore sensitive to subtle cognitive deficits than SerialPattern Matching 1.
C Simple Reaction Time. Subjects are asked topress a key as soon as they see anything at all onthe screen. This procedure provides a basalmeasure of reaction time.
C Choice Reaction Time for Single Digits.Subjects are asked to press a key as soon as theysee a specific number such as '7', otherwise theyare to do nothing. This procedure adds a simpleelement of memory to the task.
C Serial Pattern Matching 1 (Sequential ReactionTime 1). Subjects are asked to press a key onlywhen they see two of the same number insequence, for example, if they see the number '3'followed by a second occurrence of the number'3'. This procedure adds a more complex elementof memory since the subject must keep in mind thelast number that was seen.
C Serial Pattern Matching 2 (Sequential ReactionTime 2). Subjects are asked to press a key onlywhen they see two numbers in sequence(increasing order). For example, if they see thenumber '3' followed by the number '4', the number'6' followed by '7' and so on.
Normative data for these tasks are available usingage- and education-specific norms based on 656 menbetween the ages of 21 and 72.
Mini VersionTest Duration: 4-5 minutes
A “Mini” version of the CALCAP was developed forclinical research protocols where testing time isextremely limited. This “Mini” version consists of thefirst two choice reaction time tasks from theAbbreviated reaction time task. There is no SimpleReaction Time procedure.
C Choice Reaction Time for Single Digits.Subjects are asked to press a key as soon as theysee a specific number such as '7', otherwise theyare to do nothing. This procedure adds a simpleelement of memory to the task.
C Serial Pattern Matching 1 (Sequential ReactionTime 1). Subjects are asked to press a key onlywhen they see two of the same number insequence, for example, if they see the number '3'followed by a second occurrence of the number'3'. This procedure adds a more complex elementof memory since the subject must keep in mind thelast number that was seen.
The normative data for these tasks are the same asthose used for the Abbreviated test battery, andinclude age- and education-specific norms based on656 men between the ages of 21 and 72.
Customized Versions
The CALCAP routines can be special ordered toinclude any of the simple and choice reaction timemeasures described above. This flexibility allowsresearchers and clinicians to customize the CALCAPfor specific needs that may not be met by the Standardand Abbreviated versions of the CALCAP.
4-1
TASK ADMINISTRATION
Setting Up the Room
It is important that the subject be able to see thescreen clearly during the task. Make sure that theback of the computer monitor is slightly elevated toreduce glare from any overhead lights. If necessary,lights should be dimmed or a glare screen should beplaced over the computer screen.
Starting the CALCAP Program
From Windows: Select Start û Programs ûCalCAP and then click on the CalCAP icon.
From DOS: Switch to the \CALCAP subdirectoryon your hard disk, then type 'CalCAP'. For example,if CALCAP is installed on Drive C you would type:
C:CD \CALCAPCALCAP
For Windows or DOS: From this point on theprocedures are the same regardless of whether youstarted from Windows or from DOS. You will see alisting of all versions of the CALCAP program thatare installed on your computer.
DOS CommandsLanguage Standard Abbrev MiniEnglish RT ART MINIDanish DRT DART DMINIFlemish FLRTFrench FRRTNorwegian NORT NOART NMINISpanish SRT SART SMINI
Type the appropriate ‘DOS Command’ for theprogram you want to use, then press [Enter]. Theprogram checks to make sure it has exclusive use ofthe computer, then performs several brief initialization routines lasting approximately 30seconds.
These procedures compute the speed of yourcomputer's microprocessor so that timing can beaccurately controlled for the reaction time stimulusmaterials.
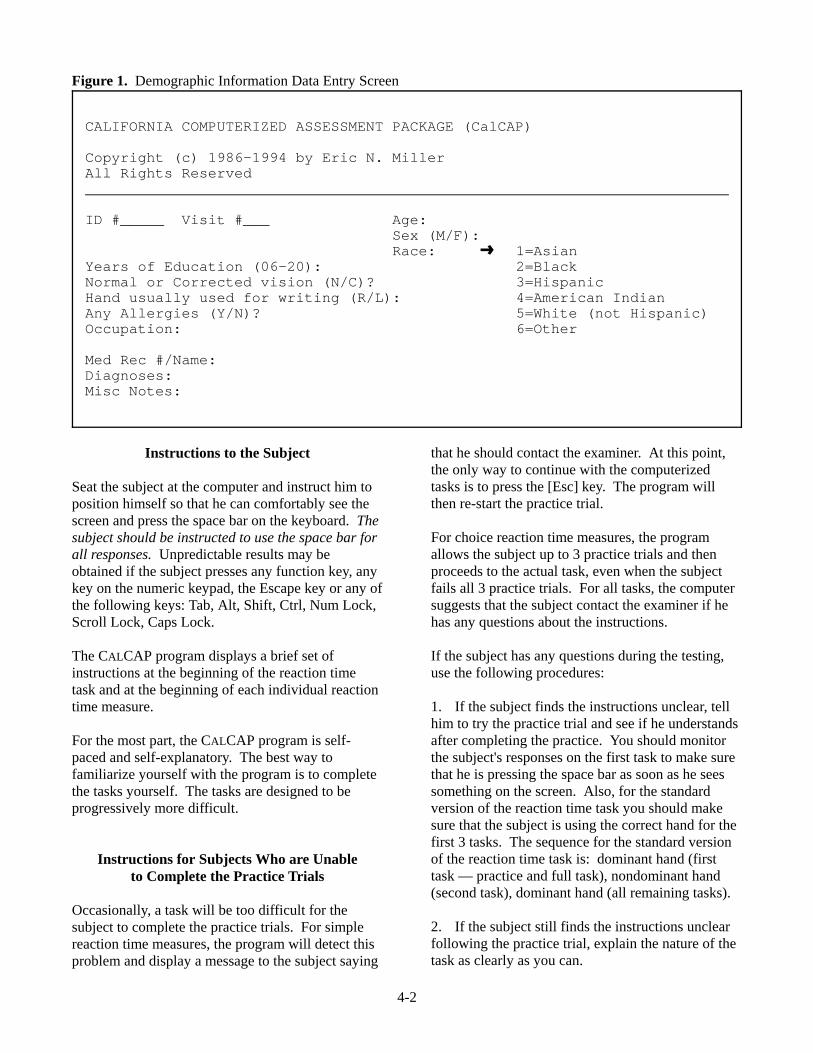
Entering Identification Numbersand Demographic Information
The first data entry screen prompts you for anidentification number for the subject (see Figure onnext page). To ensure accurate data entry, you willbe asked to enter the subject number twice. Subjectnumbers can be composed of the letters A-Z andnumbers 0-9, but cannot be longer than 5 characters. One of the best methods for creating unique subjectnumbers is to use the patient's initials plus the day ofthe month. For example, the code for Eric N. Millertested on November 21st would be 'ENM21'. Thismethod will usually create unique numbers. If datahave been entered during the past month using thissame ID number the CALCAP program will warnyou that the ID number already exists. If thishappens, you should select a different ID number(perhaps by using a different day of the month).
After entering the subject number you will beprompted to enter a variety of demographic andmedical information. All of this information isoptional, although age and years of education areused to select appropriate normative data forevaluating the subject's responses. These data arerecorded on diskette and are included in the finalreport of the subject's results.
Once you have entered the subject number and allnecessary demographic information, press the [Esc]key to display a brief set of instructions for thesubject.
4-2
CALIFORNIA COMPUTERIZED ASSESSMENT PACKAGE (CalCAP)
Copyright (c) 1986-1994 by Eric N. MillerAll Rights Reserved
ID #_____ Visit #___ Age: Sex (M/F): Race: º 1=AsianYears of Education (06-20): 2=BlackNormal or Corrected vision (N/C)? 3=HispanicHand usually used for writing (R/L): 4=American IndianAny Allergies (Y/N)? 5=White (not Hispanic)Occupation: 6=Other
Med Rec #/Name:Diagnoses:Misc Notes:
Figure 1. Demographic Information Data Entry Screen
Instructions to the Subject
Seat the subject at the computer and instruct him toposition himself so that he can comfortably see thescreen and press the space bar on the keyboard. Thesubject should be instructed to use the space bar forall responses. Unpredictable results may beobtained if the subject presses any function key, anykey on the numeric keypad, the Escape key or any ofthe following keys: Tab, Alt, Shift, Ctrl, Num Lock,Scroll Lock, Caps Lock.
The CALCAP program displays a brief set ofinstructions at the beginning of the reaction timetask and at the beginning of each individual reactiontime measure.
For the most part, the CALCAP program is self-paced and self-explanatory. The best way tofamiliarize yourself with the program is to completethe tasks yourself. The tasks are designed to beprogressively more difficult.
Instructions for Subjects Who are Unableto Complete the Practice Trials
Occasionally, a task will be too difficult for thesubject to complete the practice trials. For simplereaction time measures, the program will detect thisproblem and display a message to the subject saying
that he should contact the examiner. At this point,the only way to continue with the computerizedtasks is to press the [Esc] key. The program willthen re-start the practice trial.
For choice reaction time measures, the programallows the subject up to 3 practice trials and thenproceeds to the actual task, even when the subjectfails all 3 practice trials. For all tasks, the computersuggests that the subject contact the examiner if hehas any questions about the instructions.
If the subject has any questions during the testing,use the following procedures:
1. If the subject finds the instructions unclear, tellhim to try the practice trial and see if he understandsafter completing the practice. You should monitorthe subject's responses on the first task to make surethat he is pressing the space bar as soon as he seessomething on the screen. Also, for the standardversion of the reaction time task you should makesure that the subject is using the correct hand for thefirst 3 tasks. The sequence for the standard versionof the reaction time task is: dominant hand (firsttask –– practice and full task), nondominant hand(second task), dominant hand (all remaining tasks).
2. If the subject still finds the instructions unclearfollowing the practice trial, explain the nature of thetask as clearly as you can.
4-3
3. If the subject is still unable to understand thetask following three practice trials, the CALCAPprogram will automatically move on to the full task. If necessary you can skip the task by pressing the[Esc] key followed by the [Tab] key when thecomputer says "Press the space bar twice tocontinue".
Feedback During the CALCAP Task
If feedback has been selected (as in the standardversion of the CALCAP program), the computer willgive the subject feedback on his performancerelative to other subjects of the same age andeducation. It is not possible to change the feedbacksetting while the CALCAP program is in progress.
Feedback can be permanently enabled or disabled ifnecessary. See 'Special Configurations for theCALCAP Program' elsewhere in this document.
Controlling the Music
In the standard version of the CALCAP program thecomputer plays a brief tune at the end of each of theChoice Reaction Time measures.
You can turn off the music in the middle of theCALCAP program by pressing '0' (zero) twice whenthe program asks for the subject to 'Press the spacebar twice to continue'. Use the '0' key at the top ofthe keyboard rather than on the numeric keypad. Music can be turned on by pressing '1' (one) insteadof '0' (zero).
The default setting for music can be permanentlyenabled or disabled. See 'Special Configurations forthe CALCAP Program' elsewhere in this document.
Skipping Specific Tasks
If you need to skip one specific task, you can do soby pressing the [Esc] key, then pressing the [Tab]key.
Note: If the computer is waiting for you to 'Press thespace bar twice to continue' this procedure will workquickly. If you attempt to skip a task that hasalready started, however, you will need to wait for abeep after pressing the [Esc] key. Within simple
reaction time tasks it may take several seconds forthe system to respond after you press [Esc]. Withinchoice reaction time tasks you may need to press the[Esc] key more than once before the computer willrespond.
Aborting the CALCAP Program
If you need to abort the CALCAP program for anyreason, you can do so by pressing the [Esc] key andthen pressing the [Backspace] key.
Note: If the computer is waiting for you to 'Press thespace bar twice to continue' this procedure will workquickly. If you attempt to abort the CALCAPprogram from within a reaction time task, however,you will need to wait for a beep after pressing the[Esc] key. Within simple reaction time tasks it maytake several seconds for the system to respond afteryou press [Esc]. Within choice reaction time tasksyou may need to press the [Esc] key more than oncebefore the computer will respond.
In a real emergency, you can exit from the programby pressing Ctrl-Alt-Del, or by turning the computeroff. These methods have the potential for causingdamage to the procedures for recording data andshould be used only when the system refuses torespond to any keyboard input.
End of the CALCAP Program
At the end of the CALCAP program the keyboardappears to ''freeze'' so that the subject will notaccidentally view the summary of exam results.
Viewing Exam Results
Following completion of the computerized tasks, asummary of the test results is immediately available. After the subject leaves the room, press the [Esc]key to move to the next screen. On slowercomputers it may take from 20 to 40 seconds afterpressing [Esc] before the exam summary appears onthe screen.
The CalCAP program provides several pages of testresults: (1) a Summary of all abnormal test results;(2) a Graphical representation of Mean ReactionTimes and True Positive responses; (3) Mean and
4-4
Median Reaction Times; (4) Difference Scores fordeviation from baseline simple and choice reactiontime tests; (5) True Positive and False Positivescores; and (6) the A’ population estimate of theSignal Detection parameter d’.
You can move from one screen to the next bypressing the space bar. Most of these results includez-scores and percentile ranks based on age andeducation level. In addition to the informationpresented on the screen, additional recommendationsfor interpretation of exam results are printed if yourequest a hard copy of the results.
Printing the Results
The DOS version of the CalCAP will send resultsdirectly to a printer if you press the letter ‘P’ whilethe results are displayed.
The Windows version of the CalCAP runs in avirtual machine that cannot send information directlyto your printer. Instead, the CalCAP results areautomatically sent to a file (REVIEW.TXT) that canbe read by the Windows Notepad program. Theeasiest way to open REVIEW.TXT is by choosingthe ‘Print Results’ icon from the CalCAP folder inthe Start Menu (Start -> All Programs -> CalCAP ->Print Results). Once the results are displayed inNotepad you can print them as you would with anyother Windows program.
Note: The current default directory for the WindowsCalCAP is C:\CalCAP7. Earlier versions, however,may have installed the program in C:\ProgramFiles\CalCAP7 or C:\Program Files (x86)\CalCAP7.The ‘Print Results’ icon will search forREVIEW.TXT in all of these locations, as well asseveral hidden locations that are sometimes used byWindows 7 and Windows 8. If you are havingdifficulty finding the REVIEW.TXT file (or any ofthe CalCAP data files), contact Eric Miller [email protected].
Re-Starting the CALCAP Program
You can avoid the 30-second initialization process atthe beginning of the CALCAP program by re-startingthe program from the Results screen. Simply pressthe letter 'R' to restart the program.
Exiting the Program
If you want to exit from the Results screen, simplypress the [Esc] key.
If you want to exit at the prompt for ID number,press Alt-X (hold down the Alt key and press X).
If you want to exit in the middle of the CALCAPprogram, follow the procedures for 'Aborting theCALCAP Program' described above.
All of the procedures described above will returnyou to the DOS command prompt. If you started theprogram from Windows and would like to return toWindows, type ‘EXIT’ then press the Enter key.
Reviewing Results at a Later Time
The CalCAP program stores a copy of all datacollected during the task in a file called‘subjn-xx.DAT' where ‘subjn' is the subject numberentered at the beginning of the program and ‘xx' isthe number of times the person has been tested.
From Windows: Double-click on the Review icon inthe CalCAP folder, or, from the Start Menu, selectStart û Programs û CalCAP and then click on theReview icon. You will then need to select theappropriate subject ID from a list of all availablesubject data.
If you want to review the last set of test results, youcan just click on the ‘Print Results’ icon in theCalCAP folder (Start -> Programs -> CalCAP ->Print Results).
From the DOS prompt: You can review exam resultsby typing ‘Review’ or ‘Review subjn’ at the systemprompt. (Note: You must already be in the\CALCAP subdirectory before using this command.)
Printing Results Using theClassic (1986-1998) CalCAP Print Format
DOS Version of the CalCAP Only
If you want to see the 3-page printout format thatwas used up through mid-1998, you can togglebetween the new and old formats by pressing “C”(for Classic style) while the test results are displayed
4-5
on the screen. This alternate format can only beprinted using the DOS version of the CalCAP. Itcannot be stored in REVIEW.TXT for use by theWindows version of the CalCAP.
If you are using the DOS version of the CalCAP anddecide that you prefer the old printout format, youcan make the “Classic” style the default byswitching to the CalCAP subdirectory and thentyping ‘PRINTOLD’ at the DOS prompt. If you laterdecide that you prefer to keep the New printout styleas the default, you can go back by switching to theCalCAP subdirectory and then typing ‘PRINTNEW’at the DOS prompt.
Troubleshooting Your Printer
The Windows version of the CalCAP runs in avirtual machine that cannot send information directlyto your printer. Instead, the CalCAP results areautomatically sent to a file (REVIEW.TXT) that canbe read by the Windows Notepad program. Theeasiest way to open REVIEW.TXT is by choosingthe ‘Print Results’ icon from the CalCAP folder inthe Start Menu (Start -> All Programs -> CalCAP ->Print Results). Once the results are displayed inNotepad you can print them as you would with anyother Windows program.
Note: The current default directory for the WindowsCalCAP is C:\CalCAP7. Earlier versions, however,may have installed the program in C:\ProgramFiles\CalCAP7 or C:\Program Files (x86)\CalCAP7.The ‘Print Results’ icon will search forREVIEW.TXT in all of these locations, as well asseveral hidden locations that are sometimes used byWindows 7 and Windows 8. If you are havingdifficulty finding the REVIEW.TXT file (or any ofthe CalCAP data files), contact Eric Miller [email protected].
5-1
INTERPRETATION OF REACTION TIME RESULTS
Overview
At the completion of testing, the CALCAP programdisplays a summary of all of the exam results on asingle screen, showing those tests, if any, on whichthe subject performed abnormally (see Figure 1).
An additional five screens of detailed test results areavailable by pressing the space bar to cycle througha graphical summary of the reaction times and truepositive responses; a detailed summary of mean andmedian reaction times; difference scores; accuracyindices including true and false positive responses;and signal detection parameters.
The exam results are automatically sent to a file(REVIEW.TXT) which can be accessed for printingafter you return to the Windows environment (Start–> Programs –> CalCAP –> Print Results).Additional information about test interpretation isincluded when you print the REVIEW.TXT file. Asample printout is shown in Appendix B.
Note: If you are using the original DOS version ofthe CalCAP, you can send results to a printer bypressing ‘P’ while the results are displayed.
How the CalCAP Selects NormativeComparison Samples
The CALCAP program compares each subject'sresponses with normative data matched (whenpossible) by age and education. The originalnormative sample consisted of over 600 menbetween the ages of 21 to 59, with a meaneducational level of a college degree. Additionalnormative data are available, and most of these dataare summarized in Appendix A. For the purposes ofthe CalCAP printouts, however, only the originalnormative sample is used to compute z-scores andpercentile ranks. Normative data are stratified byboth age (20-34, 35-44, 45+) and education (< 16years, 16 years, > 16 years).
Subjects who are not within the age groupings of thenormative sample are evaluated based on means and
standard deviations for all subjects within theireducational stratum. If years of education aremissing, subjects are evaluated using means andstandard deviations for all subjects within their agestratum. If age and education data are missing or outof range, subjects are evaluated using means andstandard deviations for all subjects within thenormative sample.
Sociodemographic Factors ThatMay Influence Reaction Time
Reaction time correlates most highly with age, and,to a lesser extent, with years of education. A studyof the effects of age, education and ethnicity isreprinted in Appendix F. Two small studies ofgender effects on CalCAP reaction time have shownno differences between men and women on any ofthe CalCAP indices. Normative data from one ofthese studies, stratified by gender, are included inAppendix A.
Understanding the Results:A Page by Page Interpretation Guide
Each of the six pages of the CalCAP printout isdescribed in detail below and are illustrated in theaccompanying figures. A complete sample printoutis shown in Appendix B. For all printouts, resultsthat are outside of normal limits are tagged with one,two or three asterisks to represent performance 1.5,2.0 or 3.0 SDs below the mean of the normativesample. The notation “Skipped” indicates that someor all of the subtest was skipped by the user.“Custom” indicates that the subtest is Custom-designed and cannot be compared with the originalCalCAP normative data set.
5-2
CALIFORNIA COMPUTERIZED ASSESSMENT PACKAGE (CalCAP)
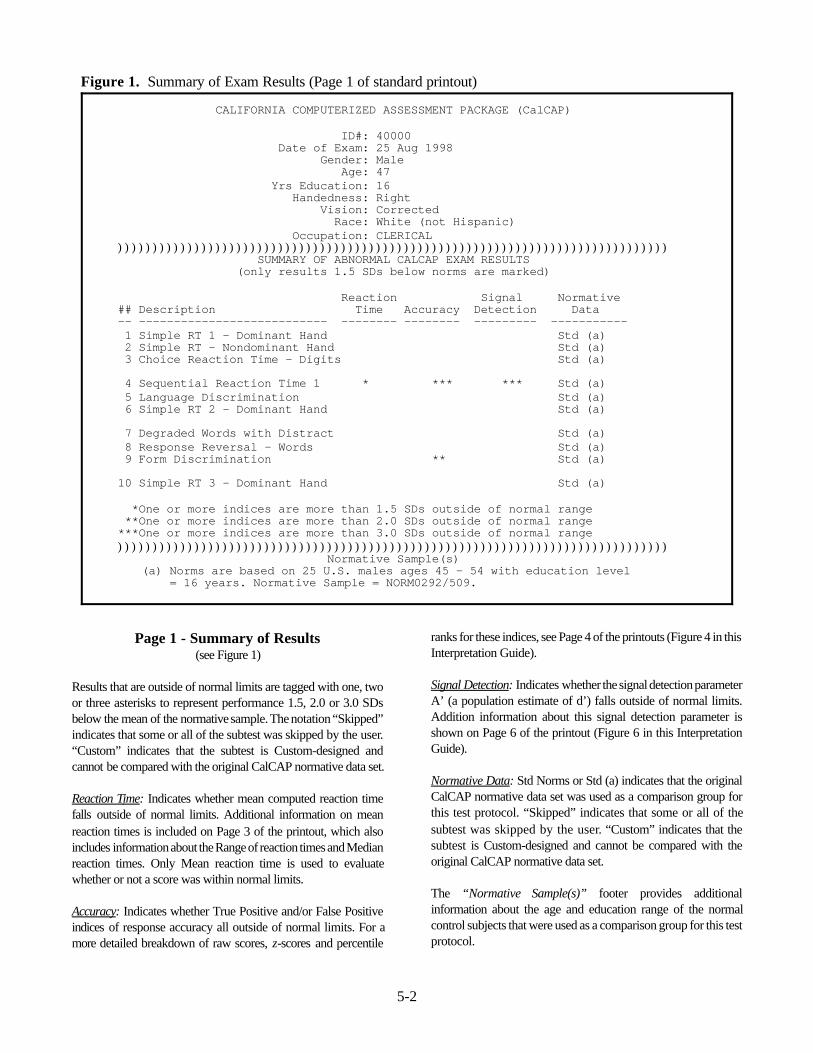
ID#: 40000 Date of Exam: 25 Aug 1998 Gender: Male Age: 47 Yrs Education: 16 Handedness: Right Vision: Corrected Race: White (not Hispanic) Occupation: CLERICAL ))))))))))))))))))))))))))))))))))))))))))))))))))))))))))))))))))))))))))))))) SUMMARY OF ABNORMAL CALCAP EXAM RESULTS (only results 1.5 SDs below norms are marked)
Reaction Signal Normative## Description Time Accuracy Detection Data -- --------------------------- -------- -------- --------- ----------- 1 Simple RT 1 - Dominant Hand Std (a) 2 Simple RT - Nondominant Hand Std (a) 3 Choice Reaction Time - Digits Std (a)
4 Sequential Reaction Time 1 * *** *** Std (a) 5 Language Discrimination Std (a) 6 Simple RT 2 - Dominant Hand Std (a)
7 Degraded Words with Distract Std (a) 8 Response Reversal - Words Std (a) 9 Form Discrimination ** Std (a)
10 Simple RT 3 - Dominant Hand Std (a)
*One or more indices are more than 1.5 SDs outside of normal range **One or more indices are more than 2.0 SDs outside of normal range***One or more indices are more than 3.0 SDs outside of normal range))))))))))))))))))))))))))))))))))))))))))))))))))))))))))))))))))))))))))))))) Normative Sample(s)
(a) Norms are based on 25 U.S. males ages 45 - 54 with education level = 16 years. Normative Sample = NORM0292/509.
Figure 1. Summary of Exam Results (Page 1 of standard printout)
Page 1 - Summary of Results(see Figure 1)
Results that are outside of normal limits are tagged with one, twoor three asterisks to represent performance 1.5, 2.0 or 3.0 SDsbelow the mean of the normative sample. The notation “Skipped”indicates that some or all of the subtest was skipped by the user.“Custom” indicates that the subtest is Custom-designed andcannot be compared with the original CalCAP normative data set.
Reaction Time: Indicates whether mean computed reaction timefalls outside of normal limits. Additional information on meanreaction times is included on Page 3 of the printout, which alsoincludes information about the Range of reaction times and Medianreaction times. Only Mean reaction time is used to evaluatewhether or not a score was within normal limits.
Accuracy: Indicates whether True Positive and/or False Positiveindices of response accuracy all outside of normal limits. For amore detailed breakdown of raw scores, z-scores and percentile
ranks for these indices, see Page 4 of the printouts (Figure 4 in thisInterpretation Guide).
Signal Detection: Indicates whether the signal detection parameterA’ (a population estimate of d’) falls outside of normal limits.Addition information about this signal detection parameter isshown on Page 6 of the printout (Figure 6 in this InterpretationGuide).
Normative Data: Std Norms or Std (a) indicates that the originalCalCAP normative data set was used as a comparison group forthis test protocol. “Skipped” indicates that some or all of thesubtest was skipped by the user. “Custom” indicates that thesubtest is Custom-designed and cannot be compared with theoriginal CalCAP normative data set.
The “Normative Sample(s)” footer provides additionalinformation about the age and education range of the normalcontrol subjects that were used as a comparison group for this testprotocol.
5-3
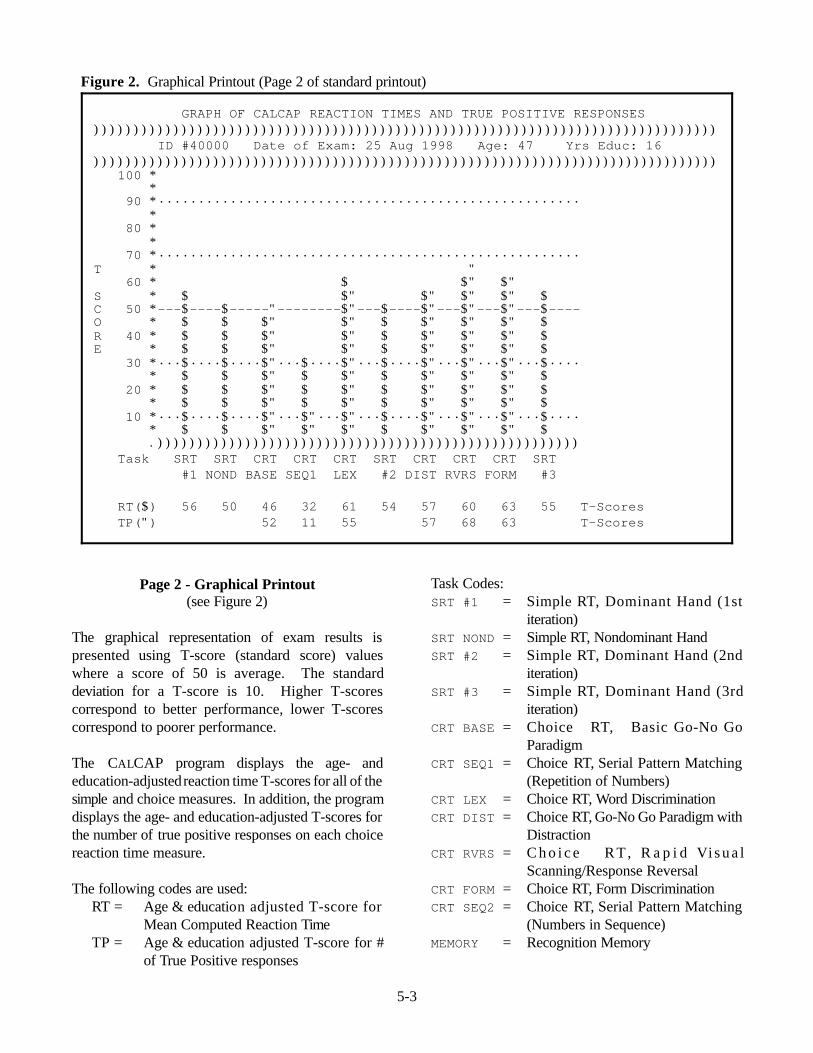
GRAPH OF CALCAP REACTION TIMES AND TRUE POSITIVE RESPONSES ))))))))))))))))))))))))))))))))))))))))))))))))))))))))))))))))))))))))))))))) ID #40000 Date of Exam: 25 Aug 1998 Age: 47 Yrs Educ: 16 ))))))))))))))))))))))))))))))))))))))))))))))))))))))))))))))))))))))))))))))) 100 * * 90 *····················································· * 80 * * 70 *·····················································T * " 60 * $ $" $" S * $ $" $" $" $" $ C 50 *---$----$-----"--------$"---$----$"---$"---$"---$----O * $ $ $" $" $ $" $" $" $ R 40 * $ $ $" $" $ $" $" $" $ E * $ $ $" $" $ $" $" $" $ 30 *···$····$····$"···$····$"···$····$"···$"···$"···$···· * $ $ $" $ $" $ $" $" $" $ 20 * $ $ $" $ $" $ $" $" $" $ * $ $ $" $ $" $ $" $" $" $ 10 *···$····$····$"···$"···$"···$····$"···$"···$"···$···· * $ $ $" $" $" $ $" $" $" $ .))))))))))))))))))))))))))))))))))))))))))))))))))))) Task SRT SRT CRT CRT CRT SRT CRT CRT CRT SRT #1 NOND BASE SEQ1 LEX #2 DIST RVRS FORM #3
RT($) 56 50 46 32 61 54 57 60 63 55 T-Scores TP(") 52 11 55 57 68 63 T-Scores
Figure 2. Graphical Printout (Page 2 of standard printout)
Page 2 - Graphical Printout(see Figure 2)
The graphical representation of exam results ispresented using T-score (standard score) valueswhere a score of 50 is average. The standarddeviation for a T-score is 10. Higher T-scorescorrespond to better performance, lower T-scorescorrespond to poorer performance.
The CALCAP program displays the age- andeducation-adjusted reaction time T-scores for all of thesimple and choice measures. In addition, the programdisplays the age- and education-adjusted T-scores forthe number of true positive responses on each choicereaction time measure.
The following codes are used: RT = Age & education adjusted T-score for
Mean Computed Reaction Time TP = Age & education adjusted T-score for #
of True Positive responses
Task Codes:SRT #1 = Simple RT, Dominant Hand (1st
iteration)SRT NOND = Simple RT, Nondominant HandSRT #2 = Simple RT, Dominant Hand (2nd
iteration)SRT #3 = Simple RT, Dominant Hand (3rd
iteration)CRT BASE = Choice RT, Basic Go-No Go
ParadigmCRT SEQ1 = Choice RT, Serial Pattern Matching
(Repetition of Numbers)CRT LEX = Choice RT, Word DiscriminationCRT DIST = Choice RT, Go-No Go Paradigm with
DistractionCRT RVRS = C h o i c e R T , R a p i d Vi s u a l
Scanning/Response ReversalCRT FORM = Choice RT, Form DiscriminationCRT SEQ2 = Choice RT, Serial Pattern Matching
(Numbers in Sequence)MEMORY = Recognition Memory
5-4
CALCAP REACTION TIMES ))))))))))))))))))))))))))))))))))))))))))))))))))))))))))))))))))))))))))))))) ID #40000 Date of Exam: 25 Aug 1998 Age: 47 Yrs Educ: 16 ))))))))))))))))))))))))))))))))))))))))))))))))))))))))))))))))))))))))))))))) Mean Reaction Time (RT)## Description Range Median RT z-score %ile-- ------------------------------ ------- ------ ------ ------- ---- 1 Simple RT 1 - Dominant Hand 283- 352 333 332 0.64 74% 2 Simple RT - Nondominant Hand 295- 428 343 351 0.03 51% 3 Choice Reaction Time - Digits 375- 502 427 426 -0.36 36%
4 Sequential Reaction Time 1 437- 853 853 712* -1.78 4% 5 Language Discrimination 382- 552 482 488 1.15 87% 6 Simple RT 2 - Dominant Hand 338- 868** 354 385 0.40 65%
7 Degraded Words with Distract 431- 669 515 503 0.68 75% 8 Response Reversal - Words 407- 757 613 601 1.05 85% 9 Form Discrimination 435-1133 607 613 1.27 90%
10 Simple RT 3 - Dominant Hand 298- 458 328 335 0.48 69%
*Score is more than 1.5 SDs outside of normal range **Score is more than 2.0 SDs outside of normal range***Score is more than 3.0 SDs outside of normal range
Figure 3. Mean and Median Reaction Time Indices (Page 3 of standard printout).
Page 3 - Reaction Times(see Figure 3)
This page summarizes the critical reaction time indicesused in the CalCAP task. One, two or three asterisksare used to indicate scores that are 1.5, 2.0 or 3.0 SDsbelow the mean of the normative sample. Norms areavailable only for the Range of reaction times and theMean reaction time. No norms are available forMedian reaction times, so these values should never beflagged with asterisks, even when they are clearlyabnormal.
Range: The range of reaction times shown representsthe best and worst performances during this testingsession. Range is considered abnormal if thedifference between the fastest and slowest reactiontimes deviates significantly from the range of reactiontimes observed in the normal control sample.
An abnormal result indicates that the subject isresponding extremely quickly to some items, butextremely slowly to others. Unusually large rangessuggest inconsistent responding across the trial. Thismay be due to transient distractions during the testing,difficulties keeping up with the pace of the testing, orlosing track of the task instructions. Abnormal rangesacross multiple tests suggest poor motivation,
malingering, or significant fluctuations in attention dueto psychoactive drugs or neurologic injury.
Median: Median reaction time is the median of alltrials on a particular task. Note that no norms areavailable for Median reaction times, so these valueswill never be flagged with an asterisk, even when theyare clearly abnormal.
Mean: The mean reaction times shown on Page 3represent the arithmetic mean of all target trials,excluding the two best and two worst performances..An abnormal value indicates that the subject is, onaverage, responding unusually slowly to the items onthis task.
Mean reaction times indicate the average speed withwhich the individual was able to respond to targetstimuli. Abnormal reaction times on multiple taskssuggest generalized slowing in cognitive processing orartifacts such as inattention, visual problems, orrandom responding. Selective slowing on certain tasksmay indicate a passing distraction during the testprocedure or may indicate a focal deficit in thecognitive ability measured by that subtest. Note thatabnormal performance on the LanguageDiscrimination task only may suggest that theindividual is not a native speaker.
5-5
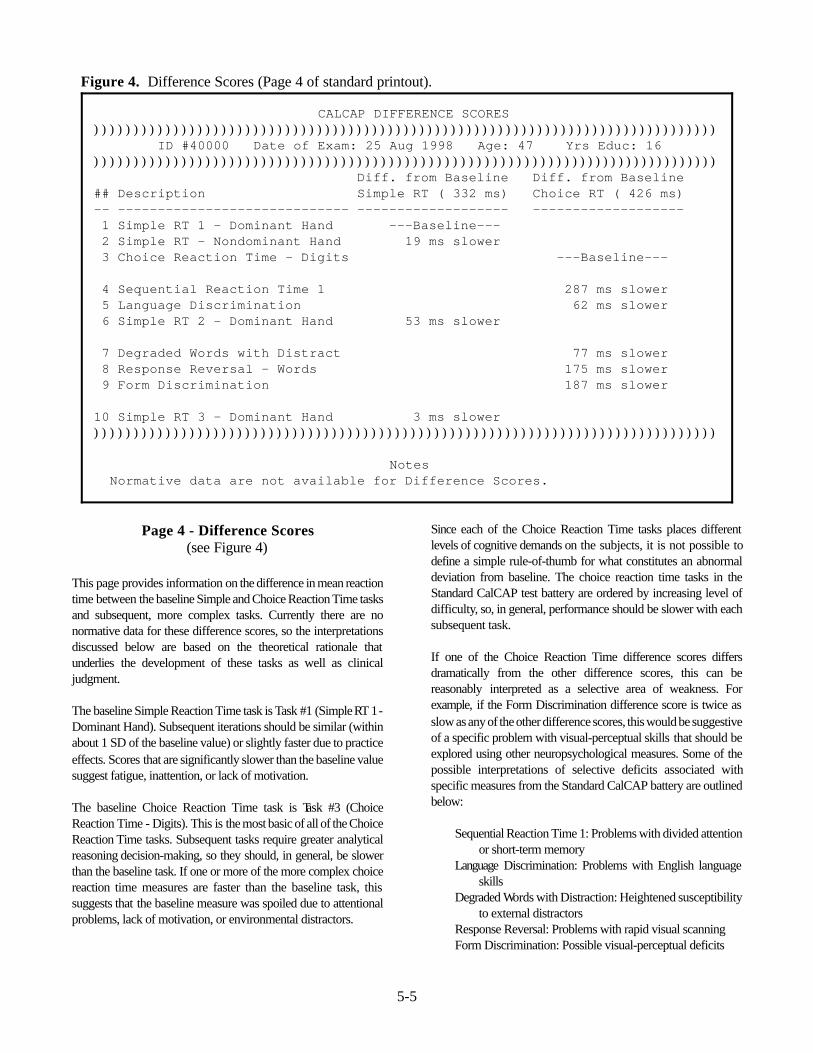
CALCAP DIFFERENCE SCORES ))))))))))))))))))))))))))))))))))))))))))))))))))))))))))))))))))))))))))))))) ID #40000 Date of Exam: 25 Aug 1998 Age: 47 Yrs Educ: 16 ))))))))))))))))))))))))))))))))))))))))))))))))))))))))))))))))))))))))))))))) Diff. from Baseline Diff. from Baseline## Description Simple RT ( 332 ms) Choice RT ( 426 ms)-- ----------------------------- ------------------- ------------------- 1 Simple RT 1 - Dominant Hand ---Baseline--- 2 Simple RT - Nondominant Hand 19 ms slower 3 Choice Reaction Time - Digits ---Baseline---
4 Sequential Reaction Time 1 287 ms slower 5 Language Discrimination 62 ms slower 6 Simple RT 2 - Dominant Hand 53 ms slower
7 Degraded Words with Distract 77 ms slower 8 Response Reversal - Words 175 ms slower 9 Form Discrimination 187 ms slower
10 Simple RT 3 - Dominant Hand 3 ms slower )))))))))))))))))))))))))))))))))))))))))))))))))))))))))))))))))))))))))))))))
Notes Normative data are not available for Difference Scores.
Figure 4. Difference Scores (Page 4 of standard printout).
Page 4 - Difference Scores(see Figure 4)
This page provides information on the difference in mean reactiontime between the baseline Simple and Choice Reaction Time tasksand subsequent, more complex tasks. Currently there are nonormative data for these difference scores, so the interpretationsdiscussed below are based on the theoretical rationale thatunderlies the development of these tasks as well as clinicaljudgment.
The baseline Simple Reaction Time task is Task #1 (Simple RT 1 -Dominant Hand). Subsequent iterations should be similar (withinabout 1 SD of the baseline value) or slightly faster due to practiceeffects. Scores that are significantly slower than the baseline valuesuggest fatigue, inattention, or lack of motivation.
The baseline Choice Reaction Time task is Task #3 (ChoiceReaction Time - Digits). This is the most basic of all of the ChoiceReaction Time tasks. Subsequent tasks require greater analyticalreasoning decision-making, so they should, in general, be slowerthan the baseline task. If one or more of the more complex choicereaction time measures are faster than the baseline task, thissuggests that the baseline measure was spoiled due to attentionalproblems, lack of motivation, or environmental distractors.
Since each of the Choice Reaction Time tasks places differentlevels of cognitive demands on the subjects, it is not possible todefine a simple rule-of-thumb for what constitutes an abnormaldeviation from baseline. The choice reaction time tasks in theStandard CalCAP test battery are ordered by increasing level ofdifficulty, so, in general, performance should be slower with eachsubsequent task.
If one of the Choice Reaction Time difference scores differsdramatically from the other difference scores, this can bereasonably interpreted as a selective area of weakness. Forexample, if the Form Discrimination difference score is twice asslow as any of the other difference scores, this would be suggestiveof a specific problem with visual-perceptual skills that should beexplored using other neuropsychological measures. Some of thepossible interpretations of selective deficits associated withspecific measures from the Standard CalCAP battery are outlinedbelow:
Sequential Reaction Time 1: Problems with divided attentionor short-term memory
Language Discrimination: Problems with English languageskills
Degraded Words with Distraction: Heightened susceptibilityto external distractors
Response Reversal: Problems with rapid visual scanningForm Discrimination: Possible visual-perceptual deficits
5-6
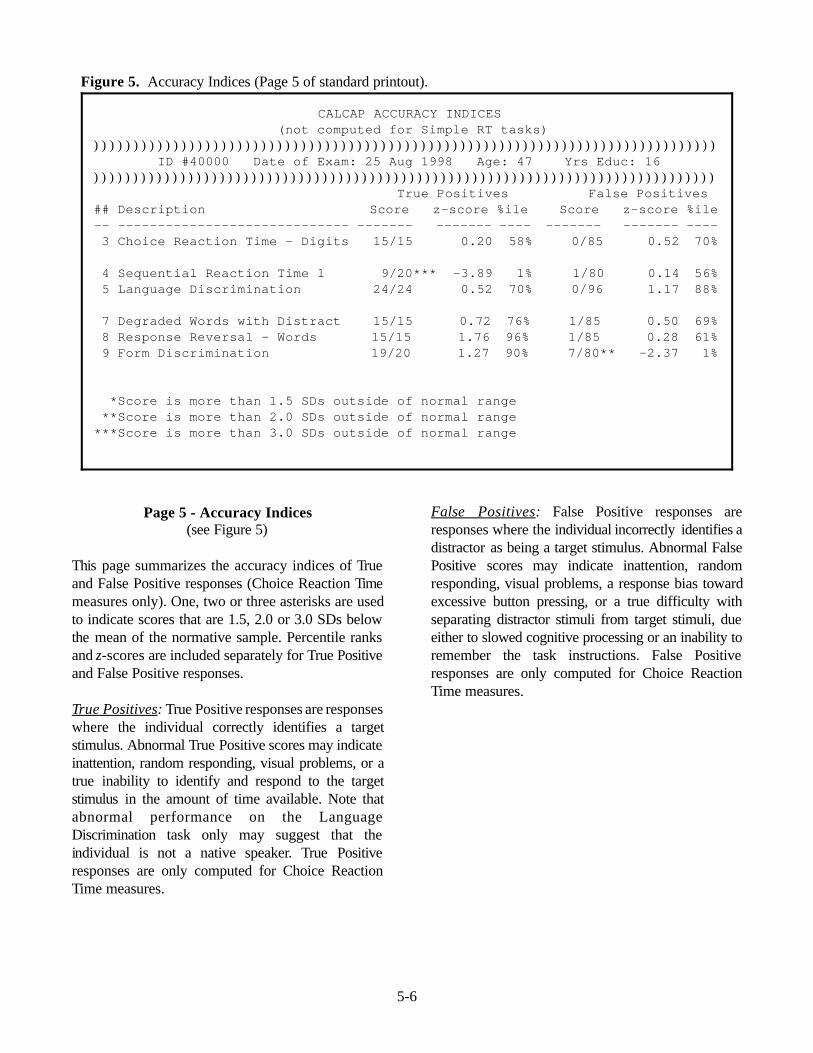
CALCAP ACCURACY INDICES (not computed for Simple RT tasks) ))))))))))))))))))))))))))))))))))))))))))))))))))))))))))))))))))))))))))))))) ID #40000 Date of Exam: 25 Aug 1998 Age: 47 Yrs Educ: 16 ))))))))))))))))))))))))))))))))))))))))))))))))))))))))))))))))))))))))))))))) True Positives False Positives## Description Score z-score %ile Score z-score %ile-- ----------------------------- ------- ------- ---- ------- ------- ---- 3 Choice Reaction Time - Digits 15/15 0.20 58% 0/85 0.52 70%
4 Sequential Reaction Time 1 9/20*** -3.89 1% 1/80 0.14 56% 5 Language Discrimination 24/24 0.52 70% 0/96 1.17 88%
7 Degraded Words with Distract 15/15 0.72 76% 1/85 0.50 69% 8 Response Reversal - Words 15/15 1.76 96% 1/85 0.28 61% 9 Form Discrimination 19/20 1.27 90% 7/80** -2.37 1%
*Score is more than 1.5 SDs outside of normal range **Score is more than 2.0 SDs outside of normal range***Score is more than 3.0 SDs outside of normal range
Figure 5. Accuracy Indices (Page 5 of standard printout).
Page 5 - Accuracy Indices(see Figure 5)
This page summarizes the accuracy indices of Trueand False Positive responses (Choice Reaction Timemeasures only). One, two or three asterisks are usedto indicate scores that are 1.5, 2.0 or 3.0 SDs belowthe mean of the normative sample. Percentile ranksand z-scores are included separately for True Positiveand False Positive responses.
True Positives: True Positive responses are responseswhere the individual correctly identifies a targetstimulus. Abnormal True Positive scores may indicateinattention, random responding, visual problems, or atrue inability to identify and respond to the targetstimulus in the amount of time available. Note thatabnormal performance on the LanguageDiscrimination task only may suggest that theindividual is not a native speaker. True Positiveresponses are only computed for Choice ReactionTime measures.
False Positives: False Positive responses areresponses where the individual incorrectly identifies adistractor as being a target stimulus. Abnormal FalsePositive scores may indicate inattention, randomresponding, visual problems, a response bias towardexcessive button pressing, or a true difficulty withseparating distractor stimuli from target stimuli, dueeither to slowed cognitive processing or an inability toremember the task instructions. False Positiveresponses are only computed for Choice ReactionTime measures.
5-7
CALCAP REACTION TIMES ))))))))))))))))))))))))))))))))))))))))))))))))))))))))))))))))))))))))))))))) ID #40000 Date of Exam: 25 Aug 1998 Age: 47 Yrs Educ: 16 ))))))))))))))))))))))))))))))))))))))))))))))))))))))))))))))))))))))))))))))) Mean Reaction Time (RT)## Description Range Median RT z-score %ile-- ------------------------------ ------- ------ ------ ------- ---- 1 Simple RT 1 - Dominant Hand 283- 352 333 332 0.64 74% 2 Simple RT - Nondominant Hand 295- 428 343 351 0.03 51% 3 Choice Reaction Time - Digits 375- 502 427 426 -0.36 36%
4 Sequential Reaction Time 1 437- 853 853 712* -1.78 4% 5 Language Discrimination 382- 552 482 488 1.15 87% 6 Simple RT 2 - Dominant Hand 338- 868** 354 385 0.40 65%
7 Degraded Words with Distract 431- 669 515 503 0.68 75% 8 Response Reversal - Words 407- 757 613 601 1.05 85% 9 Form Discrimination 435-1133 607 613 1.27 90%
10 Simple RT 3 - Dominant Hand 298- 458 328 335 0.48 69%
*Score is more than 1.5 SDs outside of normal range **Score is more than 2.0 SDs outside of normal range***Score is more than 3.0 SDs outside of normal range
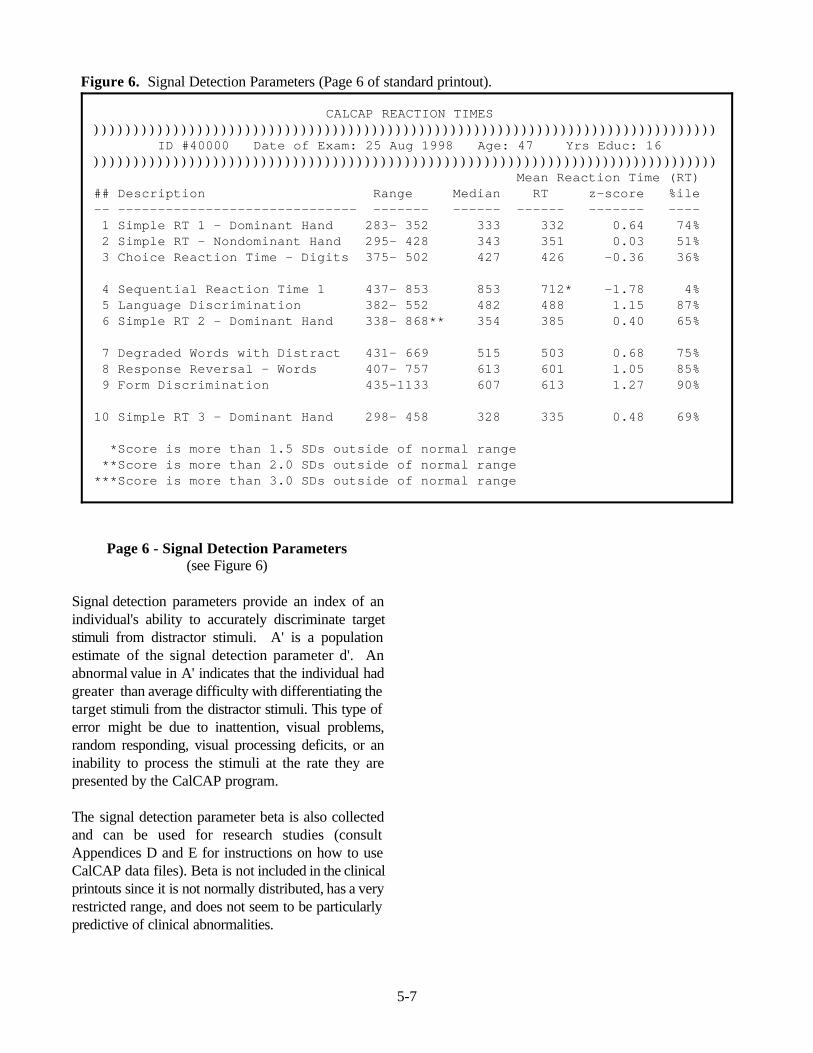
Figure 6. Signal Detection Parameters (Page 6 of standard printout).
Page 6 - Signal Detection Parameters(see Figure 6)
Signal detection parameters provide an index of anindividual's ability to accurately discriminate targetstimuli from distractor stimuli. A' is a populationestimate of the signal detection parameter d'. Anabnormal value in A' indicates that the individual hadgreater than average difficulty with differentiating thetarget stimuli from the distractor stimuli. This type oferror might be due to inattention, visual problems,random responding, visual processing deficits, or aninability to process the stimuli at the rate they arepresented by the CalCAP program.
The signal detection parameter beta is also collectedand can be used for research studies (consultAppendices D and E for instructions on how to useCalCAP data files). Beta is not included in the clinicalprintouts since it is not normally distributed, has a veryrestricted range, and does not seem to be particularlypredictive of clinical abnormalities.
5-8
General Tips for Interpretation
In general, you should consider the first simple andchoice reaction time tasks to be practice trials. Eventhough each individual task has a practice component,many subject's scores do not stabilize until after thefirst tasks.
The reaction time tasks measure cognitive functioningthat is not ordinarily assessed using standardneuropsychological procedures. Although the taskscorrelate modestly (.2 - .4) with otherneuropsychological measures (especially Symbol DigitSubstitution and Trails B), based on factor analyses thereaction time measures form two factors (Simplereaction time and Choice reaction time) that aredifferent from standard NP tasks.
The cognitive functions assessed by the CALCAPprogram are best described as timed psychomotorskills requiring focused or sustained attention.Impaired reaction time across multiple measures isusually indicative of generalized motor slowing.Impaired reaction time on specific measures,particularly when coupled with scores outside ofnormal bounds on true positive responding, issuggestive of a more specific functional deficit, usuallyin the area of fluctuating attention.
In general, poor performance on a single measure isnot indicative of a specific type of cognitiveimpairment. Certain tasks, however, do seem to berelated to specific skills.
Serial Pattern Matching (Sequential Reaction Time) islargely a measure of divided attention skills (similar toTrails B, Consonant Trigrams, etc.)
Lexical Discrimination is frequently impaired in non-native English speakers.
A large discrepancy in reaction time between tasks 1(simple reaction time–dominant hand) and 2 (simplereaction time–non-dominant hand) may be suggestiveof a lateralizing finding.
An isolated finding of impaired performance on FormDiscrimination may be suggestive of focal impairmentin visuoperceptual skills.
6-1
SUPPLEMENTARY PROGRAMS
Re-Viewing Results from theCALCAP Program
The CALCAP program stores a copy of all datacollected during the task in a file called'subjn-xx.DAT' where 'subjn' is the subject numberentered at the beginning of the program and 'xx' is acoded form of the date of the exam. You can reviewexam results by typing 'Review' or'Review subjn' at the system prompt. (Note:You must already be in the \CALCAP subdirectorybefore using this command.) In the Windowsversion of the CalCAP you can click on the‘Review’ icon in the CalCAP folder (Start –>Programs –> CalCAP –> Review).
Preparing Data Sets forAdditional Data Analyses [DOS Version Only]
It is possible to simplify the data structure of the rawCALCAP data files significantly by using theSHORTEN utility. This utility takes all CALCAPdata and arranges it in a fixed format suitable for useby statistical packages or database programs. TheSHORTEN program is invoked by typing:
SHORTEN
at the DOS command prompt. The SHORTENprogram will merge all CALCAP raw data files ofthe form subjn-xx.dat into a single data file namedMMDDYYA.DTA where MM is the month, DD isthe day, YY is the year, and the letter A is appendedto the date if this is the first such file in yourdirectory, the letter B is appended if this is thesecond such file, and so on. This file can then beused as an input file for your database program orstatistical package.
The SHORTEN program is designed for use with theStandard and Abbreviated versions of the CALCAPprogram, and should work with most Customizedversions, as long as no single task (e.g., ChoiceReaction Time Task 03) is repeated more than once.For more information on the structure of this datafile and procedures for using the SHORTENprogram, see Appendix E.
Archiving Data toSave Disk Space [DOS Version Only]
In the DOS version of the CalCAP program data canbe archived by using the 'Transfer' command. 'Transfer' compresses the data on your hard disk andthen transfers this compressed data to a floppydiskette. After the data have been compressed you will no longer be able to use 'Review' to look at oldexam results.
To use the 'Transfer' command to compress andtransfer data to a disk in Drive A you would type
TRANSFER A:
at the DOS prompt. You must already be in the\CALCAP subdirectory before using this command.This command will not work with the Windowsversion of the CalCAP since no external drives arerecognized from the virtual machine DOS prompt. Safety Tips: You should be sure that the floppy diskthat you use has already been formatted and has noother files on the disk. Since TRANSFER deletes allof your old data files when it is finished you shouldalways back up your data files [*.DAT] to a floppydiskette before using the TRANSFER command. Inaddition to the DOS Copy command (for example,COPY *.DAT A:), there are a number ofcommercial and shareware programs that can beused to back up your data.
Technical Notes: TRANSFER uses a shareware datacompression program called LHARC (Copyright ©Haruyasu Yoshizaki 1988-89).
Identifying Multiple Program Driversfor the CALCAP Program
If you want to know which versions of the CALCAPprogram are installed on your hard disk, type thecommand 'CALCAP' at the DOS prompt. You must already be in the \CALCAPsubdirectory for this command to work.
7-1
SPECIAL CONFIGURATIONS FOR THECALCAP PROGRAM
Customizing the CALCAP Program
The CALCAP program can be customized in avariety of ways to accomodate different researchprotocols. The following features are available:
C In the DOS version of the CalCAP, summaryoutput can be sent to the screen or to a printer. Printed output includes additional informationexplaining special codes and describing thenormative comparison group.
C At the end of each task the computer can givefeedback on the subject's performance relative toage- and education-matched controls. Manysubjects find this feedback helpful andmotivating.
C A brief tune is played at the end of all choicereaction time measures in the Standard versionof the CalCAP. Some subjects enjoy thisfeature, others are annoyed by it. Music can beturned on or off at any time during the tasks.
C The background can be either black or blue. Allnormative data is based on a blue background.
C A demo version of the program can be invokedfor instructional purposes or presentations.
Most of these features can be controlled from thecommand line when the CALCAP program is started. The different command line switches are describedbelow and in the Figure on the next page.
Command Line Switches
Feedback. [/feed] The CALCAP program canprovide feedback on performance at the end of eachtask. This feedback takes the form of statementsdesigned to encourage or motivate the examinee('That was very good,' 'You had a little trouble withthat task–the next task will be quite different.') Eachtask has three levels of feedback: (1) performanceabove expected levels; (2) performance in the
average range; (3) performance below expectedlevels. Feedback is tailored to the age and educationof the examinee. Default value is Feedback OFF. The /feed command line switch turns Feedback ON.
Music. [/nm] The CALCAP program plays arandom 5-15 second musical selection at the end ofeach choice reaction time measure. Default value isMusic ON. The /nm command line switch turnsMusic OFF.
Printer. [/p] At the end of the CALCAP testbattery you are shown the test results on the videodisplay. In the DOS version of the CalCAP you canoptionally specify that you always want the resultssent to the printer by using the /p option. Defaultvalue is Printer OFF. The /p command line switchturns Printer ON. This function does not work withthe Windows version of the CalCAP.
Text Resolution. [/novga] The original CALCAPprogram was designed for CGA monitors and allformal stimulus materials are displayed at CGAresolution. On EGA, VGA and XGA monitors,however, the CALCAP program will display textinstructions using a high-resolution display font. You can force the CalCAP program to use CGAresolution for both instructions and stimulusmaterials by adding the /novga switch to thecommand line. Default is VGA Resolution ON. The /novga command line switch turns VGAResolution OFF.
Multitasking Warning. [/nww] The CALCAPprogram needs exclusive use of the microprocessorin your computer. If it detects active multi-taskingsoftware such as older versions of MicrosoftWindows, it issues a warning. The /nww switch (NoWindows Warning) eliminates this warning.
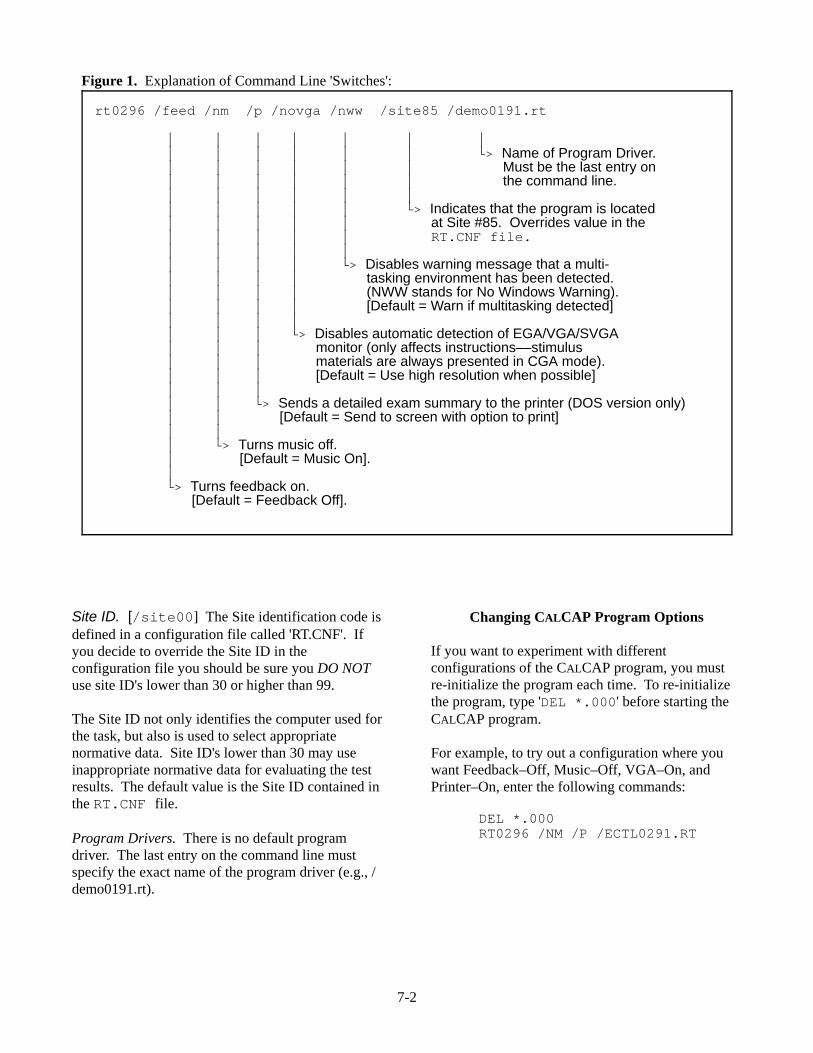
7-2
rt0296 /feed /nm /p /novga /nww /site85 /demo0191.rt
* * * * * * ** * * * * * .> Name of Program Driver.* * * * * * Must be the last entry on* * * * * * the command line.* * * * * ** * * * * .> Indicates that the program is located* * * * * at Site #85. Overrides value in the* * * * * RT.CNF file.* * * * ** * * * .> Disables warning message that a multi-* * * * tasking environment has been detected.* * * * (NWW stands for No Windows Warning).* * * * [Default = Warn if multitasking detected]* * * ** * * .> Disables automatic detection of EGA/VGA/SVGA* * * monitor (only affects instructions––stimulus* * * materials are always presented in CGA mode).* * * [Default = Use high resolution when possible]* * ** * .> Sends a detailed exam summary to the printer (DOS version only)* * [Default = Send to screen with option to print]* ** .> Turns music off.* [Default = Music On].*.> Turns feedback on. [Default = Feedback Off].
Figure 1. Explanation of Command Line 'Switches':
Site ID. [/site00] The Site identification code isdefined in a configuration file called 'RT.CNF'. Ifyou decide to override the Site ID in theconfiguration file you should be sure you DO NOTuse site ID's lower than 30 or higher than 99.
The Site ID not only identifies the computer used forthe task, but also is used to select appropriatenormative data. Site ID's lower than 30 may useinappropriate normative data for evaluating the testresults. The default value is the Site ID contained inthe RT.CNF file.
Program Drivers. There is no default programdriver. The last entry on the command line mustspecify the exact name of the program driver (e.g., /demo0191.rt).
Changing CALCAP Program Options
If you want to experiment with differentconfigurations of the CALCAP program, you mustre-initialize the program each time. To re-initializethe program, type 'DEL *.000' before starting theCALCAP program.
For example, to try out a configuration where youwant Feedback–Off, Music–Off, VGA–On, andPrinter–On, enter the following commands:
DEL *.000RT0296 /NM /P /ECTL0291.RT
8-1
TECHNICAL SPECIFICATIONS
Hardware Specifications
Stimulus materials are presented using DOS orWindows computers. The program requires at leastan 80286 microprocessor running at 6MHz. Computers based on the Intel 8086 and 8088microprocessors will run too slowly to be able toaccurately time the stimulus materials.
The program requires a standard IBM CGA, EGA,VGA, or SVGA or 100% compatible color display. Non-standard liquid crystal displays and plasmadisplays such as those used in laptop computers willnot function correctly, nor will Passive Matrixdisplays used in color laptops. Active Matrix colordisplays will work correctly.
The stimulus materials developed for this programwill appear correctly using CGA, EGA, VGA orActive Matrix LCD color displays. Normative datawere collected using 14" EGA and VGA monitors. There were no significant differences in reactiontime or signal detection parameters as a function ofthe type of monitor used. The program requires at least the speed of an 80286microprocessor, but automatically adjusts forchanges in clock speed to provide uniform timing.
The timing circuits have a minimum resolution of0.70 msecs for timing of the materials displayed onthe screen, and a minimum resolution of 1.34 msecsfor detecting keypress responses from the subject.Interrupt timing introduces a maximum 27 msectiming error. All timing errors can be positive ornegative and average out to 0 over repeated trials.
The hardware that controls the color monitorrewrites the screen image sixty times per secondwhich means that there is a potential timing error ofup to 34 msecs during which the stimulus image iswritten on the screen (17 msecs) and subsequentlyerased from the screen (another 17 msecs). TheCALCAP checks the position of the electronscanning gun prior to writing to the screen, thusreducing actual error variance to 1-2 msecs.
Compatibility Issues
The CalCAP is a DOS program that runs correctlyon a single-speed computer running DOS orWindows. Since the CalCAP requires exclusive useof your microprocessor and your screen, it runswithin a virtual machine if you are using WindowsVista, Windows 7 or a later operating system.
The CalCAP is incompatible with laptop computersthat automatically adjust their clock speed, thoughyou may be able to permanently set your clock speedthrough the laptop BIOS or SpeedSwitchXPSoftware(http://www.diefer.de/speedswitchxp/index.html).
Software Timing
The timing accuracy of the CALCAP software islimited primarily by the hardware considerationsdetailed above. In addition to these hardwarelimitations, the following rules are used forcomputation of reaction times:
For simple reaction time measures, mean reactiontime is computed by dropping the best and worsttrials (or the two best and two worst trials if there areover 10 trials), and then averaging the remainingtrials. The maximum reaction time is computed asthe upper limit defined by the Program Drivers (1.5seconds in the Standard, Abbreviated and CPTprogram drivers).
For choice reaction time measures, mean reactiontime is computed by dropping the two best and twoworst trials and then averaging the remaining trials. The maximum reaction time is equal to the sum ofthe minimum inter-stimulus interval and the stimulusduration, minus half of the speed at which thecomputer writes information on the screen [ISI.MIN+ stimulus duration - (screen.write.speed / 2)]. Asdescribed under hardware considerations above,screen.write.speed is usually 34 msecs. Thus, if theminimum inter-stimulus interval (ISI.MIN) is equalto 800 msecs, stimulus duration is equal to 200msecs, and screen writing speed = 34 msecs, then
8-2
maximum possible reaction time = 800 + 200 - (34/2) = 983.
Program Driver History
Standard Version. ECTL0291.RT is a modificationof standard version (CTRL0191.RT) that increasesthe number of Simple RT trials from 6 to 12. Available beginning in February 1991. Designed tobe used at all installations for commercial sales. Aspecial version called ECRM0291.RT includes Task11 (Recognition Memory). Recognition Memorywas dropped from the MACS study in 9/89 to reducethe overall length of the test battery and because itdid not appear particularly sensitive to HIV-specificcognitive deficits.
CPT Version. CPT0191.RT is the ContinuousPerformance Test version of the CALCAP programfirst developed in Spring 1989. Adapted andextended in Fall 1990 to allow 3 iterations of thestandard CPT protocol.
Abbreviated Version. MACS0191.RT is amodification of standard version requiring less time(approx. 7-10 minutes) and VGA monitors. Available beginning in February 1991. Designed tobe used at all MACS centers beginning in April1991. Renamed ART0292.RT in February 1992.
Original Version. CTRL0191.RT is the originalversion used to develop norms in the MACS (basedon AT-compatible computers). Takes approx. 20-25minutes & requires CGA or EGA monitors. SimpleRT tasks consist of 6 actual trials. Used primarily inthe MACS study in Los Angeles from April 1987through March 1991. (Last distributed on 1/31/91). A special version called CTRM0191.RT includesTask 11 (Recognition Memory). RecognitionMemory was dropped from the MACS study in 9/89to reduce the overall length of the test battery andbecause it did not appear particularly sensitive toHIV-specific cognitive deficits.
9-1
REFERENCES
Benton AL, Hamsher KS. Multilingual AphasiaExamination Manual. Iowa City:University ofIowa., 1978.
Benton AL, Hamsher KS, Varney NR, Spreen O.
Contributions to neuropsychological assessment.New York:Oxford University Press, 1983.
Chapman LJ, Chapman JP. Artifactual and genuine
relationships of lateral difference scores to overallaccuracy in studies of laterality. Psychol Bull1988;104:127-136.
Cronbach LJ, Furby L. How we should measure"change" - or should we? Psychol Bull1970;74:68-80.
Gallway RA, Millington JT, Mirsky AF, Van Gorp
WG, Miller EN, Wolcott CL. Neuropsychologicalconsequences of hyperbaric nitrogen narcosis[ a b s t r a c t ] . N a t i o n a l A c a d e m y o fNeuropsychology, Reno, Nevada, 1990.
Gallway RA, Millington JT, Van Gorp WG, Miller EN,Mirsky AF. Neuropsychological consequences ofhyperbaric nitrogen narcosis II [abstract]. Journalof Clinical and Experimental Neuropsychology,1991:13;440.
Halman M, Hamburg NM, Savage CR, Worth JL. Useof computer-based measures of complex reactiontime in depressed HIV-1 infected patients[abstract]. Academy of Psychosomatic Medicine,Phoenix, 1994.
Klo/ve H. Clinical neuropsychology. In: Forster FM,ed. The medical clinics of North America. NewYork: Saunders, 1963.
Martin A, Kampen D, Salazar AM, et al . Slowed
cognitive processing in HIV+ patients incomparison to psychiatric controls. Int Conf AIDS1989;5:(Abstract)
Martin E, Edelstein H, Robertson L. Decision-making
speed in early human immunodeficiency virus(HIV) in fec t ion . In t Conf AIDS1989;5:462.(Abstract)
Martin EM, Sorensen DJ, Edelstein HE, RobertsonLC. Decision-making speed in HIV-1 infection: apreliminary report. AIDS, 1992;6:109-113.
Matthews CG, Klo/ve H. Instruction manual for the
Adult Neuropsychology Test Battery.Madison:University of Wisconsin Medical School,1964.
Miller EN. Cognitive testing using reaction time andtraditional neuropsychological procedures. AnnualMeeting of the International NeuropsychologicalSociety. Cincinnati, Ohio. February 1994, pp. 108-109.
Miller EN. Use of computerized reaction time in theassessment of dementia [abstract]. Neurology,1992;42(suppl 3):220.
Miller EN, Bing EG, Selnes OA, Wesch J, Becker JT.The effects of sociodemographic factors onreaction time and speed of information processing.Journal of Clinical and ExperimentalNeuropsychology, 1993;15:66.
Miller EN, Satz P, Van Gorp W, Visscher B, DudleyJ. Computerized screening for HIV-relatedcognitive decline in gay men: Cross-sectionalanalyses and one-year follow-up. (Abstract).Proceedings of the V International Conference onAIDS (Montreal, Canada), 1989; 465.
Miller EN, Satz P, Van Gorp W, Visscher B, DudleyJ. Computerized screening for HIV-relatedcognitive decline in gay men. (Abstract).Proceedings of the IV International Conferenceon AIDS (Stockholm, Sweden), 1988;1:378.
4-2
Miller EN, Satz P, Visscher B. Neuropsychologicaltests in HIV [letter]. Neurology, 1992;42:2056.
Miller EN, Satz P, Visscher B. Computerized andconventional neuropsychological assessment ofHIV-1 infected homosexual men. Neurology,1991;41:1608-1616.
Miller EN, Satz P, Visscher B. Computerizedneuropsychological assessment for HIV-relatedencephalopathy. Symposium on Novel andTraditional Approaches for Early Detection ofHIV-1 Related Dementia (Vancouver, Canada).Journal of Clinical and ExperimentalNeuropsychology, 1989;11:34-35.
Miller EN, Wilkie FL. (in press). Problems and issuesin the use of a computerized battery for theassessment of cognition in HIV-1 positiveindividuals. In I. Grant and A. Martin,Neuropsychology of HIV Infection: CurrentResearch and New Directions. Oxford UniversityPress: New York.
Perdices M, Cooper DA. Simple and choice reactiontime in patients with human immunodeficiencyvirus infection. Ann Neurol 1989;25:460-467.
Posner MI, Cohen Y, Rafal RD. Neural systems
control of spatial orienting. Phil Trans R Soc Lond1982;298:187-198.
Radloff LS. The CES-D scale: A self-reportdepression scale for research in the generalpopulation. Appl Psychol Measurement1977;1:385-401.
Reitan R. Validity of the Trail Making Test as an
indicator of organic brain damage. Percept MotSkills 1958;8:271-276.
Reitan R. Manual for administration of
neuropsychological test batteries for adults andchildren. Tucson:Neuropsychology Laboratory,1979.
Rey A. L'examen clinique en psychologie.
Paris:Presses Universitaires de France, 1964.
Smith A. Symbol Digit Modalities Test: Manual. LosAngeles:Western Psychological Services, 1973.
Sternberg S. High speed scanning in human memory.Science 1966;153:652-654.
Sternberg S. Memory scanning: new findings and
current controversies. Q J Exp Psychol1975;27:1-32.
Waterloo K, Ingebrigtsen T, Romner B.
Neuropsychological function in patients withincreased serum levels of protein S-100 afterminor head injury. Acta Neurochirurgica,1997:139;26-32.
Wechsler D. Wechsler Adult Intelligence Scale -Revised. New York:Psychological Corporation,1981.
Wilkie FL, Eisdorfer C, Morgan R, Loewenstein DA,
Szapocznik J. Cognition in early humanimmunodeficiency virus infection. Arch Neurol1990;47:433-440.
Worth JL, Savage CR, and Navia BA. Computer-based measures of neuropsychological deficits inpatients with HIV-1 cognitive/motor complex. IntConf AIDS, 1992;8.
Worth JL, Savage CR, and Navia BA. Computer-based screening test for AIDS dementia complex.Presented at the Annual Meeting of the AmericanPsychiatric Association, Washington, DC, 1992.
Worth JL, Savage CR, Baer L, Esty EK, and NaviaBA. Computer-based neuropsychologicalscreening for AIDS dementia complex. AIDS,1993;7:677-681.
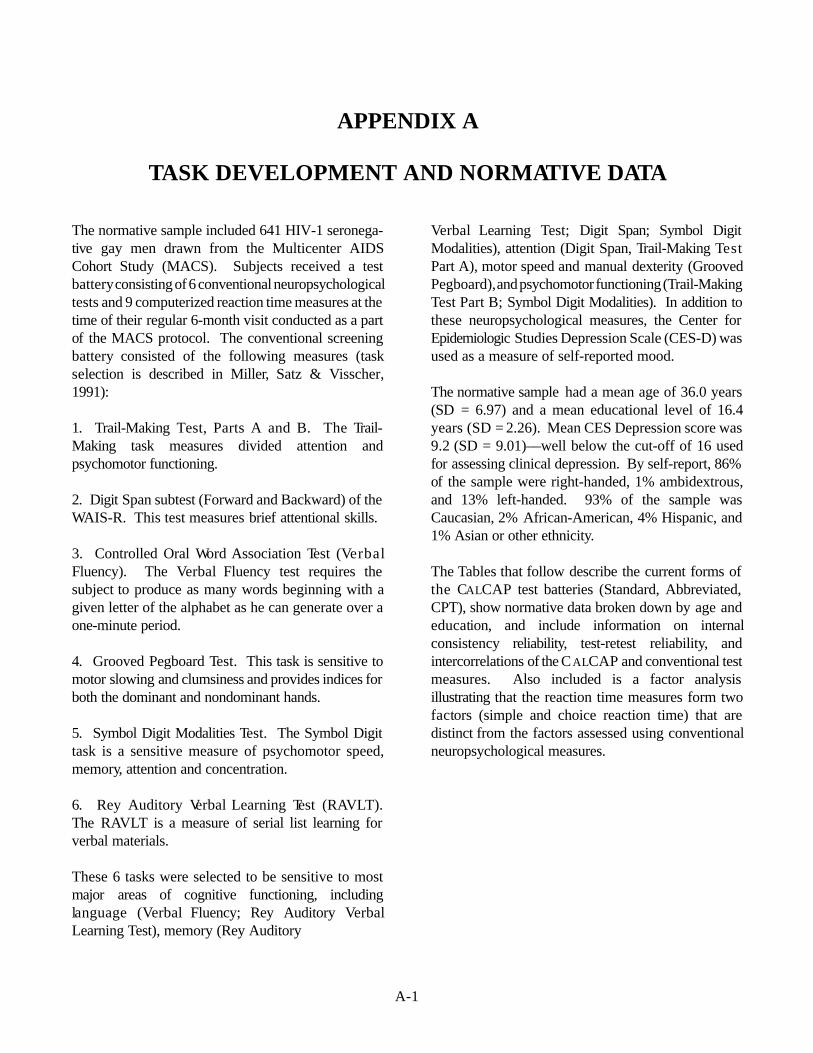
A-1
APPENDIX A
TASK DEVELOPMENT AND NORMATIVE DATA
The normative sample included 641 HIV-1 seronega-tive gay men drawn from the Multicenter AIDSCohort Study (MACS). Subjects received a testbattery consisting of 6 conventional neuropsychologicaltests and 9 computerized reaction time measures at thetime of their regular 6-month visit conducted as a partof the MACS protocol. The conventional screeningbattery consisted of the following measures (taskselection is described in Miller, Satz & Visscher,1991):
1. Trail-Making Test, Parts A and B. The Trail-Making task measures divided attention andpsychomotor functioning.
2. Digit Span subtest (Forward and Backward) of theWAIS-R. This test measures brief attentional skills.
3. Controlled Oral Word Association Test (VerbalFluency). The Verbal Fluency test requires thesubject to produce as many words beginning with agiven letter of the alphabet as he can generate over aone-minute period.
4. Grooved Pegboard Test. This task is sensitive tomotor slowing and clumsiness and provides indices forboth the dominant and nondominant hands.
5. Symbol Digit Modalities Test. The Symbol Digittask is a sensitive measure of psychomotor speed,memory, attention and concentration.
6. Rey Auditory Verbal Learning Test (RAVLT).The RAVLT is a measure of serial list learning forverbal materials.
These 6 tasks were selected to be sensitive to mostmajor areas of cognitive functioning, includinglanguage (Verbal Fluency; Rey Auditory VerbalLearning Test), memory (Rey Auditory
Verbal Learning Test; Digit Span; Symbol DigitModalities), attention (Digit Span, Trail-Making TestPart A), motor speed and manual dexterity (GroovedPegboard), and psychomotor functioning (Trail-MakingTest Part B; Symbol Digit Modalities). In addition tothese neuropsychological measures, the Center forEpidemiologic Studies Depression Scale (CES-D) wasused as a measure of self-reported mood.
The normative sample had a mean age of 36.0 years(SD = 6.97) and a mean educational level of 16.4years (SD = 2.26). Mean CES Depression score was9.2 (SD = 9.01)––well below the cut-off of 16 usedfor assessing clinical depression. By self-report, 86%of the sample were right-handed, 1% ambidextrous,and 13% left-handed. 93% of the sample wasCaucasian, 2% African-American, 4% Hispanic, and1% Asian or other ethnicity.
The Tables that follow describe the current forms ofthe CALCAP test batteries (Standard, Abbreviated,CPT), show normative data broken down by age andeducation, and include information on internalconsistency reliability, test-retest reliability, andintercorrelations of the CALCAP and conventional testmeasures. Also included is a factor analysisillustrating that the reaction time measures form twofactors (simple and choice reaction time) that aredistinct from the factors assessed using conventionalneuropsychological measures.
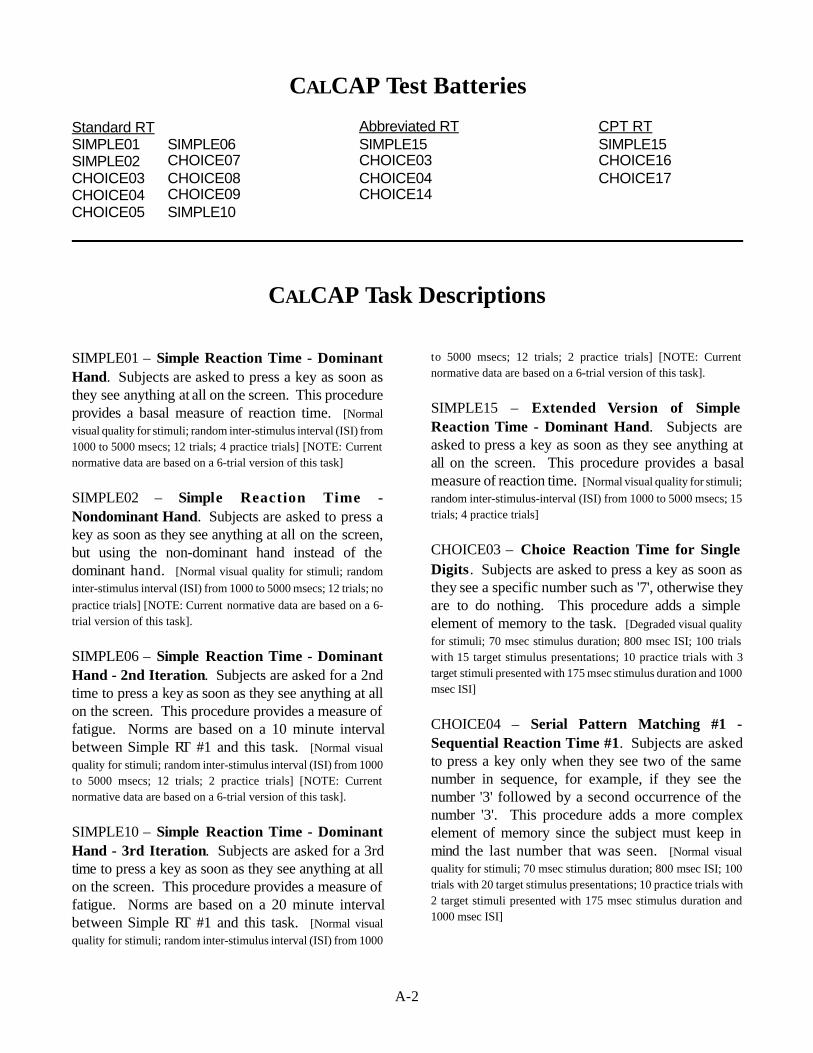
A-2
CALCAP Test Batteries
Standard RT Abbreviated RT CPT RTSIMPLE01 SIMPLE06 SIMPLE15 SIMPLE15SIMPLE02 CHOICE07 CHOICE03 CHOICE16CHOICE03 CHOICE08 CHOICE04 CHOICE17CHOICE04 CHOICE09 CHOICE14CHOICE05 SIMPLE10
CALCAP Task Descriptions
SIMPLE01 – Simple Reaction Time - DominantHand. Subjects are asked to press a key as soon asthey see anything at all on the screen. This procedureprovides a basal measure of reaction time. [Normalvisual quality for stimuli; random inter-stimulus interval (ISI) from1000 to 5000 msecs; 12 trials; 4 practice trials] [NOTE: Currentnormative data are based on a 6-trial version of this task]
SIMPLE02 – Simple Reaction Time -Nondominant Hand. Subjects are asked to press akey as soon as they see anything at all on the screen,but using the non-dominant hand instead of thedominant hand. [Normal visual quality for stimuli; randominter-stimulus interval (ISI) from 1000 to 5000 msecs; 12 trials; nopractice trials] [NOTE: Current normative data are based on a 6-trial version of this task].
SIMPLE06 – Simple Reaction Time - DominantHand - 2nd Iteration. Subjects are asked for a 2ndtime to press a key as soon as they see anything at allon the screen. This procedure provides a measure offatigue. Norms are based on a 10 minute intervalbetween Simple RT #1 and this task. [Normal visualquality for stimuli; random inter-stimulus interval (ISI) from 1000to 5000 msecs; 12 trials; 2 practice trials] [NOTE: Currentnormative data are based on a 6-trial version of this task].
SIMPLE10 – Simple Reaction Time - DominantHand - 3rd Iteration. Subjects are asked for a 3rdtime to press a key as soon as they see anything at allon the screen. This procedure provides a measure offatigue. Norms are based on a 20 minute intervalbetween Simple RT #1 and this task. [Normal visualquality for stimuli; random inter-stimulus interval (ISI) from 1000
to 5000 msecs; 12 trials; 2 practice trials] [NOTE: Currentnormative data are based on a 6-trial version of this task].
SIMPLE15 – Extended Version of SimpleReaction Time - Dominant Hand. Subjects areasked to press a key as soon as they see anything atall on the screen. This procedure provides a basalmeasure of reaction time. [Normal visual quality for stimuli;random inter-stimulus-interval (ISI) from 1000 to 5000 msecs; 15trials; 4 practice trials]
CHOICE03 – Choice Reaction Time for SingleDigits. Subjects are asked to press a key as soon asthey see a specific number such as '7', otherwise theyare to do nothing. This procedure adds a simpleelement of memory to the task. [Degraded visual qualityfor stimuli; 70 msec stimulus duration; 800 msec ISI; 100 trialswith 15 target stimulus presentations; 10 practice trials with 3target stimuli presented with 175 msec stimulus duration and 1000msec ISI]
CHOICE04 – Serial Pattern Matching #1 -Sequential Reaction Time #1. Subjects are askedto press a key only when they see two of the samenumber in sequence, for example, if they see thenumber '3' followed by a second occurrence of thenumber '3'. This procedure adds a more complexelement of memory since the subject must keep inmind the last number that was seen. [Normal visualquality for stimuli; 70 msec stimulus duration; 800 msec ISI; 100trials with 20 target stimulus presentations; 10 practice trials with2 target stimuli presented with 175 msec stimulus duration and1000 msec ISI]
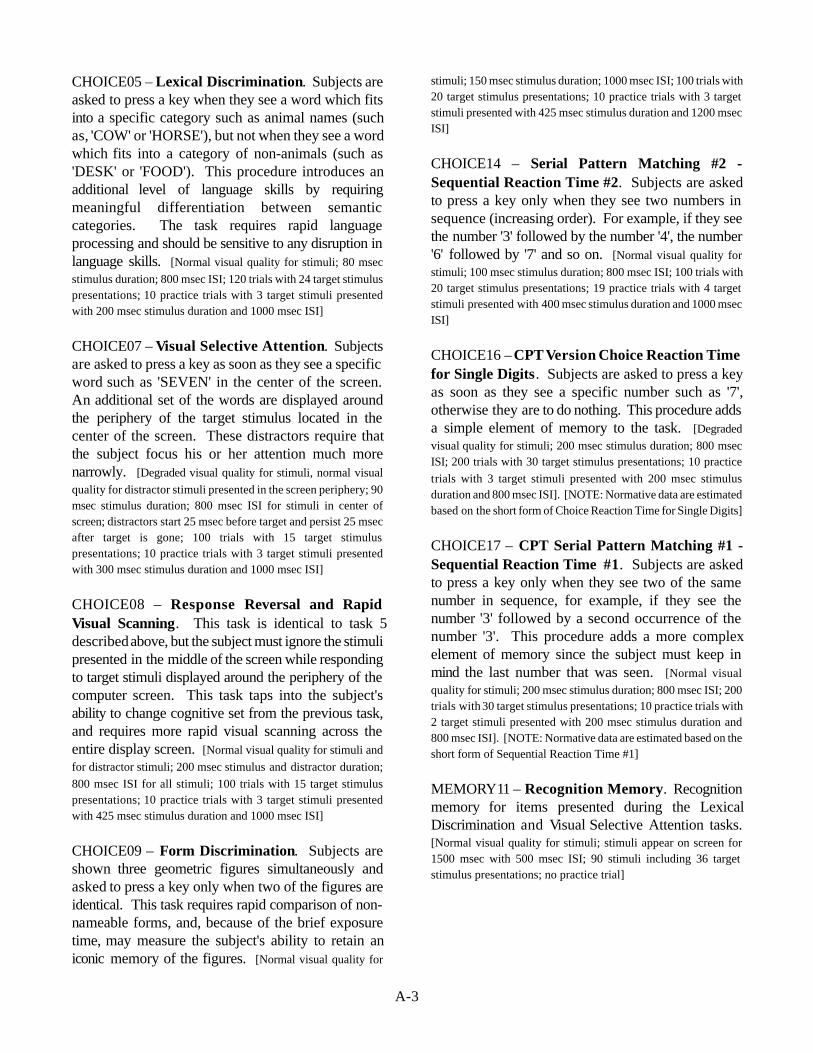
A-3
CHOICE05 – Lexical Discrimination. Subjects areasked to press a key when they see a word which fitsinto a specific category such as animal names (suchas, 'COW' or 'HORSE'), but not when they see a wordwhich fits into a category of non-animals (such as'DESK' or 'FOOD'). This procedure introduces anadditional level of language skills by requiringmeaningful differentiation between semanticcategories. The task requires rapid languageprocessing and should be sensitive to any disruption inlanguage skills. [Normal visual quality for stimuli; 80 msecstimulus duration; 800 msec ISI; 120 trials with 24 target stimuluspresentations; 10 practice trials with 3 target stimuli presentedwith 200 msec stimulus duration and 1000 msec ISI]
CHOICE07 – Visual Selective Attention. Subjectsare asked to press a key as soon as they see a specificword such as 'SEVEN' in the center of the screen.An additional set of the words are displayed aroundthe periphery of the target stimulus located in thecenter of the screen. These distractors require thatthe subject focus his or her attention much morenarrowly. [Degraded visual quality for stimuli, normal visualquality for distractor stimuli presented in the screen periphery; 90msec stimulus duration; 800 msec ISI for stimuli in center ofscreen; distractors start 25 msec before target and persist 25 msecafter target is gone; 100 trials with 15 target stimuluspresentations; 10 practice trials with 3 target stimuli presentedwith 300 msec stimulus duration and 1000 msec ISI]
CHOICE08 – Response Reversal and RapidVisual Scanning. This task is identical to task 5described above, but the subject must ignore the stimulipresented in the middle of the screen while respondingto target stimuli displayed around the periphery of thecomputer screen. This task taps into the subject'sability to change cognitive set from the previous task,and requires more rapid visual scanning across theentire display screen. [Normal visual quality for stimuli andfor distractor stimuli; 200 msec stimulus and distractor duration;800 msec ISI for all stimuli; 100 trials with 15 target stimuluspresentations; 10 practice trials with 3 target stimuli presentedwith 425 msec stimulus duration and 1000 msec ISI]
CHOICE09 – Form Discrimination. Subjects areshown three geometric figures simultaneously andasked to press a key only when two of the figures areidentical. This task requires rapid comparison of non-nameable forms, and, because of the brief exposuretime, may measure the subject's ability to retain aniconic memory of the figures. [Normal visual quality for
stimuli; 150 msec stimulus duration; 1000 msec ISI; 100 trials with20 target stimulus presentations; 10 practice trials with 3 targetstimuli presented with 425 msec stimulus duration and 1200 msecISI]
CHOICE14 – Serial Pattern Matching #2 -Sequential Reaction Time #2. Subjects are askedto press a key only when they see two numbers insequence (increasing order). For example, if they seethe number '3' followed by the number '4', the number'6' followed by '7' and so on. [Normal visual quality forstimuli; 100 msec stimulus duration; 800 msec ISI; 100 trials with20 target stimulus presentations; 19 practice trials with 4 targetstimuli presented with 400 msec stimulus duration and 1000 msecISI]
CHOICE16 – CPT Version Choice Reaction Timefor Single Digits. Subjects are asked to press a keyas soon as they see a specific number such as '7',otherwise they are to do nothing. This procedure addsa simple element of memory to the task. [Degradedvisual quality for stimuli; 200 msec stimulus duration; 800 msecISI; 200 trials with 30 target stimulus presentations; 10 practicetrials with 3 target stimuli presented with 200 msec stimulusduration and 800 msec ISI]. [NOTE: Normative data are estimatedbased on the short form of Choice Reaction Time for Single Digits]
CHOICE17 – CPT Serial Pattern Matching #1 -Sequential Reaction Time #1. Subjects are askedto press a key only when they see two of the samenumber in sequence, for example, if they see thenumber '3' followed by a second occurrence of thenumber '3'. This procedure adds a more complexelement of memory since the subject must keep inmind the last number that was seen. [Normal visualquality for stimuli; 200 msec stimulus duration; 800 msec ISI; 200trials with 30 target stimulus presentations; 10 practice trials with2 target stimuli presented with 200 msec stimulus duration and800 msec ISI]. [NOTE: Normative data are estimated based on theshort form of Sequential Reaction Time #1]
MEMORY11 – Recognition Memory. Recognitionmemory for items presented during the LexicalDiscrimination and Visual Selective Attention tasks.[Normal visual quality for stimuli; stimuli appear on screen for1500 msec with 500 msec ISI; 90 stimuli including 36 targetstimulus presentations; no practice trial]
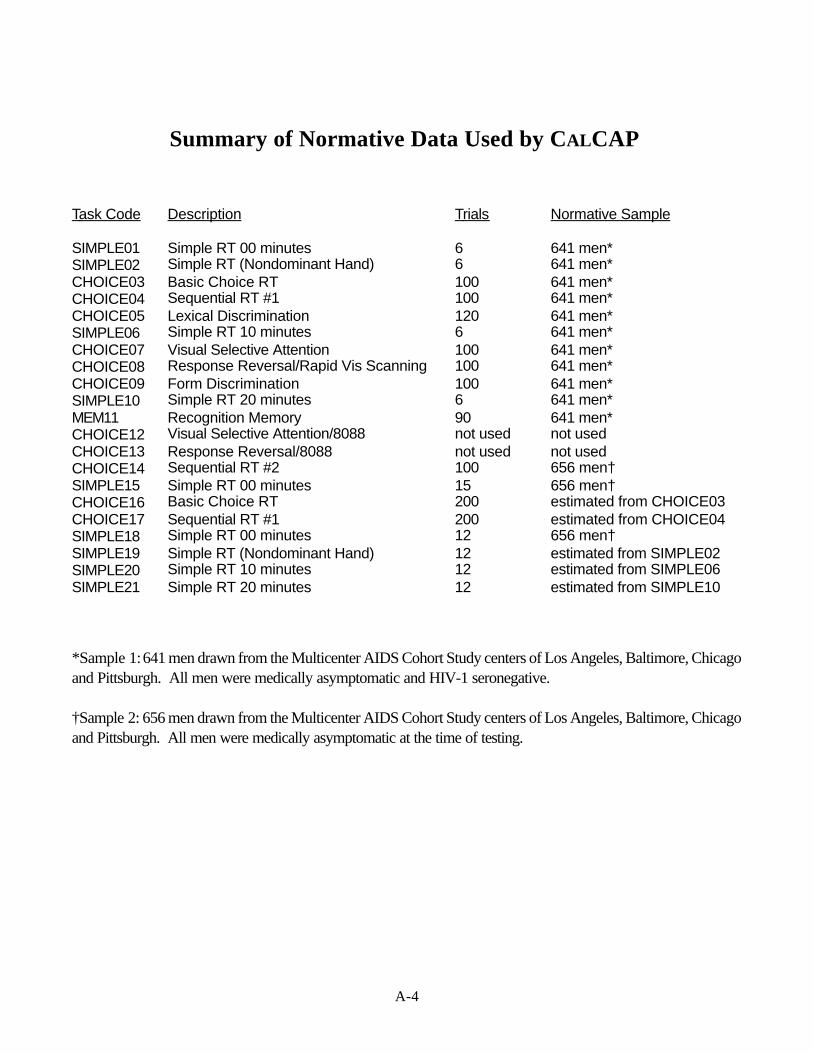
A-4
Summary of Normative Data Used by CALCAP
Task Code Description Trials Normative Sample
SIMPLE01 Simple RT 00 minutes 6 641 men*SIMPLE02 Simple RT (Nondominant Hand) 6 641 men*CHOICE03 Basic Choice RT 100 641 men*CHOICE04 Sequential RT #1 100 641 men*CHOICE05 Lexical Discrimination 120 641 men*SIMPLE06 Simple RT 10 minutes 6 641 men*CHOICE07 Visual Selective Attention 100 641 men*CHOICE08 Response Reversal/Rapid Vis Scanning 100 641 men*CHOICE09 Form Discrimination 100 641 men*SIMPLE10 Simple RT 20 minutes 6 641 men*MEM11 Recognition Memory 90 641 men*CHOICE12 Visual Selective Attention/8088 not used not usedCHOICE13 Response Reversal/8088 not used not usedCHOICE14 Sequential RT #2 100 656 men†SIMPLE15 Simple RT 00 minutes 15 656 men†CHOICE16 Basic Choice RT 200 estimated from CHOICE03CHOICE17 Sequential RT #1 200 estimated from CHOICE04SIMPLE18 Simple RT 00 minutes 12 656 men†SIMPLE19 Simple RT (Nondominant Hand) 12 estimated from SIMPLE02SIMPLE20 Simple RT 10 minutes 12 estimated from SIMPLE06SIMPLE21 Simple RT 20 minutes 12 estimated from SIMPLE10
*Sample 1: 641 men drawn from the Multicenter AIDS Cohort Study centers of Los Angeles, Baltimore, Chicagoand Pittsburgh. All men were medically asymptomatic and HIV-1 seronegative.
†Sample 2: 656 men drawn from the Multicenter AIDS Cohort Study centers of Los Angeles, Baltimore, Chicagoand Pittsburgh. All men were medically asymptomatic at the time of testing.
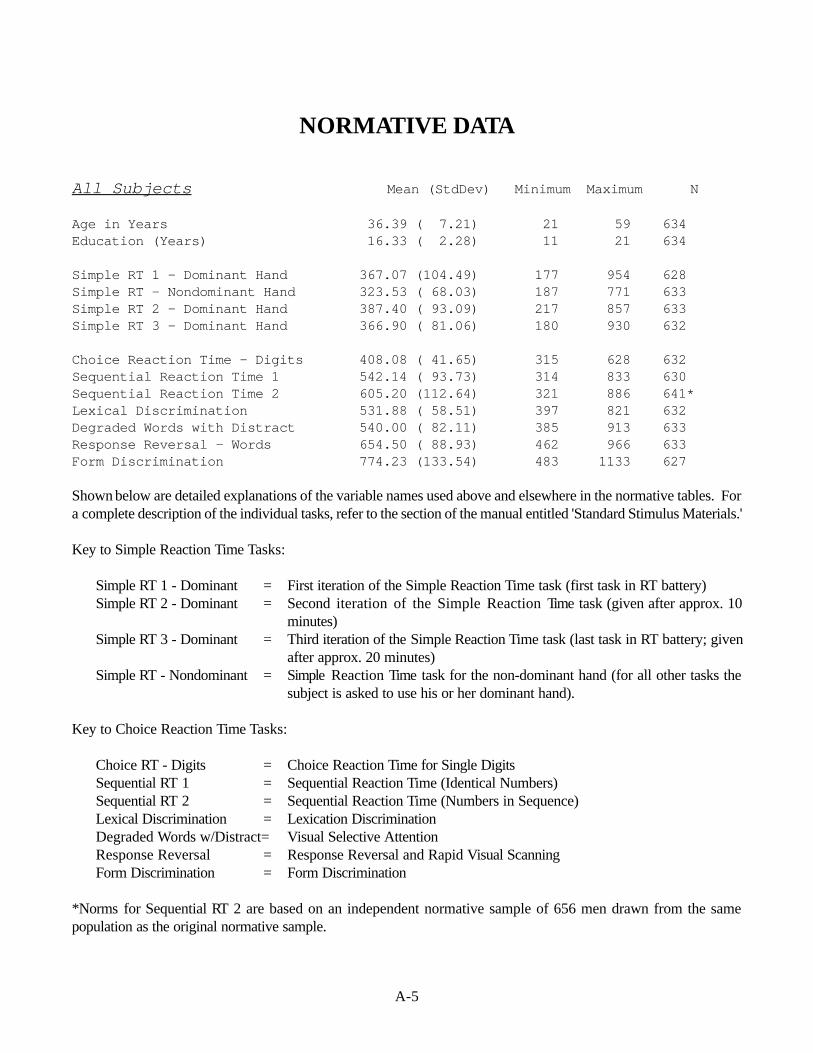
A-5
NORMATIVE DATA
All Subjects Mean (StdDev) Minimum Maximum N
Age in Years 36.39 ( 7.21) 21 59 634Education (Years) 16.33 ( 2.28) 11 21 634
Simple RT 1 - Dominant Hand 367.07 (104.49) 177 954 628Simple RT - Nondominant Hand 323.53 ( 68.03) 187 771 633Simple RT 2 - Dominant Hand 387.40 ( 93.09) 217 857 633Simple RT 3 - Dominant Hand 366.90 ( 81.06) 180 930 632
Choice Reaction Time - Digits 408.08 ( 41.65) 315 628 632Sequential Reaction Time 1 542.14 ( 93.73) 314 833 630Sequential Reaction Time 2 605.20 (112.64) 321 886 641*Lexical Discrimination 531.88 ( 58.51) 397 821 632Degraded Words with Distract 540.00 ( 82.11) 385 913 633Response Reversal - Words 654.50 ( 88.93) 462 966 633Form Discrimination 774.23 (133.54) 483 1133 627
Shown below are detailed explanations of the variable names used above and elsewhere in the normative tables. Fora complete description of the individual tasks, refer to the section of the manual entitled 'Standard Stimulus Materials.'
Key to Simple Reaction Time Tasks:
Simple RT 1 - Dominant = First iteration of the Simple Reaction Time task (first task in RT battery)Simple RT 2 - Dominant = Second iteration of the Simple Reaction Time task (given after approx. 10
minutes)Simple RT 3 - Dominant = Third iteration of the Simple Reaction Time task (last task in RT battery; given
after approx. 20 minutes)Simple RT - Nondominant = Simple Reaction Time task for the non-dominant hand (for all other tasks the
subject is asked to use his or her dominant hand).
Key to Choice Reaction Time Tasks:
Choice RT - Digits = Choice Reaction Time for Single DigitsSequential RT 1 = Sequential Reaction Time (Identical Numbers)Sequential RT 2 = Sequential Reaction Time (Numbers in Sequence)Lexical Discrimination = Lexication DiscriminationDegraded Words w/Distract= Visual Selective AttentionResponse Reversal = Response Reversal and Rapid Visual ScanningForm Discrimination = Form Discrimination
*Norms for Sequential RT 2 are based on an independent normative sample of 656 men drawn from the samepopulation as the original normative sample.
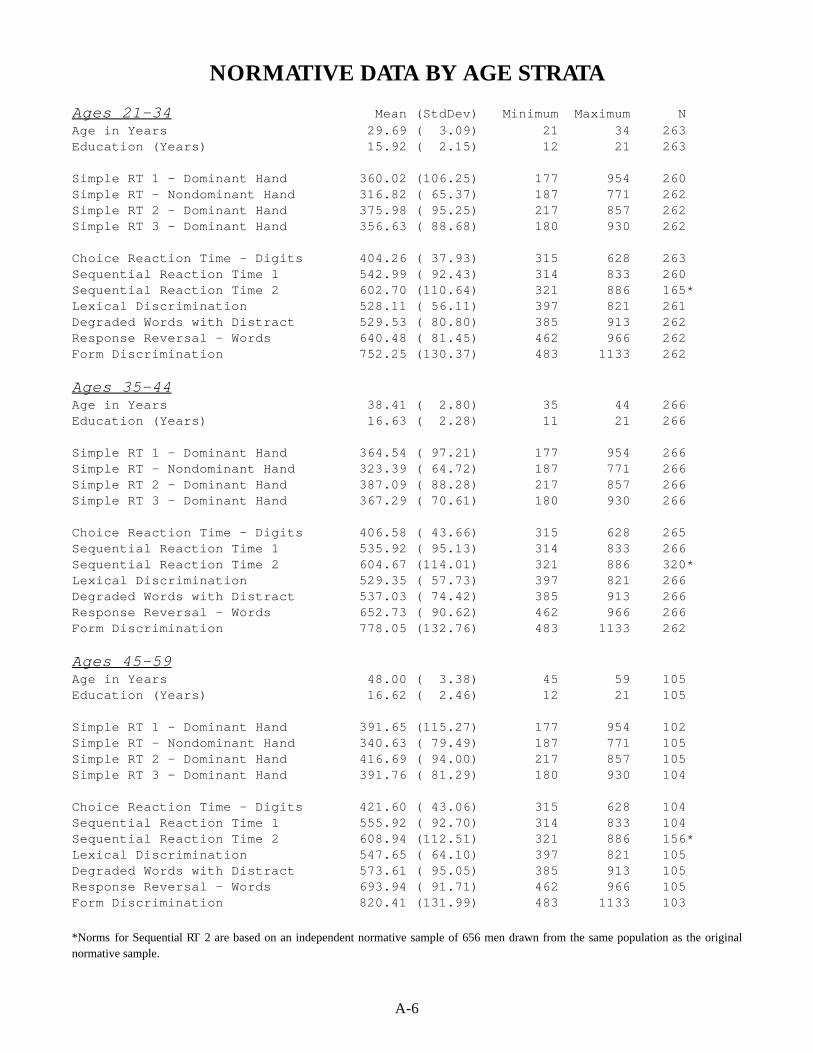
A-6
NORMATIVE DATA BY AGE STRATA
Ages 21-34 Mean (StdDev) Minimum Maximum NAge in Years 29.69 ( 3.09) 21 34 263Education (Years) 15.92 ( 2.15) 12 21 263
Simple RT 1 - Dominant Hand 360.02 (106.25) 177 954 260Simple RT - Nondominant Hand 316.82 ( 65.37) 187 771 262Simple RT 2 - Dominant Hand 375.98 ( 95.25) 217 857 262Simple RT 3 - Dominant Hand 356.63 ( 88.68) 180 930 262
Choice Reaction Time - Digits 404.26 ( 37.93) 315 628 263Sequential Reaction Time 1 542.99 ( 92.43) 314 833 260Sequential Reaction Time 2 602.70 (110.64) 321 886 165*Lexical Discrimination 528.11 ( 56.11) 397 821 261Degraded Words with Distract 529.53 ( 80.80) 385 913 262Response Reversal - Words 640.48 ( 81.45) 462 966 262Form Discrimination 752.25 (130.37) 483 1133 262 Ages 35-44Age in Years 38.41 ( 2.80) 35 44 266Education (Years) 16.63 ( 2.28) 11 21 266
Simple RT 1 - Dominant Hand 364.54 ( 97.21) 177 954 266Simple RT - Nondominant Hand 323.39 ( 64.72) 187 771 266Simple RT 2 - Dominant Hand 387.09 ( 88.28) 217 857 266Simple RT 3 - Dominant Hand 367.29 ( 70.61) 180 930 266
Choice Reaction Time - Digits 406.58 ( 43.66) 315 628 265Sequential Reaction Time 1 535.92 ( 95.13) 314 833 266Sequential Reaction Time 2 604.67 (114.01) 321 886 320*Lexical Discrimination 529.35 ( 57.73) 397 821 266Degraded Words with Distract 537.03 ( 74.42) 385 913 266Response Reversal - Words 652.73 ( 90.62) 462 966 266Form Discrimination 778.05 (132.76) 483 1133 262
Ages 45-59Age in Years 48.00 ( 3.38) 45 59 105Education (Years) 16.62 ( 2.46) 12 21 105
Simple RT 1 - Dominant Hand 391.65 (115.27) 177 954 102Simple RT - Nondominant Hand 340.63 ( 79.49) 187 771 105Simple RT 2 - Dominant Hand 416.69 ( 94.00) 217 857 105Simple RT 3 - Dominant Hand 391.76 ( 81.29) 180 930 104
Choice Reaction Time - Digits 421.60 ( 43.06) 315 628 104Sequential Reaction Time 1 555.92 ( 92.70) 314 833 104Sequential Reaction Time 2 608.94 (112.51) 321 886 156*Lexical Discrimination 547.65 ( 64.10) 397 821 105Degraded Words with Distract 573.61 ( 95.05) 385 913 105Response Reversal - Words 693.94 ( 91.71) 462 966 105Form Discrimination 820.41 (131.99) 483 1133 103
*Norms for Sequential RT 2 are based on an independent normative sample of 656 men drawn from the same population as the originalnormative sample.
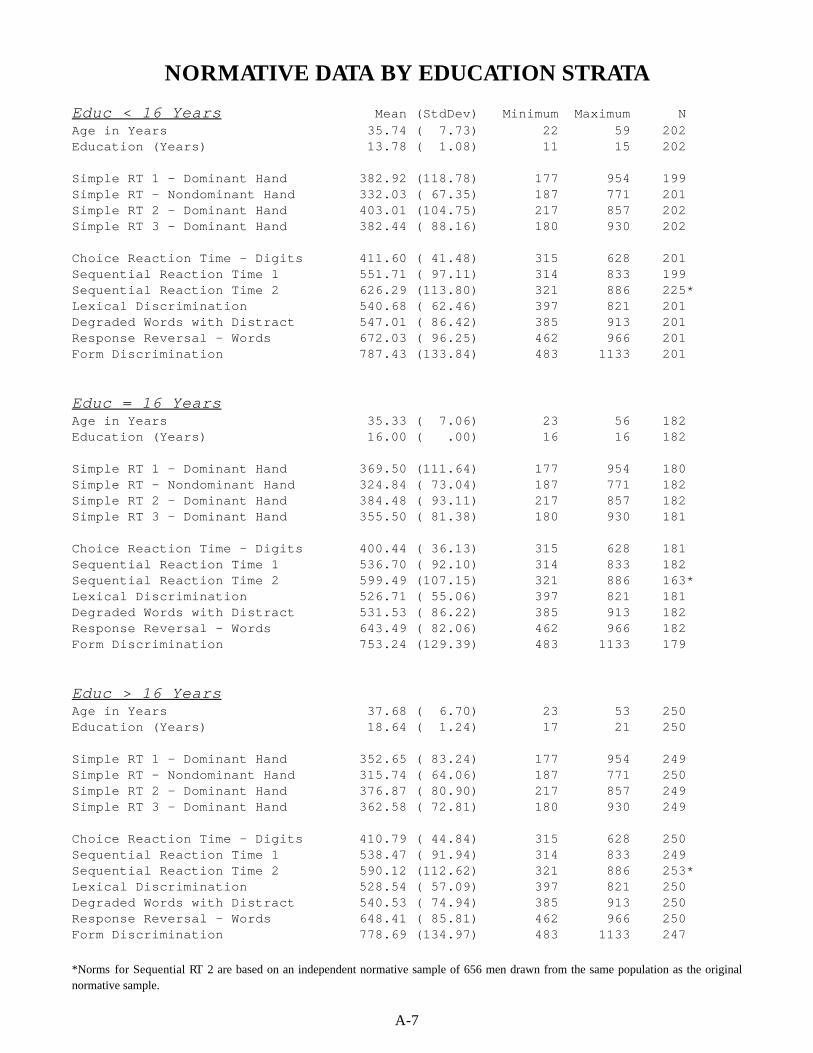
A-7
NORMATIVE DATA BY EDUCATION STRATA Educ < 16 Years Mean (StdDev) Minimum Maximum NAge in Years 35.74 ( 7.73) 22 59 202Education (Years) 13.78 ( 1.08) 11 15 202
Simple RT 1 - Dominant Hand 382.92 (118.78) 177 954 199Simple RT - Nondominant Hand 332.03 ( 67.35) 187 771 201Simple RT 2 - Dominant Hand 403.01 (104.75) 217 857 202Simple RT 3 - Dominant Hand 382.44 ( 88.16) 180 930 202
Choice Reaction Time - Digits 411.60 ( 41.48) 315 628 201Sequential Reaction Time 1 551.71 ( 97.11) 314 833 199Sequential Reaction Time 2 626.29 (113.80) 321 886 225*Lexical Discrimination 540.68 ( 62.46) 397 821 201Degraded Words with Distract 547.01 ( 86.42) 385 913 201Response Reversal - Words 672.03 ( 96.25) 462 966 201Form Discrimination 787.43 (133.84) 483 1133 201
Educ = 16 YearsAge in Years 35.33 ( 7.06) 23 56 182Education (Years) 16.00 ( .00) 16 16 182
Simple RT 1 - Dominant Hand 369.50 (111.64) 177 954 180Simple RT - Nondominant Hand 324.84 ( 73.04) 187 771 182Simple RT 2 - Dominant Hand 384.48 ( 93.11) 217 857 182Simple RT 3 - Dominant Hand 355.50 ( 81.38) 180 930 181
Choice Reaction Time - Digits 400.44 ( 36.13) 315 628 181Sequential Reaction Time 1 536.70 ( 92.10) 314 833 182Sequential Reaction Time 2 599.49 (107.15) 321 886 163*Lexical Discrimination 526.71 ( 55.06) 397 821 181Degraded Words with Distract 531.53 ( 86.22) 385 913 182Response Reversal - Words 643.49 ( 82.06) 462 966 182Form Discrimination 753.24 (129.39) 483 1133 179
Educ > 16 YearsAge in Years 37.68 ( 6.70) 23 53 250Education (Years) 18.64 ( 1.24) 17 21 250
Simple RT 1 - Dominant Hand 352.65 ( 83.24) 177 954 249Simple RT - Nondominant Hand 315.74 ( 64.06) 187 771 250Simple RT 2 - Dominant Hand 376.87 ( 80.90) 217 857 249Simple RT 3 - Dominant Hand 362.58 ( 72.81) 180 930 249
Choice Reaction Time - Digits 410.79 ( 44.84) 315 628 250Sequential Reaction Time 1 538.47 ( 91.94) 314 833 249Sequential Reaction Time 2 590.12 (112.62) 321 886 253*Lexical Discrimination 528.54 ( 57.09) 397 821 250Degraded Words with Distract 540.53 ( 74.94) 385 913 250Response Reversal - Words 648.41 ( 85.81) 462 966 250Form Discrimination 778.69 (134.97) 483 1133 247
*Norms for Sequential RT 2 are based on an independent normative sample of 656 men drawn from the same population as the originalnormative sample.
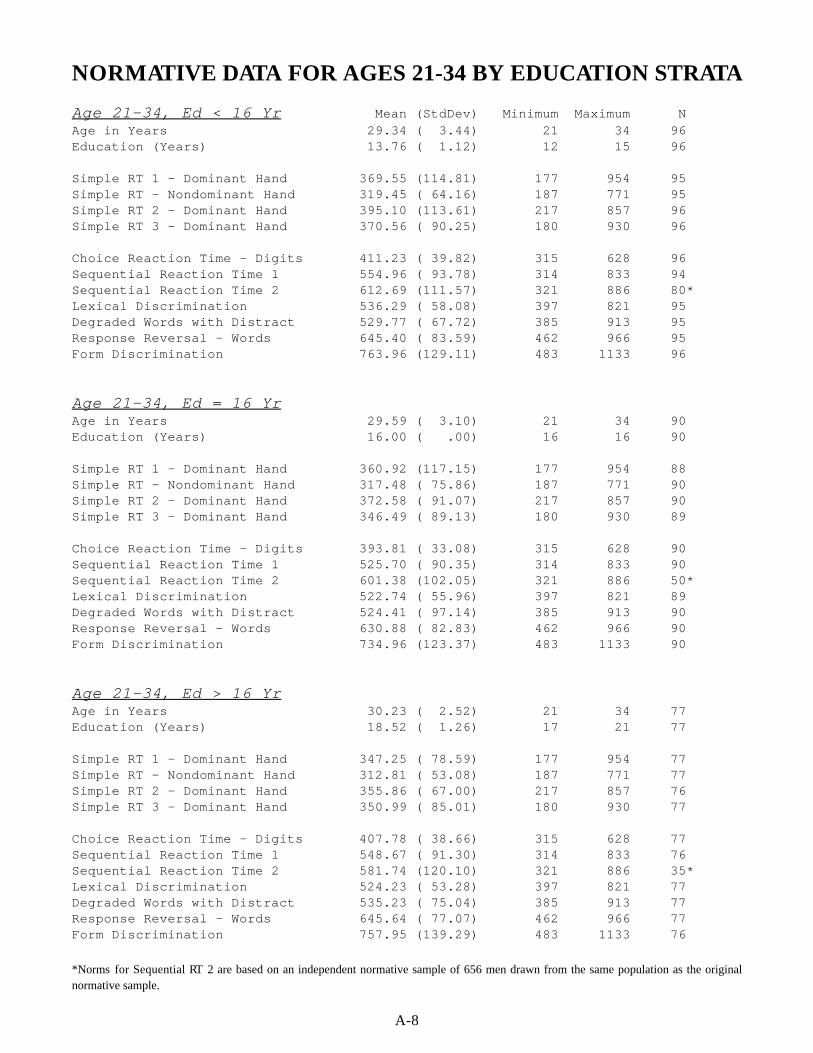
A-8
NORMATIVE DATA FOR AGES 21-34 BY EDUCATION STRATA
Age 21-34, Ed < 16 Yr Mean (StdDev) Minimum Maximum NAge in Years 29.34 ( 3.44) 21 34 96Education (Years) 13.76 ( 1.12) 12 15 96
Simple RT 1 - Dominant Hand 369.55 (114.81) 177 954 95Simple RT - Nondominant Hand 319.45 ( 64.16) 187 771 95Simple RT 2 - Dominant Hand 395.10 (113.61) 217 857 96Simple RT 3 - Dominant Hand 370.56 ( 90.25) 180 930 96
Choice Reaction Time - Digits 411.23 ( 39.82) 315 628 96Sequential Reaction Time 1 554.96 ( 93.78) 314 833 94Sequential Reaction Time 2 612.69 (111.57) 321 886 80*Lexical Discrimination 536.29 ( 58.08) 397 821 95Degraded Words with Distract 529.77 ( 67.72) 385 913 95Response Reversal - Words 645.40 ( 83.59) 462 966 95Form Discrimination 763.96 (129.11) 483 1133 96
Age 21-34, Ed = 16 YrAge in Years 29.59 ( 3.10) 21 34 90Education (Years) 16.00 ( .00) 16 16 90
Simple RT 1 - Dominant Hand 360.92 (117.15) 177 954 88Simple RT - Nondominant Hand 317.48 ( 75.86) 187 771 90Simple RT 2 - Dominant Hand 372.58 ( 91.07) 217 857 90Simple RT 3 - Dominant Hand 346.49 ( 89.13) 180 930 89
Choice Reaction Time - Digits 393.81 ( 33.08) 315 628 90Sequential Reaction Time 1 525.70 ( 90.35) 314 833 90Sequential Reaction Time 2 601.38 (102.05) 321 886 50*Lexical Discrimination 522.74 ( 55.96) 397 821 89Degraded Words with Distract 524.41 ( 97.14) 385 913 90Response Reversal - Words 630.88 ( 82.83) 462 966 90Form Discrimination 734.96 (123.37) 483 1133 90
Age 21-34, Ed > 16 YrAge in Years 30.23 ( 2.52) 21 34 77Education (Years) 18.52 ( 1.26) 17 21 77
Simple RT 1 - Dominant Hand 347.25 ( 78.59) 177 954 77Simple RT - Nondominant Hand 312.81 ( 53.08) 187 771 77Simple RT 2 - Dominant Hand 355.86 ( 67.00) 217 857 76Simple RT 3 - Dominant Hand 350.99 ( 85.01) 180 930 77
Choice Reaction Time - Digits 407.78 ( 38.66) 315 628 77Sequential Reaction Time 1 548.67 ( 91.30) 314 833 76Sequential Reaction Time 2 581.74 (120.10) 321 886 35*Lexical Discrimination 524.23 ( 53.28) 397 821 77Degraded Words with Distract 535.23 ( 75.04) 385 913 77Response Reversal - Words 645.64 ( 77.07) 462 966 77Form Discrimination 757.95 (139.29) 483 1133 76
*Norms for Sequential RT 2 are based on an independent normative sample of 656 men drawn from the same population as the originalnormative sample.
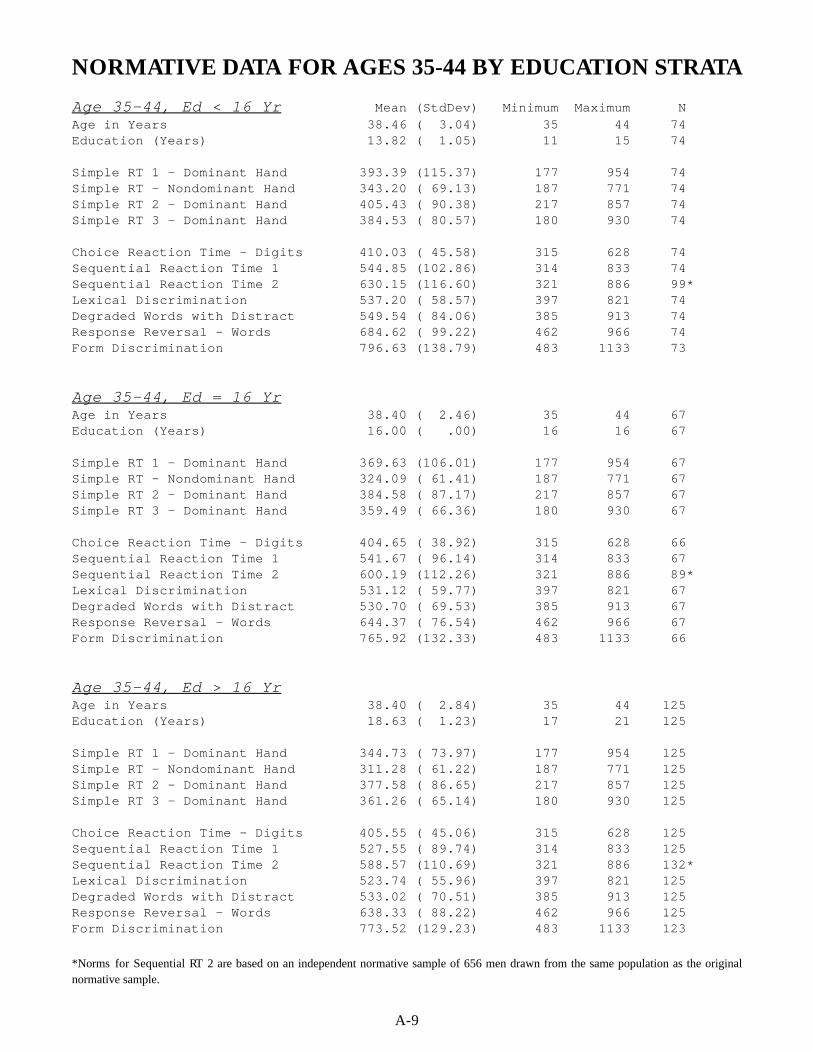
A-9
NORMATIVE DATA FOR AGES 35-44 BY EDUCATION STRATA
Age 35-44, Ed < 16 Yr Mean (StdDev) Minimum Maximum NAge in Years 38.46 ( 3.04) 35 44 74Education (Years) 13.82 ( 1.05) 11 15 74
Simple RT 1 - Dominant Hand 393.39 (115.37) 177 954 74Simple RT - Nondominant Hand 343.20 ( 69.13) 187 771 74Simple RT 2 - Dominant Hand 405.43 ( 90.38) 217 857 74Simple RT 3 - Dominant Hand 384.53 ( 80.57) 180 930 74
Choice Reaction Time - Digits 410.03 ( 45.58) 315 628 74Sequential Reaction Time 1 544.85 (102.86) 314 833 74Sequential Reaction Time 2 630.15 (116.60) 321 886 99*Lexical Discrimination 537.20 ( 58.57) 397 821 74Degraded Words with Distract 549.54 ( 84.06) 385 913 74Response Reversal - Words 684.62 ( 99.22) 462 966 74Form Discrimination 796.63 (138.79) 483 1133 73
Age 35-44, Ed = 16 YrAge in Years 38.40 ( 2.46) 35 44 67Education (Years) 16.00 ( .00) 16 16 67
Simple RT 1 - Dominant Hand 369.63 (106.01) 177 954 67Simple RT - Nondominant Hand 324.09 ( 61.41) 187 771 67Simple RT 2 - Dominant Hand 384.58 ( 87.17) 217 857 67Simple RT 3 - Dominant Hand 359.49 ( 66.36) 180 930 67
Choice Reaction Time - Digits 404.65 ( 38.92) 315 628 66Sequential Reaction Time 1 541.67 ( 96.14) 314 833 67Sequential Reaction Time 2 600.19 (112.26) 321 886 89*Lexical Discrimination 531.12 ( 59.77) 397 821 67Degraded Words with Distract 530.70 ( 69.53) 385 913 67Response Reversal - Words 644.37 ( 76.54) 462 966 67Form Discrimination 765.92 (132.33) 483 1133 66
Age 35-44, Ed > 16 YrAge in Years 38.40 ( 2.84) 35 44 125Education (Years) 18.63 ( 1.23) 17 21 125
Simple RT 1 - Dominant Hand 344.73 ( 73.97) 177 954 125Simple RT - Nondominant Hand 311.28 ( 61.22) 187 771 125Simple RT 2 - Dominant Hand 377.58 ( 86.65) 217 857 125Simple RT 3 - Dominant Hand 361.26 ( 65.14) 180 930 125
Choice Reaction Time - Digits 405.55 ( 45.06) 315 628 125Sequential Reaction Time 1 527.55 ( 89.74) 314 833 125Sequential Reaction Time 2 588.57 (110.69) 321 886 132*Lexical Discrimination 523.74 ( 55.96) 397 821 125Degraded Words with Distract 533.02 ( 70.51) 385 913 125Response Reversal - Words 638.33 ( 88.22) 462 966 125Form Discrimination 773.52 (129.23) 483 1133 123
*Norms for Sequential RT 2 are based on an independent normative sample of 656 men drawn from the same population as the originalnormative sample.
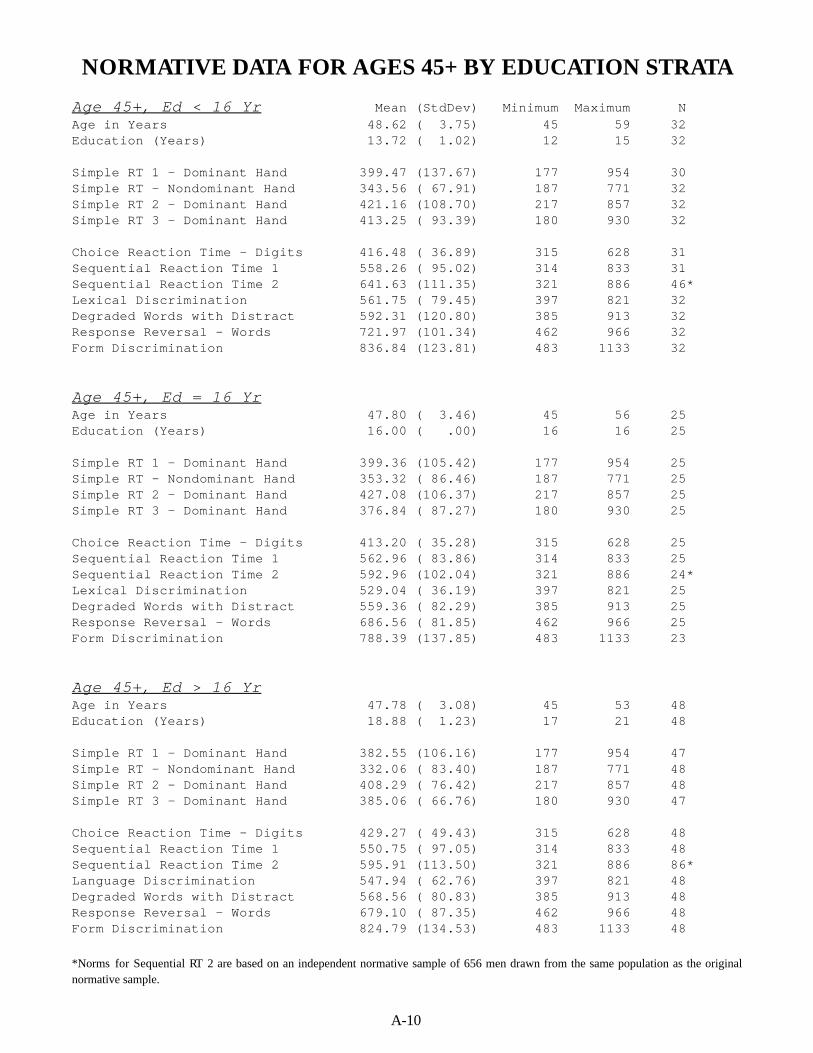
A-10
NORMATIVE DATA FOR AGES 45+ BY EDUCATION STRATA
Age 45+, Ed < 16 Yr Mean (StdDev) Minimum Maximum NAge in Years 48.62 ( 3.75) 45 59 32Education (Years) 13.72 ( 1.02) 12 15 32
Simple RT 1 - Dominant Hand 399.47 (137.67) 177 954 30Simple RT - Nondominant Hand 343.56 ( 67.91) 187 771 32Simple RT 2 - Dominant Hand 421.16 (108.70) 217 857 32Simple RT 3 - Dominant Hand 413.25 ( 93.39) 180 930 32
Choice Reaction Time - Digits 416.48 ( 36.89) 315 628 31Sequential Reaction Time 1 558.26 ( 95.02) 314 833 31Sequential Reaction Time 2 641.63 (111.35) 321 886 46*Lexical Discrimination 561.75 ( 79.45) 397 821 32Degraded Words with Distract 592.31 (120.80) 385 913 32Response Reversal - Words 721.97 (101.34) 462 966 32Form Discrimination 836.84 (123.81) 483 1133 32
Age 45+, Ed = 16 YrAge in Years 47.80 ( 3.46) 45 56 25Education (Years) 16.00 ( .00) 16 16 25
Simple RT 1 - Dominant Hand 399.36 (105.42) 177 954 25Simple RT - Nondominant Hand 353.32 ( 86.46) 187 771 25Simple RT 2 - Dominant Hand 427.08 (106.37) 217 857 25Simple RT 3 - Dominant Hand 376.84 ( 87.27) 180 930 25
Choice Reaction Time - Digits 413.20 ( 35.28) 315 628 25Sequential Reaction Time 1 562.96 ( 83.86) 314 833 25Sequential Reaction Time 2 592.96 (102.04) 321 886 24*Lexical Discrimination 529.04 ( 36.19) 397 821 25Degraded Words with Distract 559.36 ( 82.29) 385 913 25Response Reversal - Words 686.56 ( 81.85) 462 966 25Form Discrimination 788.39 (137.85) 483 1133 23
Age 45+, Ed > 16 YrAge in Years 47.78 ( 3.08) 45 53 48Education (Years) 18.88 ( 1.23) 17 21 48
Simple RT 1 - Dominant Hand 382.55 (106.16) 177 954 47Simple RT - Nondominant Hand 332.06 ( 83.40) 187 771 48Simple RT 2 - Dominant Hand 408.29 ( 76.42) 217 857 48Simple RT 3 - Dominant Hand 385.06 ( 66.76) 180 930 47
Choice Reaction Time - Digits 429.27 ( 49.43) 315 628 48Sequential Reaction Time 1 550.75 ( 97.05) 314 833 48Sequential Reaction Time 2 595.91 (113.50) 321 886 86*Language Discrimination 547.94 ( 62.76) 397 821 48Degraded Words with Distract 568.56 ( 80.83) 385 913 48Response Reversal - Words 679.10 ( 87.35) 462 966 48Form Discrimination 824.79 (134.53) 483 1133 48
*Norms for Sequential RT 2 are based on an independent normative sample of 656 men drawn from the same population as the originalnormative sample.
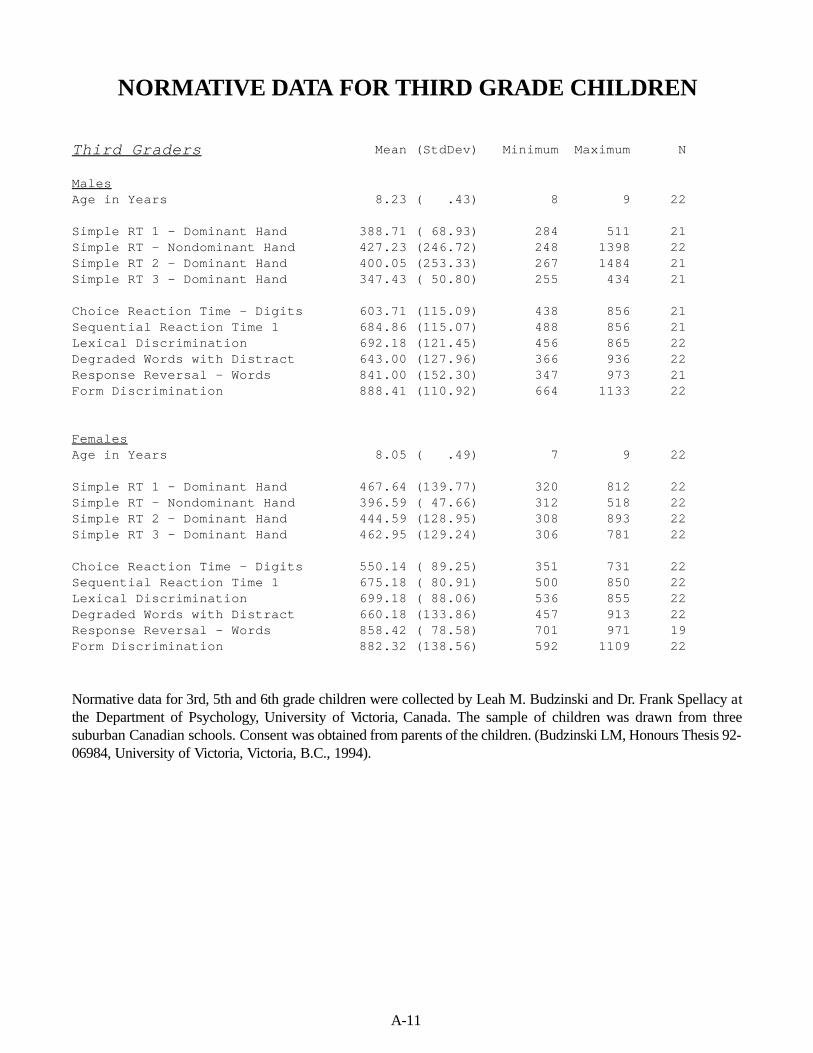
A-11
NORMATIVE DATA FOR THIRD GRADE CHILDREN
Third Graders Mean (StdDev) Minimum Maximum N
MalesAge in Years 8.23 ( .43) 8 9 22
Simple RT 1 - Dominant Hand 388.71 ( 68.93) 284 511 21Simple RT - Nondominant Hand 427.23 (246.72) 248 1398 22Simple RT 2 - Dominant Hand 400.05 (253.33) 267 1484 21Simple RT 3 - Dominant Hand 347.43 ( 50.80) 255 434 21
Choice Reaction Time - Digits 603.71 (115.09) 438 856 21Sequential Reaction Time 1 684.86 (115.07) 488 856 21Lexical Discrimination 692.18 (121.45) 456 865 22Degraded Words with Distract 643.00 (127.96) 366 936 22Response Reversal - Words 841.00 (152.30) 347 973 21Form Discrimination 888.41 (110.92) 664 1133 22
FemalesAge in Years 8.05 ( .49) 7 9 22
Simple RT 1 - Dominant Hand 467.64 (139.77) 320 812 22Simple RT - Nondominant Hand 396.59 ( 47.66) 312 518 22Simple RT 2 - Dominant Hand 444.59 (128.95) 308 893 22Simple RT 3 - Dominant Hand 462.95 (129.24) 306 781 22
Choice Reaction Time - Digits 550.14 ( 89.25) 351 731 22Sequential Reaction Time 1 675.18 ( 80.91) 500 850 22Lexical Discrimination 699.18 ( 88.06) 536 855 22Degraded Words with Distract 660.18 (133.86) 457 913 22Response Reversal - Words 858.42 ( 78.58) 701 971 19Form Discrimination 882.32 (138.56) 592 1109 22
Normative data for 3rd, 5th and 6th grade children were collected by Leah M. Budzinski and Dr. Frank Spellacy atthe Department of Psychology, University of Victoria, Canada. The sample of children was drawn from threesuburban Canadian schools. Consent was obtained from parents of the children. (Budzinski LM, Honours Thesis 92-06984, University of Victoria, Victoria, B.C., 1994).
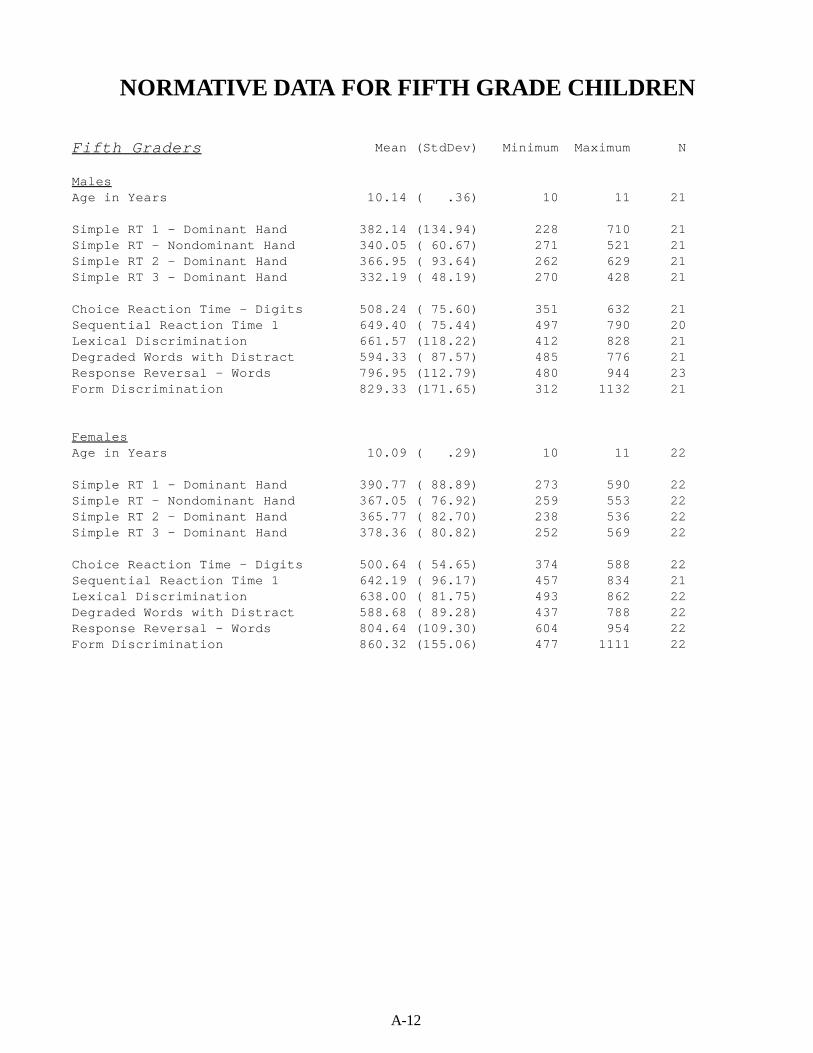
A-12
NORMATIVE DATA FOR FIFTH GRADE CHILDREN
Fifth Graders Mean (StdDev) Minimum Maximum N
MalesAge in Years 10.14 ( .36) 10 11 21
Simple RT 1 - Dominant Hand 382.14 (134.94) 228 710 21Simple RT - Nondominant Hand 340.05 ( 60.67) 271 521 21Simple RT 2 - Dominant Hand 366.95 ( 93.64) 262 629 21Simple RT 3 - Dominant Hand 332.19 ( 48.19) 270 428 21
Choice Reaction Time - Digits 508.24 ( 75.60) 351 632 21Sequential Reaction Time 1 649.40 ( 75.44) 497 790 20Lexical Discrimination 661.57 (118.22) 412 828 21Degraded Words with Distract 594.33 ( 87.57) 485 776 21Response Reversal - Words 796.95 (112.79) 480 944 23Form Discrimination 829.33 (171.65) 312 1132 21
FemalesAge in Years 10.09 ( .29) 10 11 22
Simple RT 1 - Dominant Hand 390.77 ( 88.89) 273 590 22Simple RT - Nondominant Hand 367.05 ( 76.92) 259 553 22Simple RT 2 - Dominant Hand 365.77 ( 82.70) 238 536 22Simple RT 3 - Dominant Hand 378.36 ( 80.82) 252 569 22
Choice Reaction Time - Digits 500.64 ( 54.65) 374 588 22Sequential Reaction Time 1 642.19 ( 96.17) 457 834 21Lexical Discrimination 638.00 ( 81.75) 493 862 22Degraded Words with Distract 588.68 ( 89.28) 437 788 22Response Reversal - Words 804.64 (109.30) 604 954 22Form Discrimination 860.32 (155.06) 477 1111 22
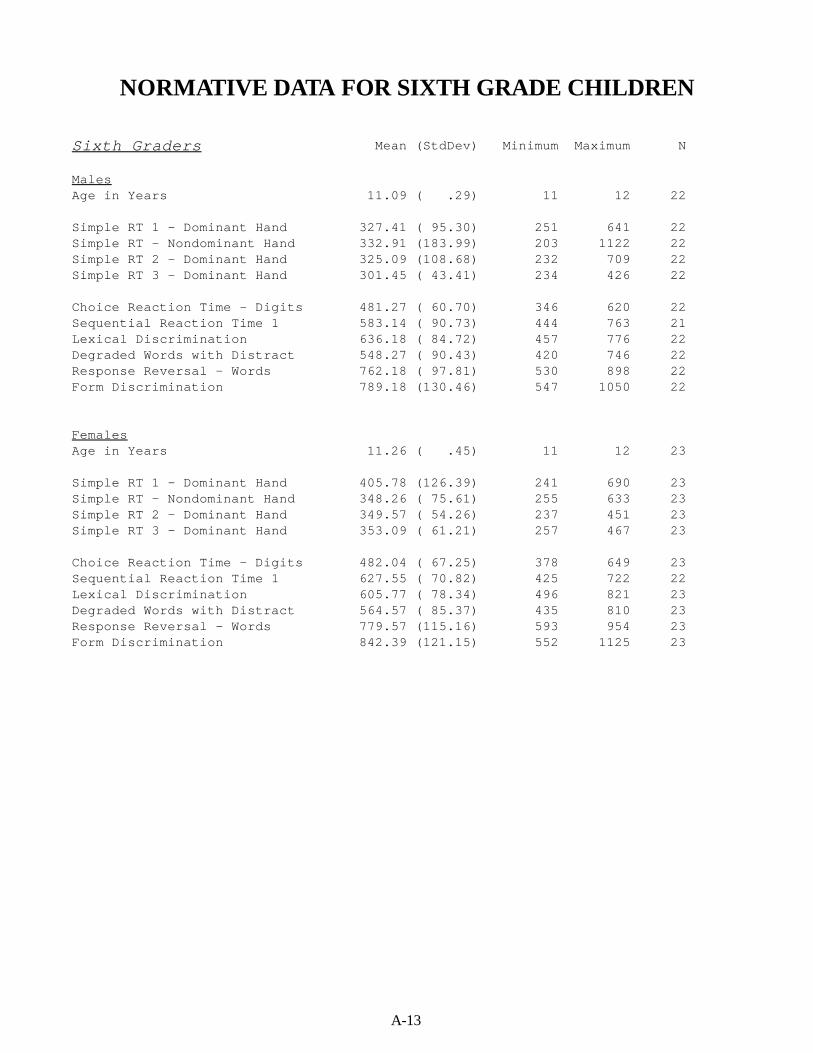
A-13
NORMATIVE DATA FOR SIXTH GRADE CHILDREN
Sixth Graders Mean (StdDev) Minimum Maximum N
MalesAge in Years 11.09 ( .29) 11 12 22
Simple RT 1 - Dominant Hand 327.41 ( 95.30) 251 641 22Simple RT - Nondominant Hand 332.91 (183.99) 203 1122 22Simple RT 2 - Dominant Hand 325.09 (108.68) 232 709 22Simple RT 3 - Dominant Hand 301.45 ( 43.41) 234 426 22
Choice Reaction Time - Digits 481.27 ( 60.70) 346 620 22Sequential Reaction Time 1 583.14 ( 90.73) 444 763 21Lexical Discrimination 636.18 ( 84.72) 457 776 22Degraded Words with Distract 548.27 ( 90.43) 420 746 22Response Reversal - Words 762.18 ( 97.81) 530 898 22Form Discrimination 789.18 (130.46) 547 1050 22
FemalesAge in Years 11.26 ( .45) 11 12 23
Simple RT 1 - Dominant Hand 405.78 (126.39) 241 690 23Simple RT - Nondominant Hand 348.26 ( 75.61) 255 633 23Simple RT 2 - Dominant Hand 349.57 ( 54.26) 237 451 23Simple RT 3 - Dominant Hand 353.09 ( 61.21) 257 467 23
Choice Reaction Time - Digits 482.04 ( 67.25) 378 649 23Sequential Reaction Time 1 627.55 ( 70.82) 425 722 22Lexical Discrimination 605.77 ( 78.34) 496 821 23Degraded Words with Distract 564.57 ( 85.37) 435 810 23Response Reversal - Words 779.57 (115.16) 593 954 23Form Discrimination 842.39 (121.15) 552 1125 23
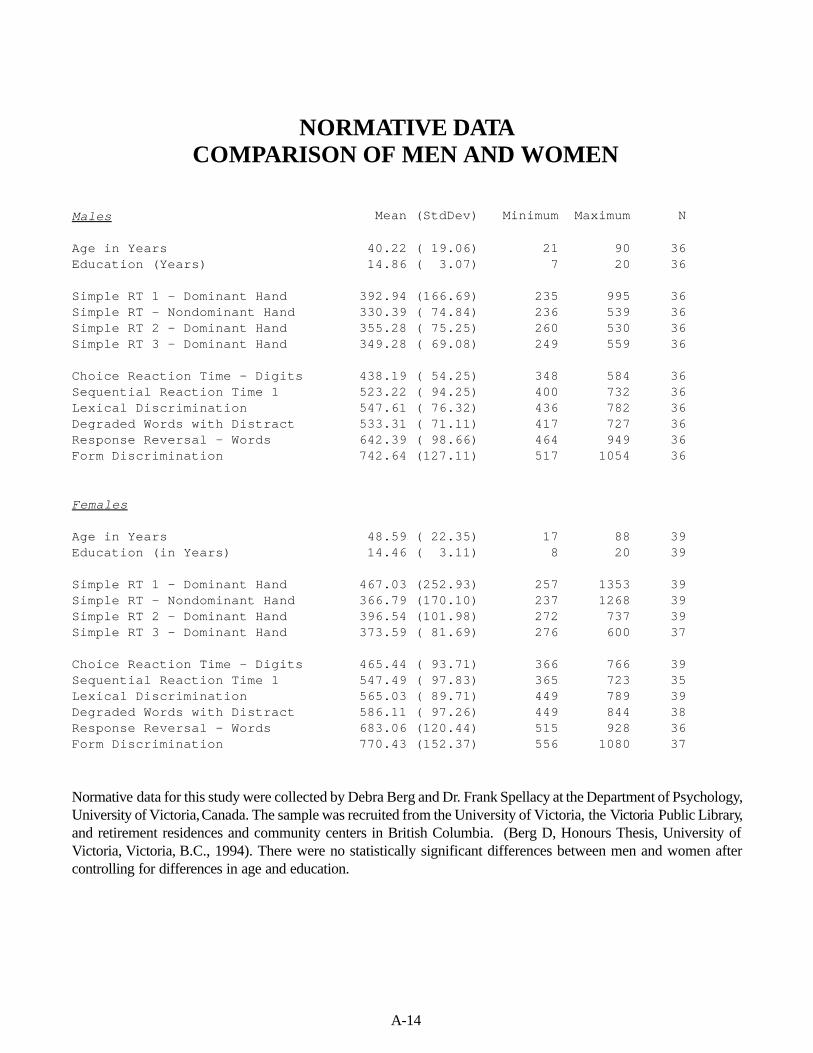
A-14
NORMATIVE DATACOMPARISON OF MEN AND WOMEN
Males Mean (StdDev) Minimum Maximum N
Age in Years 40.22 ( 19.06) 21 90 36Education (Years) 14.86 ( 3.07) 7 20 36
Simple RT 1 - Dominant Hand 392.94 (166.69) 235 995 36Simple RT - Nondominant Hand 330.39 ( 74.84) 236 539 36Simple RT 2 - Dominant Hand 355.28 ( 75.25) 260 530 36Simple RT 3 - Dominant Hand 349.28 ( 69.08) 249 559 36
Choice Reaction Time - Digits 438.19 ( 54.25) 348 584 36Sequential Reaction Time 1 523.22 ( 94.25) 400 732 36Lexical Discrimination 547.61 ( 76.32) 436 782 36Degraded Words with Distract 533.31 ( 71.11) 417 727 36Response Reversal - Words 642.39 ( 98.66) 464 949 36Form Discrimination 742.64 (127.11) 517 1054 36
Females
Age in Years 48.59 ( 22.35) 17 88 39Education (in Years) 14.46 ( 3.11) 8 20 39
Simple RT 1 - Dominant Hand 467.03 (252.93) 257 1353 39Simple RT - Nondominant Hand 366.79 (170.10) 237 1268 39Simple RT 2 - Dominant Hand 396.54 (101.98) 272 737 39Simple RT 3 - Dominant Hand 373.59 ( 81.69) 276 600 37
Choice Reaction Time - Digits 465.44 ( 93.71) 366 766 39Sequential Reaction Time 1 547.49 ( 97.83) 365 723 35Lexical Discrimination 565.03 ( 89.71) 449 789 39Degraded Words with Distract 586.11 ( 97.26) 449 844 38Response Reversal - Words 683.06 (120.44) 515 928 36Form Discrimination 770.43 (152.37) 556 1080 37
Normative data for this study were collected by Debra Berg and Dr. Frank Spellacy at the Department of Psychology,University of Victoria, Canada. The sample was recruited from the University of Victoria, the Victoria Public Library,and retirement residences and community centers in British Columbia. (Berg D, Honours Thesis, University ofVictoria, Victoria, B.C., 1994). There were no statistically significant differences between men and women aftercontrolling for differences in age and education.
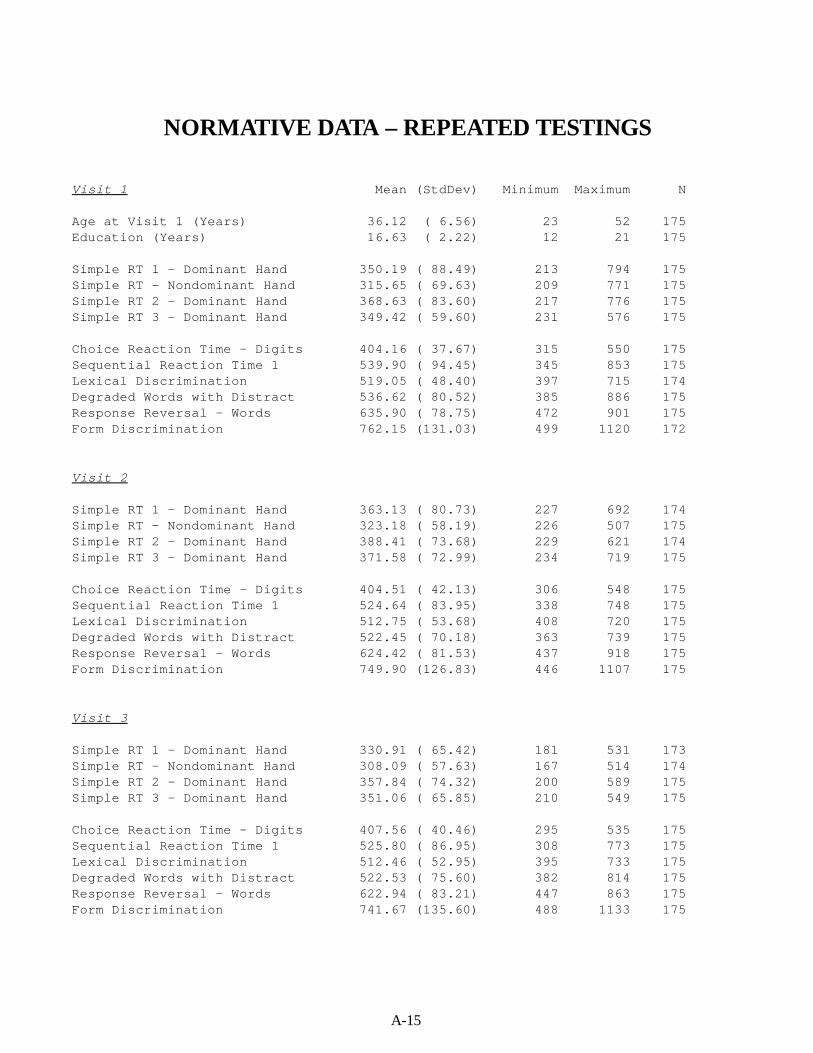
A-15
NORMATIVE DATA – REPEATED TESTINGS
Visit 1 Mean (StdDev) Minimum Maximum N
Age at Visit 1 (Years) 36.12 ( 6.56) 23 52 175Education (Years) 16.63 ( 2.22) 12 21 175
Simple RT 1 - Dominant Hand 350.19 ( 88.49) 213 794 175Simple RT - Nondominant Hand 315.65 ( 69.63) 209 771 175Simple RT 2 - Dominant Hand 368.63 ( 83.60) 217 776 175Simple RT 3 - Dominant Hand 349.42 ( 59.60) 231 576 175
Choice Reaction Time - Digits 404.16 ( 37.67) 315 550 175Sequential Reaction Time 1 539.90 ( 94.45) 345 853 175Lexical Discrimination 519.05 ( 48.40) 397 715 174Degraded Words with Distract 536.62 ( 80.52) 385 886 175Response Reversal - Words 635.90 ( 78.75) 472 901 175Form Discrimination 762.15 (131.03) 499 1120 172
Visit 2
Simple RT 1 - Dominant Hand 363.13 ( 80.73) 227 692 174Simple RT - Nondominant Hand 323.18 ( 58.19) 226 507 175Simple RT 2 - Dominant Hand 388.41 ( 73.68) 229 621 174Simple RT 3 - Dominant Hand 371.58 ( 72.99) 234 719 175
Choice Reaction Time - Digits 404.51 ( 42.13) 306 548 175Sequential Reaction Time 1 524.64 ( 83.95) 338 748 175Lexical Discrimination 512.75 ( 53.68) 408 720 175Degraded Words with Distract 522.45 ( 70.18) 363 739 175Response Reversal - Words 624.42 ( 81.53) 437 918 175Form Discrimination 749.90 (126.83) 446 1107 175
Visit 3
Simple RT 1 - Dominant Hand 330.91 ( 65.42) 181 531 173Simple RT - Nondominant Hand 308.09 ( 57.63) 167 514 174Simple RT 2 - Dominant Hand 357.84 ( 74.32) 200 589 175Simple RT 3 - Dominant Hand 351.06 ( 65.85) 210 549 175
Choice Reaction Time - Digits 407.56 ( 40.46) 295 535 175Sequential Reaction Time 1 525.80 ( 86.95) 308 773 175Lexical Discrimination 512.46 ( 52.95) 395 733 175Degraded Words with Distract 522.53 ( 75.60) 382 814 175Response Reversal - Words 622.94 ( 83.21) 447 863 175Form Discrimination 741.67 (135.60) 488 1133 175
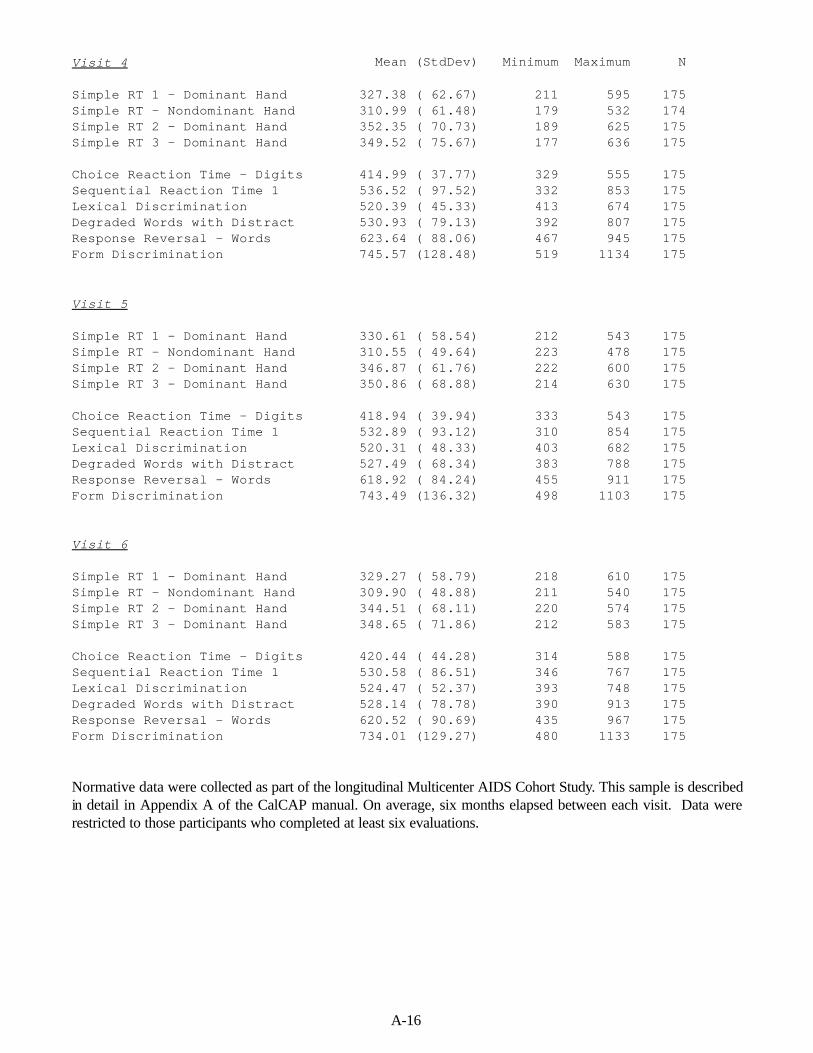
A-16
Visit 4 Mean (StdDev) Minimum Maximum N
Simple RT 1 - Dominant Hand 327.38 ( 62.67) 211 595 175Simple RT - Nondominant Hand 310.99 ( 61.48) 179 532 174Simple RT 2 - Dominant Hand 352.35 ( 70.73) 189 625 175Simple RT 3 - Dominant Hand 349.52 ( 75.67) 177 636 175
Choice Reaction Time - Digits 414.99 ( 37.77) 329 555 175Sequential Reaction Time 1 536.52 ( 97.52) 332 853 175Lexical Discrimination 520.39 ( 45.33) 413 674 175Degraded Words with Distract 530.93 ( 79.13) 392 807 175Response Reversal - Words 623.64 ( 88.06) 467 945 175Form Discrimination 745.57 (128.48) 519 1134 175
Visit 5
Simple RT 1 - Dominant Hand 330.61 ( 58.54) 212 543 175Simple RT - Nondominant Hand 310.55 ( 49.64) 223 478 175Simple RT 2 - Dominant Hand 346.87 ( 61.76) 222 600 175Simple RT 3 - Dominant Hand 350.86 ( 68.88) 214 630 175
Choice Reaction Time - Digits 418.94 ( 39.94) 333 543 175Sequential Reaction Time 1 532.89 ( 93.12) 310 854 175Lexical Discrimination 520.31 ( 48.33) 403 682 175Degraded Words with Distract 527.49 ( 68.34) 383 788 175Response Reversal - Words 618.92 ( 84.24) 455 911 175Form Discrimination 743.49 (136.32) 498 1103 175
Visit 6
Simple RT 1 - Dominant Hand 329.27 ( 58.79) 218 610 175Simple RT - Nondominant Hand 309.90 ( 48.88) 211 540 175Simple RT 2 - Dominant Hand 344.51 ( 68.11) 220 574 175Simple RT 3 - Dominant Hand 348.65 ( 71.86) 212 583 175
Choice Reaction Time - Digits 420.44 ( 44.28) 314 588 175Sequential Reaction Time 1 530.58 ( 86.51) 346 767 175Lexical Discrimination 524.47 ( 52.37) 393 748 175Degraded Words with Distract 528.14 ( 78.78) 390 913 175Response Reversal - Words 620.52 ( 90.69) 435 967 175Form Discrimination 734.01 (129.27) 480 1133 175
Normative data were collected as part of the longitudinal Multicenter AIDS Cohort Study. This sample is describedin detail in Appendix A of the CalCAP manual. On average, six months elapsed between each visit. Data wererestricted to those participants who completed at least six evaluations.
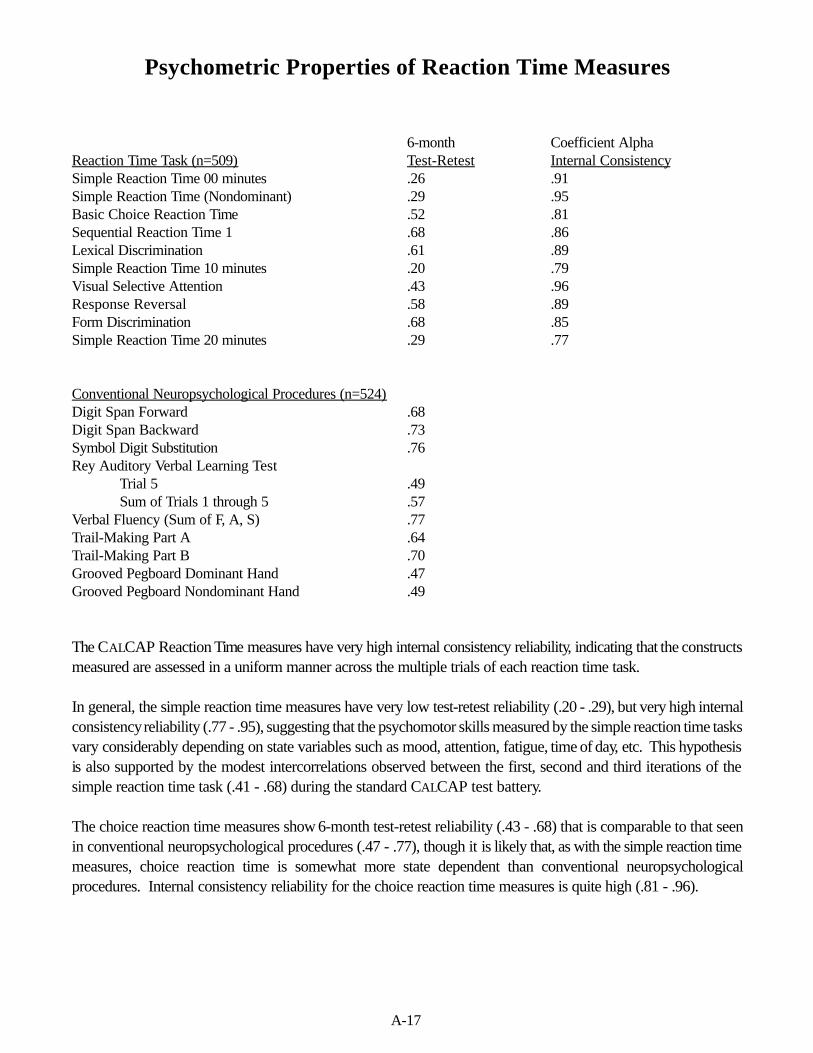
A-17
Psychometric Properties of Reaction Time Measures
6-month Coefficient AlphaReaction Time Task (n=509) Test-Retest Internal ConsistencySimple Reaction Time 00 minutes .26 .91Simple Reaction Time (Nondominant) .29 .95Basic Choice Reaction Time .52 .81Sequential Reaction Time 1 .68 .86Lexical Discrimination .61 .89Simple Reaction Time 10 minutes .20 .79Visual Selective Attention .43 .96Response Reversal .58 .89Form Discrimination .68 .85Simple Reaction Time 20 minutes .29 .77
Conventional Neuropsychological Procedures (n=524)Digit Span Forward .68Digit Span Backward .73Symbol Digit Substitution .76Rey Auditory Verbal Learning Test
Trial 5 .49Sum of Trials 1 through 5 .57
Verbal Fluency (Sum of F, A, S) .77Trail-Making Part A .64Trail-Making Part B .70Grooved Pegboard Dominant Hand .47Grooved Pegboard Nondominant Hand .49
The CALCAP Reaction Time measures have very high internal consistency reliability, indicating that the constructsmeasured are assessed in a uniform manner across the multiple trials of each reaction time task.
In general, the simple reaction time measures have very low test-retest reliability (.20 - .29), but very high internalconsistency reliability (.77 - .95), suggesting that the psychomotor skills measured by the simple reaction time tasksvary considerably depending on state variables such as mood, attention, fatigue, time of day, etc. This hypothesisis also supported by the modest intercorrelations observed between the first, second and third iterations of thesimple reaction time task (.41 - .68) during the standard CALCAP test battery.
The choice reaction time measures show 6-month test-retest reliability (.43 - .68) that is comparable to that seenin conventional neuropsychological procedures (.47 - .77), though it is likely that, as with the simple reaction timemeasures, choice reaction time is somewhat more state dependent than conventional neuropsychologicalprocedures. Internal consistency reliability for the choice reaction time measures is quite high (.81 - .96).

A-18
NOTE: Simple Reaction Time in the CALCAP test package was originally derived based on a very short set of 6reaction time trials. For greater stability, CALCAP currently uses either 12 (Standard Version) or 15 (AbbreviatedVersion) simple reaction time trials. The numbers below show the differences among the different lengths of thesetasks:
CoeffReaction Time Task Mean (SD) Alpha NSimple RT - 6 trials 354 (103) .85 647Simple RT - 12 trials 341 (95) .91 647Simple RT - 15 trials 337 (93) .90 647
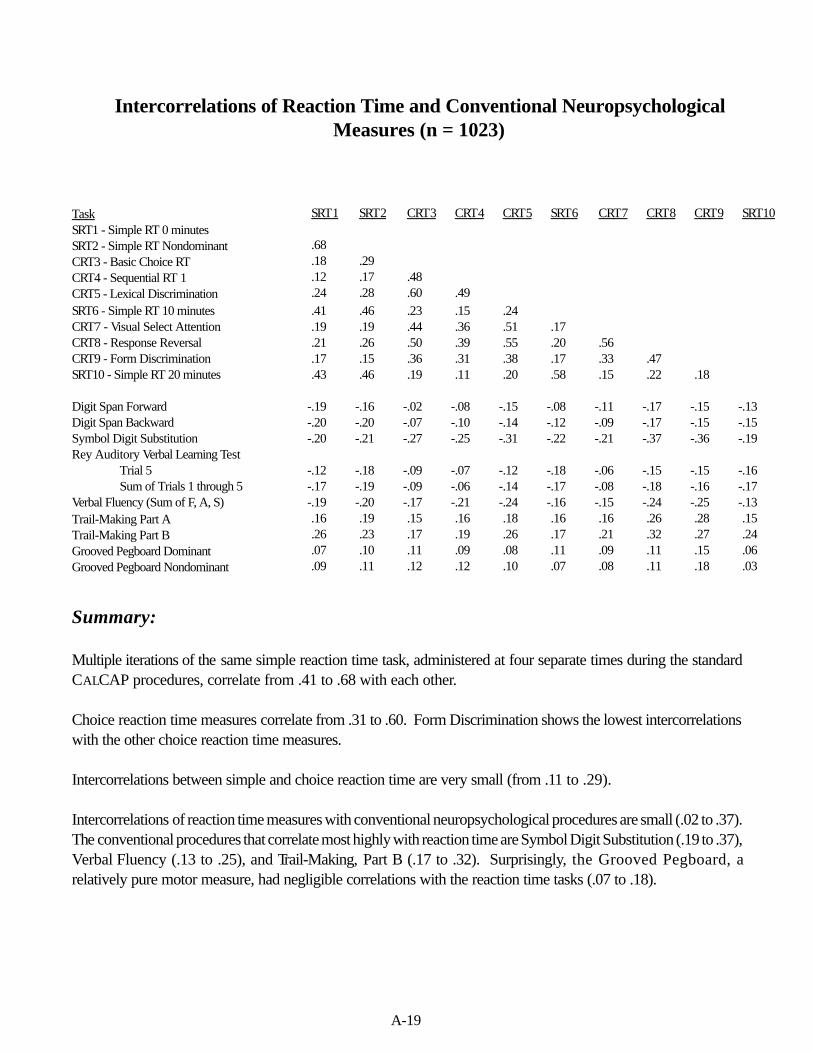
A-19
Intercorrelations of Reaction Time and Conventional NeuropsychologicalMeasures (n = 1023)
Task SRT1 SRT2 CRT3 CRT4 CRT5 SRT6 CRT7 CRT8 CRT9 SRT10SRT1 - Simple RT 0 minutesSRT2 - Simple RT Nondominant .68CRT3 - Basic Choice RT .18 .29CRT4 - Sequential RT 1 .12 .17 .48CRT5 - Lexical Discrimination .24 .28 .60 .49SRT6 - Simple RT 10 minutes .41 .46 .23 .15 .24CRT7 - Visual Select Attention .19 .19 .44 .36 .51 .17CRT8 - Response Reversal .21 .26 .50 .39 .55 .20 .56CRT9 - Form Discrimination .17 .15 .36 .31 .38 .17 .33 .47SRT10 - Simple RT 20 minutes .43 .46 .19 .11 .20 .58 .15 .22 .18
Digit Span Forward -.19 -.16 -.02 -.08 -.15 -.08 -.11 -.17 -.15 -.13Digit Span Backward -.20 -.20 -.07 -.10 -.14 -.12 -.09 -.17 -.15 -.15Symbol Digit Substitution -.20 -.21 -.27 -.25 -.31 -.22 -.21 -.37 -.36 -.19Rey Auditory Verbal Learning Test
Trial 5 -.12 -.18 -.09 -.07 -.12 -.18 -.06 -.15 -.15 -.16Sum of Trials 1 through 5 -.17 -.19 -.09 -.06 -.14 -.17 -.08 -.18 -.16 -.17
Verbal Fluency (Sum of F, A, S) -.19 -.20 -.17 -.21 -.24 -.16 -.15 -.24 -.25 -.13Trail-Making Part A .16 .19 .15 .16 .18 .16 .16 .26 .28 .15Trail-Making Part B .26 .23 .17 .19 .26 .17 .21 .32 .27 .24Grooved Pegboard Dominant .07 .10 .11 .09 .08 .11 .09 .11 .15 .06Grooved Pegboard Nondominant .09 .11 .12 .12 .10 .07 .08 .11 .18 .03
Summary:
Multiple iterations of the same simple reaction time task, administered at four separate times during the standardCALCAP procedures, correlate from .41 to .68 with each other.
Choice reaction time measures correlate from .31 to .60. Form Discrimination shows the lowest intercorrelationswith the other choice reaction time measures.
Intercorrelations between simple and choice reaction time are very small (from .11 to .29).
Intercorrelations of reaction time measures with conventional neuropsychological procedures are small (.02 to .37).The conventional procedures that correlate most highly with reaction time are Symbol Digit Substitution (.19 to .37),Verbal Fluency (.13 to .25), and Trail-Making, Part B (.17 to .32). Surprisingly, the Grooved Pegboard, arelatively pure motor measure, had negligible correlations with the reaction time tasks (.07 to .18).
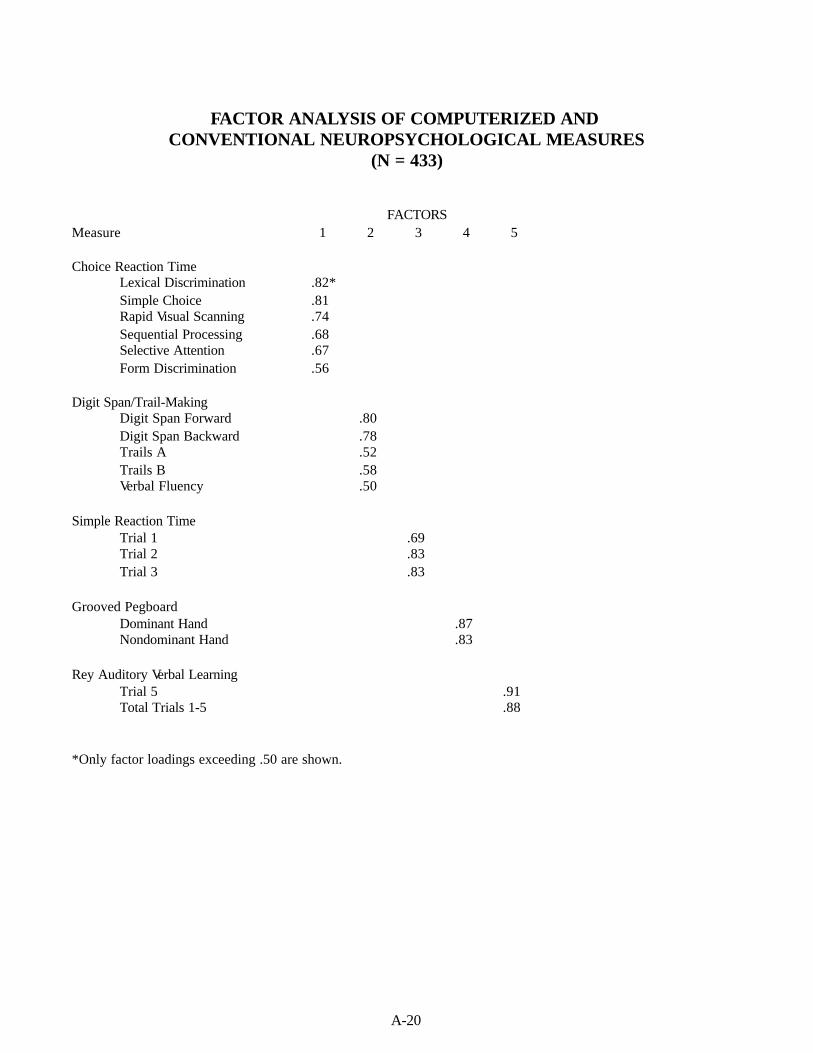
A-20
FACTOR ANALYSIS OF COMPUTERIZED AND CONVENTIONAL NEUROPSYCHOLOGICAL MEASURES
(N = 433)
FACTORSMeasure 1 2 3 4 5
Choice Reaction TimeLexical Discrimination .82*Simple Choice .81Rapid Visual Scanning .74Sequential Processing .68Selective Attention .67Form Discrimination .56
Digit Span/Trail-MakingDigit Span Forward .80Digit Span Backward .78Trails A .52Trails B .58Verbal Fluency .50
Simple Reaction TimeTrial 1 .69Trial 2 .83Trial 3 .83
Grooved PegboardDominant Hand .87Nondominant Hand .83
Rey Auditory Verbal LearningTrial 5 .91Total Trials 1-5 .88
*Only factor loadings exceeding .50 are shown.
B-1
APPENDIX B
SAMPLE REPORT
The following pages show a sample 6-page printout from a standard CalCAP test battery. See “Interpretation ofReaction Time Results” in the manual for additional information about test interpretation.
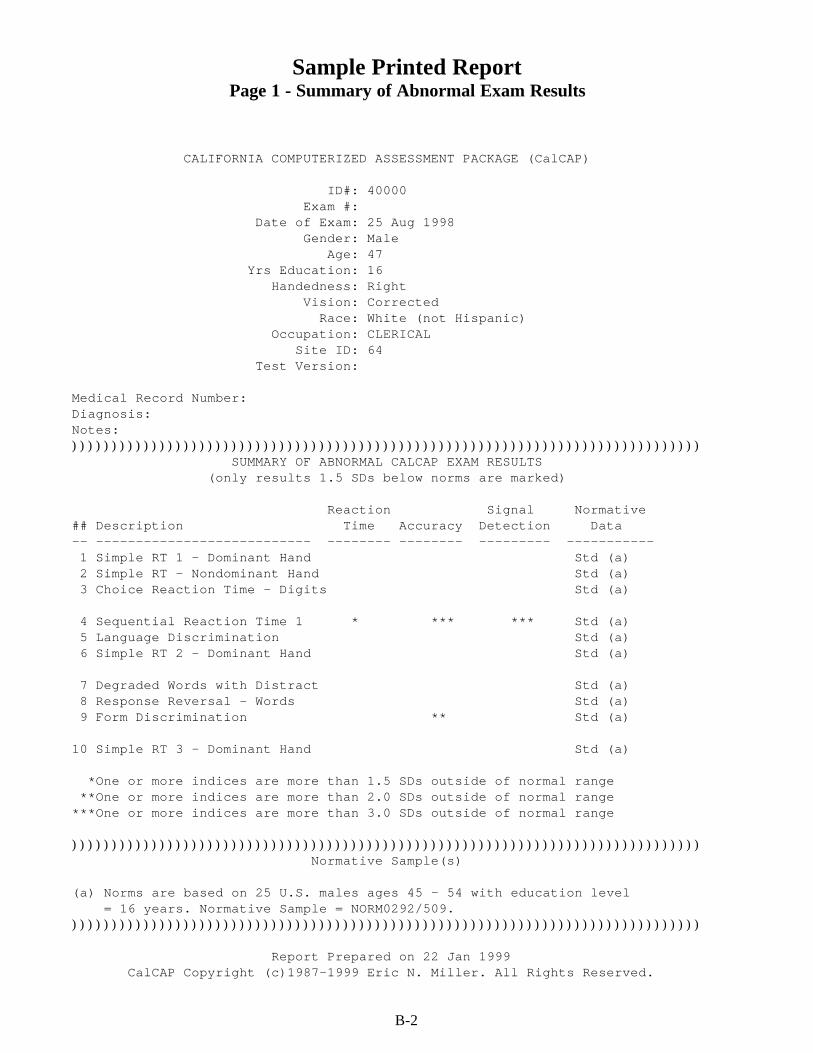
B-2
Sample Printed ReportPage 1 - Summary of Abnormal Exam Results
CALIFORNIA COMPUTERIZED ASSESSMENT PACKAGE (CalCAP)
ID#: 40000 Exam #: Date of Exam: 25 Aug 1998 Gender: Male Age: 47 Yrs Education: 16 Handedness: Right Vision: Corrected Race: White (not Hispanic) Occupation: CLERICAL Site ID: 64 Test Version:
Medical Record Number: Diagnosis: Notes: ))))))))))))))))))))))))))))))))))))))))))))))))))))))))))))))))))))))))))))))) SUMMARY OF ABNORMAL CALCAP EXAM RESULTS (only results 1.5 SDs below norms are marked)
Reaction Signal Normative## Description Time Accuracy Detection Data -- --------------------------- -------- -------- --------- ----------- 1 Simple RT 1 - Dominant Hand Std (a) 2 Simple RT - Nondominant Hand Std (a) 3 Choice Reaction Time - Digits Std (a)
4 Sequential Reaction Time 1 * *** *** Std (a) 5 Language Discrimination Std (a) 6 Simple RT 2 - Dominant Hand Std (a)
7 Degraded Words with Distract Std (a) 8 Response Reversal - Words Std (a) 9 Form Discrimination ** Std (a)
10 Simple RT 3 - Dominant Hand Std (a)
*One or more indices are more than 1.5 SDs outside of normal range **One or more indices are more than 2.0 SDs outside of normal range***One or more indices are more than 3.0 SDs outside of normal range
))))))))))))))))))))))))))))))))))))))))))))))))))))))))))))))))))))))))))))))) Normative Sample(s)
(a) Norms are based on 25 U.S. males ages 45 - 54 with education level = 16 years. Normative Sample = NORM0292/509.)))))))))))))))))))))))))))))))))))))))))))))))))))))))))))))))))))))))))))))))
Report Prepared on 22 Jan 1999 CalCAP Copyright (c)1987-1999 Eric N. Miller. All Rights Reserved.
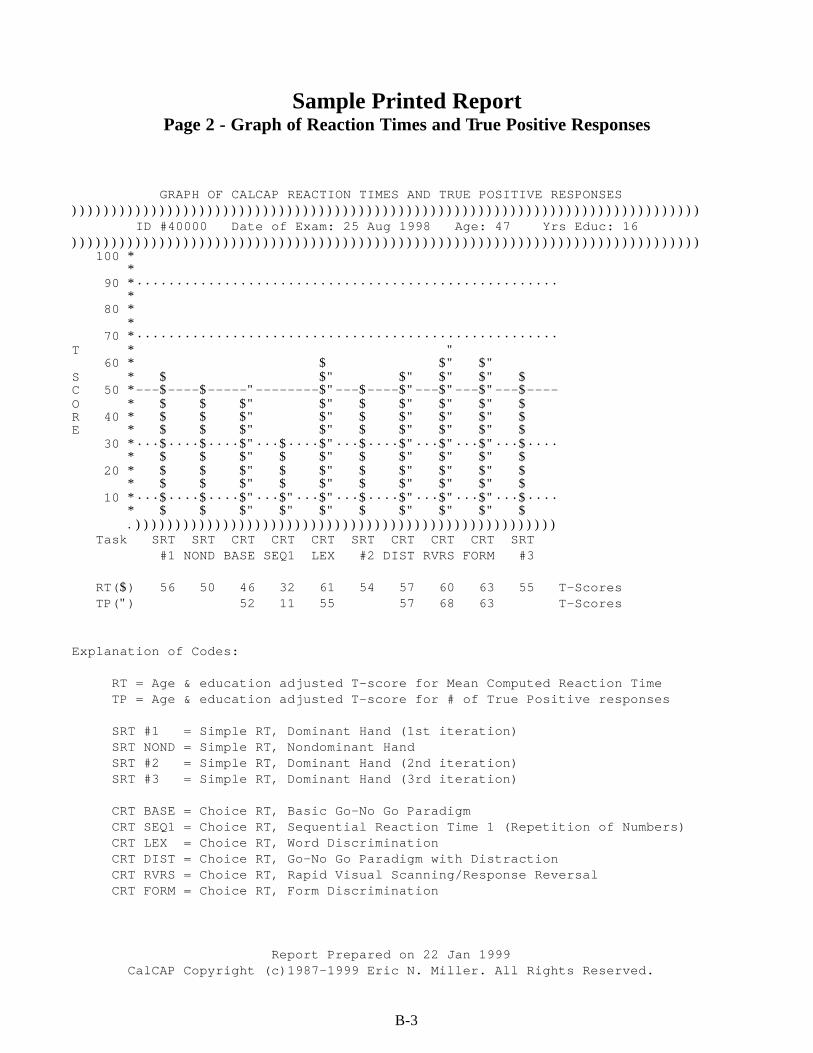
B-3
Sample Printed ReportPage 2 - Graph of Reaction Times and True Positive Responses
GRAPH OF CALCAP REACTION TIMES AND TRUE POSITIVE RESPONSES ))))))))))))))))))))))))))))))))))))))))))))))))))))))))))))))))))))))))))))))) ID #40000 Date of Exam: 25 Aug 1998 Age: 47 Yrs Educ: 16 ))))))))))))))))))))))))))))))))))))))))))))))))))))))))))))))))))))))))))))))) 100 * * 90 *····················································· * 80 * * 70 *·····················································T * " 60 * $ $" $" S * $ $" $" $" $" $ C 50 *---$----$-----"--------$"---$----$"---$"---$"---$----O * $ $ $" $" $ $" $" $" $ R 40 * $ $ $" $" $ $" $" $" $ E * $ $ $" $" $ $" $" $" $ 30 *···$····$····$"···$····$"···$····$"···$"···$"···$···· * $ $ $" $ $" $ $" $" $" $ 20 * $ $ $" $ $" $ $" $" $" $ * $ $ $" $ $" $ $" $" $" $ 10 *···$····$····$"···$"···$"···$····$"···$"···$"···$···· * $ $ $" $" $" $ $" $" $" $ .))))))))))))))))))))))))))))))))))))))))))))))))))))) Task SRT SRT CRT CRT CRT SRT CRT CRT CRT SRT #1 NOND BASE SEQ1 LEX #2 DIST RVRS FORM #3
RT($) 56 50 46 32 61 54 57 60 63 55 T-Scores TP(") 52 11 55 57 68 63 T-Scores
Explanation of Codes:
RT = Age & education adjusted T-score for Mean Computed Reaction Time TP = Age & education adjusted T-score for # of True Positive responses
SRT #1 = Simple RT, Dominant Hand (1st iteration) SRT NOND = Simple RT, Nondominant Hand SRT #2 = Simple RT, Dominant Hand (2nd iteration) SRT #3 = Simple RT, Dominant Hand (3rd iteration)
CRT BASE = Choice RT, Basic Go-No Go Paradigm CRT SEQ1 = Choice RT, Sequential Reaction Time 1 (Repetition of Numbers) CRT LEX = Choice RT, Word Discrimination CRT DIST = Choice RT, Go-No Go Paradigm with Distraction CRT RVRS = Choice RT, Rapid Visual Scanning/Response Reversal CRT FORM = Choice RT, Form Discrimination
Report Prepared on 22 Jan 1999 CalCAP Copyright (c)1987-1999 Eric N. Miller. All Rights Reserved.
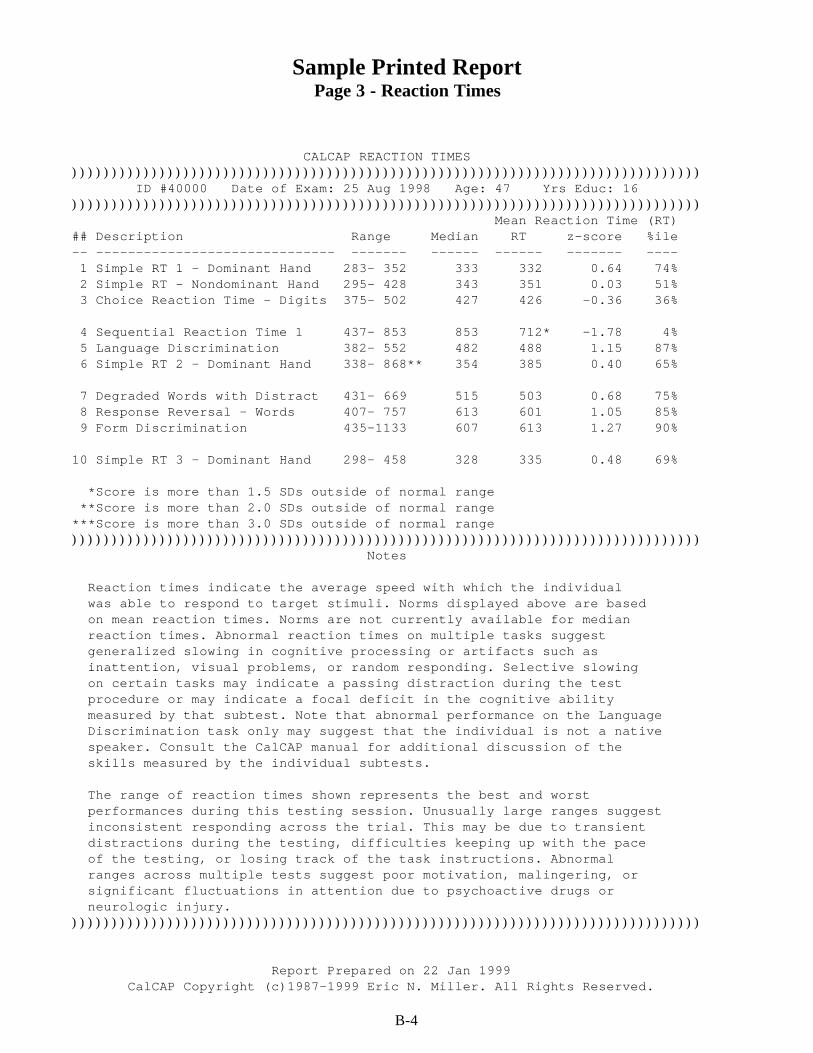
B-4
Sample Printed ReportPage 3 - Reaction Times
CALCAP REACTION TIMES ))))))))))))))))))))))))))))))))))))))))))))))))))))))))))))))))))))))))))))))) ID #40000 Date of Exam: 25 Aug 1998 Age: 47 Yrs Educ: 16 ))))))))))))))))))))))))))))))))))))))))))))))))))))))))))))))))))))))))))))))) Mean Reaction Time (RT)## Description Range Median RT z-score %ile-- ------------------------------ ------- ------ ------ ------- ---- 1 Simple RT 1 - Dominant Hand 283- 352 333 332 0.64 74% 2 Simple RT - Nondominant Hand 295- 428 343 351 0.03 51% 3 Choice Reaction Time - Digits 375- 502 427 426 -0.36 36%
4 Sequential Reaction Time 1 437- 853 853 712* -1.78 4% 5 Language Discrimination 382- 552 482 488 1.15 87% 6 Simple RT 2 - Dominant Hand 338- 868** 354 385 0.40 65%
7 Degraded Words with Distract 431- 669 515 503 0.68 75% 8 Response Reversal - Words 407- 757 613 601 1.05 85% 9 Form Discrimination 435-1133 607 613 1.27 90%
10 Simple RT 3 - Dominant Hand 298- 458 328 335 0.48 69%
*Score is more than 1.5 SDs outside of normal range **Score is more than 2.0 SDs outside of normal range***Score is more than 3.0 SDs outside of normal range))))))))))))))))))))))))))))))))))))))))))))))))))))))))))))))))))))))))))))))) Notes
Reaction times indicate the average speed with which the individual was able to respond to target stimuli. Norms displayed above are based on mean reaction times. Norms are not currently available for median reaction times. Abnormal reaction times on multiple tasks suggest generalized slowing in cognitive processing or artifacts such as inattention, visual problems, or random responding. Selective slowing on certain tasks may indicate a passing distraction during the test procedure or may indicate a focal deficit in the cognitive ability measured by that subtest. Note that abnormal performance on the Language Discrimination task only may suggest that the individual is not a native speaker. Consult the CalCAP manual for additional discussion of the skills measured by the individual subtests. The range of reaction times shown represents the best and worst performances during this testing session. Unusually large ranges suggest inconsistent responding across the trial. This may be due to transient distractions during the testing, difficulties keeping up with the pace of the testing, or losing track of the task instructions. Abnormal ranges across multiple tests suggest poor motivation, malingering, or significant fluctuations in attention due to psychoactive drugs or neurologic injury.)))))))))))))))))))))))))))))))))))))))))))))))))))))))))))))))))))))))))))))))
Report Prepared on 22 Jan 1999 CalCAP Copyright (c)1987-1999 Eric N. Miller. All Rights Reserved.
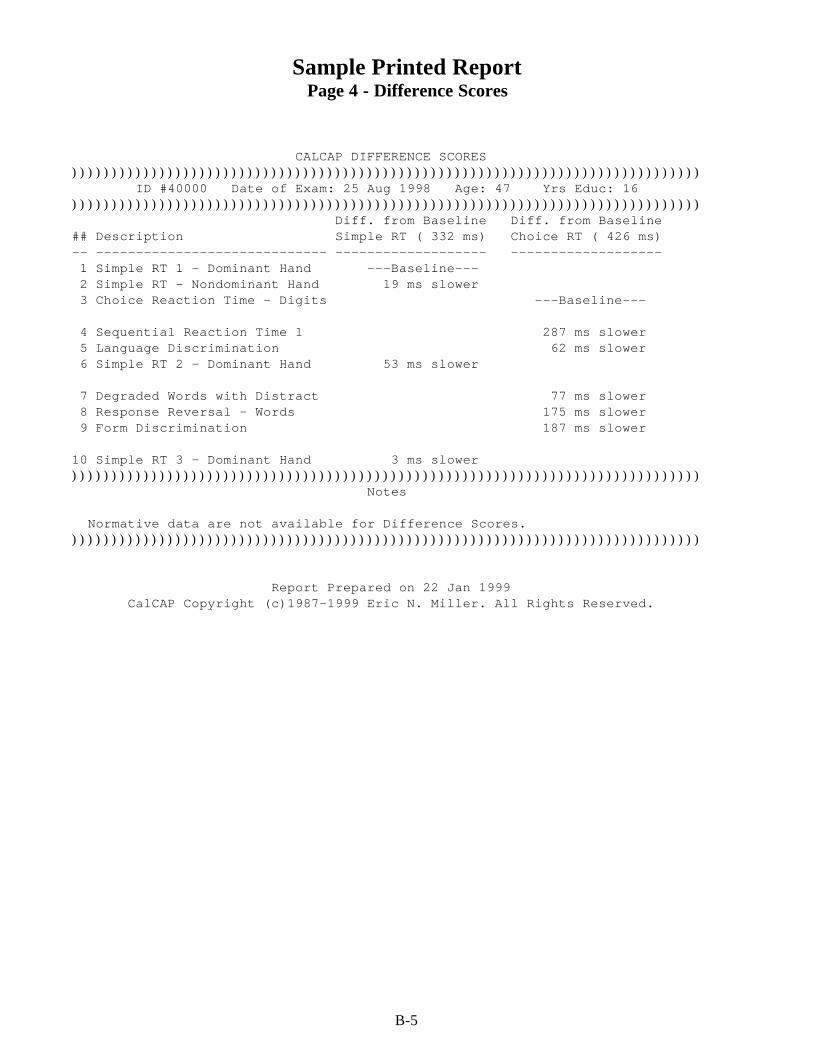
B-5
Sample Printed ReportPage 4 - Difference Scores
CALCAP DIFFERENCE SCORES ))))))))))))))))))))))))))))))))))))))))))))))))))))))))))))))))))))))))))))))) ID #40000 Date of Exam: 25 Aug 1998 Age: 47 Yrs Educ: 16 ))))))))))))))))))))))))))))))))))))))))))))))))))))))))))))))))))))))))))))))) Diff. from Baseline Diff. from Baseline## Description Simple RT ( 332 ms) Choice RT ( 426 ms)-- ----------------------------- ------------------- ------------------- 1 Simple RT 1 - Dominant Hand ---Baseline--- 2 Simple RT - Nondominant Hand 19 ms slower 3 Choice Reaction Time - Digits ---Baseline---
4 Sequential Reaction Time 1 287 ms slower 5 Language Discrimination 62 ms slower 6 Simple RT 2 - Dominant Hand 53 ms slower
7 Degraded Words with Distract 77 ms slower 8 Response Reversal - Words 175 ms slower 9 Form Discrimination 187 ms slower
10 Simple RT 3 - Dominant Hand 3 ms slower ))))))))))))))))))))))))))))))))))))))))))))))))))))))))))))))))))))))))))))))) Notes
Normative data are not available for Difference Scores.)))))))))))))))))))))))))))))))))))))))))))))))))))))))))))))))))))))))))))))))
Report Prepared on 22 Jan 1999 CalCAP Copyright (c)1987-1999 Eric N. Miller. All Rights Reserved.
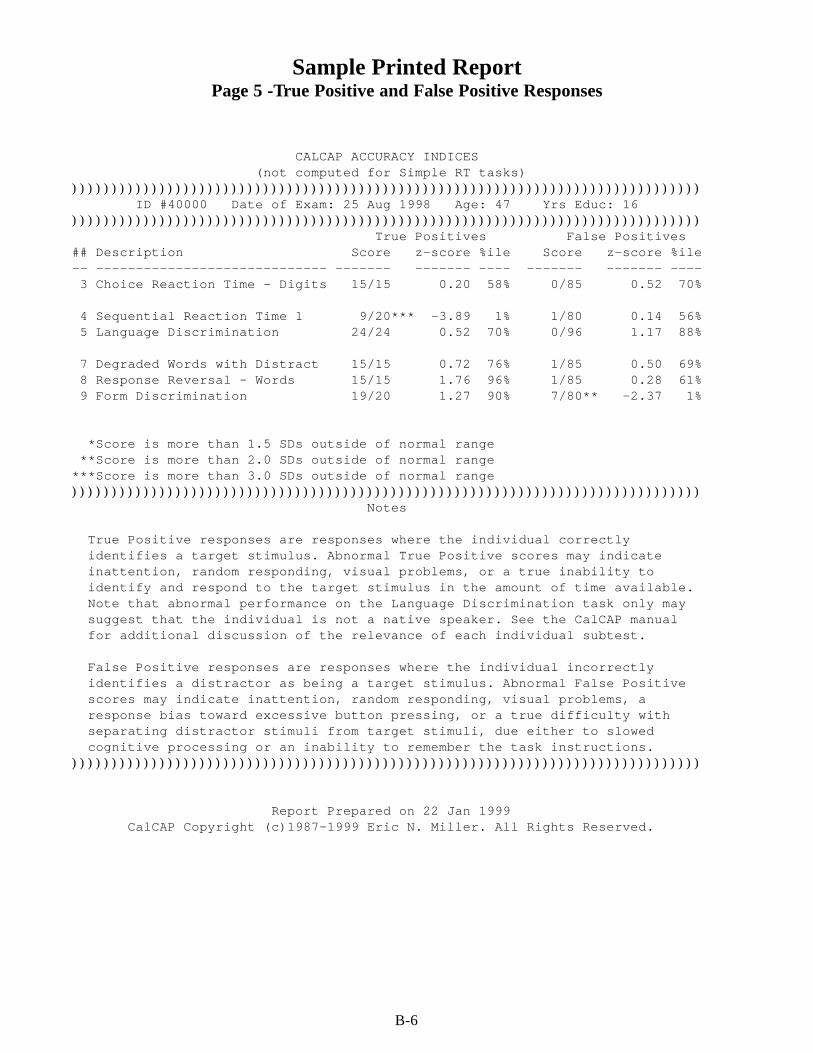
B-6
Sample Printed ReportPage 5 -True Positive and False Positive Responses
CALCAP ACCURACY INDICES (not computed for Simple RT tasks) ))))))))))))))))))))))))))))))))))))))))))))))))))))))))))))))))))))))))))))))) ID #40000 Date of Exam: 25 Aug 1998 Age: 47 Yrs Educ: 16 ))))))))))))))))))))))))))))))))))))))))))))))))))))))))))))))))))))))))))))))) True Positives False Positives## Description Score z-score %ile Score z-score %ile-- ----------------------------- ------- ------- ---- ------- ------- ---- 3 Choice Reaction Time - Digits 15/15 0.20 58% 0/85 0.52 70%
4 Sequential Reaction Time 1 9/20*** -3.89 1% 1/80 0.14 56% 5 Language Discrimination 24/24 0.52 70% 0/96 1.17 88%
7 Degraded Words with Distract 15/15 0.72 76% 1/85 0.50 69% 8 Response Reversal - Words 15/15 1.76 96% 1/85 0.28 61% 9 Form Discrimination 19/20 1.27 90% 7/80** -2.37 1%
*Score is more than 1.5 SDs outside of normal range **Score is more than 2.0 SDs outside of normal range***Score is more than 3.0 SDs outside of normal range))))))))))))))))))))))))))))))))))))))))))))))))))))))))))))))))))))))))))))))) Notes
True Positive responses are responses where the individual correctly identifies a target stimulus. Abnormal True Positive scores may indicate inattention, random responding, visual problems, or a true inability to identify and respond to the target stimulus in the amount of time available. Note that abnormal performance on the Language Discrimination task only may suggest that the individual is not a native speaker. See the CalCAP manual for additional discussion of the relevance of each individual subtest. False Positive responses are responses where the individual incorrectly identifies a distractor as being a target stimulus. Abnormal False Positive scores may indicate inattention, random responding, visual problems, a response bias toward excessive button pressing, or a true difficulty with separating distractor stimuli from target stimuli, due either to slowed cognitive processing or an inability to remember the task instructions.)))))))))))))))))))))))))))))))))))))))))))))))))))))))))))))))))))))))))))))))
Report Prepared on 22 Jan 1999 CalCAP Copyright (c)1987-1999 Eric N. Miller. All Rights Reserved.
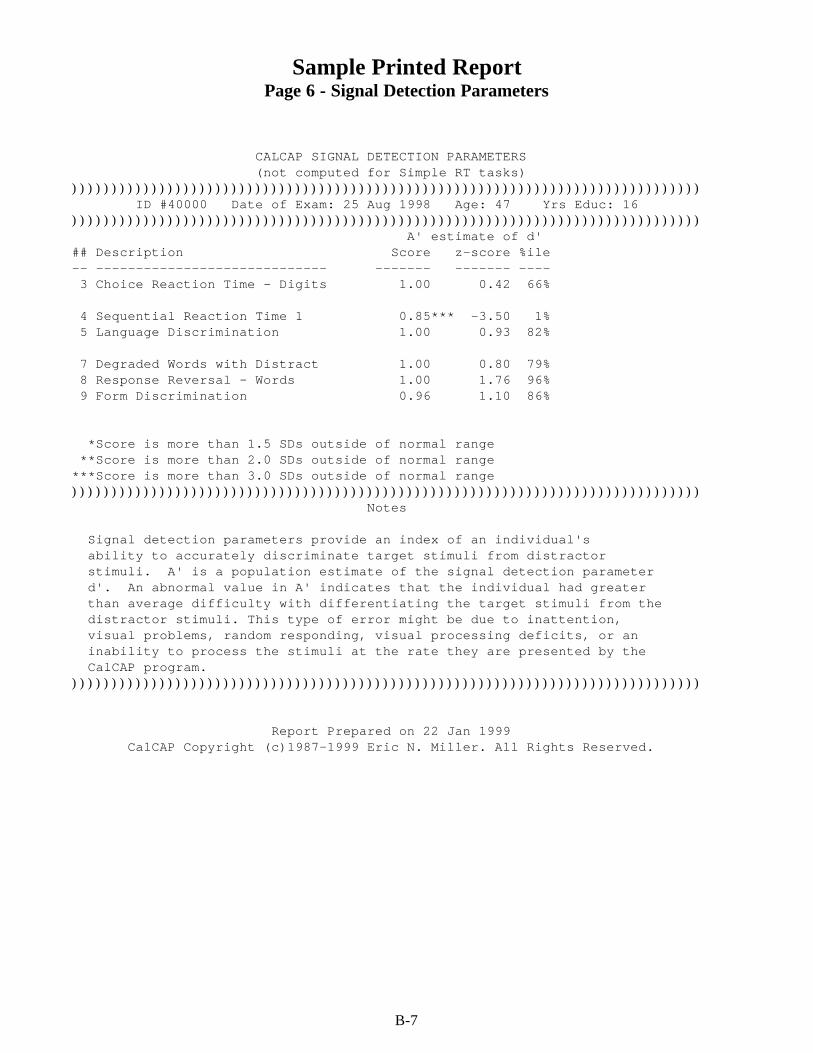
B-7
Sample Printed ReportPage 6 - Signal Detection Parameters
CALCAP SIGNAL DETECTION PARAMETERS (not computed for Simple RT tasks) ))))))))))))))))))))))))))))))))))))))))))))))))))))))))))))))))))))))))))))))) ID #40000 Date of Exam: 25 Aug 1998 Age: 47 Yrs Educ: 16 ))))))))))))))))))))))))))))))))))))))))))))))))))))))))))))))))))))))))))))))) A' estimate of d'## Description Score z-score %ile-- ----------------------------- ------- ------- ---- 3 Choice Reaction Time - Digits 1.00 0.42 66%
4 Sequential Reaction Time 1 0.85*** -3.50 1% 5 Language Discrimination 1.00 0.93 82%
7 Degraded Words with Distract 1.00 0.80 79% 8 Response Reversal - Words 1.00 1.76 96% 9 Form Discrimination 0.96 1.10 86%
*Score is more than 1.5 SDs outside of normal range **Score is more than 2.0 SDs outside of normal range***Score is more than 3.0 SDs outside of normal range))))))))))))))))))))))))))))))))))))))))))))))))))))))))))))))))))))))))))))))) Notes
Signal detection parameters provide an index of an individual's ability to accurately discriminate target stimuli from distractor stimuli. A' is a population estimate of the signal detection parameter d'. An abnormal value in A' indicates that the individual had greater than average difficulty with differentiating the target stimuli from the distractor stimuli. This type of error might be due to inattention, visual problems, random responding, visual processing deficits, or an inability to process the stimuli at the rate they are presented by the CalCAP program.)))))))))))))))))))))))))))))))))))))))))))))))))))))))))))))))))))))))))))))))
Report Prepared on 22 Jan 1999 CalCAP Copyright (c)1987-1999 Eric N. Miller. All Rights Reserved.
C-1
APPENDIX C
SAMPLE REPORTS - CLASSIC STYLE USED 1986-1998
INCLUDES INTERPRETATION GUIDE AND SAMPLE REPORTS
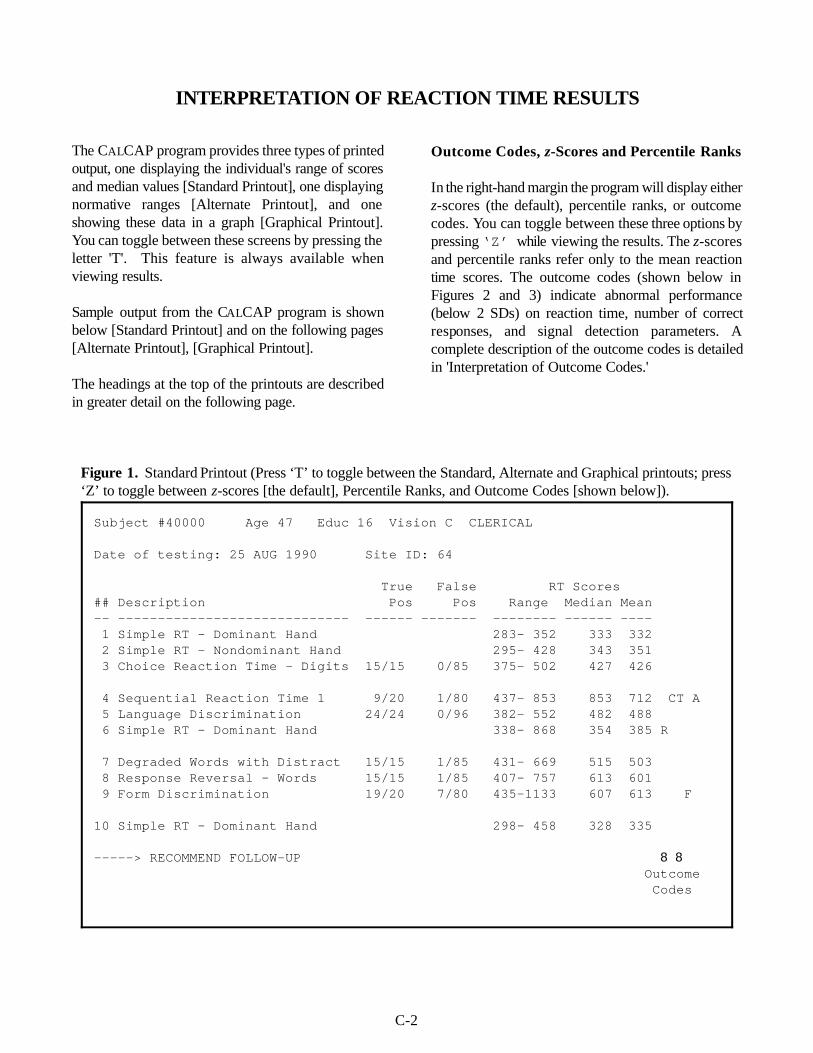
C-2
Subject #40000 Age 47 Educ 16 Vision C CLERICAL Date of testing: 25 AUG 1990 Site ID: 64 True False RT Scores ## Description Pos Pos Range Median Mean -- ----------------------------- ------ ------- -------- ------ ---- 1 Simple RT - Dominant Hand 283- 352 333 332 2 Simple RT - Nondominant Hand 295- 428 343 351 3 Choice Reaction Time - Digits 15/15 0/85 375- 502 427 426
4 Sequential Reaction Time 1 9/20 1/80 437- 853 853 712 CT A 5 Language Discrimination 24/24 0/96 382- 552 482 488 6 Simple RT - Dominant Hand 338- 868 354 385 R
7 Degraded Words with Distract 15/15 1/85 431- 669 515 503 8 Response Reversal - Words 15/15 1/85 407- 757 613 601 9 Form Discrimination 19/20 7/80 435-1133 607 613 F
10 Simple RT - Dominant Hand 298- 458 328 335
-----> RECOMMEND FOLLOW-UP 8 8 Outcome Codes
Figure 1. Standard Printout (Press ‘T’ to toggle between the Standard, Alternate and Graphical printouts; press‘Z’ to toggle between z-scores [the default], Percentile Ranks, and Outcome Codes [shown below]).
INTERPRETATION OF REACTION TIME RESULTS
The CALCAP program provides three types of printedoutput, one displaying the individual's range of scoresand median values [Standard Printout], one displayingnormative ranges [Alternate Printout], and oneshowing these data in a graph [Graphical Printout].You can toggle between these screens by pressing theletter 'T'. This feature is always available whenviewing results.
Sample output from the CALCAP program is shownbelow [Standard Printout] and on the following pages[Alternate Printout], [Graphical Printout].
The headings at the top of the printouts are describedin greater detail on the following page.
Outcome Codes, z-Scores and Percentile Ranks
In the right-hand margin the program will display eitherz-scores (the default), percentile ranks, or outcomecodes. You can toggle between these three options bypressing ‘Z’ while viewing the results. The z-scoresand percentile ranks refer only to the mean reactiontime scores. The outcome codes (shown below inFigures 2 and 3) indicate abnormal performance(below 2 SDs) on reaction time, number of correctresponses, and signal detection parameters. Acomplete description of the outcome codes is detailedin 'Interpretation of Outcome Codes.'
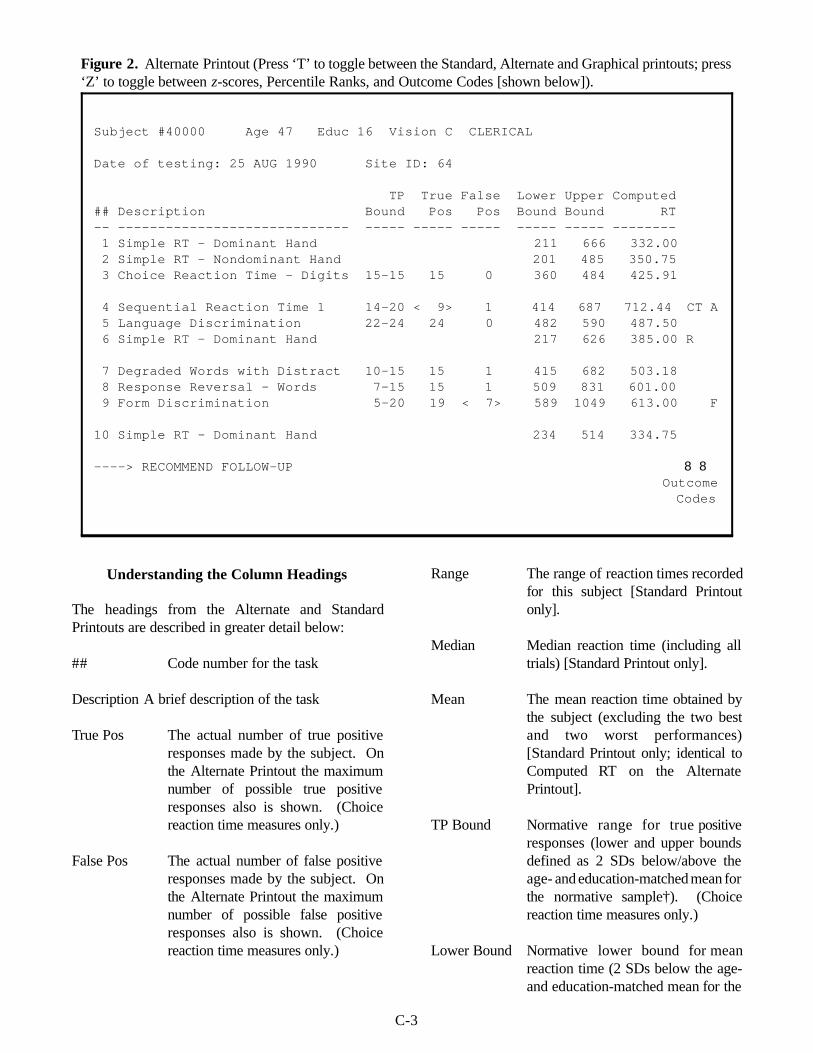
C-3
Subject #40000 Age 47 Educ 16 Vision C CLERICAL
Date of testing: 25 AUG 1990 Site ID: 64
TP True False Lower Upper Computed ## Description Bound Pos Pos Bound Bound RT -- ----------------------------- ----- ----- ----- ----- ----- -------- 1 Simple RT - Dominant Hand 211 666 332.00 2 Simple RT - Nondominant Hand 201 485 350.75 3 Choice Reaction Time - Digits 15-15 15 0 360 484 425.91
4 Sequential Reaction Time 1 14-20 < 9> 1 414 687 712.44 CT A 5 Language Discrimination 22-24 24 0 482 590 487.50 6 Simple RT - Dominant Hand 217 626 385.00 R
7 Degraded Words with Distract 10-15 15 1 415 682 503.18 8 Response Reversal - Words 7-15 15 1 509 831 601.00 9 Form Discrimination 5-20 19 < 7> 589 1049 613.00 F
10 Simple RT - Dominant Hand 234 514 334.75
----> RECOMMEND FOLLOW-UP 8 8 Outcome Codes
Figure 2. Alternate Printout (Press ‘T’ to toggle between the Standard, Alternate and Graphical printouts; press‘Z’ to toggle between z-scores, Percentile Ranks, and Outcome Codes [shown below]).
Understanding the Column Headings
The headings from the Alternate and StandardPrintouts are described in greater detail below:
## Code number for the task
Description A brief description of the task
True Pos The actual number of true positiveresponses made by the subject. Onthe Alternate Printout the maximumnumber of possible true positiveresponses also is shown. (Choicereaction time measures only.)
False Pos The actual number of false positiveresponses made by the subject. Onthe Alternate Printout the maximumnumber of possible false positiveresponses also is shown. (Choicereaction time measures only.)
Range The range of reaction times recordedfor this subject [Standard Printoutonly].
Median Median reaction time (including alltrials) [Standard Printout only].
Mean The mean reaction time obtained bythe subject (excluding the two bestand two worst performances)[Standard Printout only; identical toComputed RT on the AlternatePrintout].
TP Bound Normative range for true positiveresponses (lower and upper boundsdefined as 2 SDs below/above theage- and education-matched mean forthe normative sample†). (Choicereaction time measures only.)
Lower Bound Normative lower bound for meanreaction time (2 SDs below the age-and education-matched mean for the
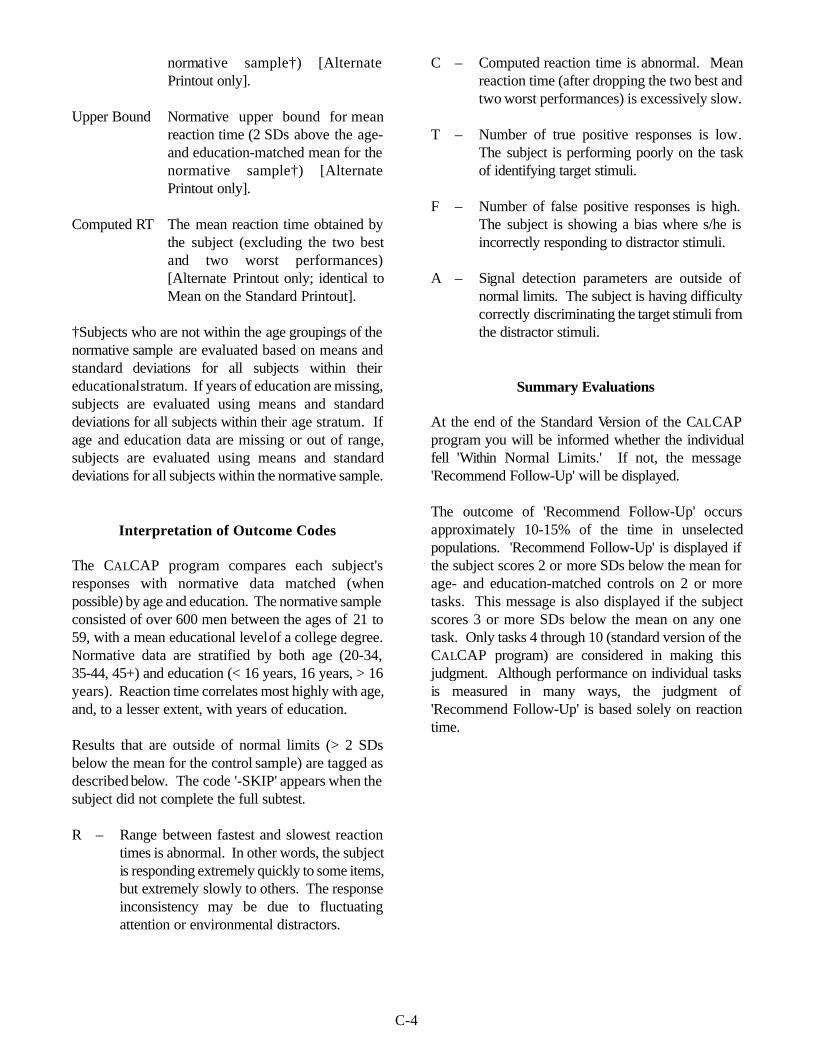
C-4
normative sample†) [AlternatePrintout only].
Upper Bound Normative upper bound for meanreaction time (2 SDs above the age-and education-matched mean for thenormative sample†) [AlternatePrintout only].
Computed RT The mean reaction time obtained bythe subject (excluding the two bestand two worst performances)[Alternate Printout only; identical toMean on the Standard Printout].
†Subjects who are not within the age groupings of thenormative sample are evaluated based on means andstandard deviations for all subjects within theireducational stratum. If years of education are missing,subjects are evaluated using means and standarddeviations for all subjects within their age stratum. Ifage and education data are missing or out of range,subjects are evaluated using means and standarddeviations for all subjects within the normative sample.
Interpretation of Outcome Codes
The CALCAP program compares each subject'sresponses with normative data matched (whenpossible) by age and education. The normative sampleconsisted of over 600 men between the ages of 21 to59, with a mean educational level of a college degree.Normative data are stratified by both age (20-34,35-44, 45+) and education (< 16 years, 16 years, > 16years). Reaction time correlates most highly with age,and, to a lesser extent, with years of education.
Results that are outside of normal limits (> 2 SDsbelow the mean for the control sample) are tagged asdescribed below. The code '-SKIP' appears when thesubject did not complete the full subtest.
R – Range between fastest and slowest reactiontimes is abnormal. In other words, the subjectis responding extremely quickly to some items,but extremely slowly to others. The responseinconsistency may be due to fluctuatingattention or environmental distractors.
C – Computed reaction time is abnormal. Meanreaction time (after dropping the two best andtwo worst performances) is excessively slow.
T – Number of true positive responses is low.The subject is performing poorly on the taskof identifying target stimuli.
F – Number of false positive responses is high.The subject is showing a bias where s/he isincorrectly responding to distractor stimuli.
A – Signal detection parameters are outside ofnormal limits. The subject is having difficultycorrectly discriminating the target stimuli fromthe distractor stimuli.
Summary Evaluations
At the end of the Standard Version of the CALCAPprogram you will be informed whether the individualfell 'Within Normal Limits.' If not, the message'Recommend Follow-Up' will be displayed.
The outcome of 'Recommend Follow-Up' occursapproximately 10-15% of the time in unselectedpopulations. 'Recommend Follow-Up' is displayed ifthe subject scores 2 or more SDs below the mean forage- and education-matched controls on 2 or moretasks. This message is also displayed if the subjectscores 3 or more SDs below the mean on any onetask. Only tasks 4 through 10 (standard version of theCALCAP program) are considered in making thisjudgment. Although performance on individual tasksis measured in many ways, the judgment of'Recommend Follow-Up' is based solely on reactiontime.
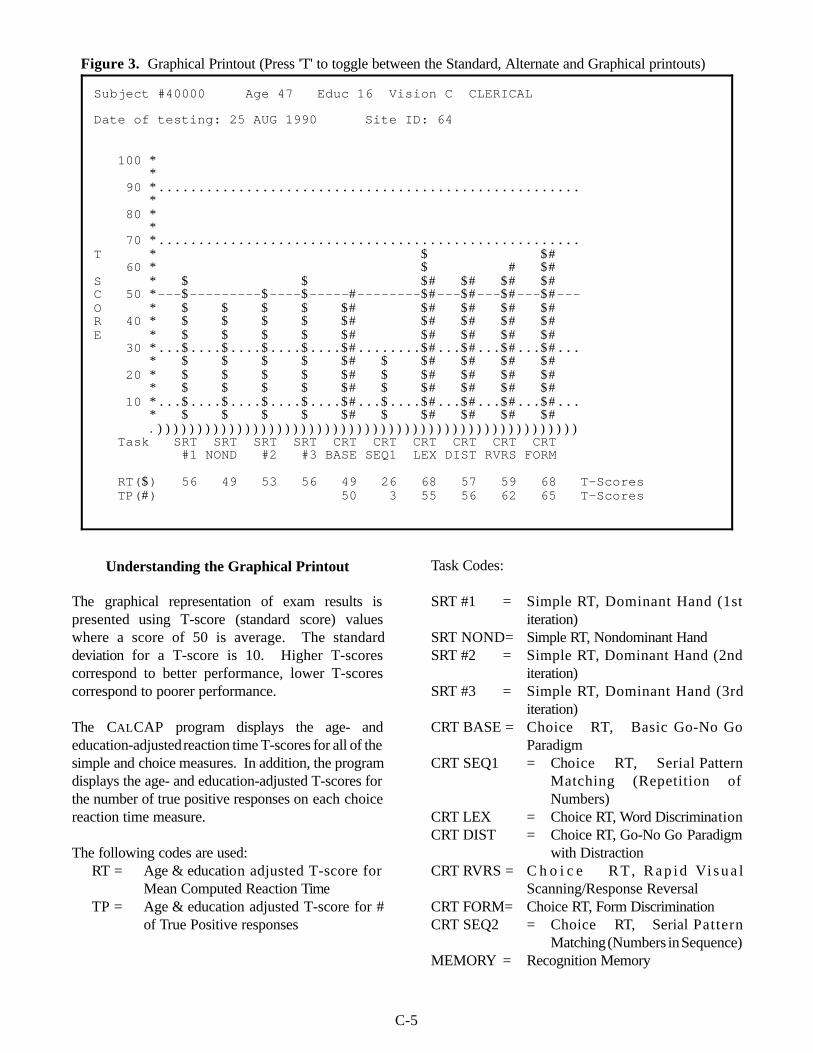
C-5
Subject #40000 Age 47 Educ 16 Vision C CLERICAL
Date of testing: 25 AUG 1990 Site ID: 64
100 * * 90 *..................................................... * 80 * * 70 *.....................................................T * $ $# 60 * $ # $# S * $ $ $# $# $# $# C 50 *---$---------$----$-----#--------$#---$#---$#---$#---O * $ $ $ $ $# $# $# $# $# R 40 * $ $ $ $ $# $# $# $# $# E * $ $ $ $ $# $# $# $# $# 30 *...$....$....$....$....$#........$#...$#...$#...$#... * $ $ $ $ $# $ $# $# $# $# 20 * $ $ $ $ $# $ $# $# $# $# * $ $ $ $ $# $ $# $# $# $# 10 *...$....$....$....$....$#...$....$#...$#...$#...$#... * $ $ $ $ $# $ $# $# $# $# .))))))))))))))))))))))))))))))))))))))))))))))))))))) Task SRT SRT SRT SRT CRT CRT CRT CRT CRT CRT #1 NOND #2 #3 BASE SEQ1 LEX DIST RVRS FORM
RT($) 56 49 53 56 49 26 68 57 59 68 T-Scores TP(#) 50 3 55 56 62 65 T-Scores
Figure 3. Graphical Printout (Press 'T' to toggle between the Standard, Alternate and Graphical printouts)
Understanding the Graphical Printout
The graphical representation of exam results ispresented using T-score (standard score) valueswhere a score of 50 is average. The standarddeviation for a T-score is 10. Higher T-scorescorrespond to better performance, lower T-scorescorrespond to poorer performance.
The CALCAP program displays the age- andeducation-adjusted reaction time T-scores for all of thesimple and choice measures. In addition, the programdisplays the age- and education-adjusted T-scores forthe number of true positive responses on each choicereaction time measure.
The following codes are used: RT = Age & education adjusted T-score for
Mean Computed Reaction Time TP = Age & education adjusted T-score for #
of True Positive responses
Task Codes:
SRT #1 = Simple RT, Dominant Hand (1stiteration)
SRT NOND= Simple RT, Nondominant HandSRT #2 = Simple RT, Dominant Hand (2nd
iteration)SRT #3 = Simple RT, Dominant Hand (3rd
iteration)CRT BASE = Choice RT, Basic Go-No Go
ParadigmCRT SEQ1 = Choice RT, Serial Pattern
Matching (Repetition ofNumbers)
CRT LEX = Choice RT, Word DiscriminationCRT DIST = Choice RT, Go-No Go Paradigm
with DistractionCRT RVRS = C h o i c e R T , R a p i d Vi s u a l
Scanning/Response ReversalCRT FORM= Choice RT, Form DiscriminationCRT SEQ2 = Choice RT, Serial Pattern
Matching (Numbers in Sequence)MEMORY = Recognition Memory
C-6
General Tips for Interpretation
In general, you should consider the first simple andchoice reaction time tasks to be practice trials. Eventhough each individual task has a practice component,many subject's scores do not stabilize until after thefirst tasks.
The reaction time tasks measure cognitive functioningthat is not ordinarily assessed using standardneuropsychological procedures. Although the taskscorrelate modestly (.2 - .4) with otherneuropsychological measures (especially Symbol DigitSubstitution and Trails B), based on factor analyses thereaction time measures form two factors (Simplereaction time and Choice reaction time) that aredifferent from standard NP tasks.
The cognitive functions assessed by the CALCAPprogram are best described as timed psychomotorskills requiring focused or sustained attention.Impaired reaction time across multiple measures isusually indicative of generalized motor slowing.Impaired reaction time on specific measures,particularly when coupled with scores outside ofnormal bounds on true positive responding, issuggestive of a more specific functional deficit, usuallyin the area of fluctuating attention.
In general, poor performance on a single measure isnot indicative of a specific type of cognitiveimpairment. Certain tasks, however, do seem to berelated to specific skills.
Serial Pattern Matching (Sequential Reaction Time) islargely a measure of divided attention skills (similar toTrails B, Consonant Trigrams, etc.)
Lexical Discrimination is frequently impaired in non-native English speakers.
A large discrepancy in reaction time between tasks 1(simple reaction time–dominant hand) and 2 (simplereaction time–non-dominant hand) may be suggestiveof a lateralizing finding.
An isolated finding of impaired performance on FormDiscrimination may be suggestive of focal impairmentin visuoperceptual skills.
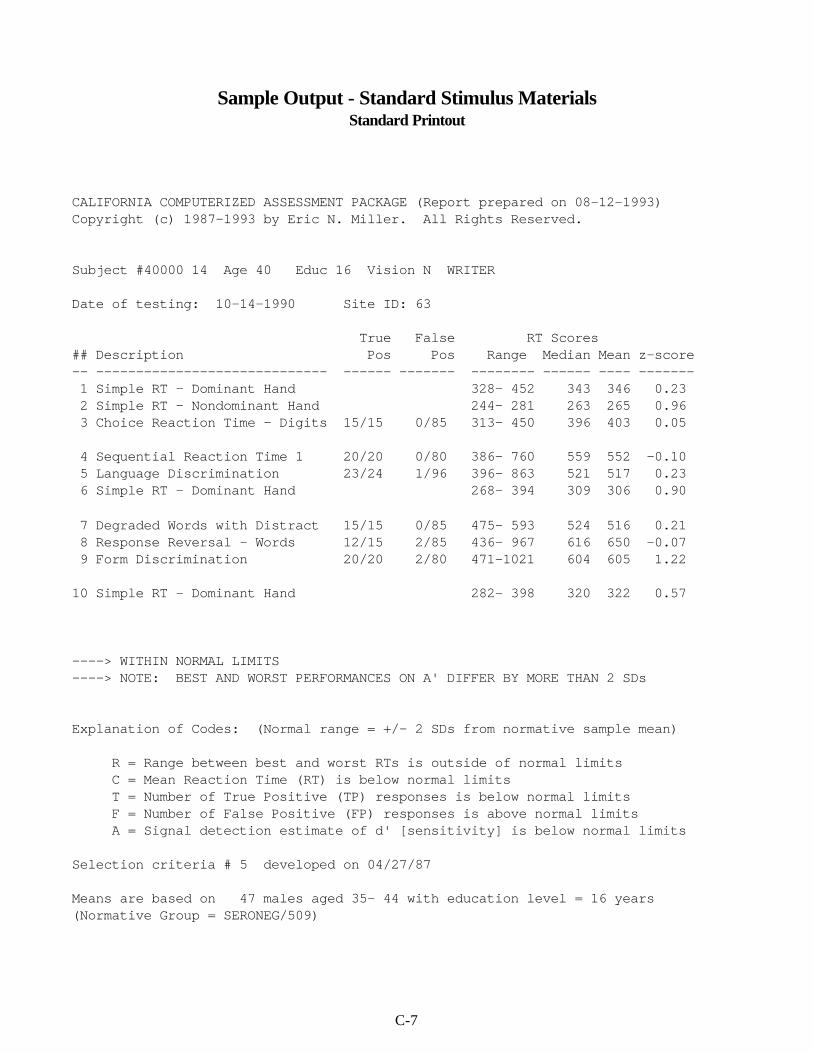
C-7
Sample Output - Standard Stimulus MaterialsStandard Printout
CALIFORNIA COMPUTERIZED ASSESSMENT PACKAGE (Report prepared on 08-12-1993)Copyright (c) 1987-1993 by Eric N. Miller. All Rights Reserved.
Subject #40000 14 Age 40 Educ 16 Vision N WRITER
Date of testing: 10-14-1990 Site ID: 63
True False RT Scores ## Description Pos Pos Range Median Mean z-score-- ----------------------------- ------ ------- -------- ------ ---- ------- 1 Simple RT - Dominant Hand 328- 452 343 346 0.23 2 Simple RT - Nondominant Hand 244- 281 263 265 0.96 3 Choice Reaction Time - Digits 15/15 0/85 313- 450 396 403 0.05
4 Sequential Reaction Time 1 20/20 0/80 386- 760 559 552 -0.10 5 Language Discrimination 23/24 1/96 396- 863 521 517 0.23 6 Simple RT - Dominant Hand 268- 394 309 306 0.90
7 Degraded Words with Distract 15/15 0/85 475- 593 524 516 0.21 8 Response Reversal - Words 12/15 2/85 436- 967 616 650 -0.07 9 Form Discrimination 20/20 2/80 471-1021 604 605 1.22
10 Simple RT - Dominant Hand 282- 398 320 322 0.57
----> WITHIN NORMAL LIMITS----> NOTE: BEST AND WORST PERFORMANCES ON A' DIFFER BY MORE THAN 2 SDs
Explanation of Codes: (Normal range = +/- 2 SDs from normative sample mean)
R = Range between best and worst RTs is outside of normal limits C = Mean Reaction Time (RT) is below normal limits T = Number of True Positive (TP) responses is below normal limits F = Number of False Positive (FP) responses is above normal limits A = Signal detection estimate of d' [sensitivity] is below normal limits
Selection criteria # 5 developed on 04/27/87
Means are based on 47 males aged 35- 44 with education level = 16 years (Normative Group = SERONEG/509)
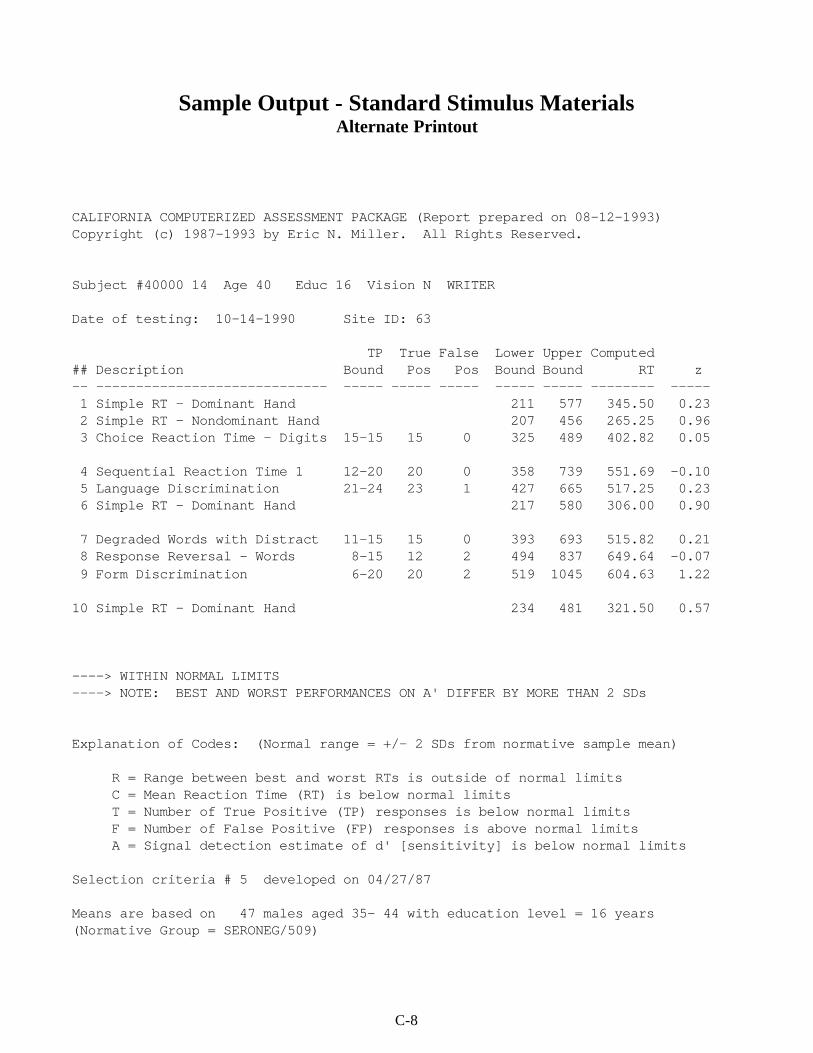
C-8
Sample Output - Standard Stimulus MaterialsAlternate Printout
CALIFORNIA COMPUTERIZED ASSESSMENT PACKAGE (Report prepared on 08-12-1993)Copyright (c) 1987-1993 by Eric N. Miller. All Rights Reserved.
Subject #40000 14 Age 40 Educ 16 Vision N WRITER
Date of testing: 10-14-1990 Site ID: 63
TP True False Lower Upper Computed ## Description Bound Pos Pos Bound Bound RT z-- ----------------------------- ----- ----- ----- ----- ----- -------- ----- 1 Simple RT - Dominant Hand 211 577 345.50 0.23 2 Simple RT - Nondominant Hand 207 456 265.25 0.96 3 Choice Reaction Time - Digits 15-15 15 0 325 489 402.82 0.05
4 Sequential Reaction Time 1 12-20 20 0 358 739 551.69 -0.10 5 Language Discrimination 21-24 23 1 427 665 517.25 0.23 6 Simple RT - Dominant Hand 217 580 306.00 0.90
7 Degraded Words with Distract 11-15 15 0 393 693 515.82 0.21 8 Response Reversal - Words 8-15 12 2 494 837 649.64 -0.07 9 Form Discrimination 6-20 20 2 519 1045 604.63 1.22
10 Simple RT - Dominant Hand 234 481 321.50 0.57
----> WITHIN NORMAL LIMITS----> NOTE: BEST AND WORST PERFORMANCES ON A' DIFFER BY MORE THAN 2 SDs
Explanation of Codes: (Normal range = +/- 2 SDs from normative sample mean)
R = Range between best and worst RTs is outside of normal limits C = Mean Reaction Time (RT) is below normal limits T = Number of True Positive (TP) responses is below normal limits F = Number of False Positive (FP) responses is above normal limits A = Signal detection estimate of d' [sensitivity] is below normal limits
Selection criteria # 5 developed on 04/27/87
Means are based on 47 males aged 35- 44 with education level = 16 years (Normative Group = SERONEG/509)
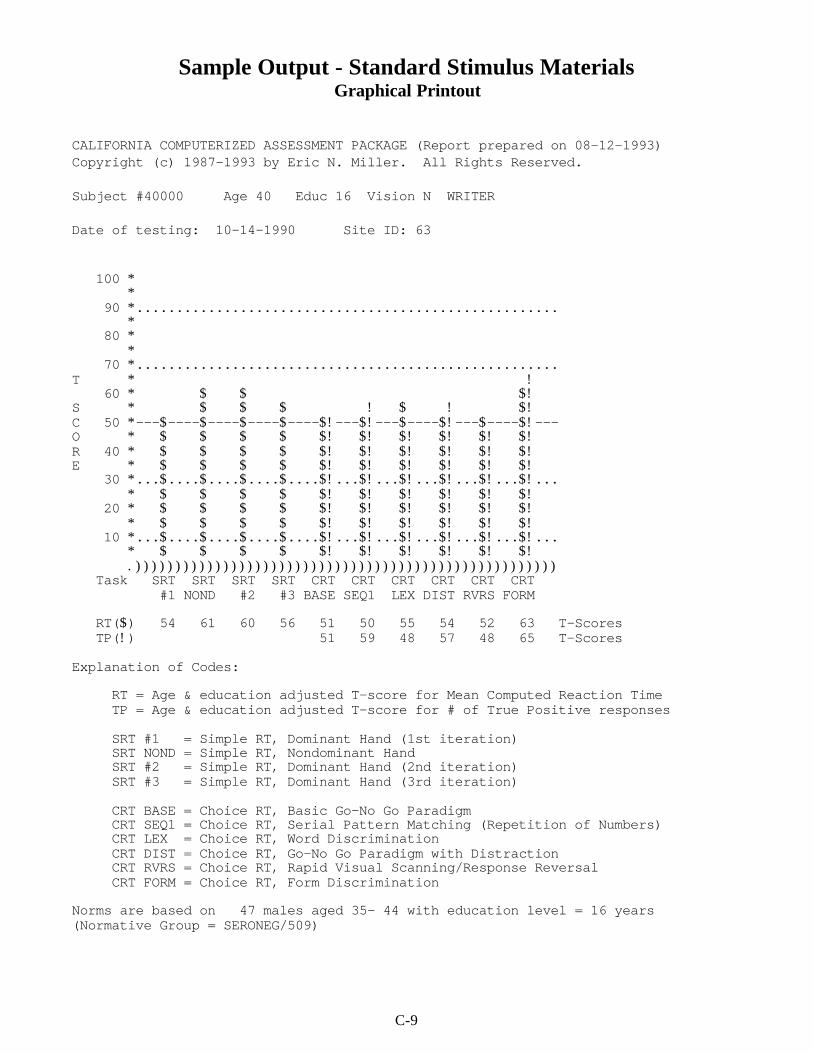
C-9
Sample Output - Standard Stimulus MaterialsGraphical Printout
CALIFORNIA COMPUTERIZED ASSESSMENT PACKAGE (Report prepared on 08-12-1993)Copyright (c) 1987-1993 by Eric N. Miller. All Rights Reserved.
Subject #40000 Age 40 Educ 16 Vision N WRITER
Date of testing: 10-14-1990 Site ID: 63
100 * * 90 *..................................................... * 80 * * 70 *.....................................................T * ! 60 * $ $ $! S * $ $ $ ! $ ! $! C 50 *---$----$----$----$----$!---$!---$----$!---$----$!---O * $ $ $ $ $! $! $! $! $! $! R 40 * $ $ $ $ $! $! $! $! $! $! E * $ $ $ $ $! $! $! $! $! $! 30 *...$....$....$....$....$!...$!...$!...$!...$!...$!... * $ $ $ $ $! $! $! $! $! $! 20 * $ $ $ $ $! $! $! $! $! $! * $ $ $ $ $! $! $! $! $! $! 10 *...$....$....$....$....$!...$!...$!...$!...$!...$!... * $ $ $ $ $! $! $! $! $! $! .))))))))))))))))))))))))))))))))))))))))))))))))))))) Task SRT SRT SRT SRT CRT CRT CRT CRT CRT CRT #1 NOND #2 #3 BASE SEQ1 LEX DIST RVRS FORM
RT($) 54 61 60 56 51 50 55 54 52 63 T-Scores TP(!) 51 59 48 57 48 65 T-Scores
Explanation of Codes:
RT = Age & education adjusted T-score for Mean Computed Reaction Time TP = Age & education adjusted T-score for # of True Positive responses
SRT #1 = Simple RT, Dominant Hand (1st iteration) SRT NOND = Simple RT, Nondominant Hand SRT #2 = Simple RT, Dominant Hand (2nd iteration) SRT #3 = Simple RT, Dominant Hand (3rd iteration)
CRT BASE = Choice RT, Basic Go-No Go Paradigm CRT SEQ1 = Choice RT, Serial Pattern Matching (Repetition of Numbers) CRT LEX = Choice RT, Word Discrimination CRT DIST = Choice RT, Go-No Go Paradigm with Distraction CRT RVRS = Choice RT, Rapid Visual Scanning/Response Reversal CRT FORM = Choice RT, Form Discrimination
Norms are based on 47 males aged 35- 44 with education level = 16 years (Normative Group = SERONEG/509)
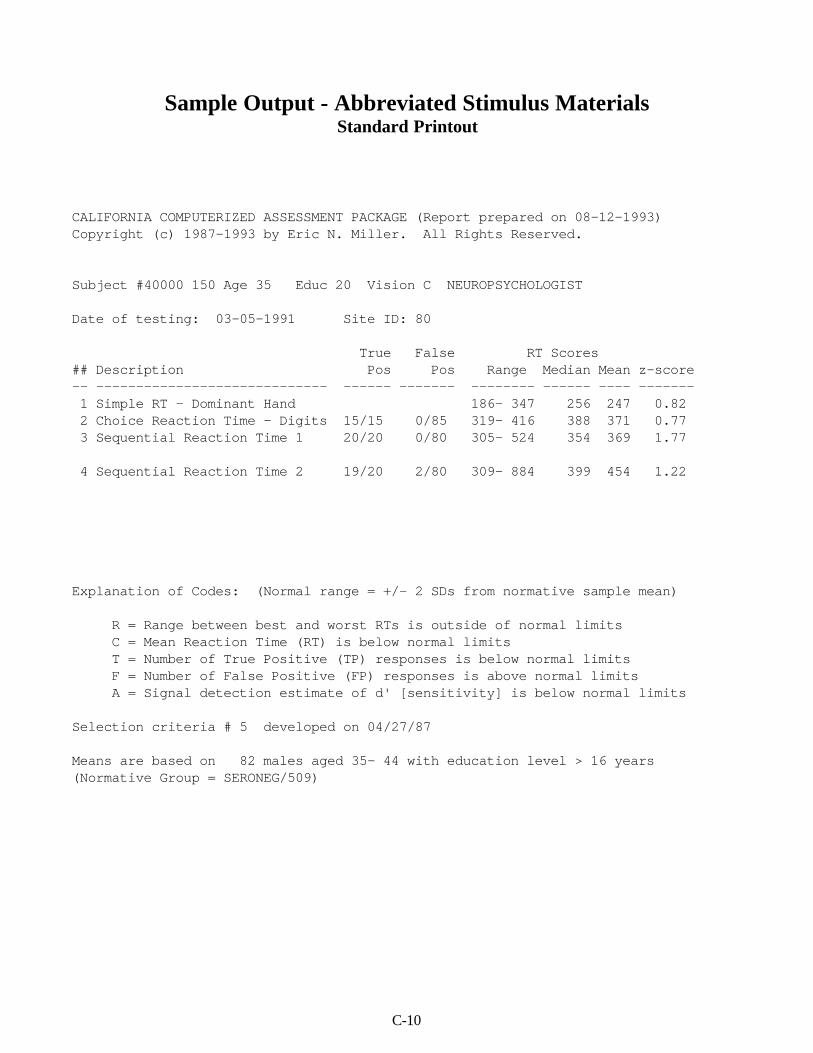
C-10
Sample Output - Abbreviated Stimulus MaterialsStandard Printout
CALIFORNIA COMPUTERIZED ASSESSMENT PACKAGE (Report prepared on 08-12-1993)Copyright (c) 1987-1993 by Eric N. Miller. All Rights Reserved.
Subject #40000 150 Age 35 Educ 20 Vision C NEUROPSYCHOLOGIST
Date of testing: 03-05-1991 Site ID: 80
True False RT Scores ## Description Pos Pos Range Median Mean z-score-- ----------------------------- ------ ------- -------- ------ ---- ------- 1 Simple RT - Dominant Hand 186- 347 256 247 0.82 2 Choice Reaction Time - Digits 15/15 0/85 319- 416 388 371 0.77 3 Sequential Reaction Time 1 20/20 0/80 305- 524 354 369 1.77
4 Sequential Reaction Time 2 19/20 2/80 309- 884 399 454 1.22
Explanation of Codes: (Normal range = +/- 2 SDs from normative sample mean)
R = Range between best and worst RTs is outside of normal limits C = Mean Reaction Time (RT) is below normal limits T = Number of True Positive (TP) responses is below normal limits F = Number of False Positive (FP) responses is above normal limits A = Signal detection estimate of d' [sensitivity] is below normal limits
Selection criteria # 5 developed on 04/27/87
Means are based on 82 males aged 35- 44 with education level > 16 years (Normative Group = SERONEG/509)
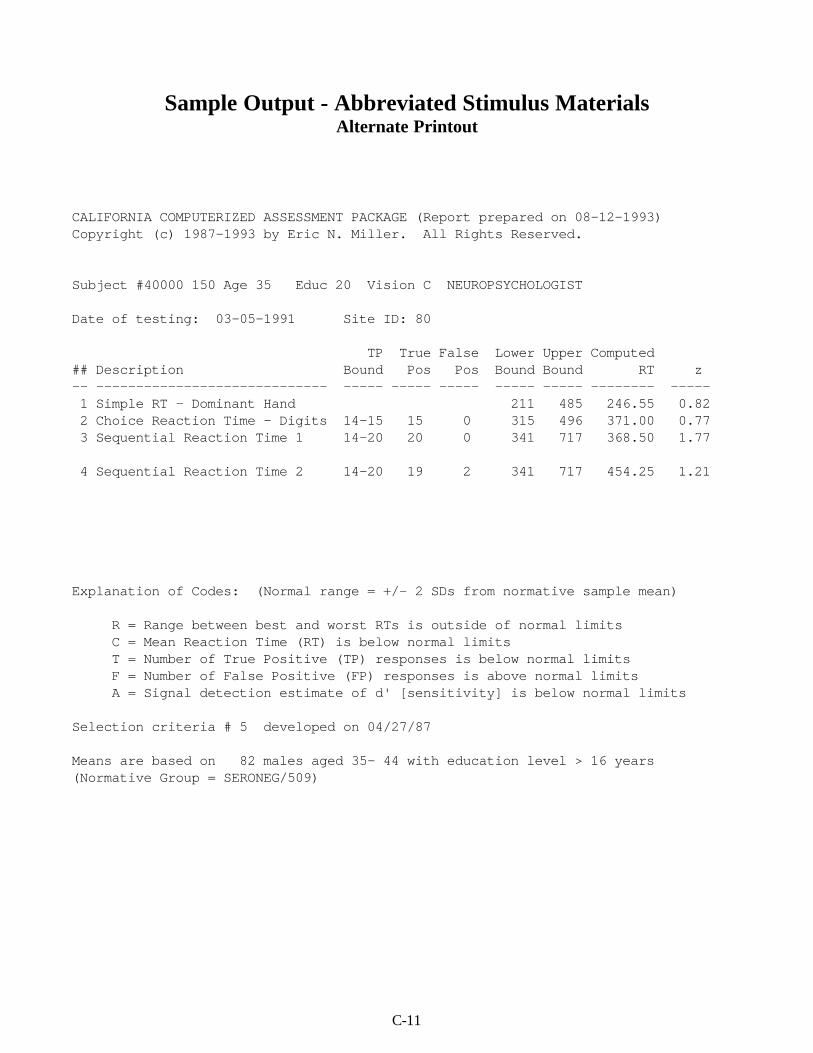
C-11
Sample Output - Abbreviated Stimulus MaterialsAlternate Printout
CALIFORNIA COMPUTERIZED ASSESSMENT PACKAGE (Report prepared on 08-12-1993)Copyright (c) 1987-1993 by Eric N. Miller. All Rights Reserved.
Subject #40000 150 Age 35 Educ 20 Vision C NEUROPSYCHOLOGIST
Date of testing: 03-05-1991 Site ID: 80
TP True False Lower Upper Computed ## Description Bound Pos Pos Bound Bound RT z-- ----------------------------- ----- ----- ----- ----- ----- -------- ----- 1 Simple RT - Dominant Hand 211 485 246.55 0.82 2 Choice Reaction Time - Digits 14-15 15 0 315 496 371.00 0.77 3 Sequential Reaction Time 1 14-20 20 0 341 717 368.50 1.77
4 Sequential Reaction Time 2 14-20 19 2 341 717 454.25 1.21
Explanation of Codes: (Normal range = +/- 2 SDs from normative sample mean)
R = Range between best and worst RTs is outside of normal limits C = Mean Reaction Time (RT) is below normal limits T = Number of True Positive (TP) responses is below normal limits F = Number of False Positive (FP) responses is above normal limits A = Signal detection estimate of d' [sensitivity] is below normal limits
Selection criteria # 5 developed on 04/27/87
Means are based on 82 males aged 35- 44 with education level > 16 years (Normative Group = SERONEG/509)
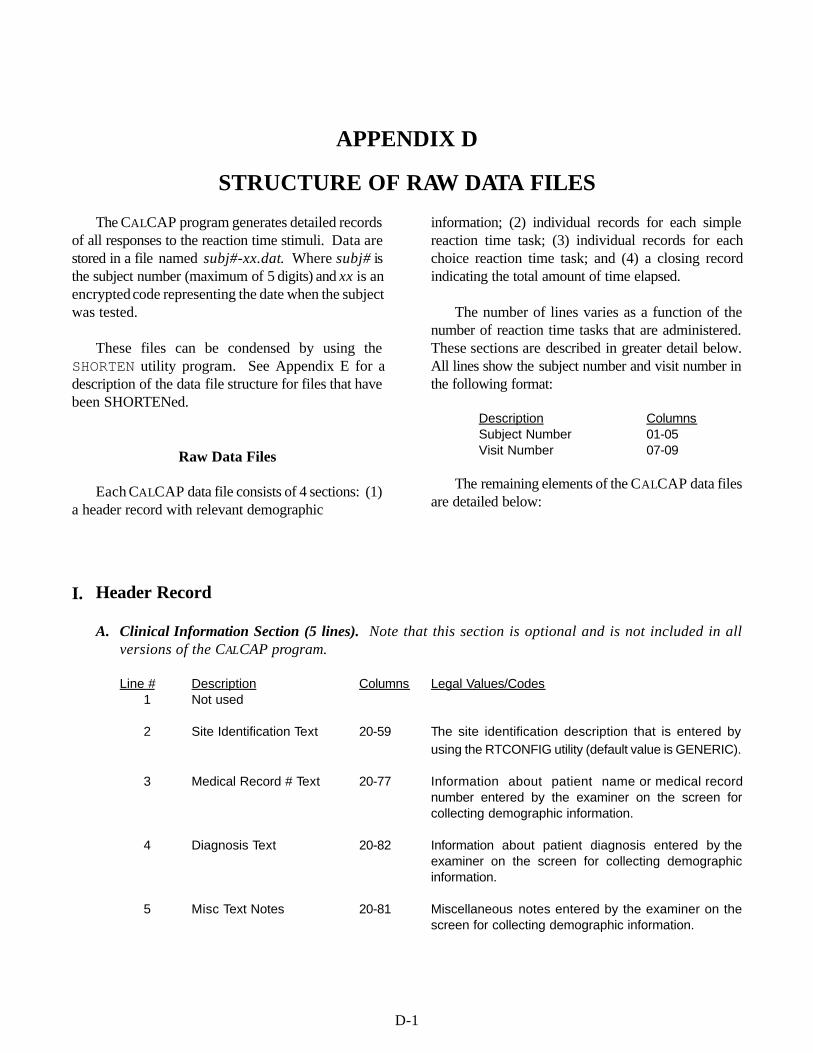
D-1
APPENDIX D
STRUCTURE OF RAW DATA FILES
The CALCAP program generates detailed recordsof all responses to the reaction time stimuli. Data arestored in a file named subj#-xx.dat. Where subj# isthe subject number (maximum of 5 digits) and xx is anencrypted code representing the date when the subjectwas tested.
These files can be condensed by using theSHORTEN utility program. See Appendix E for adescription of the data file structure for files that havebeen SHORTENed.
Raw Data Files
Each CALCAP data file consists of 4 sections: (1)a header record with relevant demographic
information; (2) individual records for each simplereaction time task; (3) individual records for eachchoice reaction time task; and (4) a closing recordindicating the total amount of time elapsed.
The number of lines varies as a function of thenumber of reaction time tasks that are administered.These sections are described in greater detail below.All lines show the subject number and visit number inthe following format:
Description ColumnsSubject Number 01-05Visit Number 07-09
The remaining elements of the CALCAP data filesare detailed below:
I. Header Record
A. Clinical Information Section (5 lines). Note that this section is optional and is not included in allversions of the CALCAP program.
Line # Description Columns Legal Values/Codes1 Not used
2 Site Identification Text 20-59 The site identification description that is entered byusing the RTCONFIG utility (default value is GENERIC).
3 Medical Record # Text 20-77 Information about patient name or medical recordnumber entered by the examiner on the screen forcollecting demographic information.
4 Diagnosis Text 20-82 Information about patient diagnosis entered by theexaminer on the screen for collecting demographicinformation.
5 Misc Text Notes 20-81 Miscellaneous notes entered by the examiner on thescreen for collecting demographic information.
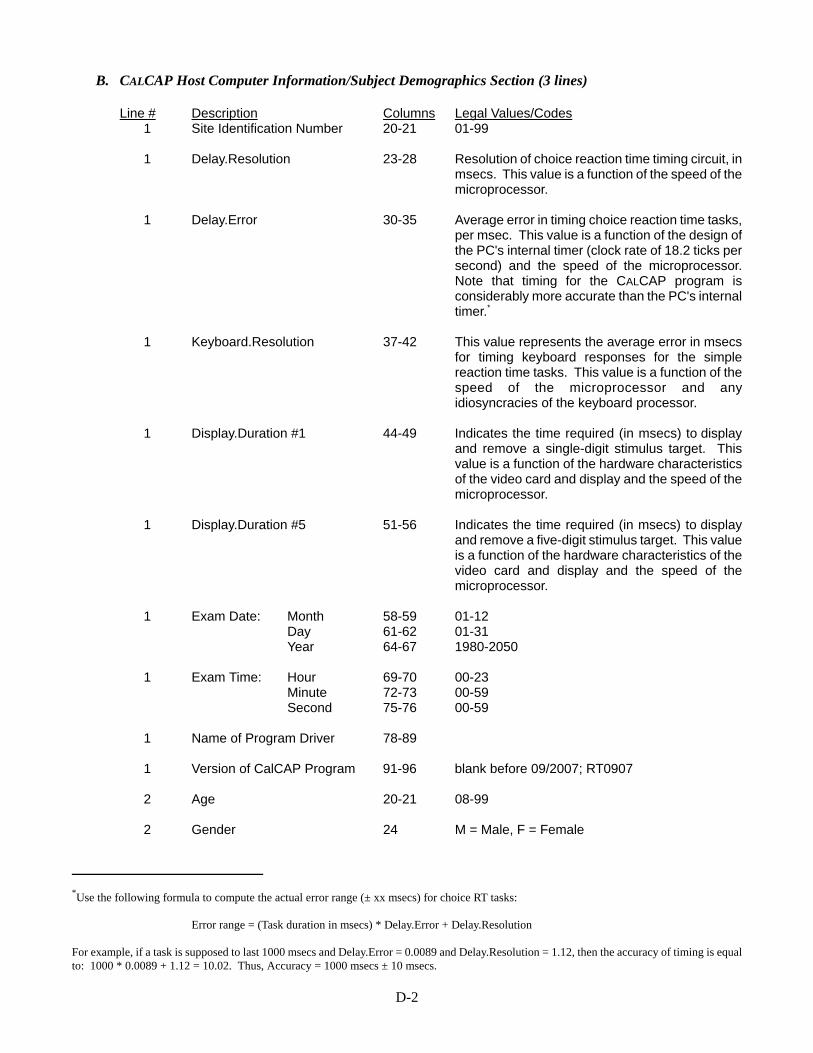
*Use the following formula to compute the actual error range (± xx msecs) for choice RT tasks:
Error range = (Task duration in msecs) * Delay.Error + Delay.Resolution
For example, if a task is supposed to last 1000 msecs and Delay.Error = 0.0089 and Delay.Resolution = 1.12, then the accuracy of timing is equalto: 1000 * 0.0089 + 1.12 = 10.02. Thus, Accuracy = 1000 msecs ± 10 msecs.
D-2
B. CALCAP Host Computer Information/Subject Demographics Section (3 lines)
Line # Description Columns Legal Values/Codes1 Site Identification Number 20-21 01-99
1 Delay.Resolution 23-28 Resolution of choice reaction time timing circuit, inmsecs. This value is a function of the speed of themicroprocessor.
1 Delay.Error 30-35 Average error in timing choice reaction time tasks,per msec. This value is a function of the design ofthe PC's internal timer (clock rate of 18.2 ticks persecond) and the speed of the microprocessor.Note that timing for the CALCAP program isconsiderably more accurate than the PC's internaltimer.*
1 Keyboard.Resolution 37-42 This value represents the average error in msecsfor timing keyboard responses for the simplereaction time tasks. This value is a function of thespeed of the microprocessor and anyidiosyncracies of the keyboard processor.
1 Display.Duration #1 44-49 Indicates the time required (in msecs) to displayand remove a single-digit stimulus target. Thisvalue is a function of the hardware characteristicsof the video card and display and the speed of themicroprocessor.
1 Display.Duration #5 51-56 Indicates the time required (in msecs) to displayand remove a five-digit stimulus target. This valueis a function of the hardware characteristics of thevideo card and display and the speed of themicroprocessor.
1 Exam Date: Month 58-59 01-12Day 61-62 01-31Year 64-67 1980-2050
1 Exam Time: Hour 69-70 00-23Minute 72-73 00-59Second 75-76 00-59
1 Name of Program Driver 78-89
1 Version of CalCAP Program 91-96 blank before 09/2007; RT0907
2 Age 20-21 08-99
2 Gender 24 M = Male, F = Female
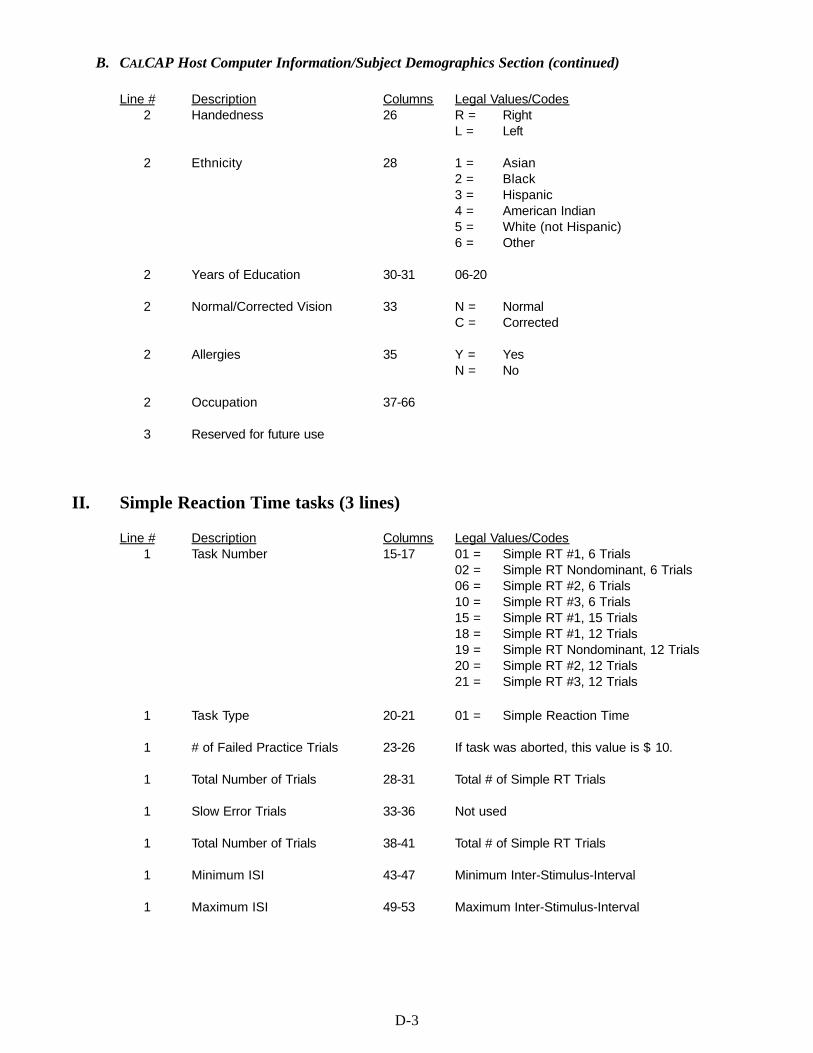
D-3
B. CALCAP Host Computer Information/Subject Demographics Section (continued)
Line # Description Columns Legal Values/Codes2 Handedness 26 R = Right
L = Left
2 Ethnicity 28 1 = Asian2 = Black3 = Hispanic4 = American Indian5 = White (not Hispanic)6 = Other
2 Years of Education 30-31 06-20
2 Normal/Corrected Vision 33 N = NormalC = Corrected
2 Allergies 35 Y = YesN = No
2 Occupation 37-66
3 Reserved for future use
II. Simple Reaction Time tasks (3 lines)
Line # Description Columns Legal Values/Codes1 Task Number 15-17 01 = Simple RT #1, 6 Trials
02 = Simple RT Nondominant, 6 Trials06 = Simple RT #2, 6 Trials10 = Simple RT #3, 6 Trials15 = Simple RT #1, 15 Trials18 = Simple RT #1, 12 Trials19 = Simple RT Nondominant, 12 Trials20 = Simple RT #2, 12 Trials21 = Simple RT #3, 12 Trials
1 Task Type 20-21 01 = Simple Reaction Time
1 # of Failed Practice Trials 23-26 If task was aborted, this value is $ 10.
1 Total Number of Trials 28-31 Total # of Simple RT Trials
1 Slow Error Trials 33-36 Not used
1 Total Number of Trials 38-41 Total # of Simple RT Trials
1 Minimum ISI 43-47 Minimum Inter-Stimulus-Interval
1 Maximum ISI 49-53 Maximum Inter-Stimulus-Interval
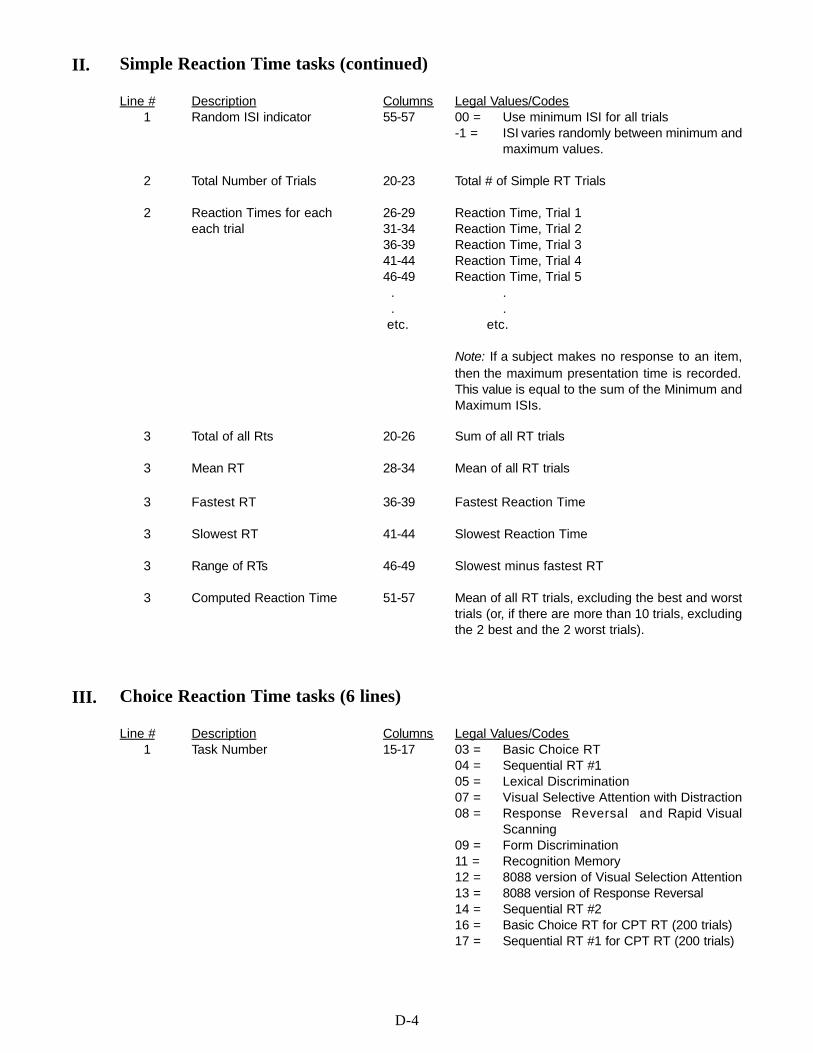
D-4
II. Simple Reaction Time tasks (continued)
Line # Description Columns Legal Values/Codes1 Random ISI indicator 55-57 00 = Use minimum ISI for all trials
-1 = ISI varies randomly between minimum andmaximum values.
2 Total Number of Trials 20-23 Total # of Simple RT Trials
2 Reaction Times for each 26-29 Reaction Time, Trial 1each trial 31-34 Reaction Time, Trial 2
36-39 Reaction Time, Trial 341-44 Reaction Time, Trial 446-49 Reaction Time, Trial 5 . . . . etc. etc.
Note: If a subject makes no response to an item,then the maximum presentation time is recorded.This value is equal to the sum of the Minimum andMaximum ISIs.
3 Total of all Rts 20-26 Sum of all RT trials
3 Mean RT 28-34 Mean of all RT trials
3 Fastest RT 36-39 Fastest Reaction Time
3 Slowest RT 41-44 Slowest Reaction Time
3 Range of RTs 46-49 Slowest minus fastest RT
3 Computed Reaction Time 51-57 Mean of all RT trials, excluding the best and worsttrials (or, if there are more than 10 trials, excludingthe 2 best and the 2 worst trials).
III. Choice Reaction Time tasks (6 lines)
Line # Description Columns Legal Values/Codes1 Task Number 15-17 03 = Basic Choice RT
04 = Sequential RT #105 = Lexical Discrimination07 = Visual Selective Attention with Distraction08 = Response Reversal and Rapid Visual
Scanning09 = Form Discrimination11 = Recognition Memory12 = 8088 version of Visual Selection Attention13 = 8088 version of Response Reversal14 = Sequential RT #216 = Basic Choice RT for CPT RT (200 trials)17 = Sequential RT #1 for CPT RT (200 trials)
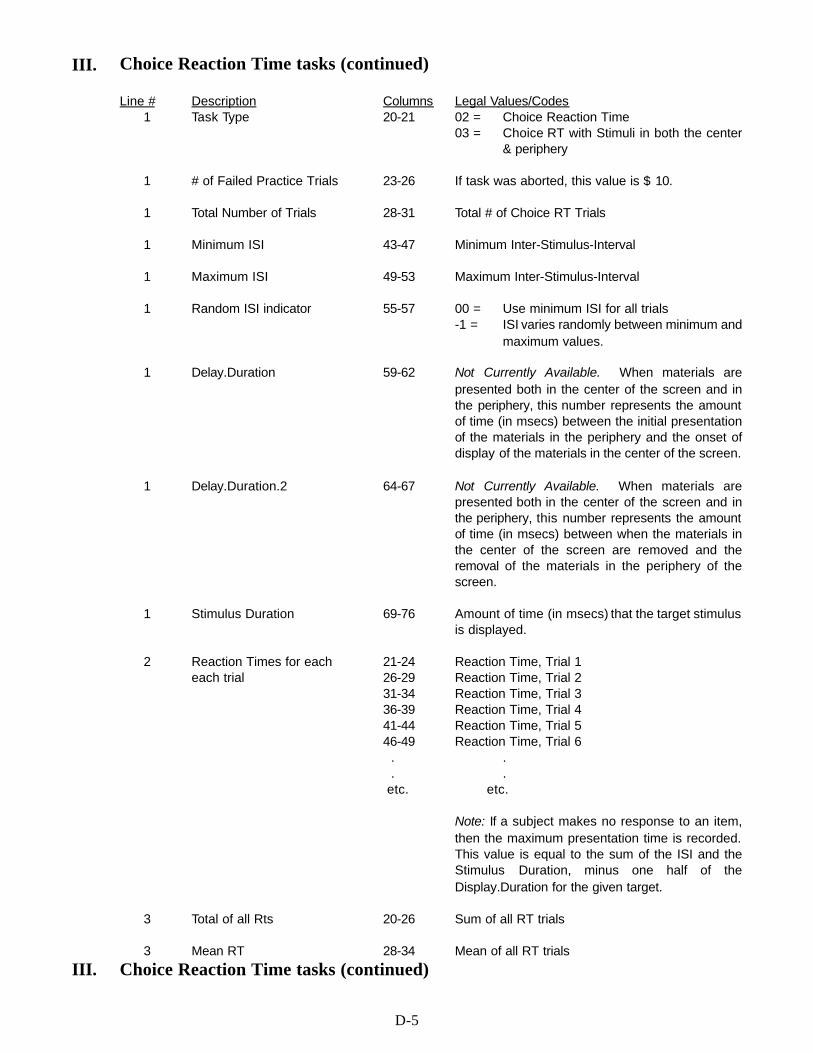
D-5
III. Choice Reaction Time tasks (continued)
Line # Description Columns Legal Values/Codes1 Task Type 20-21 02 = Choice Reaction Time
03 = Choice RT with Stimuli in both the center& periphery
1 # of Failed Practice Trials 23-26 If task was aborted, this value is $ 10.
1 Total Number of Trials 28-31 Total # of Choice RT Trials
1 Minimum ISI 43-47 Minimum Inter-Stimulus-Interval
1 Maximum ISI 49-53 Maximum Inter-Stimulus-Interval
1 Random ISI indicator 55-57 00 = Use minimum ISI for all trials-1 = ISI varies randomly between minimum and
maximum values.
1 Delay.Duration 59-62 Not Currently Available. When materials arepresented both in the center of the screen and inthe periphery, this number represents the amountof time (in msecs) between the initial presentationof the materials in the periphery and the onset ofdisplay of the materials in the center of the screen.
1 Delay.Duration.2 64-67 Not Currently Available. When materials arepresented both in the center of the screen and inthe periphery, this number represents the amountof time (in msecs) between when the materials inthe center of the screen are removed and theremoval of the materials in the periphery of thescreen.
1 Stimulus Duration 69-76 Amount of time (in msecs) that the target stimulusis displayed.
2 Reaction Times for each 21-24 Reaction Time, Trial 1each trial 26-29 Reaction Time, Trial 2
31-34 Reaction Time, Trial 336-39 Reaction Time, Trial 441-44 Reaction Time, Trial 546-49 Reaction Time, Trial 6 . . . . etc. etc.
Note: If a subject makes no response to an item,then the maximum presentation time is recorded.This value is equal to the sum of the ISI and theStimulus Duration, minus one half of theDisplay.Duration for the given target.
3 Total of all Rts 20-26 Sum of all RT trials
3 Mean RT 28-34 Mean of all RT trials
III. Choice Reaction Time tasks (continued)
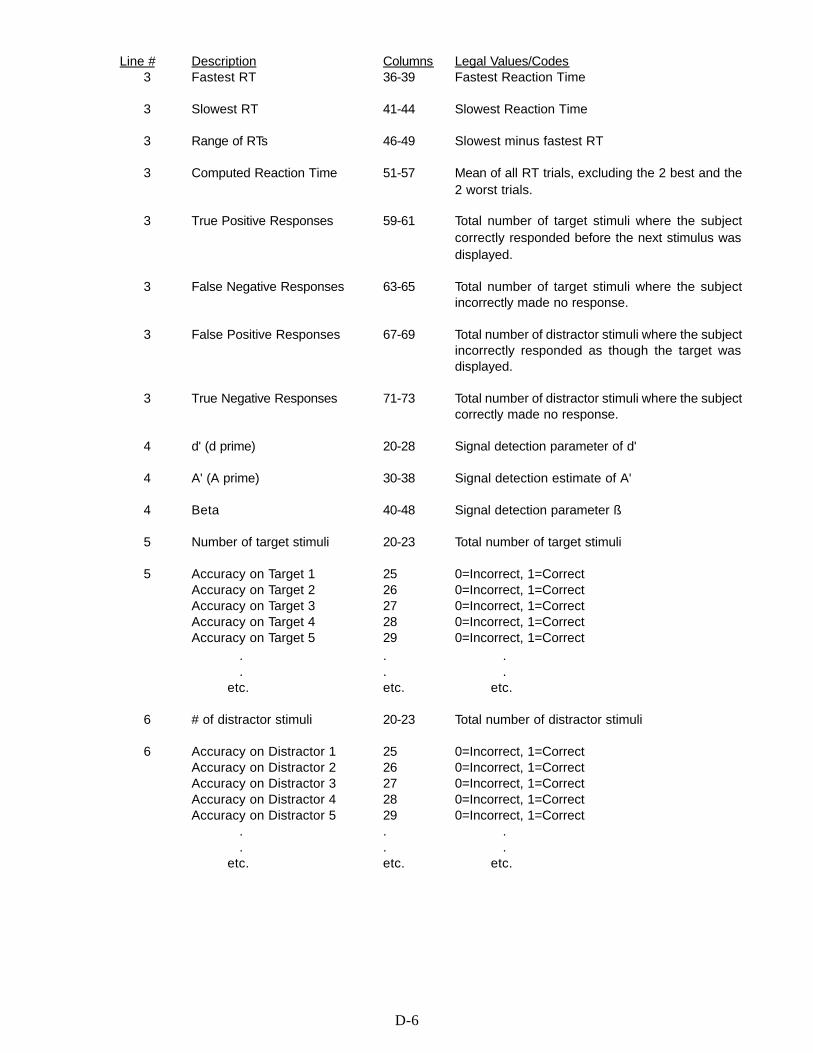
D-6
Line # Description Columns Legal Values/Codes3 Fastest RT 36-39 Fastest Reaction Time
3 Slowest RT 41-44 Slowest Reaction Time
3 Range of RTs 46-49 Slowest minus fastest RT
3 Computed Reaction Time 51-57 Mean of all RT trials, excluding the 2 best and the2 worst trials.
3 True Positive Responses 59-61 Total number of target stimuli where the subjectcorrectly responded before the next stimulus wasdisplayed.
3 False Negative Responses 63-65 Total number of target stimuli where the subjectincorrectly made no response.
3 False Positive Responses 67-69 Total number of distractor stimuli where the subjectincorrectly responded as though the target wasdisplayed.
3 True Negative Responses 71-73 Total number of distractor stimuli where the subjectcorrectly made no response.
4 d' (d prime) 20-28 Signal detection parameter of d'
4 A' (A prime) 30-38 Signal detection estimate of A'
4 Beta 40-48 Signal detection parameter ß
5 Number of target stimuli 20-23 Total number of target stimuli
5 Accuracy on Target 1 25 0=Incorrect, 1=CorrectAccuracy on Target 2 26 0=Incorrect, 1=CorrectAccuracy on Target 3 27 0=Incorrect, 1=CorrectAccuracy on Target 4 28 0=Incorrect, 1=CorrectAccuracy on Target 5 29 0=Incorrect, 1=Correct
. . .
. . . etc. etc. etc.
6 # of distractor stimuli 20-23 Total number of distractor stimuli
6 Accuracy on Distractor 1 25 0=Incorrect, 1=CorrectAccuracy on Distractor 2 26 0=Incorrect, 1=CorrectAccuracy on Distractor 3 27 0=Incorrect, 1=CorrectAccuracy on Distractor 4 28 0=Incorrect, 1=CorrectAccuracy on Distractor 5 29 0=Incorrect, 1=Correct
. . .
. . . etc. etc. etc.
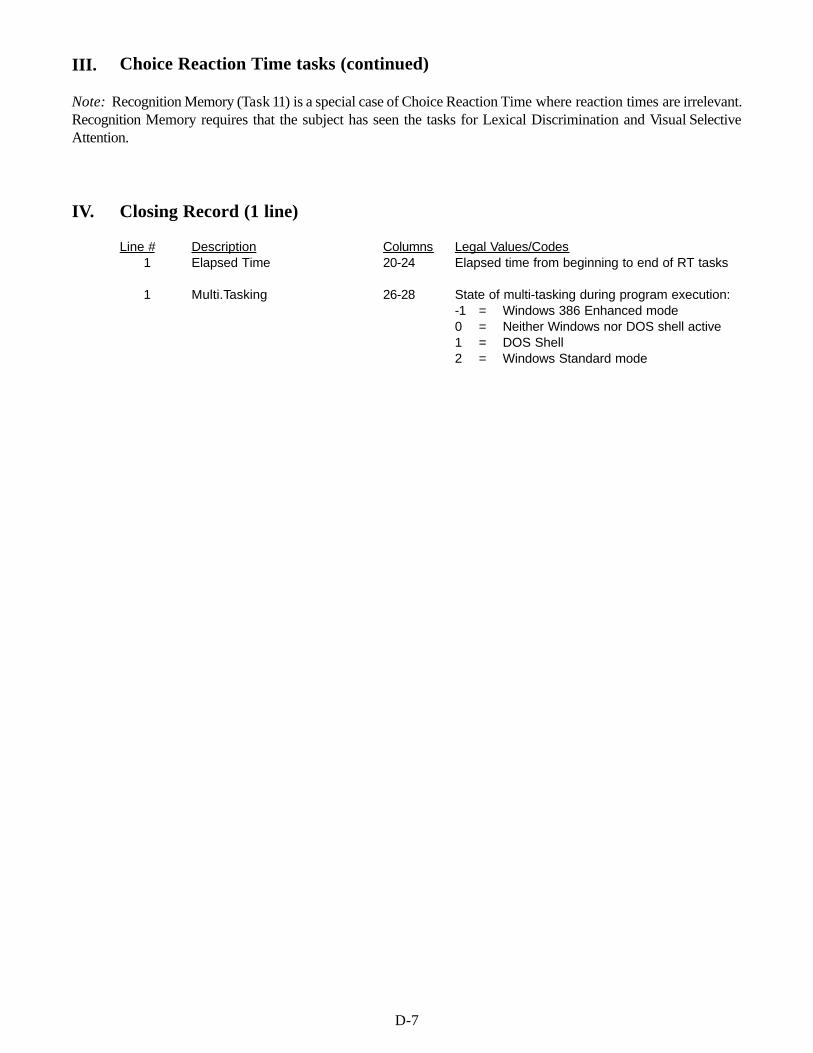
D-7
III. Choice Reaction Time tasks (continued)
Note: Recognition Memory (Task 11) is a special case of Choice Reaction Time where reaction times are irrelevant.Recognition Memory requires that the subject has seen the tasks for Lexical Discrimination and Visual SelectiveAttention.
IV. Closing Record (1 line)
Line # Description Columns Legal Values/Codes1 Elapsed Time 20-24 Elapsed time from beginning to end of RT tasks
1 Multi.Tasking 26-28 State of multi-tasking during program execution:-1 = Windows 386 Enhanced mode0 = Neither Windows nor DOS shell active1 = DOS Shell2 = Windows Standard mode
E-1
APPENDIX E
SHORTENED DATA FILES
How to SHORTEN CALCAP Data Files
It is possible to simplify the data structure of the rawCALCAP data files significantly by using theSHORTEN utility. This utility takes all CALCAP dataand arranges it in a fixed format suitable for use bystatistical packages or database programs. TheSHORTEN program is invoked by typing:
SHORTEN
at the DOS command prompt. The SHORTENprogram will merge all CALCAP raw data files of theform subjn-xx.dat into two data files namedMMDDYYA.DTA and MMDDYYA.DBF where MM isthe month, DD is the day, YY is the year, and the letterA is appended to the date if this is the first such file inyour directory, the letter B is appended if this is thesecond such file, and so on. The .DTA file is a plainASCII file that uses the structure described below.The .DBF file is in dBase® III format and can beused directly by most database programs and statisticalpackages.
In order to stay within the 128 variable limit of dBase,several variables are not included in the .DBF file,including the computer accuracy/resolution parameters( D e l a y. R e s o l u t i o n , D e l a y . E r r o r ,Keyboard.Resolution, Display.Duration #1,Display.Duration #5, Multi-tasking), the second ofthe day that the exam was started (Exam Time:Second), the Uncorrected Reaction Time variablesfor all tasks, and the Maximum Reaction Timevariables for all tasks. The values for MaximumReaction Time can be derived by summing the Rangeand Minimum Reaction Time variables (i.e., MaximumReaction Time = Minimum Reaction Time + Range).
The SHORTEN program is designed for use with theStandard and Abbreviated versions of the CALCAPprogram, and should work with most Customizedversions, as long as no single task (e.g., ChoiceReaction Time Task 03) is repeated more than once.
Edit Checks for SHORTENed Data Files
There are several checks that you should perform toensure data integrity. These checks are necessary toexclude subjects who score unusually poorly becausethey did not complete the task or did not understandthe instructions.
1. If the number of True Positives plus the number ofFalse Positives is less than 5, then all data fromthat task should be coded as missing.
2. If the Range of reaction time scores for any taskis equal to 0, then all data from that task should becoded as missing.
3. If the Range of reaction time scores for any of thesimple reaction time measures exceeds 1500msecs, all of the data from that task should becoded as missing.
4. If the Range of reaction time scores for any of thechoice reaction time measures (any measure asidefrom simple reaction time) exceeds 1000 msecs,then all data from that task should be coded asmissing.
5. If the Corrected Reaction Time for any of thesimple reaction time procedures is less than 200msecs or exceeds 1600 msecs, all data from thattask should be coded as missing.
6. If the Corrected Reaction Time for any of thechoice reaction time measures (any measure asidefrom simple reaction time) is less than 200 msecsor exceeds 1000 msecs, then all data from thattask should be coded as missing.
7. If the number of True Positive responses is lessthan 2, then all data from that task should becoded as missing.
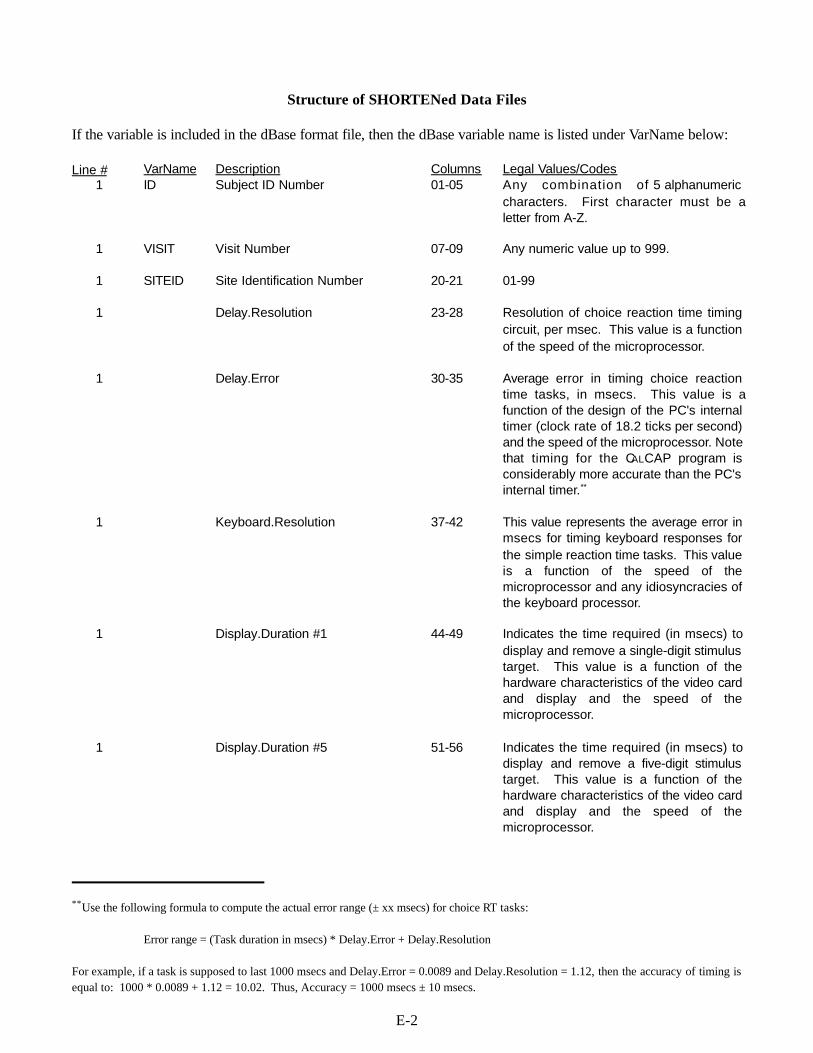
**Use the following formula to compute the actual error range (± xx msecs) for choice RT tasks:
Error range = (Task duration in msecs) * Delay.Error + Delay.Resolution
For example, if a task is supposed to last 1000 msecs and Delay.Error = 0.0089 and Delay.Resolution = 1.12, then the accuracy of timing isequal to: 1000 * 0.0089 + 1.12 = 10.02. Thus, Accuracy = 1000 msecs ± 10 msecs.
E-2
Structure of SHORTENed Data Files
If the variable is included in the dBase format file, then the dBase variable name is listed under VarName below:
Line # VarName Description Columns Legal Values/Codes1 ID Subject ID Number 01-05 Any combination of 5 alphanumeric
characters. First character must be aletter from A-Z.
1 VISIT Visit Number 07-09 Any numeric value up to 999.
1 SITEID Site Identification Number 20-21 01-99
1 Delay.Resolution 23-28 Resolution of choice reaction time timingcircuit, per msec. This value is a functionof the speed of the microprocessor.
1 Delay.Error 30-35 Average error in timing choice reactiontime tasks, in msecs. This value is afunction of the design of the PC's internaltimer (clock rate of 18.2 ticks per second)and the speed of the microprocessor. Notethat timing for the CALCAP program isconsiderably more accurate than the PC'sinternal timer.**
1 Keyboard.Resolution 37-42 This value represents the average error inmsecs for timing keyboard responses forthe simple reaction time tasks. This valueis a function of the speed of themicroprocessor and any idiosyncracies ofthe keyboard processor.
1 Display.Duration #1 44-49 Indicates the time required (in msecs) todisplay and remove a single-digit stimulustarget. This value is a function of thehardware characteristics of the video cardand display and the speed of themicroprocessor.
1 Display.Duration #5 51-56 Indicates the time required (in msecs) todisplay and remove a five-digit stimulustarget. This value is a function of thehardware characteristics of the video cardand display and the speed of themicroprocessor.
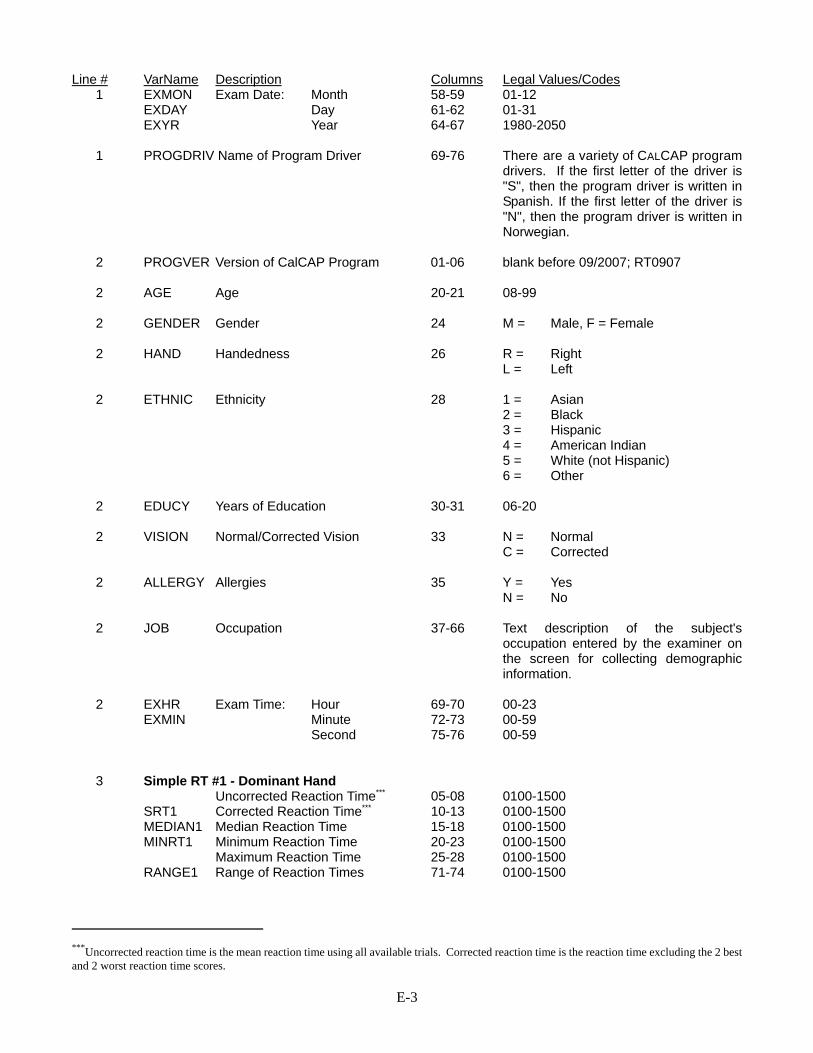
***Uncorrected reaction time is the mean reaction time using all available trials. Corrected reaction time is the reaction time excluding the 2 bestand 2 worst reaction time scores.
E-3
Line # VarName Description Columns Legal Values/Codes1 EXMON Exam Date: Month 58-59 01-12
EXDAY Day 61-62 01-31EXYR Year 64-67 1980-2050
1 PROGDRIV Name of Program Driver 69-76 There are a variety of CALCAP programdrivers. If the first letter of the driver is"S", then the program driver is written inSpanish. If the first letter of the driver is"N", then the program driver is written inNorwegian.
2 PROGVER Version of CalCAP Program 01-06 blank before 09/2007; RT0907
2 AGE Age 20-21 08-99
2 GENDER Gender 24 M = Male, F = Female
2 HAND Handedness 26 R = RightL = Left
2 ETHNIC Ethnicity 28 1 = Asian2 = Black3 = Hispanic4 = American Indian5 = White (not Hispanic)6 = Other
2 EDUCY Years of Education 30-31 06-20
2 VISION Normal/Corrected Vision 33 N = NormalC = Corrected
2 ALLERGY Allergies 35 Y = YesN = No
2 JOB Occupation 37-66 Text description of the subject'soccupation entered by the examiner onthe screen for collecting demographicinformation.
2 EXHR Exam Time: Hour 69-70 00-23EXMIN Minute 72-73 00-59
Second 75-76 00-59
3 Simple RT #1 - Dominant HandUncorrected Reaction Time*** 05-08 0100-1500
SRT1 Corrected Reaction Time*** 10-13 0100-1500 MEDIAN1 Median Reaction Time 15-18 0100-1500
MINRT1 Minimum Reaction Time 20-23 0100-1500 Maximum Reaction Time 25-28 0100-1500
RANGE1 Range of Reaction Times 71-74 0100-1500
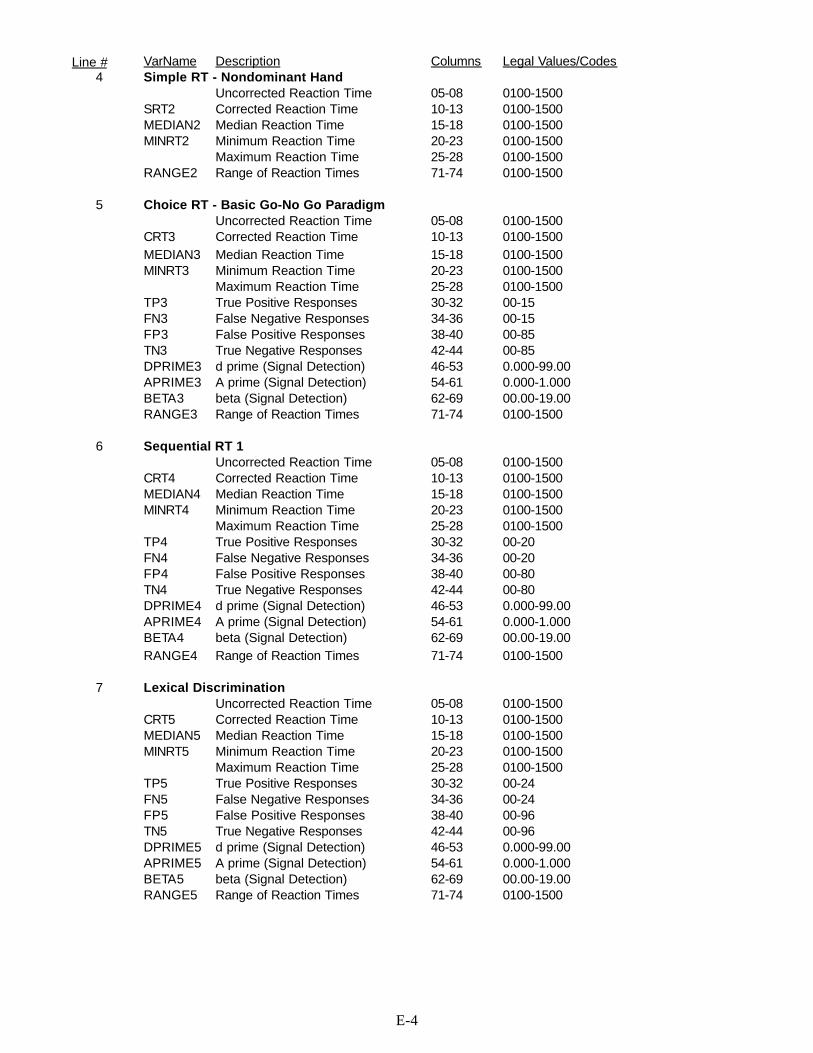
E-4
Line # VarName Description Columns Legal Values/Codes4 Simple RT - Nondominant Hand
Uncorrected Reaction Time 05-08 0100-1500 SRT2 Corrected Reaction Time 10-13 0100-1500 MEDIAN2 Median Reaction Time 15-18 0100-1500
MINRT2 Minimum Reaction Time 20-23 0100-1500 Maximum Reaction Time 25-28 0100-1500
RANGE2 Range of Reaction Times 71-74 0100-1500
5 Choice RT - Basic Go-No Go ParadigmUncorrected Reaction Time 05-08 0100-1500
CRT3 Corrected Reaction Time 10-13 0100-1500 MEDIAN3 Median Reaction Time 15-18 0100-1500
MINRT3 Minimum Reaction Time 20-23 0100-1500 Maximum Reaction Time 25-28 0100-1500 TP3 True Positive Responses 30-32 00-15
FN3 False Negative Responses 34-36 00-15FP3 False Positive Responses 38-40 00-85TN3 True Negative Responses 42-44 00-85DPRIME3 d prime (Signal Detection) 46-53 0.000-99.00APRIME3 A prime (Signal Detection) 54-61 0.000-1.000BETA3 beta (Signal Detection) 62-69 00.00-19.00RANGE3 Range of Reaction Times 71-74 0100-1500
6 Sequential RT 1 Uncorrected Reaction Time 05-08 0100-1500
CRT4 Corrected Reaction Time 10-13 0100-1500 MEDIAN4 Median Reaction Time 15-18 0100-1500
MINRT4 Minimum Reaction Time 20-23 0100-1500 Maximum Reaction Time 25-28 0100-1500 TP4 True Positive Responses 30-32 00-20
FN4 False Negative Responses 34-36 00-20FP4 False Positive Responses 38-40 00-80TN4 True Negative Responses 42-44 00-80DPRIME4 d prime (Signal Detection) 46-53 0.000-99.00APRIME4 A prime (Signal Detection) 54-61 0.000-1.000BETA4 beta (Signal Detection) 62-69 00.00-19.00RANGE4 Range of Reaction Times 71-74 0100-1500
7 Lexical DiscriminationUncorrected Reaction Time 05-08 0100-1500
CRT5 Corrected Reaction Time 10-13 0100-1500 MEDIAN5 Median Reaction Time 15-18 0100-1500
MINRT5 Minimum Reaction Time 20-23 0100-1500 Maximum Reaction Time 25-28 0100-1500 TP5 True Positive Responses 30-32 00-24
FN5 False Negative Responses 34-36 00-24FP5 False Positive Responses 38-40 00-96TN5 True Negative Responses 42-44 00-96DPRIME5 d prime (Signal Detection) 46-53 0.000-99.00APRIME5 A prime (Signal Detection) 54-61 0.000-1.000BETA5 beta (Signal Detection) 62-69 00.00-19.00RANGE5 Range of Reaction Times 71-74 0100-1500
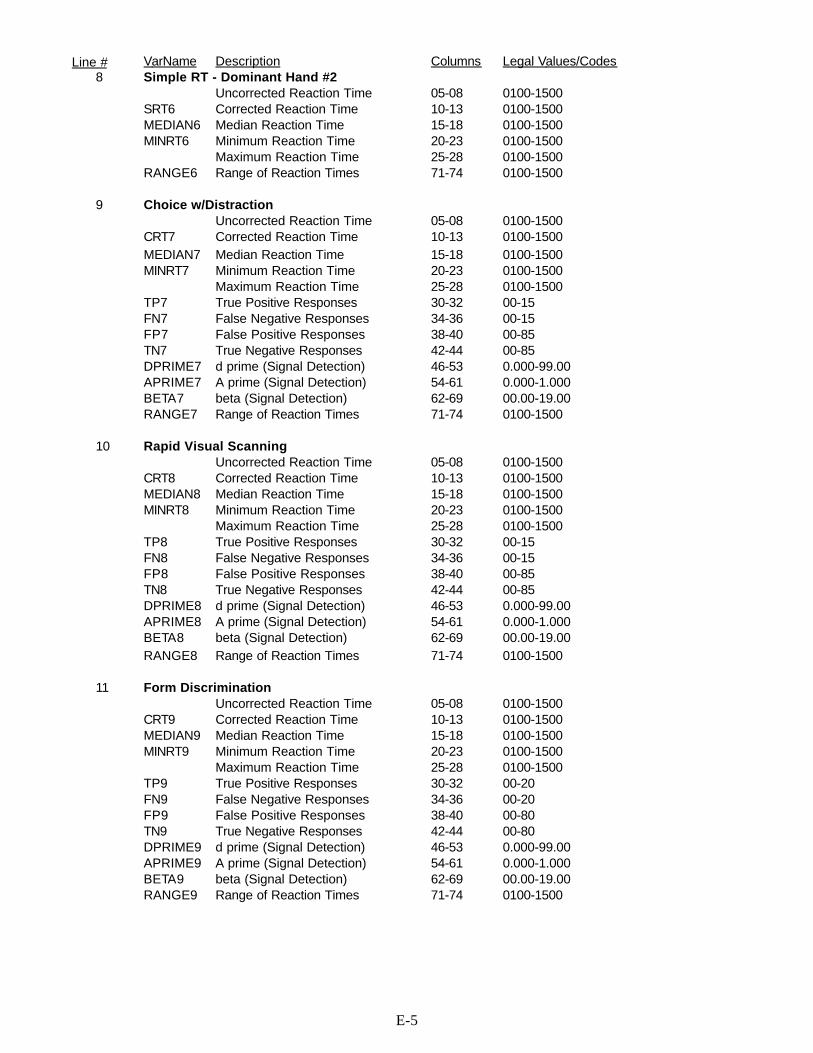
E-5
Line # VarName Description Columns Legal Values/Codes8 Simple RT - Dominant Hand #2
Uncorrected Reaction Time 05-08 0100-1500 SRT6 Corrected Reaction Time 10-13 0100-1500 MEDIAN6 Median Reaction Time 15-18 0100-1500
MINRT6 Minimum Reaction Time 20-23 0100-1500 Maximum Reaction Time 25-28 0100-1500
RANGE6 Range of Reaction Times 71-74 0100-1500
9 Choice w/DistractionUncorrected Reaction Time 05-08 0100-1500
CRT7 Corrected Reaction Time 10-13 0100-1500 MEDIAN7 Median Reaction Time 15-18 0100-1500
MINRT7 Minimum Reaction Time 20-23 0100-1500 Maximum Reaction Time 25-28 0100-1500 TP7 True Positive Responses 30-32 00-15
FN7 False Negative Responses 34-36 00-15FP7 False Positive Responses 38-40 00-85TN7 True Negative Responses 42-44 00-85DPRIME7 d prime (Signal Detection) 46-53 0.000-99.00APRIME7 A prime (Signal Detection) 54-61 0.000-1.000BETA7 beta (Signal Detection) 62-69 00.00-19.00RANGE7 Range of Reaction Times 71-74 0100-1500
10 Rapid Visual ScanningUncorrected Reaction Time 05-08 0100-1500
CRT8 Corrected Reaction Time 10-13 0100-1500 MEDIAN8 Median Reaction Time 15-18 0100-1500
MINRT8 Minimum Reaction Time 20-23 0100-1500 Maximum Reaction Time 25-28 0100-1500 TP8 True Positive Responses 30-32 00-15
FN8 False Negative Responses 34-36 00-15FP8 False Positive Responses 38-40 00-85TN8 True Negative Responses 42-44 00-85DPRIME8 d prime (Signal Detection) 46-53 0.000-99.00APRIME8 A prime (Signal Detection) 54-61 0.000-1.000BETA8 beta (Signal Detection) 62-69 00.00-19.00RANGE8 Range of Reaction Times 71-74 0100-1500
11 Form DiscriminationUncorrected Reaction Time 05-08 0100-1500
CRT9 Corrected Reaction Time 10-13 0100-1500 MEDIAN9 Median Reaction Time 15-18 0100-1500
MINRT9 Minimum Reaction Time 20-23 0100-1500 Maximum Reaction Time 25-28 0100-1500 TP9 True Positive Responses 30-32 00-20
FN9 False Negative Responses 34-36 00-20FP9 False Positive Responses 38-40 00-80TN9 True Negative Responses 42-44 00-80DPRIME9 d prime (Signal Detection) 46-53 0.000-99.00APRIME9 A prime (Signal Detection) 54-61 0.000-1.000BETA9 beta (Signal Detection) 62-69 00.00-19.00RANGE9 Range of Reaction Times 71-74 0100-1500
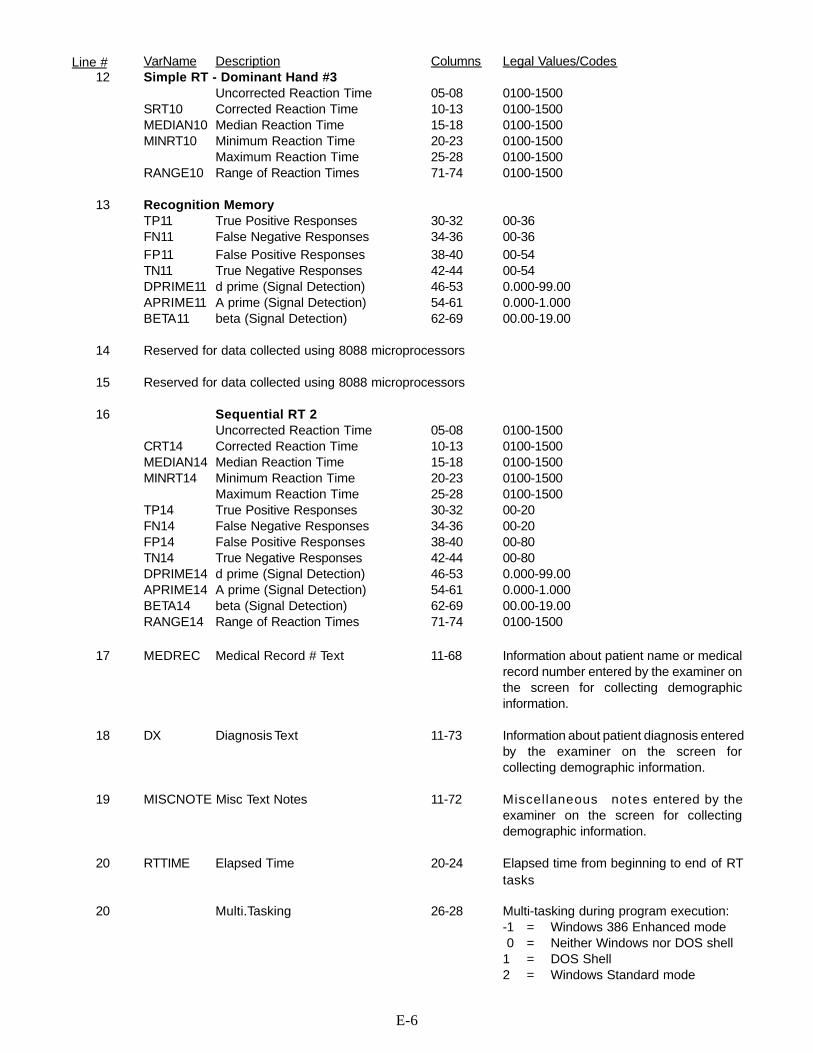
E-6
Line # VarName Description Columns Legal Values/Codes12 Simple RT - Dominant Hand #3
Uncorrected Reaction Time 05-08 0100-1500 SRT10 Corrected Reaction Time 10-13 0100-1500 MEDIAN10 Median Reaction Time 15-18 0100-1500
MINRT10 Minimum Reaction Time 20-23 0100-1500 Maximum Reaction Time 25-28 0100-1500
RANGE10 Range of Reaction Times 71-74 0100-1500
13 Recognition Memory TP11 True Positive Responses 30-32 00-36
FN11 False Negative Responses 34-36 00-36FP11 False Positive Responses 38-40 00-54TN11 True Negative Responses 42-44 00-54DPRIME11 d prime (Signal Detection) 46-53 0.000-99.00APRIME11 A prime (Signal Detection) 54-61 0.000-1.000BETA11 beta (Signal Detection) 62-69 00.00-19.00
14 Reserved for data collected using 8088 microprocessors
15 Reserved for data collected using 8088 microprocessors
16 Sequential RT 2Uncorrected Reaction Time 05-08 0100-1500
CRT14 Corrected Reaction Time 10-13 0100-1500 MEDIAN14 Median Reaction Time 15-18 0100-1500
MINRT14 Minimum Reaction Time 20-23 0100-1500 Maximum Reaction Time 25-28 0100-1500 TP14 True Positive Responses 30-32 00-20
FN14 False Negative Responses 34-36 00-20FP14 False Positive Responses 38-40 00-80TN14 True Negative Responses 42-44 00-80DPRIME14 d prime (Signal Detection) 46-53 0.000-99.00APRIME14 A prime (Signal Detection) 54-61 0.000-1.000BETA14 beta (Signal Detection) 62-69 00.00-19.00RANGE14 Range of Reaction Times 71-74 0100-1500
17 MEDREC Medical Record # Text 11-68 Information about patient name or medicalrecord number entered by the examiner onthe screen for collecting demographicinformation.
18 DX Diagnosis Text 11-73 Information about patient diagnosis enteredby the examiner on the screen forcollecting demographic information.
19 MISCNOTE Misc Text Notes 11-72 Miscellaneous notes entered by theexaminer on the screen for collectingdemographic information.
20 RTTIME Elapsed Time 20-24 Elapsed time from beginning to end of RTtasks
20 Multi.Tasking 26-28 Multi-tasking during program execution:-1 = Windows 386 Enhanced mode 0 = Neither Windows nor DOS shell1 = DOS Shell2 = Windows Standard mode
F-1
APPENDIX F
CALCAP Reaction Time
Bibliography and Selected Abstracts from Articles andConference Presentations
Attached are abstracts from articles and conference presentations that contain valuableinformation about clinical and research applications of the CalCAP test battery, as well
as psychometric properties of the instrument.
F-2
Suggested Readings aboutReaction Time and CALCAP
(Research that uses the CALCAP procedures is highlighted with italics)
Berg D. Adults' reaction time as affected by age andeducation level. B.A. Honours Thesis supervisedby Dr. Frank Spellacy, University of Victoria,1994.
Bruhn P, Parsons OA. Continuous reaction time in braindamage. Cortex, 1971:7;278-291.
Budzinski LM, An exploration of simple and choicereaction times in children. B.A. Honours Thesissupervised by Dr. Frank Spellacy, University ofVictoria, Victoria, B.C., 1994.
Caretti DM. Cognitive performance during long-term respirator wear while at rest. AmericanIndustrial Hygiene Association Journal,1997:58:105-109.
Caretti DM, Bay-Hansen LA, Kuhlmann WD.Cognitive performance during respirator wearin the absence of other stressors. AmericanIndustrial Hygiene Association Journal,1995:56:776-781.
Clarkson PM, Kroll W. Practice effects on fractionatedresponse time related to age and activity level. Journalof Motor Behavior, 1978:10;275-286.
Crabtree DA, Antrim LR. Guidelines for measuringreaction time. Perceptual and Motor Skills,1988:66;363-370.
The Dana Consortium on Therapy for HIV Dementiaand Related Cognitive Disorders. Clinicalconfirmation of the American Academy ofNeurology algorithm for HIV-1-associatedcognitive/motor disorder. Neurology,1996;47:1247-1253.
Donders FC. On the speed of mental processes. ActaPsychologica (Amsterdam), 1969:30;412-431.
Dunlop O, Myrvang B. Neuropsychological tests inHIV [letter]. Neurology, 1992:42:2055-2056.
Durvasula RS, Myers HM, Satz P, Miller EN, ForneyD, Evans G, Richardson M, Morgenstern H. HIV-
1, cocaine, and neuropsychologicalperformance in African American men.Submitted for publication.
Durvasula RS, Miller EN, Myers HM, Satz P, WyattG. Neuropsychological performance and HIV-1in ethnic minority samples of women and men:serostatus effects, comparative data andmethodological considerations. Presented atthe Annual Meeting of the InternationalNeuropsychological Society, Honolulu,February, 1998.
Durvasula RS, Miller EN, Wyatt GE. Longitudinalassessment of neuropsychological performancein HIV+ women (baseline and 6 months).Presented at the 12th Worlds AIDS Conference,Geneva, Switzerland, 1998.
Gallway RA, Millington JT, Van Gorp WG, MillerEN, Mirsky AF. Neuropsychologicalconsequences of hyperbaric nitrogen narcosis II[abstract]. Journal of Clinical andExperimental Neuropsychology, 1991:13;440.
Halman M, Hamburg NM, Savage CR, Worth JL. Useof computer-based measures of complexreaction time in depressed HIV-1 infectedpatients [abstract]. Psychosomatics,1995:36;175.
Kerr B. Processing demands during mental operations.Memory and Cognition, 1973:1;401-412.
Llorente AM, Miller EN, D’Elia LF, Selnes OA,Wesch J, Becker JT, Satz P for the MulticenterAIDS Cohort Study (MACS). Slowedinformation processing in HIV-1 disease.Journal of Clinical and ExperimentalNeuropsychology. 1998; 20: 60-72.
Martin A, Heyes MP, Salazar AM, Kampen DL, WilliamsJ, Law WA, Coats ME, Markey SP. Progressiveslowing of reaction time and increasing cerebrospinalfluid concentrations of quinolinic acid in HIV-infected
F-3
individuals. Journal of Neuropsychiatry and ClinicalNeurosciences, 1992:4;270-279.
Martin EM, Sorensen DJ, Edelstein HE, Robertson LC.Decision-making speed in HIV-1 infection: apreliminary report. AIDS, 1992;6:109-113.
Martin EM, Sorensen DJ, Robertson LC, Edelstein HE,Chirurgi VA. Spatial attention in HIV-1 infection: apreliminary report. Journal of Neuropsychiatry andClinical Neurosciences, 1992;4:288-293.
Martin EM, Robertson LC, Sorensen DJ, Jagust WJ,Mallon KF, Chirurgi VA. Speed of memory scanningis not affected in early HIV-1 infection. Journal ofClinical and Experimental Neuropsychology,1993;15:311-320.
Mateos JLA. Actas Luso-Espanolas de NeurologiaPsiquiatria y Ciencias Afines, 1997;25:45.
Miller EN. California Computerized AssessmentBattery (CalCAP) Manual. Los Angeles:Norland Software, 1990.
Miller EN. Cognitive testing using reaction time andtraditional neuropsychological procedures.Journal of the InternationalNeuropsychological Society. 1995;1:393.
Miller EN. Use of computerized reaction time in theassessment of dementia [abstract]. Neurology,1992;42(suppl 3):220.
Miller EN, Bing EG, Selnes OA, Wesch J, Becker JT.The effects of sociodemographic factors onreaction time and speed of informationprocessing. Journal of Clinical andExperimental Neuropsychology, 1993;15:66.
Miller EN, Satz P, Van Gorp W, Visscher B, Dudley J.Computerized screening for HIV-relatedcognitive decline in gay men: Cross-sectionalanalyses and one-year follow-up. (Abstract). Proceedings of the V International Conferenceon AIDS (Montreal, Canada), 1989; 465.
Miller EN, Satz P, Van Gorp W, Visscher B, Dudley J.Computerized screening for HIV-relatedcognitive decline in gay men. (Abstract). Proceedings of the IV International Conferenceon AIDS (Stockholm, Sweden), 1988;1:378.
Miller EN, Satz P, Visscher B. Neuropsychologicaltests in HIV: Reply from the authors [letter]. Neurology, 1992;42:2056.
Miller EN, Satz P, Visscher B. Computerized andconventional neuropsychological assessment ofHIV-1 infected homosexual men. Neurology,1991;41:1608-1616.
Miller EN, Satz P, Visscher B. Computerizedneuropsychological assessment for HIV-relatedencephalopathy. Symposium on Novel andTraditional Approaches for Early Detection ofHIV-1 Related Dementia (Vancouver, Canada). Journal of Clinical and ExperimentalNeuropsychology, 1989;11:34-35.
Miller EN, Wilkie FL. Computerized testing to assesscognition in HIV-positive individuals. In: GrantI, Martin A, eds. Neuropsychology of HIVInfection: Current Research and NewDirections. New York: Oxford; 1994;161-175.
Mowbray GH, Rhoades MV. On the reduction of choicereaction times with practice. Quarterly Journal ofExperimental Psychology, 1959:11;16-23.
Norrie ML. Practice effects on reaction latency for simpleand complex movements. Research Quarterly: TheAmerican Association for Health and PhysicalEducation, 1967:38;79-85.
Perdices M, Cooper DA. Simple and choice reaction timein patients with human immunodeficiency virusinfection. Ann Neurol 1989;25:460-467.
Posner MI. Chronometric explorations of mind. Erlbaum:Hillsdale, NJ, 1978.
Posner MI, Mitchell RF. Chronometric analysis ofclassification. Psychological Review,1967:74;392-409.
Posner MI, Cohen Y, Rafal RD. Neural systems control ofspatial orienting. Phil Trans R Soc Lond1982;298:187-198.
Richardson MA, Satz P, Myers HF, Miller EN, BingEG, Fawzy FI, Maj M. Effects of depressed moodversus clinical depression onneuropsychological test performance amongAfrican American men impacted by HIV/AIDS.Submitted for publication.
Selnes OA, Miller EN. Development of a screeningbattery for HIV-related cognitive impairment:the MACS experience. In: Grant I, Martin A, eds.Neuropsychology of HIV Infection: CurrentResearch and New Directions. New York:Oxford University Press; 1994:176-187.
F-4
Sternberg S. High speed scanning in human memory.Science 1966;153:652-654.
Sternberg S. Memory scanning: new findings and currentcontroversies. Q J Exp Psychol 1975;27:1-32.
van Gorp WG, Miller EN, Marcotte TD, Dixon W, PazD, Selnes O, Wesch J, Becker JT, Hinkin CH,Mitrushina M, Satz P, Weisman JD, BuckinghamSL, Stenquist PK. The relationship between ageand cognitive impairment in HIV-1 infection:findings from the Multicenter AIDS CohortStudy and a clinical cohort. Neurology.1994;44:929-935.
Vernon PA. New developments in reaction time research.In P.A. Vernon, (Ed.) Speed of Information Processingand Intelligence. Ablex Publishing, Norwood, NJ,1987, 1-20.
Waterloo K, Ingebrigtsen T, Romner B.Neuropsychological function in patients withincreased serum levels of protein S-100 afterminor head injury. Acta Neurochirurgica,1997:139;26-32.
Welford AT. Reaction times. Academic Press: New York,1980.
Welford AT. Note on the effects of practice on reactiontimes. Journal of Motor Behavior, 1986:18;343-345.
Wilkie FL, Eisdorfer C, Morgan R, Loewenstein DA,Szapocznik J. Cognition in early humanimmunodeficiency virus infection. Arch Neurol1990;47:433-440.
Wilkinson RT, Allison S. Age and simple reaction time:decade differences for 5,325 subjects. Journal ofGerontology, 1989:44;29-36.
Worth JL, Savage CR, and Navia BA. Computer-based screening test for AIDS dementiacomplex. Presented at the Annual Meeting ofthe American Psychiatric Association,Washington, DC, 1992.
Worth JL, Savage CR, and Navia BA. Computer-based measures of neuropsychological deficitsin patients with HIV-1 cognitive/motor complex.Int Conf AIDS, 1992;8.
Worth JL, Savage CR, Baer L, Esty EK, and NaviaBA. Computer-based neuropsychologicalscreening for AIDS dementia complex. AIDS,1993;7:677-681.
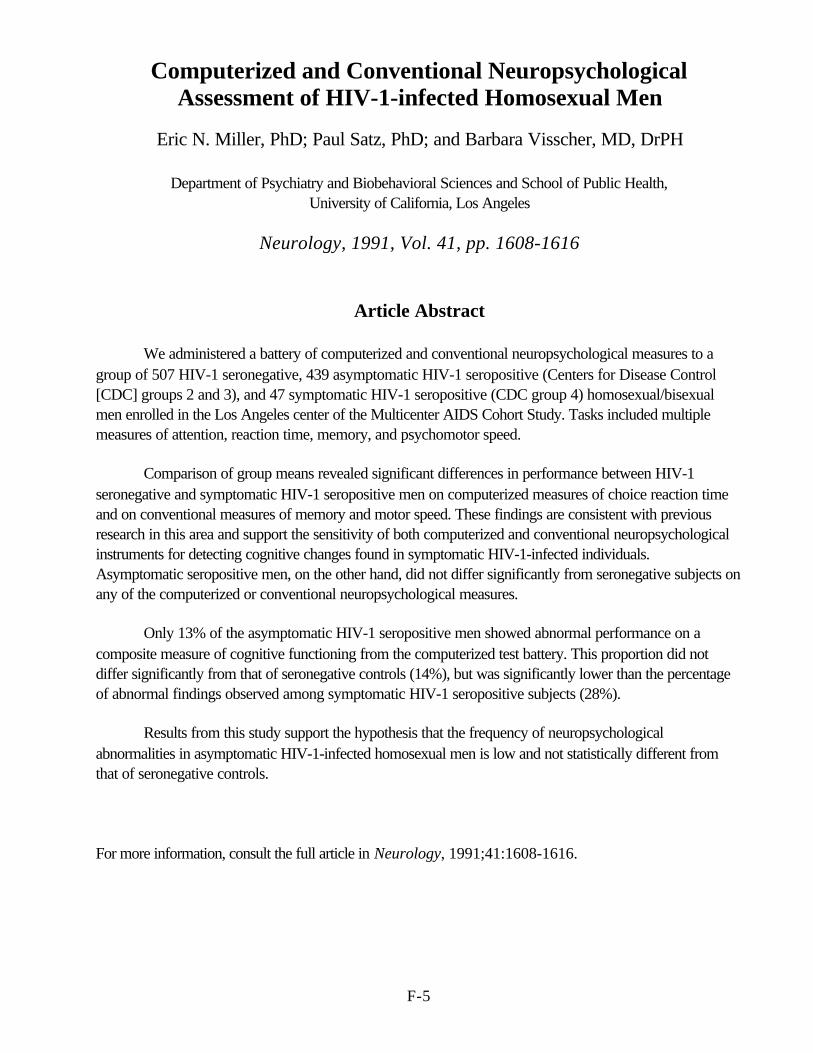
F-5
Computerized and Conventional NeuropsychologicalAssessment of HIV-1-infected Homosexual Men
Eric N. Miller, PhD; Paul Satz, PhD; and Barbara Visscher, MD, DrPH
Department of Psychiatry and Biobehavioral Sciences and School of Public Health,University of California, Los Angeles
Neurology, 1991, Vol. 41, pp. 1608-1616
Article Abstract
We administered a battery of computerized and conventional neuropsychological measures to agroup of 507 HIV-1 seronegative, 439 asymptomatic HIV-1 seropositive (Centers for Disease Control[CDC] groups 2 and 3), and 47 symptomatic HIV-1 seropositive (CDC group 4) homosexual/bisexualmen enrolled in the Los Angeles center of the Multicenter AIDS Cohort Study. Tasks included multiplemeasures of attention, reaction time, memory, and psychomotor speed.
Comparison of group means revealed significant differences in performance between HIV-1seronegative and symptomatic HIV-1 seropositive men on computerized measures of choice reaction timeand on conventional measures of memory and motor speed. These findings are consistent with previousresearch in this area and support the sensitivity of both computerized and conventional neuropsychologicalinstruments for detecting cognitive changes found in symptomatic HIV-1-infected individuals.Asymptomatic seropositive men, on the other hand, did not differ significantly from seronegative subjects onany of the computerized or conventional neuropsychological measures.
Only 13% of the asymptomatic HIV-1 seropositive men showed abnormal performance on acomposite measure of cognitive functioning from the computerized test battery. This proportion did notdiffer significantly from that of seronegative controls (14%), but was significantly lower than the percentageof abnormal findings observed among symptomatic HIV-1 seropositive subjects (28%).
Results from this study support the hypothesis that the frequency of neuropsychologicalabnormalities in asymptomatic HIV-1-infected homosexual men is low and not statistically different fromthat of seronegative controls.
For more information, consult the full article in Neurology, 1991;41:1608-1616.
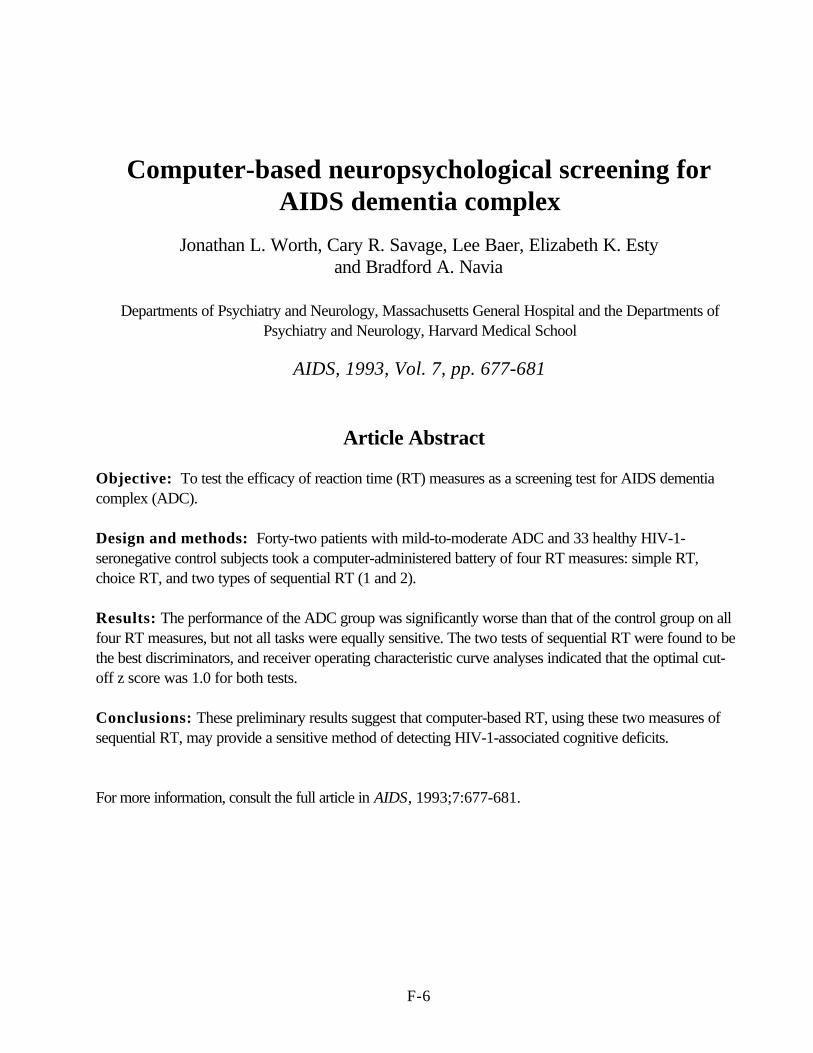
F-6
Computer-based neuropsychological screening forAIDS dementia complex
Jonathan L. Worth, Cary R. Savage, Lee Baer, Elizabeth K. Estyand Bradford A. Navia
Departments of Psychiatry and Neurology, Massachusetts General Hospital and the Departments ofPsychiatry and Neurology, Harvard Medical School
AIDS, 1993, Vol. 7, pp. 677-681
Article Abstract
Objective: To test the efficacy of reaction time (RT) measures as a screening test for AIDS dementiacomplex (ADC).
Design and methods: Forty-two patients with mild-to-moderate ADC and 33 healthy HIV-1-seronegative control subjects took a computer-administered battery of four RT measures: simple RT,choice RT, and two types of sequential RT (1 and 2).
Results: The performance of the ADC group was significantly worse than that of the control group on allfour RT measures, but not all tasks were equally sensitive. The two tests of sequential RT were found to bethe best discriminators, and receiver operating characteristic curve analyses indicated that the optimal cut-off z score was 1.0 for both tests.
Conclusions: These preliminary results suggest that computer-based RT, using these two measures ofsequential RT, may provide a sensitive method of detecting HIV-1-associated cognitive deficits.
For more information, consult the full article in AIDS, 1993;7:677-681.
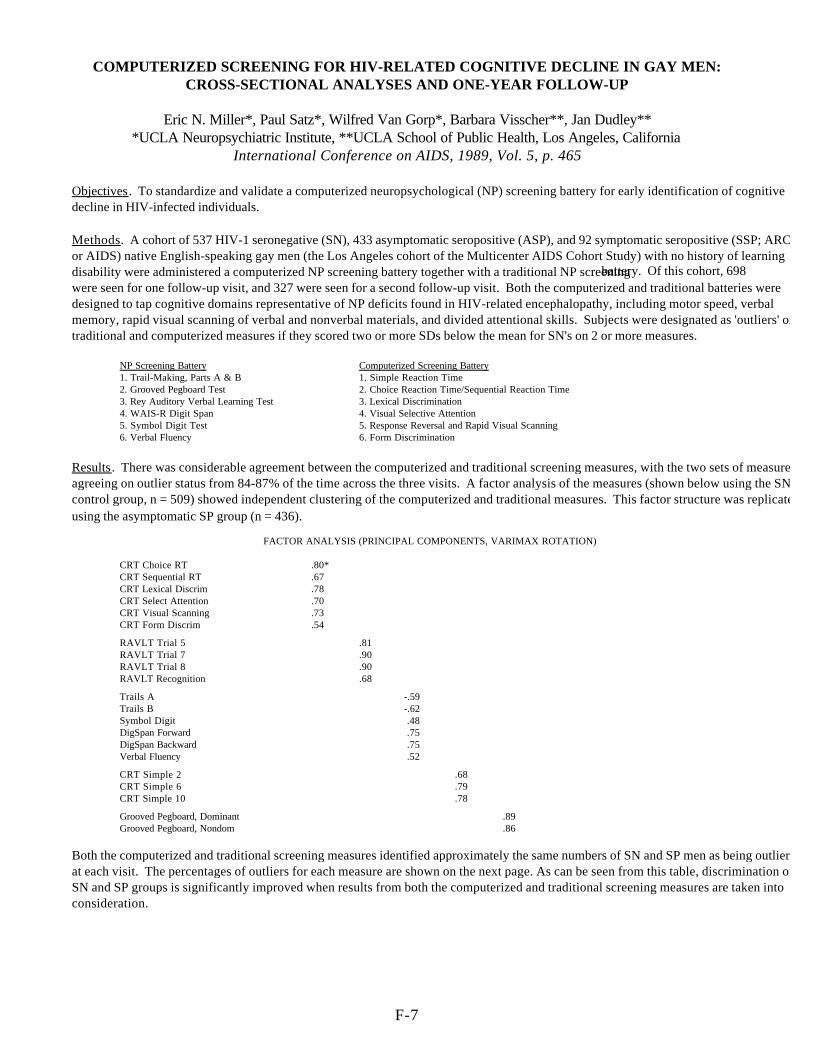
F-7
COMPUTERIZED SCREENING FOR HIV-RELATED COGNITIVE DECLINE IN GAY MEN:CROSS-SECTIONAL ANALYSES AND ONE-YEAR FOLLOW-UP
Eric N. Miller*, Paul Satz*, Wilfred Van Gorp*, Barbara Visscher**, Jan Dudley***UCLA Neuropsychiatric Institute, **UCLA School of Public Health, Los Angeles, California
International Conference on AIDS, 1989, Vol. 5, p. 465
Objectives. To standardize and validate a computerized neuropsychological (NP) screening battery for early identification of cognitivedecline in HIV-infected individuals.
Methods. A cohort of 537 HIV-1 seronegative (SN), 433 asymptomatic seropositive (ASP), and 92 symptomatic seropositive (SSP; ARCor AIDS) native English-speaking gay men (the Los Angeles cohort of the Multicenter AIDS Cohort Study) with no history of learningdisability were administered a computerized NP screening battery together with a traditional NP screening battery. Of this cohort, 698were seen for one follow-up visit, and 327 were seen for a second follow-up visit. Both the computerized and traditional batteries weredesigned to tap cognitive domains representative of NP deficits found in HIV-related encephalopathy, including motor speed, verbalmemory, rapid visual scanning of verbal and nonverbal materials, and divided attentional skills. Subjects were designated as 'outliers' on thetraditional and computerized measures if they scored two or more SDs below the mean for SN's on 2 or more measures.
NP Screening Battery Computerized Screening Battery1. Trail-Making, Parts A & B 1. Simple Reaction Time2. Grooved Pegboard Test 2. Choice Reaction Time/Sequential Reaction Time3. Rey Auditory Verbal Learning Test 3. Lexical Discrimination4. WAIS-R Digit Span 4. Visual Selective Attention5. Symbol Digit Test 5. Response Reversal and Rapid Visual Scanning6. Verbal Fluency 6. Form Discrimination
Results. There was considerable agreement between the computerized and traditional screening measures, with the two sets of measuresagreeing on outlier status from 84-87% of the time across the three visits. A factor analysis of the measures (shown below using the SNcontrol group, n = 509) showed independent clustering of the computerized and traditional measures. This factor structure was replicatedusing the asymptomatic SP group (n = 436).
FACTOR ANALYSIS (PRINCIPAL COMPONENTS, VARIMAX ROTATION)
CRT Choice RT .80*CRT Sequential RT .67CRT Lexical Discrim .78CRT Select Attention .70CRT Visual Scanning .73CRT Form Discrim .54
RAVLT Trial 5 .81RAVLT Trial 7 .90RAVLT Trial 8 .90RAVLT Recognition .68
Trails A -.59Trails B -.62Symbol Digit .48DigSpan Forward .75DigSpan Backward .75Verbal Fluency .52
CRT Simple 2 .68CRT Simple 6 .79CRT Simple 10 .78
Grooved Pegboard, Dominant .89Grooved Pegboard, Nondom .86
Both the computerized and traditional screening measures identified approximately the same numbers of SN and SP men as being outliersat each visit. The percentages of outliers for each measure are shown on the next page. As can be seen from this table, discrimination of theSN and SP groups is significantly improved when results from both the computerized and traditional screening measures are taken intoconsideration.
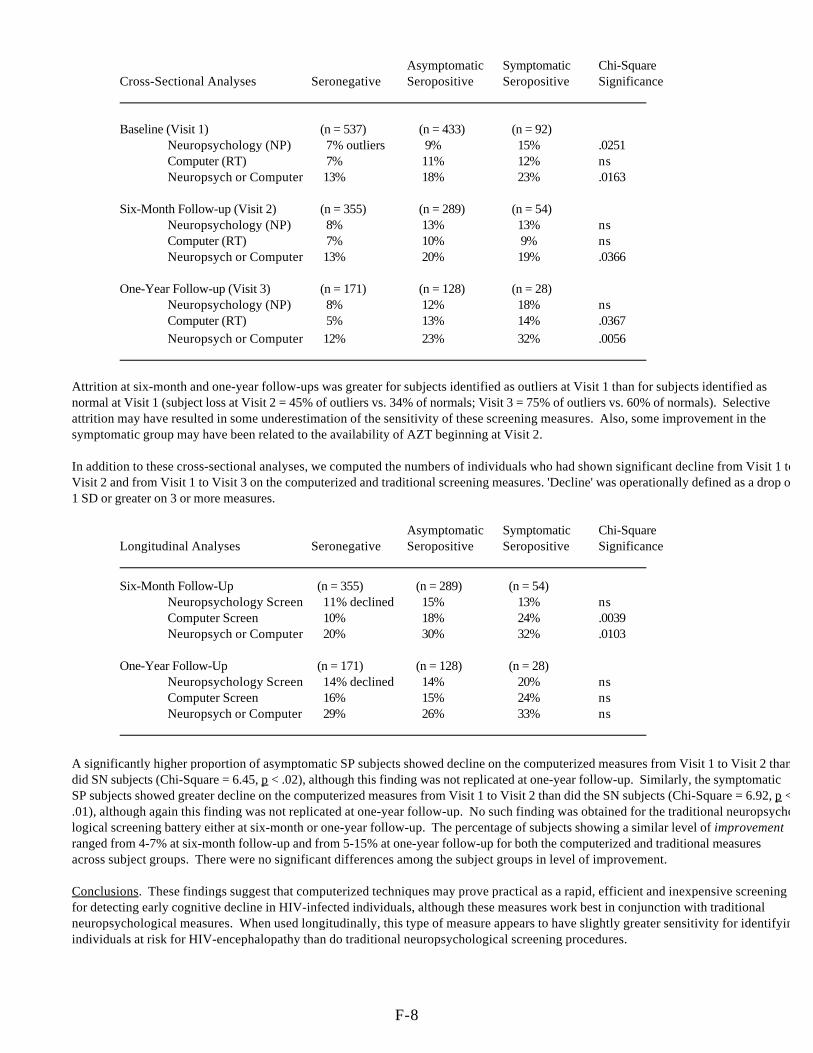
F-8
Asymptomatic Symptomatic Chi-SquareCross-Sectional Analyses Seronegative Seropositive Seropositive Significance
Baseline (Visit 1) (n = 537) (n = 433) (n = 92)Neuropsychology (NP) 7% outliers 9% 15% .0251Computer (RT) 7% 11% 12% nsNeuropsych or Computer 13% 18% 23% .0163
Six-Month Follow-up (Visit 2) (n = 355) (n = 289) (n = 54)Neuropsychology (NP) 8% 13% 13% nsComputer (RT) 7% 10% 9% nsNeuropsych or Computer 13% 20% 19% .0366
One-Year Follow-up (Visit 3) (n = 171) (n = 128) (n = 28)Neuropsychology (NP) 8% 12% 18% nsComputer (RT) 5% 13% 14% .0367Neuropsych or Computer 12% 23% 32% .0056
Attrition at six-month and one-year follow-ups was greater for subjects identified as outliers at Visit 1 than for subjects identified asnormal at Visit 1 (subject loss at Visit 2 = 45% of outliers vs. 34% of normals; Visit 3 = 75% of outliers vs. 60% of normals). Selectiveattrition may have resulted in some underestimation of the sensitivity of these screening measures. Also, some improvement in thesymptomatic group may have been related to the availability of AZT beginning at Visit 2.
In addition to these cross-sectional analyses, we computed the numbers of individuals who had shown significant decline from Visit 1 toVisit 2 and from Visit 1 to Visit 3 on the computerized and traditional screening measures. 'Decline' was operationally defined as a drop of1 SD or greater on 3 or more measures.
Asymptomatic Symptomatic Chi-SquareLongitudinal Analyses Seronegative Seropositive Seropositive Significance
Six-Month Follow-Up (n = 355) (n = 289) (n = 54)Neuropsychology Screen 11% declined 15% 13% nsComputer Screen 10% 18% 24% .0039Neuropsych or Computer 20% 30% 32% .0103
One-Year Follow-Up (n = 171) (n = 128) (n = 28)Neuropsychology Screen 14% declined 14% 20% nsComputer Screen 16% 15% 24% nsNeuropsych or Computer 29% 26% 33% ns
A significantly higher proportion of asymptomatic SP subjects showed decline on the computerized measures from Visit 1 to Visit 2 thandid SN subjects (Chi-Square = 6.45, p < .02), although this finding was not replicated at one-year follow-up. Similarly, the symptomaticSP subjects showed greater decline on the computerized measures from Visit 1 to Visit 2 than did the SN subjects (Chi-Square = 6.92, p <.01), although again this finding was not replicated at one-year follow-up. No such finding was obtained for the traditional neuropsycho-logical screening battery either at six-month or one-year follow-up. The percentage of subjects showing a similar level of improvementranged from 4-7% at six-month follow-up and from 5-15% at one-year follow-up for both the computerized and traditional measuresacross subject groups. There were no significant differences among the subject groups in level of improvement.
Conclusions. These findings suggest that computerized techniques may prove practical as a rapid, efficient and inexpensive screening toolfor detecting early cognitive decline in HIV-infected individuals, although these measures work best in conjunction with traditionalneuropsychological measures. When used longitudinally, this type of measure appears to have slightly greater sensitivity for identifyingindividuals at risk for HIV-encephalopathy than do traditional neuropsychological screening procedures.
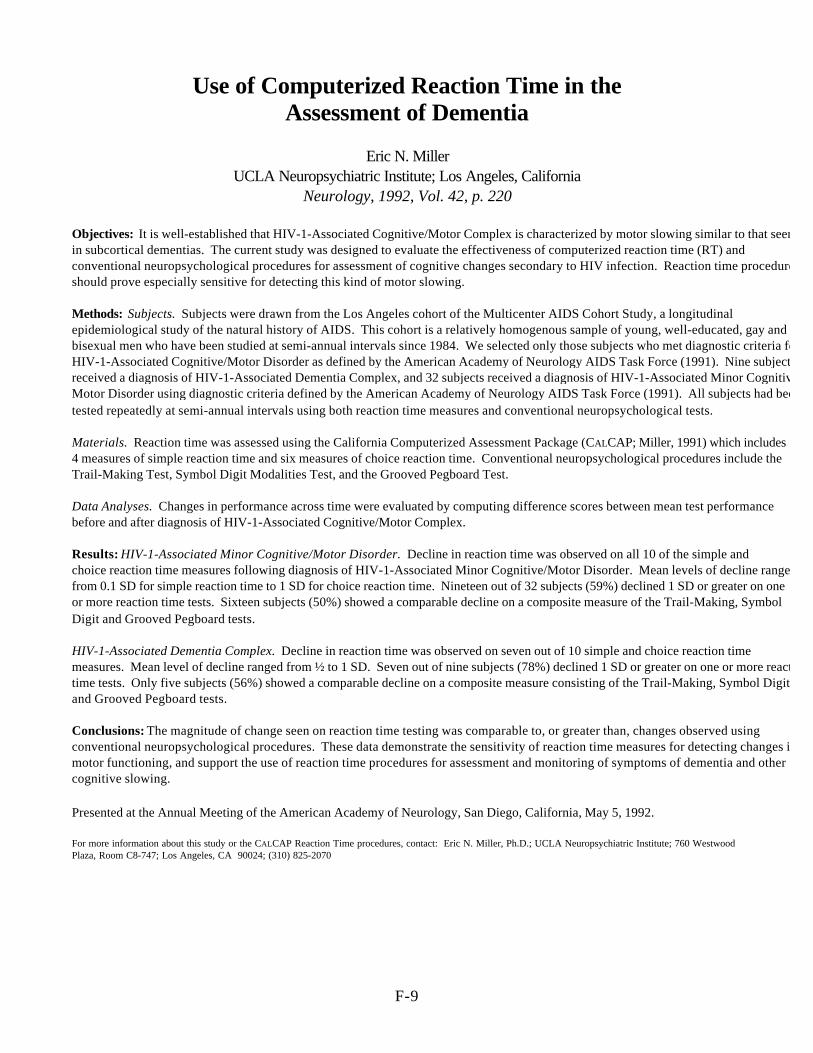
F-9
Use of Computerized Reaction Time in theAssessment of Dementia
Eric N. MillerUCLA Neuropsychiatric Institute; Los Angeles, California
Neurology, 1992, Vol. 42, p. 220
Objectives: It is well-established that HIV-1-Associated Cognitive/Motor Complex is characterized by motor slowing similar to that seenin subcortical dementias. The current study was designed to evaluate the effectiveness of computerized reaction time (RT) andconventional neuropsychological procedures for assessment of cognitive changes secondary to HIV infection. Reaction time proceduresshould prove especially sensitive for detecting this kind of motor slowing.
Methods: Subjects. Subjects were drawn from the Los Angeles cohort of the Multicenter AIDS Cohort Study, a longitudinalepidemiological study of the natural history of AIDS. This cohort is a relatively homogenous sample of young, well-educated, gay andbisexual men who have been studied at semi-annual intervals since 1984. We selected only those subjects who met diagnostic criteria forHIV-1-Associated Cognitive/Motor Disorder as defined by the American Academy of Neurology AIDS Task Force (1991). Nine subjectsreceived a diagnosis of HIV-1-Associated Dementia Complex, and 32 subjects received a diagnosis of HIV-1-Associated Minor Cognitive/Motor Disorder using diagnostic criteria defined by the American Academy of Neurology AIDS Task Force (1991). All subjects had beentested repeatedly at semi-annual intervals using both reaction time measures and conventional neuropsychological tests.
Materials. Reaction time was assessed using the California Computerized Assessment Package (CALCAP; Miller, 1991) which includes4 measures of simple reaction time and six measures of choice reaction time. Conventional neuropsychological procedures include theTrail-Making Test, Symbol Digit Modalities Test, and the Grooved Pegboard Test.
Data Analyses. Changes in performance across time were evaluated by computing difference scores between mean test performancebefore and after diagnosis of HIV-1-Associated Cognitive/Motor Complex.
Results: HIV-1-Associated Minor Cognitive/Motor Disorder. Decline in reaction time was observed on all 10 of the simple and choice reaction time measures following diagnosis of HIV-1-Associated Minor Cognitive/Motor Disorder. Mean levels of decline rangedfrom 0.1 SD for simple reaction time to 1 SD for choice reaction time. Nineteen out of 32 subjects (59%) declined 1 SD or greater on oneor more reaction time tests. Sixteen subjects (50%) showed a comparable decline on a composite measure of the Trail-Making, SymbolDigit and Grooved Pegboard tests.
HIV-1-Associated Dementia Complex. Decline in reaction time was observed on seven out of 10 simple and choice reaction timemeasures. Mean level of decline ranged from ½ to 1 SD. Seven out of nine subjects (78%) declined 1 SD or greater on one or more reactiontime tests. Only five subjects (56%) showed a comparable decline on a composite measure consisting of the Trail-Making, Symbol Digitand Grooved Pegboard tests.
Conclusions: The magnitude of change seen on reaction time testing was comparable to, or greater than, changes observed usingconventional neuropsychological procedures. These data demonstrate the sensitivity of reaction time measures for detecting changes inmotor functioning, and support the use of reaction time procedures for assessment and monitoring of symptoms of dementia and othercognitive slowing.
Presented at the Annual Meeting of the American Academy of Neurology, San Diego, California, May 5, 1992.
For more information about this study or the CALCAP Reaction Time procedures, contact: Eric N. Miller, Ph.D.; UCLA Neuropsychiatric Institute; 760 WestwoodPlaza, Room C8-747; Los Angeles, CA 90024; (310) 825-2070
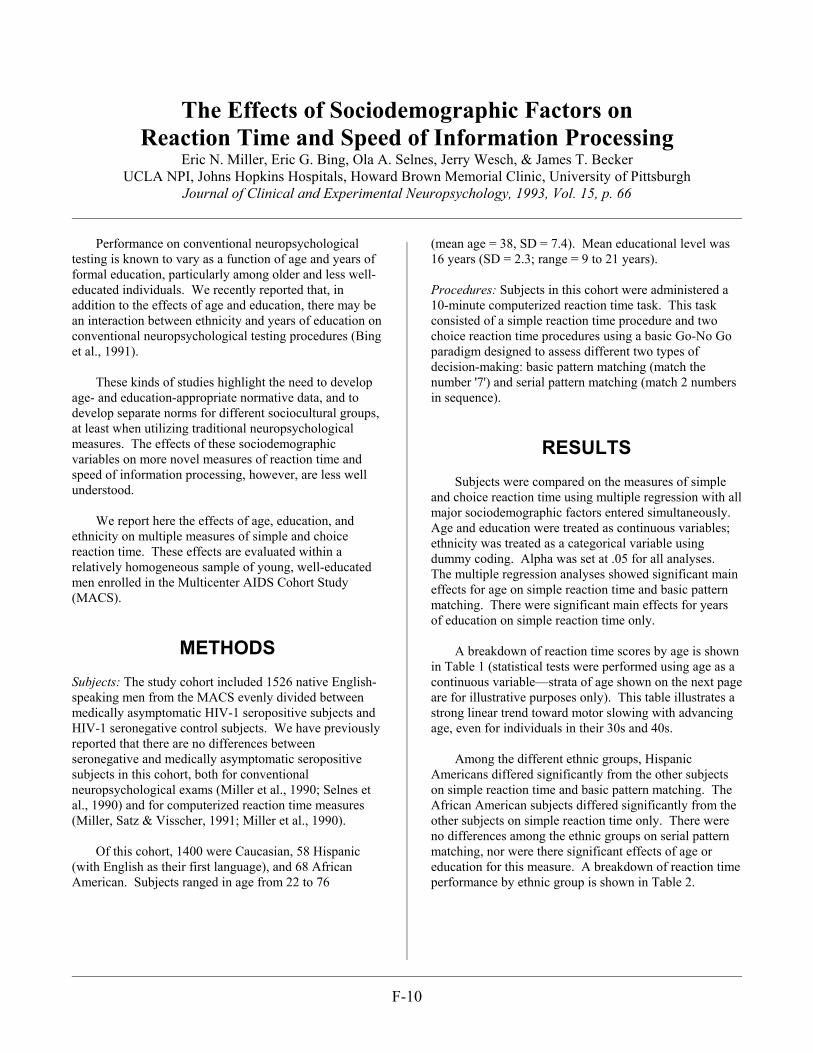
F-10
The Effects of Sociodemographic Factors onReaction Time and Speed of Information Processing
Eric N. Miller, Eric G. Bing, Ola A. Selnes, Jerry Wesch, & James T. BeckerUCLA NPI, Johns Hopkins Hospitals, Howard Brown Memorial Clinic, University of Pittsburgh
Journal of Clinical and Experimental Neuropsychology, 1993, Vol. 15, p. 66
Performance on conventional neuropsychologicaltesting is known to vary as a function of age and years offormal education, particularly among older and less well-educated individuals. We recently reported that, inaddition to the effects of age and education, there may bean interaction between ethnicity and years of education onconventional neuropsychological testing procedures (Binget al., 1991).
These kinds of studies highlight the need to developage- and education-appropriate normative data, and todevelop separate norms for different sociocultural groups,at least when utilizing traditional neuropsychologicalmeasures. The effects of these sociodemographicvariables on more novel measures of reaction time andspeed of information processing, however, are less wellunderstood.
We report here the effects of age, education, andethnicity on multiple measures of simple and choicereaction time. These effects are evaluated within arelatively homogeneous sample of young, well-educatedmen enrolled in the Multicenter AIDS Cohort Study(MACS).
METHODSSubjects: The study cohort included 1526 native English-speaking men from the MACS evenly divided betweenmedically asymptomatic HIV-1 seropositive subjects andHIV-1 seronegative control subjects. We have previouslyreported that there are no differences betweenseronegative and medically asymptomatic seropositivesubjects in this cohort, both for conventionalneuropsychological exams (Miller et al., 1990; Selnes etal., 1990) and for computerized reaction time measures(Miller, Satz & Visscher, 1991; Miller et al., 1990).
Of this cohort, 1400 were Caucasian, 58 Hispanic(with English as their first language), and 68 AfricanAmerican. Subjects ranged in age from 22 to 76
(mean age = 38, SD = 7.4). Mean educational level was16 years (SD = 2.3; range = 9 to 21 years).
Procedures: Subjects in this cohort were administered a10-minute computerized reaction time task. This taskconsisted of a simple reaction time procedure and twochoice reaction time procedures using a basic Go-No Goparadigm designed to assess different two types ofdecision-making: basic pattern matching (match thenumber '7') and serial pattern matching (match 2 numbersin sequence).
RESULTSSubjects were compared on the measures of simple
and choice reaction time using multiple regression with allmajor sociodemographic factors entered simultaneously. Age and education were treated as continuous variables;ethnicity was treated as a categorical variable usingdummy coding. Alpha was set at .05 for all analyses. The multiple regression analyses showed significant maineffects for age on simple reaction time and basic patternmatching. There were significant main effects for yearsof education on simple reaction time only.
A breakdown of reaction time scores by age is shownin Table 1 (statistical tests were performed using age as acontinuous variable––strata of age shown on the next pageare for illustrative purposes only). This table illustrates astrong linear trend toward motor slowing with advancingage, even for individuals in their 30s and 40s.
Among the different ethnic groups, HispanicAmericans differed significantly from the other subjectson simple reaction time and basic pattern matching. TheAfrican American subjects differed significantly from theother subjects on simple reaction time only. There wereno differences among the ethnic groups on serial patternmatching, nor were there significant effects of age oreducation for this measure. A breakdown of reaction timeperformance by ethnic group is shown in Table 2.
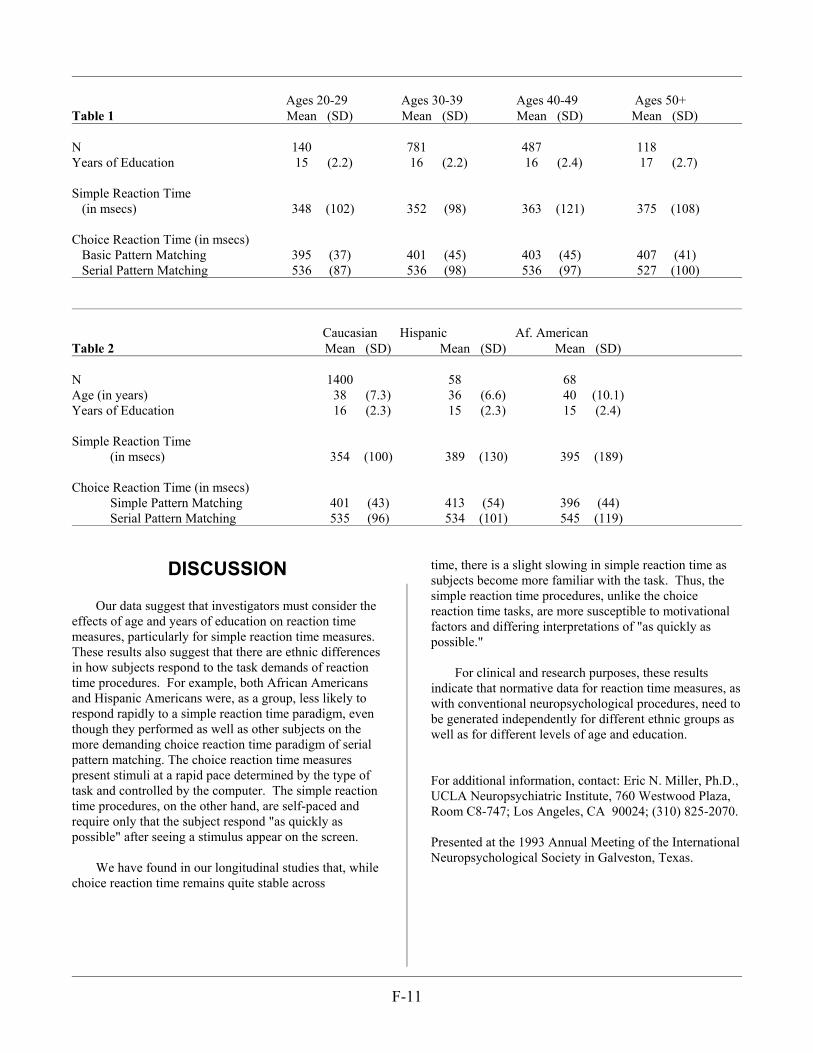
F-11
Ages 20-29 Ages 30-39 Ages 40-49 Ages 50+Table 1 Mean (SD) Mean (SD) Mean (SD) Mean (SD)
N 140 781 487 118Years of Education 15 (2.2) 16 (2.2) 16 (2.4) 17 (2.7)
Simple Reaction Time (in msecs) 348 (102) 352 (98) 363 (121) 375 (108)
Choice Reaction Time (in msecs) Basic Pattern Matching 395 (37) 401 (45) 403 (45) 407 (41) Serial Pattern Matching 536 (87) 536 (98) 536 (97) 527 (100)
Caucasian Hispanic Af. AmericanTable 2 Mean (SD) Mean (SD) Mean (SD)
N 1400 58 68Age (in years) 38 (7.3) 36 (6.6) 40 (10.1)Years of Education 16 (2.3) 15 (2.3) 15 (2.4)
Simple Reaction Time (in msecs) 354 (100) 389 (130) 395 (189)
Choice Reaction Time (in msecs)Simple Pattern Matching 401 (43) 413 (54) 396 (44)Serial Pattern Matching 535 (96) 534 (101) 545 (119)
DISCUSSION
Our data suggest that investigators must consider theeffects of age and years of education on reaction timemeasures, particularly for simple reaction time measures. These results also suggest that there are ethnic differencesin how subjects respond to the task demands of reactiontime procedures. For example, both African Americansand Hispanic Americans were, as a group, less likely torespond rapidly to a simple reaction time paradigm, eventhough they performed as well as other subjects on themore demanding choice reaction time paradigm of serialpattern matching. The choice reaction time measurespresent stimuli at a rapid pace determined by the type oftask and controlled by the computer. The simple reactiontime procedures, on the other hand, are self-paced andrequire only that the subject respond "as quickly aspossible" after seeing a stimulus appear on the screen.
We have found in our longitudinal studies that, whilechoice reaction time remains quite stable across
time, there is a slight slowing in simple reaction time assubjects become more familiar with the task. Thus, thesimple reaction time procedures, unlike the choicereaction time tasks, are more susceptible to motivationalfactors and differing interpretations of "as quickly aspossible."
For clinical and research purposes, these resultsindicate that normative data for reaction time measures, aswith conventional neuropsychological procedures, need tobe generated independently for different ethnic groups aswell as for different levels of age and education.
For additional information, contact: Eric N. Miller, Ph.D.,UCLA Neuropsychiatric Institute, 760 Westwood Plaza,Room C8-747; Los Angeles, CA 90024; (310) 825-2070.
Presented at the 1993 Annual Meeting of the InternationalNeuropsychological Society in Galveston, Texas.
F-12
Cognitive Testing Using Reaction Timeand Traditional Neuropsychological Procedures
Eric N. MillerUCLA Neuropsychiatric Institute
Journal of the International Neuropsychological Society, 1995; Volume 1, p. 393
Overview: Reaction time (RT) measures often are viewed as more sensitive than traditional neuropsychological tests forstudying the subtle kinds of cognitive changes that may occur in the early stages of many kinds of brain disease. We havestudied the relative usefulness of two neuropsychological screening batteries –– one consisting of traditionalneuropsychological procedures and one consisting of multiple measures of simple and choice RT.
Methods: Subjects were 1034 native English-speaking men evenly divided between medically asymptomatic HIV-1seropositive subjects and HIV-1 seronegative controls. All subjects were drawn from the Los Angeles cohort of theMulticenter AIDS Cohort Study, a longitudinal epidemiological study of the natural history of HIV infection. This cohort is arelatively homogenous sample of well-educated, gay and bisexual men who have been tested at semi-annual intervals usingboth RT tasks and traditional neuropsychological tests. RT was assessed using the California Computerized AssessmentPackage (CALCAP; Miller, 1991) which includes 4 measures of simple RT and six measures of choice RT (Go-No Go;Lexical Discrimination; Sequential Memory; Visual Distraction; Response Reversal; Form Discrimination). Traditionalneuropsychological procedures included the Trail-Making Test, Rey Auditory Verbal Learning Test, Symbol Digit ModalitiesTest, Digit Span, Verbal Fluency, and the Grooved Pegboard Test. The RT procedures were evaluated for internal consistencyreliability, test-retest reliability, and concurrent validity. The relationship between the traditional and computerizedprocedures was evaluated using factor analysis.
Results: The simple RT measures showed high internal consistency reliability (coefficient alpha = .77-.95), but low 6-monthtest-retest reliability (.20-.29), suggesting that the psychomotor skills measured by this task are assessed in a uniform manneracross the multiple trials of each individual task, but that these skills vary considerably depending on state variables such asmood, attention, fatigue, etc. By contrast, the choice RT measures showed excellent internal consistency reliability (.81-.96)and 6-month test-retest reliability (.43-.68) that was comparable to that seen using the traditional neuropsychologicalmeasures (.47-.77).
A factor analysis of the RT and traditional NP tasks was performed and showed that the tasks measure 3 primary factors fromthe traditional neuropsychological testing (brief memory and attention; manual dexterity and motor speed; verbal learning andmemory) and 2 factors from the RT testing (separate factors for simple and choice RT). These findings suggest that the RTtasks measure skills that are different from those assessed using traditional neuropsychological procedures. Despite thisfinding, the RT tasks and the traditional procedures showed considerable overlap in classification of outlier status. Subjectswere designated as <outliers’ if they scored 2 SDs below the mean on two or more measures, or if they scored 3 SDs belowthe mean on any one measure. Using these criteria, the RT and the traditional measures agreed on outlier status 85% of thetime. 51% of individuals identified as outliers on the RT tasks and 50% of individuals identified as outliers on the traditionalneuropsychological tests were identified as having abnormal clinical neuropsychological or neurological exams on follow-up.
There were 41 individuals with multiple neuropsychological testing who developed HIV-associated Cognitive MotorDisorder. For these individuals, the magnitude of change seen on RT testing was comparable to, or greater than, changesobserved using traditional neuropsychological procedures.
Conclusions: These findings show that simple and choice RT tasks measure at least two domains of cognitive functioningthat are relatively independent of the psychomotor skills assessed by traditional neuropsychological tests. When properlydeveloped and administered, RT tasks have psychometric properties that are comparable to those found in traditionalneuropsychological procedures. RT measures are best seen as complementing, rather than replacing, traditionalneuropsychological procedures.
F-13
The Use of Computer-Based Measures of Complex Reaction Time inDepressed HIV-1 Infected Patients
M Halman, NM Hamburg; CR Savage, JL WorthMassachusetts General Hospital
Psychosomatics, 1995; Volume 36, page 175
Objective: Computer-based measures of reaction time provide a sensitive screening method forHIV-1-associated cognitive deficits. As major depression is frequent in the course of HIVdisease and also thought to confound certain cognitive measures, we sought to evaluate thechange in performance on a cognitive screening test in HIV-1 infected patients treated for majordepression.
Method: All patients completed a Beck Depression Inventory (BDI), a computer-based measureof sequential reaction time (SQRT2) and a semi-structured psychiatric examination, and metDSM-III-R criteria for major depressive episode. Patients were treated and reevaluated at sixmonth follow-up with a repeat BDI and SQRT2. At follow-up, patients were classified into twogroups based on treatment response: 1) responders as defined by BDI < 14 or decreased by50%; and 2) non-responders. The two groups were matched on age, education, CD4+lymphocyte count and initial BDI score.
Results: Twenty-one depressed HIV-1 infected patients were examined. Ten were classified asresponders and eleven as non-responders. On initial SQRT2, non-responders showed a trendtoward slower performance (SD), 706.00 (70.96) vs. 638.80 (92.22) msec (t=1.882, df=19,p=.075), as compared to responders. Responders showed no significant change on their follow-up SQRT2 time (+7.300 msec); (p=.83), whereas non-responders showed a significant slowing inperformance (-50.727 msec); (t=-2.514, df=10, p=.03). Pearson correlations between BDI andSQRT2 at both initial and follow-up times showed no significant correlations for both groups.
Conclusions: Although clinical lore suggests that major depression should be treated beforeperforming cognitive testing on an HIV-1 infected patient, this study's findings suggest thatsuccessful treatment of major depression does not result in significant changes in cognitiveperformance on a complex reaction time measure known to be sensitive to HIV-1-associatedcognitive deficits. Impairment on SQRT2 may also predict poor outcome in depressed patients,possibly by identifying the presence of significant cognitive deficits at the initial evaluation.
For more information, contact: Mark H. Halman, MD, FRCP(C); Massachusetts General Hospital -ACC 812; Boston, MA 02114.
F-14
Cognitive Performance during Long-TermRespirator Wear While at Rest
Caretti DMAmerican Industrial Hygiene Association Journal, 1997:58:105-109
Article Abstract
Cognitive performance was studied in six male and three female subjects exposed to two randomlyadministered 10-hour measurement periods, a control condition without a respirator, and a respirator wear trialrequiring continuous wear, under nonexercise conditions. Reaction time and decision-making speed wereassessed using a series of simple and choice reaction time tasks at the start of each test iteration and after hours2, 4, 6, 8 and 10 of testing. Subject anxiety levels were assessed along with reaction time measures. Visualtracking ability was measured after each hour of testing. Reaction time and decision-making speed did not differsignificantly between control and respirator conditions at any time throughout the 10 hours of testing. Femalevolunteers exhibited significantly faster reaction times and decision-making speeds than males independent ofrespirator wear conditions and time of measurement. Subject anxiety increased significantly from initialmeasurements after 8 hours of testing for each condition, but no differences were observed between conditionsat any time. Respirator wear did not detrimentally influence visual tracking ability. These findings suggest thatrespirator wear over a relatively long time period under nonexercise conditions should not significantly inhibitcognitive function.
F-15
Neuropsychological Function in Patients with IncreasedSerum Levels of Protein S-100 After Minor Head Injury
K Waterloo, T Ingebrigtsen, B RomnerActa Neurochirurgica, 1997; Volume 139: 26-32
Article Abstract
Protein S-100 is a calcium binding protein, synthesized in astroglial cells in all parts of the centralnervous system (CNS). We have previously reported high serum levels of protein S-100 inpatients after minor head injury (MHI). A battery of conventional and computerizedneuropsychological measures was administered to two groups of MHI patients.Neuropsychological outcome at 12 months postinjury was examined in a group of 7 patients withincreased serum levels of protein S-100 after MHI and 7 age- and sex-matched controls withoutdetectable S-100 in serum after MHI. Our results demonstrate no overall cognitive dysfunction ineither of the two groups. Our findings indicate specific dysfunction on measures of reaction time,attention and speed of information processing for the S-100 group. Posttraumatic depressiondoes not explain the neuropsychological differences between the groups. These findings supportthat increased serum levels of protein S-100 may be of predictive and prognostic value forlonglasting neurocognitive abnormalities after minor head injury. Presence of S-100 in serum mayindicate the presence of diffuse brain damage. Our results suggest that information processingmeasures in computerized neuropsychological assessment are more sensitive for detecting smallsigns of neurocognitive abnormalities after MHI than conventional test batteries.
F-16
Neuropsychological Performance and HIV-1 in EthnicMinority Samples of Women and Men:
Serostatus Effects, Comparative Data and Methodological Considerations
Durvasula, R.S., Miller, E.N., Myers, H.M, Satz, P., & Wyatt, G.
Background and Rationale: As rates of HIV and AIDS continue to rise among women and ethnic minoritygroup members, larger scale cross-sectional and longitudinal studies of neuropsychological (NP) performanceamong HIV-positive individuals from these understudied groups are needed. To date, much of the work assessingNP function in these groups has focused largely on cohorts of injection drug users (IDUs), a subgroup ofindividuals not representative of the majority of HIV infected men and women from ethnic minority groups.
Samples: The present data are derived from two separate studies on the psychosocial, medical, and NP sequelaeof HIV infection: (a) the UCLA/Drew Women and Family Project, a longitudinal study of a multiethnic sample of400 women and (b) the African American Health Project, a cross-sectional study of 502 African American men. Both studies were conducted in Los Angeles County, and the samples are comprised of HIV + and HIV -individuals at varying stages of infection, with a range of substance abuse histories.
Results: Preliminary analysis of baseline data from the women’s samples (N=190) reveal a trend towardslower motor speed among HIV positive women as assessed by both the Grooved Pegboard (F (2,163) = 2.7; p <.07) and the Finger Tapping Test (F(2,111) = 5.2 p < .007), controlling for age, education, and recent drugexposure. In contrast, analysis of performance by a subsample of HIV + and HIV - African American menfrom the AAHP (N=237) on the Grooved Pegboard revealed no differences as a function of HIV serostatus. While women did not evidence any HIV serostatus differences on measures of reaction time (as assessed by theCalifornia Computerized Assessment Package (CalCAP), multivariate analysis revealed HIV serostatus effectsfor men on this test, with symptomatic seropositive men evidencing significantly poorer performance thanasymptomatic seropositive men (F (2,214) = 2.26, p < .04), with significant univariate effects for SequentialReaction Time I (F (2,214) = 4.63, p < .01) and Sequential Reaction Time II (F (2,214) = 5.48, p < .005). Bothwomen and men were administered the WHO-Auditory Verbal Learning Test, a supraspan list learning testsimilar to the RAVLT and CVLT, and neither group evidenced differences as a function of HIV serostatus onthis test. These findings are consistent with the primary deficit in psychomotor functioning captured by studiesconducted with both IDUs and cohorts of White men, but, as has been seen in other studies, the specificmeasures that are most sensitive vary across different study samples, gender, and ethnic groups.
Conclusions: While both men and women evidence differences as a function of serostatus, the domains inwhich differences are observed vary across these two samples. While differences in education or otherdemographics may partially account for the dissociation between the men’s and women’s samples, other issues,including the differential contribution of substance use will be addressed. These discrepant findings highlight theimportance of circumspection when generating conclusions from studies examining multiethnic samples or anyother groups for whom appropriate culture fair tests or normative data are not available. Comprehensivecharacterization of samples, as well as careful assessment and quantification of psychosocial and demographicdata are essential for accurate interpretation of findings obtained from any studies of the NP sequelae of HIV inunderstudied groups. Implementation of these issues into study design and execution will be discussed with afocus on methods of assessing sociodemographic factors, selection of culture-fair tests and recruitment andretention of ethnic minority samples, particularly women.
Presented at the Annual Meeting of the International Neuropsychological Society, Honolulu, Feb, 1998