Embed Size (px)
Citation preview
21
Thorndike, Thurstone, and Rasch:A Comparison of Their Methods of ScalingPsychological and Educational TestsGeorge Engelhard, Jr.University of Chicago and Chicago State University
The purpose of this study is to describe and com-pare the methods used by Thorndike, Thurstone, andRasch for calibrating test items. Thorndike and Thur-stone represent a traditional psychometric approach tothis problem, whereas Rasch represents a more mod-em conceptualization derived from latent trait theory.These three major theorists in psychological and edu-cational measurement were concerned with a commonset of issues that seem to recur in a cyclical manner inpsychometric theory. One such issue involves the in-variance of item parameters. Each recognized the im-portance of eliminating the effects of an arbitrary sam-ple in the estimation of item parameters. The differ-ences generally arise from the specific methods chosento deal with the problem. Thorndike attempted tosolve the problem of item invariance by adjusting formean differences in ability distributions. Thurstone ex-tended Thorndike’s work by proposing two adjust-ments which included an adjustment for differences inthe dispersions of ability in addition to Thomdike’sadjustment for mean differences. Rasch’s method im-plies a third adjustment, which involves the additionof a response model for each person in the sample.Data taken from Trabue (1916) are used to illustrateand compare how Thomdike, Thurstone, and Raschwould approach a common problem, namely, the cali-bration of a single set of items administered to severalgroups.
Many great advances have been made in psy-chological and educational measurement within the
last 20 years. Technological advances in psycho-metrics have made practicable many innovationsthat were only dreamed about in the early part ofthis century. Many of these recent advances in testtheory and methods are described in Weiss andDavison (1981).
Although psychometricians are constantly in-
venting new methods, many of the actual problemsand issues that are being addressed have not changedsignificantly since they were initially posed. In fact,many of the current solutions were adumbrated bymajor theorists such as Thomdike and Thurstone.An important example is the problem of item in-variance.
The general problem of invariance has been suc-cinctly stated by Wright (1968) in terms of the
conditions necessary for ooiective measurement.Two of the conditions that are necessary for ob-
jective measurement are as follows:First, the calibration of measuring instrumentsmust be independent of those objects that hap-pen to be used for calibration. Second, themeasurement of objects must be independentof the instrument that happens to be used forthe measuring. (Wright, 1968, p. 87)
The importance of meeting these conditions, whichcan result in ir~~ariance9 has emerged repeatedly inthe history of psychological and educational mea-surement. The principle of invariance can be con-sidered an essential attribute of any objective scal-ing method (Jones, 1960). This article is primarily
Downloaded from the Digital Conservancy at the University of Minnesota, http://purl.umn.edu/93227. May be reproduced with no cost by students and faculty for academic use. Non-academic reproduction
requires payment of royalties through the Copyright Clearance Center, http://www.copyright.com/
22
concerned with the first condition for item invari-ance and with the methods used by T’horndikc9Thurstone, and Rasch for meeting this condition.
Andrich (1978) has shown how Thurstone (1927a)approached the problem of invariance within thecontext of attitude measurement using his pairedcomparison method. He has shown how Thurstone’s spaired comparison method eliminates the sampleeffect e~perir~e~tally9 whereas Rasch’s simple lo-gistic model eliminates the sample effect statisti-cally. The present paper extends Andrich’s (1978)work by comparing how Thurstone and Rasch wouldapproach a direct response design for the mea-surement of person abilities rather than attitudes.
Thurstone (1927b) believed that his method ofabsolute scaling met the conditions necessary forthe invariance of item parameters in different groups.Thurstone illustrated his solution by reanalyzing aset of data that had been studied by Trabue (1916)using Thomdike’s (1919) scaling method. Thur-stone (1927b) criticizcd ’~hor~dikc’s method ofscaling because it did &dquo;not possess the one re-
quirement of a unit of measurement, namely con-stancy ... [the item difficulty scale] fluctuatesfrom one age to another&dquo; (p. 505). ’~’hurstone’s
concept of constancy is his version of an invariancecondition and is an explicit characteristic of mea-surement situations that yield objective measure-ment. Thomdike’s scale values fluctuate becausethe item scale values are not sample free, whichviolated ’~h~rstonc’s (192~) insight that the 6 ‘scalevalue of an item should be the same no matter
which age group is used&dquo; (p. 119).Although Thurstone recognized the importance
of a sample-free method of item calibration thatwould provide invariant item parameters, his ap-proach did not provide the final solution to theproblem. Loevinger (1947) pointed out very clearlythat the &dquo;subject of scaling is far from closed&dquo; (p.43). Almost 20 years later she acknowledged thatRasch had made a major contribution to the solu-tion of two major psychometric problems that cor-respond to the conditions specified by Wright (1968)for objective measurement, namely, 6‘the abilityassigned to an individual is independent of that ofother members of the group and of the particular
items with which he is tested; similarly for the itemdifficulty&dquo; (Loevinger, 1965, p. 151).The purpose of this paper is to describe and to
compare the methods used by three major mea-surement theorists to calibrate test items. Thom-
dike and Thurstone represent a traditional approachto this problem, whereas Rasch will be used torepresent a more modem conceptualization derivedfrom latent trait theory, or item response theory, 9as it has been called more recently (Lord, 1980).Their common concern with the elimination of ar-
bitrary sample effects in the calibration of itemsserves to unite their contributions to psychologicaland educational measurement, as well as to high-light progress made towards the attainment of iteminvariance.
of the Three Methods
Thorndike’s scaling methods, Thursione ’ meth-ods of absolute scaling, and Rasch’s method ofcalibrating test items are described in this section.These results will then be used in the next section
to highlight the similarities and differences amongthe three methods. The development of Thorn-dike’s scaling method historically precedes the de-velopment of Thurstone &dquo;s method of absolute scal-ing ; however, Thurstone’s methods will be de-
scribed first, because ‘Th®rr~dike~s methods can be
easily derived from it.
Thurstone’s Method of Absolute Scaling
The idea and motivation for developing a sewmethod of item scaling occurred to Thurstone (1925)while he w~s ’trying to tease out the logic of somewell-known educational scales and mental agescales&dquo; (p. 433) and was finding to his dissatis-faction that the &dquo;authors of educational scale mon-
ographs seldom gave an adequate discussion of theassumptions and logic of their scale constructions&dquo;(p. 433).m order to remedy this situation, Thurstone (1925, 9
1927b, 1928b) set out his ideas about item scalingin a series of major articles in the 1920s. In thesearticles Thurstone derived and applied his methodof absolute scaling. In his words,
Downloaded from the Digital Conservancy at the University of Minnesota, http://purl.umn.edu/93227. May be reproduced with no cost by students and faculty for academic use. Non-academic reproduction
requires payment of royalties through the Copyright Clearance Center, http://www.copyright.com/
23
It is called an absolute scaling method becauseit is independent of the scoring unit repre-sented by the raw scores. The unit of mea-surement is the standard deviation of test abil-
ity in any given age group. This distributionis assumed, as usual, to be normal and thebase line is an abstract scale of test abilityindependent of the raw scoring unit. (Thur-stone, 1928b, p. 441)
As a first step, Thurstone assumed a normal dis-tribution of ability for any given group on the latenttrait being measured. He next assumed that itemscould be constructed and used to define points onthis scale that would define the latent trait. The
location of the item was defined by the percentageof correct responses to the item for a specifiedgroup. The next step was to define a numericalvalue for each group with the standard deviation
as the unit of measurement and the proportion ofcorrect responses to each item within a group trans-
formed to standard normal deviates. These standardnormal deviates were called sigma values by Thur-stone.
Once the items had been assigned a numericalvalue, Thurstone recognized that some adjustmentmust be made in order to locate each separate groupwith its own ability distribution on the latent trait
scale. Thurstone recognized that the location of theitem on the latent trait scale must be independentof the group used to calibrate the item.
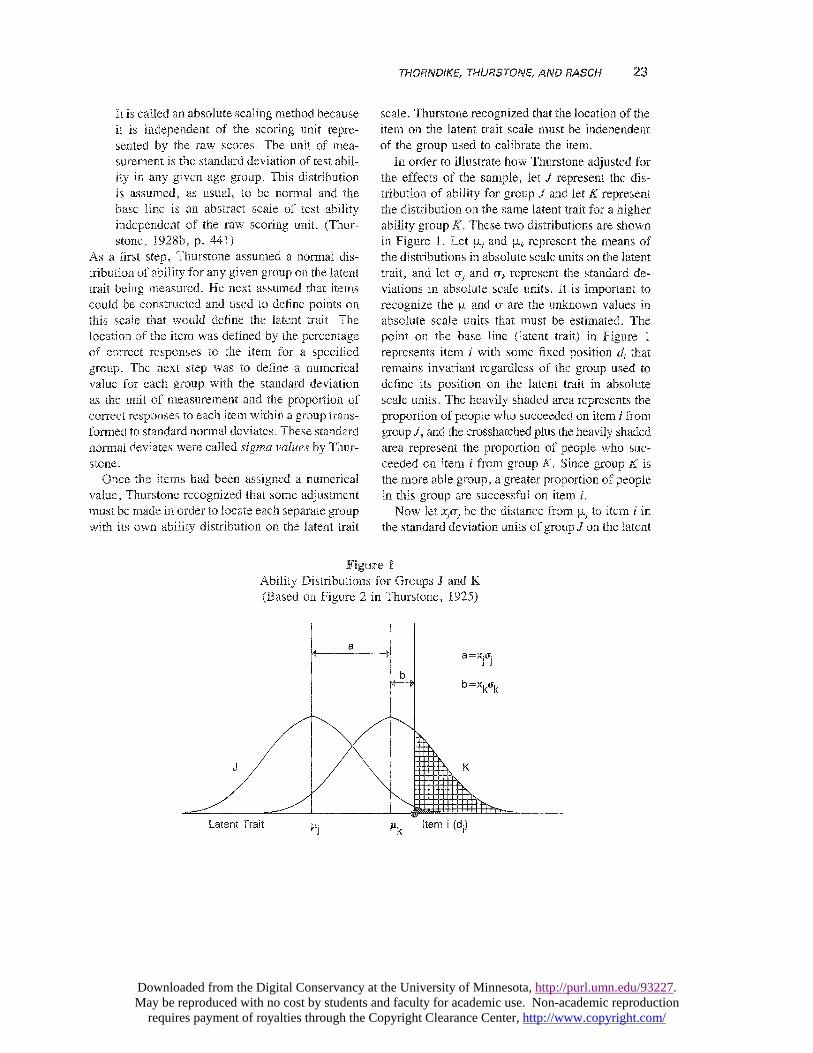
In order to illustrate how Thurstone adjusted forthe effects of the sample, let J represent the dis-tribution of ability for group J and let K representthe distribution on the same latent trait for a higherability group I~. These two distributions are shownin Figure 1. Let !-Lj and pu, represent the means ofthe distributions in absolute scale units on the latent
trait, and let ay and 0’ represent the standard de-viations in absolute scale units. It is important torecognize the R and a are the unknown values inabsolute scale units that must be estimated. The
point on the base line (latent trait) in Figure 1
represents item i with some fixed position di thatremains invariant regardless of the group used todefine its position on the latent trait in absolutescale units. The heavily shaded area represents theproportion of people who succeeded on item i fromgroup J, and the crosshatched plus the heavily shadedarea represent the proportion of people who suc-ceeded on item from group ~. Since group isthe more able group, a greater proportion of peoplein this group are successful on item i.
Now let x~~-~ be the distance from Rj to item a inthe standard deviation units of group J on the latent
Figure 1Ability Distributions for Groups J and K(Based on Figure 2 in Thurstone, 1925)
Downloaded from the Digital Conservancy at the University of Minnesota, http://purl.umn.edu/93227. May be reproduced with no cost by students and faculty for academic use. Non-academic reproduction
requires payment of royalties through the Copyright Clearance Center, http://www.copyright.com/
24
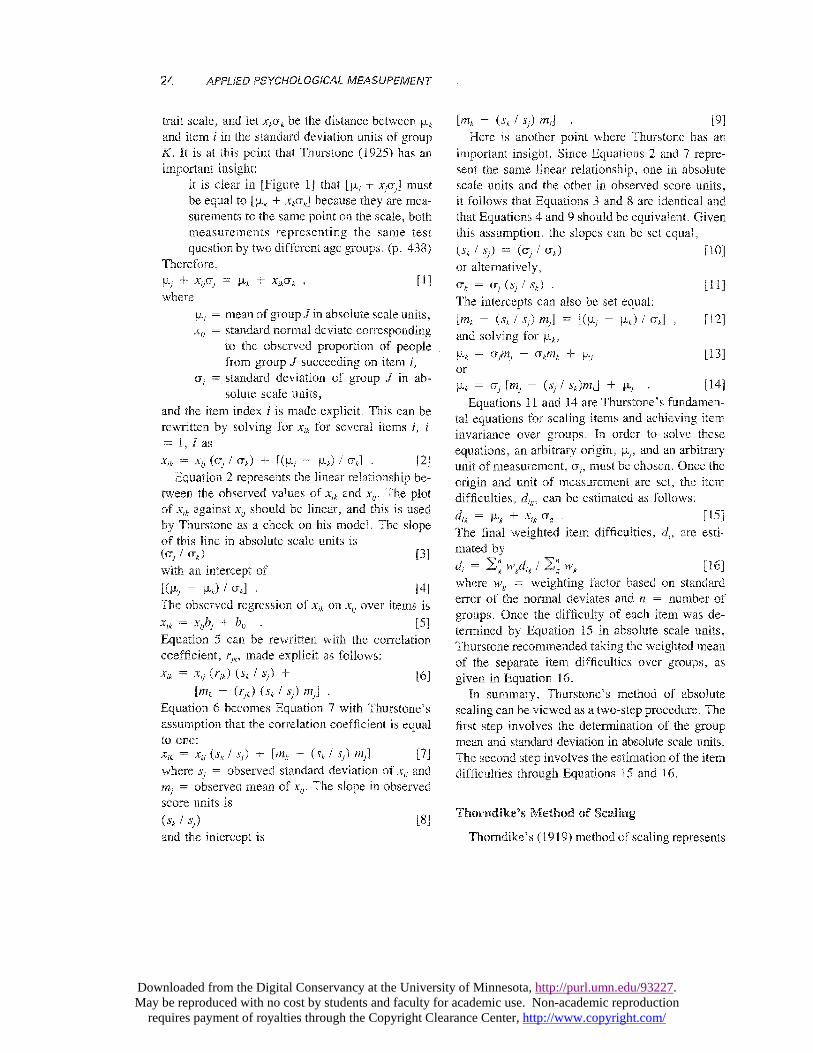
trait scale, and let ~cr~. be the distance between ~,kand item i in the standard deviation units of groupK. It is at this point that Thurstone (1925) has animportant insight:
it is clear in [Figure 1] that [VLj + xjcrj] mustbe equal to [VL, + x,cr,] because they are mea-surements to the same point on the scale, bothmeasurements representing the same testquestion by two different age groups. (p. 438)
Therefore,
where
p,, = mean of group J in absolute scale units, 9xij
= standard normal deviate correspondingto the observed proportion of peoplefrom group J succeeding on item i,
(T == standard deviation of group J in ab-solute scale units,
and the item index i is made explicit. This can berewritten by solving for xi, for several items i, i
Equation 2 represents the linear relationship be-tween the observed values of ~ and xij. The plotof xi, against xii should be linear, and this is usedby Thurstone as a check on his model. The slopeof this line in absolute scale units is(o, / Crk) [3]with an intercept of
The observed regression of Xik on Xu over items is
Equation 5 can be rewritten with the correlationcoefficient, rj,, made explicit as follows:
Equation 6 becomes Equation 7 with Thurstone’s sassumption that the correlation coefficient is equalto one: e
where 5j = observed standard deviation of xij andmj = observed mean of x~~e The slope in observedscore units is
~.sk ~ ~;) [8]and the intercept is
Here is another point where Thurstone has animportant insight. Since Equations 2 and 7 repre-sent the same linear relationship, one in absolutescale units and the other in observed score units,it follows that Equations 3 and 8 are identical andthat Equations 4 and 9 should be equivalent. Giventhis assumption, the slopes can be set equal,
or altematively,
The intercepts can also be set equal:IMI - (Sk s) mJ = ~l~’j ~) / (3.kl , l 12jand solving for ~k9
Equations 11 and 14 are Thurstone’s fundamen-tal equations for scaling items and achieving iteminvariance over groups. In order to solve these
equations, an arbitrary origin, ~a,~, and an arbitraryunit of measurement, ~~9 must be chosen. Once the
origin and unit of measurement are set, the itemdifficulties, dig, can be estimated as follows:
The final weighted item difficulties, di, are esti-
mated by -
where w~ = weighting factor based on standarderror of the normal deviates and n = number of
groups. Once the difficulty of each item was de-termined by Equation 15 in absolute scale units,Thurstone recommended taking the weighted meanof the separate item difficulties over groups, as
given in Equation 16.In summary, Thurstone’s method of absolute
scaling can be viewed as a two-step procedure. Thefirst step involves the determination of the groupmean and standard deviation in absolute scale units.
The second step involves the estimation of the itemdifficulties through Equations 15 and 16.
Thorndike’s Method of Scaling
Thomdike,’ (1919) method of scaling represents
Downloaded from the Digital Conservancy at the University of Minnesota, http://purl.umn.edu/93227. May be reproduced with no cost by students and faculty for academic use. Non-academic reproduction
requires payment of royalties through the Copyright Clearance Center, http://www.copyright.com/
25
an early attempt to transform scores on items, in-dividuals, or &dquo;any series of facts ranked for theiramounts on any traits’° (p. 109) into measure-
ments. It is important, not only as a historical land-mark in mental measurement, but also as a tech-
nique which Thurstone (1927b) used as an alter-native scaling method in order to document thesuperiority of his absolute scaling method. It is
important to note that Thorndike used several meth-ods of scaling at various points in his life. The
method that is described in this section is the one
used by Trabue (1916).One of Thorndike’ major contributions was his
proposal for transmuting scores into measures onthe basis of an assumed distribution (Thomdike,1922). Once the general form of the distribution isspecified, an ilem’s position on the latent trait canbe transmuted into terms of amount from a measure
of central tendency in any unit of measurementbased on an index of variability. Thorndike gen-erally assumed a normal distribution of ability, andhis scaling method provided a satisfactory solutionfor scaling problems within a single group. In fact,’I’h®r~dik~ 9 and Thurstone’s methods of scalingyield essentially indentical values when appliedwithin one group (Holzinger, 1928).The major difference between these two scaling
methods occurs in multiple group situations wherea common set of items is calibrated separately ineach group. Thomdike approached the problem ofitem invariance by adjusting for difference in themeans among different groups. Tbomdilce’s methodcan be expressed explicitly in a set of equationswhich parallel ’~h~rst®~~9s method of absolute scal-ing with the simplifying assumption that the stan-dard deviations in each of the ability distributionsare equal. Thurstone’s Equation 11 takes on a valueof one, and Equation 14 becomes
The item difficulty for each group, J;~ can then beexpressed as
and the final item difficulty for Thomdike’s methodof scaling is estimated by
As pointed out earlier, T’hurst®~e’s method of ab-solute scaling can be viewed as a two-step proce-dure. Th~r~dilc~9s method can be viewed in a sim-
ilar manner. The first step for both methods in-volves the determination of the group means, ~,~9and also the standard deviations, ug, for Thur-
stone’s method. The second step is the determi-
nation of the item difficulties through Equations18 and 19 for Thomdike’s method of scaling.
Rasch’s of Test Items
During the 1950s, Rasch conducted the basicpsychometric research that led to the publicationin 1960 of his book Probabilistic Models for SomeIntelligence and Attainment Tests. I~~s~h’s methodof calibrating test items was developed as an in-dividual-centered technique as opposed to the group-based techniques used by earlier researchers, suchas Thorndike and Thurstone. According to Rasch,(1960/1980)
individual-centered statistical techniques re-quire models in which each individual is char-acterized separately and from which, givenadequate data, the individual parameters canbe estimated. It is further essential that com-
parisons between individuals become inde-pendent of which particular instruments-testitems or other stimuli-within the class con-sidered have been used. Symmetrically, it oughtto be possible to compare stimuli belongingto the same class- &dquo;measuring the same
thing&dquo; -independent of which particular in-dividuals within a class considered were in-strumental for the comparison. (p. xx)
In traditional psychometrics, the properties of a setof items are defined in terms of the variation within
specified groups. As a consequence, the propertiesof the items, such as the proportion correct andreliability coefficients, depend on the group beingused.
Rasch’s approach to measurement places a cen-tral emphasis on the concept of specific objectivity(Rasch, 1960/1980, 1961, 1966a, 1966b, 1977;Wright, 1968, 1977). In relation to item calibrationand scaling, Rasch’s aim was to develop &dquo;proba-
Downloaded from the Digital Conservancy at the University of Minnesota, http://purl.umn.edu/93227. May be reproduced with no cost by students and faculty for academic use. Non-academic reproduction
requires payment of royalties through the Copyright Clearance Center, http://www.copyright.com/
26
bilistic models in the application of which the pop-ulation can be ignored&dquo; (Rasch, 196®/19$09 p. 89).His concept of specific objectivity is his version ofan invariance condition and is closely related toThurstone’s concept of constancy.The concept of specific objectivity is derived
from what Rasch (f961) has termed the principlesof comparison. Basically, these principles specifythe conditions necessary for comparing individualsand for comparing items or stimuli. Rasch specifiedfour requirements that he felt were indispensiblefor well-defined comparisons. The requirements areas follows:
The comparison between two stimuli shouldbe independent of which particular individualswere instrumental for the comparison; and itshould also be independent of which stimuliwithin the considered class were or might alsohave been compared.
Symmetrically, a comparison between twoindividuals should be independent of whichparticular stimuli within the class consideredwere instrumental for the comparison; and itshould also be independent of which otherindividuals were also compared, on the sameor on some other occasion. (Rasch, 1961, p.331)
Rasch’s measurement model for dichotomous data
can be expressed as
which specifies the probability of person n with anability of ~3,t, giving a correct response to item i
with a difficulty of 8i. See Rasch (1960/1980) andalso Wright and Stone (1979) for a full descriptionof the development and derivation of the model.Rasch ( 1966a) provides a detailed example of howthis model achieves specific objectivity.
There are several methods for estimating the pa-rameters, ~i,i and 8i. The procedure used in thispaper is called PROX (Wright & Stone, 1979) andwas originally proposed by Cohen (1979). Thisestimation method was chosen because it highlightsin simple closed-form equations the similarity be-tween Rasch’s approach for obtaining item invar-
iance and sample-free item calibration, as com-
pared to Thorndike’s and Thurstone,’ methods.Cohen’s approximation involves making two as-
sumptions in order to obtain equations for esti-
mating the item difficulties and the person abilities.The first assumption is that the person ability es-timates are normally distributed, and the secondassumption is that the item difficulties are also ap-proximately normally distributed. The difficulty ofitem i can then be expressed asdi = I’(x~ - x.) [21]where
xi = logit corresponding to the observed
proportion of people succeeding on itemt’C> ’ t’l~ 9
x. = mean of the item logits, andY = item logit expansion factor.
This can also be expressed as; = M + xi~ [22]with M set equal to - Yx. and the expansion factordefined as follows:
where V = variance of observed score logits andU = variance of observed item logits.The standard error of each item can be approx-
imated by
where is the number of people in the calibrationsample (See Wright and Stone, 1979, for a moredetailed derivation of the PROX method of esti-
mation.) This approximation of Cohen’s agrees verywell with the estimates obtained using other esti-mation methods (Cohen, 1979; Wright & Douglas,1977).
Comparison of Thorndike, Thurstone, andRasch
Thorndike, Thurstone, and Rasch recognized theimportance of obtaining sample-free estimates ofthe item parameters that would be invariant across
groups. As a consequence of this, cach developeda method for obtaining item invariance and foreliminating arbitrary sample effects.The concept of an underlying latent trait plays
a central role in the quest for invariance with thethree scaling methods. Each method includes the
Downloaded from the Digital Conservancy at the University of Minnesota, http://purl.umn.edu/93227. May be reproduced with no cost by students and faculty for academic use. Non-academic reproduction
requires payment of royalties through the Copyright Clearance Center, http://www.copyright.com/
27
assumption that items can be located on a latenttrait scale and the assumption that these items canbe used to define this latent trait. The location of
the item is defined by the difficulty of the item,and this difficulty is assumed to have a fixed po-sition regardless of the group being used for thecalibration.
Thomdike, Thurstone, and Rasch understood thatthe percentage of correct responses to an item in a
particular group would not provide an invariantdefinition of item difficulty. Thomdike proposed alinear scale based on the transformation of the per-cent correct using probable errors as the unit ofmeasurement, which he called PE values. Thur-stone transformed the percent correct to standardnormal deviates, which he called sigma values, andRasch proposed using a logistic transformation ofthe percent correct. These transformations are verysimilar. In practice the PE values can be approx-imated very closely by dividing the standard nor-mal deviates by a constant (.6745). This constantis derived from the relationship between the stan-dard deviation of a normal distribution and the semi-
interquartile range (Peters & Voorhis, 1940). Thesemi-interquartile range is used as the unit of mea-surement for Thorndike9s PE values. In a similar
fashion, the standard normal deviates can be ap-proximated very closely by dividing the logits ob-tained from the logistic transformation of the per-cent correct by a constant (1.7).The adjustments for sample effects proposed by
Thomdike, Thurstone, and Rasch are based on dif-ferent levels of analysis. Thomdike and Thurstonebased their adjustments on group level descriptionsof the ability distributions, such as the mean andstandard deviation, whereas Rasch approached theadjustment directly at the individual level of anal-ysis. Since the adjustments are based on groups,Thomdike and Thurstone made the additional as-
sumption that the ability distributions were normal.Given this assumption, Thorndike proceeded to usemean differences between groups to adjust for sam-ple effects and to obtain invariant estimates of theitem difficulties. Thurstone extended Thomdike’smethod by adding a second adjustment that allowedthe standard deviations, as well as the means, to
vary from group to group.
Rasch addressed the problem of item calibrationdirectly at the individual level of analysis, and hismethod does not require the assumption of a normaldistribution of ability. Rasch set out to developindividual-centered techniques with a &dquo;formal
symmetry between items and persons&dquo; (Rasch, 1960/1980, p. 77). Rasch chose to define simultaneouslythe concepts of item difficulty and person ability.Rasch’s method of item calibration includes an in-
dividual-level response model that can account forthe probability of an individual with a certain abil-ity succeeding on an item with a specific difficulty.
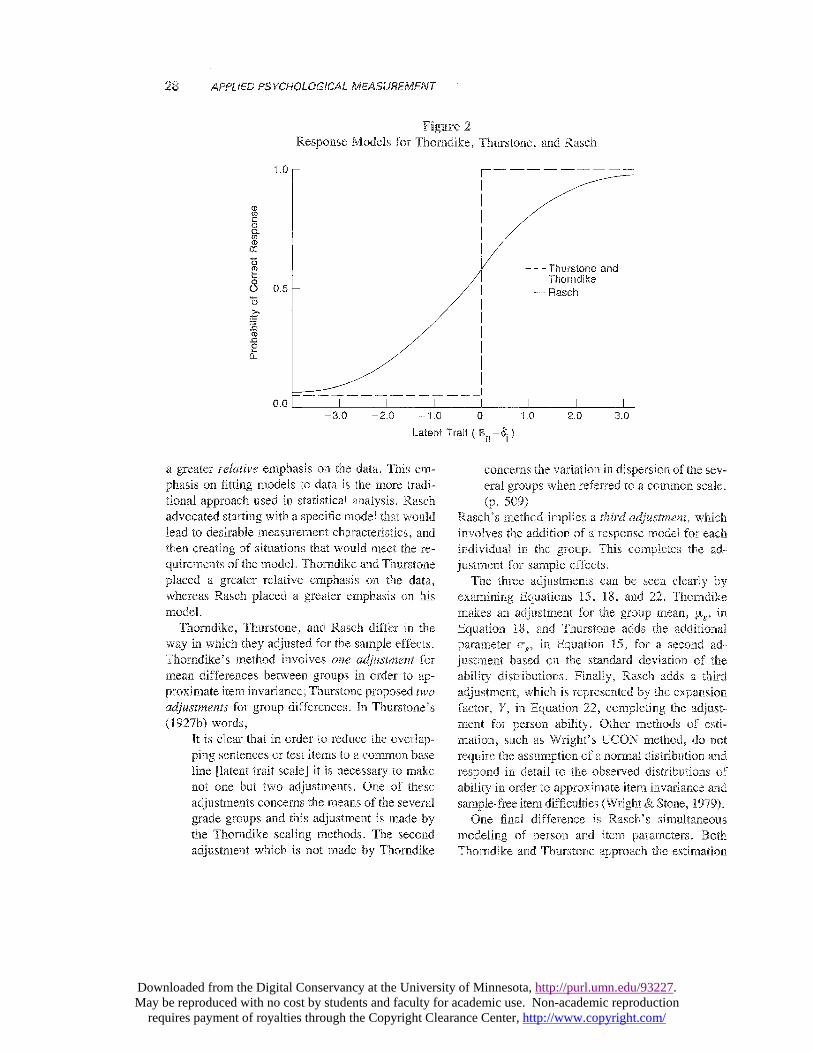
In Figure 1, the item difficulty, di, representsthe fixed location of the item regardless of group.Thorndike’s and Thurstone’s methods imply thatevery individual to the right of the item wouldsucceed (since their ability is greater than the itemdifficulty), and every individual to the left of theitem would fail (since their ability is less than theitem difficulty). Rasch’s model describes the prob-ability of obtaining a correct response on an item.This probability is defined as a function of the
difference between the item difficulty and personability. The comparison of lZasch’s response modeland the response model implied by ’I’horridikc andThurstone is given in Figure 2. Figure 2 is some-what artificial because some people would fail dueto random response error, but Thorndike and Thur-
stone do not propose a specific way of modelingthe individual response process to take this into
account.
Another difference between Thorndike and
Thurstone as compared to Rasch involves the dis-tinction between two simple questions: Does themodelfit the data? asked by Thomdike and Thur-stone and Do the data fit the model? asked byRasch. One of the consequences of the way theyapproached the issue of model and data fit is evidentin the procedures suggested for item analysis. Raschset out the requirements necessary for specific ob-jectivity and then advocated a very active approachto the selection and development of procedures formeeting these requirements. Essentially, Raschsuggested that items be constructed and then se-lected to fit his model in order to achieve objectivemeasurement. Although Thorndike and Thurstonewere certainly concerned with this issue, they placed
Downloaded from the Digital Conservancy at the University of Minnesota, http://purl.umn.edu/93227. May be reproduced with no cost by students and faculty for academic use. Non-academic reproduction
requires payment of royalties through the Copyright Clearance Center, http://www.copyright.com/
28
Figure2Response Models for ~’~®~dg~e9 Thurstone, and Rasch
a greater relative emphasis on the data. This em-phasis on fitting models to data is the more tradi-tional approach used in statistical analysis. Raschadvocated starting with a specific model that wouldlead to desirable measurement characteristics, andthen creating of situations that would meet the re-quirements of the model. Thondike and Thurstoneplaced a greater relative emphasis on the data, 9whereas Rasch placed a greater emphasis on hismodel.
Thomdike, Thurstone, and Rasch differ in the
way in which they adjusted for the sample effects.Thondike’s method involves one adjustment formean differences between groups in order to ap-proximate item invariance; Thurstone proposed ~®adjustments for group differences. In ’~’h~arst®ne’s(1927b) words, 9
It is clear that in order to reduce the overlap-ping sentences or test items to a common baseline [latent trait scale] it is necessary to make
not one but two adjustments. One of theseadjustments concerns the means of the severalgrade groups and this adjustment is made bythe Thomdike scaling methods. The secondadjustment which is not made by Thomdike,
concerns the variation in dispersion of the sev-eral groups when referred to a common scale.
(p. 509)Rasch’s method implies a third adjustment, whichinvolves the addition of a response model for eachindividual in the group. This completes the ad-justment for sample effects.
The three adjustments can be seen clearly byexamining Equations 15, 18, and 22. Thomdikemakes an adjustment for the group mean, ~,~9 in
Equation 18, and Thurstone adds the additionalparameter ~g9 in Equation 15, for a second ad-justment based on the standard deviation of theability distributions. Finally, Rasch adds a thirdadjustment, which is represented by the expansionfactor, ~’9 in Equation 22, completing the adjust-ment for person ability. Other methods of esti-mation, such as ~lri~ht9s UCON method, do notrequire the assumption of a normal distribution andrespond in detail to the observed distributions ofability in order to approximate item invariance andsample-free item difficulties (Wright & Stone, 1979).One final difference is Rasch’s simultaneous
modeling of person and item parameters. BothThomdike and Thurstone approach the estimation
Downloaded from the Digital Conservancy at the University of Minnesota, http://purl.umn.edu/93227. May be reproduced with no cost by students and faculty for academic use. Non-academic reproduction
requires payment of royalties through the Copyright Clearance Center, http://www.copyright.com/
29
of person ability as a separate activity. Thurstonedid recognize the importance of locating both in-dividuals and items on a latent trait scale, even
though he chose to treat person measurement anditem calibration as separate activities. Thurstone’s smethod of absolute scaling can, of course, be ap-plied to the scaling of raw scores (Gulliksen, 1950),but this is distinct from the calibration of the itemsthat led to these person scores. One of the advan-
tages of including person measurement explicitlyin the model is that it provides the opportunity todetermine whether or not the individual being mea-sured fits the model. This is a major advantage ofall latent trait models because they provide the op-portunity to define the precision of measurementfor each individual (Weiss & Davison, 1981). Therelationship between person measurement and itemcalibration is still problematic within the field ofeducational and psychological measurement.
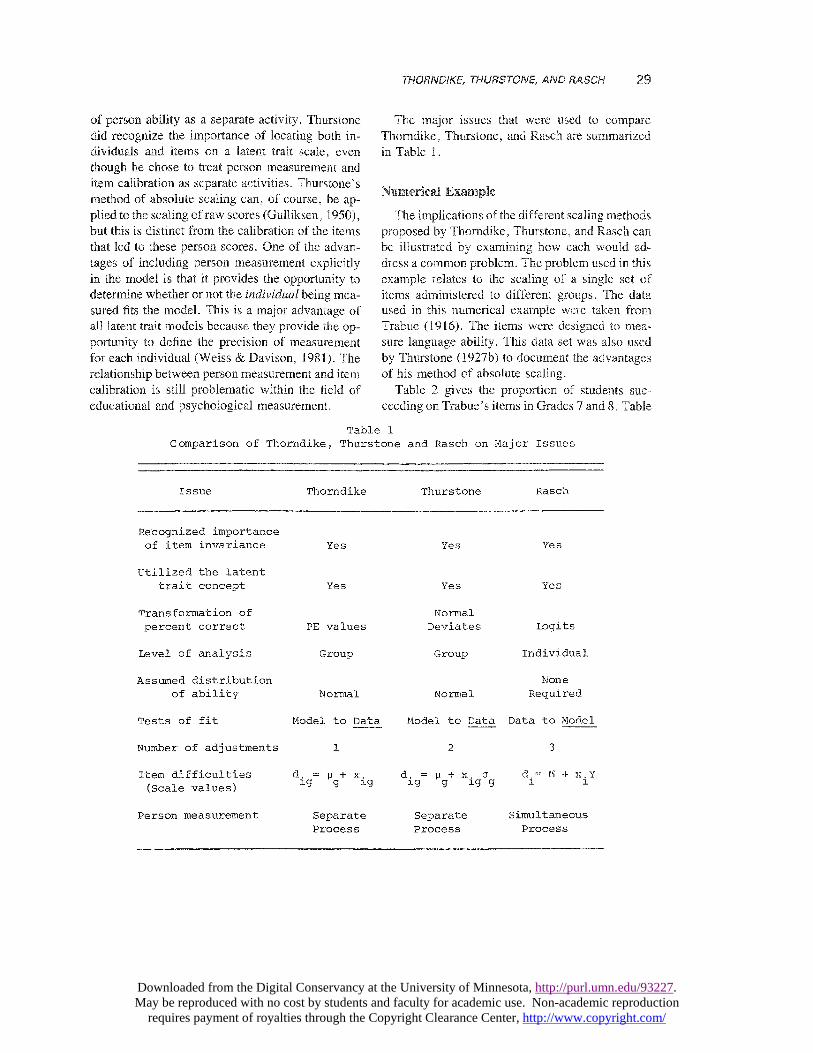
The major issues that were used to compareThomdike, Thurstone., and Rasch are summarizedin Table 1.
Numerical Example
The implications of the different scaling methodsproposed by Thomdike, Thurstone., and Rasch canbe illustrated by examining how each would ad-dress a common problem. The problem used in thisexample relates to the scaling of a single set ofitems administered to different groups. The dataused in this numerical example were taken fromTrabue (1916). The items were designed to mea-sure language ability. This data set was also usedby Thurstone (1927b) to document the advantagesof his method of absolute scaling.
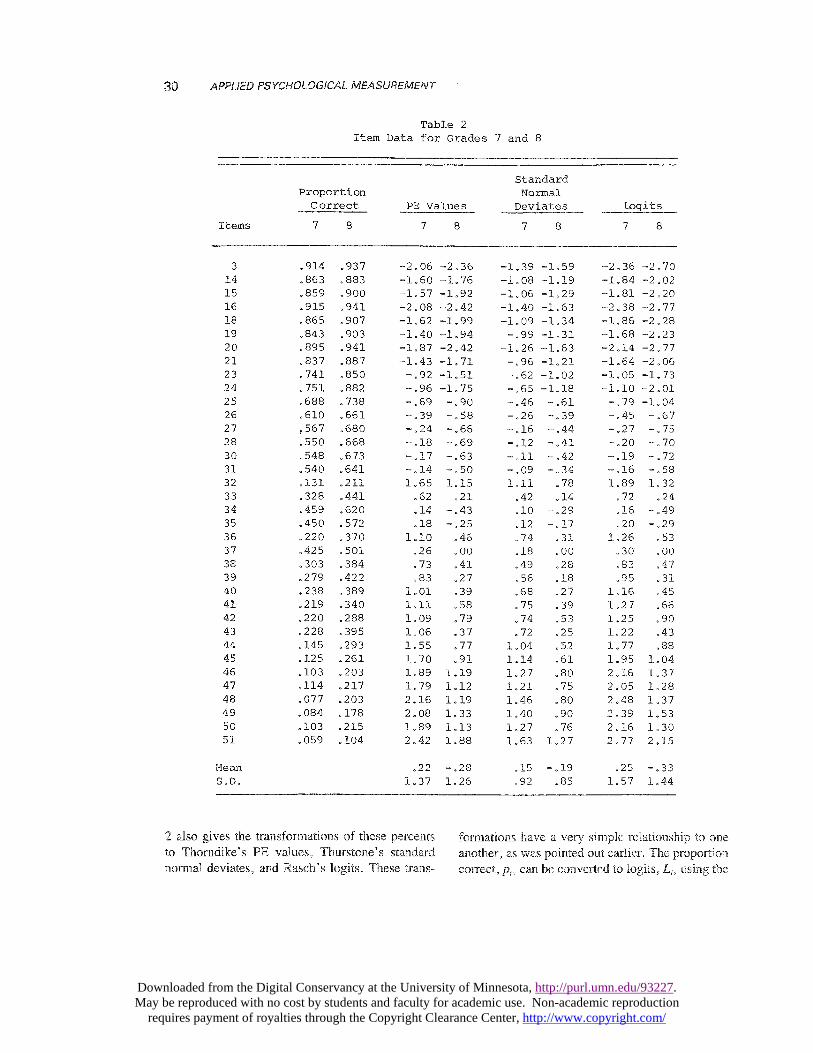
Table 2 gives the proportion of students suc-ceeding on Trabue’s items in Grades 7 and 8. Table
Table 1
Comparison of Thorndike, Thurstone and Rasch on Major Issues
Downloaded from the Digital Conservancy at the University of Minnesota, http://purl.umn.edu/93227. May be reproduced with no cost by students and faculty for academic use. Non-academic reproduction
requires payment of royalties through the Copyright Clearance Center, http://www.copyright.com/
30
Table 2
Item Data for Grades 7 and 8
2 also gives the transformations of these percentsto Thomdike’s PE values, Thurstone’s standardnormal deviates, and Rasch’s logits. These trans-
formations have a very simple relationship to oneanother, as was pointed out earlier. The proportioncorrect, pi, can be converted to logits, I,;, using the
Downloaded from the Digital Conservancy at the University of Minnesota, http://purl.umn.edu/93227. May be reproduced with no cost by students and faculty for academic use. Non-academic reproduction
requires payment of royalties through the Copyright Clearance Center, http://www.copyright.com/
31
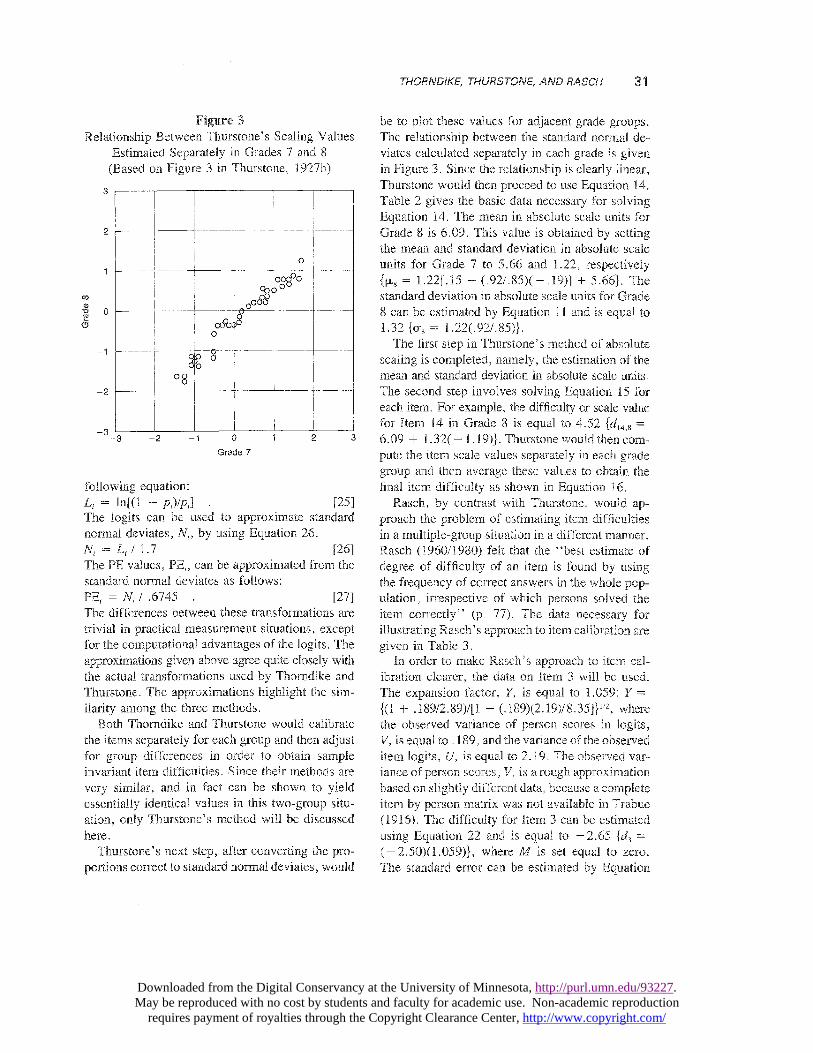
Figure3Relationship Between Thurstone’s Scaling Values
Estimated Separately in Grades 7 and 8(Based on Figure 3 in Thurstone, 1927b)
following equation:Li = ln[(l - W)/~~] . [25]The logits can be used to approximate standardnormal deviates, 1V,9 by using Equation 26.IVt = Lt I 1 e 7 [26]The PE values, PE;, can be approximated from thestandard normal deviates as follows:
PE, = TV, / .6745 . a [2’7]The differences between these transformations are
trivial in practical measurement situations, exceptfor the computational advantages of the logits. Theapproximations given above agree quite closely withthe actual transformations used by Thorndike andThurstone. The approximations highlight the sim-ilarity among the three methods. e
Both Thorndike and Thurstone would calibrate
the items separately for each group and then adjustfor group differences in order to obtain sampleinvariant item difficulties. Since their methods are
very similar, and in fact can be shown to yieldessentially identical values in this two-group situ-ation, only Thurstone’s method will be discussedhere.
Thurstone’ next step, after converting the pro-portions correct to standard normal deviates, would
be to plot these values for adjacent grade groups.The relationship between the standard normal de-viates calculated separately in each grade is givenin Figure 3. Since the relationship is clearly linear,Thurstone would then proceed to use Equation 14.Table 2 gives the basic data necessary for solvingEquation 14. The mean in absolute scale units forGrade 8 is 6.09. This value is obtained by settingthe mean and standard deviation in absolute scaleunits for Grade 7 to 5.66 and 1.22, respectivelyf~L, = 1.22[.15 - (.92/.85)(-.19)] + 5.661. Thestandard deviation in absolute scale units for Grade8 can be estimated by Equation 11 and is equal to1.32 for, = 1.22(.92/.85)}.The first step in Thurstone’s method of absolute
scaling is completed, namely, the estimation of themean and standard deviation in absolute scale units.The second step involves solving Equation 15 foreach item. For example, the difficulty or scale valuefor Item 14 in Grade 8 is equal to 4.52 fdl4,~ =6.09 + 1.32( - 1.19)}. Thurstone would then corm-pute the item scale values separately in each gradegroup and then average these values to obtain thefinal item difficulty as shown in Equation 16.
Rasch, by contrast with Thurstone, would ap-proach the problem of estimating item difficultiesin a multiple-group situation in a different manner.Rasch ( 19C0/ 1990) felt that the 6 ‘best estimate of
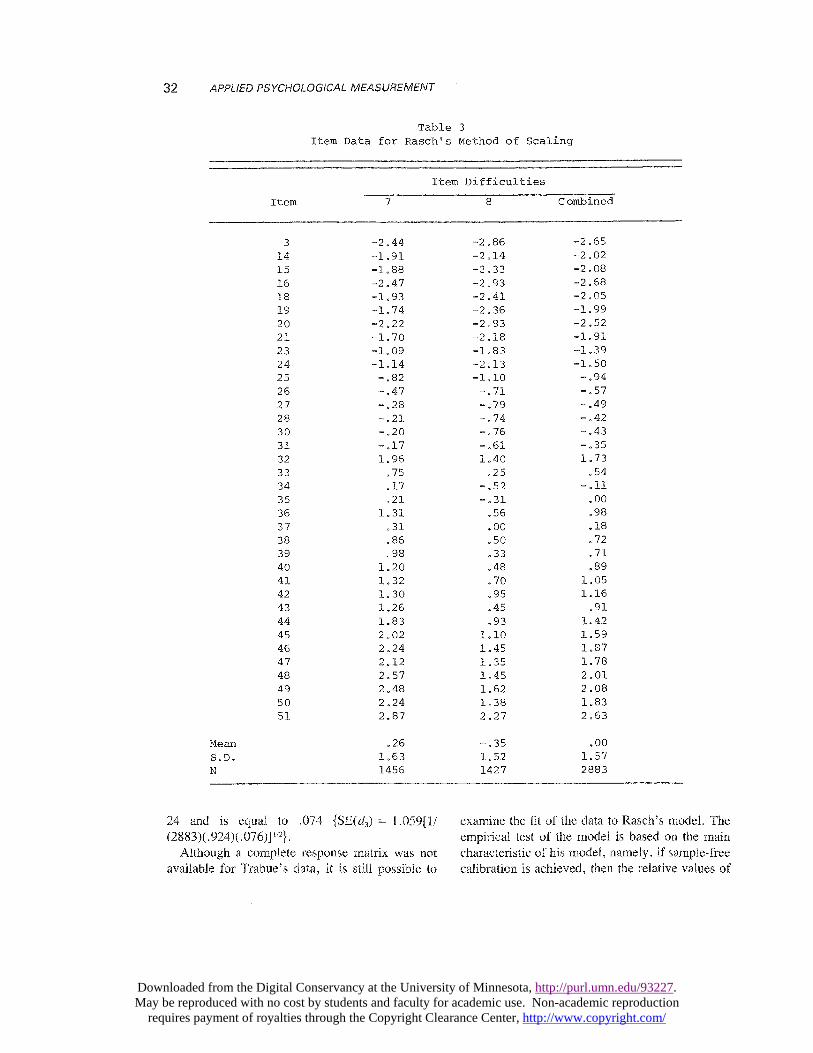
degree of difficulty of an item is found by usingthe frequency of correct answers in the whole pop-ulation, irrespective of which persons solved theitem correctly&dquo; (p. 77). The data necessary forillustrating l2~sch’s approach to item calibration aregiven in Table 3.
In order to make Rasch’ approach to item cal-ibration clearer, the data on Item 3 will be used.The expansion factor, Y, is equal to 1.059: Y _
l(i + .189/2.89)/[l - (.I~9)(2.1~9)/~.3s]~’~2, wherethe observed variance of person scores in logits,V, is equal to .189, and the variance of the observeditem logits, U, is equal to 2.19. The observed var-iance of person scores, V, is a rough approximationbased on slightly different data, because a completeitem by person matrix was not available in Trabue(1916). The difficulty for Item 3 can be estimatedusing Equation 22 and is equal to - 2.65 ~d3 =(-2.50)(1.059)1, where M is set equal to zero.The standard error can be estimated by Equation
Downloaded from the Digital Conservancy at the University of Minnesota, http://purl.umn.edu/93227. May be reproduced with no cost by students and faculty for academic use. Non-academic reproduction
requires payment of royalties through the Copyright Clearance Center, http://www.copyright.com/
32
Table 3
Item Data for Rasch’s Method of Scaling
24 and is equal to .074 ~~E(d3) = 1.059[1/(2883)(.924)(.076)]’~}.
Although a complete response matrix was notavailable for Trabue’s data, it is still possible to
examine the fit of the data to Rasch’s model. The
empirical test of the model is based on the maincharacteristic of his model, namely, if sample-freecalibration is achieved, then the relative values of
Downloaded from the Digital Conservancy at the University of Minnesota, http://purl.umn.edu/93227. May be reproduced with no cost by students and faculty for academic use. Non-academic reproduction
requires payment of royalties through the Copyright Clearance Center, http://www.copyright.com/
33
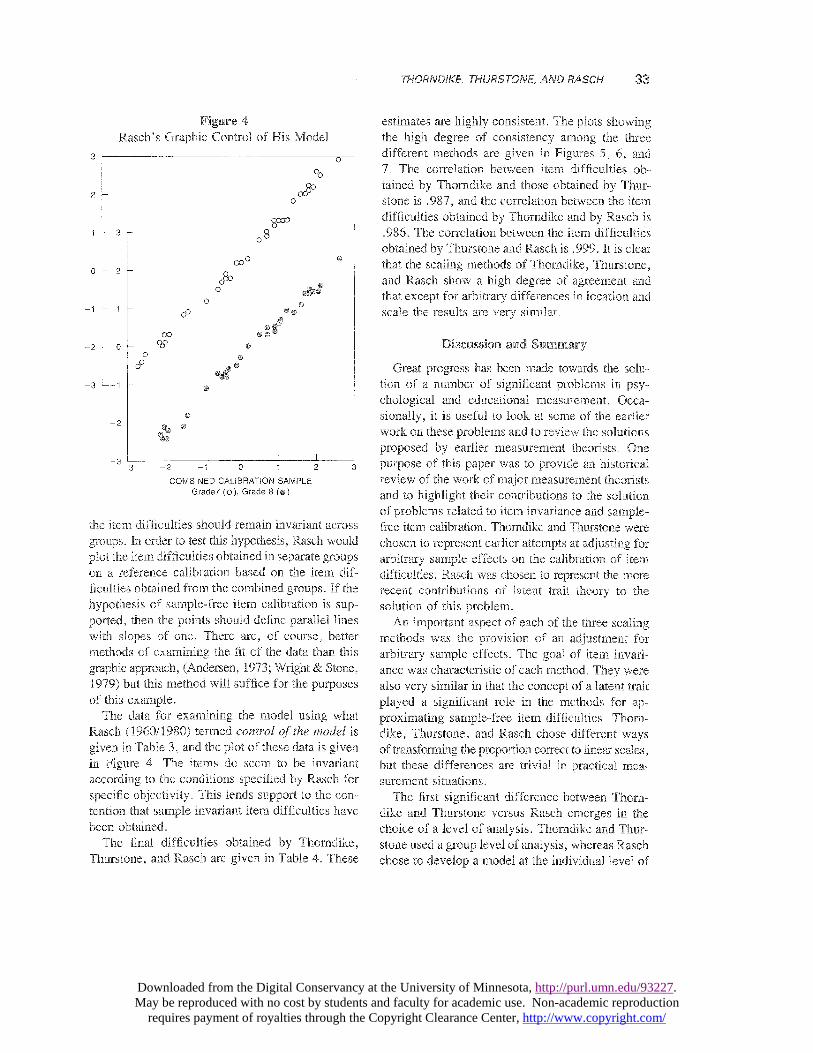
FigMre4Rasch’s Graphic Control of His Model
the item difficulties should remain invariant across
groups. In order to test this hypothesis, Rasch wouldplot the item difficulties obtained in separate groupson a reference calibration based on the item dif-
ficulties obtained from the combined groups. If the
hypothesis of sample-free item calibration is sup-ported, then the points should define parallel lineswith slopes of one. There are, of course, bettermethods of examining the fit of the data than thisgraphic approach, (Andersen, 1973; Wright & Stone,1979) but this method will suffice for the purposesof this example.
The data for examining the model using whatRasch (1960/1980) termed control of the model isgiven in Table 3, and the plot of these data is givenin Figure 4. The items do seem to be invariantaccording to the conditions specified by Rasch forspecific objectivity. This lends support to the con-tention that sample invariant item difficulties havebeen obtained. e
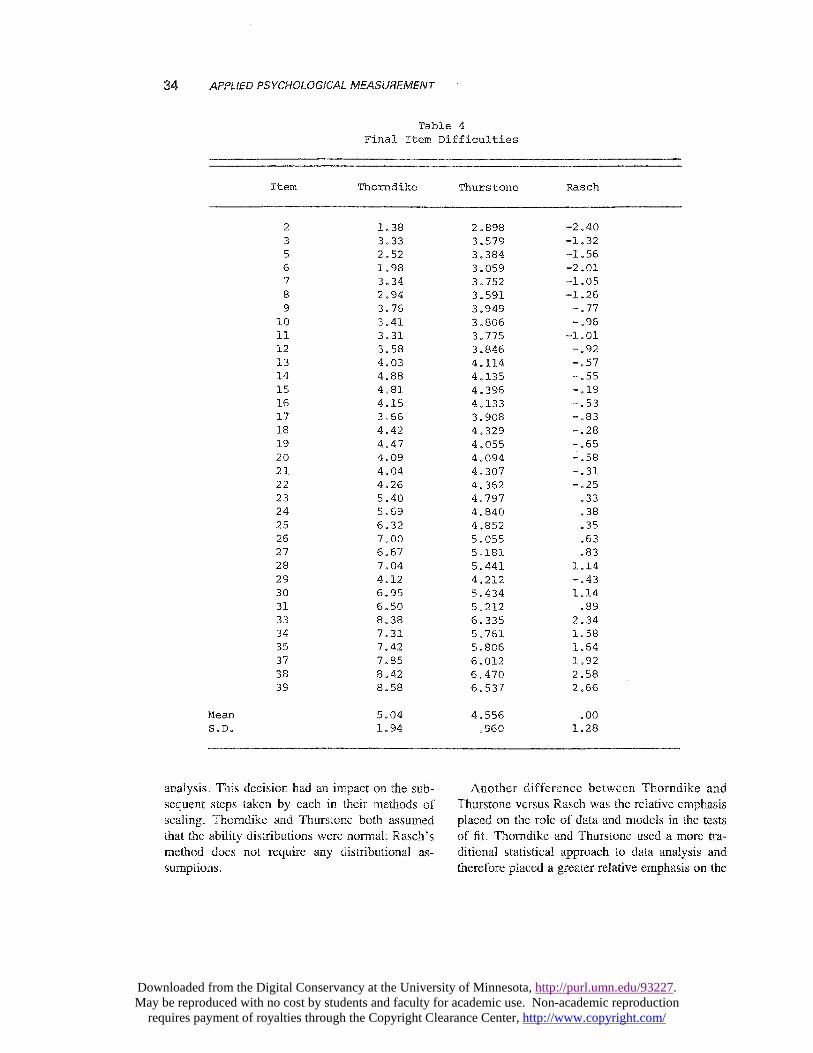
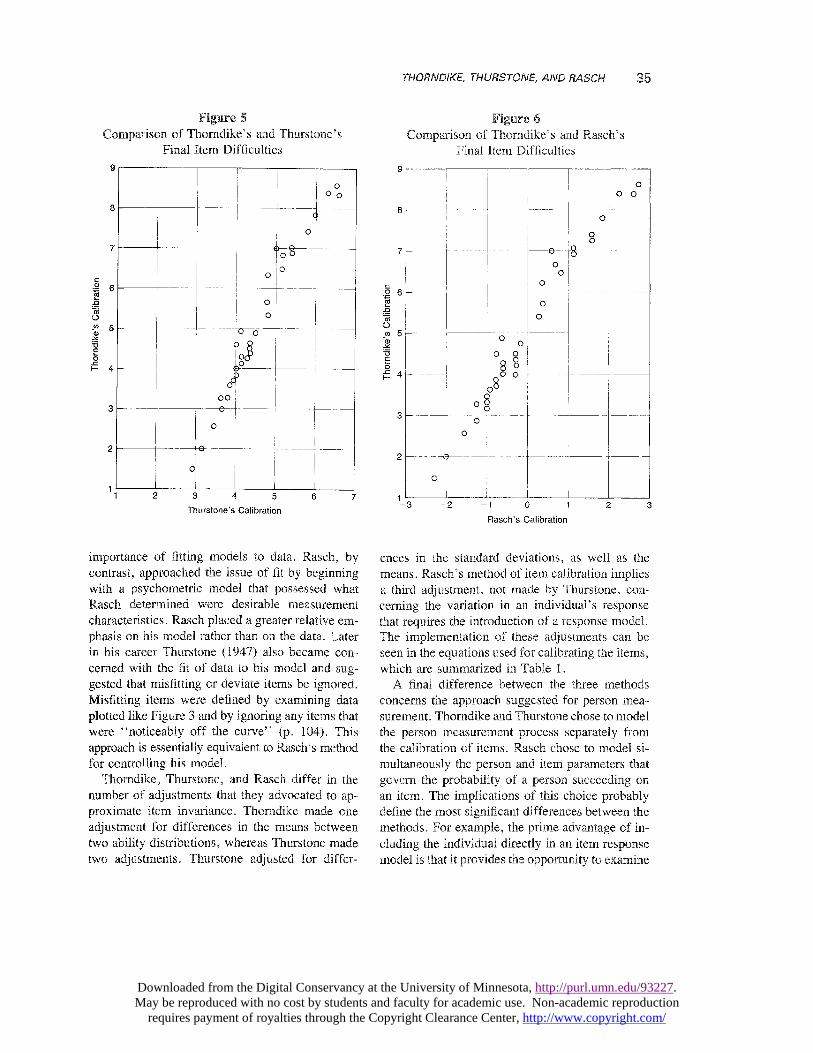
The final difficulties obtained by Thomdike,,Thurstone, and Rasch are given in Table 4. These
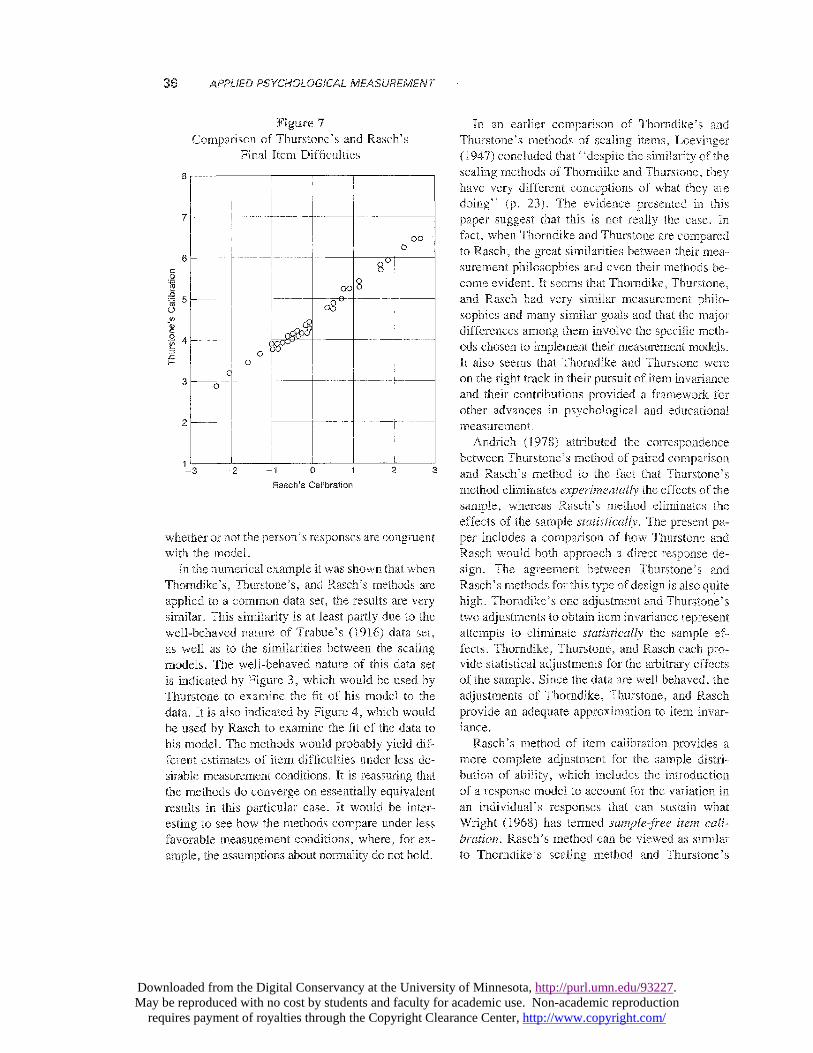
estimates are highly consistent. The plots showingthe high degree of consistency among the threedifferent methods are given in Figures 5, 6, and7. The correlation between item difficulties ob-tained by Thomdike and those obtained by Thur-stone is .9~‘79 and the correlation between the itemdifficulties obtained by Thomdike and by Rasch is.986. The correlation between the item difficultiesobtained by Thurstone and Rasch is .999. It is clearthat the scaling methods of Thomdike, Thurstone,and Rasch show a high degree of agreement andthat except for arbitrary differences in location andscale the results are very similar.
Discussion and Summary
Great progress has been made towards the solu-
tion of a number of significant problems in psy-chological and educational measurement. Occa-sionally, it is useful to look at some of the earlierwork on these problems and to review the solutionsproposed by earlier measurement theorists. Onepurpose of this paper was to provide an historicalreview of the work of major measurement theoristsand to highlight their contributions to the solutionof problems related to item invariance and sample-free item calibration. Thomdike and Thurstone werechosen to represent earlier attempts at adjusting forarbitrary sample effects on the calibration of itemdifficulties. Rasch was chosen to represent the morerecent contributions of latent trait theory to thesolution of this problem.An important aspect of each of the three scaling
methods was the provision of an adjustment forarbitrary sample effects. The goal of item invaxi-ance was characteristic of each method. They werealso very similar in that the concept of a latent trait
played a significant role in the methods for ap-proximating sample-free item difficulties. Thorn-dike, Thurstone, and Rasch chose different waysof transforming the proportion correct to linear scales, %but these differences are trivial in practical mea-surement situations.
The first significant difference between Thom-dike and Thurstone versus Rasch emerges in thechoice of a level of analysis. Thomdike and Thur-stone used a group level of analysis, whereas Raschchose to develop a model at the individual level of
Downloaded from the Digital Conservancy at the University of Minnesota, http://purl.umn.edu/93227. May be reproduced with no cost by students and faculty for academic use. Non-academic reproduction
requires payment of royalties through the Copyright Clearance Center, http://www.copyright.com/
34
Table 4
Final Item Difficulties
analysis. This decision had an impact on the sub-sequent steps taken by each in their methods ofscaling. Thomdike and Thurstone both assumedthat the ability distributions were normal; Rasch’smethod does not require any distributional as-
sumptions.
Another difference between Thorndike and
Thurstone versus Rasch was the relative emphasisplaced on the role of data and models in the testsof fit. Thorndike and Thurstone used a more tra-ditional statistical approach to data analysis andtherefore placed a greater relative emphasis on the
Downloaded from the Digital Conservancy at the University of Minnesota, http://purl.umn.edu/93227. May be reproduced with no cost by students and faculty for academic use. Non-academic reproduction
requires payment of royalties through the Copyright Clearance Center, http://www.copyright.com/
35
Figure 5Comparison of Thomdike’s and Thurstone’s s
Final Item Difficultiesn
importance of fitting models to data. Rasch, bycontrast, approached the issue of fit by beginningwith a psychometric model that possessed whatRasch determined were desirable measurementcharacteristics. Rasch placed a greater relative em-phasis on his model rather than on the data. Laterin his career Thurstone (1947) also became con-cemed with the fit of data to his model and sug-gested that misfitting or deviate items be ignored.Misfitting items were defined by examining dataplotted like Figure 3 and by ignoring any items thatwere &dquo;noticeably off the curve&dquo; (p. 104). Thisapproach is essentially equivalent to Rasch’s methodfor controlling his model.
Thomdike, Thurstone, and Rasch differ in thenumber of adjustments that they advocated to ap-proximate item invariance. Thomdike made oneadjustment for differences in the means betweentwo ability distributions, whereas Thurstone madetwo adjustments. Thurstone adjusted for differ-
FigMre6Comparison of Thomdike’s and Rasch’s
Final Item Difficulties
ences in the standard deviations, as well as the
means. Rasch’s method of item calibration impliesa third adjustment, not made by Thurstone, con-ceming the variation in an individual’s responsethat requires the introduction of a response model.The implementation of these adjustments can beseen in the equations used for calibrating the items,which are summarized in Table 1.
A final difference between the three methods
concerns the approach suggested for person mea-surement. Thomdike and Thurstone chose to model
the person measurement process separately fromthe calibration of items. Rasch chose to model si-
multaneously the person and item parameters thatgovern the probability of a person succeeding onan item. The implications of this choice probablydefine the most significant differences between themethods. For example, the prime advantage of in-cluding the individual directly in an item responsemodel is that it provides the opportunity to examine
Downloaded from the Digital Conservancy at the University of Minnesota, http://purl.umn.edu/93227. May be reproduced with no cost by students and faculty for academic use. Non-academic reproduction
requires payment of royalties through the Copyright Clearance Center, http://www.copyright.com/
36
Figure?Comparison of Thurstone’s and Rasch’s s
Final Item Difficulties
whether or not the person’s responses are congruentwith the model.
In the numerical example it was shown that when‘I‘h®rr~di2~~9s~ Thurstone’s, and Rasch’s methods areapplied to a common data set, the results are verysimilar. This similarity is at least partly due to thewell-behaved nature of Trabue’s (1916) data set, 9as well as to the similarities between the scalingmodels. The well-behaved nature of this data set
is indicated by Figure 3 ~ which would be used byThurstone to examine the fit of his model to the
data. It is also indicated by Figure 4, which wouldbe used by Rasch to examine the fit of the data tohis model. The methods would probably yield dif-ferent estimates of item difficulties under less de-
sirable measurement conditions. It is reassuring thatthe methods do converge on essentially equivalentresults in this particular case. It would be inter-
esting to see how the methods compare under lessfavorable measurement conditions, where, for ex-
ample, the assumptions about normality do not hold.
In an earlier comparison of Thorndike’s andThurstone’s methods of scaling items, Loevinger(1947) concluded th~t 6‘d~spit~ the similarity of thescaling methods of Thorndike and Thurstone, theyhave very different conceptions of what they aredoing&dquo; (p. 23). The evidence presented in thispaper suggest that this is not really the case. In
fact, when Thorndike and Thurstone are comparedto Rasch, the great similarities between their mea-surement philosophies and even their methods be-come evident. It seems that Thorndike, Thurstone,and Rasch had very similar measurement philo-sophies and many similar goals and that the majordifferences among them involve the specific meth-ods chosen to implement their measurement models.It also seems that Thorndike and Thurstone wereon the right track in their pursuit of item invarianceand their contributions provided a framework forother advances in psychological and educationalmeasurement.
Andrich (1978) attributed the correspondencebetween Thurstone’ method of paired comparisonand Rasch’s method to the fact that Thurstone’smethod eliminates e.~pe~°i~~~atully the effects of thesample, whereas Rasch’s method eliminates theeffects of the sample .~t~t~,~t~c°c~~ly. The present pa-per includes a comparison of how Thurstone andRasch would both approach a direct response de-sign. The agreement between Thurstone’s andl~~s~h’s methods for this type of design is also quitehigh. Thorndike’s one adjustment and Thurstone’s stwo adjustments to obtain item invariance representattempts to eliminate ~tc~t~,~tic~c~lly the sample ef-fects. Thorndike, ’~’h~rst~~ae9 and Rasch each pro-vide statistical adjustments for the arbitrary effectsof the sample. Since the data are well behaved, theadjustments of Thorndike, Thurstone, and Raschprovide an adequate approximation to item invar-iance.
Rasch’s method of item calibration provides amore complete adjustment for the sample distri-bution of ability, which includes the introductionof a response model to account for the variation in
an individual’s responses that can sustain what
Wright (1968) has termed sarnple-free item cali-b~c~t~®~. Rasch’s method can be viewed as similarto Thondike’s scaling method and Thurstone’s
Downloaded from the Digital Conservancy at the University of Minnesota, http://purl.umn.edu/93227. May be reproduced with no cost by students and faculty for academic use. Non-academic reproduction
requires payment of royalties through the Copyright Clearance Center, http://www.copyright.com/
37
method of absolute scaling with a response modelincluded and the adjustment for the arbitrary effectsof the sample completed.
In general, the similarity between the three meth-ods is a positive indicator. It shows how the Raschmodel and other latent trait models fit into the his-
tory of psychological and educational measure-ment. The issue of item invariance and sample-freeestimation is still important, and one that may havenot been totally resolved. Wood (1976) has pointedout that although
much play is made of the ’invariance’ of itemparameter estimates in latent trait models sup-portive evidence is conspicuous by its ab-
sence. In fact, this is one of the greyest areasof test theory. (p. 252)
The work of Thomdike, Thurstone., and Rasch rep-resents some of the major milestones in the questfor item invariance. It seems that further work onthis issue may still be required.
References
Andersen, E. B. (1973). A goodness of fit test for theRasch model. Psychometrika, 38, 123-140.
Andrich, D. (1978). Relationships between the Thur-stone and Rasch approaches to item scaling. AppliedPsychological Measurement, 2, 451-462.
Cohen, L. (1979). Approximate expressions for para-meter estimates in the Rasch model. British Journal
of Mathematical and Statistical Psychology, 32, 113-120.
Gulliksen, H. (1950). Theory of mental tests. New York:John Wiley & Sons, Inc.
Holzinger, K. J. (1928). I. Some comments on ProfessorThurstone’s method of determining the scale valuesof tests items. Journal of Educational Psychology, 19,112-117.
Jones, L. V. (1960). Some invariant findings under themethod of successive intervals. In H. Gulliksen & S.Messick (Eds.), Psychological scaling: Theory andapplications. New York: John Wiley & Sons, Inc.
Loevinger, J. (1947). A systematic approach to the con-struction and evaluation of tests of ability. Psycho-logical Monographs, 61, No. 4.
Loevinger, J. (1965). Person and population as psy-chometric concepts. Psychological Review, 72, 143-155.
Lord, F. M. (1980). Applications of item response the-ory to practical testing problems. Hillsdale NJ: Erl-baum Assoc.
Peters, C. C., & Voorhis, W. R. (1940). Statistical pro-
cedures and their mathematical bases. New York:McGraw-Hill Inc.
Rasch, G. (1980). Probabilistic models for some intel-ligence and attainment tests. Chicago: The Universityof Chicago Press. (Originally published, Copenhagen:Danmarks Paedagogiske Institut, 1960).
Rasch, G. (1961). On general laws and the meaning ofmeasurement in psychology. In J. Neyman (Ed.), Pro-ceedings of the Fourth Berkeley Symposium on Math-ematical Statistics and Probability. Berkeley: Uni-versity of California Press.
Rasch, G. (1966a). An individualistic approach to itemanalysis. In P. F. Lazarsfeld & N. Henry (Eds.),Readings in mathematical social science. Chicagp:Science Research Associates.
Rasch, G. (1966b). An item analysis which takes indi-vidual differences into account. British Journal ofMathematical and Statistical Psychology, 19, Part 1,49-57.
Rasch, G. (1977). On specific objectivity: An attemptat formalizing the request for generality and validityof scientific statements. Danish Yearbook of Philos-ophy, 14, 58-94.
Thomdike, E. L. (1919). An introduction to the theoryof mental and social measurements. New York: Co-lumbia University, Teachers College.
Thorndike, E. L. (1922). On finding equivalent scoresin tests of intelligence. Journal of Applied Psychology,6, 29-33.
Thurstone, L. L. (1925). A method of scaling psycho-logical and educational tests. Journal of EducationalPsychology, 16, 433-451.
Thurstone, L. L. (1927a). The method of paired com-parisons for social values. Journal of Abnormal andSocial Psychology, 21, 384-400.
Thurstone, L. L. (1927b). The unit of measurement ineducational scales. Journal of Educational Psychol-ogy, 18, 505-524.
Thurstone, L. L. (1928a). II. Comment by L. L. Thur-stone. Journal of Educational Psychology, 19, 117-124.
Thurstone, L. L. (1928b). Scale construction withweighted observations. Journal of Educational Psy-chology, 19, 441-453.
Thurstone, L. L. (1947). The calibration of items. Amer-ican Psychologist, 2, 103-104.
Trabue, M. R. (1916). Completion-test language scales.Contributions to Education, No. 77. New York: Co-lumbia University, Teachers College.
Weiss, D. J., & Davison, M. L. (1981). Test theory andmethods, Annual Review of Psychology, 32, 629-658.
Wood, R. (1976). Trait measurement and item banks.In D.N.M. de Gruijter & L.J.T. van der Kamp (Eds.),Advances in Psychological and Educational Mea-surement. New York: John Wiley & Sons.
Wright, B. D. (1968). Sample-free test calibration and
Downloaded from the Digital Conservancy at the University of Minnesota, http://purl.umn.edu/93227. May be reproduced with no cost by students and faculty for academic use. Non-academic reproduction
requires payment of royalties through the Copyright Clearance Center, http://www.copyright.com/
38
person measurement. In Proceedings of the 1967 In-vitational Conference on Testing Problems. PrincetonNJ: Educational Testing Service.
Wright, B. D. (1977). Solving measurement problemswith the Rasch model. Journal of Educational Mea-surement, 14, 97-116.
Wright, B. D., & Douglas, G. A. (1977). Best proce-dures for sample-free item analysis. Applied Psycho-logical Measurement, 1, 281-295.
Wright, B. D., & Stone, M. H. (1979). Best test design.Chicago: MESA Press.
AcknowledgmentsThe author is to ~e~jc~min D. Wright for sug-gesting that the Rasch represents a &dquo;third ad-
justment.&dquo; Judith A. Monsaas many helpfulcomments.
Author’s Address
Send requests for reprints or further information to GeorgeEngelhard, Jr., Office of Institutional Research and Eval-uation, Chicago State University, Ninety-Fifth at KingDrive, Chicago IL 60628, U.S.A.
Downloaded from the Digital Conservancy at the University of Minnesota, http://purl.umn.edu/93227. May be reproduced with no cost by students and faculty for academic use. Non-academic reproduction
requires payment of royalties through the Copyright Clearance Center, http://www.copyright.com/